Attached files
| file | filename |
|---|---|
| EX-99.12 - EX-99.12 - Chaparral Energy, Inc. | d37844dex9912.htm |
| EX-99.10 - EX-99.10 - Chaparral Energy, Inc. | d37844dex9910.htm |
| EX-99.9 - EX-99.9 - Chaparral Energy, Inc. | d37844dex999.htm |
| EX-99.8 - EX-99.8 - Chaparral Energy, Inc. | d37844dex998.htm |
| EX-99.7 - EX-99.7 - Chaparral Energy, Inc. | d37844dex997.htm |
| EX-99.6 - EX-99.6 - Chaparral Energy, Inc. | d37844dex996.htm |
| EX-99.5 - EX-99.5 - Chaparral Energy, Inc. | d37844dex995.htm |
| EX-99.4 - EX-99.4 - Chaparral Energy, Inc. | d37844dex994.htm |
| EX-99.3 - EX-99.3 - Chaparral Energy, Inc. | d37844dex993.htm |
| EX-99.2 - EX-99.2 - Chaparral Energy, Inc. | d37844dex992.htm |
| EX-99.1 - EX-99.1 - Chaparral Energy, Inc. | d37844dex991.htm |
| 8-K - 8-K - Chaparral Energy, Inc. | d37844d8k.htm |

Cleansing materials August 16th, 2020 Exhibit 99.11
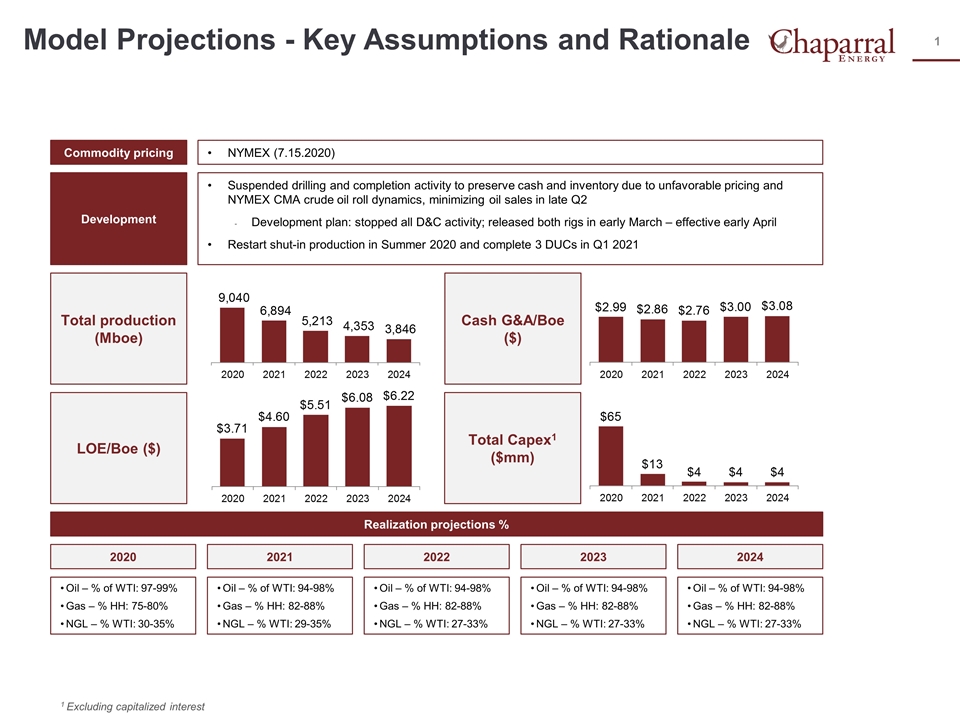
Model Projections - Key Assumptions and Rationale NYMEX (7.15.2020) Commodity pricing Suspended drilling and completion activity to preserve cash and inventory due to unfavorable pricing and NYMEX CMA crude oil roll dynamics, minimizing oil sales in late Q2 Development plan: stopped all D&C activity; released both rigs in early March – effective early April Restart shut-in production in Summer 2020 and complete 3 DUCs in Q1 2021 Development Total production (Mboe) Cash G&A/Boe ($) LOE/Boe ($) Total Capex1 ($mm) 1 Excluding capitalized interest Realization projections % 2020 2021 2022 2023 2024 Oil – % of WTI: 97-99% Gas – % HH: 75-80% NGL – % WTI: 30-35% Oil – % of WTI: 94-98% Gas – % HH: 82-88% NGL – % WTI: 29-35% Oil – % of WTI: 94-98% Gas – % HH: 82-88% NGL – % WTI: 27-33% Oil – % of WTI: 94-98% Gas – % HH: 82-88% NGL – % WTI: 27-33% Oil – % of WTI: 94-98% Gas – % HH: 82-88% NGL – % WTI: 27-33%
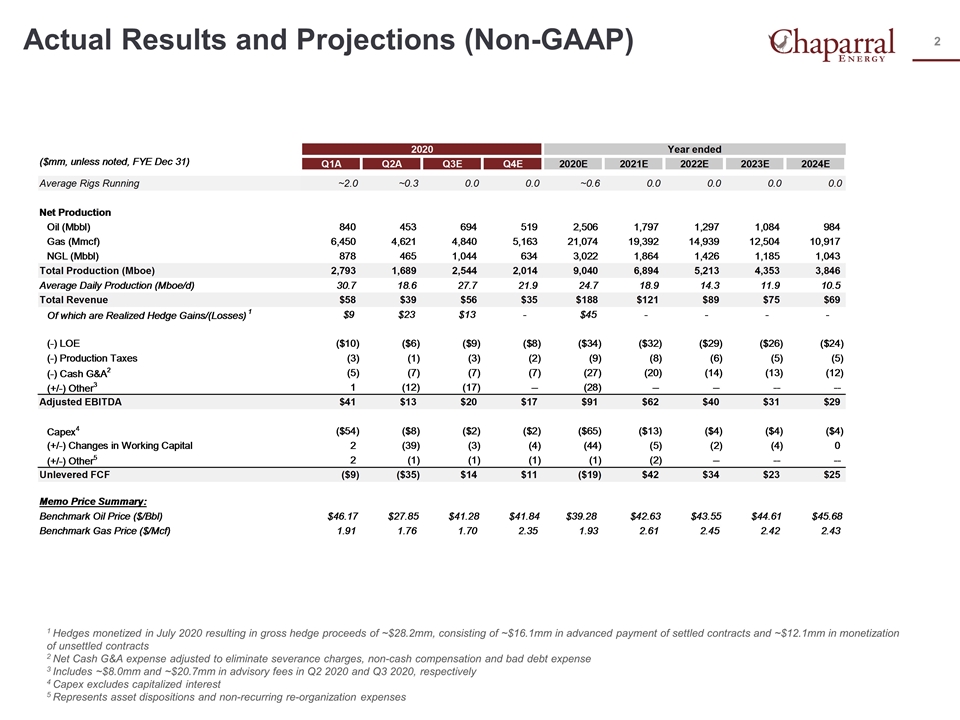
Actual Results and Projections (Non-GAAP) 1 Hedges monetized in July 2020 resulting in gross hedge proceeds of ~$28.2mm, consisting of ~$16.1mm in advanced payment of settled contracts and ~$12.1mm in monetization of unsettled contracts 2 Net Cash G&A expense adjusted to eliminate severance charges, non-cash compensation and bad debt expense 3 Includes ~$8.0mm and ~$20.7mm in advisory fees in Q2 2020 and Q3 2020, respectively 4 Capex excludes capitalized interest 5 Represents asset dispositions and non-recurring re-organization expenses Opportune to update to 8/6 strip?
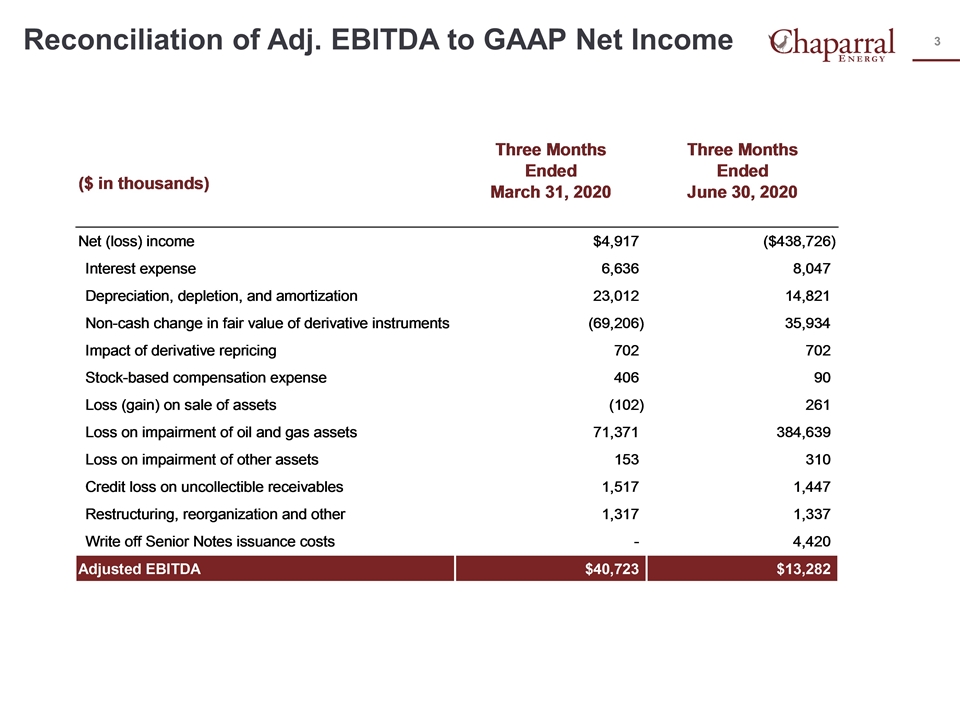
Reconciliation of Adj. EBITDA to GAAP Net Income
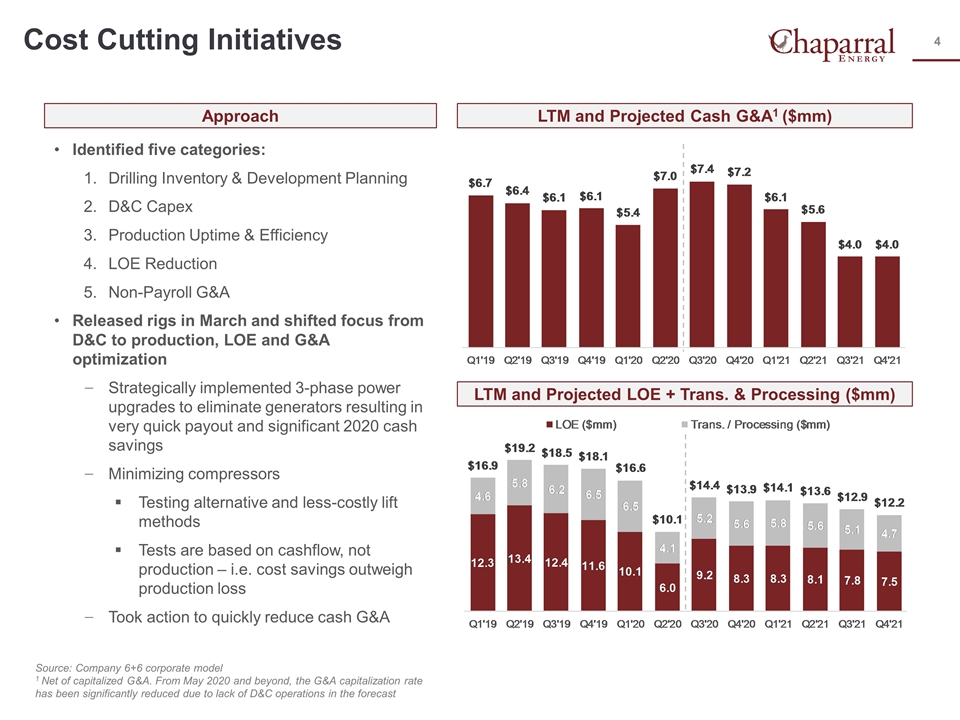
Approach LTM and Projected LOE + Trans. & Processing ($mm) Cost Cutting Initiatives Identified five categories: Drilling Inventory & Development Planning D&C Capex Production Uptime & Efficiency LOE Reduction Non-Payroll G&A Released rigs in March and shifted focus from D&C to production, LOE and G&A optimization Strategically implemented 3-phase power upgrades to eliminate generators resulting in very quick payout and significant 2020 cash savings Minimizing compressors Testing alternative and less-costly lift methods Tests are based on cashflow, not production – i.e. cost savings outweigh production loss Took action to quickly reduce cash G&A LTM and Projected Cash G&A1 ($mm) Source: Company 6+6 corporate model 1 Net of capitalized G&A. From May 2020 and beyond, the G&A capitalization rate has been significantly reduced due to lack of D&C operations in the forecast
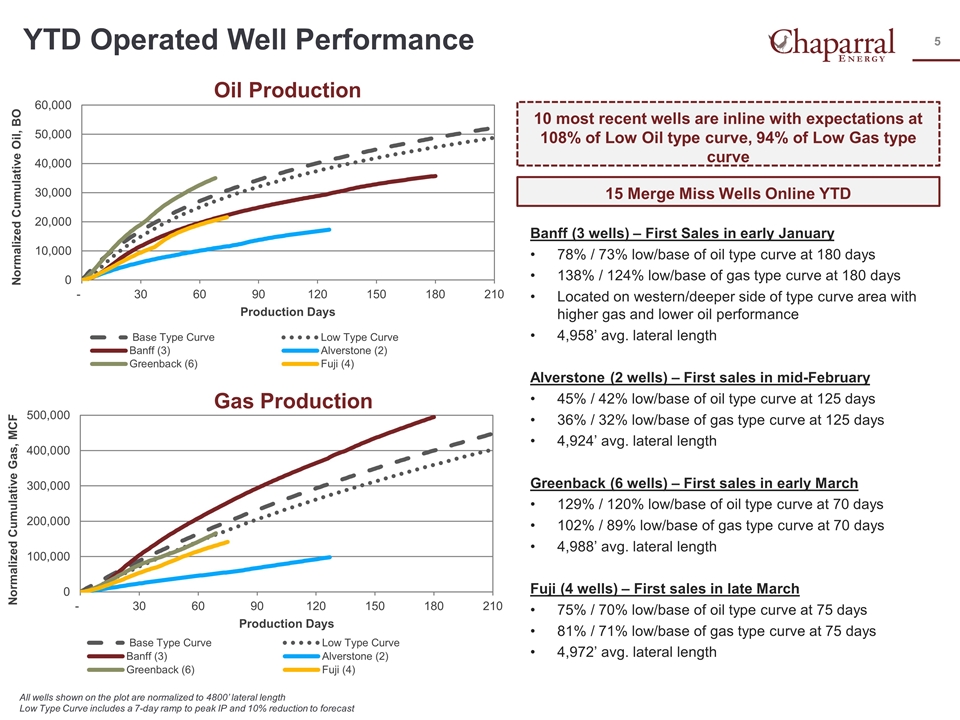
YTD Operated Well Performance Banff (3 wells) – First Sales in early January 78% / 73% low/base of oil type curve at 180 days 138% / 124% low/base of gas type curve at 180 days Located on western/deeper side of type curve area with higher gas and lower oil performance 4,958’ avg. lateral length Alverstone (2 wells) – First sales in mid-February 45% / 42% low/base of oil type curve at 125 days 36% / 32% low/base of gas type curve at 125 days 4,924’ avg. lateral length Greenback (6 wells) – First sales in early March 129% / 120% low/base of oil type curve at 70 days 102% / 89% low/base of gas type curve at 70 days 4,988’ avg. lateral length Fuji (4 wells) – First sales in late March 75% / 70% low/base of oil type curve at 75 days 81% / 71% low/base of gas type curve at 75 days 4,972’ avg. lateral length All wells shown on the plot are normalized to 4800’ lateral length Low Type Curve includes a 7-day ramp to peak IP and 10% reduction to forecast Oil Production Gas Production 10 most recent wells are inline with expectations at 108% of Low Oil type curve, 94% of Low Gas type curve 15 Merge Miss Wells Online YTD
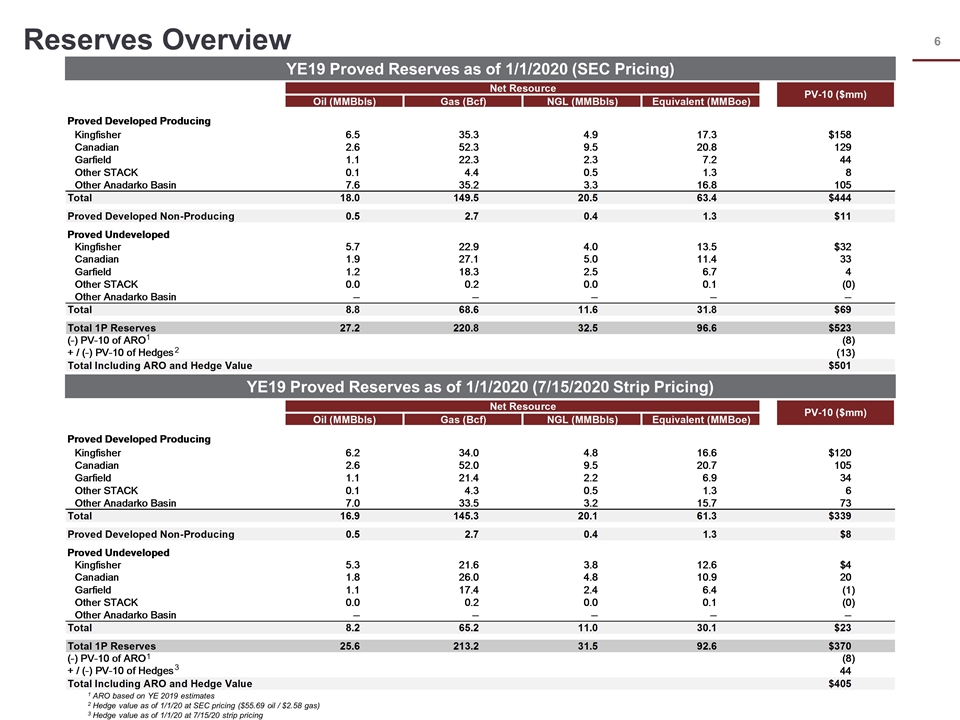
Reserves Overview YE19 Proved Reserves as of 1/1/2020 (7/15/2020 Strip Pricing) YE19 Proved Reserves as of 1/1/2020 (SEC Pricing) 1 ARO based on YE 2019 estimates 2 Hedge value as of 1/1/20 at SEC pricing ($55.69 oil / $2.58 gas) 3 Hedge value as of 1/1/20 at 7/15/20 strip pricing 1 2 1 3
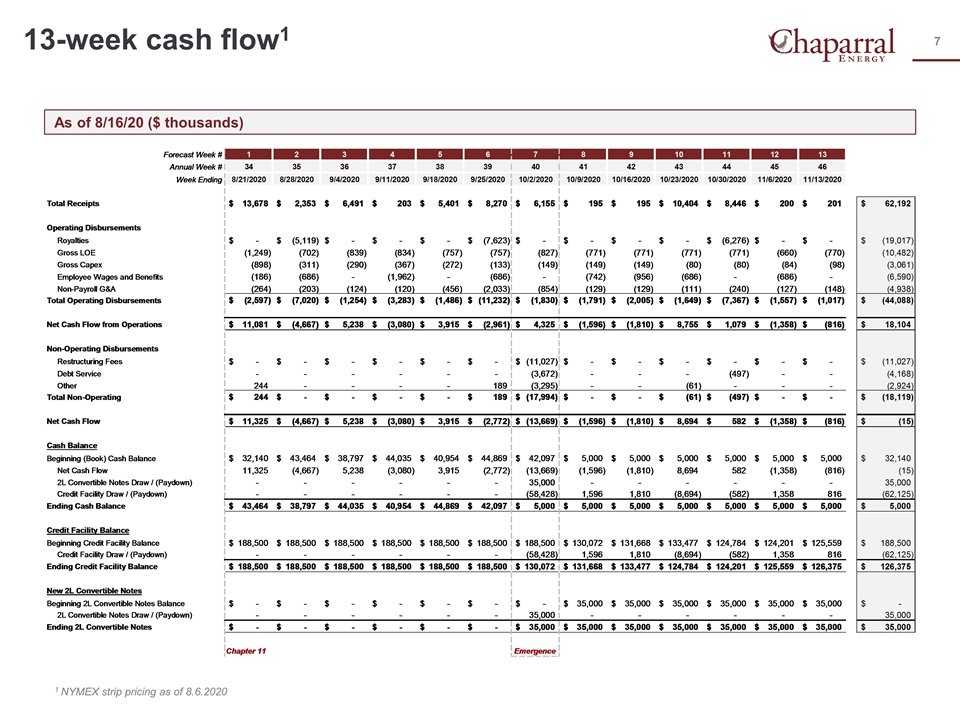
13-week cash flow1 As of 8/16/20 ($ thousands) Opportune to update 7/15 strip 1 NYMEX strip pricing as of 8.6.2020
The securities to which this communication relates will not be registered under the U.S. Securities Act of 1933, as amended (the “Securities Act”), or the securities laws of any state or any other jurisdiction. The securities may not be offered or sold within the United States or to, or for the account or benefit of, U.S. persons except pursuant to an exemption from, or in a transaction not subject to, the registration requirements of the Securities Act. Accordingly, the securities will be offered and sold only (a) to “qualified institutional buyers” (as defined in Rule 144A under the Securities Act) in compliance with Rule 144A under the Securities Act and (b) outside the United States to non-U.S. persons in compliance with Regulation S under the Securities Act. This communication is for informational purposes only and not intended to and does not constitute an offer to subscribe for, buy or sell, the solicitation of an offer to subscribe for, buy or sell or an invitation to subscribe for, buy or sell any securities in any jurisdiction, nor shall there be any sale, issuance or transfer of securities in any jurisdiction in contravention of applicable law. You should not rely upon or use it to form the definitive basis for any decision or action whatsoever, with respect to any proposed transaction or otherwise. This document is “as is” and is based, in part, on information obtained from other sources. Our use of such information does not imply that we have independently verified or necessarily agree with any of such information, and we have assumed and relied upon the accuracy and completeness of such information for purposes of this document. Neither we nor any of our affiliates, agents, or advisors make any representation or warranty, express or implied, in relation to the accuracy or completeness of the information contained in this document (or any data it generates) and expressly disclaim any and all liability (whether direct or indirect, in contract, tort or otherwise) in relation to any of such information or any errors or omissions therein. Forward-Looking Statements This presentation includes statements that constitute forward-looking statements within the meaning of the federal securities laws. These statements are subject to risks and uncertainties. These statements may relate to, but are not limited to, information or assumptions about us, our capital and other expenditures, production, well performance, commodity prices, revenue collection, financing plans, capital structure, cash flow, future economic performance, operating income, cost savings, and management’s plans, strategies, goals and objectives for future operations. These forward-looking statements generally are accompanied by words such as “intend,” “anticipate,” “believe,” “estimate,” “expect,” “should,” “seek,” “project,” “plan” or similar expressions. Any statement that is not a historical fact is a forward-looking statement. It should be understood that these forward-looking statements are necessarily estimates reflecting the best judgment of senior management, not guarantees of future performance. They are subject to a number of assumptions, risks and uncertainties that could cause actual results to differ materially from those expressed or implied in the forward-looking statements. These forward-looking statements represent intentions, plans, expectations, assumptions and beliefs about future events and are subject to risks, uncertainties and other factors. Many of those factors are outside of our control and could cause actual results to differ materially from the results expressed or implied by those forward-looking statements. In addition to the risk factors described in our Quarterly Report on Form 10-Q for the quarter ended March 31, 2020 and in our Annual Report on Form 10-K for the year ended December 31, 2019 and any other public filings, the risks and uncertainties include or relate to: the impact of the COVID-19 pandemic; worldwide supply of and demand for oil and natural gas; volatility and declines in oil and natural gas prices; geologic and reservoir complexity and variability; drilling plans (including scheduled and budgeted wells); the number, timing or results of any wells; changes in wells operated and in reserve estimates; future growth and expansion; future exploration; integration of existing and new technologies into operations; future capital expenditures (or funding thereof) and working capital; effectiveness and extent to our risk management activities; the extent to which our strategy to stop drilling and completion and to shut-in non-essential oil production results in incremental future value; availability and cost of equipment and services; risks related to the concentration of our operations in the mid-continent geographic area; borrowings and capital resources and liquidity; covenant compliance under instruments governing any of our existing or future indebtedness; changes in strategy and business discipline, including our post-emergence business strategy; legislative, tax and regulatory initiatives, including in response to the COVID-19 pandemic; loss of key personnel; geopolitical events affecting oil and natural gas prices; outcome, effects or timing of legal proceedings (including environmental litigation); the ability to improve our financial results; availability of sufficient cash flow to execute our business plan; and the ability to replace reserves and efficiently develop current reserves. (Initial production (IP) rates are discreet data points in each well’s productive history. These rates are sometimes actual rates and sometimes extrapolated or normalized rates. As such, the rates for a particular well may decline over time and change as additional data becomes available. Peak production rates are not necessarily indicative or predictive of future production rates or economic rates-of-return from such wells and should not be relied upon for such purpose.) The ability of the company or the relevant operator to maintain expected levels of production from a well is subject to numerous risks and uncertainties, including those referenced and discussed above. (In addition, methodology the company and other industry participants utilize to calculate peak IP rates may not be consistent and, as a result, the values reported may not be directly and meaningfully comparable.) These and other important factors could cause actual results to differ materially from those anticipated or implied in the forward-looking statements. We undertake no obligation to update or revise any forward-looking statements, whether as a result of new information, future events or otherwise, except as may be required under applicable securities laws. All forward-looking statements included herein are expressly qualified in their entirety by the cautionary statements contained or referred to in this section. Disclaimer
www.chaparralenergy.com
