Attached files
| file | filename |
|---|---|
| EX-99.3 - EX-99.3 - LEAF GROUP LTD. | leaf-20200730ex993bdc6c4.htm |
| EX-99.1 - EX-99.1 - LEAF GROUP LTD. | leaf-20200730ex9918e15d3.htm |
| 8-K - 8-K - LEAF GROUP LTD. | leaf-20200730x8k.htm |
Exhibit 99.2
| Q2 2020 SHAREHOLDER LETTER JULY 30, 2020 |

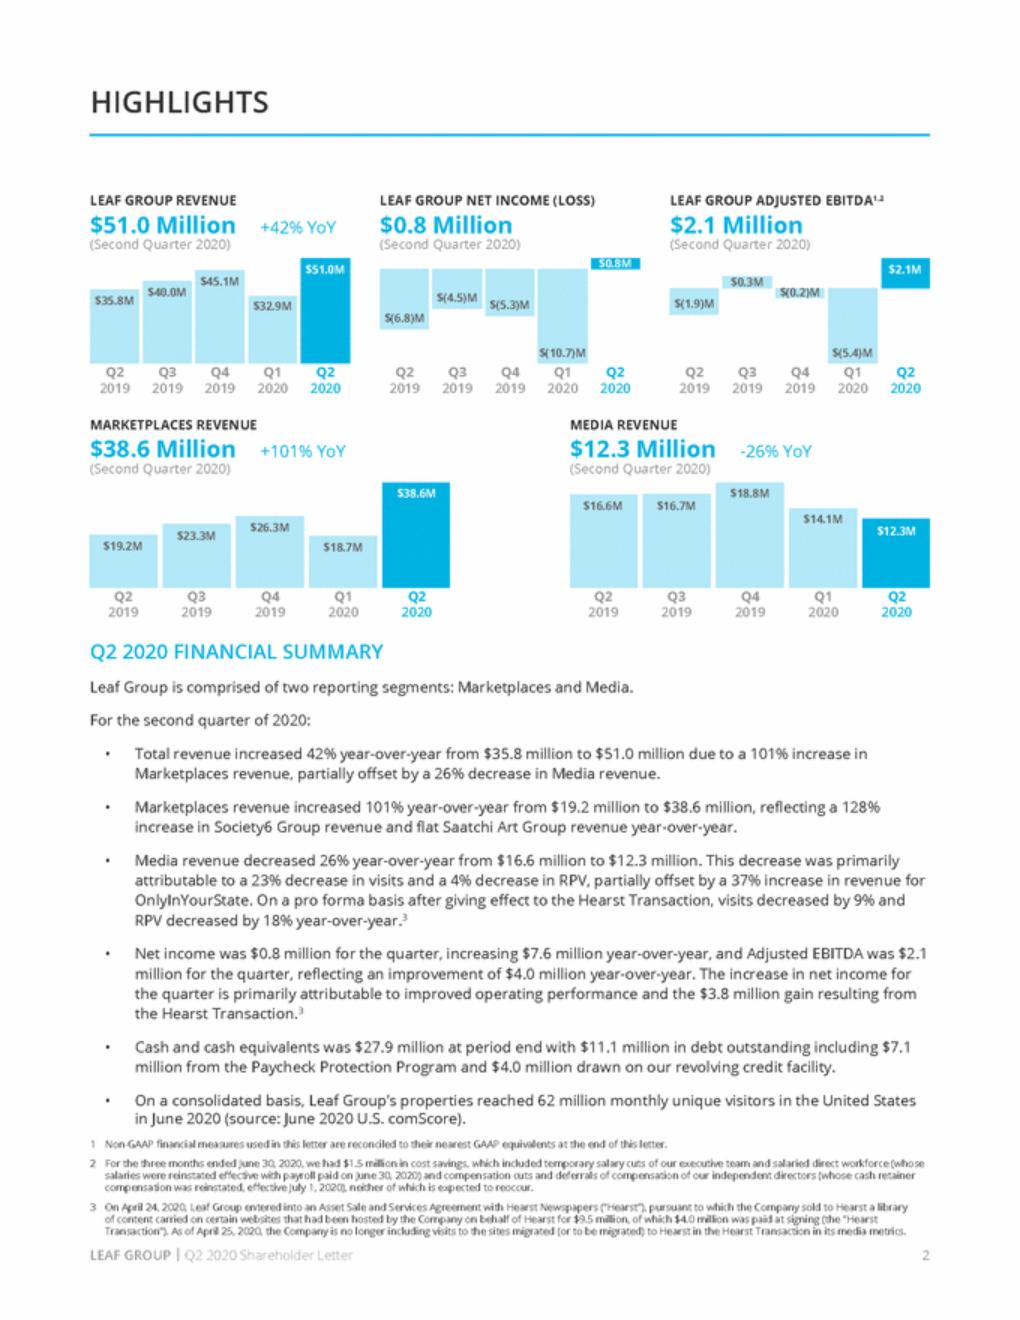
| HIGHLIGHTS LEAF GROUP REVENUE $51.0 Million (Second Quarter 2020) LEAF GROUP NET INCOME (LOSS) $0.8 Million (Second Quarter 2020) LEAF GROUP ADJUSTED EBITDA1,2 $2.1 Million (Second Quarter 2020) +42% YoY $(0.2)M Q2 2019 Q3 2019 Q4 2019 Q1 2020 Q2 2020 Q2 2019 Q3 2019 Q4 2019 Q1 2020 Q2 2020 Q2 2019 Q3 2019 Q4 2019 Q1 2020 Q2 2020 MARKETPLACES REVENUE $38.6 Million (Second Quarter 2020) MEDIA REVENUE $12.3 Million (Second Quarter 2020) +101% YoY -26% YoY Q2 2019 Q3 2019 Q4 2019 Q1 2020 Q2 2020 Q2 2019 Q3 2019 Q4 2019 Q1 2020 Q2 2020 Q2 2020 FINANCIAL SUMMARY Leaf Group is comprised of two reporting segments: Marketplaces and Media. For the second quarter of 2020: • Total revenue increased 42% year-over-year from $35.8 million to $51.0 million due to a 101% increase in Marketplaces revenue, partially offset by a 26% decrease in Media revenue. • Marketplaces revenue increased 101% year-over-year from $19.2 million to $38.6 million, reflecting a 128% increase in Society6 Group revenue and flat Saatchi Art Group revenue year-over-year. • Media revenue decreased 26% year-over-year from $16.6 million to $12.3 million. This decrease was primarily attributable to a 23% decrease in visits and a 4% decrease in RPV, partially offset by a 37% increase in revenue for OnlyInYourState. On a pro forma basis after giving effect to the Hearst Transaction, visits decreased by 9% and RPV decreased by 18% year-over-year.3 • Net income was $0.8 million for the quarter, increasing $7.6 million year-over-year, and Adjusted EBITDA was $2.1 million for the quarter, reflecting an improvement of $4.0 million year-over-year. The increase in net income for the quarter is primarily attributable to improved operating performance and the $3.8 million gain resulting from the Hearst Transaction.3 • Cash and cash equivalents was $27.9 million at period end with $11.1 million in debt outstanding including $7.1 million from the Paycheck Protection Program and $4.0 million drawn on our revolving credit facility. • On a consolidated basis, Leaf Group’s properties reached 62 million monthly unique visitors in the United States in June 2020 (source: June 2020 U.S. comScore). 1 2 Non-GAAP financial measures used in this letter are reconciled to their nearest GAAP equivalents at the end of this letter. For the three months ended June 30, 2020, we had $1.5 million in cost savings, which included temporary salary cuts of our executive team and salaried direct workforce (whose salaries were reinstated effective with payroll paid on June 30, 2020) and compensation cuts and deferrals of compensation of our independent directors (whose cash retainer compensation was reinstated, effective July 1, 2020), neither of which is expected to reoccur. On April 24, 2020, Leaf Group entered into an Asset Sale and Services Agreement with Hearst Newspapers (“Hearst”), pursuant to which the Company sold to Hearst a library of content carried on certain websites that had been hosted by the Company on behalf of Hearst for $9.5 million, of which $4.0 million was paid at signing (the “Hearst Transaction”). As of April 25, 2020, the Company is no longer including visits to the sites migrated (or to be migrated) to Hearst in the Hearst Transaction in its media metrics. 3 LEAF GROUP | Q2 2020 Shareholder Letter 2 $18.7M $19.2M $23.3M $26.3M $12.3M $14.1M $16.7M $16.6M $38.6M $18.8M $0.3M $(1.9)M $51.0M $45.1M $40.0M $35.8M $32.9M $2.1M $(5.4)M $0.8M $(6.8)M $(4.5)M $(5.3)M $(10.7)M |
| TO OUR SHAREHOLDERS Welcome to our Q2 2020 shareholder letter. HOME, ART & DESIGN We hope this letter finds you and your families safe and well. In our last letter, we outlined how our team was able to quickly and effectively adapt to the Pandemic, which at the time was just beginning to unfold. Today, we want to take some time to highlight how the continued resilience of our team, as well as the company and our diverse portfolio of brands, is translating into very strong financial results and reduced overall corporate financial volatility and risk – all despite the unpredictable macroenvironment in which we are operating. The quick, decisive measures that we took across our portfolio in March have continued to drive positive momentum for the company and our brands in Q2 2020, despite a challenging advertising landscape. Q2 2020 revenue increased 42% – marking our strongest revenue growth since Q1 2011. Q2 2020 Adjusted EBITDA was $2.1 million, a $4.0 million increase year-over-year. We ended Q2 2020 with $27.9 million in cash – a significant improvement from $11.6 million in Q1 2020 – driven by strong operating cash flow and the addition of $7.1 million received from the Paycheck Protection Program (PPP Loan) and $4.0 million from the April 2020 content sale to Hearst. Q2 2020 cash flow provided by operations was $7.9 million, a $13.8 million improvement year-over-year, primarily driven by strong cash flow generation at Society6 Group. Given the asset light nature of our businesses as they scale, Q2 2020 free cash flow was $6.2 million, a $13.8 million increase year-over-year. FITNESS & WELLNESS The work that the Society6 and Saatchi Art teams had done over the past several quarters have put both brands in prime position to capitalize on the massive ongoing shift in customer purchasing behavior to online, driving historic growth in Q2. Society6 Group reaped the benefits of its recently implemented platform improvements, mobile optimization and revamped merchandising strategy, delivering 134% year-over-year growth in Gross Transaction Value (GTV) – including growth of 172% in U.S. direct-to-consumer (DTC) GTV and a strong rebound in international with GTV increasing 81%, year-over-year. Similarly, Saatchi Art Online delivered record growth in new customers and 50% growth in year-over-year GTV. The strategic decision by Saatchi Art and The Other Art Fair to launch virtual fairs through the new Online Studios campaign also quickly filled a void for artists and art buyers left by the cancellations of in-person art fairs and cultural events. The introduction of this virtual event program has proven to be a valuable channel, generating more than $1.0 million in GTV since its launch in April. Moving forward, Online Studios will be a key element of our business strategy, pairing virtual experiences with the unique onsite programming attendees have come to know and love. MEDIA LEAF GROUP | Q2 2020 Shareholder Letter 3 |

| We believe this upward trend in digital demand reflects a fundamental shift in consumer behavior and eCommerce that we expect to continue even after the Pandemic restrictions ease. In our view, these behavioral changes are here to stay, and we expect them to drive sustainable growth across our properties going forward. Media revenue declined 26% year-over-year in the quarter, primarily due to the impact of the Pandemic on overall industry ad pricing and, to a lesser extent, a decrease in visits. The strength of our media and sales teams is evident in how quickly they adapted, taking advantage of overwhelming marketer demand for insight into consumer needs in the current landscape and pivoting to a position of thought leadership. Leaf Group’s media and sales teams developed its first data-driven report, the Leaf Group COVID-19 Study: Consumer Beliefs, Behaviors and Lasting Changes, and utilized findings from the report to provide brands and advertisers with the answers to key strategic questions regarding consumer buying habits and the most effective use of marketing dollars. This strategy led to a new deal with Campbell’s brand V8 for a custom campaign across Well+Good and Livestrong.com, set to launch later this summer. Q3 is off to a strong start with Marketplaces momentum continuing in July, and Media trends are starting to show signs of improvement compared to Q2, on a year-over-year basis. We are seeing early signs of improvement in direct Media sales. LOOKING AHEAD – BRANDS TO WIN AND 2022 TARGETS As we look ahead, we are more confident than ever in our strategy of building a portfolio of digital-first brands in high-passion lifestyle categories. We have established leadership positions in Fitness & Wellness and Home, Art & Design, which are massive categories that are experiencing significant digital growth and resonate with a large, mass-affluent audience. We believe we own the right brands in the right categories to achieve a long-term revenue growth rate organically at 15%+ annually and 20%+ with our tuck-in acquisition strategy. With Society6, Saatchi Art and Hunker, we are well positioned to drive strong growth in the Home, Art & Design category. With over 75% of its GTV in home decor, Society6 is well positioned in the $30+ billion U.S. online home decor market, offering consumers over 70 premium products featuring millions of unique designs at affordable prices. Society6 Group is experiencing strong eCommerce demand across all its main categories of Wall Art, Home Décor, and Technology, and the recent introduction of non-medical face masks in late June 2020 has been a top performing product since launch. Saatchi Art has seen strong new customer acquisition and increasing marketplace traction in Q2. As with other eCommerce markets, the $60+ billion art marketplace is seeing significant growth and change as consumers are turning to the web to discover art for their homes and living spaces, all while physical galleries have closed their doors and the global art fair system has shuttered. As a leading online art gallery, Saatchi Art is well positioned given its marketplace of over 100,000 global artists and recent introduction of Online Studios from The Other Art Fair. Our digital media portfolio is well-balanced and remains highly profitable, setting up well for a rebound in CPM pricing in the future. The Leaf Group portfolio reaches more than 61 million monthly unique visitors – roughly one quarter of the U.S. internet population (source: June 2020 comScore) – providing significant revenue growth opportunities through increasing engagement and direct sales. Hunker and Well+Good are focusing on opportunities to diversify revenue. Early efforts in affiliate commerce and digital events are showing initial success with opportunities to expand, while these premium brands explore longer-term strategies including new subscription offerings. Our common media technology platform enables our sites to organically scale rapidly and efficiently. We will continue to explore strategic M&A, such as OnlyInYourState, which has grown revenue threefold since the acquisition in February 2019. LEAF GROUP | Q2 2020 Shareholder Letter 4 |
| 2022 TARGETS We are establishing 2022 Targets of more than $250 million in revenue and $20 million in Adjusted EBITDA as guideposts for investors based on increased confidence in the growth and strength of our key brands and proven portfolio operating leverage. We expect that selective, strategic tuck-in acquisitions would be additive to these targets. At the segment margin level, we continue to expect Segment Operating Contribution Margin to remain in the 35-40% range for Media, and as Marketplaces revenue continues to grow, we expect incremental Segment Operating Contribution Margin to be in the 15-20% range. In Q2 2020, Marketplaces generated Segment Operating Contribution Margin of $3.7 million, or 9.5% with incremental Segment Operating Contribution Margin of 26%, partly aided by expense savings. On the Media side, despite a challenging revenue quarter, Media Segment Operating Contribution Margin was $4.8 million, or 38.7%. Over the next several quarters we expect the digital media marketplace to continue to improve. On the bottom line, we expect significant operating leverage against our largely fixed corporate expenses. With our Q2 2020 earnings release, we added an additional financial disclosure for corporate expenses with the break out of Strategic Shared Services (including services such as business intelligence, financial systems, business development, information systems, etc.) and Corporate Overhead (including accounting, finance, HR and legal), which we believe better informs investors on how we view our business. Given this change in reporting, we have and will continue to adjust comparable year-over-year period results using the same methodology. With improved revenue growth and increasing scale and leverage, we expect strong conversion, from Adjusted EBITDA to free cash flow, given favorable working capital dynamics of our Marketplace brands and modest capital expenditures which remain low in the 3-4% range of revenue. Over the long term, we expect to see increasingly strong free cash flow for our businesses. INVESTOR GROUP UPDATE As many of you are likely aware, a group of our investors has issued several public letters to shareholders expressing their views about the Company’s current strategy, leadership, and Board. You can find our latest responses to their communications here and here. Our Board of Directors is always open to reviewing offers for Leaf Group that can potentially deliver shareholder value, and the Company just completed an exhaustive, 13-month strategic review to do so. Now, we are focused on extending our strong performance. A QUARTER – AND TEAM – TO BE PROUD OF While we are still operating in an environment of unprecedented uncertainty, we are extremely proud of what our Leaf Group team has delivered over the past quarter. Despite operating in a global pandemic and through a period of extreme volatility, we have worked hard, sacrificed as a team to protect jobs and avoid layoffs, and delivered truly outstanding quarterly results. Our team of people are committed, capable, and have proven themselves under the most adverse of circumstances. The strength of our team, quality of our brands, and category positioning gives us the utmost confidence that we can continue to deliver excellent results and drive shareholder value. LEAF GROUP | Q2 2020 Shareholder Letter 5 |
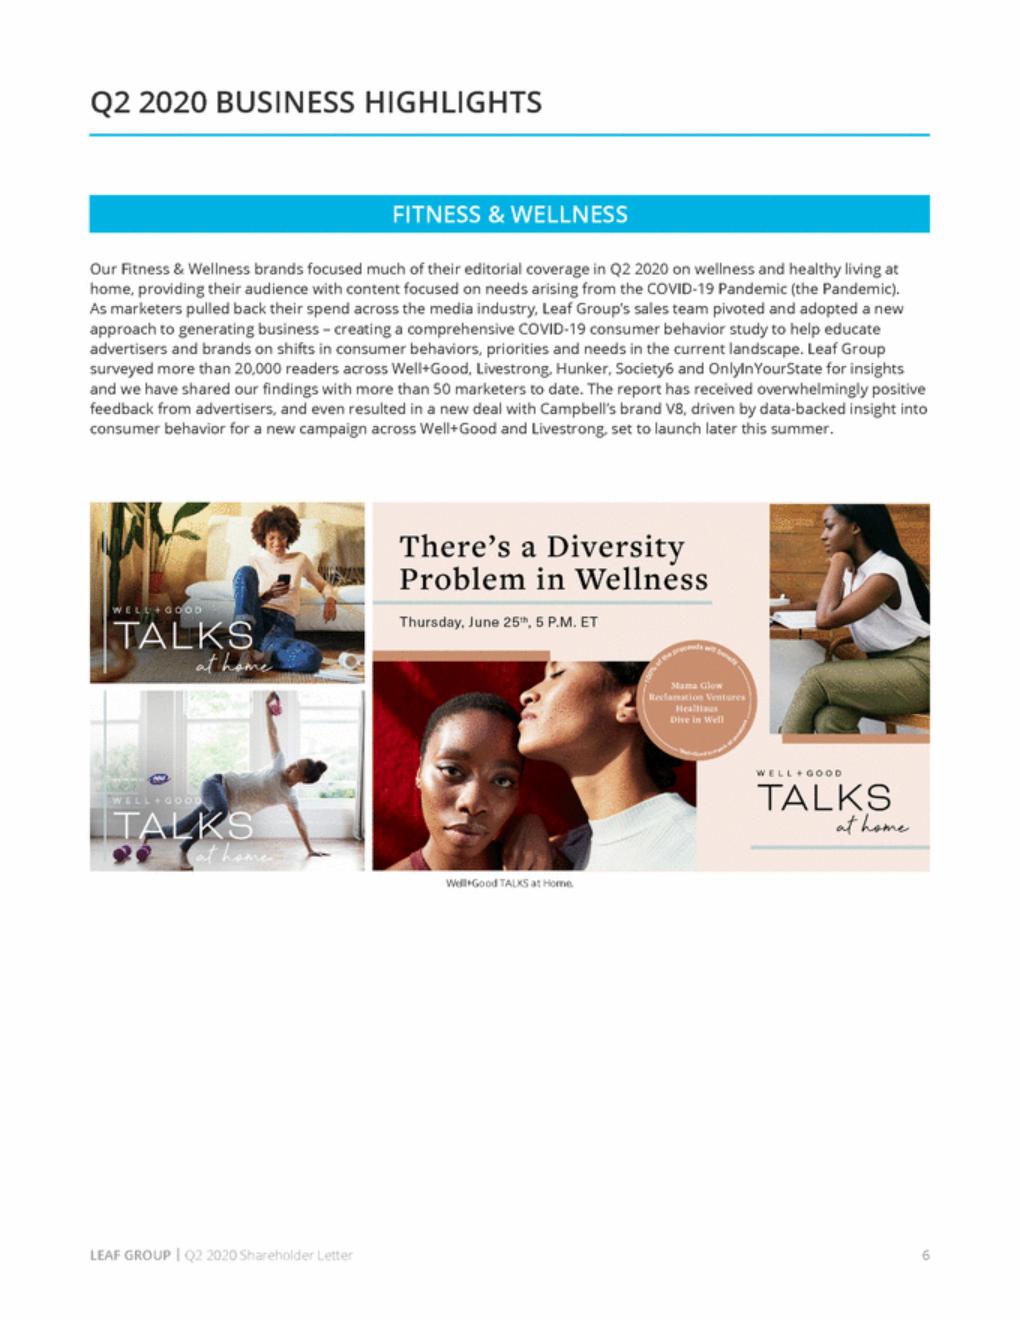
| Q2 2020 BUSINESS HIGHLIGHTS Our Fitness & Wellness brands focused much of their editorial coverage in Q2 2020 on wellness and healthy living at home, providing their audience with content focused on needs arising from the COVID-19 Pandemic (the Pandemic). As marketers pulled back their spend across the media industry, Leaf Group’s sales team pivoted and adopted a new approach to generating business – creating a comprehensive COVID-19 consumer behavior study to help educate advertisers and brands on shifts in consumer behaviors, priorities and needs in the current landscape. Leaf Group surveyed more than 20,000 readers across Well+Good, Livestrong, Hunker, Society6 and OnlyInYourState for insights and we have shared our findings with more than 50 marketers to date. The report has received overwhelmingly positive feedback from advertisers, and even resulted in a new deal with Campbell’s brand V8, driven by data-backed insight into consumer behavior for a new campaign across Well+Good and Livestrong, set to launch later this summer. Well+Good TALKS at Home. LEAF GROUP | Q2 2020 Shareholder Letter 6 FITNESS & WELLNESS |
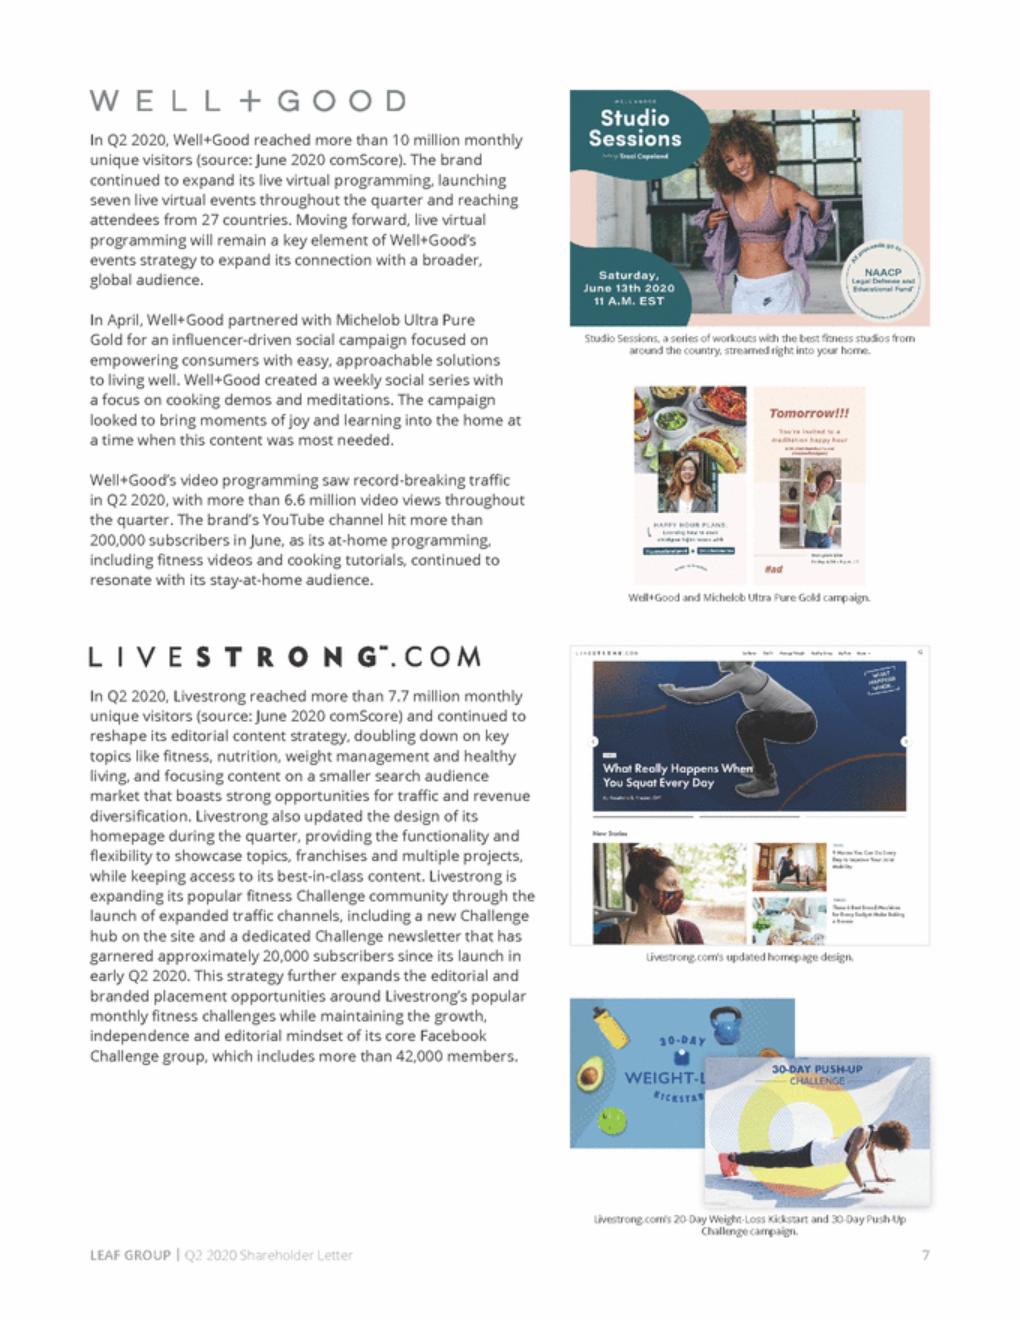
| In Q2 2020, Well+Good reached more than 10 million monthly unique visitors (source: June 2020 comScore). The brand continued to expand its live virtual programming, launching seven live virtual events throughout the quarter and reaching attendees from 27 countries. Moving forward, live virtual programming will remain a key element of Well+Good’s events strategy to expand its connection with a broader, global audience. In April, Well+Good partnered with Michelob Ultra Pure Gold for an influencer-driven social campaign focused on empowering consumers with easy, approachable solutions to living well. Well+Good created a weekly social series with a focus on cooking demos and meditations. The campaign looked to bring moments of joy and learning into the home at a time when this content was most needed. Studio Sessions, a series of workouts with the best fitness studios from around the country, streamed right into your home. Well+Good’s video programming saw record-breaking traffic in Q2 2020, with more than 6.6 million video views throughout the quarter. The brand’s YouTube channel hit more than 200,000 subscribers in June, as its at-home programming, including fitness videos and cooking tutorials, continued to resonate with its stay-at-home audience. Well+Good and Michelob Ultra Pure Gold campaign. In Q2 2020, Livestrong reached more than 7.7 million monthly unique visitors (source: June 2020 comScore) and continued to reshape its editorial content strategy, doubling down on key topics like fitness, nutrition, weight management and healthy living, and focusing content on a smaller search audience market that boasts strong opportunities for traffic and revenue diversification. Livestrong also updated the design of its homepage during the quarter, providing the functionality and flexibility to showcase topics, franchises and multiple projects, while keeping access to its best-in-class content. Livestrong is expanding its popular fitness Challenge community through the launch of expanded traffic channels, including a new Challenge hub on the site and a dedicated Challenge newsletter that has garnered approximately 20,000 subscribers since its launch in early Q2 2020. This strategy further expands the editorial and branded placement opportunities around Livestrong’s popular monthly fitness challenges while maintaining the growth, independence and editorial mindset of its core Facebook Challenge group, which includes more than 42,000 members. Livestrong.com’s updated homepage design. Livestrong.com’s 20-Day Weight-Loss Kickstart and 30-Day Push-Up Challenge campaign. LEAF GROUP | Q2 2020 Shareholder Letter 7 |
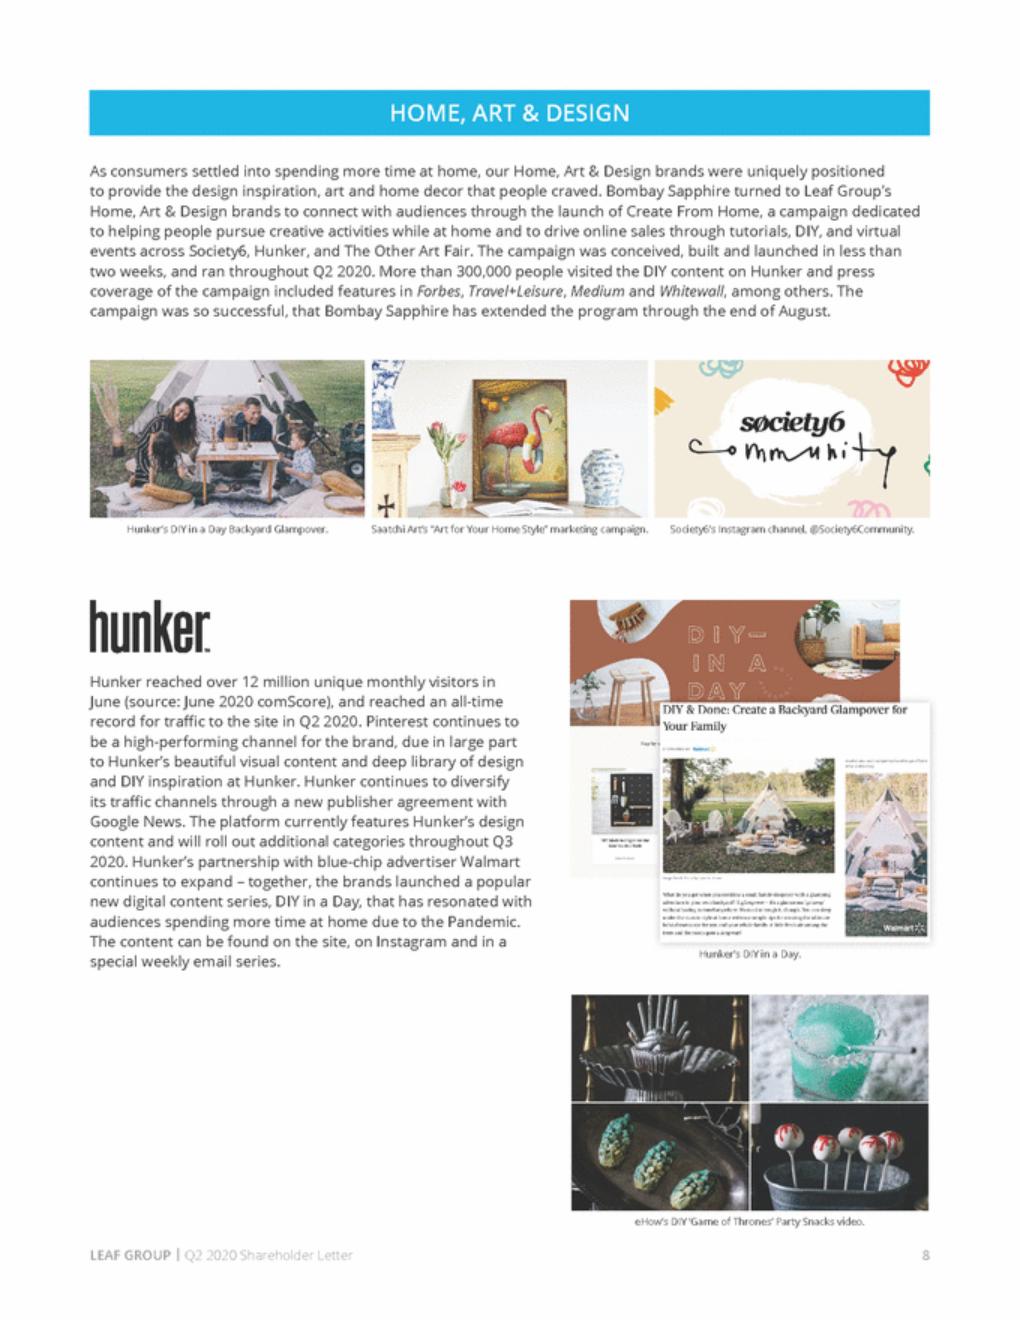
| As consumers settled into spending more time at home, our Home, Art & Design brands were uniquely positioned to provide the design inspiration, art and home decor that people craved. Bombay Sapphire turned to Leaf Group’s Home, Art & Design brands to connect with audiences through the launch of Create From Home, a campaign dedicated to helping people pursue creative activities while at home and to drive online sales through tutorials, DIY, and virtual events across Society6, Hunker, and The Other Art Fair. The campaign was conceived, built and launched in less than two weeks, and ran throughout Q2 2020. More than 300,000 people visited the DIY content on Hunker and press coverage of the campaign included features in Forbes, Travel+Leisure, Medium and Whitewall, among others. The campaign was so successful, that Bombay Sapphire has extended the program through the end of August. Hunker’s DIY in a Day Backyard Glampover. Saatchi Art’s “Art for Your Home Style” marketing campaign. Society6’s Instagram channel, @Society6Community. Hunker reached over 12 million unique monthly visitors in June (source: June 2020 comScore), and reached an all-time record for traffic to the site in Q2 2020. Pinterest continues to be a high-performing channel for the brand, due in large part to Hunker’s beautiful visual content and deep library of design and DIY inspiration at Hunker. Hunker continues to diversify its traffic channels through a new publisher agreement with Google News. The platform currently features Hunker’s design content and will roll out additional categories throughout Q3 2020. Hunker’s partnership with blue-chip advertiser Walmart continues to expand – together, the brands launched a popular new digital content series, DIY in a Day, that has resonated with audiences spending more time at home due to the Pandemic. The content can be found on the site, on Instagram and in a special weekly email series. Hunker’s DIY in a Day. eHow’s DIY ‘Game of Thrones’ Party Snacks video. LEAF GROUP | Q2 2020 Shareholder Letter 8 HOME, ART & DESIGN |
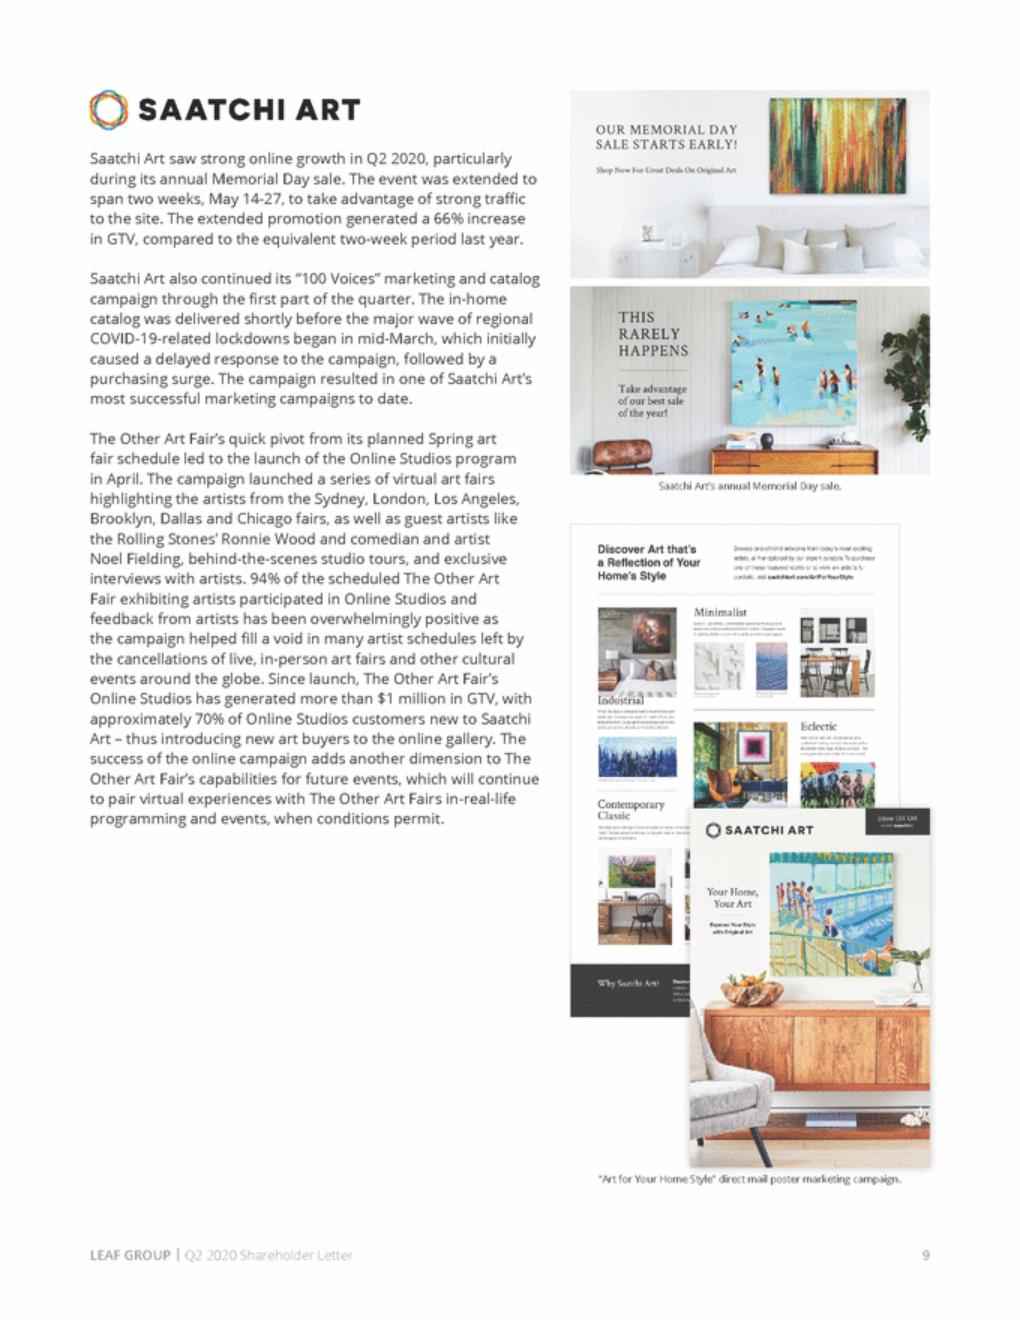
| Saatchi Art saw strong online growth in Q2 2020, particularly during its annual Memorial Day sale. The event was extended to span two weeks, May 14-27, to take advantage of strong traffic to the site. The extended promotion generated a 66% increase in GTV, compared to the equivalent two-week period last year. Saatchi Art also continued its “100 Voices” marketing and catalog campaign through the first part of the quarter. The in-home catalog was delivered shortly before the major wave of regional COVID-19-related lockdowns began in mid-March, which initially caused a delayed response to the campaign, followed by a purchasing surge. The campaign resulted in one of Saatchi Art’s most successful marketing campaigns to date. The Other Art Fair’s quick pivot from its planned Spring art fair schedule led to the launch of the Online Studios program in April. The campaign launched a series of virtual art fairs highlighting the artists from the Sydney, London, Los Angeles, Brooklyn, Dallas and Chicago fairs, as well as guest artists like the Rolling Stones’ Ronnie Wood and comedian and artist Noel Fielding, behind-the-scenes studio tours, and exclusive interviews with artists. 94% of the scheduled The Other Art Fair exhibiting artists participated in Online Studios and feedback from artists has been overwhelmingly positive as the campaign helped fill a void in many artist schedules left by the cancellations of live, in-person art fairs and other cultural events around the globe. Since launch, The Other Art Fair’s Online Studios has generated more than $1 million in GTV, with approximately 70% of Online Studios customers new to Saatchi Art – thus introducing new art buyers to the online gallery. The success of the online campaign adds another dimension to The Other Art Fair’s capabilities for future events, which will continue to pair virtual experiences with The Other Art Fairs in-real-life programming and events, when conditions permit. Saatchi Art’s annual Memorial Day sale. “Art for Your Home Style” direct mail poster marketing campaign. LEAF GROUP | Q2 2020 Shareholder Letter 9 |
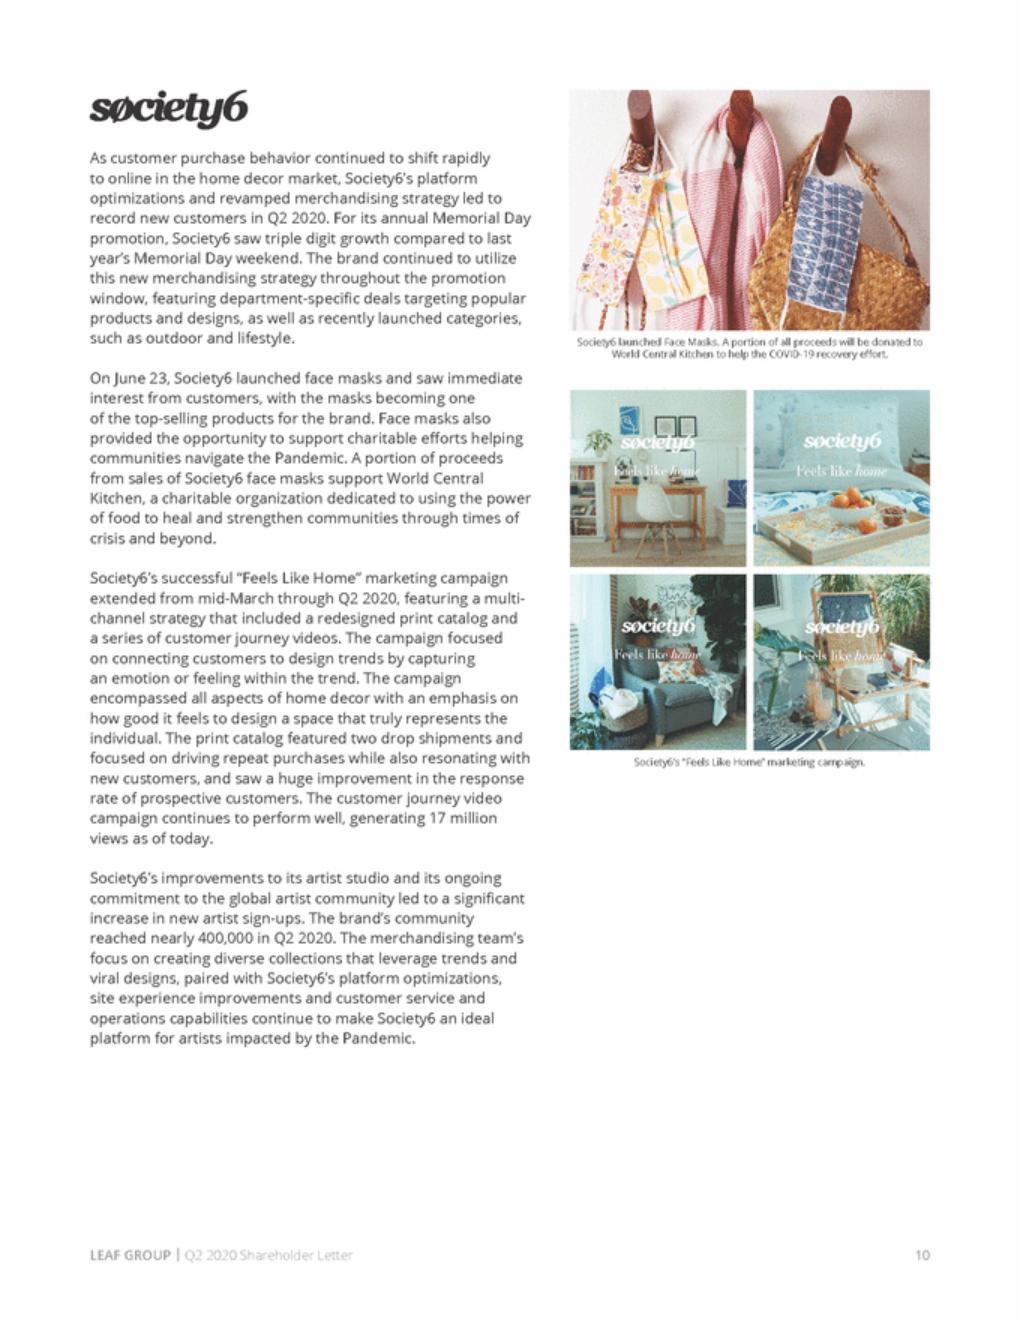
| As customer purchase behavior continued to shift rapidly to online in the home decor market, Society6’s platform optimizations and revamped merchandising strategy led to record new customers in Q2 2020. For its annual Memorial Day promotion, Society6 saw triple digit growth compared to last year’s Memorial Day weekend. The brand continued to utilize this new merchandising strategy throughout the promotion window, featuring department-specific deals targeting popular products and designs, as well as recently launched categories, such as outdoor and lifestyle. Society6 launched Face Masks. A portion of all proceeds will be donated to World Central Kitchen to help the COVID-19 recovery effort. On June 23, Society6 launched face masks and saw immediate interest from customers, with the masks becoming one of the top-selling products for the brand. Face masks also provided the opportunity to support charitable efforts helping communities navigate the Pandemic. A portion of proceeds from sales of Society6 face masks support World Central Kitchen, a charitable organization dedicated to using the power of food to heal and strengthen communities through times of crisis and beyond. Society6’s successful “Feels Like Home” marketing campaign extended from mid-March through Q2 2020, featuring a multi-channel strategy that included a redesigned print catalog and a series of customer journey videos. The campaign focused on connecting customers to design trends by capturing an emotion or feeling within the trend. The campaign encompassed all aspects of home decor with an emphasis on how good it feels to design a space that truly represents the individual. The print catalog featured two drop shipments and focused on driving repeat purchases while also resonating with new customers, and saw a huge improvement in the response rate of prospective customers. The customer journey video campaign continues to perform well, generating 17 million views as of today. Society6’s “Feels Like Home” marketing campaign. Society6’s improvements to its artist studio and its ongoing commitment to the global artist community led to a significant increase in new artist sign-ups. The brand’s community reached nearly 400,000 in Q2 2020. The merchandising team’s focus on creating diverse collections that leverage trends and viral designs, paired with Society6’s platform optimizations, site experience improvements and customer service and operations capabilities continue to make Society6 an ideal platform for artists impacted by the Pandemic. LEAF GROUP | Q2 2020 Shareholder Letter 10 |
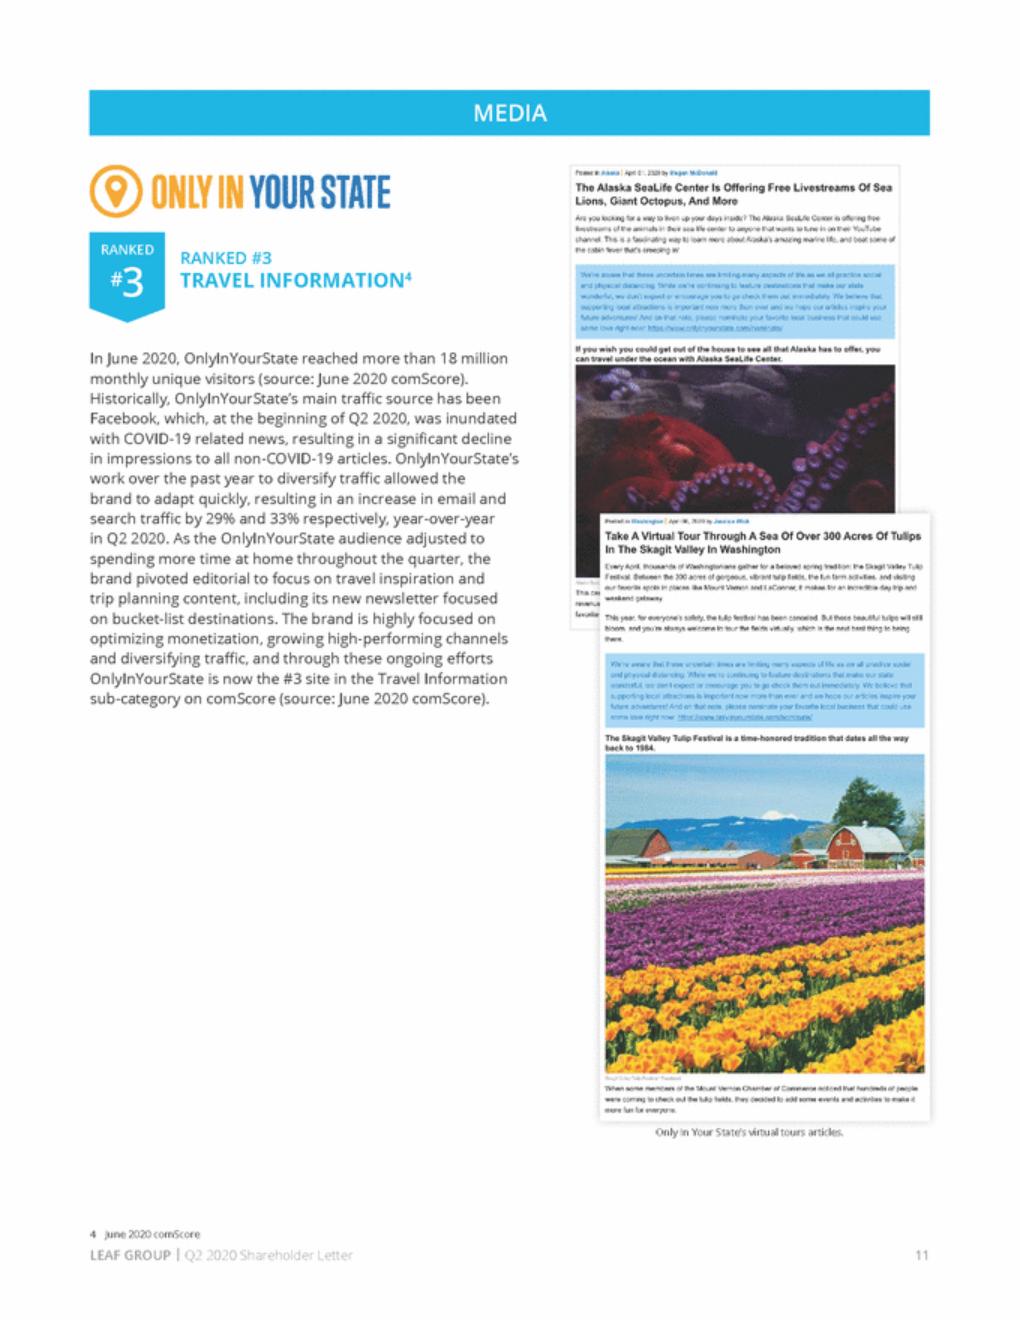
| RANKED #3 RANKED #3 TRAVEL INFORMATION4 In June 2020, OnlyInYourState reached more than 18 million monthly unique visitors (source: June 2020 comScore). Historically, OnlyInYourState’s main traffic source has been Facebook, which, at the beginning of Q2 2020, was inundated with COVID-19 related news, resulting in a significant decline in impressions to all non-COVID-19 articles. OnlyInYourState’s work over the past year to diversify traffic allowed the brand to adapt quickly, resulting in an increase in email and search traffic by 29% and 33% respectively, year-over-year in Q2 2020. As the OnlyInYourState audience adjusted to spending more time at home throughout the quarter, the brand pivoted editorial to focus on travel inspiration and trip planning content, including its new newsletter focused on bucket-list destinations. The brand is highly focused on optimizing monetization, growing high-performing channels and diversifying traffic, and through these ongoing efforts OnlyInYourState is now the #3 site in the Travel Information sub-category on comScore (source: June 2020 comScore). Only In Your State’s virtual tours articles. 4 June 2020 comScore LEAF GROUP | Q2 2020 Shareholder Letter 11 MEDIA |
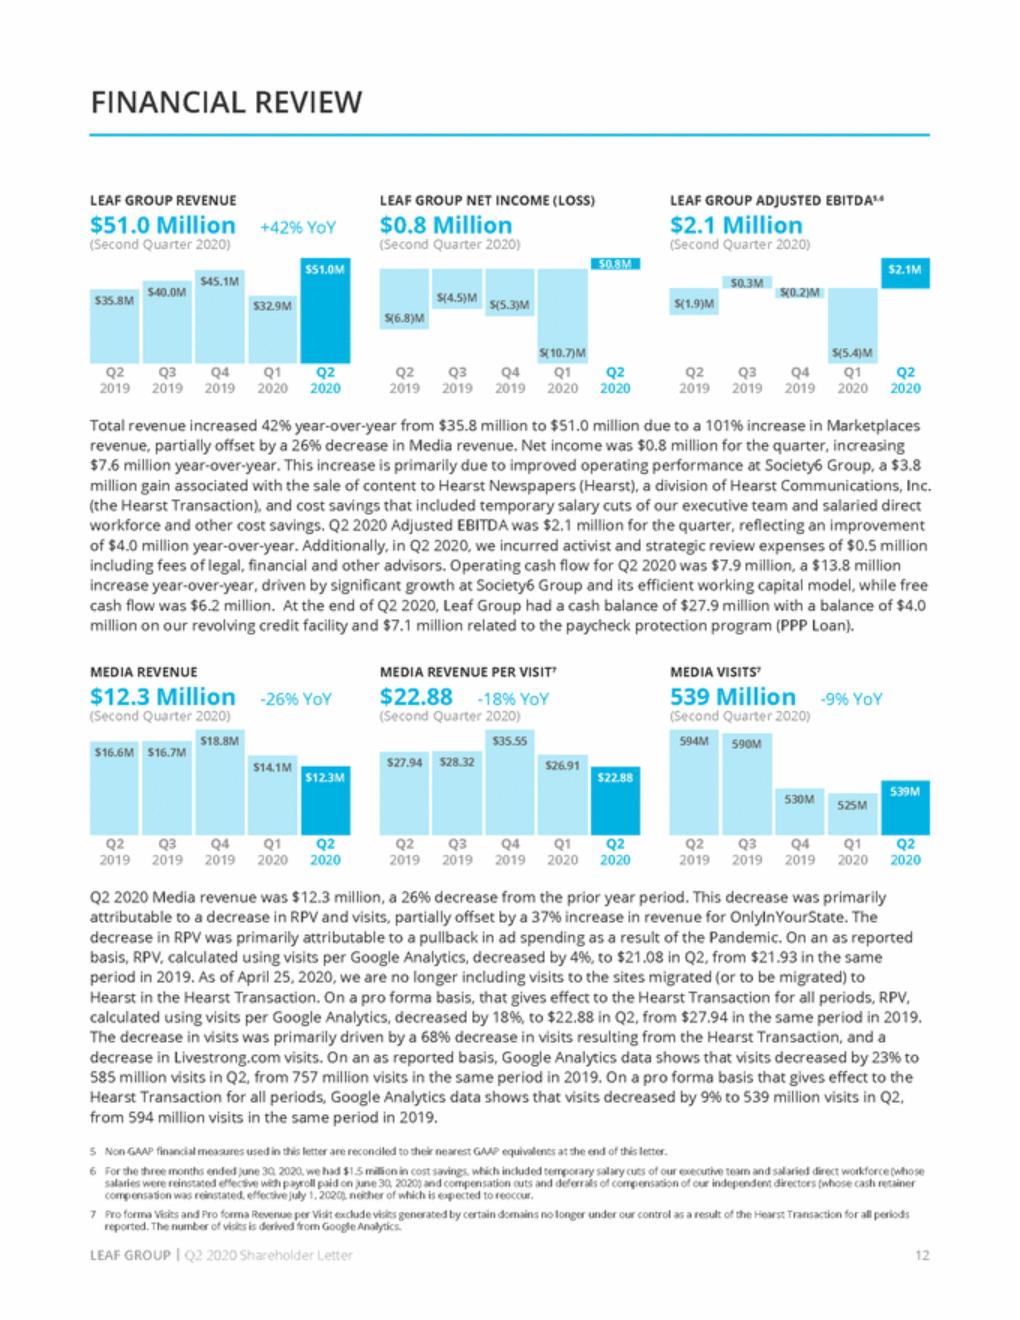
| FINANCIAL REVIEW LEAF GROUP REVENUE $51.0 Million (Second Quarter 2020) LEAF GROUP NET INCOME (LOSS) $0.8 Million (Second Quarter 2020) LEAF GROUP ADJUSTED EBITDA5,6 $2.1 Million (Second Quarter 2020) +42% YoY $(0.2)M Q2 2019 Q3 2019 Q4 2019 Q1 2020 Q2 2020 Q2 2019 Q3 2019 Q4 2019 Q1 2020 Q2 2020 Q2 2019 Q3 2019 Q4 2019 Q1 2020 Q2 2020 Total revenue increased 42% year-over-year from $35.8 million to $51.0 million due to a 101% increase in Marketplaces revenue, partially offset by a 26% decrease in Media revenue. Net income was $0.8 million for the quarter, increasing $7.6 million year-over-year. This increase is primarily due to improved operating performance at Society6 Group, a $3.8 million gain associated with the sale of content to Hearst Newspapers (Hearst), a division of Hearst Communications, Inc. (the Hearst Transaction), and cost savings that included temporary salary cuts of our executive team and salaried direct workforce and other cost savings. Q2 2020 Adjusted EBITDA was $2.1 million for the quarter, reflecting an improvement of $4.0 million year-over-year. Additionally, in Q2 2020, we incurred activist and strategic review expenses of $0.5 million including fees of legal, financial and other advisors. Operating cash flow for Q2 2020 was $7.9 million, a $13.8 million increase year-over-year, driven by significant growth at Society6 Group and its efficient working capital model, while free cash flow was $6.2 million. At the end of Q2 2020, Leaf Group had a cash balance of $27.9 million with a balance of $4.0 million on our revolving credit facility and $7.1 million related to the paycheck protection program (PPP Loan). MEDIA REVENUE $12.3 Million (Second Quarter 2020) MEDIA REVENUE PER VISIT7 MEDIA VISITS7 539 Million -9% YoY (Second Quarter 2020) $22.88 -26% YoY -18% YoY (Second Quarter 2020) Q2 2019 Q3 2019 Q4 2019 Q1 2020 Q2 2020 Q2 2019 Q3 2019 Q4 2019 Q1 2020 Q2 2020 Q2 2019 Q3 2019 Q4 2019 Q1 2020 Q2 2020 Q2 2020 Media revenue was $12.3 million, a 26% decrease from the prior year period. This decrease was primarily attributable to a decrease in RPV and visits, partially offset by a 37% increase in revenue for OnlyInYourState. The decrease in RPV was primarily attributable to a pullback in ad spending as a result of the Pandemic. On an as reported basis, RPV, calculated using visits per Google Analytics, decreased by 4%, to $21.08 in Q2, from $21.93 in the same period in 2019. As of April 25, 2020, we are no longer including visits to the sites migrated (or to be migrated) to Hearst in the Hearst Transaction. On a pro forma basis, that gives effect to the Hearst Transaction for all periods, RPV, calculated using visits per Google Analytics, decreased by 18%, to $22.88 in Q2, from $27.94 in the same period in 2019. The decrease in visits was primarily driven by a 68% decrease in visits resulting from the Hearst Transaction, and a decrease in Livestrong.com visits. On an as reported basis, Google Analytics data shows that visits decreased by 23% to 585 million visits in Q2, from 757 million visits in the same period in 2019. On a pro forma basis that gives effect to the Hearst Transaction for all periods, Google Analytics data shows that visits decreased by 9% to 539 million visits in Q2, from 594 million visits in the same period in 2019. 5 6 Non-GAAP financial measures used in this letter are reconciled to their nearest GAAP equivalents at the end of this letter. For the three months ended June 30, 2020, we had $1.5 million in cost savings, which included temporary salary cuts of our executive team and salaried direct workforce (whose salaries were reinstated effective with payroll paid on June 30, 2020) and compensation cuts and deferrals of compensation of our independent directors (whose cash retainer compensation was reinstated, effective July 1, 2020), neither of which is expected to reoccur. Pro forma Visits and Pro forma Revenue per Visit exclude visits generated by certain domains no longer under our control as a result of the Hearst Transaction for all periods reported. The number of visits is derived from Google Analytics. 7 LEAF GROUP | Q2 2020 Shareholder Letter 12 $18.8M $16.6M $16.7M $14.1M $12.3M $35.55 $27.94 $28.32 $26.91 $22.88 594M 590M 539M 530M 525M $0.3M $(1.9)M $51.0M $45.1M $40.0M $35.8M $32.9M $2.1M $(5.4)M $0.8M $(6.8)M $(4.5)M $(5.3)M $(10.7)M |
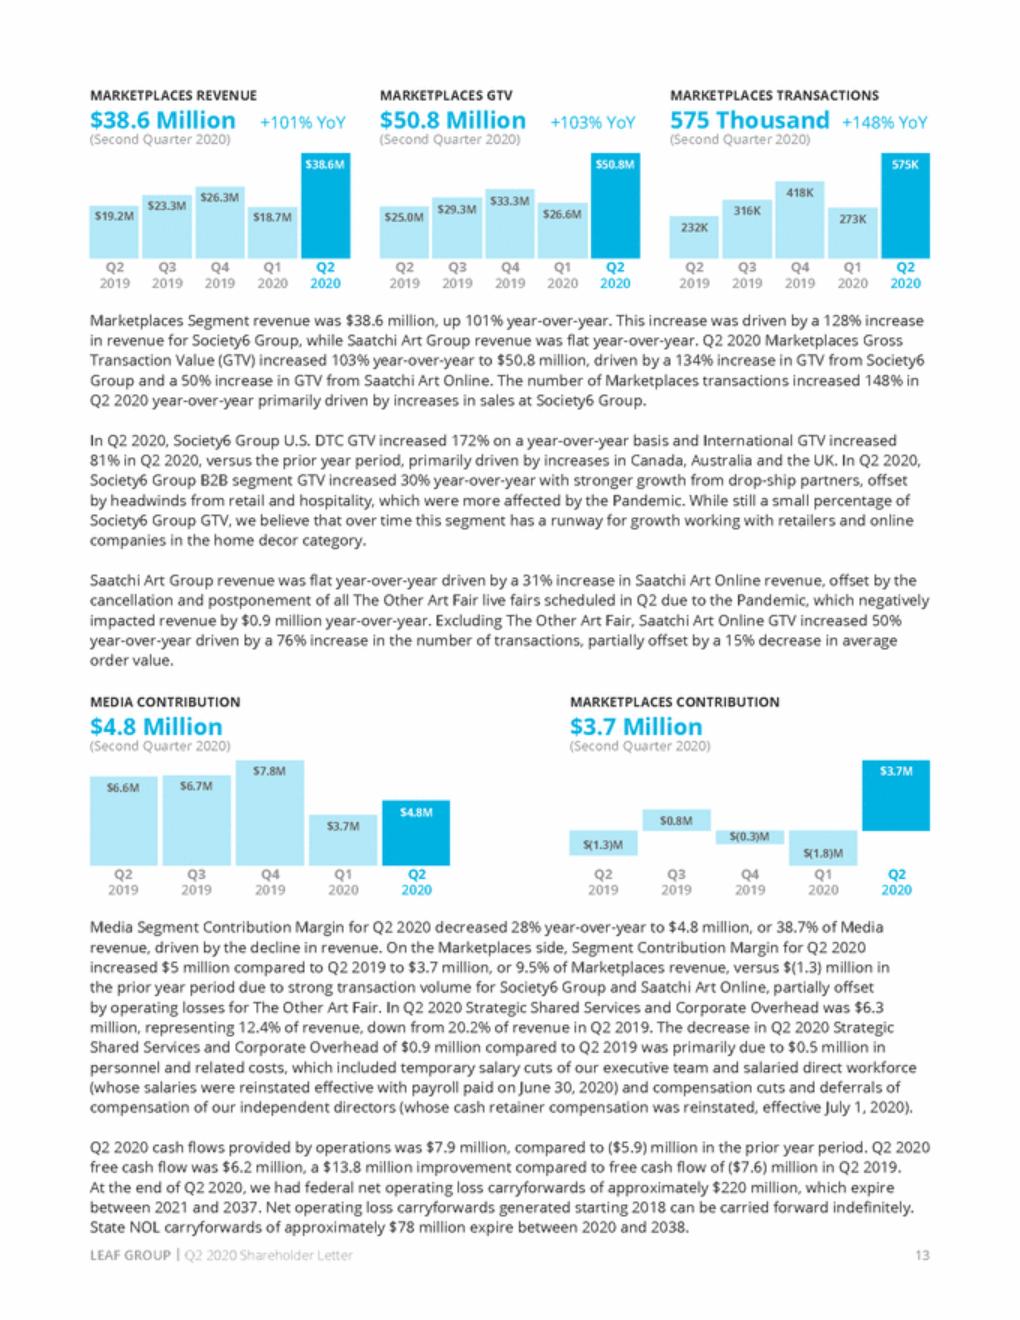
| MARKETPLACES REVENUE $38.6 Million (Second Quarter 2020) MARKETPLACES GTV $50.8 Million (Second Quarter 2020) MARKETPLACES TRANSACTIONS 575 Thousand +148% YoY (Second Quarter 2020) +101% YoY +103% YoY Q2 2019 Q3 2019 Q4 2019 Q1 2020 Q2 2020 Q2 2019 Q3 2019 Q4 2019 Q1 2020 Q2 2020 Q2 2019 Q3 2019 Q4 2019 Q1 2020 Q2 2020 Marketplaces Segment revenue was $38.6 million, up 101% year-over-year. This increase was driven by a 128% increase in revenue for Society6 Group, while Saatchi Art Group revenue was flat year-over-year. Q2 2020 Marketplaces Gross Transaction Value (GTV) increased 103% year-over-year to $50.8 million, driven by a 134% increase in GTV from Society6 Group and a 50% increase in GTV from Saatchi Art Online. The number of Marketplaces transactions increased 148% in Q2 2020 year-over-year primarily driven by increases in sales at Society6 Group. In Q2 2020, Society6 Group U.S. DTC GTV increased 172% on a year-over-year basis and International GTV increased 81% in Q2 2020, versus the prior year period, primarily driven by increases in Canada, Australia and the UK. In Q2 2020, Society6 Group B2B segment GTV increased 30% year-over-year with stronger growth from drop-ship partners, offset by headwinds from retail and hospitality, which were more affected by the Pandemic. While still a small percentage of Society6 Group GTV, we believe that over time this segment has a runway for growth working with retailers and online companies in the home decor category. Saatchi Art Group revenue was flat year-over-year driven by a 31% increase in Saatchi Art Online revenue, offset by the cancellation and postponement of all The Other Art Fair live fairs scheduled in Q2 due to the Pandemic, which negatively impacted revenue by $0.9 million year-over-year. Excluding The Other Art Fair, Saatchi Art Online GTV increased 50% year-over-year driven by a 76% increase in the number of transactions, partially offset by a 15% decrease in average order value. MEDIA CONTRIBUTION $4.8 Million (Second Quarter 2020) MARKETPLACES CONTRIBUTION $3.7 Million (Second Quarter 2020) Q2 2019 Q3 2019 Q4 2019 Q1 2020 Q2 2020 Q2 2019 Q3 2019 Q4 2019 Q1 2020 Q2 2020 Media Segment Contribution Margin for Q2 2020 decreased 28% year-over-year to $4.8 million, or 38.7% of Media revenue, driven by the decline in revenue. On the Marketplaces side, Segment Contribution Margin for Q2 2020 increased $5 million compared to Q2 2019 to $3.7 million, or 9.5% of Marketplaces revenue, versus $(1.3) million in the prior year period due to strong transaction volume for Society6 Group and Saatchi Art Online, partially offset by operating losses for The Other Art Fair. In Q2 2020 Strategic Shared Services and Corporate Overhead was $6.3 million, representing 12.4% of revenue, down from 20.2% of revenue in Q2 2019. The decrease in Q2 2020 Strategic Shared Services and Corporate Overhead of $0.9 million compared to Q2 2019 was primarily due to $0.5 million in personnel and related costs, which included temporary salary cuts of our executive team and salaried direct workforce (whose salaries were reinstated effective with payroll paid on June 30, 2020) and compensation cuts and deferrals of compensation of our independent directors (whose cash retainer compensation was reinstated, effective July 1, 2020). Q2 2020 cash flows provided by operations was $7.9 million, compared to ($5.9) million in the prior year period. Q2 2020 free cash flow was $6.2 million, a $13.8 million improvement compared to free cash flow of ($7.6) million in Q2 2019. At the end of Q2 2020, we had federal net operating loss carryforwards of approximately $220 million, which expire between 2021 and 2037. Net operating loss carryforwards generated starting 2018 can be carried forward indefinitely. State NOL carryforwards of approximately $78 million expire between 2020 and 2038. LEAF GROUP | Q2 2020 Shareholder Letter 13 $(1.8)M $(1.3)M $(0.3)M $3.7M $0.8M $4.8M $6.7M $6.6M $7.8M $3.7M 575K 418K 316K 273K 232K $50.8M $33.3M $29.3M $25.0M $26.6M $38.6M $26.3M $23.3M $19.2M $18.7M |
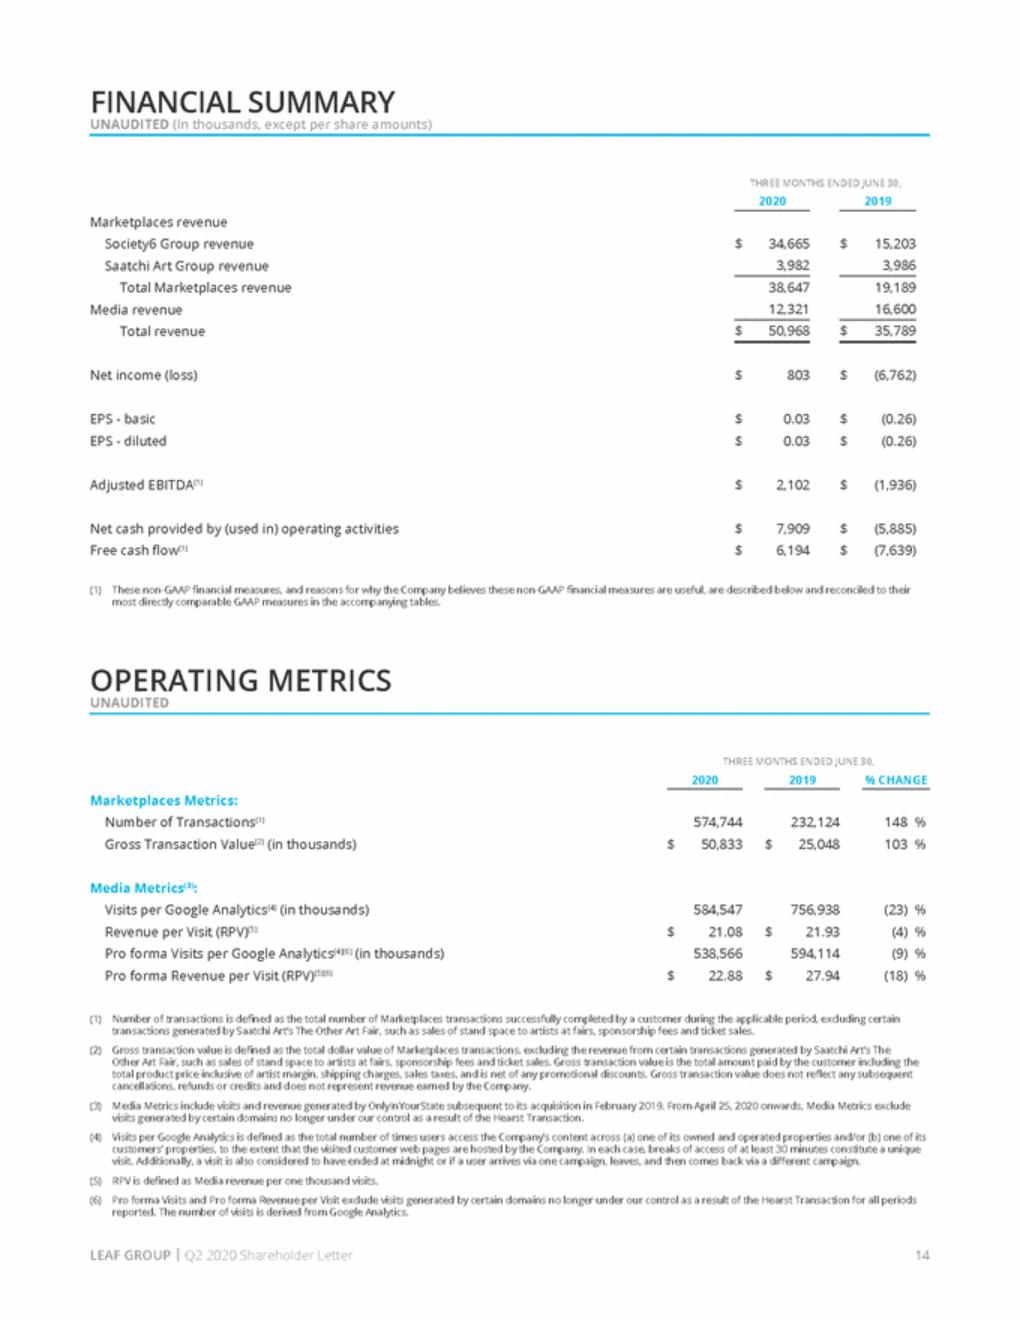
| FINANCIAL SUMMARY UNAUDITED (In thousands, except per share amounts) THREE MONTHS ENDED JUNE 30, 2020 2019 Marketplaces revenue Society6 Group revenue Saatchi Art Group revenue Total Marketplaces revenue Media revenue Total revenue $ 34,665 3,982 $ 15,203 3,986 38,647 12,321 19,189 16,600 $ 50,968 $ 35,789 Net income (loss) $ 803 $ (6,762) EPS - basic EPS - diluted $ $ 0.03 0.03 $ $ (0.26) (0.26) Adjusted EBITDA(1) $ 2,102 $ (1,936) Net cash provided by (used in) operating activities Free cash flow(1) $ $ 7,909 6,194 $ $ (5,885) (7,639) (1) These non-GAAP financial measures, and reasons for why the Company believes these non-GAAP financial measures are useful, are described below and reconciled to their most directly comparable GAAP measures in the accompanying tables. OPERATING METRICS UNAUDITED THREE MONTHS ENDED JUNE 30, 2020 2019 % CHANGE Marketplaces Metrics: Number of Transactions(1) Gross Transaction Value(2) (in thousands) 574,744 50,833 232,124 25,048 148 % 103 % $ $ Media Metrics(3): Visits per Google Analytics(4) (in thousands) Revenue per Visit (RPV)(5) Pro forma Visits per Google Analytics(4)(6) (in thousands) Pro forma Revenue per Visit (RPV)(5)(6) 584,547 21.08 538,566 22.88 756,938 21.93 594,114 27.94 (23) % (4) % (9) % (18) % $ $ $ $ (1) Number of transactions is defined as the total number of Marketplaces transactions successfully completed by a customer during the applicable period, excluding certain transactions generated by Saatchi Art’s The Other Art Fair, such as sales of stand space to artists at fairs, sponsorship fees and ticket sales. Gross transaction value is defined as the total dollar value of Marketplaces transactions, excluding the revenue from certain transactions generated by Saatchi Art’s The Other Art Fair, such as sales of stand space to artists at fairs, sponsorship fees and ticket sales. Gross transaction value is the total amount paid by the customer including the total product price inclusive of artist margin, shipping charges, sales taxes, and is net of any promotional discounts. Gross transaction value does not reflect any subsequent cancellations, refunds or credits and does not represent revenue earned by the Company. Media Metrics include visits and revenue generated by OnlyInYourState subsequent to its acquisition in February 2019. From April 25, 2020 onwards, Media Metrics exclude visits generated by certain domains no longer under our control as a result of the Hearst Transaction. Visits per Google Analytics is defined as the total number of times users access the Company’s content across (a) one of its owned and operated properties and/or (b) one of its customers’ properties, to the extent that the visited customer web pages are hosted by the Company. In each case, breaks of access of at least 30 minutes constitute a unique visit. Additionally, a visit is also considered to have ended at midnight or if a user arrives via one campaign, leaves, and then comes back via a different campaign. RPV is defined as Media revenue per one thousand visits. Pro forma Visits and Pro forma Revenue per Visit exclude visits generated by certain domains no longer under our control as a result of the Hearst Transaction for all periods reported. The number of visits is derived from Google Analytics. (2) (3) (4) (5) (6) LEAF GROUP | Q2 2020 Shareholder Letter 14 |
| USE OF NON-GAAP FINANCIAL MEASURES To supplement its consolidated financial statements, which are prepared and presented in accordance with generally accepted accounting principles in the United States of America (“GAAP”), Leaf Group uses certain non-GAAP financial measures, as described below. These non-GAAP financial measures are presented to enhance the user’s overall understanding of Leaf Group’s financial performance and should not be considered a substitute for, or superior to, the financial information prepared and presented in accordance with GAAP. The non-GAAP financial measures presented in this release, together with the GAAP financial results, are the primary measures used by the Company’s management and board of directors to understand and evaluate the Company’s financial performance and operating trends, including period-to-period comparisons, because they exclude certain expenses and gains that management believes are not indicative of the Company’s core operating results. Management also uses these measures to prepare and update the Company’s short and long term financial and operational plans, to evaluate investment decisions, and in its discussions with investors, commercial bankers, equity research analysts and other users of the Company’s financial statements. Accordingly, the Company believes that these non-GAAP financial measures provide useful information to investors and others in understanding and evaluating the Company’s operating results in the same manner as the Company’s management and in comparing operating results across periods and to those of Leaf Group’s peer companies. The use of non-GAAP financial measures has certain limitations because they do not reflect all items of income and expense, or cash flows, that affect the Company’s financial performance and operations. An additional limitation of non-GAAP financial measures is that they do not have standardized meanings, and therefore other companies, including peer companies, may use the same or similarly named measures but exclude or include different items or use different computations. Management compensates for these limitations by reconciling these non-GAAP financial measures to their most comparable GAAP financial measures in the tables captioned “Reconciliations of Non-GAAP Financial Measures” included at the end of this release. Investors and others are encouraged to review the Company’s financial information in its entirety and not rely on a single financial measure. The Company defines Adjusted earnings before interest, taxes, depreciation and amortization (Adjusted EBITDA) as net income (loss) excluding interest (income) expense, income tax expense (benefit), and certain other non-cash or non-recurring items impacting net income (loss) from time to time, principally comprised of depreciation and amortization, stock-based compensation, contingent payments to certain key employees/equity holders of acquired businesses and other payments attributable to acquisition, disposition or corporate realignment activities. Management believes that the exclusion of certain expenses and gains in calculating Adjusted EBITDA provides a useful measure for period-to-period comparisons of the Company’s underlying core revenue and operating costs that is focused more closely on the current costs necessary to operate the Company’s businesses, and reflects its ongoing business in a manner that allows for meaningful analysis of trends. Management also believes that excluding certain non-cash charges can be useful because the amounts of such expenses is the result of long-term investment decisions made in previous periods rather than day-to-day operating decisions. The Company defines Segment Operating Contribution as earnings before corporate or unallocated expenses and also excludes: (a) depreciation expense; (b) amortization of intangible assets; (c) share-based compensation expense; (d) interest and other income (expense); (e) income taxes; and (f) contingent payments to certain key employees/equity holders of acquired businesses. Management believes that the exclusion of certain expenses and gains in calculating Segment Operating Contribution provides a useful measure for period-to-period comparisons of the segment’s underlying revenue and operating costs that is focused more closely on the current costs necessary to operate the segment, and reflects the segment’s ongoing business in a manner that allows for meaningful analysis of trends. Management also believes that excluding certain non-cash charges can be useful because the amounts of such expenses is the result of long-term investment decisions made in previous periods rather than day-to-day operating decisions. The Company defines Free Cash Flow as net cash provided by (used in) operating activities net of cash flows from contingent payments to certain key employees/equity holders of acquired businesses; other payments attributable to acquisition, disposition or corporate realignment activities; purchases of property and equipment; and purchases of intangible assets. Management believes that Free Cash Flow provides investors with useful information to measure operating liquidity because it reflects the Company’s underlying cash flows from recurring operating activities after investing in capital assets and intangible assets. Free Cash Flow is used by management, and may also be useful for investors, to assess the Company’s ability to generate cash flow for a variety of strategic opportunities, including reinvesting in its businesses, pursuing new business opportunities and potential acquisitions, paying dividends and repurchasing shares. ABOUT LEAF GROUP Leaf Group Ltd. (NYSE: LEAF) is a diversified consumer internet company that builds enduring, creator-driven brands that reach passionate audiences in large and growing lifestyle categories, including fitness and wellness (Well+Good, Livestrong.com and MyPlate App), and home, art and design (Saatchi Art, Society6 and Hunker). For more information about Leaf Group, visit www.leafgroup.com. CAUTIONARY INFORMATION REGARDING FORWARD-LOOKING STATEMENTS This shareholder letter contains “forward-looking statements” within the meaning of the safe harbor provisions of the U.S. Private Securities Litigation Reform Act of 1995. The forward-looking statements set forth in this shareholder letter include, among other things, statements regarding potential synergies achieved from acquisitions, the impact of strategic operational changes and the Company’s future financial performance. In addition, statements containing words such as “guidance,” “may,” “believe,” “anticipate,” “expect,” “intend,” “plan,” “project,” “projections,” “business outlook,” and “estimate” or similar expressions constitute forward-looking statements. Actual results may differ materially from the results predicted, and reported results should not be considered an indication of future performance. These forward-looking statements involve risks and uncertainties regarding the Company’s future financial performance; could cause actual results or developments to differ materially from those indicated due to a number of factors affecting Leaf Group’s operations, markets, products and services; and are based on current expectations, estimates and projections about the Company’s industry, financial condition, operating performance and results of operations, including certain assumptions related thereto. Potential risks and uncertainties that could affect the Company’s operating and financial results are described in Leaf Group’s annual report on Form 10-K for the fiscal year ending December 31, 2019 filed with the Securities and Exchange Commission (http:// www.sec.gov) on March 16, 2020, as such risks and uncertainties may be updated from time to time in Leaf Group’s quarterly reports on Form 10-Q filed with the Securities and Exchange Commission, including, without limitation, information under the captions “Risk Factors” and “Management’s Discussion and Analysis of Financial Condition and Results of Operations.” These risks and uncertainties include, among others: risks associated with political and economic instability domestically and internationally including those resulting from the COVID-19 pandemic, which have and could lead to fluctuations in the availability of credit, decreased business and consumer confidence and increased unemployment; the Company’s ability to execute its business plan to return to compliance with the continued listing criteria of the New York Stock Exchange (“NYSE”); the Company’s ability to continue to comply with applicable listing standards within the available cure period; changes by the Small Business Administration or other governmental authorities regarding the Coronavirus Aid, Relief and Economic Security Act of 2020 (the “CARES Act”), the Paycheck Protection Program (“PPP”) or related administrative matters; the Company’s ability to comply with the terms of the PPP loan and the CARES Act, including to use the proceeds of the PPP loan; the Company’s ability to successfully drive and increase traffic to its marketplaces and media properties; changes in the methodologies of internet search engines, including ongoing algorithmic changes made by Google, Bing and Yahoo!; the Company’s ability to attract new and repeat customers and artists to its marketplaces and successfully grow its marketplace businesses; the potential impact on advertising-based revenue from lower ad unit rates, a reduction in online advertising spending, a loss of advertisers, lower advertising yields, increased availability of ad blocking software, particularly on mobile devices and/or ongoing changes in ad unit formats; the Company’s dependence on various agreements with a specific business partner for a significant portion of its advertising revenue; the effects of shifting consumption of media content and online shopping from desktop to mobile devices and/or social media platforms; the Company’s history of incurring net operating losses; the Company’s ability to obtain capital when desired on favorable terms; potential write downs, reserves against or impairment of assets including receivables, goodwill, intangibles (including media content) or other assets; the Company’s ability to effectively integrate, manage, operate and grow acquired businesses; the Company’s ability to retain key personnel; the Company’s ability to prevent any actual or perceived security breaches; the Company’s ability to expand its business internationally; the Company’s ability to generate long-term value for its stockholders; and ongoing actions taken and any future actions that may be taken by activist stockholders. From time to time, the Company may consider acquisitions or divestitures that, if consummated, could be material. Any forward-looking statements regarding financial metrics are based upon the assumption that no such acquisition or divestiture is consummated during the relevant periods. If an acquisition or divestiture were consummated, actual results could differ materially from any forward-looking statements. Any forward-looking statement made by the Company in this shareholder letter is based only on information currently available to the Company and speaks only as of the date on which it is made. The Company undertakes no obligation to revise or update any forward-looking information, whether written or oral, that may be made from time to time, whether as a result of new information, future developments or otherwise, except as required by law, and may not provide this type of information in the future. LEAF GROUP | Q2 2020 Shareholder Letter 15 |
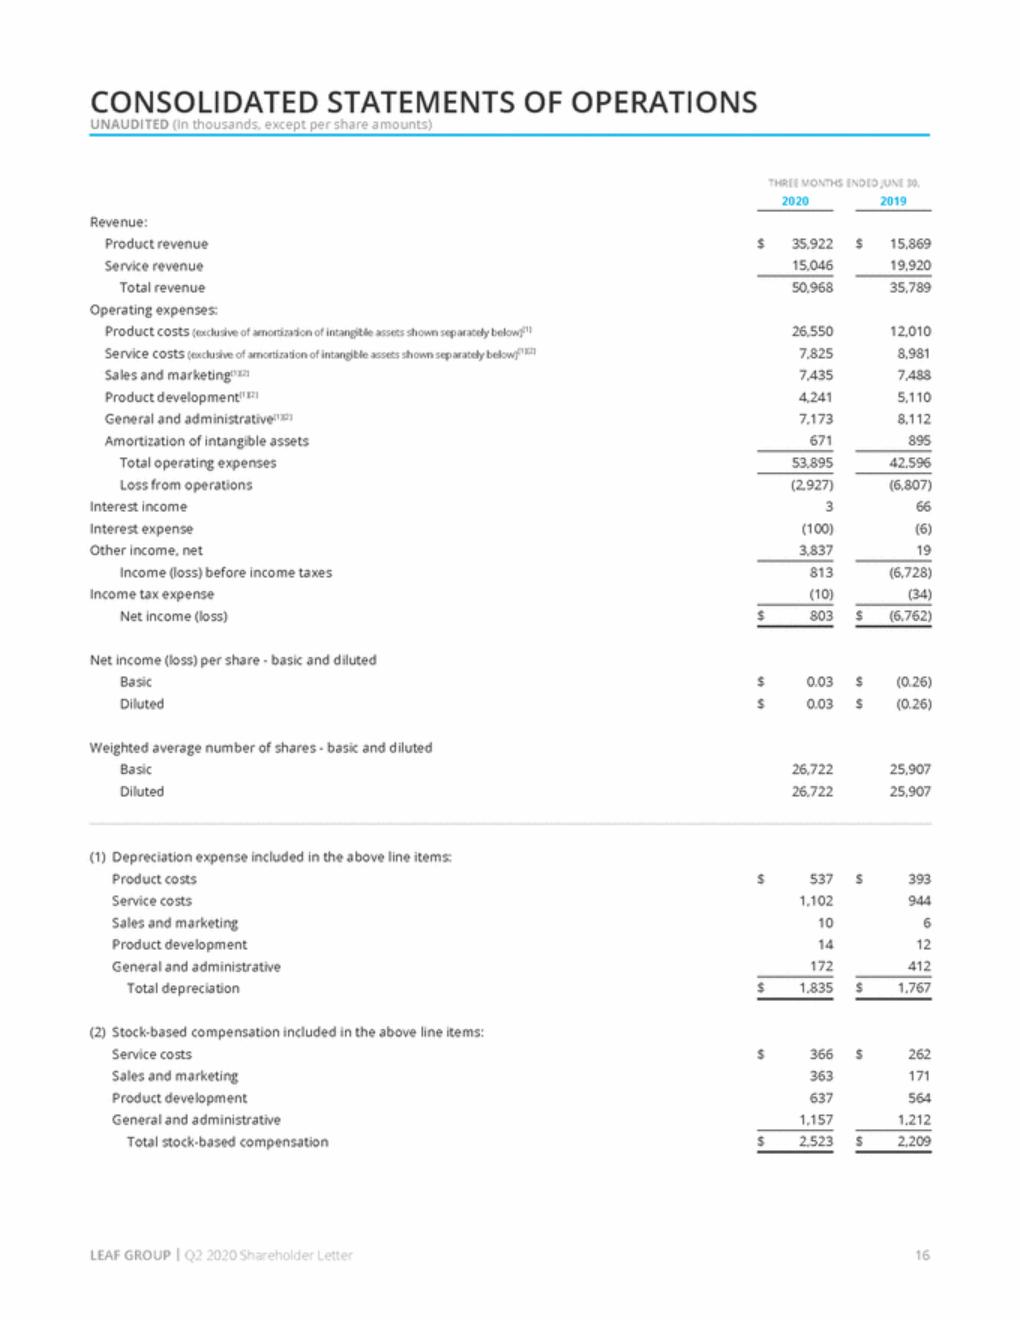
| CONSOLIDATED STATEMENTS OF OPERATIONS UNAUDITED (In thousands, except per share amounts) THREE MONTHS ENDED JUNE 30, 2020 2019 Revenue: Product revenue Service revenue Total revenue Operating expenses: Product costs (exclusive of amortization of intangible assets shown separately below)(1) Service costs (exclusive of amortization of intangible assets shown separately below)(1)(2) Sales and marketing(1)(2) Product development(1)(2) General and administrative(1)(2) Amortization of intangible assets Total operating expenses Loss from operations Interest income Interest expense Other income, net Income (loss) before income taxes Income tax expense Net income (loss) $ 35,922 15,046 $ 15,869 19,920 50,968 35,789 26,550 7,825 7,435 4,241 7,173 671 12,010 8,981 7,488 5,110 8,112 895 53,895 42,596 (2,927) 3 (100) 3,837 (6,807) 66 (6) 19 813 (10) (6,728) (34) $ 803 $ (6,762) Net income (loss) per share - basic and diluted Basic Diluted $ $ 0.03 0.03 $ $ (0.26) (0.26) Weighted average number of shares - basic and diluted Basic Diluted 26,722 26,722 25,907 25,907 (1) Depreciation expense included in the above line items: Product costs Service costs Sales and marketing Product development General and administrative Total depreciation $ 537 1,102 10 14 172 $ 393 944 6 12 412 $ 1,835 $ 1,767 (2) Stock-based compensation included in the above line items: Service costs Sales and marketing Product development General and administrative Total stock-based compensation $ 366 363 637 1,157 $ 262 171 564 1,212 $ 2,523 $ 2,209 LEAF GROUP | Q2 2020 Shareholder Letter 16 |
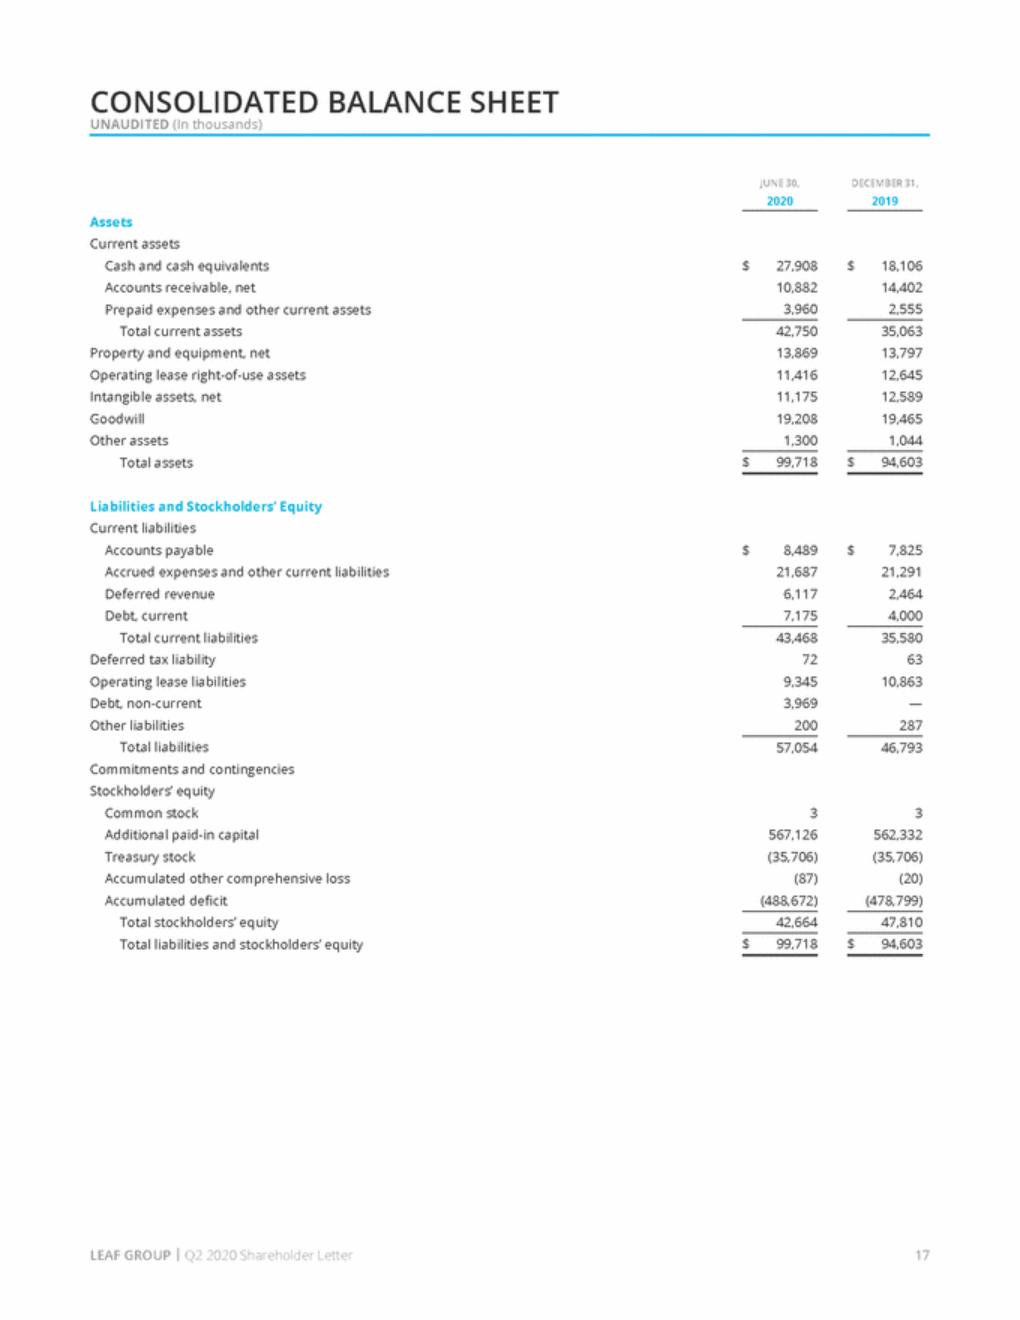
| CONSOLIDATED BALANCE SHEET UNAUDITED (In thousands) JUNE 30, 2020 DECEMBER 31, 2019 Assets Current assets Cash and cash equivalents Accounts receivable, net Prepaid expenses and other current assets Total current assets Property and equipment, net Operating lease right-of-use assets Intangible assets, net Goodwill Other assets Total assets $ 27,908 10,882 3,960 $ 18,106 14,402 2,555 42,750 13,869 11,416 11,175 19,208 1,300 35,063 13,797 12,645 12,589 19,465 1,044 $ 99,718 $ 94,603 Liabilities and Stockholders’ Equity Current liabilities Accounts payable Accrued expenses and other current liabilities Deferred revenue Debt, current Total current liabilities Deferred tax liability Operating lease liabilities Debt, non-current Other liabilities Total liabilities Commitments and contingencies Stockholders’ equity Common stock Additional paid-in capital Treasury stock Accumulated other comprehensive loss Accumulated deficit Total stockholders’ equity Total liabilities and stockholders’ equity $ 8,489 21,687 6,117 7,175 $ 7,825 21,291 2,464 4,000 43,468 72 9,345 3,969 200 35,580 63 10,863 — 287 57,054 46,793 3 567,126 (35,706) (87) (488,672) 3 562,332 (35,706) (20) (478,799) 42,664 47,810 $ 99,718 $ 94,603 LEAF GROUP | Q2 2020 Shareholder Letter 17 |
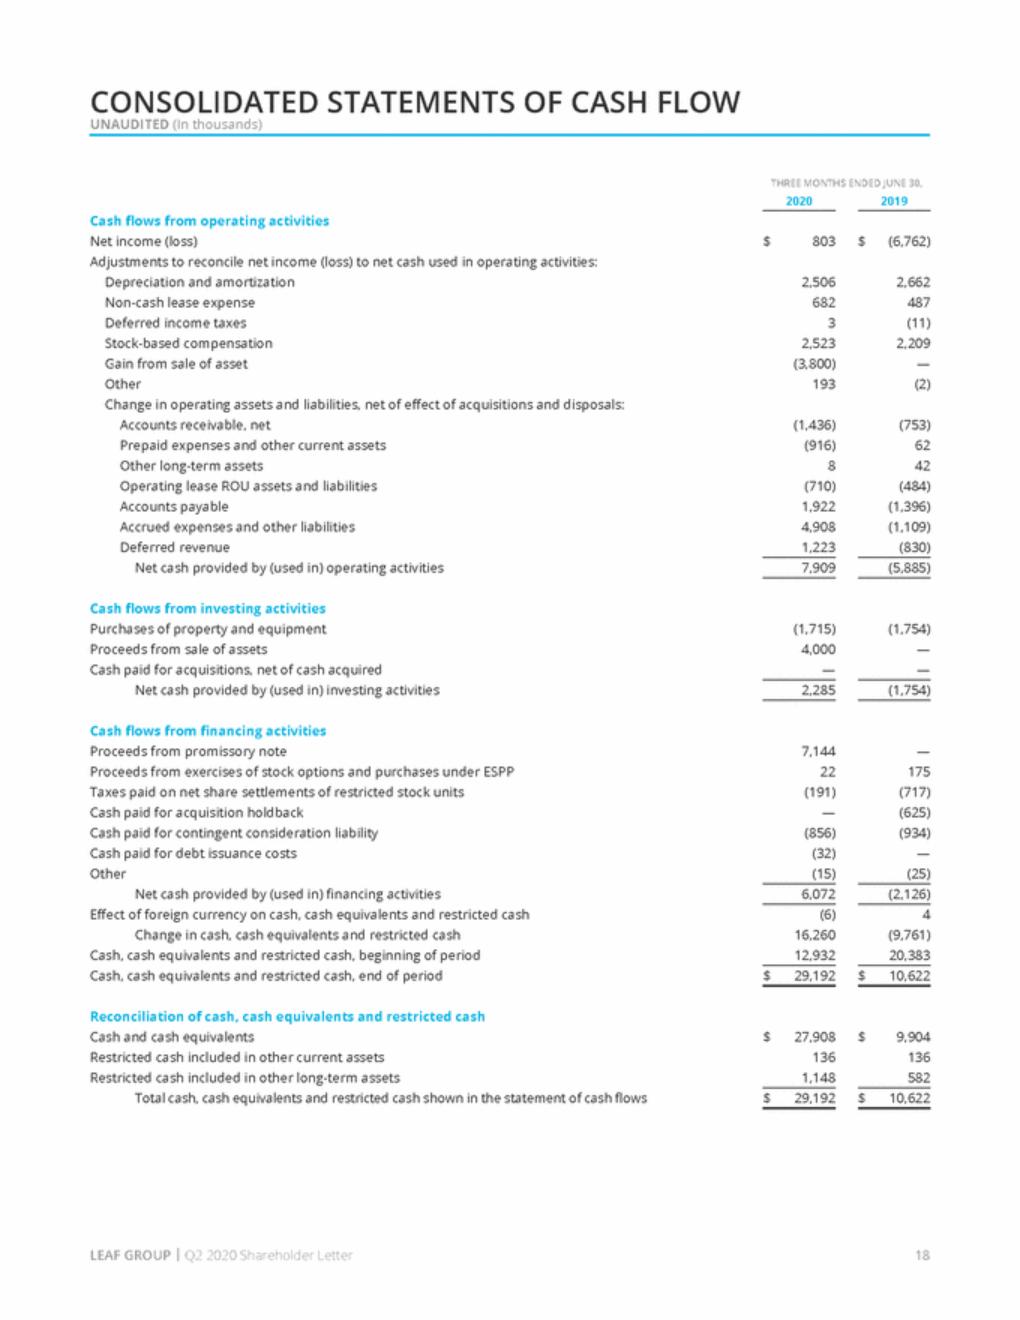
| CONSOLIDATED STATEMENTS OF CASH FLOW UNAUDITED (In thousands) THREE MONTHS ENDED JUNE 30, 2020 2019 Cash flows from operating activities Net income (loss) Adjustments to reconcile net income (loss) to net cash used in operating activities: Depreciation and amortization Non-cash lease expense Deferred income taxes Stock-based compensation Gain from sale of asset Other Change in operating assets and liabilities, net of effect of acquisitions and disposals: Accounts receivable, net Prepaid expenses and other current assets Other long-term assets Operating lease ROU assets and liabilities Accounts payable Accrued expenses and other liabilities Deferred revenue Net cash provided by (used in) operating activities $ 803 $ (6,762) 2,506 682 3 2,523 (3,800) 193 2,662 487 (11) 2,209 — (2) (1,436) (916) 8 (710) 1,922 4,908 1,223 (753) 62 42 (484) (1,396) (1,109) (830) 7,909 (5,885) Cash flows from investing activities Purchases of property and equipment Proceeds from sale of assets Cash paid for acquisitions, net of cash acquired Net cash provided by (used in) investing activities (1,715) 4,000 — (1,754) — — 2,285 (1,754) Cash flows from financing activities Proceeds from promissory note Proceeds from exercises of stock options and purchases under ESPP Taxes paid on net share settlements of restricted stock units Cash paid for acquisition holdback Cash paid for contingent consideration liability Cash paid for debt issuance costs Other Net cash provided by (used in) financing activities Effect of foreign currency on cash, cash equivalents and restricted cash Change in cash, cash equivalents and restricted cash Cash, cash equivalents and restricted cash, beginning of period Cash, cash equivalents and restricted cash, end of period 7,144 22 (191) — (856) (32) (15) — 175 (717) (625) (934) — (25) 6,072 (2,126) (6) 16,260 12,932 4 (9,761) 20,383 $ 29,192 $ 10,622 Reconciliation of cash, cash equivalents and restricted cash Cash and cash equivalents Restricted cash included in other current assets Restricted cash included in other long-term assets Total cash, cash equivalents and restricted cash shown in the statement of cash flows $ 27,908 136 1,148 $ 9,904 136 582 $ 29,192 $ 10,622 LEAF GROUP | Q2 2020 Shareholder Letter 18 |
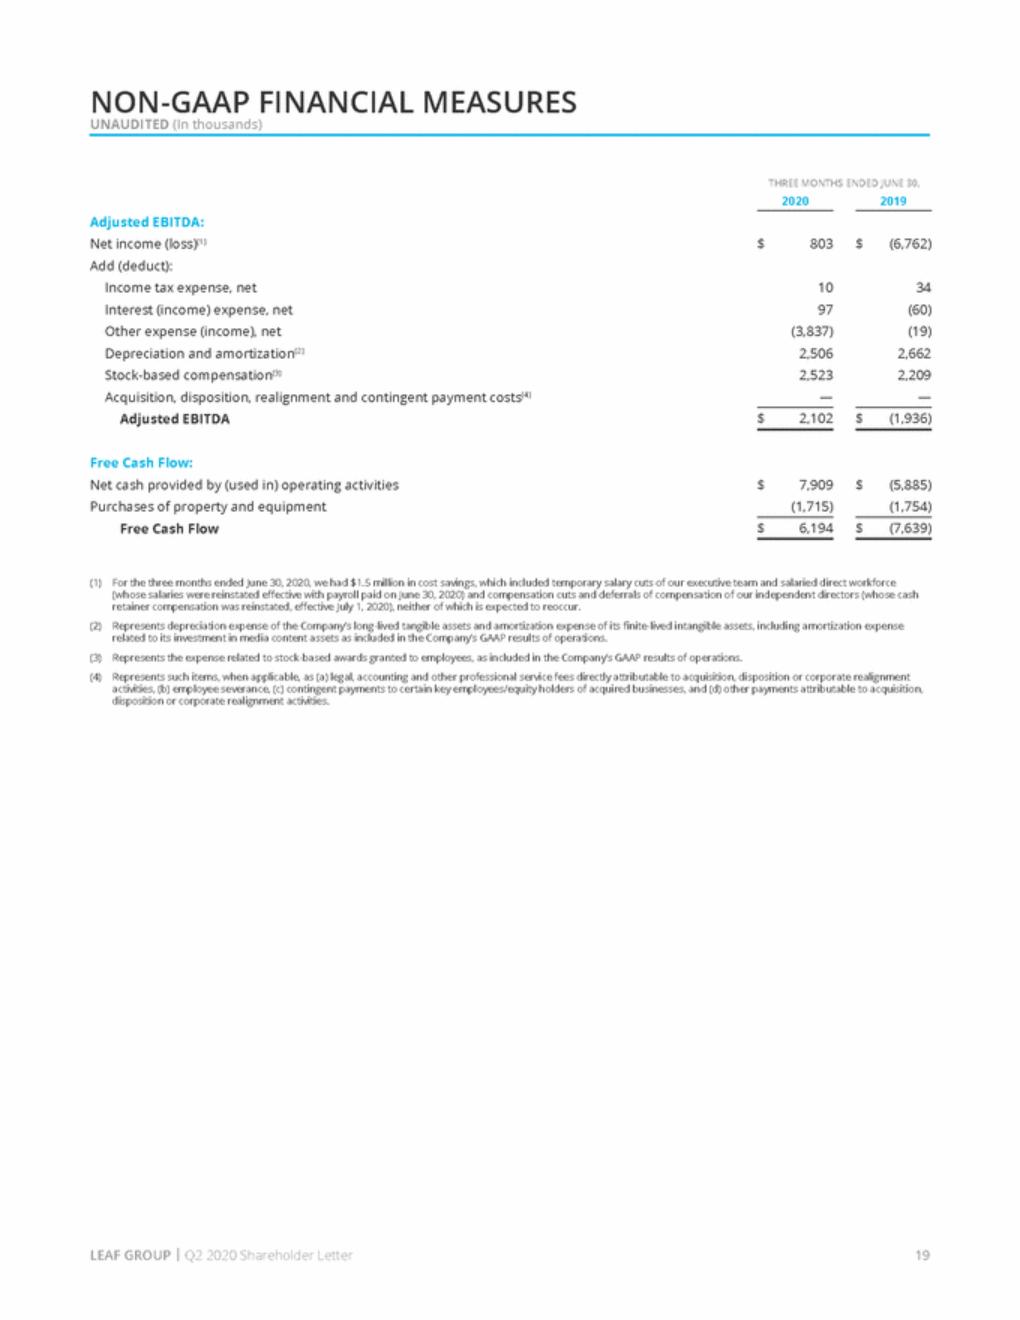
| NON-GAAP FINANCIAL MEASURES UNAUDITED (In thousands) THREE MONTHS ENDED JUNE 30, 2020 2019 Adjusted EBITDA: Net income (loss)(1) Add (deduct): Income tax expense, net Interest (income) expense, net Other expense (income), net Depreciation and amortization(2) Stock-based compensation(3) Acquisition, disposition, realignment and contingent payment costs(4) Adjusted EBITDA $ 803 $ (6,762) 10 97 (3,837) 2,506 2,523 — 34 (60) (19) 2,662 2,209 — $ 2,102 $ (1,936) Free Cash Flow: Net cash provided by (used in) operating activities Purchases of property and equipment Free Cash Flow $ 7,909 (1,715) $ (5,885) (1,754) $ 6,194 $ (7,639) (1) For the three months ended June 30, 2020, we had $1.5 million in cost savings, which included temporary salary cuts of our executive team and salaried direct workforce (whose salaries were reinstated effective with payroll paid on June 30, 2020) and compensation cuts and deferrals of compensation of our independent directors (whose cash retainer compensation was reinstated, effective July 1, 2020), neither of which is expected to reoccur. Represents depreciation expense of the Company’s long-lived tangible assets and amortization expense of its finite-lived intangible assets, including amortization expense related to its investment in media content assets as included in the Company’s GAAP results of operations. Represents the expense related to stock-based awards granted to employees, as included in the Company’s GAAP results of operations. Represents such items, when applicable, as (a) legal, accounting and other professional service fees directly attributable to acquisition, disposition or corporate realignment activities, (b) employee severance, (c) contingent payments to certain key employees/equity holders of acquired businesses, and (d) other payments attributable to acquisition, disposition or corporate realignment activities. (2) (3) (4) LEAF GROUP | Q2 2020 Shareholder Letter 19 |
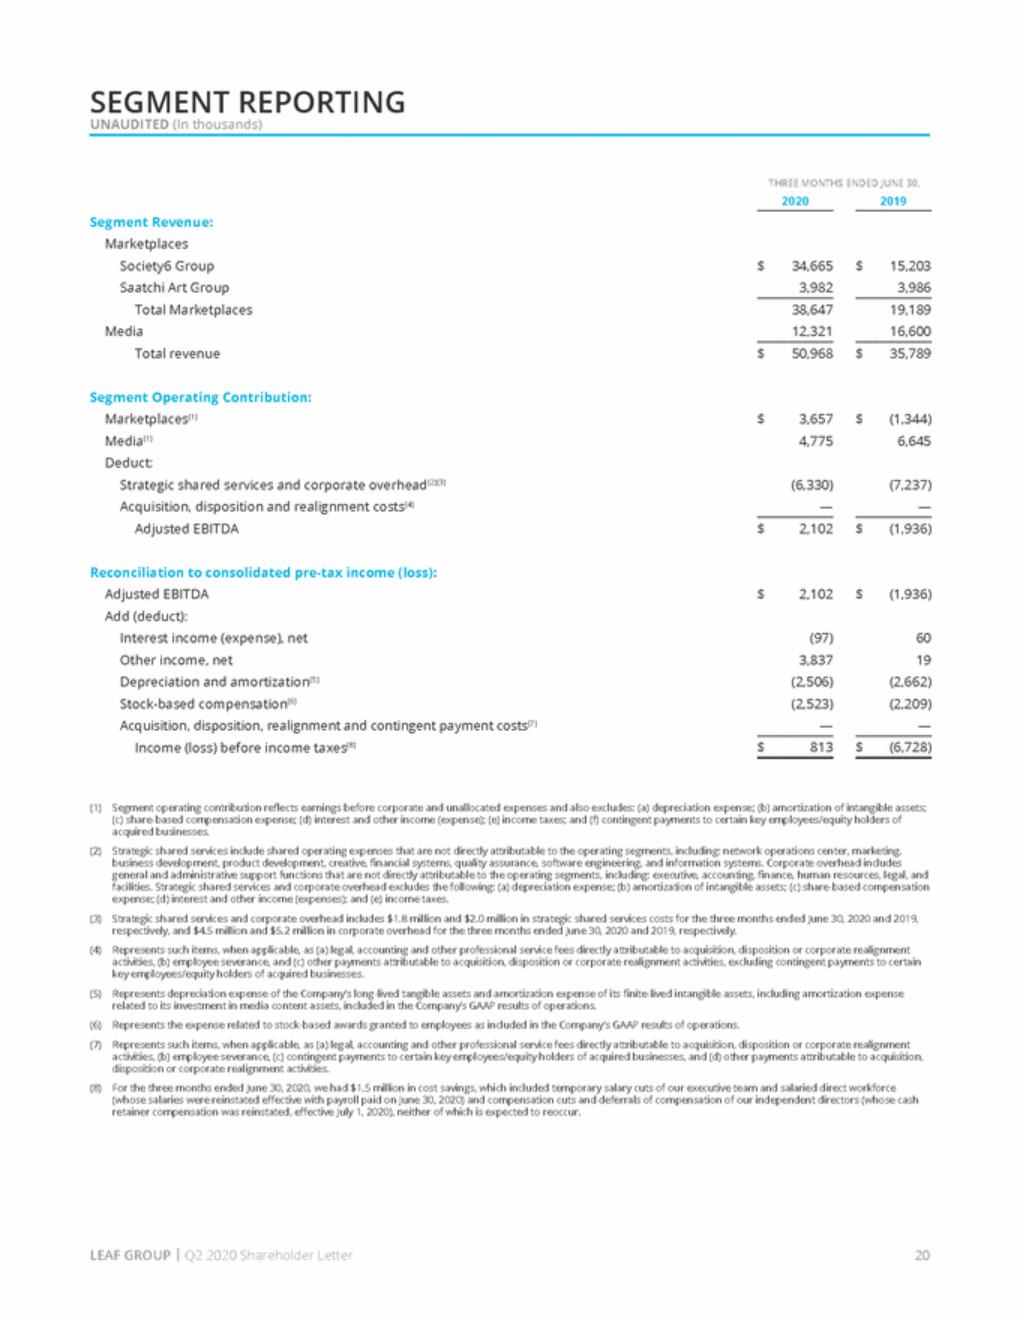
| SEGMENT REPORTING UNAUDITED (In thousands) THREE MONTHS ENDED JUNE 30, 2020 2019 Segment Revenue: Marketplaces Society6 Group Saatchi Art Group Total Marketplaces Media Total revenue $ 34,665 3,982 $ 15,203 3,986 38,647 12,321 19,189 16,600 $ 50,968 $ 35,789 Segment Operating Contribution: Marketplaces(1) Media(1) Deduct: Strategic shared services and corporate overhead(2)(3) Acquisition, disposition and realignment costs(4) Adjusted EBITDA $ 3,657 4,775 $ (1,344) 6,645 (6,330) — (7,237) — $ 2,102 $ (1,936) Reconciliation to consolidated pre-tax income (loss): Adjusted EBITDA Add (deduct): Interest income (expense), net Other income, net Depreciation and amortization(5) Stock-based compensation(6) Acquisition, disposition, realignment and contingent payment costs(7) Income (loss) before income taxes(8) $ 2,102 $ (1,936) (97) 3,837 (2,506) (2,523) — 60 19 (2,662) (2,209) — $ 813 $ (6,728) (1) Segment operating contribution reflects earnings before corporate and unallocated expenses and also excludes: (a) depreciation expense; (b) amortization of intangible assets; (c) share-based compensation expense; (d) interest and other income (expense); (e) income taxes; and (f) contingent payments to certain key employees/equity holders of acquired businesses. Strategic shared services include shared operating expenses that are not directly attributable to the operating segments, including: network operations center, marketing, business development, product development, creative, financial systems, quality assurance, software engineering, and information systems. Corporate overhead includes general and administrative support functions that are not directly attributable to the operating segments, including: executive, accounting, finance, human resources, legal, and facilities. Strategic shared services and corporate overhead excludes the following: (a) depreciation expense; (b) amortization of intangible assets; (c) share-based compensation expense; (d) interest and other income (expenses); and (e) income taxes. Strategic shared services and corporate overhead includes $1.8 million and $2.0 million in strategic shared services costs for the three months ended June 30, 2020 and 2019, respectively, and $4.5 million and $5.2 million in corporate overhead for the three months ended June 30, 2020 and 2019, respectively. Represents such items, when applicable, as (a) legal, accounting and other professional service fees directly attributable to acquisition, disposition or corporate realignment activities, (b) employee severance, and (c) other payments attributable to acquisition, disposition or corporate realignment activities, excluding contingent payments to certain key employees/equity holders of acquired businesses. Represents depreciation expense of the Company’s long-lived tangible assets and amortization expense of its finite-lived intangible assets, including amortization expense related to its investment in media content assets, included in the Company’s GAAP results of operations. Represents the expense related to stock-based awards granted to employees as included in the Company’s GAAP results of operations. Represents such items, when applicable, as (a) legal, accounting and other professional service fees directly attributable to acquisition, disposition or corporate realignment activities, (b) employee severance, (c) contingent payments to certain key employees/equity holders of acquired businesses, and (d) other payments attributable to acquisition, disposition or corporate realignment activities. For the three months ended June 30, 2020, we had $1.5 million in cost savings, which included temporary salary cuts of our executive team and salaried direct workforce (whose salaries were reinstated effective with payroll paid on June 30, 2020) and compensation cuts and deferrals of compensation of our independent directors (whose cash retainer compensation was reinstated, effective July 1, 2020), neither of which is expected to reoccur. (2) (3) (4) (5) (6) (7) (8) LEAF GROUP | Q2 2020 Shareholder Letter 20 |