Attached files
| file | filename |
|---|---|
| EX-31.2 - EX-31.2 - LEAF GROUP LTD. | dmd-20151231ex3120068f2.htm |
| EX-23.1 - EX-23.1 - LEAF GROUP LTD. | dmd-20151231ex23124aa04.htm |
| EX-32.1 - EX-32.1 - LEAF GROUP LTD. | dmd-20151231ex32197aa59.htm |
| EX-21.1 - EX-21.1 - LEAF GROUP LTD. | dmd-20151231ex211f9df7f.htm |
| EX-31.1 - EX-31.1 - LEAF GROUP LTD. | dmd-20151231ex311abb1dd.htm |
| EX-32.2 - EX-32.2 - LEAF GROUP LTD. | dmd-20151231ex322cfb07b.htm |
UNITED STATES
SECURITIES AND EXCHANGE COMMISSION
WASHINGTON, D.C. 20549
FORM 10-K
(Mark One)
☒ANNUAL REPORT PURSUANT TO SECTION 13 OR 15(d) OF THE SECURITIES EXCHANGE ACT OF 1934
For the fiscal year ended December 31, 2015
OR
☐TRANSITION REPORT PURSUANT TO SECTION 13 OR 15(d) OF THE SECURITIES EXCHANGE ACT OF 1934
For the transition period from to
Commission file number 001-35048
DEMAND MEDIA, INC.
(Exact name of registrant as specified in its charter)
|
Delaware |
|
20-4731239 |
|
(State or other jurisdiction of |
|
(I.R.S. Employer |
|
|
|
|
|
1655 26th Street Santa Monica, CA |
|
90404 |
|
(Address of principal executive offices) |
|
(Zip Code) |
(310) 656-6253
(Registrant’s telephone number, including area code)
Securities registered pursuant to Section 12(b) of the Act:
|
Title of each class |
|
Name of each exchange on which registered |
|
Common Stock, $0.0001 par value |
|
The New York Stock Exchange |
Securities registered pursuant to Section 12(g) of the Act:
None.
Indicate by check mark if the registrant is a well-known seasoned issuer, as defined in Rule 405 of the Securities Act. Yes ☐ No ☒
Indicate by check mark if the registrant is not required to file reports pursuant to Section 13 or Section 15(d) of the Exchange Act. Yes ☐ No ☒
Indicate by check mark whether the registrant (1) has filed all reports required to be filed by Section 13 or 15(d) of the Securities Exchange Act of 1934 during the preceding 12 months (or for such shorter period that the registrant was required to file such reports), and (2) has been subject to such filing requirements for the past 90 days. Yes ☒ No ☐
Indicate by check mark whether the registrant has submitted electronically and posted on its corporate Web site, if any, every Interactive Data File required to be submitted and posted pursuant to Rule 405 of Regulation S-T (§232.405 of this chapter) during the preceding 12 months (or for such shorter period that the registrant was required to submit and post such files). Yes ☒ No ☐
Indicate by check mark if disclosure of delinquent filers pursuant to Item 405 of Regulation S-K (§229.405 of this chapter) is not contained herein, and will not be contained, to the best of registrant’s knowledge, in definitive proxy or information statements incorporated by reference in Part III of this Form 10-K or any amendment to this Form 10-K. ☒
Indicate by check mark whether the registrant is a large accelerated filer, an accelerated filer, a non-accelerated filer, or a smaller reporting company. See the definitions of “large accelerated filer,” “accelerated filer” and “smaller reporting company” in Rule 12b-2 of the Exchange Act.:
|
Large accelerated filer ☐ |
|
Accelerated filer ☒ |
|
Non-accelerated filer ☐ (Do not check if a smaller reporting company) |
|
Smaller reporting company ☐ |
Indicate by check mark whether the registrant is a shell company (as defined in Rule 12b-2 of the Exchange Act). Yes ☐ No ☒
As of June 30, 2015, the aggregate market value of the registrant’s common stock, $0.0001 par value, held by non-affiliates of the registrant was approximately $74.3 million (based upon the closing sale price of the common stock on that date on the New York Stock Exchange).
As of February 24, 2016, there were 20,250,726 shares of the common stock, $0.0001 par value, outstanding.
Documents Incorporated by Reference
Part III of this Annual Report on Form 10-K incorporates by reference portions of the registrant’s Proxy Statement for its 2016 Annual Meeting of Stockholders, which will be filed with the Securities and Exchange Commission within 120 days after the end of the fiscal year to which this report relates.
DEMAND MEDIA, INC.
2
SPECIAL NOTE REGARDING FORWARD LOOKING STATEMENTS
This Annual Report on Form 10-K contains forward-looking statements within the meaning of the Private Securities Litigation Reform Act of 1995. All statements other than statements of historical facts contained in this Annual Report on Form 10-K, including statements regarding our future results of operations and financial position, business strategy and plans and our objectives for future operations, are forward-looking statements. The words “believe,” “may,” “will,” “estimate,” “continue,” “anticipate,” “intend,” “expect,” “predict,” “plan” and similar expressions are intended to identify forward-looking statements. You should not rely upon forward-looking statements as guarantees of future performance. We have based these forward-looking statements largely on our estimates of our financial results and our current expectations and projections about future events and financial trends that we believe may affect our financial condition, results of operations, business strategy, short-term and long-term business operations and objectives, and financial needs. These forward-looking statements are subject to a number of risks, uncertainties and assumptions, including those described in Item 1A. under the heading entitled “Risk Factors.” Moreover, we operate in a very competitive and rapidly changing environment. New risks emerge from time to time. It is not possible for our management to predict all risks, nor can we assess the impact of all factors on our business or the extent to which any factor, or combination of factors, may cause actual results to differ materially from those contained in any forward-looking statements we may make. In light of these risks, uncertainties and assumptions, the forward-looking events and circumstances discussed in this Annual Report on Form 10-K may not occur and actual results could differ materially and adversely from those anticipated or implied in the forward-looking statements. We undertake no obligation to revise or update any forward-looking statements for any reason after the date of this Annual Report on Form 10-K, except as required by law.
You should read this Annual Report on Form 10-K and the documents that we reference in this Annual Report on Form 10-K and have filed with the Securities and Exchange Commission (the “SEC”) with the understanding that our actual future results, levels of activity, performance and events and circumstances may be materially different from what we expect.
3
Item 1. Business
As used herein, “Demand Media,” the “Company,” “our,” “we,” “us” and similar terms include Demand Media, Inc. and its subsidiaries, unless the context indicates otherwise.
“Demand Media” and other trademarks of ours appearing in this report are our property. This report contains additional trade names and trademarks of other companies. We do not intend our use or display of other companies’ trade names or trademarks to imply an endorsement or sponsorship of us or our business by such companies, or any relationship with any of these companies.
Overview
Demand Media is a diversified Internet company that builds platforms across its media and marketplaces properties to enable communities of creators to reach passionate audiences in large and growing lifestyle categories. In addition, our branded content creation and diverse advertising offerings help advertisers find innovative ways to engage with their customers.
Our business is comprised of two service offerings: Content & Media and Marketplaces.
|
· |
Content & Media: Our Content & Media service offering includes our leading owned and operated online properties that publish media content, including text articles, videos, photographs and designed visual formats. This content is published across several key categories on eHow.com (“eHow”), a do-it-yourself and how-to reference destination; Livestrong.com, a health and healthy living destination; Cracked.com (“Cracked”), a humor site offering original and engaging comedy-driven video series, text articles and blogs; and certain niche properties focused on specific interests. Additionally, our studioD business develops and executes content marketing strategies and creates custom content for third-party brands, advertisers and publishers. |
|
· |
Marketplaces: Through our Marketplaces service offering, we operate two leading art and design marketplaces where large communities of artists can market and sell their original artwork or original designs printed on a wide variety of products. Society6.com (“Society6”) provides artists with an online commerce platform to feature and sell their original designs on art prints, phone and tablet cases, t-shirts, throw pillows and other consumer and home décor products. SaatchiArt.com (“Saatchi Art”) is an online art gallery featuring a wide selection of original paintings, drawings, sculptures and photography that provides a global community of artists a curated environment in which to exhibit and sell their work directly to consumers around the world. |
Our Content & Media service offering derives the majority of its revenue from the sale of advertising on our online properties. We also generate revenue from the sale or license of content and the sale of content marketing services. Our Marketplaces service offering generates revenue from the sale of products and services through our art and design marketplaces. Information about our revenue by service offering is set forth in Note 16 of our Notes to Consolidated Financial Statements included in Part III, Item 15, “Exhibits, Financial Statement Schedules” of this Annual Report on Form 10-K.
On August 1, 2014, we completed the separation of Rightside Group, Ltd. (“Rightside”) from Demand Media, resulting in two independent, publicly traded companies (hereinafter referred to as the “Separation”). Following the Separation, Rightside operates our former domain name services business, while we continue to own and operate our Content & Media and Marketplaces businesses. The Separation was structured as a pro rata tax-free dividend involving the distribution of all outstanding shares of Rightside common stock to holders of Demand Media common stock as of the August 1, 2014 record date (the “Distribution”). Immediately following the Distribution, we completed a 1-for-5 reverse stock split of our outstanding and treasury shares of common stock. The financial results of Rightside are presented as discontinued operations in our consolidated statements of operations for all periods prior to fiscal 2015 presented in this Annual Report on Form 10-K.
4
Demand Media was incorporated in Delaware in March 2006. Our headquarters are located in Santa Monica, California. We completed our initial public offering in January 2011 and our common stock is listed on the New York Stock Exchange (“NYSE”) under the symbol “DMD.”
Content & Media
We create media content, including text articles, videos, photographs and designed visual formats, and publish such content to our online properties. We also leverage our content creation platform to provide custom content and other content marketing solutions to brands, advertisers and publishers.
Content Creation and Distribution. We create high-quality, informative and engaging digital content in a wide variety of formats including text articles and blogs, videos, original photography, slideshows, infographics and animated GIFs. We strive to create valuable long-lived content with positive revenue and traffic growth characteristics. Our content creation process employs algorithms and processes, as well as an editorial staff that identifies and curates the topics that are most appropriate for our distribution channels. Most of the content published on eHow and Livestrong.com was previously produced by a large community of freelance professionals, but we have recently shifted our content creation process to focus on building relationships with a smaller number of freelance content creators and influencers who have subject matter expertise and bring increased authority and credibility to their content. The content on Cracked is created through a collaborative process among our in-house editorial staff, comedians and a community of website enthusiasts.
We publish a majority of our content on our owned and operated online properties. Users visit our online properties through search engine referrals, direct navigation, social media referrals, e-mail and online marketing activities. Our properties are designed to be easily discoverable by users due to the combination of relevant content, search engine optimization and the ability of users to recommend and share our content via social media websites and applications such as Facebook, Pinterest and Twitter. Visitors access our online properties through desktop and mobile platforms, including mobile applications, and view our content on distribution channels such as Facebook and YouTube.
Our portfolio of owned and operated online properties includes:
|
· |
eHow. eHow is a do-it-yourself and how-to reference destination with an extensive library of text articles and videos that provide people with practical solutions and easily understandable instruction and advice on a broad range of subjects that they may encounter throughout their day. eHow has recently focused on improving the user experience on the site by adding new features and tools to facilitate engagement with the content. In January 2016, eHow had nearly 24 million unique visitors in the U.S. across desktop and mobile platforms, according to comScore. |
|
· |
Livestrong.com. Livestrong.com, an online destination for health and healthy living, has an extensive library of health, fitness, lifestyle and nutrition text articles and videos. This content, combined with interactive tools and mobile applications, user-contributed nutritional information and social media community features, helps users create customized goals and monitor their health, fitness and life achievements, while serving as a platform for community members to connect with each other. In January 2016, Livestrong.com had nearly 26 million unique visitors in the U.S. across desktop and mobile platforms, according to comScore. |
|
· |
Cracked. Cracked is a leading humor website offering original and engaging comedy-driven videos and video series, text articles, podcasts and blogs created by our in-house editorial staff, comedians and website enthusiasts. Cracked has a passionate community of readers who awarded it the People’s Voice Webby for “Best Humor Site” for 2012, 2013 and 2015, and the Cracked video series “After Hours” won the 2014 Webby and People’s Voice Webby for Best Writing in Online Film & Video. As of January 2016, the Cracked YouTube channel had over one million subscribers. In January 2016, Cracked had more than 8 million unique visitors in the U.S. across desktop and mobile platforms, according to comScore. |
5
|
· |
Niche Properties. We also own and operate certain niche properties that are focused on specific topics or interests, such as airliners, pets and cars, where people can entertain their passions and share related information with like-minded people. |
We also distribute our content to brands and publishers as part of our content channels solution. We use our content creation platform to create original custom content for brands and publishers, which we host and seamlessly integrate onto dedicated sections of these customers’ websites. Our content channel agreements generally include a revenue sharing arrangement with regard to advertising revenue generated by the display of the content we create and distribute through these content channels.
Monetization. We have developed a multi-faceted monetization platform, incorporating a multitude of partners ranging from sell side platforms to advertising exchanges, that we deploy to our online properties and those hosted for our content channel customers. We use a series of sophisticated algorithms and proprietary methods to present visitors with relevant advertisements that can be dynamically optimized via creative rotation, frequency capping, and data to improve monetization performance. Our system of monetization tools also includes yield optimization systems that continuously evaluate the performance of advertisements on desktop and mobile in order to maximize revenue, while also utilizing ad management infrastructures that manage multiple ad formats and control ad inventory.
For monetization of our display ad inventory, our programmatic platform, D360, automates the selling of ad inventory utilizing third-party technology and sophisticated data sets. D360 matches advertisers looking for specific ads in connection with their campaign goals with the inventory available on our online properties in real time. We also create operational efficiencies by selling our premium display and native ad inventory directly to advertisers, while streamlining ad planning and buying and managing media campaigns through the use of technology and proprietary first-party data sets.
Content Marketing. Our studioD business helps brands, advertisers and publishers develop a comprehensive and integrated digital content strategy. We provide our customers with topically relevant custom content; advise on distribution and publishing strategies; and track and measure client objectives to optimize content across formats and devices. The content we provide spans across text articles and blogs, videos, photography and designed visuals, such as infographics and animated GIFs. The content can be acquired outright or licensed, usually via revenue share agreements. We have increased our investment in our content marketing services over the past two years and intend to continue to expand this service offering in the future.
Marketplaces
Our Marketplaces service offering includes Society6, which we acquired in June 2013, and Saatchi Art, which we acquired in August 2014. Over the last two years, we have expanded our marketplace offerings in several ways, including continuing to introduce new products on Society6 and launching mobile applications for Saatchi Art and Society6. Our marketplace platforms provide consumers with tools to discover a large selection of original artworks and designs created by a leading global artist community of approximately 240,000 artists across both sites. Our marketplaces empower artists to reach a global audience of art lovers and earn a living pursuing their passion, while we handle various logistics such as coordination of print-on-demand production, global shipping and payment processes. We believe that our marketplaces are distinguished by the high quality products, caliber of artists and superior customer service we provide to both artists and buyers.
Society6. Society6 provides artists with an online commerce platform where they can feature and sell their original designs on a wide variety of lifestyle and home décor products, including art prints, phone and tablet cases, t-shirts and throw pillows. Artists post their designs, set the price for art prints, and select other products within the Society6 product portfolio on which the design can be sold. After a product is purchased, we utilize third-party vendors to produce, package and ship the product directly to the buyer. As of December 31, 2015, there were approximately 180,000 active artists on Society6, an increase of more than 38% from a year earlier. There are now more than 2.7 million unique designs available across the Society6 product portfolio, a 38% increase year-over-year. During 2015, Society6 customers came from over 100 countries and approximately 39% of Society6’s users accessed its services via mobile devices.
6
Saatchi Art. Saatchi Art is an online art gallery that provides a global community of artists a curated environment in which to exhibit and sell their artworks, including paintings, drawings, sculptures and photographs, directly to customers around the world. Saatchi Art’s art advisory service provides individual collectors and trade professionals with complimentary access to an art curator who will select works for the customer to browse that are tailored to the customer's needs, space and style. There are currently more than 500,000 original, unique artworks created by over 60,000 artists available on the Saatchi Art platform. In addition, artists can choose to sell prints of the artworks they post on Saatchi Art and we contract with third-party vendors to produce and ship the prints directly to the purchaser. Saatchi Art customers are located in over 80 countries and approximately 20% of Saatchi Art’s customers have made repeat purchases, evidencing the high quality of the artwork and their purchasing experience.
Technology
Our technologies include software applications built to run on independent clusters of standard and commercially available servers located at co-location facilities located in North America. We make substantial use of off-the-shelf available open-source technologies such as Linux, PHP, MySQL, Redis, mongoDB, Memcache, and Lucene in addition to commercial platforms such as Microsoft, including Windows Operating Systems, SQL Server, and .NET. These systems are connected to the Internet via load balancers, firewalls, and routers installed in multiple redundant pairs. We also utilize third-party services to geographically deliver data using major content delivery network (“CDN”) providers. Virtualization is heavily deployed throughout our technology architecture, which affords scaling numerous properties in an efficient and cost effective manner. Enterprise class storage systems provide redundancy in order to maintain continued and seamless system availability in the event of most component failures.
Our data centers host most of our public-facing websites and applications, as well as many of our back-end business intelligence and financial systems. Some of our websites are hosted with a third-party cloud hosting provider. Each of our significant websites is designed to be fault-tolerant, with collections of application servers, typically configured in a load balanced state, in order to provide additional resiliency. Our environment is staffed and equipped with a full scale monitoring solution, which includes a Network Operations Center that is continuously staffed.
International Operations
We provide our products and services to consumers around the world. Our Content & Media service offering includes eHow en Español, Livestrong.com en Español and eHow Brasil (Spanish and Portuguese language sites that target both the U.S. and the worldwide Spanish/Portuguese-speaking markets), as well as eHow UK (an eHow site in the United Kingdom). Our marketplaces are available to artists and buyers globally. Information regarding financial data by geographic areas is set forth in Note 16 of our Notes to Consolidated Financial Statements included in Part III, Item 15, “Exhibits, Financial Statement Schedules” of this Annual Report on Form 10-K, and additional information regarding certain risks associated with our international operations is provided under the heading “Risk Factors” in Part I, Item 1A of this Annual Report on Form 10-K.
Customers
Our content & media customers currently include advertisers and advertising providers that purchase advertising space on our online properties, as well as third-party brands, publishers and advertisers for whom we provide content marketing solutions and/or create and host content on content channels as part of our studioD services. Our advertising strategy is currently focused on programmatic offerings that utilize various advertising network exchanges to manage our ad stack. We have also recently re-implemented direct sales channels to improve our advertising sales with brands and advertising agencies, particularly with respect to native and sponsored ad campaigns.
The products and artworks sold through our marketplaces are sold directly to consumers.
Competition
We operate in highly competitive and developing industries that are characterized by rapid technological change, various business models and frequent disruption of incumbents by innovative entrants.
7
Content & Media. We face intense competition for our Content & Media service offering from a wide range of competitors. These markets are rapidly evolving, fragmented and competition could increase in the future as more companies enter the space. We compete for advertisers on the basis of a number of factors including return on marketing expenditures, price of our offerings, and the ability to deliver large amounts, or precise types, of segmented customer traffic. Our principal competitors in this space currently include various online media companies, ranging from large Internet media companies to specialized and enthusiast properties that focus on particular areas of consumer interest, as well as social media outlets such as Facebook, Snapchat and Pinterest, where brands and advertisers are focusing a significant portion of their online advertising spend in order to connect with their customers. Some of our competitors have larger audiences and more financial resources than we have and many of our competitors are making significant investments, particularly in online video, in order to compete with various aspects of our business. Our primary competitors for our content marketing and custom content services are other companies, such as Contently and Skyword, that also provide content marketing services and/or employ a content creation model similar to our platform.
Marketplaces. Our art and design marketplaces compete with a wide variety of online and brick-and-mortar companies selling comparable products. Society6 competes with companies, such as RedBubble, Zazzle and Minted, that utilize a print-on-demand model whereby specialty products are produced and shipped to customers with selected user or artist generated designs printed on them, as well as small online providers of niche customization services and product offerings. Saatchi Art competes with traditional offline art galleries, art consultants and other online properties selling original artwork, such as Artfinder, Artspace, Ugallery and Amazon Art. Our marketplaces must successfully attract, retain and engage both buyers and sellers to use our platforms. We believe that the principal competitive factors for our marketplaces include the quality, price and uniqueness of the products or artworks being offered; the selection of goods and artists featured; the ability to source numerous products efficiently and cost-effectively with respect to our print-on-demand products; customer service; the convenience and ease of the shopping experience we provide; and our reputation and brand strength. We expect competition to continue to intensify as online and offline businesses increasingly compete with each other and the barriers to enter online channels are reduced.
Many of our current Content & Media and Marketplaces competitors have, and potential competitors may have, substantially greater financial, marketing and other resources than we have; greater technical capabilities; greater brand recognition; longer operating histories; differentiated products and services; and larger customer bases. These resources may help some of our competitors respond more quickly as the industry and technology evolves, focus more on product innovation, adopt more aggressive pricing policies and devote substantially more resources to website and system development than we do. Additional information regarding competition is included under the heading “Risk Factors” in Part I, Item 1A of this Annual Report on Form 10-K.
Intellectual Property
Our intellectual property consists of trade secrets, trademarks, service marks, patents and copyrights and is, in the aggregate, important to our business. To protect our proprietary rights, we rely on a combination of trade secret, trademark, patent and copyright laws in the United States and other jurisdictions, together with contractual provisions and technical measures. As of February 24, 2016, we held more than 30 U.S. trademark registrations (some of which are registered in multiple classes), including “Demand Media,” “eHow,” “Society6” and “Cracked.” We have also registered certain trademarks in various countries outside of the U.S. As of February 24, 2016, we held approximately 15 patents granted by the United States Patent and Trademark Office and six patents granted by other jurisdictions, and we have approximately 15 patent applications pending in the United States and other jurisdictions. We rely more heavily on trade secret protection than patent protection. To protect our trade secrets, we control access to our proprietary systems and technology, including our platforms, and we enter into confidentiality and invention assignment agreements with our employees and consultants, as well as confidentiality and non-disclosure agreements with other third parties. We generally do not register the copyrights associated with our content with the United States Copyright Office due to the relatively high cost we would incur to register all of our copyrights. In addition to the intellectual property we own, we also have licenses to use the “Saatchi” and “Livestrong.com” names as permitted by the terms of intellectual property or licensing agreements with the third parties who retain the ownership rights to such names. Additional information regarding certain risks related to our intellectual property is included under the heading “Risk Factors” in Part I, Item 1A of this Annual Report on Form 10-K.
8
Regulation
We are subject to numerous laws and regulations in the U.S. and abroad, including laws and regulations relating to freedom of expression; information security; data privacy and data collection; pricing and fees; online content and the distribution of content; intellectual property rights, including secondary liability for infringement by others; product liability claims; taxation, including sales and value-added taxes (“VAT”); and online advertising and marketing, including email marketing and unsolicited commercial email.
In the United States, Congress has adopted legislation that regulates certain aspects of the Internet, including the Communications Decency Act, the Digital Millenium Copyright Act, the Lanham Act, the Anticybersquatting Consumer Protection Act and the CAN-SPAM Act. Advertising and promotional information presented to visitors on our online properties and our other marketing activities are subject to federal and state consumer protection laws that regulate unfair and deceptive practices. Because we operate large consumer-facing websites, we are also subject to state, federal and foreign laws and regulations governing privacy of users’ search habits and other information and data protection of consumers’ non-public personal information and preferences.
We must also comply with certain foreign and U.S. laws and regulations that apply to our international operations, including restrictions imposed by the Foreign Corrupt Practices Act (“FCPA”) and the economic and trade sanctions administered by the Office of Foreign Assets Control (“OFAC”) and the U.S. Commerce Department based on U.S. foreign policy and national security goals against targeted foreign states, organizations and individuals. Additionally, some of the products and services we provide to customers globally may require approval under applicable U.S. export law.
Federal, state, local and foreign governments are also considering other legislative and regulatory proposals that would regulate the Internet in more and different ways than exist today, including with respect to taxes. New laws and regulations, or new interpretations of existing laws and regulations, may significantly impact our business. The costs of compliance with the various laws and regulations applicable to us are high and may increase in the future and any failure to comply with applicable laws and regulations may subject us to additional liabilities and penalties. See “Risk Factors” in Part I, Item 1A of this Annual Report on Form 10-K for additional information.
Employees
As of December 31, 2015, we had approximately 350 employees. None of our employees is represented by a labor union or is subject to a collective bargaining agreement. We believe that relations with our employees are good.
Seasonality
Our Content & Media service offering is affected by seasonal fluctuations in internet usage and our Marketplaces service offering is affected by traditional retail seasonality as well as seasonal fluctuations in internet usage. Internet usage generally slows during the summer months while our marketplaces generally experience increased sales activity during the fourth quarter holiday season. These seasonal trends have caused, and will likely continue to cause, fluctuations in our quarterly results.
Available Information
We file reports with the SEC, including annual reports on Form 10-K, quarterly reports on Form 10-Q, current reports on Form 8-K and any other filings required by the SEC. Our annual reports on Form 10-K, quarterly reports on Form 10-Q, current reports on Form 8-K, and all amendments to those reports are made available free of charge in the investor relations section of our corporate website (http://ir.demandmedia.com) as soon as reasonably practicable after such material is electronically filed with or furnished to the SEC. The public may also read and copy any materials we file with the SEC at the SEC's Public Reference Room at 100 F Street, NE, Washington, DC 20549. The public may obtain information on the operation of the Public Reference Room by calling the SEC at 1-800-SEC-0330. The SEC maintains an Internet site (http://www.sec.gov) that contains reports, proxy and information statements, and other information regarding issuers that file electronically with the SEC.
9
We webcast our earnings calls and certain events we participate in or host with members of the investment community on the investor relations section of our corporate website. Additionally, we provide notifications of news or announcements regarding our financial performance, including SEC filings, investor events, and press and earnings releases, on the investor relations section of our corporate website. Investors and others can receive notifications of press releases and SEC filings by signing up for email alerts. Investors and others should note that we also use social media to communicate with the public about our company, our services and other issues. It is possible that the information we post on social media could be deemed to be material information. Therefore, we encourage investors, the media, and others interested in our company to review the information we post on the social media channels listed on the investor relations section of our corporate website. Further corporate governance information, including our corporate governance guidelines, board committee charters and code of business conduct and ethics, is also available on the investor relations section of our corporate website under the heading “Corporate Governance.”
Any references to our corporate website address in this Annual Report on Form 10-K are intended to be inactive textual references only. None of the information contained on our website is part of this Annual Report on Form 10-K or incorporated by reference into this report or any other report or document we file with the SEC.
In addition to the other information set forth in this Annual Report on Form 10-K, you should consider carefully the risks and uncertainties described below, which could materially adversely affect our business, financial condition and results of operations.
Risks Relating to our Business
If Internet search engines continue to modify their methodologies, traffic to our online properties could decline significantly. If we are unable to successfully drive traffic to our online properties, our business, financial condition and results of operations would be adversely affected.
In order for our businesses to grow, we must attract new visitors to our online properties and retain our existing visitors. We depend on various Internet search engines, such as Google, Bing and Yahoo!, to direct a significant amount of traffic to our online properties, including online properties that we host for our content channel customers. Our Content & Media properties are particularly dependent on search referral traffic. For the year ended December 31, 2015, based on our internal data, a majority of the traffic directed to eHow and Livestrong.com came directly from Internet search engines and more than half of the traffic from search engines came from Google. Changes in the methodologies or algorithms used by search engines to display results could cause our online properties to receive less favorable placements or be removed from the search results. Internet search engines could decide that content on our online properties, or the size and placement of ad units displayed on webpages hosting our content, is unacceptable or violates their policies. Internet search engines could also view changes made to our online properties unfavorably, leading to lower search result rankings and a decrease in search referral traffic.
In addition, search engine providers typically display, together with organic search results, content and links that may divert traffic from the pages referenced in the organic search results, including paid search results and content and links that the search engine provider selects and displays in response to the key words used in specific search queries. Accordingly, even if we rank highly in organic search results, traffic to our properties may be reduced as a result of paid search results and other content included on the search results page generated by a search query.
Google, Bing and Yahoo! regularly deploy changes to their search engine algorithms. Since 2011, we have experienced fluctuations in the total number of Google search referrals to our online properties. During 2013, we experienced several negative changes in Google referrals to our Content & Media properties that, in the aggregate, were larger in magnitude than those we had previously experienced. Beginning in 2014, Bing and Yahoo! began to implement similar changes to their search engine algorithms. The changes to search engine algorithms by Google, Bing and Yahoo! have resulted in, and may continue to result in, substantial declines in traffic directed to our Content & Media properties, particularly eHow, which has contributed to significant revenue declines from our Content & Media properties. Any
10
future or ongoing changes made by search engines that negatively impact the volume of search referral traffic to any of our online properties could materially and adversely affect our business, financial condition and results of operations.
Our success in attracting traffic to our Content & Media properties and converting these visitors into repeat users also depends, in part, upon our ability to identify, create and distribute high-quality content through engaging products and our ability to meet rapidly changing consumer demand. We may not be able to identify and create the desired content and produce an engaging user experience in a cost-effective or timely manner, if at all. We also utilize search engine optimization efforts to help generate search referral traffic to our online properties. If we are unable to successfully modify our search engine optimization practices in response to changes in search engine algorithms and search query trends, or if we are unable to generate increased traffic from other sources such as social media and direct navigation, we could continue to experience substantial declines in traffic to our Content & Media properties and to other properties that publish our content, which would adversely impact our business, financial condition and results of operations.
We generate the majority of our Content & Media revenue from advertising. A reduction in advertising revenue, including as a result of lower ad unit rates, increased availability of ad blocking software, lower online advertising spend, a loss of advertisers or lower advertising yields, could seriously harm our business, financial condition and results of operations.
We currently generate the majority of our revenue from advertisements displayed on our online properties. For the years ended December 31, 2015, 2014 and 2013, after giving effect to the Separation, we generated 53%, 70% and 83%, respectively, of our total revenue from advertising, and we expect to continue to derive a significant amount of our revenue from advertising. We have experienced declines in ad unit rates for both desktop and mobile since 2014, resulting in lower advertising revenue, and any further reductions in ad unit rates would negatively impact our financial results. In addition, software developers have been increasing the availability of ad blocking software, particularly on mobile devices. Increased adoption of ad blocking software by users could reduce our advertising revenue and negatively impact our financial results.
We also believe that advertising spend on the Internet, as in traditional media, fluctuates significantly as a result of a variety of factors, many of which are outside of our control. These factors include variations in expenditures by advertisers due to budgetary constraints; the cyclical and discretionary nature of advertising spending, including the perceived impact of campaign strategies; general economic conditions, as well as economic conditions specific to the Internet and media industry; and the occurrence of extraordinary events, such as natural disasters or terrorist attacks. Brands and advertisers are also increasingly focusing a portion of their online advertising budgets on social media outlets such as Facebook, Snapchat and Pinterest, as well as on native and sponsored advertising campaigns. If this trend continues and we are unable to offer competitive or similarly valued advertising opportunities on our online properties, our revenue from advertising could be adversely impacted. An inability to maintain or increase our advertising revenue would have a material adverse effect on our business, financial condition and results of operations.
Additionally, our advertising strategy is currently focused on programmatic offerings that utilize various advertising network exchanges, including exchanges operated by Google and Rubicon Project, to manage our ad stack. Operating on a programmatic basis requires us to actively manage the sale of our owned and operated inventory on these exchanges. Although we had shifted our advertising strategy away from direct sales in early 2014, we have recently decided to implement direct sales channels again to improve our branded advertising sales, particularly with respect to native and sponsored ad campaigns. An inability to successfully manage our ad stack, including the programmatic process and our direct sales team, could have a material adverse effect on our business, financial condition and results of operations.
In addition, one component of our platform that we use to generate advertiser interest is our system of monetization tools, which is designed to match content with advertisements in a manner that optimizes revenue yield and end-user experience. Advertising providers and advertisers will stop placing advertisements on our online properties if their investments do not generate sales leads, branding opportunities and ultimately customers, or if we do not deliver their advertisements in an appropriate and effective manner. The failure of our yield-optimized monetization technology to effectively match advertisements with our content in a manner that results in increased revenue for advertisers would
11
have an adverse impact on our ability to maintain or increase our revenue from advertising. If any of our advertisers or advertising providers, and in particular Google, decides not to continue advertising on, or providing advertisements to, our online properties, or modifies its advertising policies in a manner that could negatively impact yield, we could experience a rapid decline in our revenue over a relatively short period of time.
We are dependent upon certain arrangements with Google for a significant portion of our revenue. A termination of, or a loss of revenue generated from, our agreements with Google would have a material adverse effect on our business, financial condition and results of operations.
We have an extensive relationship with Google and a significant portion of our revenue is derived from advertising provided by Google. For the years ended December 31, 2015, 2014 and 2013, after giving effect to the Separation, we derived approximately 36%, 50% and 56%, respectively, of our total revenue from our arrangements with Google. Google provides cost-per-click advertisements and cost-per-impression advertisements to our online properties and we receive a portion of the revenue generated by such advertisements. We also utilize Google’s DoubleClick Ad Exchange, an auction marketplace that allows us to sell display advertising space on our online properties. In addition, we use Google’s DoubleClick ad serving technology to deliver advertisements to our online properties. Our services agreement with Google, which governs our various advertising relationships with them, currently expires in October 2016. Google has the right to terminate its agreements with us prior to their expiration upon the occurrence of certain events, including if Google reasonably believes that our use of its services violates the rights of third parties, and other breaches of contractual provisions, a number of which are broadly defined. If our agreements with Google are terminated, or we are unable to enter into new agreements with Google on terms and conditions favorable to us prior to the expiration of the current agreements, we may not be able to enter into agreements with alternative third-party advertisement providers or for alternative ad serving platforms on acceptable terms or on a timely basis or both.
Furthermore, our advertising agreement with Google may not continue to generate the same level of revenue that we have received from such arrangements during past periods for a variety of reasons, including a reduction in the amounts Google is able to charge advertisers and the possibility that our online properties do not generate sufficient traffic to realize our maximum revenue share percentage with Google. Our ability to generate online advertising revenue from Google also depends, in part, on Google’s assessment of the quality and performance characteristics of Internet traffic resulting from online advertisements placed on our online properties. In addition, Google may at any time change the nature of, or suspend, the services that it provides to online advertisers and the catalog of advertisers from which online advertisements are sourced, or modify its policies with respect to how advertisements may be displayed on a webpage. These types of changes or suspensions would adversely impact our ability to generate revenue from our advertising agreement with Google. Any termination of or change in the services that Google provides to us, or a loss of revenue generated by our advertising agreement with Google, would have a material adverse effect on our business, financial condition and results of operations.
Mobile devices are increasingly being used to access the Internet and our online media offerings may not be as effective when accessed through these devices. Additionally, mobile advertising yields are lower on average than desktop yields, which could negatively impact our business, financial condition and results of operation.
The number of people who access the Internet through mobile devices such as smartphones and tablets, rather than through desktop or laptop computers, has increased substantially in recent years. If we cannot effectively distribute our media content, products and services on these devices, we could experience a decline in visits and traffic and a corresponding decline in revenue. It is also more difficult to display advertisements on mobile devices without disrupting the consumer experience. We have made, and may make further, changes to the layouts and formats of our mobile sites in order to improve the user experience or comply with the requirements of our advertising partners, which could negatively impact our monetization efforts on mobile devices. In addition, mobile advertising yields on average are currently lower than those for desktop, in part due to the limitations involved in using cookies on mobile devices to track and optimize mobile advertising and the reduced screen space available to render ads to consumers. The significant increase in mobile consumption of our media content has contributed to a reduction in our Content & Media revenue per one thousand visits, or RPVs. As a result of these factors, the increasing use of mobile devices to access our content could negatively impact our business, financial condition and results of operations.
12
Certain changes to the business model for our Content & Media service offering and related expenditures could negatively impact our operating margins in the near-term and may not lead to increased revenue in the long-term.
We have recently incurred significant expenses to improve the user experience and engagement on certain of our Content & Media properties by redesigning our websites; removing duplicative or low-quality content; reducing the ad unit density; changing the format of advertising units; improving the mobile experience and adding user engagement tools. Such expenses do not directly generate related revenue and certain changes will likely negatively impact our revenue and operating margins in the near-term. In particular, between 2013 and 2015, we removed a significant amount of content from eHow and Livestrong.com and reduced the number of ad units on each page, which collectively resulted in a large decrease in revenue and will continue to negatively impact revenue and operating margins due to the reduction in content and ad units generating advertising revenue on these sites. We may also incur additional expenses in order to further improve the product and user experience associated with our online properties. These recent changes and any additional changes may not result in increased visits to, or increased revenue generated by, our Content & Media properties in the near-term or long-term. We also plan to continue investing in building our studioD business, which develops and executes content marketing strategies and creates custom content for third-party brands, advertisers and publishers. If these customers do not perceive our content marketing and custom content services to be driving performance for their business, we may not be able to expand our relationship with our current customers or identify and attract new customers, and we may not generate sufficient revenue from this service offering to justify our planned investment in this business.
If we are unable to attract new customers to our marketplaces and successfully grow our marketplaces business, our business, financial condition and results of operations could be adversely affected.
We operate two leading art and design marketplaces and we recently launched a marketplace that carries boutique-style products for pets, as well as animal-themed clothing and accessories. We have limited experience in marketing, managing and growing these revenue streams.
The success of our marketplaces is dependent upon a number of factors, including:
|
· |
demand for these types of products and market acceptance of our products; |
|
· |
our ability to attract new customers; |
|
· |
increased brand awareness and the reputation of our marketplaces; |
|
· |
our ability to maintain the artist communities on Society6 and Saatchi Art so that artists continue to contribute and maintain their original artwork and designs on these marketplaces; |
|
· |
our ability to cost-effectively introduce and market new products on Society6 on a timely basis to address changing consumption trends and consumer preferences; |
|
· |
the success and competitiveness of new entrants into this highly competitive industry; |
|
· |
competitive pricing pressures, including potential discounts offered to attract customers and reduced or free shipping; |
|
· |
maintaining significant strategic relationships with our print-on-demand suppliers and ensuring the quality of their products and the timeliness of our production cycle for our art and design marketplaces; |
|
· |
disruptions in the supply-chain, production and fulfillment operations associated with the print-on-demand products sold through our art and design marketplaces; |
|
· |
our ability to source local vendors as we look to expand internationally; |
13
|
· |
shipping disruptions or delays with the products sold through our marketplaces; |
|
· |
the return rate for products sold through our marketplaces; |
|
· |
the overall growth rate of e-commerce and marketplaces; |
|
· |
overall changes in consumer spending on discretionary purchases; and |
|
· |
legal claims, including copyright and trademark infringement claims, right of publicity claims and product liability claims, which may expose us to greater litigation costs in the future as compared to historical levels. |
One of the key factors to grow our marketplaces business is expanding our customer base. Our ability to attract new customers, some of whom may already purchase similar products from our competitors, depends in part on our ability to successfully drive traffic to our marketplaces using social media sites, e-mail marketing campaigns, paid referrals and search. We may incur significant expenses related to customer acquisition and the net sales from new customers may not ultimately exceed the cost of acquiring these customers. Additionally, we believe that many of the new customers for our marketplaces originate from word-of-mouth and other non-paid referrals from existing customers. If we fail to deliver a differentiated shopping experience or if customers do not perceive the products sold through our marketplaces to be of high value and quality, we may have difficulty retaining our existing customers and attracting new customers through referrals.
If we are unable to successfully grow our marketplaces, including as a result of lower customer growth or retention than expected, or if the revenue generated from initiatives related to our marketplaces is less than the costs of such initiatives, our business, financial condition and results of operations could be materially and adversely affected.
If the mobile solutions available to buyers and sellers using our marketplaces are not effective, the growth prospects of our marketplaces could decline and our business could be adversely affected.
Consumers are increasingly conducting online shopping on mobile devices, including smartphones and tablets, rather than on desktop computers. Although we have recently introduced mobile applications for Society6 and Saatchi Art and we continue to focus on improving the mobile experience for buyers and sellers using our marketplaces, the smaller screen size and reduced functionality associated with some mobile device interfaces may make the use of our marketplace platforms more difficult or less appealing to our members, and visits to our marketplaces on mobile devices have not converted into purchases as often as visits made through desktop computers. Society6 and Saatchi Art sellers are also increasingly using mobile devices to operate and monitor their businesses on our platforms and if we are not able to deliver a rewarding experience to sellers using mobile devices, our marketplace businesses may suffer. Additionally, our recently launched mobile apps may not result in sufficient increased revenue to justify the expenses of developing and maintaining them, and we may encounter problems with operating the mobile apps in the future. If our members encounter difficulty accessing or using our marketplace platforms on their mobile devices, or if our members choose not to use our marketplace platforms on their mobile devices, our growth prospects and our business may be adversely affected.
We face significant competition, which we expect will continue to intensify, and we may not be able to maintain or improve our competitive position or market share.
We operate in highly competitive and still developing markets. The industries in which we compete are characterized by rapid technological change, various business models and frequent disruption of incumbents by innovative entrants. There can be no assurance that we will be able to compete successfully against current or future competitors and a failure to increase, or the loss of, market share, would likely seriously harm our business, financial condition and results of operations.
14
Content & Media
We face intense competition for our Content & Media service offering from a wide range of competitors. We compete for advertisers and customers on the basis of a number of factors including return on marketing expenditures, price of our offerings and the ability to deliver large amounts, or precise types, of segmented customer traffic. Our current principal competitors include:
|
· |
Online Media Properties. We compete with numerous Internet media companies, some of which have much larger audiences and financial resources than we have, for online marketing budgets. We also compete with companies and individuals that provide specialized consumer information online, including through enthusiast websites, message boards and blogs. These competitors compete with us across several areas of consumer interest including do-it-yourself, health and healthy living, home and garden, fashion and beauty, crafts, automotive and humor. |
|
· |
Social Media Outlets. We compete with social media outlets such as Facebook, Snapchat and Pinterest, where brands and advertisers are focusing a significant portion of their online advertising spend in order to connect with their customers. |
|
· |
Distributed Content Creation Platforms. We compete with other companies, such as Contently and Skyword, that provide content marketing services and/or employ a content creation model with aspects similar to our platform, including the creation of content for third parties. |
We may be subject to increased future competition to our Content & Media service offering if any of our competitors devote increased resources to more directly address the online market for the professional creation and distribution of content. Many of our current and potential competitors enjoy substantial competitive advantages, such as greater brand recognition, longer operating histories, substantially greater financial, marketing and other resources, greater technical capabilities, access to larger customer bases and, in some cases, the ability to combine their online marketing products with traditional offline media such as newspapers or magazines. These companies may use these advantages to offer products and services similar to ours at a lower price, develop different products to compete with our current offerings and respond more quickly and effectively than we can to new or changing opportunities, technologies, standards or customer requirements. For example, if Google chose to compete more directly with us, we may face the prospect of the loss of business or other adverse financial consequences due to Google’s significantly greater customer base, financial resources, distribution channels and patent portfolio. Given the intense competition that our Content & Media service offering faces, we may be unable to maintain or improve our competitive position or market share.
Marketplaces
Our marketplaces compete with a wide variety of online and brick-and-mortar companies selling comparable products. Society6 competes with companies, such as RedBubble, Zazzle and Minted, that utilize a print-on-demand model whereby specialty products are produced and shipped to customers with selected user or artist generated designs printed on them, as well as small online providers of niche customization services and product offerings. Saatchi Art competes with traditional offline art galleries, art consultants and other online properties selling original artwork, such as Artfinder, Artspace, Ugallery and Amazon Art. We expect competition to continue to intensify as online and offline businesses increasingly compete with each other, and because the barriers to entry into online channels can be low.
Our marketplaces must successfully attract, retain and engage both buyers and sellers to use our platforms. We believe that the principal competitive factors for our marketplaces include the quality, price and uniqueness of the products or artworks being offered; the selection of goods and artists featured; the ability to source numerous products efficiently and cost-effectively with respect to our print-on-demand products; customer service; the convenience and ease of the shopping experience we provide; and our reputation and brand strength.
Many of our marketplaces’ current competitors have, and potential competitors may have, longer operating histories, larger customer bases, greater technical capabilities, greater brand recognition, differentiated products and services, and substantially greater financial, marketing and other resources than we have. These resources may help
15
some of our competitors react more quickly as the industry evolves, focus more on product innovation, and devote substantially more resources to website and system development than we do. Some of our competitors may offer or continue to offer faster and/or free shipping, more favorable return policies or other transaction-related services which improve their user experience, but which could be impractical or inefficient for us to match. Some of our competitors may be able to use the advantages of brick-and-mortar stores or other sorts of physical presence to build their customer bases and drive sales. Our competitors may engage in more extensive research and development efforts, undertake more far-reaching marketing campaigns and adopt more aggressive pricing policies, which may allow them to build larger customer bases or generate net sales from their customer bases more effectively than we do. For all of these reasons, we may not be able to compete successfully against the current and potential competitors to our artist marketplaces.
We rely on freelance artists to generate the artwork and designs sold through our art and design marketplaces. We may not be able to attract or retain enough artists to generate artwork and designs on a scale or of a quality sufficient to grow our business.
Our art and design marketplaces rely on artists to join our communities and contribute original artwork and designs that they seek to sell or monetize through the sale of art prints and other print-on-demand products. We rely on freelance artists to upload their unique art designs to Society6 or sell their original artwork on Saatchi Art and we may not be able to attract or retain enough artists to generate artwork and designs on a scale or of a quality sufficient to grow our business. Furthermore, our competitors may attempt to attract members of our artist communities by offering compensation and revenue-sharing arrangements that we are unable to match. If we are unable to continue attracting artists to our marketplaces, our revenues from sales of artwork and print-on-demand products will decrease, which would have a negative impact on our business, financial condition and results of operations.
We may not be successful in expanding our current product or service offerings, or expanding into new lines of business, which could limit our future growth.
Important potential areas of growth for us are the development of new product and service offerings and the acquisition or internal development of new lines of business, and we are currently developing certain niche media properties and mobile applications. New product and service offerings and new lines of business may be subject to significant business, economic and competitive uncertainties and contingencies frequently encountered by new businesses in competitive environments, many of which are beyond our control, including lack of market acceptance. If we develop or acquire new lines of business or new product or service offerings, we may not be able to effectively integrate and manage these new businesses and we may not recover the funds and resources we expend on developing or acquiring them. If we are unable to successfully expand the products and services we offer, or expand into new lines of business, our future growth would be limited which could have a negative effect on our business, financial condition and results of operations.
Poor perception of our brands or business could harm our reputation and adversely affect our business, financial condition and results of operations.
Our Content & Media business is dependent on attracting a large number of visitors to our online properties and providing leads and clicks to our advertisers, which depends in part on our reputation within the industry and with our users. Perception that the quality of our content may not be the same or better than that of other published Internet content, even if baseless, can damage our reputation. In addition, Livestrong.com is a licensed trademark from the Livestrong Foundation and there has been negative publicity surrounding Mr. Armstrong. Any damage to our reputation could harm our ability to attract and retain advertisers, visitors, customers and artists, which would materially adversely affect our business, financial condition and results of operations.
We depend upon the quality of traffic to our online properties to provide value to online advertisers and excessive low-quality traffic could have a material adverse effect on the value of such online properties to our third-party advertisement distribution providers and online advertisers and thereby adversely affect our revenue.
We depend upon the quality of traffic to our online properties to provide value to online advertisers. Low-quality traffic can include clicks associated with non-human processes, including robots, spiders or other software; the
16
mechanical automation of clicking; and other types of invalid clicks or click fraud. There is a risk that a certain amount of low-quality traffic, or traffic that is deemed to be invalid by advertisers, will be delivered to advertisers on our online properties. As a result, we may be required to credit future amounts owed to us by our advertising partners or repay them for amounts previously received if such future amounts are insufficient. Furthermore, low-quality or invalid traffic may be detrimental to our relationships with third-party advertisement distribution providers and online advertisers and could adversely affect our revenue.
Risks Relating to our Company
We have a history of operating losses and may not be able to operate profitably or generate positive cash flow.
We were founded in 2006 and, except for the year ended December 31, 2012, when we generated net income, we have had a net loss in every year from inception, including generating a net loss of $43.5 million for the year ended December 31, 2015. As of December 31, 2015 we had an accumulated deficit of approximately $395.6 million and we may incur net operating losses in the future. Moreover, our cash flows from operating activities do not currently cover all of our operating expenses, and we may not generate sufficient cash to cover operating expenses for the foreseeable future. Our ability to generate net income in the future will depend in large part on our ability to generate and sustain substantially increased revenue levels, while continuing to control our expenses. We may incur significant operating losses in the future for a number of reasons, including those discussed in other risk factors and factors that we cannot foresee, and we may be unable to generate net income or sufficient positive cash flows.
We may not be able to obtain capital when desired on favorable terms, if at all, or without substantial dilution to our stockholders, which may impact our ability to execute on our current or future business strategies.
We anticipate that our current cash, cash equivalents and cash provided by operating activities will be sufficient to fund our operations for the next 12 months. It is possible, however, that we may not generate sufficient cash flow from operations or otherwise have the capital resources to meet our future capital needs, including to invest in areas for growth, and we do not currently have a line of credit in place if we need to borrow funds. If we do not generate sufficient cash flow from operations or otherwise have sufficient capital resources available, we may need to enter into a new financing arrangement or dispose of certain assets to execute on our current or future business strategies, including developing new or investing in existing service offerings, maintaining our operating infrastructure, acquiring complementary businesses, hiring additional personnel or otherwise responding to competitive pressures. We cannot assure you that a new financing arrangement will be available to us on favorable terms, or at all. Furthermore, if we raise additional funds through the issuance of convertible debt or equity securities, the percentage ownership of our stockholders could be significantly diluted, and these newly issued securities may have rights, preferences or privileges senior to those of existing stockholders. If adequate funds are not available or are not available on acceptable terms, if and when needed, our ability to fund our operations, meet obligations in the normal course of business, take advantage of strategic opportunities, or otherwise respond to competitive pressures would be significantly limited.
In connection with the Separation, our operational and financial profile changed and we entered into certain arrangements with Rightside under which we may have indemnification obligations.
On August 1, 2014, we completed the Separation of Rightside from Demand Media. We may be unable to achieve some or all of the strategic and financial benefits that we expected would result from the Separation of Demand Media and Rightside, or such benefits may be delayed, which could materially and adversely affect our business, financial condition and results of operations. Following the Separation, we are also a smaller company focused on our Content & Media and Marketplaces businesses. This narrower business focus may leave us more vulnerable to changing market conditions and the diminished diversification of revenue, costs, and cash flows could cause our results of operation, cash flows, working capital and financing requirements to be subject to increased volatility. In addition, we entered into various agreements with Rightside in connection with the Separation that governed our relationship with Rightside subsequent to the Separation and contained certain indemnification obligations. If we are required to indemnify Rightside for certain liabilities and related losses arising in connection with any of these agreements or if Rightside is required to indemnify us for certain liabilities and related losses arising in connection with any of these agreements and
17
does not fulfill its obligations to us, we may be subject to substantial liabilities, which could have a material adverse effect on our financial position.
If there is a determination that the Separation is taxable for U.S. federal income tax purposes, then we and our stockholders that are subject to U.S. federal income tax could incur significant U.S. federal income tax liabilities.
We received a private letter ruling from the Internal Revenue Service (“IRS”), together with an opinion of Latham & Watkins LLP, tax counsel to us (the “Tax Opinion”), substantially to the effect that, among other things, the Separation qualifies as a tax-free transaction for U.S. federal income tax purposes under Sections 355 and 368(a)(1)(D) of the Internal Revenue Code of 1986, as amended (the “Code”). The private letter ruling and Tax Opinion relied on certain facts, assumptions, representations and undertakings from us and Rightside regarding the past and future conduct of the companies’ respective businesses and other matters. The private letter ruling did not address all the requirements for determining whether the Separation would qualify for tax-free treatment, and the Tax Opinion, which addressed all such requirements but relied on the private letter ruling as to matters covered by the ruling, is not binding on the IRS or the courts. Notwithstanding the private letter ruling and the Tax Opinion, the IRS could determine on audit that the Separation should be treated as taxable if it determines that any of these facts, assumptions, representations or undertakings is not correct or have been violated or if it disagrees with the conclusions in the Tax Opinion that are not covered by the private letter ruling, or for other reasons, including as a result of certain significant changes in the stock ownership of us or Rightside after the Separation.
If the Separation ultimately is determined to be taxable, we would be subject to tax as if we had sold the Rightside common stock in a taxable sale for its fair market value, and our stockholders would be subject to tax as if they had received a taxable distribution equal to the fair market value of Rightside’s common stock that was distributed to them. Under the tax matters agreement we entered into with Rightside (the “Tax Matters Agreement”), we may be required to indemnify Rightside against all or a portion of the taxes incurred by Rightside in the event the Separation were to fail to qualify for tax-free treatment under the Code. If we are required to pay any tax liabilities in connection with the Separation pursuant to the Tax Matters Agreement or pursuant to applicable tax law, the amounts may be significant.
We have agreed to various restrictions to preserve the non-recognition treatment of the Separation, which may reduce our strategic and operating flexibility.
Pursuant to the Tax Matters Agreement, we may not take any action that would jeopardize the favorable tax treatment of the Separation. The restrictions under the Tax Matters Agreement may limit our ability to pursue certain strategic transactions or engage in other transactions that might increase the value of our business for the two-year period following the Separation. For example, we might determine to continue to operate certain of our business operations for the foreseeable future even if a sale or discontinuance of such business might have otherwise been advantageous. Moreover, in light of the requirements of Section 355(e) of the Code, we might determine to forgo certain transactions, including share repurchases, stock issuances, certain asset dispositions or other strategic transactions for some period of time following the Separation. In addition, our indemnity obligation under the Tax Matters Agreement might discourage, delay or prevent a change of control transaction for some period of time following the Separation.
The intangible assets and goodwill on our balance sheet may be subject to impairment. If our intangible assets or goodwill become impaired we may be required to record a significant non-cash charge to earnings which would have a material adverse effect on our results of operations.
We carry a substantial amount of intangible assets on our balance sheet, primarily from the creation of our long-lived media content and from certain past acquisitions. We also carry goodwill on our balance sheet from certain acquisitions we have made. We assess potential impairments to our intangible assets and goodwill when there is evidence that events or changes in circumstances indicate that the carrying value of such intangible assets or goodwill may not be recoverable. In the third quarter of 2014, we recorded a $232.3 million pretax impairment charge after we determined that the implied fair value of goodwill in our content and media reporting unit was substantially lower than its carrying value. We most recently performed our annual impairment analysis in the fourth quarter of the year ended December 31, 2015, and based on the results, there were no goodwill impairment charges for the year ended December
18
31, 2015. Future significant and sustained declines in our stock price and market capitalization relative to our book value or our inability to generate sufficient revenue or cash flows from our long-lived media content or the businesses that we have acquired may result in us having to take additional impairment charges against certain of our intangible assets or goodwill. If we are required to record additional impairment charges in future periods, it could have a material adverse effect on our results of operations and financial condition, particularly in the period such charge is taken.
Our operating results may fluctuate on a quarterly and annual basis due to a number of factors, which may make it difficult to predict our future performance.
Our revenue and operating results could fluctuate significantly from quarter-to-quarter and year-to-year due to a variety of factors, many of which are outside of our control. Therefore, comparing our operating results on a period-to-period basis may not be meaningful. In addition to other risk factors discussed in this section, factors that may contribute to the variability of our quarterly and annual results include:
|
· |
lower than anticipated levels of traffic to our owned and operated online properties and to our customers’ online properties; |
|
· |
seasonality of the revenue associated with our marketplaces, including increased sales activity during the holiday season; |
|
· |
spikes in sales of our print-on-demand products due to major social or political events resulting in a short-term demand for products with related content; |
|
· |
competitive pricing pressures, including shipping costs and potential discounts offered, associated with the products sold through our marketplaces; |
|
· |
disruptions in the supply-chain, production and fulfillment operations associated with the products sold through our marketplaces; |
|
· |
the amount and timing of operating costs and capital expenditures related to the maintenance and expansion of our services, operations and infrastructure, especially one-time costs related to the development or acquisition of new products and services; |
|
· |
the level of promotional activity required to drive potential customers to our marketplaces; |
|
· |
increased costs associated with the acquisition or production of new content; |
|
· |
changes in Internet advertising purchasing patterns by advertisers and changes in how we sell advertisements; |
|
· |
realignment costs associated with shifting priorities for our businesses; |
|
· |
timing of and revenue recognition for certain transactions; |
|
· |
changes in generally accepted accounting principles; |
|
· |
our focus on long-term goals over short-term results; and |
|
· |
weakness or uncertainty in general economic or industry conditions. |
It is possible that our operating results may fluctuate and our operating results may be below the expectations of public market analysts and investors in one or more future quarters due to any of the factors listed above, a combination
19
of those factors or other reasons, which could have a material adverse impact on the price of shares of our common stock.
We have made and may make additional acquisitions that involve significant execution, integration and operational risks and we may not realize the anticipated benefits of any such acquisitions.
We evaluate acquisition and expansion opportunities on an ongoing basis and may pursue select acquisitions. We may continue to make acquisitions of complementary websites, businesses, solutions, technologies or talent in the future to increase the scope of our business. The identification of suitable acquisition candidates can be difficult, time-consuming and costly. Potential acquisitions require significant attention from our management and could result in a diversion of resources from our existing business, which in turn could have an adverse effect on our business and results of operations. In addition, the expected benefits of acquisitions may not materialize as planned, including achieving certain financial and revenue objectives. Certain acquired businesses or the transactions entered into as part of business combinations may also carry contingent liabilities that could materially impact our future results of operations and financial condition. Furthermore, we may not be able to successfully complete identified acquisitions. If we are unable to identify suitable future acquisition opportunities, reach agreement with such parties or obtain the financing necessary to make such acquisitions, we could lose market share to competitors who are able to make such acquisitions. This loss of market share could negatively impact our business, revenue and future growth.
Even if we successfully complete an acquisition, we may not be able to successfully assimilate and integrate the acquired websites, business, assets, technologies, solutions, personnel or operations, particularly if key personnel of an acquired company decide not to work for us, and we therefore may not achieve the anticipated benefits of such acquisition. Acquisitions also could harm our reputation or brands generally, as well as our relationships with existing customers. In addition, financing an acquisition may require us to (i) use substantial portions of our available cash on hand, (ii) incur additional indebtedness, which would increase our costs and impose operational limitations, and/or (iii) issue equity securities, which would dilute our stockholders’ ownership and could adversely affect the price of our common stock. We may also unknowingly inherit liabilities that arise after the acquisition and are not adequately covered by indemnities, and certain stockholders of an acquired company may dissent from or object to an acquisition or otherwise seek to assert claims related to the transaction.
We depend on key personnel to operate our business, and if we are unable to retain our current personnel or hire additional personnel, our ability to develop and successfully market our business could be harmed.
We believe that our future success is highly dependent on the contributions of our executive officers, as well as our ability to attract and retain highly skilled personnel, including engineers, developers and sales personnel. Since 2013, we have had significant turnover in senior management including a new Chief Executive Officer and a new Chief Financial Officer. It is important that we retain other key personnel following these changes. In addition, qualified individuals that are critical to the success of our current and future business, including engineers, developers and sales personnel, are in high demand, and we may incur significant costs to attract and retain them. All of our officers and other employees are at-will employees, which means they can terminate their employment relationship with us at any time, and their knowledge of our business and industry would be extremely difficult to replace. Volatility or under-performance in our stock price may also affect our ability to attract new employees and retain our existing key employees. Our executive officers and employees may be more inclined to leave us if the perceived value of equity awards, including restricted stock units and stock options, decline. If we lose the services of key personnel or do not hire or retain other qualified personnel for key positions, our business and results of operation could be adversely affected. In addition, we do not maintain “key person” life insurance policies for any of our executive officers.
Our business is subject to online security risks, including cyberattacks and other security breaches, and any actual or perceived security breach could have a material adverse effect on our business, financial condition and results of operations.
Some of our systems, products and services involve the storage and transmission of information regarding our users, customers, and advertising and publishing partners, and our information technology and infrastructure may be vulnerable to cyberattacks, malware or security incidents that result in third parties gaining access to such proprietary
20
information. An increasing number of websites have recently disclosed online security breaches, some of which have involved sophisticated and highly targeted attacks on portions of their websites or infrastructure. Our security measures may be breached and unauthorized parties may attempt to gain access to our systems and information through various means, including hacking into our systems or facilities, fraud, employee error, malfeasance, or inserting malicious code or malware into our code base. For example, in 2014 we determined that an unauthorized individual may have gained access to the user names, email addresses and passwords of certain eHowNow customers. Additionally, outside parties may attempt to fraudulently induce employees, users, or customers to disclose sensitive information or take other actions by using fraudulent “spoof” and “phishing” emails. Outside parties may also introduce viruses or other malware through “trojan horse” programs to our users’ computers in order to gain access to our systems and the data stored therein. Because the techniques used to obtain unauthorized access, disable or degrade service, or sabotage systems change frequently, often are not recognized until launched against a target and may be difficult to detect for a long time, we may be unable to anticipate these techniques or to implement adequate preventive measures. Any security breach or unauthorized access could result in a misappropriation of our proprietary information or the proprietary information of our users, customers or partners, which could result in significant legal and financial exposure, an interruption in our operations and damage to our reputation. If an actual or perceived breach of our security occurs, the market perception of the effectiveness of our security measures could be harmed and we could lose users, customers, advertisers or publishers, all of which could have a material adverse effect on our business, financial condition and results of operations. Any security breach at a company providing services to us or our users, including third party payment processors, could have similar effects and we may not be fully indemnified for the costs we may incur as a result of any such breach. In addition, we may need to expend significant resources to protect against security breaches or to address problems caused by a breach, and the coverage limits on our insurance policies may not be adequate to reimburse us for any losses caused by security breaches.
We are subject to risks and compliance rules and regulations related to the third party credit card payment processing solutions integrated with our websites.
Many of our customers pay amounts owed to us using a credit card or debit card. For credit and debit card payments, we pay payment processing fees in addition to interchange and other fees, which may increase over time and raise our operating expenses and adversely affect our net income. We are also subject to payment card association operating rules, certification requirements and rules governing electronic funds transfers, which could change or be reinterpreted to make it difficult or impossible for us to comply. We believe we and our payment processing service providers are compliant in all material respects with the Payment Card Industry Data Security Standard, which incorporates Visa’s Cardholder Information Security Program and MasterCard’s Site Data Protection standard. However, there is no guarantee that such compliance will be maintained or that compliance will prevent illegal or improper use of our systems that are integrated with our payment processing providers. If any of our third party payment processors fails to be in compliance with applicable credit card rules and regulations, we may be required to migrate to an alternate payment processor which could result in transaction downtime during the migration and/or a loss of customers and have a material adverse effect on our business, financial condition and results of operations.
If we do not adequately protect our intellectual property rights, our competitive position and business may suffer.
Our intellectual property, consisting of trade secrets, trademarks, service marks, patents and copyrights, is, in the aggregate, important to our business. We rely on a combination of trade secret, trademark, copyright and patent laws in the United States and other jurisdictions together with contractual provisions and technical measures to protect our proprietary rights. We rely more heavily on trade secret protection than patent protection. To protect our trade secrets, we control access to our proprietary systems and technology, including our platforms, and we enter into confidentiality and invention assignment agreements with our employees and consultants, as well as confidentiality and non-disclosure agreements with other third parties. We face risks related to our intellectual property including that:
|
· |
because of the relatively high cost we would experience in registering all of our copyrights with the United States Copyright Office, we generally do not register the copyrights associated with our content; |
|
· |
our ability to assert our intellectual property rights against potential competitors or to settle current or future disputes may be limited by our agreements with third parties; |
21
|
· |
our intellectual property rights may not be enforced in jurisdictions where legal protections are weak; |
|
· |
any of the patents, trademarks, copyrights, trade secrets or other intellectual property rights that we presently employ in our business could lapse or be invalidated, circumvented, challenged or abandoned; |
|
· |
competitors may design around our protected systems and technology; or |
|
· |
we may lose the ability to assert our intellectual property rights against others. |
Effective protection of our trade secrets, trademarks, service marks, copyrights and patents may not be available in all countries where we currently operate or in which we may operate in the future. Policing unauthorized use of our proprietary rights can be difficult and costly. In addition, it may be necessary to enforce or protect our intellectual property rights through litigation or to defend litigation brought against us, which could result in substantial costs and diversion of resources and management attention and could adversely affect our business, even if we are successful on the merits.
Some of our software and systems contain open source software, which may pose risks to our proprietary software and solutions.
We use open source software in our software and systems and will use open source software in the future. The licenses applicable to open source software typically require that the source code subject to the license be made available to the public and that any modifications or derivative works to open source software continue to be licensed under open source licenses. From time to time, we may face claims from third parties demanding the release or license of the open source software or derivative works that we developed using such software (which could include our proprietary source code), claiming infringement of their intellectual property rights, or otherwise seeking to enforce the terms of the applicable open source license. These claims could result in litigation and could require us to purchase a costly license, publicly release the affected portions of our source code, be limited in the licensing of our technologies or cease offering the implicated solutions unless and until we can re-engineer them to avoid infringement or change the use of the implicated open source software. In addition to risks related to license requirements, use of certain open source software can lead to greater risks than use of third-party commercial software, as open source licensors generally do not provide warranties, indemnities or other contractual protections with respect to the software (for example, non-infringement or functionality). Our use of open source software may also present additional security risks because the source code for open source software is publicly available, which may make it easier for hackers and other third parties to determine how to breach our sites and systems that rely on open source software. Any of these risks could be difficult to eliminate or manage, and, if not addressed, could have a material adverse effect on our business, financial condition and results of operation.
The interruption or failure of our information technology and communications systems, or those of third parties that we rely upon, could adversely affect our business, financial condition and results of operations.
The availability of our online properties depends on the continuing operation of our information technology and communications systems. Any damage to or failure of our systems, or those of third parties that we rely upon (e.g., co-location providers for data servers, storage devices, and network access), could result in interruptions in our service, which could reduce our revenue and profits, and damage our brand. We have previously experienced certain server outages and computer distributed denial of service attacks, and any future server outages at our data center facilities or distributed denial of service attacks may cause all or portions of our online properties to become unavailable to users. Our systems are also vulnerable to damage or interruption from natural disasters, terrorist attacks, power loss, telecommunications failures, computer viruses or other attempts to harm our systems, and one of our data centers is located in an area with a high risk of major earthquakes. Our data centers are also subject to break-ins, sabotage and intentional acts of vandalism, and to potential disruptions if the operators of these facilities have financial difficulties. Some of our systems are not fully redundant, and our disaster recovery planning is currently underdeveloped and does not account for all eventualities. The occurrence of a natural disaster, a decision to close a facility we are using without adequate notice for financial reasons or other unanticipated problems at our data centers could result in lengthy
22
interruptions in our service. Delays or interruptions in our service may cause our users, advertisers, customers and/or artists to become dissatisfied with our offerings and could adversely affect our business.
Furthermore, third-party service providers may experience an interruption in operations or cease operations for any reason. If we are unable to agree on satisfactory terms for continued data center hosting relationships, we would be forced to enter into a relationship with other service providers or assume hosting responsibilities ourselves. If we are forced to switch hosting facilities, we may not be successful in finding an alternative service provider on acceptable terms or in hosting the computer servers ourselves. We may also be limited in our remedies against these providers in the event of a failure of service. We also rely on third-parties to provide certain components of our technology platform, such as hardware and software providers, and to serve as operators for our content delivery networks, or CDNs. A failure or limitation of service or available capacity by any of these third-party providers could adversely affect our business, financial condition and results of operations.
We rely on technology infrastructure and a failure to update or maintain this technology infrastructure, or difficulty scaling and adapting our existing technology and network infrastructure to accommodate increased traffic, could adversely affect our business.
Significant portions of our content, products and services are dependent on technology infrastructure that was developed over multiple years. To be successful, our network infrastructure has to perform well and be reliable. The greater the user traffic and the greater the complexity of our products and services, the more computing power we will need. In the future, we may spend substantial amounts to purchase or lease data centers and equipment, upgrade our technology and network infrastructure to handle increased traffic on our online properties and roll out new products and services. Updating and replacing our technology infrastructure could be challenging to implement and manage, take time to test and deploy, cause us to incur substantial costs, cause us to suffer data loss, delays or interruptions in service or result in inefficiencies or operational failures. If we do not successfully update our technology and network infrastructure as needed, or if we experience inefficiencies and operational failures during such updates, the quality of our products and services and our users’ experience could decline. This could damage our reputation and lead us to lose current and potential users, advertisers, customers and artists. Failure to update our technology infrastructure as new technologies become available may also put us in a weaker position relative to a number of our key competitors. Competitors with newer technology infrastructure may have greater flexibility and be in a position to respond more quickly than us to new opportunities, which may impact our competitive position in certain markets and adversely affect our business. The costs associated with any adjustments to our technology and network infrastructure could also harm our operating results. Cost increases, loss of traffic or failure to accommodate new technologies could harm our business, revenue and financial condition.
Regulations concerning privacy and protection of data could subject us to claims or otherwise harm our business and changes in these regulations could diminish the value of our services and cause us to lose visitors and revenue.
We receive, process and store large amounts of personal data from users of our online properties, freelance professionals who provide services to us and artists who post artworks or designs on our marketplaces. When a user visits one of our websites or certain pages of our content channel customers’ websites, we use technologies, including “cookies,” to collect information related to the user, such as the user’s Internet Protocol, or IP, address, demographic information, and history of the user’s interactions with content or advertisements previously delivered by us. The information that we collect about our users helps us deliver content and advertising targeted to these users. We post privacy policies on all of our owned and operated websites that set forth our policies and practices related to the collection, use, sharing, disclosure and protection of personal data. The storing, sharing, use, disclosure and protection of personal information and user data are subject to federal, state and international privacy laws, the purpose of which is to protect the privacy of personal information that is collected, processed and transmitted in or from the governing jurisdiction. A variety of federal, state and international laws and regulations govern the collection, use, retention, sharing and security of data that we receive from and about our users. The existing privacy-related laws and regulations are evolving and subject to potentially differing interpretations. Developments related to “instant personalization” and similar technologies potentially provide publishers with broader access to, and more detailed information about, users and have led to greater scrutiny of industry data collection practices by regulators and privacy advocates. In addition, new laws may be enacted, new industry self-regulation may be promulgated, or existing laws may be amended or re-
23
interpreted, in a manner that limits our ability to analyze user data. If requirements regarding the manner in which certain personal information and other user data are processed and stored change significantly, our business may be adversely affected, impacting our financial condition and results of operations. In addition, we may be exposed to potential liabilities as a result of differing views on the level of privacy required for consumer and other user data we collect. We may also need to expend significant resources to protect against security breaches, including encrypting personal information, or remedy breaches after they occur, including notifying each person whose personal data may have been compromised and offering to provide credit monitoring services. Any failure, or perceived failure, by us or various third-party vendors and service providers to comply with applicable privacy policies or with industry standards or laws or regulations could result in a loss of consumer confidence in us, or result in actions against us by governmental entities or others, all of which could potentially cause us to lose consumers and revenue.
Third parties may sue us for intellectual property infringement or misappropriation or make similar claims which, if successful, could require us to pay significant damages, incur expenses or curtail our offerings.
We cannot be certain that our internally developed or acquired systems and technologies do not and will not infringe the intellectual property rights of others. In addition, we license content, software and other intellectual property rights from third parties and may be subject to claims of infringement or misappropriation if such parties do not possess the necessary intellectual property rights to the products or services they license to us. We have in the past and may in the future be subject to legal proceedings and claims that we have infringed the patent or other intellectual property rights of a third party. These claims sometimes involve patent holding companies or other patent owners who have no relevant product revenue and against whom our own patents may provide little or no deterrence. In addition, third parties may in the future assert intellectual property infringement claims against our customers, which we have agreed in certain circumstances to indemnify and defend against such claims. Any intellectual property-related infringement or misappropriation claims, whether or not meritorious, could result in costly litigation and could divert management resources and attention. If we are found liable for infringement or misappropriation, we may be required to enter into licensing agreements, if available on acceptable terms or at all, pay substantial damages or limit or curtail our systems and technologies. Also, any successful lawsuit against us could subject us to the invalidation of our proprietary rights. Moreover, we may need to redesign some of our systems and technologies to avoid future infringement liability. Any of the foregoing could prevent us from competing effectively and increase our costs.
Additionally, our marketplaces allow individuals to sell certain products or their original designs printed on art prints and various consumer products. On occasion, the designs or products posted to our marketplaces, including Society6 or Saatchi Art, may infringe certain copyrights or trademarks or misappropriate the right of publicity of well-known figures. As a result, we may be the subject of letters, lawsuits and takedown notices from rights holders, and the Digital Millennium Copyright Act may not provide safe-harbors for all types of infringing content hosted on these properties. Addressing these types of claims could require us to expend time and resources, which could have an adverse impact on our business and results of operations.
We also license the names “Saatchi” and “Livestrong.com” pursuant to the terms of intellectual property or licensing agreements with third parties, which may be terminated by such third parties if we do not comply with certain requirements in the agreements. If either of these licensing arrangements was terminated, we would experience business disruption and would have to incur significant resources to rebrand the relevant business, which could have an adverse impact on our business, financial condition and results of operations.
As a creator and a distributor of Internet content, we face potential liability and expenses for legal claims based on the nature and subject matter of the content that we create or distribute, or that are accessible via our online properties. If we are required to pay damages or expenses in connection with these legal claims, our business, financial condition and results of operations may be harmed.
As a creator and distributor of original content and third-party provided content, we face potential liability in the United States and abroad based on a variety of theories, including copyright or trademark infringement, defamation, right of publicity, negligence, unlawful practice of a licensed profession and other legal theories based on the nature, creation or distribution of this information, and under various laws, including the Lanham Act and the Copyright Act. We may also be exposed to similar liability in connection with content that we do not create but that is posted to our
24
online properties and to our content channel customers’ online properties by users and other third parties through forums, comments, personas and other social media features. In addition, it is also possible that visitors to our online properties or our content channel customers’ online properties could bring claims against us for losses incurred in reliance upon information provided on such online properties. These claims, regardless of their merit, could divert management time and attention away from our business and result in significant costs to investigate and defend. If we become subject to these or similar types of claims and are not successful in our defense, we may be forced to pay damages, some of which may be substantial. If the content we distribute through our online properties or our content channel customers’ online properties violates the intellectual property rights of others or gives rise to other legal claims against us, we could be subject to substantial liability, which could have a negative impact on our business, financial condition and results of operations.
Certain U.S. and foreign laws and regulations could subject us to claims or otherwise harm our business.
We are subject to a variety of laws and regulations in the U.S. and abroad that may subject us to claims or other remedies. Our failure to comply with applicable laws and regulations may subject us to additional liabilities, which could adversely affect our business, financial condition and results of operations. Laws and regulations that are particularly relevant to our business address freedom of expression; information security; privacy and data collection; pricing and fees; employment related matters; online content and the distribution of content, including liability for user reliance on such content; intellectual property rights, including secondary liability for infringement by others; product liability claims; taxation, including VAT and sales tax; and online advertising and marketing, including email marketing and unsolicited commercial email. See “ — Regulations concerning privacy and protection of data could subject us to claims or otherwise harm our business and changes in these regulations could diminish the value of our services and cause us to lose visitors and revenue.”
In the United States, Congress has adopted legislation that regulates certain aspects of the Internet, including the Communications Decency Act, the Digital Millenium Copyright Act, the Lanham Act, the CAN-SPAM Act and the Anticybersquatting Consumer Protection Act. Advertising and promotional information presented to visitors on our online properties and our other marketing activities are subject to federal and state consumer protection laws that regulate unfair and deceptive practices. Many applicable laws were adopted prior to the advent of the Internet and do not contemplate or address the unique issues of the Internet. Moreover, the applicability and scope of the laws that do address the Internet remain uncertain. For example, the laws relating to the liability of providers of online services are evolving. Claims have been either threatened or filed against us under both U.S. and foreign laws for defamation, copyright infringement, patent infringement, privacy violations, cybersquatting, trademark infringement and discrimination. In the future, claims may also be brought against us based on tort law liability and other theories based on our content, products and services or content generated by our users.
We must also comply with certain foreign and U.S. laws and regulations that apply to our international operations. Our business operations in countries outside the United States are subject to a number of U.S. federal laws and regulations, including restrictions imposed by the Foreign Corrupt Practices Act (“FCPA”) and economic and trade sanctions administered by the Office of Foreign Assets Control (“OFAC”) and the U.S. Commerce Department based on U.S. foreign policy and national security goals against targeted foreign states, organizations and individuals. The FCPA is intended to prohibit bribery of foreign officials or parties and requires public companies in the United States to keep books and records that accurately and fairly reflect those companies’ transactions. OFAC regulations prohibit U.S.-based entities from entering into or facilitating transactions with, for the benefit of, or involving the property of, persons, governments or countries designated by the U.S. government under one or more sanctions regimes, which could include transactions that provide a benefit that is received in an OFAC designated country. Additionally, some of the products and services we provide to customers globally may require approval under applicable U.S. export law.
VAT, sales and use, and similar tax laws and rates vary greatly by jurisdiction. We do not collect such taxes in every jurisdiction in which we have sales based on our belief that such taxes are not applicable. Certain jurisdictions in which we do not collect VAT, sales and use, or similar taxes on our sales may assert that such taxes are applicable, which could result in tax assessments, penalties and interest for prior periods, and a requirement to collect such taxes in the future. Such tax assessments, penalties and interest, or future requirements, including implementing products and
25
technologies to calculate, collect and remit such taxes, may materially and adversely affect our business, financial condition and operating results.
The costs of compliance with these regulations may increase in the future as a result of changes in the regulations or the interpretation of them. Further, if we fail to comply with applicable laws and regulations, we could be exposed to claims for damages, financial penalties, reputational harm, incarceration of our employees or restrictions on our operations, which could increase our costs of operations, reduce our profits or cause us to forgo opportunities that would otherwise support our growth.
Changes in state, federal or international taxation laws and regulations may adversely affect our business.
Due to the global nature of the Internet, it is possible that, although our services and the Internet transmissions related to them typically originate in Nevada and California, governments of other states or foreign countries might attempt to regulate our transmissions or levy sales, income or other taxes relating to our activities. Tax authorities at the international, federal, state and local levels are also currently reviewing the appropriate treatment of companies engaged in Internet commerce. New or revised international, federal, state or local tax regulations may subject us or our customers to additional sales, income, VAT and other taxes. We cannot predict the effect of current attempts to impose sales, income, VAT or other taxes on commerce over the Internet. New or revised taxes and, in particular, additional sales taxes or VAT, would likely increase the cost of doing business online and decrease the attractiveness of advertising and selling goods and services over the Internet. New taxes could also create significant increases in internal costs necessary to capture data and collect and remit taxes. Any of these events could have an adverse effect on our business and results of operations.
We may not succeed in expanding our businesses internationally, which may limit our future growth, and operating internationally exposes us to certain additional risks and operating costs.
One potential area of growth for our business is internationally. The artwork and designs sold through our art and design marketplaces are created by a global community of artists and sold to customers around the world. We are also exploring translating and localizing our Society6 marketplace site into certain foreign languages. We have an eHow site in the United Kingdom, as well as eHow en Español, Livestrong.com en Español and eHow Brasil (Spanish and Portuguese language sites that target both the U.S. and the worldwide Spanish/Portuguese-speaking markets). We cannot be certain that we will be successful in introducing beyond the markets we currently serve or marketing our products and services internationally or that our products and services will gain market acceptance. If we are unable to expand and market our products and services internationally, it could have a negative effect on our future growth prospects. There are also risks inherent in conducting business in international markets, including the need to localize our products and services to foreign customers’ preferences and customs, difficulties in managing operations due to language barriers, distance, staffing and cultural differences, application of foreign laws and regulations to us, tariffs and other trade barriers, fluctuations in currency exchange rates, establishing management and financial systems and infrastructures, reduced protection for intellectual property rights in some countries, changes in foreign political and economic conditions, and potentially adverse tax consequences. Operating internationally, where we have limited experience, exposes us to additional risks and operating costs that may outweigh the financial and other benefits of operating in such markets.
A reclassification by tax authorities of any freelance professionals we currently or have previously contracted with from independent contractors to employees could require us to pay retroactive taxes and penalties and significantly increase our cost of operations.
We previously contracted with freelance professionals to create the substantial majority of the content for our online properties and we continue to contract with freelance professionals for various purposes, including to develop, create and edit content, and otherwise contribute to the content creation process, for our and our content channel customers’ online properties. Because we consider the freelance professionals who we contract with or have contracted with to be independent contractors, as opposed to employees, we do not withhold federal or state income or other employment related taxes, make federal or state unemployment tax or Federal Insurance Contributions Act payments, or provide workers’ compensation insurance with respect to such freelance professionals. Our contracts with freelance professionals that are classified as
26
independent contractors obligate the freelance professionals to pay these taxes. The classification of freelance professionals as independent contractors depends on the specific facts and circumstances of each relationship. In the event of a determination by federal or state taxing authorities that any freelance professionals we engage or have engaged as independent contractors are employees, we may be adversely affected and subject to retroactive taxes and penalties. In addition, if the freelance professionals we categorize as independent contractors were deemed to be employees, our costs associated with content creation could increase significantly, we could potentially incur fines, penalties or other damages, and our financial results would be adversely affected.
Risks Relating to Owning Our Common Stock
The trading price of our common stock is likely to be volatile and an active, liquid and orderly market for our common stock may not be sustained.
The trading price of our common stock has been, and is likely to be, highly volatile and could be subject to wide fluctuations in response to various factors, some of which are beyond our control. For example, from the date of our initial public offering in January 2011 through February 24, 2016, our closing stock price, as adjusted for the Distribution and the 1-for-5 reverse stock split, has ranged from $4.05 to $48.75. As a result of the reverse stock split reducing the number of shares of our common stock that are outstanding, we may have a lower average daily trading volume, which could also lead to greater volatility in the trading price of our common stock or a less liquid market for our stock to trade. In addition, an active trading market for our common stock may not be sustained, which could depress the market price of our common stock.
In addition to the factors discussed in this “Risk Factors” section and elsewhere in this report, factors that may cause the trading price of our common stock to be volatile include:
|
· |
our operating performance and the operating performance of similar companies; |
|
· |
the overall performance of the equity markets; |
|
· |
the number of shares of our common stock publicly owned and available for trading; |
|
· |
any major change in our board of directors or management; |
|
· |
publication of research reports about us or our industries or changes in recommendations or withdrawal of research coverage by securities analysts; |
|
· |
publication of third-party reports relating to the performance of our business or certain key operating metrics; |
|
· |
large volumes of sales of our shares of common stock by existing stockholders; and |
|
· |
general political and economic conditions. |
In addition, the stock market in general, and the market for Internet-related companies in particular, has experienced extreme price and volume fluctuations that have often been unrelated or disproportionate to the operating performance of those companies. Securities class action litigation has often been instituted against companies following periods of volatility in the overall market and in the market price of a company’s securities. This litigation, if instituted against us, could result in very substantial costs, divert our management’s attention and resources and harm our business, financial condition and results of operation.
27
The large number of shares eligible for public sale or subject to rights requiring us to register them for public sale could depress the market price of our common stock.
The market price of our common stock could decline as a result of sales of a large number of shares of our common stock in the market, and the perception that these sales could occur may also depress the market price of our common stock. As of February 24, 2016, we had 20,250,726 shares of common stock outstanding (excluding shares held in treasury).
Certain stockholders owning a significant amount of our outstanding shares of common stock are party to a stockholders agreement that entitles them to require us to register shares of our common stock owned by them for public sale in the United States, subject to the restrictions of Rule 144. In addition, certain stockholders, including investors in our preferred stock that converted into common stock as well as current and former employees, are eligible to resell shares of common stock under Rule 144 and Rule 701 without registering such shares with the SEC. Sales of our common stock as restrictions end or pursuant to registration rights may make it more difficult for us to sell equity securities in the future at a time and at a price that we deem appropriate. These sales also could cause our stock price to fall and make it more difficult for shareholders to sell shares of our common stock.
In addition, as of February 24, 2016 we have over ten million shares of common stock reserved for future issuance under our equity compensation plans, of which approximately five million shares are registered under our registration statement on Form S-8 on file with the SEC. Subject to the satisfaction of applicable exercise periods, vesting requirements and, in certain cases, performance conditions, the shares of registered common stock issued upon exercise of outstanding options, vesting of future awards or pursuant to purchases under our employee stock purchase plan (the “ESPP”) will be available for immediate resale in the United States in the open market. We also have previously and may from time to time in the future issue shares of our common stock as consideration for acquisitions and investments. If any such acquisition or investment is significant, the number of shares that we may issue may in turn be significant.
Our stock repurchase program may be suspended or terminated at any time, which may result in a decrease in the trading price of our common stock.
Our board of directors previously approved a stock repurchase program under which we are authorized to repurchase up to $50.0 million of our common stock, of which approximately $19.2 million remains available as of December 31, 2015. Such stock repurchases may be limited, suspended, or terminated at any time without prior notice, and we have not repurchased any shares of our common stock since April 2013. There can be no assurance that we will repurchase additional shares of our common stock under our stock repurchase program or that any future repurchases will have a positive impact on the trading price of our common stock or earnings per share. Important factors that could cause us to limit, suspend or terminate our stock repurchase program include, among others, unfavorable market conditions, the trading price of our common stock, the nature of other investment or strategic opportunities presented to us from time to time, the rate of dilution of our equity compensation programs, the availability of adequate funds, and our ability to make appropriate, timely, and beneficial decisions as to when, how, and whether to purchase shares under the stock repurchase program. If we limit, suspend or terminate our stock repurchase program, our stock price may be negatively affected.
As a public company, we are subject to compliance initiatives that require substantial time from our management and result in significantly increased costs.
The Sarbanes-Oxley Act of 2002, the Dodd-Frank Wall Street Reform and Consumer Protection Act of 2010, and other rules implemented by the SEC and the NYSE, impose various requirements on public companies, including requirements related to certain corporate governance practices. Compliance with these rules and regulations has resulted in significantly increased costs for us as a public company than we incurred as a private company, including substantially higher costs to obtain comparable levels of director and officer liability insurance. Proposed corporate governance laws and regulations under consideration may further increase our compliance costs. If compliance with these various legal and regulatory requirements diverts our management’s attention from other business concerns, it could have a material adverse effect on our business, financial condition and results of operations. Additionally, these laws and regulations may make it more difficult for us to attract and retain qualified individuals to serve on our board of directors, on committees of our board of directors, or as executive officers.
28
We are required to make an assessment of the effectiveness of our internal controls over financial reporting in accordance with Section 404 of the Sarbanes-Oxley Act of 2002. We are also required to obtain an opinion on the effectiveness of our internal controls over financial reporting from our independent registered public accounting firm. Section 404 requires us to perform system and process evaluation and testing of our internal controls over financial reporting to allow management and our independent registered public accounting firm to report on the effectiveness of our internal controls over financial reporting for each fiscal year. Our testing, or the subsequent testing by our independent registered public accounting firm, may reveal deficiencies in our internal controls over financial reporting that are deemed to be material weaknesses. If we are unable to comply with the requirements of Section 404, management may not be able to assess whether our internal controls over financial reporting are effective, which may subject us to adverse regulatory consequences and could result in a negative reaction in the financial markets due to a loss of confidence in the reliability of our financial statements. In addition, if we fail to maintain effective controls and procedures, we may be unable to provide the required financial information in a timely and reliable manner or otherwise comply with the standards applicable to us as a public company. Any failure by us to provide the required financial information in a timely and reliable manner could materially and adversely impact our financial condition and the trading price of our securities. In addition, we may incur additional expenses and commitment of management’s time in connection with further assessments of our compliance with the requirements of Section 404, which could materially increase our operating expenses and adversely impact our results of operations.
If securities or industry analysts publish inaccurate or unfavorable research about our business, our stock price and trading volume could decline.
The trading market for our common stock will depend in part on the research and reports that securities or industry analysts publish about us or our business. If one or more of the analysts who cover us downgrade our stock or publish inaccurate or unfavorable research about our business, our stock price would likely decline. If one or more of these analysts ceases to cover us or fails to publish reports on us regularly, demand for our stock could decrease, which might cause our stock price and trading volume to decline.
We do not anticipate paying cash dividends and, accordingly, stockholders must rely on stock appreciation for any return on their investment.
We have never declared or paid cash dividends on our common stock and we do not anticipate paying cash dividends in the future. As a result, only appreciation of the price of our common stock, which may never occur, will provide a return to stockholders. Investors seeking cash dividends should not invest in our common stock.
Certain provisions in our charter documents and Delaware law could discourage takeover attempts and lead to management entrenchment.
Our amended and restated certificate of incorporation and amended and restated bylaws contain provisions that could have the effect of delaying or preventing changes in control or changes in our management without the consent of our board of directors, including, among other things:
|
· |
a classified board of directors with three-year staggered terms, which may delay the ability of stockholders to change the membership of a majority of our board of directors; |
|
· |
no cumulative voting in the election of directors, which limits the ability of minority stockholders to elect director candidates; |
|
· |
the ability of our board of directors to determine to issue shares of preferred stock and to determine the price and other terms of those shares, including preferences and voting rights, without stockholder approval, which could be used to significantly dilute the ownership of a hostile acquiror; |
|
· |
the exclusive right of our board of directors to elect a director to fill a vacancy created by the expansion of our board of directors or the resignation, death or removal of a director, which prevents stockholders from being able to fill vacancies on our board of directors; |
29
|
· |
a prohibition on stockholder action by written consent, which forces stockholder action to be taken at an annual or special meeting of our stockholders; |
|
· |
the requirement that a special meeting of stockholders may be called only by the chairman of our board of directors, the Chief Executive Officer, the president (in absence of a Chief Executive Officer) or our board of directors, which may delay the ability of our stockholders to force consideration of a proposal or to take action, including the removal of directors; |
|
· |
the requirement for the affirmative vote of holders of at least 66 2/3% of the voting power of all of the then outstanding shares of the voting stock, voting together as a single class, to amend the provisions of our amended and restated certificate of incorporation relating to the issuance of preferred stock and management of our business or our amended and restated bylaws, which may inhibit the ability of an acquiror from amending our certificate of incorporation or bylaws to facilitate a hostile acquisition; |
|
· |
the ability of our board of directors, by majority vote, to amend the bylaws, which may allow our board of directors to take additional actions to prevent a hostile acquisition and inhibit the ability of an acquiror from amending the bylaws to facilitate a hostile acquisition; and |
|
· |
advance notice procedures that stockholders must comply with in order to nominate candidates to our board of directors or to propose matters to be acted upon at a stockholders’ meeting, which may discourage or deter a potential acquiror from conducting a solicitation of proxies to elect the acquiror’s own slate of directors or otherwise attempting to obtain control of us. |
We are also subject to certain anti-takeover provisions under Delaware law. Under Delaware law, a corporation may not, in general, engage in a business combination with any holder of 15% or more of its capital stock unless the holder has held the stock for three years or, among other things, our board of directors has approved the transaction.
Item 1B.Unresolved Staff Comments
None.
We do not own any real estate. We currently occupy approximately 52,000 square feet in a Santa Monica, California facility that serves as our corporate headquarters and houses nearly all of our personnel for both our Content & Media and Marketplaces service offerings. The lease for our Santa Monica facility expires in July 2024, provided that we have a one-time early termination right allowing us to terminate the lease effective as of August 2019. Our primary data center is located in Las Vegas, Nevada. We believe that our current data centers and offices will be adequate for the foreseeable future.
From time to time we are a party to various legal matters incidental to the conduct of our business. Certain of our outstanding legal matters include speculative claims for indeterminate amounts of damages. We record a liability when we believe that it is probable that a loss has been incurred and the amount can be reasonably estimated. Based on our current knowledge, we do not believe that there is a reasonable possibility that the final outcome of the pending or threatened legal proceedings to which we are a party, either individually or in the aggregate, will have a material adverse effect on our future financial results. However, the outcome of such legal matters is subject to significant uncertainties.
Item 4.Mine Safety Disclosures
Not applicable.
30
Item 5. Market for Registrant’s Common Equity, Related Stockholder Matters and Issuer Purchases of Equity Securities
Market Information
Our common stock is listed and traded on the New York Stock Exchange (the “NYSE”) under the symbol “DMD”. The following table sets forth, for the periods indicated and on a per-share basis, the high and low daily closing sales prices of our common stock as reported by the NYSE, as adjusted for the 1-for-5 reverse stock split that we effected on August 1, 2014.
|
|
|
|
|
|
|
|
|
|
|
|
High |
|
Low |
|
||
|
Fiscal Year end December 31, 2015 |
|
|
|
|
|
|
|
|
First Quarter |
|
$ |
6.14 |
|
$ |
4.05 |
|
|
Second Quarter |
|
$ |
6.78 |
|
$ |
5.10 |
|
|
Third Quarter |
|
$ |
6.35 |
|
$ |
4.08 |
|
|
Fourth Quarter |
|
$ |
6.14 |
|
$ |
4.15 |
|
|
|
|
|
|
|
|
|
|
|
|
|
High |
|
Low |
|
||
|
Fiscal Year end December 31, 2014 |
|
|
|
|
|
|
|
|
First Quarter |
|
$ |
11.88 |
|
$ |
8.99 |
|
|
Second Quarter |
|
$ |
10.40 |
|
$ |
7.36 |
|
|
Third Quarter |
|
$ |
11.10 |
|
$ |
8.77 |
|
|
Fourth Quarter |
|
$ |
8.86 |
|
$ |
5.28 |
|
Holders of Record
As of February 24, 2016, our common stock was held by 44 stockholders of record. A substantially greater number of holders of our common stock are “street name” holders, or beneficial holders, whose shares are held of record by banks, brokers and other financial institutions.
Dividend Policy
We have never declared or paid cash dividends on our common stock. We currently do not anticipate paying any cash dividends in the foreseeable future. Instead, we anticipate that all of our earnings will be used to provide working capital, to support our operations and to finance the growth and development of our business. Any future determination to declare cash dividends will be made at the discretion of our board of directors and will depend on our financial condition, results of operations, capital requirements, general business conditions and other factors that our board of directors may deem relevant.
31
Performance Graph
The following performance graph shall not be deemed “filed” for purposes of Section 18 of the Securities Exchange Act of 1934, as amended (the “Exchange Act”), or incorporated by reference into any filing of Demand Media under the Securities Act of 1933, as amended, or the Exchange Act, except as shall be expressly set forth by specific reference in such filing.
The graph compares the cumulative total return of our common stock for the period starting on January 26, 2011, the date of our initial public offering, and ending on December 31, 2015, with that of the S&P 500 Index and RDG Internet Composite Index over the same period. The graph assumes that the value of the investment was $100 on January 26, 2011, and that all dividends and other distributions were reinvested. Such returns are based on historical results and are not intended to suggest future performance.
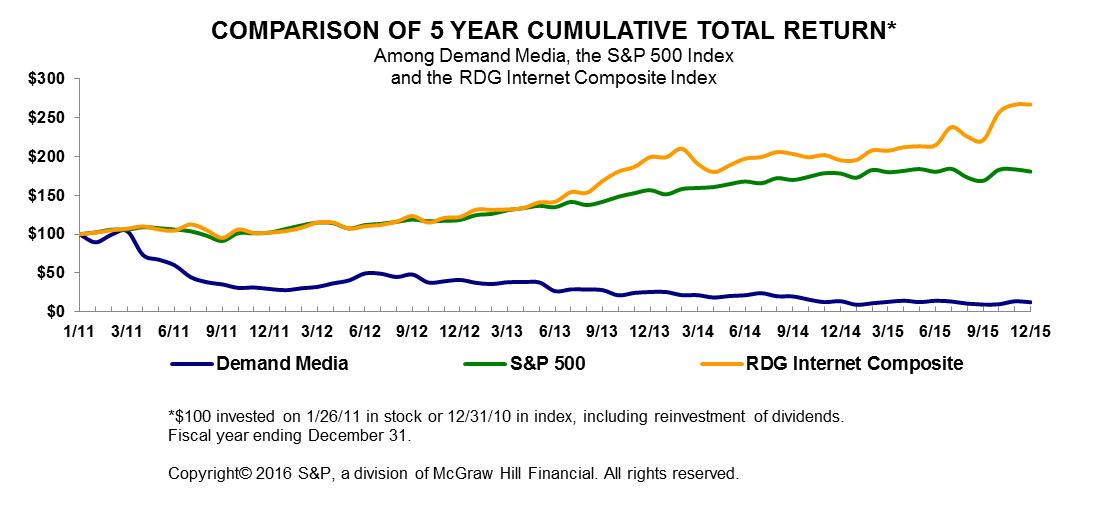
Unregistered Sales of Equity Securities and Use of Proceeds
We did not issue or sell any equity securities that were not registered under the Securities Act of 1933 during the three months ended December 31, 2015.
Purchases of Equity Securities by the Issuer and Affiliated Purchasers
Under the stock repurchase plan announced on August 19, 2011 and further increased on February 8, 2012, we are authorized to repurchase up to $50 million of our common stock (of which approximately $19.2 million remains available as of December 31, 2015) from time to time in open market purchases or in negotiated transactions. The stock repurchase plan has no expiration date and such stock repurchases may be limited, suspended, or terminated at any time without prior notice. We did not repurchase any of our common stock during the three months ended December 31, 2015 and have not repurchased any shares of our common stock since April 2013.
32
Item 6. Selected Financial Data
The consolidated statement of operations data for the years ended December 31, 2015, 2014 and 2013, as well as the consolidated balance sheet data as of December 31, 2015 and 2014, are derived from our audited consolidated financial statements that are included elsewhere in this Annual Report on Form 10-K. The consolidated statement of operations data for the years ended December 31, 2012 and 2011, as well as the consolidated balance sheet data as of December 31, 2013, 2012 and 2011, are derived from audited consolidated financial statements not included in this Annual Report on Form 10-K. The historical results presented below are not necessarily indicative of financial results to be achieved in future periods.
The following selected consolidated financial data should be read in conjunction with “Item 7. Management’s Discussion and Analysis of Financial Condition and Results of Operations” and our consolidated financial statements and the related notes included elsewhere in this Annual Report on Form 10-K.
|
|
|
Year ended December 31, |
|
|||||||||||||
|
|
|
2015 |
|
2014(1) |
|
2013(1) |
|
2012(1) |
|
2011(1) |
|
|||||
|
|
|
(In thousands, except per share data) |
|
|||||||||||||
|
Consolidated Statement of Operations: |
|
|
|
|
|
|
|
|
|
|
|
|
|
|
|
|
|
Total revenue |
|
$ |
125,969 |
|
$ |
172,429 |
|
$ |
209,411 |
|
$ |
207,640 |
|
$ |
164,307 |
|
|
Operating expenses: |
|
|
|
|
|
|
|
|
|
|
|
|
|
|
|
|
|
Service costs (exclusive of amortization of intangible assets) |
|
|
37,289 |
|
|
43,325 |
|
|
51,274 |
|
|
54,304 |
|
|
45,360 |
|
|
Product costs |
|
|
33,769 |
|
|
26,058 |
|
|
9,882 |
|
|
— |
|
|
— |
|
|
Sales and marketing |
|
|
20,319 |
|
|
20,046 |
|
|
36,275 |
|
|
38,948 |
|
|
31,978 |
|
|
Product development |
|
|
24,313 |
|
|
29,387 |
|
|
32,185 |
|
|
31,190 |
|
|
29,024 |
|
|
General and administrative |
|
|
38,344 |
|
|
50,179 |
|
|
53,014 |
|
|
54,082 |
|
|
52,491 |
|
|
Goodwill impairment charge(2) |
|
|
— |
|
|
232,270 |
|
|
— |
|
|
— |
|
|
— |
|
|
Amortization of intangible assets |
|
|
18,706 |
|
|
38,316 |
|
|
36,519 |
|
|
32,402 |
|
|
37,665 |
|
|
Total operating expenses |
|
|
172,740 |
|
|
439,581 |
|
|
219,149 |
|
|
210,926 |
|
|
196,518 |
|
|
Loss from operations |
|
|
(46,771) |
|
|
(267,152) |
|
|
(9,738) |
|
|
(3,286) |
|
|
(32,211) |
|
|
Interest income |
|
|
361 |
|
|
328 |
|
|
5 |
|
|
31 |
|
|
48 |
|
|
Interest expense |
|
|
(143) |
|
|
(4,692) |
|
|
(1,642) |
|
|
(622) |
|
|
(861) |
|
|
Other income (expense), net |
|
|
3,107 |
|
|
654 |
|
|
13 |
|
|
(36) |
|
|
(385) |
|
|
Loss from continuing operations before income taxes |
|
|
(43,446) |
|
|
(270,862) |
|
|
(11,362) |
|
|
(3,913) |
|
|
(33,409) |
|
|
Income tax (expense) benefit(2) |
|
|
(55) |
|
|
14,713 |
|
|
(2,856) |
|
|
(951) |
|
|
(2,181) |
|
|
Net loss from continuing operations |
|
|
(43,501) |
|
|
(256,149) |
|
|
(14,218) |
|
|
(4,864) |
|
|
(35,590) |
|
|
Net income (loss) from discontinued operations(3) |
|
|
— |
|
|
(11,208) |
|
|
(5,956) |
|
|
11,040 |
|
|
17,066 |
|
|
Net income (loss) |
|
|
(43,501) |
|
|
(267,357) |
|
|
(20,174) |
|
|
6,176 |
|
|
(18,524) |
|
|
Cumulative preferred stock dividends(4) |
|
|
— |
|
|
— |
|
|
— |
|
|
— |
|
|
(2,477) |
|
|
Net income (loss) attributable to common stockholders |
|
$ |
(43,501) |
|
$ |
(267,357) |
|
$ |
(20,174) |
|
$ |
6,176 |
|
$ |
(21,001) |
|
|
|
|
|
|
|
|
|
|
|
|
|
|
|
|
|
|
|
|
Earnings per share - basic and diluted |
|
|
|
|
|
|
|
|
|
|
|
|
|
|
|
|
|
Net loss from continuing operations |
|
$ |
(2.18) |
|
$ |
(13.66) |
|
$ |
(0.80) |
|
$ |
(0.28) |
|
$ |
(2.42) |
|
|
Net income (loss) from discontinued operations |
|
|
— |
|
|
(0.60) |
|
|
(0.34) |
|
|
0.65 |
|
|
1.09 |
|
|
Net income (loss) per share - basic |
|
|
(2.18) |
|
|
(14.26) |
|
|
(1.14) |
|
|
0.37 |
|
|
(1.33) |
|
|
Net income (loss) per share - diluted |
|
$ |
(2.18) |
|
$ |
(14.26) |
|
$ |
(1.14) |
|
$ |
0.35 |
|
$ |
(1.33) |
|
|
|
|
|
|
|
|
|
|
|
|
|
|
|
|
|
|
|
|
Weighted average number of shares - basic (5)(6)(7) |
|
|
19,938 |
|
|
18,745 |
|
|
17,707 |
|
|
16,910 |
|
|
15,729 |
|
|
Weighted average number of shares - diluted (5)(6)(7) |
|
|
19,938 |
|
|
18,745 |
|
|
17,707 |
|
|
17,447 |
|
|
15,729 |
|
|
(1) |
We completed one business acquisition during the year ended December 31, 2014, two business acquisitions during the year ended December 31, 2013, one business acquisition during the year ended December 31, 2012, and four business acquisitions during the year ended December 31, 2011. |
33
|
(2) |
During the year ended December 31, 2014, we recorded a pretax impairment charge of $232.3 million on the carrying value of our goodwill based on the results of an interim assessment of impairment of the goodwill in our content and media reporting unit. This resulted in a reduction of tax amortization of goodwill from the impairment of goodwill and the corresponding valuation allowance. |
|
(3) |
Discontinued operations for the periods presented relate to the reclassification of the Rightside operations to discontinued operations during 2014. |
|
(4) |
In connection with our initial public offering, all shares of our convertible preferred stock converted into shares of common stock and warrants. |
|
(5) |
In October 2010, our stockholders approved a 1-for-2 reverse stock split of our outstanding common stock, and a proportional adjustment to the existing conversion ratios for each series of preferred stock, which was effected in January 2011. |
|
(6) |
In June 2014, our stockholders approved a 1-for-5 reverse stock split of our outstanding common stock, which was effected in August 2014. Accordingly, all share and per share amounts for all periods presented prior to the 1-for-5 reverse stock split have been adjusted retrospectively, where applicable, to reflect this reverse stock split. |
|
(7) |
Basic net income (loss) per share is computed by dividing the net income (loss) attributable to common stockholders by the weighted average number of common shares outstanding during the period. For the year ended December 31, 2011, net loss attributable to common stockholders is increased for cumulative preferred stock dividends earned during these periods. For the periods where we presented losses, all potentially dilutive common shares comprised of stock options, restricted stock units, warrants and convertible preferred stock are antidilutive. Restricted stock units are considered outstanding common shares and included in the computation of basic earnings per share as of the date that all necessary conditions of vesting are satisfied. Restricted stock units are excluded from the diluted earnings per share calculation when their impact is antidilutive. Prior to satisfaction of all conditions of vesting, unvested restricted stock units are considered contingently issuable shares and are excluded from weighted average common shares outstanding. |
|
|
|
December 31, |
|
|||||||||||||
|
|
|
2015 |
|
2014 |
|
2013 |
|
2012 |
|
2011 |
|
|||||
|
|
|
(In thousands) |
|
|||||||||||||
|
Consolidated Balance Sheet Data: |
|
|
|
|
|
|
|
|
|
|
|
|
|
|
|
|
|
Cash and cash equivalents and marketable securities |
|
$ |
38,570 |
|
$ |
47,820 |
|
$ |
153,511 |
|
$ |
102,933 |
|
$ |
86,035 |
|
|
Working capital |
|
$ |
33,953 |
|
$ |
37,215 |
|
$ |
91,048 |
|
$ |
67,215 |
|
$ |
44,617 |
|
|
Total assets |
|
$ |
101,459 |
|
$ |
149,555 |
|
$ |
777,088 |
|
$ |
637,997 |
|
$ |
590,103 |
|
|
Long-term debt |
|
$ |
— |
|
$ |
— |
|
$ |
96,250 |
|
$ |
— |
|
$ |
— |
|
|
Capital lease obligations, long-term |
|
$ |
— |
|
$ |
— |
|
$ |
61 |
|
$ |
793 |
|
$ |
— |
|
|
Total stockholders' equity |
|
$ |
79,120 |
|
$ |
114,842 |
|
$ |
496,005 |
|
$ |
472,191 |
|
$ |
440,266 |
|
Non-GAAP Financial Measures
To provide investors and others with additional information regarding our financial results, we have disclosed in the table below adjusted earnings before interest, taxes, depreciation and amortization expense, or Adjusted EBITDA. We have provided a reconciliation of this non-GAAP financial measure to net income (loss), the most directly comparable GAAP financial measure. Our Adjusted EBITDA financial measure differs from GAAP net income (loss) in that it excludes net income (loss) from discontinued operations, as well as net interest expense, income tax expense (benefit), and certain other non-cash or non-recurring items impacting net income (loss) from time to time, principally comprised of depreciation and amortization, stock-based compensation and, in fiscal 2014, goodwill impairment.
Adjusted EBITDA is one of the primary measures used by our management and board of directors to understand and evaluate our financial performance and operating trends, including period-to-period comparisons, because it excludes certain expenses that management believes are not indicative of our core operating results. Management believes that the exclusion of these expenses provides a useful measure for period-to-period comparisons of our underlying core revenue and operating costs that is focused more closely on the current costs necessary to operate our businesses and reflects our ongoing business in a manner that allows for meaningful analysis of trends. In addition, management believes that excluding certain non-cash charges can be useful because the amount of such expenses is the result of long-term investment decisions in previous periods rather than day-to-day operating decisions. Adjusted EBITDA is also one of the primary measures management uses to prepare and update our short and long term financial and operational plan and to evaluate investment decisions. We also frequently use Adjusted EBITDA in our discussions with investors, commercial bankers and other users of our financial statements.
Accordingly, we believe that Adjusted EBITDA provides useful information to investors and others in understanding and evaluating our consolidated revenue and operating results in the same manner as our management and in comparing financial results across accounting periods and to those of our peer companies. However, the use of non-GAAP financial measures has certain limitations because they do not reflect all items of income and expense that affect our operations. We compensate for these limitations by reconciling non-GAAP financial measures to the most
34
comparable GAAP financial measures. Further, non-GAAP financial measures do not have standardized meanings, and therefore other companies, including peer companies, may use the same or similarly named measures but exclude different items or use different computations, so comparability may be limited. Non-GAAP financial measures should be considered in addition to, and not as a substitute for, measures prepared in accordance with GAAP. We encourage investors and others to review our financial information in its entirety and not rely on a single financial measure.
The following table presents a reconciliation of Adjusted EBITDA for each of the periods presented (in thousands):
|
|
|
Year ended December 31, |
|
|
|||||||||||||
|
|
|
2015 |
|
2014 |
|
2013 |
|
2012 |
|
2011 |
|
|
|||||
|
Net income (loss) |
|
$ |
(43,501) |
|
$ |
(267,357) |
|
$ |
(20,174) |
|
$ |
6,176 |
|
$ |
(18,524) |
|
|
|
Less: Net income (loss) from discontinued operations, net of taxes |
|
|
— |
|
|
(11,208) |
|
|
(5,956) |
|
|
11,040 |
|
|
17,066 |
|
|
|
Net loss from continuing operations |
|
|
(43,501) |
|
|
(256,149) |
|
|
(14,218) |
|
|
(4,864) |
|
|
(35,590) |
|
|
|
Add (deduct): |
|
|
|
|
|
|
|
|
|
|
|
|
|
|
|
|
|
|
Income tax (benefit) expense |
|
|
55 |
|
|
(14,713) |
|
|
2,856 |
|
|
951 |
|
|
2,181 |
|
|
|
Interest and other (income) expense, net |
|
|
(3,325) |
|
|
3,710 |
|
|
1,624 |
|
|
627 |
|
|
1,198 |
|
|
|
Depreciation and amortization(1) |
|
|
29,884 |
|
|
50,567 |
|
|
50,976 |
|
|
47,420 |
|
|
53,349 |
|
|
|
Stock-based compensation(2) |
|
|
7,562 |
|
|
18,866 |
|
|
22,603 |
|
|
27,189 |
|
|
25,951 |
|
|
|
Goodwill impairment charge |
|
|
— |
|
|
232,270 |
|
|
— |
|
|
— |
|
|
— |
|
|
|
Acquisition and realignment costs(3) |
|
|
2,488 |
|
|
2,905 |
|
|
529 |
|
|
110 |
|
|
2,048 |
|
|
|
Adjusted EBITDA |
|
$ |
(6,837) |
|
$ |
37,456 |
|
$ |
64,370 |
|
$ |
71,433 |
|
$ |
49,137 |
|
|
|
(1) |
Represents depreciation expense of our long-lived tangible assets and amortization expense of our finite-lived intangible assets, including amortization expense related to our investment in media content assets, included in our GAAP results of operations. Amortization expense for the years ended December 31, 2015, 2014, 2013, 2012 and 2011 includes $3.4 million, $7.7 million, $3.1 million, $2.1 million and $5.9 million, respectively, of accelerated non-cash amortization expense associated with the removal of certain media content intangible assets from service during those years. |
|
(2) |
Represents the fair value of stock-based awards and certain warrants to purchase our stock included in our GAAP results of operations. |
|
(3) |
Acquisition and realignment costs include such items, when applicable, as (a) non-cash GAAP purchase accounting adjustments for certain deferred revenue costs, (b) legal, accounting and other professional service fees directly attributable to acquisition or corporate realignment activities, (c) employee severance payments attributable to corporate realignment activities, and (d) expenditures related to the separation of Demand Media into two distinct publicly traded companies. Management does not consider these costs to be indicative of our core operating results. |
35
Item 7. Management’s Discussion and Analysis of Financial Condition and Results of Operations
The following discussion and analysis of our financial condition and results of operations should be read in conjunction with Part II, Item 6, “Selected Financial Data” and our consolidated financial statements included elsewhere in this Annual Report on Form 10-K. In addition to historical data, this discussion contains forward-looking statements about our business, operations and financial performance based on current expectations that involve risks, uncertainties and assumptions. Our actual results may differ materially from those discussed in the forward-looking statements as a result of various factors, including but not limited to those discussed in “Special Note Regarding Forward-Looking Statements” and Item I, Part 1A, “Risk Factors” included elsewhere in this Annual Report on Form 10-K.
Overview
We are a diversified Internet company that builds platforms across its media and marketplaces properties to enable communities of creators to reach passionate audiences in large and growing lifestyle categories. Our business is comprised of two service offerings: Content & Media and Marketplaces.
Content & Media
Our Content & Media service offering includes our leading owned and operated online properties that publish media content, including text articles, videos, photographs and designed visual formats. This content is published across several key categories on eHow, a do-it-yourself and how-to reference destination; Livestrong.com, a health and healthy living destination; Cracked, a humor site offering original and engaging comedy-driven video series, text articles and blogs; and certain other niche properties focused on specific interests. Additionally, our studioD business develops and executes content marketing strategies and creates custom content for third-party brands, advertisers and publishers.
Our Content & Media service offering derives the majority of its revenue from the sale of advertising on our online properties. Our advertising revenue is principally dependent on the number of visits to our properties and the corresponding ad unit rates. Since 2011, the total number of visits to our properties, particularly eHow, has substantially declined due to lower search engine referrals resulting from ongoing changes to search engine algorithms by Google, Yahoo! and Bing, as well as our decision to remove low quality and duplicative content. We have also experienced lower ad monetization due to industry declines in cost-per-click ad rates and our decision to reduce the number of ads per page on certain articles. In addition, visits across our online properties continue to shift from desktop to mobile, with ad unit rates for mobile generally lower than desktop. Future changes to search engine algorithms that negatively impact the volume of referral traffic, declines in ad unit rates, or increased availability of ad blocking software, particularly on mobile devices, could result in a material adverse effect to our business and results of operations.
We believe that there are opportunities to increase the number of visits to our online properties, both from direct visits by users and search engine referrals, by building high-quality products that provide a better user experience and lead to increased engagement. Since 2013, we have focused our efforts on redesigning our websites; refining our content library; rationalizing ad unit density; and developing a greater variety of content formats, particularly formats better suited for mobile devices. We have also recently started a new initiative to work with a network of contributors and influencers to create more authoritative and engaging content. These changes could negatively impact revenue and increase our operating expenses in the near term, but we believe that by providing consumers with an improved user and content experience, we will be able to increase the number of visits and revenue in a sustained fashion over the long-term. We also believe there are opportunities to increase our advertising revenue by optimizing our ad product stack and increasing branded ad sales through direct sellers and by offering more innovative products such as native advertisements and sponsored ad placements. However, if the overall ad unit rates we receive continue to decline, we could experience lower advertising revenue even if the number of visits to our properties increases.
Historically, the majority of our advertising revenue has been generated by our relationship with Google. While Google continues to be our primary ad vendor for ad monetization, in 2015 we began to significantly diversify our monetization partners and will continue to do so going forward. Google also serves as one of our primary technology
36
platform partners in connection with our programmatic ad sales offering. Any change in the type of services that Google provides to us, or to the terms of our agreements with Google, could adversely impact our results of operations.
Marketplaces
Through our Marketplaces service offering, we operate two leading art and design marketplaces where large communities of artists can market and sell their original artwork or their original designs printed on a wide variety of products. Society6 provides artists with an online commerce platform to feature and sell their original designs on a wide variety of consumer and home décor products such as art prints, phone and tablet cases, t-shirts and throw pillows. Saatchi Art is an online art gallery featuring a wide selection of original paintings, drawings, sculptures and photography that provides a global community of artists a curated environment in which to exhibit and sell their work directly to customers around the world.
Our Marketplaces service offering generates revenue from the sale of products and services through our art and design marketplaces. On Society6, revenue is generated from the sale of print-on-demand products. Saatchi Art primarily generates revenue through commissions on the final sale price of original works of art. Our Marketplaces service offering is principally dependent on the number of transactions and average revenue per transaction generated by products and services sold through our online marketplaces. We believe there are opportunities to increase the number of transactions and the average revenue per transaction by attracting new visitors to our marketplaces via diverse online and offline marketing, improving conversion of visitors to purchasing customers, continuing to introduce new products, and offering product bundling and other promotions.
The revenue generated by our Marketplaces service offering has higher costs associated with it as compared to our Content & Media service offering due to variable product costs, including outsourced product manufacturing costs, artist royalties, marketing costs, and shipping and handling costs. During the year ended December 31, 2015, a higher percentage of our total revenue was generated by our Marketplaces service offering as compared to the prior year. If our revenue sources continue to shift from our Content & Media service offering to our Marketplaces service offering, our total costs relative to our revenue will be negatively impacted.
Separation
On August 1, 2014, we completed the separation of Rightside Group, Ltd. (“Rightside”) from Demand Media, Inc., resulting in two independent, publicly traded companies (hereinafter referred to as the “Separation”). Following the Separation, Rightside operates our former domain name services business, while we continue to own and operate our Content & Media and Marketplaces businesses. The Separation was structured as a pro rata tax-free dividend involving the distribution of all outstanding shares of Rightside common stock to holders of Demand Media common stock as of the August 1, 2014 record date (the “Distribution”). Immediately following the Distribution, we completed a 1-for-5 reverse stock split of our outstanding and treasury shares of common stock. The financial results of Rightside are presented as discontinued operations in our consolidated statements of operations for all periods prior to fiscal 2015 in this Annual Report on Form 10-K. Unless it is disclosed, all financial results represent continuing operations.
Revenue
For the years ended December 31, 2015, 2014 and 2013, we reported revenue of $126.0 million, $172.4 million and $209.4 million, respectively. For the years ended December 31, 2015, 2014 and 2013, our Content & Media revenue accounted for 59%, 79% and 93% of our total revenue, respectively, and our Marketplaces revenue accounted for 41%, 21% and 7% of our total revenue, respectively.
Key Business Metrics
We regularly review a number of business metrics, including the following key metrics, to evaluate our business, measure the performance of our business model, identify trends impacting our business, determine resource allocations, formulate financial projections and make strategic business decisions. Measures which we believe are the primary indicators of our performance are as follows:
37
Content & Media Metrics
|
· |
Visits: We define visits as the total number of times users access our content across (a) one of our owned and operated online properties and/or (b) one of our customers’ online properties, to the extent that the visited customer web pages are hosted by our content services. In each case, breaks of access of at least 30 minutes constitute a unique visit. |
|
· |
Revenue per visit (“RPV”): We define RPV as Content & Media revenue per one thousand visits. |
Marketplaces Metrics
|
· |
Number of transactions: We define transactions as the total number of successfully completed transactions during the applicable period. |
|
· |
Average revenue per transaction: We calculate average revenue per transaction by dividing Marketplaces revenue for a period by the number of transactions in that period. |
The following table sets forth our key business metrics for the periods presented:
|
|
|
|
|
|
|
|
|
|
|
|
|
|
|
|
|
|
|
|
|
|
|
|
|
|
|
|
|
|
% Change |
|
|
% Change |
|
|
|
|
|
2015 |
|
2014 |
|
2013 |
|
2015 |
|
|
2014 |
|
|
|||
|
Content & Media Metrics(1): |
|
|
|
|
|
|
|
|
|
|
|
|
|
|
|
|
|
Visits (in thousands) |
|
|
3,374,385 |
|
|
4,004,287 |
|
|
4,031,514 |
|
(16) |
% |
|
(1) |
% |
|
|
Revenue per Visit |
|
$ |
21.87 |
|
$ |
34.22 |
|
$ |
48.39 |
|
(36) |
% |
|
(29) |
% |
|
|
Marketplaces Metrics(1): |
|
|
|
|
|
|
|
|
|
|
|
|
|
|
|
|
|
Number of Transactions |
|
|
925,111 |
|
|
715,343 |
|
|
277,442 |
|
29 |
% |
|
158 |
% |
|
|
Average Revenue per Transaction |
|
$ |
56.38 |
|
$ |
49.47 |
|
$ |
51.65 |
|
14 |
% |
|
(4) |
% |
|
|
(1) |
For a discussion of these period-to-period changes in the number of visits, RPV, number of transactions and average revenue per transaction and how they impacted our financial results, see “Results of Operations” below. |
Basis of Presentation
Revenue
Our revenue is primarily derived from sales of advertising and from products and services sold through our online marketplaces.
Service Revenue
Content & Media
We generate Content & Media service revenue primarily from advertisements displayed on our online properties and on certain webpages of our content channel customers’ online properties that are hosted by our content services. Articles, videos and other forms of content generate advertising revenue from a diverse mix of advertising methods including performance-based cost-per-click advertising, in which an advertiser pays only when a visitor clicks on an advertisement; display advertisements, where revenue is dependent upon the number of advertising impressions delivered; native advertisements, which are advertisements created to match the form and function of the platform on which they appear; sponsored content; or advertising links. At times we enter into revenue-sharing arrangements with our customers, and if we are considered the primary obligor, we report the underlying revenue on a gross basis in our consolidated statements of operations and record the revenue-sharing payments to our customers in service costs.
38
We also generate Content & Media service revenue from the sale or license of media content, including the creation and distribution of content for third-party brands, advertisers and publishers through our studioD business. Revenue from the sale or perpetual license of media content is recognized when the content has been delivered and the contractual performance obligations have been fulfilled. Revenue from the non-perpetual license of media content is recognized over the period of the license as content is delivered or when other related performance criteria are fulfilled. In circumstances where we distribute our content on third-party properties and the customer acts as the primary obligor, we recognize revenue on a net basis. In addition, we previously provided social media services and generated Content & Media service revenue from recurring management support fees, overage fees in excess of standard usage terms, outside consulting fees and initial set-up fees. As of February 2015, we no longer provide social media services.
Marketplaces
We generate service revenue from commissions we receive from facilitating the sale of original art by artists to customers through Saatchi Art. We recognize service revenue arising from the sale of original art net of amounts paid to the artist because we are not the primary obligor in the transaction, we do not have inventory risk, and we do not establish the prices for the art sold. We also recognize this service revenue net of any sales allowances. Revenue is recognized after the original art has been delivered and the return period has expired. Payments received in advance of delivery and completion of the return period are included in deferred revenue in the accompanying consolidated balance sheets. We periodically provide incentive offers to customers to encourage purchases, including percentage discounts off current purchases, free shipping and other offers. Value-added taxes (“VAT”), sales tax and other taxes are not included in Marketplaces service revenue because we are a pass-through conduit for collecting and remitting any such taxes.
Product Revenue
We recognize product revenue from sales of Society6 products upon delivery, net of estimated returns based on historical experience. Product revenue for Society6 is recognized net of sales allowances and return allowances. We recognize product revenue from the sale of prints through Saatchi Art when the prints are delivered and the return period has expired. Payments received in advance of delivery and, with respect to the Saatchi Art prints, prior to completion of the return period are included in deferred revenue in the accompanying consolidated balance sheets. Product revenue is recorded at the gross amount due to the following factors: we are the primary obligor in a transaction, we have inventory and credit risk, and we have latitude in establishing prices and selecting suppliers. We periodically provide incentive offers to customers to encourage purchases, including percentage discounts off current purchases, free shipping and other offers. VAT, sales tax and other taxes are not included in product revenue because we are a pass-through conduit for collecting and remitting any such taxes.
Service Costs
Service costs consist of payments relating to our Internet connection and co-location charges and other platform operating expenses, including depreciation of the systems and hardware used to build and operate our content creation and distribution platform; expenses related to creating, rewriting, or auditing certain content units; and personnel costs related to in-house editorial, customer service and information technology. Service costs also include payments to our customers pursuant to revenue-sharing arrangements where we are the primary obligor. In the near term, we expect service costs to decrease as a percentage of revenue primarily as a result of lower personnel and information technology expenses.
Product Costs
Product costs consist of outsourced product manufacturing costs, artist royalties, and personnel costs. In the near term, we expect our product costs to remain relatively flat as a percentage of product revenue.
Shipping and Handling
Shipping and handling charged to customers are recorded in service revenue or product revenue, as applicable. Associated costs are recorded in service costs or product costs.
39
Sales and Marketing
Sales and marketing expenses consist primarily of sales and marketing personnel costs, sales support, public relations, advertising, marketing and general promotional expenditures. Fluctuations in our sales and marketing expenses are generally the result of our efforts to drive growth in our product and service offerings. We currently anticipate that our sales and marketing expenses will increase in the near term as a percentage of revenue as we grow our marketing activities across all our platforms, especially our studioD and Marketplaces offerings.
Product Development
Product development expenses consist primarily of expenses incurred in our software engineering, product development and web design activities and related personnel costs. Fluctuations in our product development expenses are generally the result of hiring personnel to support and develop our platforms, including the costs to improve our owned and operated online properties and related mobile applications, as well as the costs to develop future product and service offerings. We currently anticipate that our product development expenses will remain relatively flat in the near term as a percentage of revenue.
General and Administrative
General and administrative expenses consist primarily of personnel costs from our executive, legal, finance, human resources and information technology organizations and facilities related expenditures, as well as third-party professional fees and insurance. Professional fees are largely comprised of outside legal, audit and information technology consulting. We currently anticipate that general and administrative expenses will decrease in the near term as a percentage of revenue due to managed reduction of expenses.
Amortization of Intangible Assets
We capitalize certain costs (i) allocated to the purchase price of certain identifiable intangible assets acquired in connection with business combinations and (ii) incurred to develop media content that is determined to have a probable economic benefit. We amortize these costs on a straight-line basis over the related expected useful lives of these assets. We determine the appropriate useful life of intangible assets by performing an analysis of expected cash flows based on our historical experience of intangible assets of similar quality and value. In the event of content remediation in future periods, additional accelerated amortization expense may be incurred in the periods such actions occur. We expect amortization expense related to business combinations to decrease in the near term due to fewer acquisitions as compared to prior years. Amortization as a percentage of revenue will depend upon a variety of factors, such as the amounts and mix of our investments in content and identifiable intangible assets acquired in business combinations.
Goodwill
We test goodwill for impairment in the fourth quarter of each year unless there are interim indicators that suggest that it is more likely than not that goodwill may be impaired. Goodwill is tested at the reporting unit level and as of December 31, 2015 we determined that we have two reporting units: content and media and marketplaces. We did not record any goodwill impairment charges for the year ended December 31, 2015. We may be required to record impairment charges on our remaining goodwill in future periods. For the year ended December 31, 2014, due to unexpected revenue declines attributed to lower traffic and monetization yields on certain of our content and media websites, we lowered our future cash flow expectations. As a result, we performed an interim assessment of impairment of the goodwill in our content and media reporting unit in the third quarter of 2014 and recorded a $232.3 million goodwill impairment charge in 2014.
Stock-based Compensation
Included in operating expenses are expenses associated with stock-based compensation, which are allocated and included in service costs, sales and marketing, product development and general and administrative expenses. Stock-based compensation expense is largely comprised of costs associated with stock options, restricted stock units and
40
restricted stock granted to employees, directors and non-employees, and expenses relating to our Employee Stock Purchase Plan. We record the fair value of these equity-based awards and expenses at their cost ratably over related vesting periods.
Interest Income (Expense), Net
Interest income consists of interest earned on cash balances and short-term investments. We typically invest our available cash balances in money market funds and short-term United States Treasury obligations. Interest expense principally consisted of interest on outstanding debt and amortization of debt issuance costs associated with our credit facility, which was fully repaid in November 2014.
Other Income (Expense), Net
Other income (expense), net consists primarily of transaction gains and losses on foreign currency-denominated assets and liabilities and gains or losses on sales of businesses. We expect that these gains and losses will vary depending upon movements in underlying currency exchange rates and whether we dispose of any businesses.
Provision for Income Taxes
Since our inception, we have been subject to income taxes principally in the United States, and certain other countries where we have or had a legal presence, including the United Kingdom, the Netherlands, Canada and Argentina. We may in the future become subject to taxation in additional countries based on the foreign statutory rates and our effective tax rate could fluctuate accordingly.
Income taxes are computed using the asset and liability method, under which deferred tax assets and liabilities are determined based on the difference between the financial statement and tax bases of assets and liabilities using enacted tax rates in effect for the year in which the differences are expected to affect taxable income. Valuation allowances are established when necessary to reduce deferred tax assets to the amount expected to be realized.
We currently believe that based on the available information, it is more likely than not that our deferred tax assets will not be realized, and accordingly we have taken a full valuation allowance against all of our United States federal and certain state and foreign deferred tax assets. Federal and state laws impose substantial restrictions on the utilization of net operating loss and tax credit carry-forwards in the event of an “ownership change,” as defined in Section 382 of the Code. Currently, we do not expect the utilization of our net operating loss and tax credit carry-forwards in the near term to be materially affected as no significant limitations are expected to be placed on these carry-forwards as a result of our previous ownership changes.
Critical Accounting Policies and Estimates
Our consolidated financial statements are prepared in accordance with generally accepted accounting principles (“GAAP”) in the United States. The preparation of our consolidated financial statements requires us to make estimates and assumptions that affect the reported amounts of assets, liabilities, revenue, expenses and related disclosures. We evaluate our estimates and assumptions on an ongoing basis. Our estimates are based on historical experience and various other assumptions that we believe to be reasonable under the circumstances. Our actual results could differ from these estimates.
We believe that the estimates and assumptions associated with our revenue recognition, accounts receivable and allowance for doubtful accounts, goodwill, capitalization and useful lives associated with our intangible assets, discontinued operations, income taxes, stock-based compensation and the recoverability of our long-lived assets including our media content portfolio, have the greatest potential impact on our consolidated financial statements. Therefore, we consider these to be our critical accounting policies and estimates.
41
Revenue Recognition
We recognize revenue when four basic criteria are met: persuasive evidence of a sales arrangement exists; performance of services has occurred; the sales price is fixed or determinable; and collectability is reasonably assured. We consider persuasive evidence of a sales arrangement to be the receipt of a signed contract. Collectability is assessed based on a number of factors, including transaction history and the credit worthiness of a customer. If it is determined that collection is not reasonably assured, revenue is not recognized until collection becomes reasonably assured, which is generally upon receipt of cash. We record cash received in advance of revenue recognition as deferred revenue.
For arrangements with multiple deliverables, we allocate revenue to each deliverable if the delivered item(s) has value to the customer on a standalone basis and, if the arrangement includes a general right of return relative to the delivered item, delivery or performance of the undelivered item(s) is considered probable and substantially in our control. The fair value of the selling price for a deliverable is determined using a hierarchy of (1) Company-specific objective and reliable evidence, then (2) third-party evidence, then (3) best estimate of selling price. We allocate any arrangement fee to each of the elements based on their relative selling prices.
Accounts Receivable and Allowance for Doubtful Accounts
We maintain an allowance for doubtful accounts to reserve for potentially uncollectible receivables from our customers based on our best estimate of the amount of probable losses from existing accounts receivable. We determine the allowance based on an analysis of historical bad debts, customer concentrations, customer credit-worthiness and current economic trends. In addition, past due balances over 60 days and specific other balances are reviewed individually for collectability on at least a quarterly basis. During the years ended December 31, 2015 and 2014, our allowance for doubtful accounts and bad debt expense were not significant and we expect that this trend will continue in the near term.
Goodwill
Goodwill represents the excess of the cost of an acquired entity over the fair value of the acquired net assets. Goodwill is tested for impairment annually during the fourth quarter of our fiscal year or when events or circumstances change in a manner that indicates goodwill might be impaired. Events or circumstances that could trigger an impairment review include, but are not limited to, a significant adverse change in legal factors or in the business climate, an adverse action or assessment by a regulator, unanticipated competition, a loss of key personnel, significant changes in the manner of our use of the acquired assets or the strategy for our overall business, significant negative industry or economic trends, a decline in our stock price leading to an extended period when our market capitalization is less than the book value of our net assets, or significant underperformance relative to expected historical or projected future results of operations.
Goodwill is tested for impairment at the reporting unit level, which is one level below or the same as an operating segment. During the second quarter of 2015, we made certain changes to our management structure below our chief operating decision maker and, as a result of these changes, we determined that Society6, which had previously been included in our content and media reporting unit, should be combined with the Saatchi Art reporting unit to create a marketplaces reporting unit. A change in reporting units requires that goodwill be tested for impairment. Therefore, we performed an interim assessment of impairment of goodwill for the Saatchi Art reporting unit during the second quarter of 2015 and determined an impairment did not exist. As of December 31, 2015, we determined that we have two reporting units: content and media and marketplaces.
When testing goodwill for impairment, we first perform a qualitative assessment to determine whether it is necessary to perform step one of a two-step goodwill impairment test for each reporting unit. We are required to perform step one only if we conclude that it is more likely than not that a reporting unit’s fair value is less than the carrying value of its assets. Should this be the case, the first step of the two-step process is to identify whether a potential impairment exists by comparing the estimated fair values of our reporting units with their respective carrying values, including goodwill. If the estimated fair value of a reporting unit exceeds the carrying value, goodwill is not considered to be impaired and no additional steps are necessary. If, however, the fair value of a reporting unit is less than its carrying
42
value, then a second step is performed to measure the amount of the impairment loss, if any. The amount of the impairment loss is the excess of the carrying amount of the goodwill over its implied fair value. The estimate of implied fair value of goodwill is primarily based on an estimate of the discounted cash flows expected to result from that reporting unit, but may require valuations of certain internally generated and unrecognized intangible assets such as our software, technology, patents and trademarks.
For the year ended December 31, 2014, due to unexpected revenue declines attributable to lower traffic and monetization yield on certain of our content and media websites, we lowered our future cash flow expectations. As a result of the decline in our cash flow forecast as well as a sustained decline in our market capitalization which remained at a level below the book value of our net assets for an extended period of time, we performed an interim assessment of impairment of the goodwill in our content and media reporting unit in the third quarter of 2014. Based on our analyses, we determined that the implied fair value of goodwill was substantially lower than the carrying value of goodwill for the content and media reporting unit and as a result, we determined that the implied fair value of the goodwill in the content and media reporting unit was zero. Accordingly, we recorded $232.3 million for the goodwill impairment charge in 2014.
For the year ended December 31, 2015, we performed our annual goodwill impairment test in the fourth quarter of the year, consistent with our existing accounting policy, and we determined that there was no impairment charge for the year ended December 31, 2015. As of December 31, 2015, there was $10.4 million of goodwill recorded in our marketplaces reporting unit. We may be required to record goodwill impairment charges in future periods.
Intangible Assets—Media Content
We capitalize the direct costs incurred to acquire our media content that is determined to embody a probable future economic benefit. Costs are recognized as finite-lived intangible assets based on their acquisition cost to us. All costs incurred to deploy and publish content are expensed as incurred, including the costs incurred for the ongoing maintenance of websites on which our content resides. We generally acquire content when our internal systems and processes provide reasonable assurance that, given predicted consumer and advertiser demand relative to our predetermined cost to acquire the content, the content unit will generate revenue over its useful life that exceeds the cost of acquisition. In determining whether content embodies a probable future economic benefit required for asset capitalization, we make judgments and estimates including the forecasted number of visits and the advertising rates that the content will generate. These estimates and judgments take into consideration various inherent uncertainties including, but not limited to, total expected visits over the content’s useful life; the fact that our content creation and distribution model is evolving and may be impacted by competition and technological advancements; our ability to expand existing and enter into new distribution channels and applications for our content; and whether we will be able to generate similar economic returns from content in the future. Management has reviewed, and intends to regularly review, the operating performance of content in determining probable future economic benefits of our content.
Capitalized media content is amortized on a straight-line basis over its useful life, which is typically five years, representing our estimate of when the underlying economic benefits are expected to be realized and based on our estimates of the projected cash flows from advertising revenue expected to be generated by the deployment of such content. These estimates are based on our plans and projections, comparison of the economic returns generated by our content with content of comparable quality and an analysis of historical cash flows generated by that content to date.
We continue to perform evaluations of our existing content library to identify potential improvements in our content creation and distribution platform. As a result of these evaluations, we elected to remove certain content units from our content library, resulting in $3.4 million, $7.7 million and $3.1 million of related accelerated amortization expense in the years ended December 31, 2015, 2014 and 2013, respectively.
Intangible Assets—Acquired in Business Combinations
We perform valuations of assets acquired and liabilities assumed on each acquisition accounted for as a business combination and allocate the purchase price of each acquired business to our respective net tangible and intangible assets. Acquired intangible assets include: trade names, non-compete agreements, owned website names, artist
43
relationships, customer relationships, technology, media content, and content publisher relationships. We use valuation techniques to value these intangibles assets, with the primary technique being a discounted cash flow analysis. A discounted cash flow analysis requires us to make various assumptions and estimates including projected revenue, operating costs, growth rates, useful lives and discount rates. Intangible assets are amortized over their estimated useful lives using the straight-line method which approximates the pattern in which the economic benefits are consumed.
Recoverability of Long-lived Assets
We evaluate the recoverability of our long-lived tangible and intangible assets with finite useful lives for impairment when events or changes in circumstances indicate that the carrying amount of an asset group may not be recoverable. Such trigger events or changes in circumstances may include: a significant decrease in the market price of a long-lived asset, a significant adverse change in the extent or manner in which a long-lived asset is being used, a significant adverse change in legal factors or in the business climate, including those resulting from technology advancements in the industry, the impact of competition or other factors that could affect the value of a long-lived asset, a significant adverse deterioration in the amount of revenue or cash flows we expect to generate from an asset group, an accumulation of costs significantly in excess of the amount originally expected for the acquisition or development of a long-lived asset, current or future operating or cash flow losses that demonstrate continuing losses associated with the use of a long-lived asset, or a current expectation that, more likely than not, a long-lived asset will be sold or otherwise disposed of significantly before the end of its previously estimated useful life. We perform impairment testing at the asset group level that represents the lowest level for which identifiable cash flows are largely independent of the cash flows of other assets and liabilities. If events or changes in circumstances indicate that the carrying amount of an asset group may not be recoverable and the expected undiscounted future cash flows attributable to the asset group are less than the carrying amount of the asset group, an impairment loss equal to the excess of the asset’s carrying value over its fair value is recorded. Fair value is determined based upon estimated discounted future cash flows. Assets to be disposed of, if any, are separately presented on our consolidated balance sheets and reported at the lower of their carrying amount or fair value less costs to sell, and are no longer depreciated or amortized.
Discontinued Operations
We report the results of operations of a business as discontinued operations if the disposal of a component represents a strategic shift that has (or will have) a major effect on our operations and financial results. The results of discontinued operations are reported in discontinued operations in the consolidated statements of operations for current and prior periods commencing in the period in which the business meets the criteria of a discontinued operation, and include any gain or loss recognized on closing or adjustment of the carrying amount to fair value less cost to sell.
On August 1, 2014, we completed the Separation of Rightside from Demand Media, resulting in two independent, publicly traded companies. Following the Separation, Rightside operates our former domain name services business, while we continue to own and operate our Content & Media and Marketplaces businesses. The financial results of Rightside are presented as discontinued operations in our consolidated statements of operations for the years ended
44
December 31, 2014 and 2013. We reclassified the following activity in our consolidated statements of operations from continuing operations to discontinued operations (in thousands):
|
|
|
Year ended December 31, |
|
||||
|
|
|
2014 |
|
2013 |
|
||
|
Service revenue |
|
$ |
107,721 |
|
$ |
185,187 |
|
|
|
|
|
|
|
|
|
|
|
Service costs |
|
|
92,588 |
|
|
143,607 |
|
|
Sales and marketing |
|
|
5,632 |
|
|
10,170 |
|
|
Product and development |
|
|
8,203 |
|
|
12,002 |
|
|
General and administrative |
|
|
14,819 |
|
|
20,263 |
|
|
Amortization of intangible assets |
|
|
4,243 |
|
|
7,890 |
|
|
Total operating expenses |
|
|
125,485 |
|
|
193,932 |
|
|
Operating loss |
|
|
(17,764) |
|
|
(8,745) |
|
|
Other income (expense), net |
|
|
7,017 |
|
|
4,174 |
|
|
Loss before income taxes |
|
$ |
(10,747) |
|
$ |
(4,571) |
|
|
Income tax expense |
|
|
(461) |
|
|
(1,385) |
|
|
Net loss |
|
$ |
(11,208) |
|
$ |
(5,956) |
|
Income Taxes
We account for our income taxes using the liability and asset method, which requires the recognition of deferred tax assets and liabilities for the expected future tax consequences of events that have been recognized in our financial statements or in our tax returns. In estimating future tax consequences, generally all expected future events other than enactments or changes in the tax law or rates are considered. Deferred income taxes are recognized for differences between financial reporting and tax bases of assets and liabilities at the enacted statutory tax rates in effect for the years in which the temporary differences are expected to reverse. The effect on deferred taxes of a change in tax rates is recognized in income in the period that includes the enactment date. We evaluate the realizability of our deferred tax assets, and valuation allowances are provided when necessary to reduce deferred tax assets to the amounts expected to be realized.
We operate in various tax jurisdictions and are subject to audit by various tax authorities. We believe any adjustments that may ultimately be required as a result of any of these audits will not be material to our consolidated financial statements.
We recognize a tax benefit from an uncertain tax position only if it is more likely than not that the tax position will be sustained on examination by the taxing authorities, based on the technical merits of the position. The tax benefits recognized in the consolidated financial statements from such positions are then measured based on the largest benefit that has a greater than 50% likelihood of being realized upon settlement. We recognize interest and penalties accrued related to unrecognized tax benefits in our income tax (benefit) provision in the accompanying consolidated statements of operations. Our evaluations of uncertain tax positions are based upon their technical merits, and relevant tax law and the specific facts and circumstances as of each reporting period. Changes in facts and circumstances could result in material changes to the amounts recorded for such tax contingencies.
We calculate our current and deferred tax provision based on estimates and assumptions that could differ from the actual results reflected in income tax returns filed in subsequent years. Adjustments based on filed returns are recorded when identified. The amount of income taxes we pay is subject to ongoing audits by federal, state and foreign tax authorities. Our estimate of the potential outcome of any uncertain tax issue is subject to management’s assessment of relevant risks, facts, and circumstances existing at that time. To the extent that our assessment of such tax positions changes, the change in estimate is recorded in the period in which the determination is made.
45
Stock-based Compensation
We measure and recognize compensation expense for all stock-based payment awards made to employees, non-employees and directors based on the grant date fair values of the awards. For stock option awards to employees with service based vesting conditions, the fair value is estimated using the Black-Scholes-Merton option pricing model. The value of an award that is ultimately expected to vest is recognized as expense over the requisite service periods in our consolidated statements of operations. We elected to treat stock-based payment awards with graded vesting schedules and time-based service conditions as a single award and recognize stock-based compensation expense on a straight-line basis (net of estimated forfeitures) over the requisite service period. Stock-based compensation expenses are classified in the consolidated statement of operations based on the department to which the related employee reports. Our stock-based awards are comprised principally of stock options, restricted stock units and, in the past, restricted stock awards.
The Black-Scholes-Merton option pricing model requires management to make assumptions and to apply judgment in determining the fair value of our awards. The most significant assumptions and judgments include the expected volatility, expected term of the award and estimated forfeiture rates.
We estimated the expected volatility of our awards from the historical volatility of selected public companies within the Internet and media industry with comparable characteristics to Demand Media, including similarity in size, lines of business, market capitalization, revenue and financial leverage. We calculated the weighted average expected life of our options based upon our historical experience of option exercises combined with estimates of the post-vesting holding period. The-risk free interest rate is based on the implied yield currently available on U.S. Treasury issues with terms approximately equal to the expected life of the option. The expected dividend rate is zero as we currently have no history or expectation of paying cash dividends on our common stock. The forfeiture rate is established based on applicable historical forfeiture patterns adjusted for any expected changes in future periods.
46
Results of Operations
The following tables set forth our results of operations for the periods presented. The period-to-period comparison of financial results is not necessarily indicative of future results.
|
|
|
Year ended December 31, |
|
|
|||||||
|
|
|
2015 |
|
2014 |
|
2013 |
|
|
|||
|
Revenue: |
|
|
|
|
|
|
|
|
|
|
|
|
Service revenue |
|
$ |
77,254 |
|
$ |
137,711 |
|
$ |
195,269 |
|
|
|
Product revenue |
|
|
48,715 |
|
|
34,718 |
|
|
14,142 |
|
|
|
Total revenue |
|
|
125,969 |
|
|
172,429 |
|
|
209,411 |
|
|
|
Operating expenses: |
|
|
|
|
|
|
|
|
|
|
|
|
Service costs (exclusive of amortization of intangible assets shown separately below)(1)(2) |
|
|
37,289 |
|
|
43,325 |
|
|
51,274 |
|
|
|
Product costs |
|
|
33,769 |
|
|
26,058 |
|
|
9,882 |
|
|
|
Sales and marketing(1)(2) |
|
|
20,319 |
|
|
20,046 |
|
|
36,275 |
|
|
|
Product development(1)(2) |
|
|
24,313 |
|
|
29,387 |
|
|
32,185 |
|
|
|
General and administrative(1)(2) |
|
|
38,344 |
|
|
50,179 |
|
|
53,014 |
|
|
|
Goodwill impairment charge |
|
|
— |
|
|
232,270 |
|
|
— |
|
|
|
Amortization of intangible assets |
|
|
18,706 |
|
|
38,316 |
|
|
36,519 |
|
|
|
Total operating expenses |
|
|
172,740 |
|
|
439,581 |
|
|
219,149 |
|
|
|
Loss from operations |
|
|
(46,771) |
|
|
(267,152) |
|
|
(9,738) |
|
|
|
Interest income |
|
|
361 |
|
|
328 |
|
|
5 |
|
|
|
Interest expense |
|
|
(143) |
|
|
(4,692) |
|
|
(1,642) |
|
|
|
Other income, net |
|
|
3,107 |
|
|
654 |
|
|
13 |
|
|
|
Loss from continuing operations before income taxes |
|
|
(43,446) |
|
|
(270,862) |
|
|
(11,362) |
|
|
|
Income tax (expense) benefit |
|
|
(55) |
|
|
14,713 |
|
|
(2,856) |
|
|
|
Net loss from continuing operations |
|
|
(43,501) |
|
|
(256,149) |
|
|
(14,218) |
|
|
|
Net loss from discontinued operations(1)(2) |
|
|
— |
|
|
(11,208) |
|
|
(5,956) |
|
|
|
Net loss |
|
$ |
(43,501) |
|
$ |
(267,357) |
|
$ |
(20,174) |
|
|
|
|
|
|
|
|
|
|
|
|
|
|
|
|
(1) Depreciation expense included in the above line items: |
|
|
|
|
|
|
|
|
|
|
|
|
Service costs |
|
$ |
5,965 |
|
$ |
6,798 |
|
$ |
9,594 |
|
|
|
Sales and marketing |
|
|
67 |
|
|
156 |
|
|
275 |
|
|
|
Product development |
|
|
200 |
|
|
496 |
|
|
645 |
|
|
|
General and administrative |
|
|
4,946 |
|
|
4,802 |
|
|
3,942 |
|
|
|
Discontinued operations |
|
|
— |
|
|
4,662 |
|
|
6,045 |
|
|
|
Total depreciation |
|
$ |
11,178 |
|
$ |
16,914 |
|
$ |
20,501 |
|
|
|
|
|
|
|
|
|
|
|
|
|
|
|
|
(2) Stock-based compensation included in the above line items: |
|
|
|
|
|
|
|
|
|
|
|
|
Service costs |
|
$ |
1,084 |
|
$ |
1,422 |
|
$ |
2,420 |
|
|
|
Sales and marketing |
|
|
588 |
|
|
683 |
|
|
3,823 |
|
|
|
Product development |
|
|
1,836 |
|
|
4,745 |
|
|
3,835 |
|
|
|
General and administrative |
|
|
4,054 |
|
|
12,016 |
|
|
12,525 |
|
|
|
Discontinued operations |
|
|
— |
|
|
2,949 |
|
|
4,781 |
|
|
|
Total stock-based compensation |
|
$ |
7,562 |
|
$ |
21,815 |
|
$ |
27,384 |
|
|
47
As a percentage of revenue:
|
|
|
Year ended December 31, |
|
|
||||
|
|
|
2015 |
|
2014 |
|
2013 |
|
|
|
Revenue: |
|
|
|
|
|
|
|
|
|
Service revenue |
|
61.3 |
% |
79.9 |
% |
93.2 |
% |
|
|
Product revenue |
|
38.7 |
% |
20.1 |
% |
6.8 |
% |
|
|
Total revenue |
|
100.0 |
% |
100.0 |
% |
100.0 |
% |
|
|
Operating expenses: |
|
|
|
|
|
|
|
|
|
Service costs (exclusive of amortization of intangible assets shown separately below) |
|
29.6 |
% |
25.1 |
% |
24.5 |
% |
|
|
Product costs |
|
26.8 |
% |
15.1 |
% |
4.7 |
% |
|
|
Sales and marketing |
|
16.1 |
% |
11.6 |
% |
17.3 |
% |
|
|
Product development |
|
19.3 |
% |
17.0 |
% |
15.4 |
% |
|
|
General and administrative |
|
30.4 |
% |
29.2 |
% |
25.4 |
% |
|
|
Goodwill impairment charge |
|
— |
% |
134.7 |
% |
— |
% |
|
|
Amortization of intangible assets |
|
14.9 |
% |
22.2 |
% |
17.4 |
% |
|
|
Total operating expenses |
|
137.1 |
% |
254.9 |
% |
104.7 |
% |
|
|
Loss from operations |
|
(37.1) |
% |
(154.9) |
% |
(4.7) |
% |
|
|
Interest income |
|
0.3 |
% |
0.2 |
% |
— |
% |
|
|
Interest expense |
|
(0.1) |
% |
(2.8) |
% |
(0.7) |
% |
|
|
Other income, net |
|
2.4 |
% |
0.4 |
% |
— |
% |
|
|
Loss from continuing operations before income taxes |
|
(34.5) |
% |
(157.1) |
% |
(5.4) |
% |
|
|
Income tax (expense) benefit |
|
— |
% |
8.5 |
% |
(1.4) |
% |
|
|
Net loss from continuing operations |
|
(34.5) |
% |
(148.6) |
% |
(6.8) |
% |
|
|
Net loss from discontinued operations |
|
— |
% |
(6.5) |
% |
(2.8) |
% |
|
|
Net loss |
|
(34.5) |
% |
(155.1) |
% |
(9.6) |
% |
|
Revenue
Revenue by service offering was as follows (in thousands):
|
|
|
|
|
|
|
|
|
|
|
|
|
|
|
|
|
|
|
|
Year ended December 31, |
|
% Change |
|
% Change |
|
|
|||||||
|
|
|
2015 |
|
2014 |
|
2013 |
|
2015 to 2014 |
|
2014 to 2013 |
|
|
|||
|
Content & Media |
|
$ |
73,814 |
|
$ |
137,038 |
|
$ |
195,080 |
|
(46) |
% |
(30) |
% |
|
|
Marketplaces |
|
|
52,155 |
|
|
35,391 |
|
|
14,331 |
|
47 |
% |
147 |
% |
|
|
Total revenue |
|
$ |
125,969 |
|
$ |
172,429 |
|
$ |
209,411 |
|
(27) |
% |
(18) |
% |
|
Content & Media Revenue
Content & Media revenue decreased by $63.2 million, or 46%, to $73.8 million for the year ended December 31, 2015, as compared to $137.0 million for the year ended December 31, 2014. Visits decreased by 16% to 3,374 million visits in the year ended December 31, 2015 from 4,004 million visits in the year ended December 31, 2014 driven by significant declines in desktop visits across all of our media properties, in part due to management’s decision to remove over two million articles on eHow and Livestrong.com. These declines were partially offset by mobile visit growth across most of our media properties. RPV decreased by 36%, to $21.87 in the year ended December 31, 2015 from $34.22 in the year ended December 31, 2014, primarily due to lower ad monetization yields and a shift to a higher mix of mobile traffic with lower RPV than desktop visits. In addition, the disposition of our Pluck business in the first quarter of 2015 contributed approximately $8.2 million to the decrease in revenue.
48
Content & Media revenue decreased by $58.0 million, or 30%, to $137.0 million for the year ended December 31, 2014, as compared to $195.1 million for the year ended December 31, 2013. Visits decreased by 1% to 4,004 million visits in the year ended December 31, 2014 from 4,032 million visits in the year ended December 31, 2013 primarily due to declines in desktop visits from eHow, Cracked and Livestrong.com, largely offset by mobile visit growth across most of our media properties and desktop visit growth from our international websites and customer web pages hosted by our content channel services. RPV decreased by 29%, to $34.22 in the year ended December 31, 2014 from $48.39 in the year ended December 31, 2013, primarily due to lower ad monetization yields from cost-per-click advertising, a reduction in higher yielding direct sold display advertising, and a mix shift to lower ad monetizing visits from mobile and international users.
Marketplaces Revenue
Marketplaces revenue increased by $16.8 million, or 47%, to $52.2 million for the year ended December 31, 2015, as compared to $35.4 million for the year ended December 31, 2014. The number of transactions increased 29% to 925,111 in the year ended December 31, 2015 from 715,343 in the prior year period, driven primarily by new product introductions, increased conversion of visits to purchases, and traffic growth on Society6. Average revenue per transaction was $56.38 for the year ended December 31, 2015, increasing by 14% as compared to $49.47 in the prior year period due primarily to a shift towards higher priced items on Society6, as well as the addition of Saatchi Art in August 2014, which has significantly higher average revenue per transaction.
Marketplaces revenue increased by $21.1 million, or 147%, to $35.4 million for the year ended December 31, 2014, as compared to $14.3 million for the year ended December 31, 2013. The number of transactions increased 158% to 715,343 in the year ended December 31, 2014 from 277,442 in the prior year period, driven primarily by a full year of results for Society6, which we acquired in June 2013. Average revenue per transaction was $49.47 for the year ended December 31, 2014, decreasing by 4% as compared to $51.65 in the prior year period due to a mix shift that includes lower priced product offerings on Society6.
Costs and Expenses
Operating costs and expenses were as follows (in thousands):
|
|
|
|
|
|
|
|
|
|
|
|
|
|
|
|
|
|
|
|
Year ended December 31, |
|
% Change |
|
% Change |
|
|
|||||||
|
|
|
2015 |
|
2014 |
|
2013 |
|
2015 |
|
2014 |
|
|
|||
|
Service costs (exclusive of amortization of intangible assets) |
|
$ |
37,289 |
|
$ |
43,325 |
|
$ |
51,274 |
|
(14.0) |
% |
(16.0) |
% |
|
|
Product costs |
|
|
33,769 |
|
|
26,058 |
|
|
9,882 |
|
30.0 |
% |
164.0 |
% |
|
|
Sales and marketing |
|
|
20,319 |
|
|
20,046 |
|
|
36,275 |
|
1.0 |
% |
(45.0) |
% |
|
|
Product development |
|
|
24,313 |
|
|
29,387 |
|
|
32,185 |
|
(17.0) |
% |
(9.0) |
% |
|
|
General and administrative |
|
|
38,344 |
|
|
50,179 |
|
|
53,014 |
|
(24.0) |
% |
(5.0) |
% |
|
|
Goodwill impairment charge |
|
|
— |
|
|
232,270 |
|
|
— |
|
(100.0) |
% |
100.0 |
% |
|
|
Amortization of intangible assets |
|
|
18,706 |
|
|
38,316 |
|
|
36,519 |
|
(51.0) |
% |
5.0 |
% |
|
Service Costs
Service costs for the year ended December 31, 2015 decreased by approximately $6.0 million, or 14%, to $37.3 million compared to $43.3 million for the year ended December 31, 2014. The decrease in service costs was primarily due to decreases of $2.1 million in information technology expense, $2.0 million in personnel related costs, including stock-based compensation expense, $0.9 million in traffic acquisition costs, $0.8 million in depreciation expense, $0.6 million in ad serving costs, $0.6 million related to newly created content and content renovation, and $0.6 million in consulting expense. The decrease in information technology expense was primarily related to the disposition of our Pluck business and a reduction in colocation, bandwidth and other support costs. These factors were partially offset by a $1.5 million increase in cost of services related to Saatchi Art.
49
Service costs for the year ended December 31, 2014 decreased by approximately $7.9 million, or 16%, to $43.3 million compared to $51.3 million for the year ended December 31, 2013. The decrease in service costs was primarily due to decreases of $2.8 million in depreciation expense, $2.4 million in ad serving costs, $1.8 million in traffic acquisition costs, $1.7 million related to newly created content, $1.0 million in personnel related costs, including stock-based compensation expense, and $0.1 million in information technology expense. These factors were partially offset by a $1.9 million increase in content remediation related expenses.
Product Costs
Product costs for the year ended December 31, 2015 increased by $7.7 million, or 30%, to $33.8 million compared to product costs of $26.1 million for the year ended December 31, 2014, primarily due to increased costs related to the higher volume of products sold on Society6.
Product costs for the year ended December 31, 2014 increased by $16.2 million, or 164%, to $26.1 million compared to product costs of $9.9 million for the year ended December 31, 2013, primarily due to increased costs related to the higher volume of products sold on Society6. The year ended December 31, 2014 represented our first full year of product costs related to Society6, which was acquired in June 2013.
Sales and Marketing
Sales and marketing expenses increased by $0.3 million, or 1%, to $20.3 million for the year ended December 31, 2015 from $20.0 million for the year ended December 31, 2014. The increase in expense was driven by a $2.4 million increase in marketing expenses from Society6 and studioD, partially offset by decreases in personnel related costs, including stock-based compensation expense, of $1.7 million and consulting expenses of $0.4 million.
Sales and marketing expenses decreased by $16.2 million, or 45%, to $20.0 million for the year ended December 31, 2014 from $36.3 million for the year ended December 31, 2013. The decrease was driven by a $13.1 million decrease in personnel related costs, including stock-based compensation expense, primarily due to our shift away from direct advertising sales, a $2.6 million reduction in marketing and branding activities, and a $0.5 million decrease in software licensing fees.
Product Development
Product development expenses decreased by $5.1 million, or 17%, to $24.3 million for the year ended December 31, 2015 compared to $29.4 million for the year ended December 31, 2014. The decrease was driven by a $4.8 million reduction in personnel related costs, including stock-based compensation expense, and a $0.3 million decrease in depreciation expense.
Product development expenses decreased by $2.8 million, or 9%, to $29.4 million for the year ended December 31, 2014 compared to $32.2 million for the year ended December 31, 2013. The decrease was driven by a $2.5 million reduction in personnel related costs, including stock-based compensation expense, as well as a $0.3 million decrease in consulting expense.
General and Administrative
General and administrative expenses decreased by $11.8 million, or 24%, to $38.3 million for the year ended December 31, 2015 compared to $50.2 million for the year ended December 31, 2014. The decrease was primarily due to decreases of $9.3 million in personnel and related costs, including stock-based compensation expense, $1.4 million in legal and audit fees, $0.5 million in facilities costs, and $0.2 million in taxes and insurance costs.
General and administrative expenses decreased by $2.8 million, or 5%, to $50.2 million for the year ended December 31, 2014 compared to $53.0 million for the year ended December 31, 2013. The decrease was primarily due to decreases of $2.3 million in facilities and related costs, $1.2 million in personnel and related costs, including stock-
50
based compensation expense, and $0.4 million in consulting costs, partially offset by an increase of $0.9 million in depreciation expense.
Severance Costs
In the year ended December 31, 2015, we implemented a number of initiatives to improve operating efficiency, including targeted reductions in force in areas where our business model shifted during the year. For the year ended December 31, 2015, we incurred $2.2 million in severance costs primarily related to certain workforce reduction actions that occurred during the year. These severance costs were recognized in the consolidated statements of operations for the year ended December 31, 2015 as follows: $1.1 million in product development costs, $0.6 million in service costs, $0.4 million in general and administrative costs, and $0.1 million in sales and marketing costs. Severance costs include severance pay, the provision of certain extended employee benefits, and employer taxes. As of December 31, 2015, there was $0.5 million of accrued severance costs included in accrued expenses and other current liabilities in the consolidated balance sheet. We will incur additional severance costs currently estimated to be $0.2 million over the applicable retention periods, which extend through the first quarter of 2016.
Amortization of Intangibles
Amortization expense for the year ended December 31, 2015 decreased by $19.6 million, or 51%, to $18.7 million compared to $38.3 million for the year ended December 31, 2014. The decrease is primarily due to the removal of certain content units from our media properties in the fourth quarter of 2014 and the disposition of certain intangible assets in connection with the sales of our Pluck business in the first quarter of 2015 and our Creativebug and CoveritLive businesses in the third quarter of 2014, offset by an increase in amortization expense from intangible assets acquired from the Saatchi Art acquisition in the third quarter of 2014.
Amortization expense for the year ended December 31, 2014 increased by $1.8 million, or 5%, to $38.3 million compared to $36.5 million for the year ended December 31, 2013. The increase is primarily due to additional amortization expense from intangible assets acquired from the Society6 acquisition in 2013, as well as an increase in accelerated amortization expense due to our content remediation efforts initiated in the fourth quarter of 2014, partially offset by lower amortization expense of media content due to our removal of certain content units in the fourth quarter of 2013, and reduced amortization due to the disposition of certain intangible assets in connection with certain business disposals.
Goodwill Impairment Charge
We performed our annual impairment analysis in the fourth quarter of the year ended December 31, 2015, and based on the results of the annual impairment test there was no goodwill impairment charge for the year ended December 31, 2015.
For the year ended December 31, 2014, due to unexpected revenue declines attributable to lower traffic and monetization yield on certain of our content and media websites, we lowered our future cash flow expectations. As a result of the decline in our cash flow forecast as well as a sustained decline in our market capitalization which remained at a level below the book value of our net assets for an extended period of time, we performed an interim assessment of impairment of the goodwill in our content and media reporting unit in the third quarter of 2014. Based on our analyses, we determined that the implied fair value of goodwill was substantially lower than the carrying value of goodwill for the content and media reporting unit and that the implied fair value of the goodwill in the content and media reporting unit was zero. Accordingly, we recorded a $232.3 million goodwill impairment charge in the year ended December 31, 2014.
Interest Income (Expense), Net
Net interest income was approximately $0.2 million for the year ended December 31, 2015, primarily related to interest income paid to us on the promissory note we received as part of the consideration for our sale of CoveritLive in July 2014.
51
Net interest expense was $4.4 million for the year ended December 31, 2014, an increase of $2.8 million from $1.6 million in the same period in 2013. The increase was primarily due to an increased balance outstanding under our previous credit facility and a $1.7 million write-off of debt issuance costs associated with terminating our credit facility in November 2014.
Other Income (Expense), Net
Net other income for the year ended December 31, 2015 increased by $2.4 million to $3.1 million compared to $0.7 million for the year ended December 31, 2014, primarily due to the gain on sale of our Pluck business.
Net other income for the year ended December 31, 2014 increased by $0.6 million compared to the year ended December 31, 2013, primarily due to a $0.8 million gain on sale from dispositions during the 2014 period.
Income Tax Benefit (Expense)
During the year ended December 31, 2015, we recorded an income tax expense of $0.1 million compared to an income tax benefit of $14.7 million during the year ended December 31, 2014. The change was primarily due to the tax effect arising from the impairment of goodwill and its impact on our valuation allowance for the year ended December 31, 2014. Income tax expense for the year ended December 31, 2015 is primarily related to minimal state and foreign income tax expenses.
During the year ended December 31, 2014, we recorded an income tax benefit of $14.7 million compared to an income tax expense of $2.9 million during the year ended December 31, 2013, representing a $17.6 million decrease. The decrease was primarily due to a reduction of tax amortization of goodwill from the impairment of goodwill and its impact on our valuation allowance.
52
Selected Quarterly Financial Data
The following unaudited quarterly consolidated statements of operations for the quarters in the years ended December 31, 2015 and 2014, have been prepared on a basis consistent with our audited consolidated annual financial statements, and include, in the opinion of management, all normal recurring adjustments necessary for the fair statement of the financial information contained in those statements. The period-to-period comparison of financial results is not necessarily indicative of future results and should be read in conjunction with our consolidated annual financial statements and the related notes included elsewhere in this Annual Report on Form 10-K.
|
|
|
Quarter ended |
|
||||||||||||||||||||||
|
|
|
March 31, |
|
June 30, |
|
September 30, |
|
December 31, |
|
March 31, |
|
June 30, |
|
September 30, |
|
December 31, |
|
||||||||
|
|
|
2014 |
|
2014 |
|
2014 |
|
2014 |
|
2015 |
|
2015 |
|
2015(2) |
|
2015 |
|
||||||||
|
|
|
(In thousands, except per share data) |
|
||||||||||||||||||||||
|
|
|
Unaudited |
|
||||||||||||||||||||||
|
Revenue: |
|
|
|
|
|
|
|
|
|
|
|
|
|
|
|
|
|
|
|
|
|
|
|
|
|
|
Service revenue |
|
$ |
38,264 |
|
$ |
36,397 |
|
$ |
33,712 |
|
$ |
29,338 |
|
$ |
23,225 |
|
$ |
20,067 |
|
$ |
16,755 |
|
$ |
17,207 |
|
|
Product revenue |
|
|
6,792 |
|
|
6,680 |
|
|
7,603 |
|
|
13,643 |
|
|
9,985 |
|
|
9,701 |
|
|
11,750 |
|
|
17,279 |
|
|
Total revenue |
|
$ |
45,056 |
|
$ |
43,077 |
|
$ |
41,315 |
|
$ |
42,981 |
|
$ |
33,210 |
|
$ |
29,768 |
|
$ |
28,505 |
|
$ |
34,486 |
|
|
|
|
|
|
|
|
|
|
|
|
|
|
|
|
|
|
|
|
|
|
|
|
|
|
|
|
|
Loss from operations |
|
$ |
(5,708) |
|
$ |
(5,215) |
|
$ |
(239,316) |
|
$ |
(16,913) |
|
$ |
(9,663) |
|
$ |
(14,527) |
|
$ |
(13,967) |
|
$ |
(8,614) |
|
|
|
|
|
|
|
|
|
|
|
|
|
|
|
|
|
|
|
|
|
|
|
|
|
|
|
|
|
Net loss from continuing operations |
|
$ |
(8,946) |
|
$ |
(6,440) |
|
$ |
(222,533) |
|
$ |
(18,230) |
|
$ |
(6,749) |
|
$ |
(14,408) |
|
$ |
(13,805) |
|
$ |
(8,539) |
|
|
Net loss from discontinued operations |
|
|
(2,010) |
|
|
(7,892) |
|
|
(1,306) |
|
|
— |
|
|
— |
|
|
— |
|
|
— |
|
|
— |
|
|
Net loss |
|
$ |
(10,956) |
|
$ |
(14,332) |
|
$ |
(223,839) |
|
$ |
(18,230) |
|
$ |
(6,749) |
|
$ |
(14,408) |
|
$ |
(13,805) |
|
$ |
(8,539) |
|
|
|
|
|
|
|
|
|
|
|
|
|
|
|
|
|
|
|
|
|
|
|
|
|
|
|
|
|
Earnings per share - basic and diluted(1) |
|
|
|
|
|
|
|
|
|
|
|
|
|
|
|
|
|
|
|
|
|
|
|
|
|
|
Net loss from continuing operations |
|
$ |
(0.49) |
|
$ |
(0.35) |
|
$ |
(11.62) |
|
$ |
(0.93) |
|
$ |
(0.34) |
|
$ |
(0.73) |
|
$ |
(0.69) |
|
$ |
(0.42) |
|
|
Net loss from discontinued operations |
|
|
(0.11) |
|
|
(0.43) |
|
|
(0.07) |
|
|
— |
|
|
— |
|
|
— |
|
|
— |
|
|
— |
|
|
Net loss |
|
$ |
(0.60) |
|
$ |
(0.78) |
|
$ |
(11.69) |
|
$ |
(0.93) |
|
$ |
(0.34) |
|
$ |
(0.73) |
|
$ |
(0.69) |
|
$ |
(0.42) |
|
|
|
|
|
|
|
|
|
|
|
|
|
|
|
|
|
|
|
|
|
|
|
|
|
|
|
|
|
Weighted average number of shares - basic and diluted |
|
|
18,171 |
|
|
18,286 |
|
|
19,151 |
|
|
19,622 |
|
|
19,773 |
|
|
19,841 |
|
|
20,021 |
|
|
20,114 |
|
|
(1) |
For a description of the method used to compute our basic and diluted net income (loss) per share, refer to note 7 in Part II, Item 6, “Selected Financial Data.” |
|
(2) |
During the quarter ended September 30, 2015, we identified through our internal processes that our property and equipment, net was overstated because certain capitalized internally developed software costs had not been placed into service and certain write-offs were not identified on a timely basis. As such, during the quarter ended September 30, 2015, we recorded an out of period adjustment which increased depreciation by $0.6 million and decreased “Other income, net” by $0.5 million. |
Seasonality of Quarterly Results
Our Content & Media service offering is affected by seasonal fluctuations in internet usage and our Marketplaces service offering is affected by traditional retail seasonality as well as seasonal fluctuations in internet usage. Internet usage generally slows during the summer months while our marketplaces generally experience increased sales activity during the fourth quarter holiday season. These seasonal trends have caused, and will likely continue to cause, fluctuations in our quarterly results.
53
Liquidity and Capital Resources
As of December 31, 2015, we had $38.6 million of cash and cash equivalents. Our principal sources of liquidity are our cash and cash equivalents, as well as the cash we generate from our operations. Historically, we have principally financed our operations from the issuance of stock, net cash provided by our operating activities and borrowings under our previous credit facilities. In November 2014, we repaid all outstanding amounts under our previous credit facility and terminated that facility, and we do not currently have an available line of credit. We believe that our existing cash and cash equivalents and our cash flows from operating activities will be sufficient to fund our operations for at least the next 12 months. However, in order to fund our operations, make potential acquisitions, pursue new business opportunities and invest in our existing businesses, platforms and technologies, we may need to raise additional funds by entering into a new credit facility, selling certain assets or issuing equity, equity-related or debt securities. Our shelf registration statement previously filed with the SEC expired in October 2015.
Since our inception, we have used significant cash to make strategic acquisitions to grow our business, including the acquisitions of Society6 in June 2013 and Saatchi Art in August 2014. A portion of the purchase price for Society6 was held back by us to secure any post-closing indemnification obligations and/or post-closing adjustments to the purchase price, and in July 2015, we paid $7.4 million in cash and issued an additional 122,638 shares of our common stock to the sellers of Society6 following the expiration of the indemnification holdback period. We have also generated cash since July 2014 by disposing of certain businesses. In July 2014, we sold our Creativebug business for $10.0 million in cash, $1.0 million of which was initially held in escrow and released to us in July 2015. In July 2014, we also sold our CoveritLive social media business for $4.5 million in cash and a promissory note with a principal amount of $5.6 million, originally due in full by July 2016. In September 2015, we agreed to an early repayment of the promissory note and received $5.1 million in cash, plus accrued and unpaid interest, which satisfied all amounts owed to us under the promissory note. In addition, in February 2015 we sold our Pluck social media business for $3.8 million in cash after working capital adjustments. During the year ended December 31, 2015, we also sold certain non-core niche online properties for a total of $1.2 million. We may make further acquisitions and dispositions in the future.
Our cash flows from operating activities are significantly affected by our cash-based investments in operations, including working capital, and corporate infrastructure to support our ability to generate revenue and conduct operations. Cash used in investing activities has historically been, and is expected to be, impacted by our ongoing investments in our platforms, company infrastructure and equipment. The following table sets forth our major sources and (uses) of cash for each period as set forth below (in thousands):
|
|
|
|
|
|
|
|
|
|
|
|
|
|
|
Year ended December, |
|
|||||||
|
|
|
2015 |
|
2014 |
|
2013 |
|
|||
|
Net cash (used in) provided by operating activities |
|
$ |
(8,438) |
|
$ |
34,661 |
|
$ |
76,163 |
|
|
Net cash provided by (used in) investing activities |
|
$ |
7,089 |
|
$ |
(14,921) |
|
$ |
(114,535) |
|
|
Net cash (used in) provided by financing activities |
|
$ |
(7,886) |
|
$ |
(125,418) |
|
$ |
89,030 |
|
Cash Flow from Operating Activities
Year ended December 31, 2015
Net cash used in operating activities in the year ended December 31, 2015 was $8.4 million, a decrease of $43.1 million compared to the year ended December 31, 2014. Our net loss during the period was $43.5 million, which included non-cash charges of $37.4 million related to depreciation, amortization and stock-based compensation, partially offset by gains on disposals of $3.2 million. Cash flow from operating activities was also impacted by a decrease in our working capital, including changes in accounts receivable, prepaid expenses and deferred revenue of $5.0 million, offset in part by changes in accounts payable, accrued expenses and other long-term assets of $4.1 million. The decrease in our deferred revenue was primarily due to the sale of our Pluck social media business and the sale of other non-core niche media properties during the period. The changes in our accounts receivable and accounts payable were primarily due to the timing of payments and collections.
54
Year ended December 31, 2014
Net cash provided by operating activities in the year ended December 31, 2014 was $34.7 million, a decrease of $41.5 million compared to the prior year. Our net loss during the period was $267.4 million, which included non-cash charges of $232.3 million for goodwill impairment and $82.9 million related to depreciation, amortization, stock-based compensation and debt extinguishment, partially offset by deferred taxes, gain on disposals of businesses and properties, gain on other assets, net and other totaling $22.6 million. Cash flow from operating activities was also impacted by a decrease in our working capital, including changes in accounts receivable and deferred revenue of $22.8 million, offset in part by changes in accounts payable, accrued expenses, deferred registration costs, other long-term assets and deposits with registries of $13.3 million. The increase in our deferred revenue was primarily due to growth in our former registrar service during the period. The decrease in accrued expenses is reflective of increases in amounts due to certain vendors and our employees resulting from growth in our business, while the changes in our accounts receivable and accounts payable were primarily due to the timing of payments and collections.
Year ended December 31, 2013
Net cash provided by operating activities in the year ended December 31, 2013 was $76.2 million, a decrease of $14.8 million compared to the prior year. Our net loss during the period was $20.2 million, which included non-cash charges of $96.2 million related to depreciation, amortization, stock-based compensation, and deferred taxes, partially offset by gain on other assets, net and other of $5.1 million. Cash flow from operating activities was also impacted by an increase in our working capital, including changes in accounts receivable, deferred revenue and accounts payable of $24.8 million, offset in part by changes in prepaid expenses and other current assets, accrued expenses, other long-term assets, deferred registration costs, and deposits with registries of $19.6 million. The increases in our deferred revenue and deferred registration costs were primarily due to growth in our former registrar business during the period, while the decrease in our accounts receivable balances was primarily due to timing of collections.
Cash Flow from Investing Activities
Year ended December 31, 2015
Net cash provided by investing activities was $7.1 million for the year ended December 31, 2015. Cash provided by investing activities for the year ended December 31, 2015 included $5.1 million total from the sales of our Pluck business and certain niche media properties, $5.1 million from the early repayment of a promissory note to us, $1.0 million received from a disposition holdback and $0.7 million from restricted deposits. Cash used in investing activities for the year ended December 31, 2015 related to investments of $4.7 million in property and equipment, primarily comprised of investments in servers and IT equipment, fixtures and fittings, leasehold improvements and internally developed software, and investments of $0.1 million in intangible assets, primarily comprised of media content.
Year ended December 31, 2014
Net cash used in investing activities was $14.9 million for the year ended December 31, 2014, and included investments of $8.9 million in property and equipment, primarily comprised of servers and IT equipment, fixtures and fittings, leasehold improvements and internally developed software, and investments of $5.7 million in intangible assets, primarily composed of media content. Cash flows from investing activities for the year ended December 31, 2014 also included cash inflows of $13.7 million from the sales of businesses, including Creativebug and CoveritLive, as well as outflows of $2.2 million as partial consideration to acquire Saatchi Art, and $3.1 million of restricted cash comprised of a $1.7 million holdback amount paid by us as part of the Saatchi Art consideration and $1.4 million for a standby letter of credit we cash collateralized in connection with the payment arrangement for our Santa Monica office lease. In connection with our former domain name business, we made net payments for gTLD applications of $15.8 million and received cash proceeds of $6.1 million from the withdrawals of our interest in certain gTLD applications during the year ended December 31, 2014.
55
Year ended December 31, 2013
Net cash used in investing activities was $114.5 million during the year ended December 31, 2013, and included $73.6 million of cash paid as partial consideration to acquire Society6 and Creativebug, investments of $16.8 million in intangible assets, primarily comprised of media content, and investments of $26.7 million in property and equipment, primarily comprised of servers and IT equipment, fixtures and fittings, leasehold improvements and internally developed software. In connection with our former domain name business, we made net payments for gTLD applications of $3.9 million and received cash proceeds of $5.6 million from the withdrawals of our interest in certain gTLD applications during the year ended December 31, 2013.
Cash Flow from Financing Activities
Year ended December 31, 2015
Net cash used in financing activities was $7.9 million during the year ended December 31, 2015, primarily comprised of $7.6 million of cash paid for acquisition holdbacks from prior year acquisitions and $0.7 million of costs related to net taxes paid on exercises of employee stock options and vesting of restricted stock units. We received proceeds of $0.5 million from the exercise of employee stock options and contributions from participants in our Employee Stock Purchase Plan during the year ended December 31, 2015.
Year ended December 31, 2014
Net cash used in financing activities was $125.4 million during the year ended December 31, 2014, primarily comprised of $96.3 million used to repay all amounts outstanding under our previous credit facility and $24.1 million used to capitalize Rightside in connection with the Separation. We also used $1.9 million during the year ended December 31, 2014 to fund acquisition holdbacks related to our acquisitions of Name.com, Creativebug and Society6. During the year ended December 31, 2014, we also incurred $2.9 million of costs related to net taxes paid on employee stock options exercises and restricted stock units vesting and we received proceeds of $0.5 million from the exercise of employee stock options and contributions from participants in our Employee Stock Purchase Plan.
Year ended December 31, 2013
Net cash provided by financing activities was $89.0 million during the year ended December 31, 2013, primarily comprised of net borrowings of $96.3 million under our previous credit facility, partially offset by debt issuance costs of $1.9 million incurred related to the credit facility. During the year ended December 31, 2013, we received proceeds of $4.7 million from the exercise of employee stock options and contributions from participants in our Employee Stock Purchase Plan, and we incurred $4.6 million of costs related to net taxes paid on employee stock options exercises and restricted stock units vesting. In addition, we repurchased 0.6 million shares of common stock under our share repurchase plan at a cost of $4.8 million during the year ended December 31, 2013.
Off Balance Sheet Arrangements
As of December 31, 2015, we did not have any off balance sheet arrangements.
Capital Expenditures
For the years ended December 31, 2015, 2014 and 2013, we used $4.7 million, $8.9 million and $26.7 million, respectively, in cash to fund capital expenditures to create internally developed software, fund leasehold improvements and purchase servers, IT equipment and fixtures and fittings. We currently anticipate making capital expenditures between $4.0 million and $8.0 million during the year ending December 31, 2016.
56
Contractual Obligations
The following table summarizes our outstanding contractual obligations as of December 31, 2015 (in thousands):
|
|
|
Less than |
|
1-3 |
|
3-5 |
|
More than |
|
|
|
|
||||
|
|
|
1 year |
|
years |
|
years |
|
5 years |
|
Total |
|
|||||
|
Operating lease obligations |
|
$ |
2,033 |
|
$ |
5,582 |
|
$ |
1,509 |
|
$ |
— |
|
$ |
9,124 |
|
|
Total contractual obligations |
|
$ |
2,033 |
|
$ |
5,582 |
|
$ |
1,509 |
|
$ |
— |
|
$ |
9,124 |
|
Included in operating lease obligations are agreements to lease our primary office space in Santa Monica, California and other locations under various operating leases that have non-cancelable periods ending between February 2018 and February 2020.
At December 31, 2015, we had a cash collateralized standby letter of credit for approximately $1.2 million associated with one of our leases.
Indemnifications
In the normal course of business, we have provided certain indemnities, commitments and guarantees under which we may be required to make payments in relation to certain transactions. These indemnities include intellectual property indemnities to our customers, indemnities to our directors and officers to the maximum extent permitted under the laws of Delaware, indemnifications related to our lease agreements and indemnifications to sellers or buyers in connection with acquisitions and dispositions, respectively. In addition, our advertiser, content creation and distribution partner agreements contain certain indemnification provisions, which are generally consistent with those prevalent in our industry. We have not incurred significant obligations under indemnification provisions historically, and do not expect to incur significant obligations in the future. Accordingly, we have not recorded any liability for these indemnities.
Recent Accounting Pronouncements
See Note 2 of our Notes to Consolidated Financial Statements included in Part III, Item 15, “Exhibits, Financial Statement Schedules” of this Annual Report on Form 10-K.
Item 7A.Quantitative and Qualitative Disclosures About Market Risk
We are exposed to market risks in the ordinary course of our business. These risks primarily include interest rate, foreign exchange, inflation, and concentration of credit risk. To reduce and manage these risks, we assess the financial condition of our large advertising network providers, large direct advertisers and their agencies and other large customers when we enter into or amend agreements with them and limit credit risk by collecting in advance when possible and setting and adjusting credit limits where we deem appropriate. In addition, our recent investment strategy has been to invest in high credit quality financial instruments, which are highly liquid, are readily convertible into cash and that mature within three months from the date of purchase.
Foreign Currency Exchange Risk
While relatively small, we have operations and generate revenue from sources outside the United States. We have foreign currency risks related to our revenue being denominated in currencies other than the U.S. dollar, principally in the Euro and British Pound Sterling and a relatively smaller percentage of our expenses being denominated in such currencies. We do not believe movements in the foreign currencies in which we transact will significantly affect future net earnings or losses. Foreign currency risk can be quantified by estimating the change in cash flows resulting from a hypothetical 10% adverse change in foreign exchange rates. We believe such a change would not currently have a material impact on our results of operations. However, if our international operations grow, our risks associated with fluctuation in currency rates would become greater, and we intend to continue to assess our approach to managing this risk.
57
Inflation Risk
We do not believe that inflation has had a material effect on our business, financial condition or results of operations. If our costs were to become subject to significant inflationary pressures, we may not be able to fully offset such higher costs through price increases. Our inability or failure to do so could harm our business, financial condition and results of operations.
Concentrations of Credit Risk
As of December 31, 2015, our cash and cash equivalents were maintained primarily with six major U.S. financial institutions and three foreign banks. We also maintained cash balances with three Internet payment processors. Deposits with these institutions at times exceed the federally insured limits, which potentially subject us to concentration of credit risk. Historically, we have not experienced any losses related to these balances and believe that there is minimal risk of expected future losses. However, there can be no assurance that there will not be losses on these deposits.
Advertising network partners that accounted for more than 10% of our consolidated accounts receivable balance were as follows:
|
|
|
Year ended December 31, |
|
|
||
|
|
|
2015 |
|
2014 |
|
|
|
Google, Inc. |
|
26 |
% |
42 |
% |
|
Item 8.Financial Statements and Supplementary Data
The consolidated financial statements and supplementary data required by Item 8 are contained in Item 7 and Item 15 of this Annual Report on Form 10-K and are incorporated herein by reference.
Item 9.Changes in and Disagreements with Accountants on Accounting and Financial Disclosure
None.
Item 9A.Controls and Procedures
Definition and Limitations of Disclosure Controls and Procedures.
Our disclosure controls and procedures (as such term is defined in Rule 13a-15(e) under the Exchange Act) are designed to reasonably ensure that information required to be disclosed in our reports filed or submitted under the Exchange Act is (i) recorded, processed, summarized, and reported within the time periods specified in the SEC’s rules and forms and (ii) accumulated and communicated to management, including our principal executive officer and principal financial officer, as appropriate, to allow timely decisions regarding required disclosures. A control system, no matter how well designed and operated, can provide only reasonable assurance that it will detect or uncover failures within the Company to disclose material information otherwise required to be set forth in our periodic reports. Inherent limitations to any system of disclosure controls and procedures include, but are not limited to, the possibility of human error and the circumvention or overriding of such controls by one or more persons. In addition, we have designed our system of controls based on certain assumptions, which we believe are reasonable, about the likelihood of future events, and our system of controls may therefore not achieve its desired objectives under all possible future events.
Evaluation of Disclosure Controls and Procedures.
Our management, with the participation of our Chief Executive Officer and our Chief Financial Officer, has evaluated the effectiveness of our disclosure controls and procedures at December 31, 2015, the end of the period covered by this report. Based on this evaluation, the principal executive officer and principal financial officer concluded that, at December 31, 2015, our disclosure controls and procedures were effective to provide reasonable assurance that
58
information required to be disclosed by the Company in the reports that it files or submits under the Exchange Act is (i) recorded, processed, summarized, and reported on a timely basis, and (ii) accumulated and communicated to management, including our principal executive officer and principal financial officer, as appropriate to allow timely decisions regarding required disclosures.
Management’s Report on Internal Control Over Financial Reporting.
Management is responsible for establishing and maintaining adequate internal control over financial reporting (as defined in Rule 13a-15(f) under the Exchange Act). Under the supervision and with the participation of the Company’s management, including our Chief Executive Officer and our Chief Financial Officer, the Company conducted an evaluation of the effectiveness of its internal control over financial reporting based upon the framework in Internal Control - Integrated Framework issued by the Committee of Sponsoring Organizations of the Treadway Commission (2013 framework). Based on that evaluation, management concluded that the Company’s internal control over financial reporting was effective as of December 31, 2015.
The effectiveness of the Company’s internal control over financial reporting as of December 31, 2015 has been audited by PricewaterhouseCoopers LLP, an independent registered public accounting firm, as stated in their report which appears in this Annual Report on Form 10-K.
Changes in Internal Control over Financial Reporting.
There have been no changes in the Company’s internal control over financial reporting during the most recent fiscal quarter that have materially affected, or are reasonably likely to materially affect, the Company’s internal control over financial reporting.
None.
Item 10.Directors, Executive Officers, and Corporate Governance
The information required by this item will be set forth in our definitive proxy statement with respect to our 2016 annual meeting of stockholders (the “2016 Proxy Statement”) to be filed with the SEC, which is expected to be filed not later than 120 days after the end of our fiscal year ended December 31, 2015, and is incorporated herein by reference.
We have adopted a Code of Business Conduct and Ethics that applies to all of our directors, officers and employees, including our principal executive officer and principal financial officer. The Code of Business Conduct and Ethics is posted on our website at http://ir.demandmedia.com.
We intend to satisfy the disclosure requirement under Item 5.05 of Form 8-K regarding an amendment to, or waiver from, a provision of this Code of Business Conduct and Ethics by posting such information on our corporate website, at the address and location specified above and, to the extent required by the listing standards of the New York Stock Exchange, by filing a Current Report on Form 8-K with the SEC, disclosing such information.
Item 11.Executive Compensation
The information required by this item will be set forth in the 2016 Proxy Statement and is incorporated herein by reference.
59
Item 12.Security Ownership of Certain Beneficial Owners and Management and Related Stockholder Matters
The information required by this item will be set forth in the 2016 Proxy Statement and is incorporated herein by reference.
Item 13.Certain Relationships and Related Transactions, and Director Independence
The information required by this item will be set forth in the 2016 Proxy Statement and is incorporated herein by reference.
Item 14.Principal Accounting Fees and Services
The information required by this item will be set forth in the 2016 Proxy Statement and is incorporated herein by reference.
60
Item 15. EXHIBITS, FINANCIAL STATEMENT SCHEDULES
The following documents are filed as a part of this Annual Report on Form 10-K:
(a)Financial Statements:
The following consolidated financial statements are included in this Annual Report on Form 10-K on the pages indicated:
|
|
|
|
|
Page |
|
F-2 |
|
|
F-3 |
|
|
F-4 |
|
|
F-5 |
|
|
F-6 |
|
|
F-7 |
|
|
F-8 |
(b)Exhibits:
See the Exhibit Index on the page immediately preceding the exhibits for a list of exhibits filed as part of this Annual Report on Form 10-K, which Exhibit Index is incorporated herein by reference.
(c)Financial Statement Schedule:
All schedules are omitted because they are not applicable or the required information is shown in the financial statements or notes thereto.
61
SIGNATURES
Pursuant to the requirements of Section 13 or 15(d) of the Securities Exchange Act of 1934, the registrant has duly caused this report to be signed on its behalf by the undersigned, thereunto duly authorized.
|
|
DEMAND MEDIA, INC. |
|
|
|
|
|
|
|
By: |
/s/ SEAN MORIARTY |
|
|
|
SEAN MORIARTY |
|
|
|
Chief Executive Officer |
Date: March 1, 2016
POWER OF ATTORNEY
Each person whose individual signature appears below hereby authorizes and appoints Sean Moriarty, Rachel Glaser and Daniel Weinrot, and each of them, with full power of substitution and resubstitution and full power to act without the other, as his or her true and lawful attorney-in-fact and agent to act in his or her name, place and stead and to execute in the name and on behalf of each person, individually and in each capacity stated below, solely for the purposes of filing any and all amendments to this Annual Report on Form 10-K, and to file the same, with all exhibits thereto, and other documents in connection therewith, with the Securities and Exchange Commission, granting unto said attorneys-in-fact and agents, and each of them, full power and authority to do and perform each and every act and thing, ratifying and confirming all that said attorneys-in-fact and agents or any of them or their or his substitute or substitutes may lawfully do or cause to be done by virtue thereof.
Pursuant to the requirements of the Securities Exchange Act of 1934, this report has been signed below by the following persons on behalf of the registrant and in the capacities and on the dates indicated.
|
|
|
|
|
|
|
Name |
|
Title |
|
Date |
|
|
|
|
|
|
|
/S/ SEAN MORIARTY |
|
Chief Executive Officer and Director |
|
March 1, 2016 |
|
Sean Moriarty |
|
(Principal Executive Officer) |
|
|
|
|
|
|
|
|
|
/S/ RACHEL GLASER |
|
Chief Financial Officer |
|
March 1, 2016 |
|
Rachel Glaser |
|
(Principal Financial Officer) |
|
|
|
|
|
|
|
|
|
/S/ WENDY VOONG |
|
Chief Accounting Officer |
|
March 1, 2016 |
|
Wendy Voong |
|
(Principal Accounting Officer) |
|
|
|
|
|
|
|
|
|
/S/ JAMES QUANDT |
|
Chairman of the Board |
|
March 1, 2016 |
|
James Quandt |
|
|
|
|
|
|
|
|
|
|
|
/S/ FREDRIC W. HARMAN |
|
Director |
|
March 1, 2016 |
|
Fredric W. Harman |
|
|
|
|
|
|
|
|
|
|
|
/S/ JOHN A. HAWKINS |
|
Director |
|
March 1, 2016 |
|
John A. Hawkins |
|
|
|
|
|
|
|
|
|
|
|
/S/ VICTOR E. PARKER |
|
Director |
|
March 1, 2016 |
|
Victor E. Parker |
|
|
|
|
|
|
|
|
|
|
|
/S/ BRIAN REGAN |
|
Director |
|
March 1, 2016 |
|
Brian Regan
/S/ MITCHELL STERN |
|
Director |
|
March 1, 2016 |
|
Mitchell Stern |
|
|
|
|
62
INDEX TO CONSOLIDATED FINANCIAL STATEMENTS
|
|
|
|
|
Page |
|
Demand Media, Inc. Consolidated Financial Statements |
|
|
F-2 |
|
|
F-3 |
|
|
F-4 |
|
|
F-5 |
|
|
F-6 |
|
|
F-7 |
|
|
F-8 |
F-1
REPORT OF INDEPENDENT REGISTERED PUBLIC ACCOUNTING FIRM
To the Board of Directors and Stockholders of Demand Media, Inc.:
In our opinion, the accompanying consolidated balance sheets and the related consolidated statements of operations, comprehensive loss, stockholders’ equity and cash flows present fairly, in all material respects, the financial position of Demand Media, Inc. and its subsidiaries (the “Company”) at December 31, 2015 and December 31, 2014, and the results of their operations and their cash flows for each of the three years in the period ended December 31, 2015 in conformity with accounting principles generally accepted in the United States of America. Also in our opinion, the Company maintained, in all material respects, effective internal control over financial reporting as of December 31, 2015, based on criteria established in Internal Control - Integrated Framework (2013) issued by the Committee of Sponsoring Organizations of the Treadway Commission (COSO). The Company's management is responsible for these financial statements, for maintaining effective internal control over financial reporting and for its assessment of the effectiveness of internal control over financial reporting, included in Management’s Report on Internal Control over Financial Reporting appearing under Item 9A. Our responsibility is to express opinions on these financial statements and on the Company's internal control over financial reporting based on our integrated audits. We conducted our audits in accordance with the standards of the Public Company Accounting Oversight Board (United States). Those standards require that we plan and perform the audits to obtain reasonable assurance about whether the financial statements are free of material misstatement and whether effective internal control over financial reporting was maintained in all material respects. Our audits of the financial statements included examining, on a test basis, evidence supporting the amounts and disclosures in the financial statements, assessing the accounting principles used and significant estimates made by management, and evaluating the overall financial statement presentation. Our audit of internal control over financial reporting included obtaining an understanding of internal control over financial reporting, assessing the risk that a material weakness exists, and testing and evaluating the design and operating effectiveness of internal control based on the assessed risk. Our audits also included performing such other procedures as we considered necessary in the circumstances. We believe that our audits provide a reasonable basis for our opinions.
A company’s internal control over financial reporting is a process designed to provide reasonable assurance regarding the reliability of financial reporting and the preparation of financial statements for external purposes in accordance with generally accepted accounting principles. A company’s internal control over financial reporting includes those policies and procedures that (i) pertain to the maintenance of records that, in reasonable detail, accurately and fairly reflect the transactions and dispositions of the assets of the company; (ii) provide reasonable assurance that transactions are recorded as necessary to permit preparation of financial statements in accordance with generally accepted accounting principles, and that receipts and expenditures of the company are being made only in accordance with authorizations of management and directors of the company; and (iii) provide reasonable assurance regarding prevention or timely detection of unauthorized acquisition, use, or disposition of the company’s assets that could have a material effect on the financial statements.
Because of its inherent limitations, internal control over financial reporting may not prevent or detect misstatements. Also, projections of any evaluation of effectiveness to future periods are subject to the risk that controls may become inadequate because of changes in conditions, or that the degree of compliance with the policies or procedures may deteriorate.
/s/ PricewaterhouseCoopers LLP
Los Angeles, California
March 1, 2016
F-2
Demand Media, Inc. and Subsidiaries
(In thousands, except per share amounts)
|
|
|
December 31, |
|
December 31, |
|
||
|
|
|
2015 |
|
2014 |
|
||
|
Assets |
|
|
|
|
|
|
|
|
Current assets |
|
|
|
|
|
|
|
|
Cash and cash equivalents |
|
$ |
38,570 |
|
$ |
47,820 |
|
|
Accounts receivable, net |
|
|
10,469 |
|
|
14,504 |
|
|
Prepaid expenses and other current assets |
|
|
4,989 |
|
|
7,447 |
|
|
Total current assets |
|
|
54,028 |
|
|
69,771 |
|
|
Property and equipment, net |
|
|
14,568 |
|
|
22,836 |
|
|
Intangible assets, net |
|
|
21,332 |
|
|
40,535 |
|
|
Goodwill |
|
|
10,358 |
|
|
10,358 |
|
|
Other assets |
|
|
1,173 |
|
|
6,055 |
|
|
Total assets |
|
$ |
101,459 |
|
$ |
149,555 |
|
|
Liabilities and Stockholders' Equity |
|
|
|
|
|
|
|
|
Current liabilities |
|
|
|
|
|
|
|
|
Accounts payable |
|
$ |
1,973 |
|
$ |
4,762 |
|
|
Accrued expenses and other current liabilities |
|
|
15,169 |
|
|
24,225 |
|
|
Deferred revenue |
|
|
2,933 |
|
|
3,569 |
|
|
Total current liabilities |
|
|
20,075 |
|
|
32,556 |
|
|
Deferred tax liability |
|
|
551 |
|
|
334 |
|
|
Other liabilities |
|
|
1,713 |
|
|
1,823 |
|
|
Commitments and contingencies (Note 8) |
|
|
|
|
|
|
|
|
Stockholders’ equity |
|
|
|
|
|
|
|
|
Common stock, $0.0001 par value. Authorized 100,000 shares; 20,956 issued and 20,154 shares outstanding at December 31, 2015 and 20,543 issued and 19,741 shares outstanding at December 31, 2014 |
|
|
2 |
|
|
2 |
|
|
Additional paid-in capital |
|
|
505,603 |
|
|
497,809 |
|
|
Accumulated other comprehensive loss |
|
|
(91) |
|
|
(76) |
|
|
Treasury stock at cost, 802 at December 31, 2015 and December 31, 2014, respectively |
|
|
(30,767) |
|
|
(30,767) |
|
|
Accumulated deficit |
|
|
(395,627) |
|
|
(352,126) |
|
|
Total stockholders’ equity |
|
|
79,120 |
|
|
114,842 |
|
|
Total liabilities and stockholders’ equity |
|
$ |
101,459 |
|
$ |
149,555 |
|
The accompanying notes are an integral part of these consolidated financial statements.
F-3
Demand Media, Inc. and Subsidiaries
Consolidated Statements of Operations
(In thousands, except per share amounts)
|
|
|
Year ended December 31, |
|
|
|||||||
|
|
|
2015 |
|
2014 |
|
2013 |
|
|
|||
|
Revenue: |
|
|
|
|
|
|
|
|
|
|
|
|
Service revenue |
|
$ |
77,254 |
|
$ |
137,711 |
|
$ |
195,269 |
|
|
|
Product revenue |
|
|
48,715 |
|
|
34,718 |
|
|
14,142 |
|
|
|
Total revenue |
|
|
125,969 |
|
|
172,429 |
|
|
209,411 |
|
|
|
Operating expenses: |
|
|
|
|
|
|
|
|
|
|
|
|
Service costs (exclusive of amortization of intangible assets shown separately below) |
|
|
37,289 |
|
|
43,325 |
|
|
51,274 |
|
|
|
Product costs |
|
|
33,769 |
|
|
26,058 |
|
|
9,882 |
|
|
|
Sales and marketing |
|
|
20,319 |
|
|
20,046 |
|
|
36,275 |
|
|
|
Product development |
|
|
24,313 |
|
|
29,387 |
|
|
32,185 |
|
|
|
General and administrative |
|
|
38,344 |
|
|
50,179 |
|
|
53,014 |
|
|
|
Goodwill impairment charge |
|
|
— |
|
|
232,270 |
|
|
— |
|
|
|
Amortization of intangible assets |
|
|
18,706 |
|
|
38,316 |
|
|
36,519 |
|
|
|
Total operating expenses |
|
|
172,740 |
|
|
439,581 |
|
|
219,149 |
|
|
|
Loss from operations |
|
|
(46,771) |
|
|
(267,152) |
|
|
(9,738) |
|
|
|
Interest income |
|
|
361 |
|
|
328 |
|
|
5 |
|
|
|
Interest expense |
|
|
(143) |
|
|
(4,692) |
|
|
(1,642) |
|
|
|
Other income, net |
|
|
3,107 |
|
|
654 |
|
|
13 |
|
|
|
Loss from continuing operations before income taxes |
|
|
(43,446) |
|
|
(270,862) |
|
|
(11,362) |
|
|
|
Income tax (expense) benefit |
|
|
(55) |
|
|
14,713 |
|
|
(2,856) |
|
|
|
Net loss from continuing operations |
|
|
(43,501) |
|
|
(256,149) |
|
|
(14,218) |
|
|
|
Net loss from discontinued operations |
|
|
— |
|
|
(11,208) |
|
|
(5,956) |
|
|
|
Net loss |
|
$ |
(43,501) |
|
$ |
(267,357) |
|
$ |
(20,174) |
|
|
|
|
|
|
|
|
|
|
|
|
|
|
|
|
Earnings (Loss) per share - basic and diluted |
|
|
|
|
|
|
|
|
|
|
|
|
Net loss from continuing operations |
|
$ |
(2.18) |
|
$ |
(13.66) |
|
$ |
(0.80) |
|
|
|
Net loss from discontinued operations |
|
|
— |
|
|
(0.60) |
|
|
(0.34) |
|
|
|
Net loss per share |
|
$ |
(2.18) |
|
$ |
(14.26) |
|
$ |
(1.14) |
|
|
|
|
|
|
|
|
|
|
|
|
|
|
|
|
Weighted average number of shares - basic and diluted |
|
|
19,938 |
|
|
18,745 |
|
|
17,707 |
|
|
The accompanying notes are an integral part of these consolidated financial statements.
F-4
Demand Media, Inc. and Subsidiaries
Consolidated Statements of Comprehensive Loss
(In thousands)
|
|
|
Year ended December 31, |
|
|||||||
|
|
|
2015 |
|
2014 |
|
2013 |
|
|||
|
Net loss |
|
$ |
(43,501) |
|
$ |
(267,357) |
|
$ |
(20,174) |
|
|
Other comprehensive income (loss), net of tax: |
|
|
|
|
|
|
|
|
|
|
|
Foreign currency translation adjustment |
|
|
(15) |
|
|
(13) |
|
|
(75) |
|
|
Unrealized gain on marketable securities available-for-sale, net of tax expense of ($344) |
|
|
— |
|
|
— |
|
|
562 |
|
|
Realized gain on marketable securities available-for-sale, net of tax expense of $344 |
|
|
— |
|
|
(565) |
|
|
— |
|
|
Other comprehensive income (loss), net of tax: |
|
|
(15) |
|
|
(578) |
|
|
487 |
|
|
Comprehensive loss |
|
$ |
(43,516) |
|
$ |
(267,935) |
|
$ |
(19,687) |
|
The accompanying notes are an integral part of these consolidated financial statements.
F-5
Demand Media, Inc. and Subsidiaries
Consolidated Statements of Stockholders’ Equity
(In thousands)
|
|
|
|
|
|
|
|
|
|
|
|
|
|
Accumulated |
|
|
|
|
|
|
|
|
|
|
|
|
|
|
|
|
Additional |
|
|
|
|
other |
|
|
|
|
|
|
|
||
|
|
|
|
|
|
|
|
paid-in |
|
|
|
|
comprehensive |
|
|
|
|
Total |
|
|||
|
|
|
Common stock |
|
capital |
|
Treasury |
|
income |
|
Accumulated |
|
stockholders’ |
|
||||||||
|
|
|
Shares |
|
Amount |
|
amount |
|
Stock |
|
(loss) |
|
deficit |
|
equity |
|
||||||
|
Balance at December 31, 2012 |
|
17,386 |
|
$ |
11 |
|
$ |
562,692 |
|
$ |
(25,932) |
|
$ |
15 |
|
$ |
(64,595) |
|
$ |
472,191 |
|
|
Issuance of stock under employee stock awards and other, net |
|
452 |
|
|
— |
|
|
7,059 |
|
|
— |
|
|
— |
|
|
— |
|
|
7,059 |
|
|
Stock option windfall tax benefits |
|
— |
|
|
— |
|
|
88 |
|
|
— |
|
|
— |
|
|
— |
|
|
88 |
|
|
Stock-based compensation expense |
|
— |
|
|
— |
|
|
24,908 |
|
|
— |
|
|
— |
|
|
— |
|
|
24,908 |
|
|
Unrealized gain on marketable securities |
|
— |
|
|
— |
|
|
— |
|
|
— |
|
|
562 |
|
|
— |
|
|
562 |
|
|
Issuance of common stock for acquisitions |
|
416 |
|
|
— |
|
|
16,281 |
|
|
— |
|
|
— |
|
|
— |
|
|
16,281 |
|
|
Repurchase of common stock to be held in treasury |
|
(112) |
|
|
— |
|
|
— |
|
|
(4,835) |
|
|
— |
|
|
— |
|
|
(4,835) |
|
|
Foreign currency translation adjustment |
|
— |
|
|
— |
|
|
— |
|
|
— |
|
|
(75) |
|
|
— |
|
|
(75) |
|
|
Net loss |
|
— |
|
|
— |
|
|
— |
|
|
— |
|
|
— |
|
|
(20,174) |
|
|
(20,174) |
|
|
Balance at December 31, 2013 |
|
18,142 |
|
$ |
11 |
|
$ |
611,028 |
|
$ |
(30,767) |
|
$ |
502 |
|
$ |
(84,769) |
|
$ |
496,005 |
|
|
Issuance of stock under employee stock awards and other, net |
|
549 |
|
|
— |
|
|
344 |
|
|
— |
|
|
— |
|
|
— |
|
|
344 |
|
|
Stock-based compensation expense |
|
— |
|
|
— |
|
|
20,202 |
|
|
— |
|
|
— |
|
|
— |
|
|
20,202 |
|
|
Issuance of common stock for acquisitions |
|
1,050 |
|
|
— |
|
|
10,258 |
|
|
— |
|
|
— |
|
|
— |
|
|
10,258 |
|
|
Spin-off of Rightside Group, Ltd. |
|
— |
|
|
— |
|
|
(144,032) |
|
|
— |
|
|
— |
|
|
— |
|
|
(144,032) |
|
|
Reverse stock split |
|
— |
|
|
(9) |
|
|
9 |
|
|
— |
|
|
— |
|
|
— |
|
|
— |
|
|
Realized gain on marketable securities |
|
— |
|
|
— |
|
|
— |
|
|
— |
|
|
(565) |
|
|
— |
|
|
(565) |
|
|
Foreign currency translation adjustment |
|
— |
|
|
— |
|
|
— |
|
|
— |
|
|
(13) |
|
|
— |
|
|
(13) |
|
|
Net loss |
|
— |
|
|
— |
|
|
— |
|
|
— |
|
|
— |
|
|
(267,357) |
|
|
(267,357) |
|
|
Balance at December 31, 2014 |
|
19,741 |
|
$ |
2 |
|
$ |
497,809 |
|
$ |
(30,767) |
|
$ |
(76) |
|
$ |
(352,126) |
|
$ |
114,842 |
|
|
Issuance of stock under employee stock awards and other, net |
|
290 |
|
|
— |
|
|
464 |
|
|
— |
|
|
— |
|
|
— |
|
|
464 |
|
|
Issuance of stock for acquisition holdback |
|
123 |
|
|
— |
|
|
— |
|
|
— |
|
|
— |
|
|
— |
|
|
— |
|
|
Stock-based compensation expense |
|
— |
|
|
— |
|
|
7,330 |
|
|
— |
|
|
— |
|
|
— |
|
|
7,330 |
|
|
Foreign currency translation adjustment |
|
— |
|
|
— |
|
|
— |
|
|
— |
|
|
(15) |
|
|
— |
|
|
(15) |
|
|
Net loss |
|
— |
|
|
— |
|
|
— |
|
|
— |
|
|
— |
|
|
(43,501) |
|
|
(43,501) |
|
|
Balance at December 31, 2015 |
|
20,154 |
|
$ |
2 |
|
$ |
505,603 |
|
$ |
(30,767) |
|
$ |
(91) |
|
$ |
(395,627) |
|
$ |
79,120 |
|
The accompanying notes are an integral part of these consolidated financial statements.
F-6
Demand Media, Inc. and Subsidiaries
Consolidated Statements of Cash Flows
(In thousands)
|
|
|
Year ended December 31, |
|
|||||||
|
|
|
2015 |
|
2014 |
|
2013 |
|
|||
|
Cash flows from operating activities |
|
|
|
|
|
|
|
|
|
|
|
Net loss |
|
$ |
(43,501) |
|
$ |
(267,357) |
|
$ |
(20,174) |
|
|
Adjustments to reconcile net loss to net cash provided by (used in) operating activities: |
|
|
|
|
|
|
|
|
|
|
|
Depreciation and amortization |
|
|
29,884 |
|
|
59,473 |
|
|
64,910 |
|
|
Deferred income taxes |
|
|
— |
|
|
(14,409) |
|
|
3,901 |
|
|
Stock-based compensation |
|
|
7,562 |
|
|
21,815 |
|
|
27,384 |
|
|
Goodwill impairment charge |
|
|
— |
|
|
232,270 |
|
|
— |
|
|
Gain on disposal of businesses and properties |
|
|
(3,156) |
|
|
(795) |
|
|
— |
|
|
Gain on other assets, net |
|
|
— |
|
|
(5,745) |
|
|
(4,232) |
|
|
Extinguishment of debt |
|
|
— |
|
|
1,656 |
|
|
— |
|
|
Other |
|
|
(105) |
|
|
(1,650) |
|
|
(861) |
|
|
Change in operating assets and liabilities, net of effect of acquisition: |
|
|
|
|
|
|
|
|
|
|
|
Accounts receivable, net |
|
|
3,840 |
|
|
10,844 |
|
|
12,393 |
|
|
Prepaid expenses and other current assets |
|
|
917 |
|
|
(145) |
|
|
(375) |
|
|
Deferred registration costs |
|
|
— |
|
|
(8,876) |
|
|
(9,780) |
|
|
Deposits with registries |
|
|
— |
|
|
(259) |
|
|
(914) |
|
|
Other long-term assets |
|
|
(131) |
|
|
(585) |
|
|
(2,572) |
|
|
Accounts payable |
|
|
(2,794) |
|
|
(2,192) |
|
|
2,973 |
|
|
Accrued expenses and other liabilities |
|
|
(1,177) |
|
|
(1,341) |
|
|
(5,960) |
|
|
Deferred revenue |
|
|
223 |
|
|
11,957 |
|
|
9,470 |
|
|
Net cash (used in) provided by operating activities |
|
|
(8,438) |
|
|
34,661 |
|
|
76,163 |
|
|
Cash flows from investing activities |
|
|
|
|
|
|
|
|
|
|
|
Purchases of property and equipment |
|
|
(4,732) |
|
|
(8,918) |
|
|
(26,746) |
|
|
Purchases of intangible assets |
|
|
(87) |
|
|
(5,688) |
|
|
(16,772) |
|
|
Payments for gTLD applications |
|
|
— |
|
|
(15,829) |
|
|
(3,949) |
|
|
Proceeds from gTLD withdrawals, net |
|
|
— |
|
|
6,105 |
|
|
5,616 |
|
|
Cash received from disposal of businesses and properties, net of cash disposed |
|
|
5,071 |
|
|
13,696 |
|
|
— |
|
|
Cash received from early repayment of promissory note |
|
|
5,100 |
|
|
— |
|
|
— |
|
|
Cash received from disposition holdback |
|
|
998 |
|
|
— |
|
|
— |
|
|
Cash paid for acquisitions, net of cash acquired |
|
|
(58) |
|
|
(2,240) |
|
|
(73,626) |
|
|
Restricted deposits |
|
|
671 |
|
|
(3,064) |
|
|
— |
|
|
Other |
|
|
126 |
|
|
1,017 |
|
|
942 |
|
|
Net cash provided by (used in) investing activities |
|
|
7,089 |
|
|
(14,921) |
|
|
(114,535) |
|
|
Cash flows from financing activities |
|
|
|
|
|
|
|
|
|
|
|
Long-term debt borrowings |
|
|
— |
|
|
— |
|
|
96,250 |
|
|
Long-term debt repayments |
|
|
— |
|
|
(96,250) |
|
|
— |
|
|
Proceeds from exercises of stock options and contributions to ESPP |
|
|
464 |
|
|
478 |
|
|
4,746 |
|
|
Repurchases of common stock |
|
|
— |
|
|
— |
|
|
(4,835) |
|
|
Debt issuance costs |
|
|
— |
|
|
— |
|
|
(1,936) |
|
|
Net taxes paid on restricted stock units and options exercised |
|
|
(668) |
|
|
(2,902) |
|
|
(4,576) |
|
|
Cash paid for acquisition holdback |
|
|
(7,561) |
|
|
(1,945) |
|
|
— |
|
|
Cash distribution related to spin-off |
|
|
— |
|
|
(24,145) |
|
|
— |
|
|
Other |
|
|
(121) |
|
|
(654) |
|
|
(619) |
|
|
Net cash (used in) provided by financing activities |
|
|
(7,886) |
|
|
(125,418) |
|
|
89,030 |
|
|
Effect of foreign currency on cash and cash equivalents |
|
|
(15) |
|
|
(13) |
|
|
(80) |
|
|
Change in cash and cash equivalents |
|
|
(9,250) |
|
|
(105,691) |
|
|
50,578 |
|
|
Cash and cash equivalents, beginning of period |
|
|
47,820 |
|
|
153,511 |
|
|
102,933 |
|
|
Cash and cash equivalents, end of period |
|
$ |
38,570 |
|
$ |
47,820 |
|
$ |
153,511 |
|
|
|
|
|
|
|
|
|
|
|
|
|
|
|
|
|
|
|
|
|
|
|
|
|
|
Supplemental disclosure of cash flows |
|
|
|
|
|
|
|
|
|
|
|
Cash paid for interest |
|
$ |
143 |
|
$ |
2,296 |
|
$ |
849 |
|
|
Cash paid for taxes |
|
$ |
116 |
|
$ |
104 |
|
$ |
99 |
|
|
Stock issued for acquisitions |
|
$ |
731 |
|
$ |
10,258 |
|
$ |
16,281 |
|
|
Holdback liability related to acquisitions |
|
$ |
— |
|
$ |
1,700 |
|
$ |
8,247 |
|
|
Note receivable related to disposal of a business |
|
$ |
— |
|
$ |
4,946 |
|
$ |
— |
|
The accompanying notes are an integral part of these consolidated financial statements.
F-7
Demand Media, Inc. and Subsidiaries
Notes to Consolidated Financial Statements
1. Company Background and Overview
Demand Media, Inc. (“Demand Media” and, together with its consolidated subsidiaries, the “Company,” “our,” “we,” or “us”) is a Delaware corporation headquartered in Santa Monica, California. We are a diversified Internet company that builds platforms across its media and marketplaces properties to enable communities of creators to reach passionate audiences in large and growing lifestyle categories. Our business is comprised of two service offerings: Content & Media and Marketplaces.
On August 1, 2014, we completed the separation of Rightside Group, Ltd. (“Rightside”) from Demand Media, Inc., resulting in two independent, publicly traded companies (hereinafter referred to as the “Separation”). Following the Separation, Rightside operates the domain name services business, while we continue to own and operate our Content & Media and Marketplaces businesses. The Separation was structured as a pro rata tax-free dividend involving the distribution of all outstanding shares of Rightside common stock to holders of Demand Media common stock as of the August 1, 2014 record date (the “Distribution”). Immediately following the Distribution, we completed a 1-for-5, reverse stock split with respect to all of our outstanding and treasury shares of common stock, which is reflected retrospectively throughout the consolidated financial statements.
Content & Media
Our Content & Media service offering includes our leading owned and operated online properties that publish media content, including text articles, videos, photographs and designed visual formats. This content is published across several key categories on eHow.com (“eHow”), a do-it-yourself and how-to reference destination; Livestrong.com, a health and healthy living destination; Cracked.com (“Cracked”), a humor site offering original and engaging comedy-driven video series, text articles and blogs; and certain niche properties focused on specific interests. Additionally, our studioD business develops and executes content marketing strategies and creates custom content for third-party brands, advertisers and publishers.
Marketplaces
Through our Marketplaces service offering, we operate two leading art and design marketplaces where large communities of artists can market and sell their original artwork or original designs printed on a wide variety of products. Society6.com (“Society6”) provides artists with an online commerce platform to feature and sell their original designs on art prints, phone and tablet cases, t-shirts, throw pillows and other consumer and home décor products. SaatchiArt.com (“Saatchi Art”) is an online art gallery featuring a wide selection of original paintings, drawings, sculptures and photography that provides a global community of artists a curated environment in which to exhibit and sell their work directly to consumers around the world.
2. Basis of Presentations and Summary of Significant Accounting Policies
A summary of the significant accounting policies consistently applied in the preparation of the accompanying consolidated financial statements follows.
Basis of Presentation
Our common stock share information and related per share amounts included in the consolidated financial statements have been adjusted retroactively for all periods presented to reflect the 1-for-5 reverse stock split of our common stock that was effected on August 1, 2014.
F-8
The financial results of Rightside are presented as discontinued operations in our accompanying consolidated statements of operations for the years ended December 31, 2014 and 2013. Our statements of cash flows are presented on a combined basis, including continuing and discontinued operations. Unless it is otherwise disclosed, all other disclosures in our consolidated financial statements are related to our continuing operations.
Principles of Consolidation
The consolidated financial statements include the accounts of Demand Media and its wholly owned subsidiaries. Acquisitions are included in our consolidated financial statements from the date of the acquisition. Our purchase accounting resulted in all assets and liabilities of acquired businesses being recorded at their estimated fair values on the acquisition dates. All significant intercompany transactions and balances have been eliminated in consolidation.
Use of Estimates
The preparation of the consolidated financial statements in conformity with generally accepted accounting principles (“GAAP”) in the United States requires management to make estimates and assumptions that affect the reported amounts of assets and liabilities, the disclosure of contingent assets and liabilities at the date of the financial statements, and the reported amounts of revenue and expenses during the reporting period. Significant items subject to such estimates and assumptions include revenue, allowance for doubtful accounts, investments in equity interests, the assigned value of acquired assets and assumed liabilities in business combinations, useful lives and impairment of property and equipment, intangible assets, goodwill and other assets, the fair value of equity-based compensation awards, and deferred income tax assets and liabilities. Actual results could differ materially from those estimates. On an ongoing basis, we evaluate our estimates compared to historical experience and trends, which form the basis for making judgments about the carrying value of our assets and liabilities.
Cash and Cash Equivalents
We consider all highly liquid investments with a maturity of 90 days or less at the time of purchase to be cash equivalents. Cash and cash equivalents consist primarily of checking accounts, money market accounts, money market funds, and short-term certificates of deposit.
Investments in Equity
We account for investments in companies that we do not control or account for under the equity method of accounting either at fair value or using the cost method of accounting, as applicable. Investments in equity securities are carried at fair value if the fair value of the security is readily determinable. Equity investments carried at fair value are classified as marketable securities available-for-sale. Realized gains and losses for marketable securities available-for-sale are included in other income (expense), net in our consolidated statements of operations. Unrealized gains and losses, net of taxes, on marketable securities available-for-sale are included in our consolidated financial statements as a component of other comprehensive income (loss) and accumulated other comprehensive income (loss) (“AOCI”), until realized.
The cost of marketable securities sold is based upon the specific accounting method used. Any realized gains or losses on the sale of equity investments are reflected as a component of interest income or expense. For the year ended December 31, 2013, unrealized gains on marketable securities available-for-sale was $0.9 million. During the first quarter of 2014, we sold all of these marketable securities, resulting in a reclassification from other comprehensive income of $0.9 million of unrealized gains on marketable securities, which is recorded in discontinued operations. The sale of these marketable securities resulted in total realized gains of $1.4 million for the year ended December 31, 2014, which included in discontinued operations.
Revenue Recognition
We recognize revenue when four basic criteria are met: persuasive evidence of a sales arrangement exists; performance of services has occurred; the sales price is fixed or determinable; and collectability is reasonably assured.
F-9
We consider persuasive evidence of a sales arrangement to be the receipt of a signed contract. Collectability is assessed based on a number of factors, including transaction history and the credit worthiness of a customer. If it is determined that collection is not reasonably assured, revenue is not recognized until collection becomes reasonably assured, which is generally upon receipt of cash. We record cash received in advance of revenue recognition as deferred revenue.
For arrangements with multiple deliverables, we allocate revenue to each deliverable if the delivered item(s) has value to the customer on a standalone basis and, if the arrangement includes a general right of return relative to the delivered item, delivery or performance of the undelivered item(s) is considered probable and substantially in our control. The fair value of the selling price for a deliverable is determined using a hierarchy of (1) Company-specific objective and reliable evidence, then (2) third-party evidence, then (3) best estimate of selling price. We allocate any arrangement fee to each of the elements based on their relative selling prices.
Our revenue is principally derived from the following services and products:
Service Revenue
Content & Media
Advertising Revenue. We generate revenue from advertisements displayed alongside our content on our online properties and certain of our customers’ online properties. Articles, videos and other forms of content generate advertising revenue from a diverse mix of advertising methods including performance-based cost-per-click advertising, in which an advertiser pays only when a visitor clicks on an advertisement; display advertisements, where revenue is dependent upon the number of advertising impressions delivered; and sponsored content or advertising links. In determining whether an arrangement exists, we ensure that a binding arrangement is in place, such as a standard insertion order or a fully executed customer-specific agreement. Obligations pursuant to our advertising revenue arrangements typically include a minimum number of impressions or the satisfaction of other performance criteria. Revenue from performance-based arrangements is recognized as the related performance criteria are met. We assess whether performance criteria have been met and whether the fees are fixed or determinable based on a reconciliation of the performance criteria and an analysis of the payment terms associated with the transaction. The reconciliation of the performance criteria generally includes a comparison of third-party performance data to the contractual performance obligation and to internal or customer performance data in circumstances where that data is available.
Where we enter into revenue-sharing arrangements with our customers, such as those relating to our advertiser network, and when we are considered the primary obligor, we report the underlying revenue on a gross basis in our consolidated statements of operations, and record these revenue-sharing payments to our customers in service costs.
Social Media Services. Prior to the sale of our Pluck social media business, we configured, hosted, and maintained our platform for social media services under private-labeled versions of software for commercial customers. We earned revenue from our social media services through recurring management support fees, overage fees in excess of standard usage terms, outside consulting fees and initial set-up fees. Due to the fact that social media services customers had no contractual right to take possession of our private-labeled software, we accounted for our social media services revenue as service arrangements. Social media services revenue was recognized when persuasive evidence of an arrangement existed, delivery of the service had occurred and no significant obligations remained, the selling price was fixed or determinable, and collectability was reasonably assured. In February 2015, we sold our Pluck social media business and we no longer provide any social media services. The consideration we received for Pluck was a $3.8 million cash payment after working capital adjustments, resulting in a gain of $2.1 million, which is recorded in other income, net.
Content Sales and Licensing Revenue. We generate revenue from the sale or license of media content, including the creation and distribution of content for third party brands, publishers and agencies through our studioD business. Revenue from the sale or perpetual license of media content is recognized when the content has been delivered and the contractual performance obligations have been fulfilled. Revenue from the non-perpetual license of media content is recognized over the period of the license as content is delivered or when other related performance criteria are fulfilled.
F-10
In circumstances where we distribute our content on third-party properties and the customer acts as the primary obligor, we recognize revenue on a net basis.
Marketplaces
Art Commissions Revenue. We generate service revenue from commissions we receive from facilitating the sale of original art by artists to customers through Saatchi Art. We recognize service revenue arising from the sale of original art net of amounts paid to the artist because we are not the primary obligor in the transaction, we do not have inventory risk, and we do not establish the prices for the art sold. We also recognize this service revenue net of any sales allowances. Revenue is recognized after the original art has been delivered and the return period has expired. Payments received in advance of delivery and completion of the return period are included in deferred revenue in the accompanying consolidated balance sheets. We periodically provide incentive offers to customers to encourage purchases, including percentage discounts off current purchases, free shipping and other offers. Value-added taxes (“VAT’), sales tax and other taxes are not included in revenue because we are a pass-through conduit for collecting and remitting any such taxes.
Product Revenue
We recognize product revenue from sales of Society6 products upon delivery, net of estimated returns based on historical experience. Product revenue for Society6 is recognized net of sales allowances and return allowances. We recognize product revenue from the sale of prints through Saatchi Art when the prints are delivered and the return period has expired. Payments received in advance of delivery and, with respect to the Saatchi Art prints, prior to completion of the return period are included in deferred revenue in the accompanying consolidated balance sheets. Product revenue is recorded at the gross amount due to the following factors: we are the primary obligor in a transaction, we have inventory and credit risk, and we have latitude in establishing prices and selecting suppliers. We periodically provide incentive offers to customers to encourage purchases, including percentage discounts off current purchases, free shipping and other offers. VAT, sales tax and other taxes are not included in product revenue because we are a pass-through conduit for collecting and remitting any such taxes.
Service Costs
Service costs consist of payments relating to our Internet connection and co-location charges and other platform operating expenses, including depreciation of the systems and hardware used to build and operate our content creation and distribution platform; expenses related to creating, rewriting, or auditing certain content units; and personnel costs related to in-house editorial, customer service and information technology. Service costs also include payments to our customers pursuant to revenue-sharing arrangements where we are the primary obligor.
Product Costs
Product costs consist of outsourced product manufacturing costs, artist royalties and personnel costs.
Shipping and Handling
Shipping and handling charged to customers are recorded in service revenue or product revenue. Associated costs are recorded in service costs or product costs.
Accounts Receivable
Accounts receivable primarily consist of amounts due from:
|
· |
Third parties who provide advertising services to our owned and operated websites in exchange for a share of the underlying advertising revenue. Accounts receivable from third parties are recorded as the amount of the revenue share as reported to us by the advertising networks and are generally due within 30 to 60 days from the month-end in which the invoice is generated; |
F-11
|
· |
Third party brands, publishers, and advertisers who engage us to create and publish content in a wide variety of formats including text articles and blogs, videos, original photography, slideshows, and infographics. Content sales accounts receivable are generally due within 30 to 60 days; |
|
· |
Direct advertisers who engage us to deliver branded advertising impressions. Accounts receivable from direct advertisers are recorded at negotiated advertising rates (customarily based on advertising impressions) and as the related advertising is delivered over our owned and operated websites. Direct advertising accounts receivable are generally due within 30 to 60 days from the date the advertising services are delivered and billed; |
|
· |
Customers who syndicate our content over their websites in exchange for a share of related advertising revenue. Accounts receivable from these customers are recorded as the revenue share as reported by the underlying customers and are generally due within 30 days. |
We maintain an allowance for doubtful accounts to reserve for potentially uncollectible receivables from our customers based on our best estimate of the amount of probable losses in existing accounts receivable. We determine the allowance based on an analysis of historical bad debts, advertiser concentrations, advertiser credit-worthiness and current economic trends. In addition, past due balances over 60 days and specific other balances are reviewed individually for collectability at least quarterly.
The allowance for doubtful account activity is as follows (in thousands):
|
|
|
|
|
|
|
|
|
|
|
|
|
|
|
|
|
|
Balance at |
|
Charged to |
|
|
|
|
Balance at |
|
|||
|
|
|
beginning of |
|
costs and |
|
Write-offs, net |
|
end of |
|
||||
|
|
|
period |
|
expenses |
|
of recoveries |
|
period |
|
||||
|
December 31, 2015 |
|
$ |
218 |
|
$ |
52 |
|
$ |
(73) |
|
$ |
197 |
|
|
December 31, 2014 |
|
$ |
340 |
|
$ |
— |
|
$ |
(122) |
|
$ |
218 |
|
|
December 31, 2013 |
|
$ |
369 |
|
$ |
61 |
|
$ |
(90) |
|
$ |
340 |
|
Deferred Revenue
Deferred revenue consists of amounts received from or invoiced to customers before we have met all four criteria for the recognition of revenue. Deferred revenue includes payments received from sales of our products on Society6 prior to delivery of such products; payments made for original art and prints sold via Saatchi Art that are collected prior to the completion of the return period; amounts billed to custom content customers prior to delivery of content; and sales of subscriptions for premium content or services not yet delivered.
Property and Equipment
Property and equipment are stated at cost less accumulated depreciation. Depreciation is computed using the straight-line method over the estimated useful lives of the assets. Computer equipment is amortized over three years, software is amortized over two to three years, and furniture and fixtures are amortized over five years. Leasehold improvements are amortized straight-line over the shorter of the remaining lease term or the estimated useful lives of the improvements ranging from one to ten years. Upon the sale or retirement of property or equipment, the cost and related accumulated depreciation or amortization is removed from our financial statements with the resulting gain or loss reflected in our results of operations. Repairs and maintenance costs are expensed as incurred. In the event that property and equipment is no longer in use, we will record a loss on disposal of the property and equipment, which is computed as difference between the sales price, if any, and the net remaining value (gross amount of property and equipment less accumulated depreciation expense) of the related equipment at the date of disposal.
F-12
Intangible Assets — Media Content
We capitalize the direct costs incurred to acquire our media content that is determined to embody a probable future economic benefit. Costs are recognized as finite-lived intangible assets based on their acquisition cost to us. All costs incurred to deploy and publish content are expensed as incurred, including the costs incurred for the ongoing maintenance of websites on which our content resides. We generally acquire content when our internal systems and processes provide reasonable assurance that, given predicted consumer and advertiser demand relative to our predetermined cost to acquire the content, the content unit will generate revenue over its useful life that exceeds the cost of acquisition. In determining whether content embodies a probable future economic benefit required for asset capitalization, we make judgments and estimates including the forecasted number of visits and the advertising rates that the content will generate. These estimates and judgments take into consideration various inherent uncertainties including, but not limited to, total expected visits over the content’s useful life; the fact that our content creation and distribution model is evolving and may be impacted by competition and technological advancements; our ability to expand existing and enter into new distribution channels and applications for our content; and whether we will be able to generate similar economic returns from content in the future. Management has reviewed, and intends to regularly review, the operating performance of content in determining probable future economic benefits of our content.
Capitalized media content is amortized on a straight-line basis over its useful life, which is typically five years, representing our estimate of when the underlying economic benefits are expected to be realized and based on our estimates of the projected cash flows from advertising revenue expected to be generated by the deployment of such content. These estimates are based on our plans and projections, comparison of the economic returns generated by our content with content of comparable quality and an analysis of historical cash flows generated by that content to date.
We continue to perform evaluations of our existing content library to identify potential improvements in our content creation and distribution platform. As a result of these evaluations, we elected to remove certain content units from our content library, resulting in $3.4 million, $7.7 million and $3.1 million of related accelerated amortization expense in the years ended December 31, 2015, 2014 and 2013, respectively.
Intangibles Assets — Acquired in Business Combinations
We perform valuations of assets acquired and liabilities assumed on each acquisition accounted for as a business combination and allocate the purchase price of each acquired business to our respective net tangible and intangible assets. Acquired intangible assets include: trade names, non-compete agreements, owned website names, artist relationships, customer relationships, technology, media content, and content publisher relationships. We determine the appropriate useful life by performing an analysis of expected cash flows based on historical experience of the acquired businesses. Intangible assets are amortized over their estimated useful lives using the straight-line method which approximates the pattern in which the economic benefits are consumed.
Long-lived Assets
We evaluate the recoverability of our long-lived tangible and intangible assets with finite useful lives for impairment when events or changes in circumstances indicate that the carrying amount of an asset group may not be recoverable. Such trigger events or changes in circumstances may include: a significant decrease in the market price of a long-lived asset, a significant adverse change in the extent or manner in which a long-lived asset is being used, a significant adverse change in legal factors or in the business climate, including those resulting from technology advancements in the industry, the impact of competition or other factors that could affect the value of a long-lived asset, a significant adverse deterioration in the amount of revenue or cash flows we expect to generate from an asset group, an accumulation of costs significantly in excess of the amount originally expected for the acquisition or development of a long-lived asset, current or future operating or cash flow losses that demonstrate continuing losses associated with the use of a long-lived asset, or a current expectation that, more likely than not, a long-lived asset will be sold or otherwise disposed of significantly before the end of its previously estimated useful life. We perform impairment testing at the asset group level that represents the lowest level for which identifiable cash flows are largely independent of the cash flows of other assets and liabilities. If events or changes in circumstances indicate that the carrying amount of an asset group may not be recoverable and the expected undiscounted future cash flows attributable to the asset group are less
F-13
than the carrying amount of the asset group, an impairment loss equal to the excess of the asset’s carrying value over its fair value is recorded. Fair value is determined based upon estimated discounted future cash flows. We did not recognize any impairment loss for long-lived assets for the year ended December 31, 2015. Assets to be disposed of or held for sale would be separately presented on the balance sheets and reported at the lower of their carrying amount or fair value less costs to sell, and would no longer be depreciated or amortized.
Goodwill
Goodwill represents the excess of the cost of an acquired entity over the fair value of the acquired net assets. Goodwill is tested for impairment annually during the fourth quarter of our fiscal year or when events or circumstances change in a manner that indicates goodwill might be impaired. Events or circumstances that could trigger an impairment review include, but are not limited to, a significant adverse change in legal factors or in the business climate, an adverse action or assessment by a regulator, unanticipated competition, a loss of key personnel, significant changes in the manner of our use of the acquired assets or the strategy for our overall business, significant negative industry or economic trends, a decline in our stock price leading to an extended period when our market capitalization is less than the book value of our net assets or significant underperformance relative to expected historical or projected future results of operations.
Goodwill is tested for impairment at the reporting unit level, which is one level below or the same as an operating segment. During the second quarter of 2015, we made certain changes to our management structure below our chief operating decision maker and, as a result of these changes, we determined that Society6, which had previously been included in our content and media reporting unit, should be combined with the Saatchi Art reporting unit to create a marketplaces reporting unit. As a result of these changes we determined that we have two reporting units as of December 31, 2015. A change in reporting units requires that goodwill be tested for impairment. Therefore, we performed an interim assessment of impairment of goodwill for the Saatchi Art reporting unit during the second quarter of 2015 and determined an impairment did not exist. As of December 31, 2015, we determined that we have two reporting units: content and media and marketplaces.
When testing goodwill for impairment, we first perform a qualitative assessment to determine whether it is necessary to perform step one of a two-step goodwill impairment test for each reporting unit. We are required to perform step one only if we conclude that it is more likely than not that a reporting unit’s fair value is less than the carrying value of its assets. Should this be the case, the first step of the two-step process is to identify whether a potential impairment exists by comparing the estimated fair values of our reporting units with their respective carrying values, including goodwill. If the estimated fair value of a reporting unit exceeds the carrying value, goodwill is not considered to be impaired and no additional steps are necessary. If, however, the fair value of a reporting unit is less than its carrying value, then a second step is performed to measure the amount of the impairment loss, if any. The amount of the impairment loss is the excess of the carrying amount of the goodwill over its implied fair value. The estimate of implied fair value of goodwill is primarily based on an estimate of the discounted cash flows expected to result from that reporting unit, but may require valuations of certain internally generated and unrecognized intangible assets such as our software, technology, patents and trademarks.
For the year ended December 31, 2014, due to unexpected revenue declines attributable to lower traffic and monetization yield on certain of our content and media websites, we lowered our future cash flow expectations. As a result of the decline in our cash flow forecast as well as a sustained decline in our market capitalization which remained at a level below the book value of our net assets for an extended period of time, we performed an interim assessment of impairment of the goodwill in our content and media reporting unit in the third quarter of 2014. Based on our analyses, we determined that the implied fair value of goodwill was substantially lower than the carrying value of goodwill for the content and media reporting unit and as a result, we determined that the implied fair value of the goodwill in the content and media reporting unit was zero. Accordingly, we recorded $232.3 million for the goodwill impairment charge in 2014.
For the year ended December 31, 2015, we performed our annual goodwill impairment test in the fourth quarter of the year, consistent with our existing accounting policy, and we determined that there was no impairment charge for the year ended December 31, 2015. As of December 31, 2015, there was $10.4 million of goodwill recorded in our marketplaces reporting unit. We may be required to record goodwill impairment charges in future periods.
F-14
Operating Leases
For operating leases that include rent-free periods or escalation clauses over the term of the lease, we recognize rent expense on a straight-line basis and the difference between expense and amounts paid are recorded as deferred rent in current and long-term liabilities.
Advertising Costs
Advertising costs are expensed as incurred and generally consist of Internet based advertising, sponsorships, and trade shows. Such costs are included in sales and marketing expense in our consolidated statements of operations. Advertising expense was $1.9 million, $2.2 million and $2.5 million for the years ended December 31, 2015, 2014 and 2013, respectively.
Stock-Based Compensation
We measure and recognize compensation expense for all stock-based payment awards made to employees, non-employees and directors based on the grant date fair values of the awards. Our stock-based payment awards are comprised principally of restricted stock units and stock options.
For stock-based payment awards issued to employees with service based vesting conditions the fair value is estimated using the Black-Scholes-Merton option pricing model. For premium-priced stock options with service and/or performance-based vesting conditions, the fair value is estimated using the Hull-White model. The value of an award that is ultimately expected to vest is recognized as expense over the requisite service periods in our consolidated statements of operations. We elected to treat stock-based payment awards with graded vesting schedules and time-based service conditions as a single award and recognize stock-based compensation expense on a straight-line basis (net of estimated forfeitures) over the requisite service period. Stock-based compensation expense is classified in the consolidated statement of operations based on the department to which the related employee provides service.
The Black-Scholes-Merton option pricing model requires management to make assumptions and to apply judgment in determining the fair value of our awards. The most significant assumptions and judgments include the expected volatility, expected term of the award and estimated forfeiture rates.
We estimated the expected volatility of our awards from the historical volatility of selected public companies with comparable characteristics to Demand Media, including similarity in size, lines of business, market capitalization, revenue and financial leverage. We calculated the weighted average expected life of our options based upon our historical experience of option exercises combined with estimates of the post-vesting holding period. The risk-free interest rate is based on the implied yield currently available on U.S. Treasury notes with terms approximately equal to the expected life of the option. The expected dividend rate is zero as we currently have no history or expectation of paying cash dividends on our common stock. The forfeiture rate is established based on applicable historical forfeiture patterns adjusted for any expected changes in future periods.
Under the Demand Media Employee Stock Purchase Plan (“ESPP”), during any offering period, eligible officers and employees can purchase a limited amount of Demand Media’s common stock at a discount to the market price in accordance with the terms of the plan. We use the Black-Scholes-Merton option pricing model to determine the fair value of the ESPP awards granted which is recognized straight-line over the total offering period.
Stock Repurchases
Under a stock repurchase plan, shares repurchased by us are accounted for when the transaction is settled. Repurchased shares held for future issuance are classified as treasury stock. Shares formally or constructively retired are deducted from common stock at par value and from additional paid in capital for the excess over par value. If additional paid in capital has been exhausted, the excess over par value is deducted from retained earnings. Direct costs incurred to acquire the shares are included in the total cost of the repurchased shares.
F-15
Product Development and Software Development Costs
Product development expenses consist primarily of expenses incurred in research and development, software engineering and web design activities and related personnel compensation to create, enhance and deploy our software infrastructure. Product and software development costs, other than software development costs qualifying for capitalization, are expensed as incurred. Costs of computer software developed or obtained for internal use that are incurred in the preliminary project and post implementation stages are expensed as incurred. Certain costs incurred during the application and development stage, which include compensation and related expenses, costs of computer hardware and software, and costs incurred in developing additional features and functionality of the services, are capitalized. The estimated useful life of costs capitalized is evaluated for each specific project. Capitalized costs are generally amortized using the straight-line method over a three year estimated useful life, beginning in the period in which the software is ready for its intended use. Unamortized amounts are included in property and equipment, net in the accompanying consolidated balance sheets. The net book value of capitalized software development costs is $7.2 million (net of $15.6 million accumulated amortization) and $12.0 million (net of $24.7 million accumulated amortization) as of December 31, 2015 and 2014, respectively.
Income Taxes
Deferred income taxes are recognized for differences between financial reporting and tax bases of assets and liabilities at the enacted statutory tax rates in effect for the years in which the temporary differences are expected to reverse. The effect on deferred taxes of a change in tax rates is recognized in income in the period that includes the enactment date. We evaluate the realizability of deferred tax assets and recognize a valuation allowance for our deferred tax assets when it is more likely than not that a future benefit on such deferred tax assets will not be realized.
We recognize the tax benefit from an uncertain tax position only if it is more likely than not that the tax position will be sustained on examination by the taxing authorities, based on the technical merits of the position. The tax benefits recognized in the consolidated financial statements from such positions are then measured based on the largest benefit that has a greater than 50% likelihood of being realized upon settlement. We recognize interest and penalties accrued related to unrecognized tax benefits in our income tax (benefit) provision in the accompanying consolidated statements of operations.
Net Income (Loss) Per Share
Basic net income (loss) per share is computed by dividing the net income (loss) attributable to common stockholders by the weighted average number of common shares outstanding during the period. Diluted net income (loss) per share is computed by dividing the net income (loss) attributable to common stockholders by the weighted average common shares outstanding plus potentially dilutive common shares. Restricted stock units (“RSUs”) are considered outstanding common shares and included in the computation of basic income (loss) per share as of the date that all necessary conditions of vesting are satisfied. RSUs, stock options and stock issued pursuant to the ESPP are excluded from the diluted net income (loss) per share calculation when their impact is antidilutive. We reported a net loss for the years ended December 31, 2015, 2014 and 2013, and as a result, all potentially dilutive common shares are considered antidilutive for these periods.
Foreign Currency Transactions
Foreign currency transaction gains and losses are charged or credited to earnings as incurred. For the years ended December 31, 2015, 2014 and 2013, foreign currency transaction gains and losses that are included in other income (expense) in the accompanying statements of operations were not significant.
Foreign Currency Translation
The financial statements of foreign subsidiaries are translated into U.S. dollars. Where the functional currency of a foreign subsidiary is its local currency, balance sheet accounts are translated at the current exchange rate and income
F-16
statement items are translated at the average exchange rate for the period. Gains and losses resulting from translation are accumulated in accumulated other comprehensive earnings within stockholders’ equity.
Fair Value of Financial Instruments
The carrying amounts of our financial instruments, including cash and cash equivalents, accounts receivable, restricted cash and accounts payable approximate fair value because of their short maturities. Certain assets, including goodwill and intangible assets, are also subject to measurement at fair value on a nonrecurring basis, if they are deemed to be impaired as the result of an impairment review.
Discontinued Operations
We report the results of operations of a business as discontinued operations if the disposal of a component represents a strategic shift that has (or will have) a major effect on our operations and financial results. The results of discontinued operations are reported in net income (loss) from discontinued operations in the consolidated statements of operations for current and prior periods commencing in the period in which the business meets the criteria of a discontinued operation, and include any gain or loss recognized on closing or adjustment of the carrying amount to fair value less cost to sell. The financial results of Rightside are presented as discontinued operations in our accompanying consolidated statements of operations for the years ended December 31, 2014 and 2013.
Assets Held-For-Sale
We report a business as held-for-sale when management has approved or received approval to sell the business and is committed to a formal plan, the business is available for immediate sale, the business is being actively marketed, the sale is probable and anticipated to occur during the ensuing year and certain other specified criteria are met. A business classified as held-for-sale is recorded at the lower of its carrying amount or estimated fair value less cost to sell. If the carrying amount of the business exceeds its estimated fair value, a loss is recognized. Depreciation is not recorded on long-lived assets of a business classified as held-for-sale. Assets and liabilities related to a business classified as held-for-sale are segregated in the consolidated balance sheet and may be included in an “other assets” or “other liabilities” line item or, if material, presented as a separate line item on the balance sheet. Major classes are separately disclosed in the notes to the consolidated financial statements commencing in the period in which the business is classified as held-for-sale.
Recent Accounting Pronouncements
In May 2014, the Financial Accounting Standards Board (“FASB”) issued Accounting Standards Update (“ASU”) 2014-09, Revenue from Contracts with Customers, which will supersede nearly all existing revenue recognition guidance under U.S. GAAP. The core principle of the guidance is that an entity should recognize revenue when it transfers promised goods or services to customers in an amount that reflects the consideration to which the company expects to be entitled in exchange for those goods or services. Further, the guidance requires improved disclosures to help users of financial statements better understand the nature, amount, timing and uncertainty of revenue that is recognized. The original effective date for ASU 2014-09 would have required the Company to adopt this standard beginning in the first quarter of 2017. In July 2015, the FASB voted to amend ASU 2014-09 by approving a one-year deferral of the effective date as well as providing the option to early adopt the standard on the original effective date. Accordingly, the Company may not adopt the standard until the first quarter of 2018. The new revenue standard may be applied retrospectively to each prior period presented or retrospectively with the cumulative effect recognized as of the date of adoption. We are currently evaluating the timing of its adoption and the impact of adopting the new revenue standard on our consolidated financial statements.
In September 2015, the FASB issued an update to ASC 805, Business Combinations: Simplifying the Accounting Measurement-Period Adjustments. This update simplifies the accounting for adjustments made to provisional amounts recognized in a business combination by eliminating the requirement to retrospectively account for those adjustments. Under this update, the adjustments are recognized in the reporting period in which the adjustment amounts are determined. This update is effective for the Company commencing in the first quarter of fiscal year 2017 and should be
F-17
applied prospectively. Early adoption is permitted. We are currently evaluating the impact of this amended guidance on our consolidated financial statements.
In November 2015, the FASB issued ASU No. 2015-17, Income Taxes (Topic 740): Balance Sheet Classification of Deferred Taxes. This amended guidance requires an entity to present deferred tax assets and liabilities as noncurrent in the statement of financial position. The amended guidance is effective for the Company commencing in the first quarter of fiscal 2018. Early adoption is permitted. We expect the adoption of this update will result in a reclassification of deferred tax amounts on the consolidated balance sheets.
In February 2016, the FASB issued ASU No. 2016-02, Leases (Topic 842). This update will require lease assets and lease liabilities to be recognized on the balance sheet and disclosure of key information about leasing arrangements. This guidance is effective for the Company commencing in the first quarter of fiscal 2019 and must be adopted using a modified retrospective transition, and provides for certain practical expedients. Early adoption is permitted. We are currently evaluating the impact of this standard on our consolidated financial statements.
3. Property and Equipment
Property and equipment consisted of the following (in thousands):
|
|
|
|
|
|
|
|
|
|
|
|
December 31, |
|
December 31, |
|
||
|
|
|
2015 |
|
2014 |
|
||
|
Computers and other related equipment |
|
$ |
16,588 |
|
$ |
28,776 |
|
|
Purchased and internally developed software |
|
|
34,868 |
|
|
48,875 |
|
|
Furniture and fixtures |
|
|
1,423 |
|
|
3,004 |
|
|
Leasehold improvements |
|
|
7,296 |
|
|
7,591 |
|
|
|
|
|
60,175 |
|
|
88,246 |
|
|
Less accumulated depreciation |
|
|
(45,607) |
|
|
(65,410) |
|
|
Property and equipment, net |
|
$ |
14,568 |
|
$ |
22,836 |
|
At December 31, 2015, total software under capital lease and vendor financing obligations consisted of $3.8 million and was fully amortized. At December 31, 2014, total software under capital lease and vendor financing obligations consisted $3.8 million with accumulated amortization of $3.7 million. Amortization expense for assets under capital lease and vendor financing obligations was not material for the year ended December 31, 2015, and was $0.7 million for both of the years ended December 31, 2014 and 2013.
Depreciation expense for the periods shown is classified as follows (in thousands):
|
|
|
Year ended December 31, |
|
|
|||||||
|
|
|
2015 |
|
2014 |
|
2013 |
|
|
|||
|
Service costs |
|
$ |
5,965 |
|
$ |
6,798 |
|
$ |
9,594 |
|
|
|
Sales and marketing |
|
|
67 |
|
|
156 |
|
|
275 |
|
|
|
Product development |
|
|
200 |
|
|
496 |
|
|
645 |
|
|
|
General and administrative |
|
|
4,946 |
|
|
4,802 |
|
|
3,942 |
|
|
|
Discontinued operations |
|
|
— |
|
|
4,662 |
|
|
6,045 |
|
|
|
Total depreciation |
|
$ |
11,178 |
|
$ |
16,914 |
|
$ |
20,501 |
|
|
As a result of the shortening our estimated useful lives for certain assets, we recorded accelerated depreciation expense of approximately $2.1 million, $1.3 million and $0.8 million for the years ended December 31, 2015, 2014 and 2013.
F-18
4. Intangible Assets
Intangible assets consisted of the following (in thousands):
|
|
|
December 31, 2015 |
|
|
|
|||||||
|
|
|
Gross carrying |
|
Accumulated |
|
Net carrying |
|
Weighted average |
|
|||
|
|
|
amount |
|
amortization |
|
amount |
|
useful life (years) |
|
|||
|
Customer relationships |
|
$ |
1,628 |
|
$ |
(1,107) |
|
$ |
521 |
|
3.8 |
|
|
Artist relationships |
|
|
11,719 |
|
|
(8,340) |
|
|
3,379 |
|
4.1 |
|
|
Media content |
|
|
95,785 |
|
|
(85,018) |
|
|
10,767 |
|
5.1 |
|
|
Technology |
|
|
5,854 |
|
|
(2,842) |
|
|
3,012 |
|
4.7 |
|
|
Non-compete agreements |
|
|
217 |
|
|
(160) |
|
|
57 |
|
3.0 |
|
|
Trade names |
|
|
7,150 |
|
|
(3,554) |
|
|
3,596 |
|
10.5 |
|
|
|
|
$ |
122,353 |
|
$ |
(101,021) |
|
$ |
21,332 |
|
|
|
|
|
|
December 31, 2014 |
|
|
|
|||||||
|
|
|
Gross carrying |
|
Accumulated |
|
Net carrying |
|
Weighted average |
|
|||
|
|
|
amount |
|
amortization |
|
amount |
|
useful life (years) |
|
|||
|
Customer relationships |
|
$ |
9,569 |
|
$ |
(8,730) |
|
$ |
839 |
|
4.1 |
|
|
Artist relationships |
|
|
11,719 |
|
|
(4,796) |
|
|
6,923 |
|
4.1 |
|
|
Media content |
|
|
103,415 |
|
|
(80,249) |
|
|
23,166 |
|
5.0 |
|
|
Technology |
|
|
27,770 |
|
|
(23,293) |
|
|
4,477 |
|
6.2 |
|
|
Non-compete agreements |
|
|
253 |
|
|
(146) |
|
|
107 |
|
3.2 |
|
|
Trade names |
|
|
10,478 |
|
|
(5,467) |
|
|
5,011 |
|
10.3 |
|
|
Content publisher relationships |
|
|
2,092 |
|
|
(2,080) |
|
|
12 |
|
5.0 |
|
|
|
|
$ |
165,296 |
|
$ |
(124,761) |
|
$ |
40,535 |
|
|
|
Identifiable finite-lived intangible assets are amortized on a straight-line basis over their estimated useful lives.
Amortization expense by classification is shown below (in thousands):
|
|
|
Year ended December 31, |
|
|
|||||||
|
|
|
2015 |
|
2014 |
|
2013 |
|
|
|||
|
Service costs |
|
$ |
12,680 |
|
$ |
28,523 |
|
$ |
28,974 |
|
|
|
Sales and marketing |
|
|
3,862 |
|
|
4,733 |
|
|
1,987 |
|
|
|
Product development |
|
|
1,440 |
|
|
4,212 |
|
|
4,884 |
|
|
|
General and administrative |
|
|
724 |
|
|
847 |
|
|
674 |
|
|
|
Discontinued operations |
|
|
— |
|
|
4,244 |
|
|
7,890 |
|
|
|
Total amortization |
|
$ |
18,706 |
|
$ |
42,559 |
|
$ |
44,409 |
|
|
Service costs for the years ended December 31, 2015, 2014 and 2013 includes an accelerated amortization charge of $3.4 million, $7.7 million and $3.1 million, respectively, as a result of the removing certain content assets from service.
F-19
Based upon the current amount of intangible assets subject to amortization, the estimated amortization expense for the next five years as of December 31, 2015 is as follows (in thousands):
|
|
|
|
|
|
|
|
|
Estimated |
|
|
|
|
|
Amortization |
|
|
|
Year ending December 31, |
|
|
|
|
|
2016 |
|
$ |
9,225 |
|
|
2017 |
|
$ |
5,827 |
|
|
2018 |
|
$ |
2,967 |
|
|
2019 |
|
$ |
1,006 |
|
|
2020 |
|
$ |
575 |
|
|
Thereafter |
|
$ |
1,732 |
|
5. Goodwill
The following table presents the changes in our goodwill balance (in thousands):
|
Balance at December 31, 2013 |
|
$ |
347,382 |
|
|
Acquisitions |
|
|
10,358 |
|
|
Dispositions |
|
|
(12,070) |
|
|
Spin-off |
|
|
(103,042) |
|
|
Goodwill impairment charge |
|
|
(232,270) |
|
|
Balance at December 31, 2014 |
|
|
10,358 |
|
|
Balance at December 31, 2015 |
|
$ |
10,358 |
|
The change in goodwill in 2014 is attributable to the acquisition of Saatchi Online and the disposition of our Creativebug and CoveritLive businesses. In August 2014, we completed the Separation of Rightside and the Distribution, and we no longer record goodwill related to Rightside on our balance sheet.
For the year ended December 31, 2014, due to unexpected revenue declines attributable to lower traffic and monetization yield on certain of our content and media websites, we lowered our future cash flow expectations. As a result of the decline in our cash flow forecast as well as a sustained decline in our market capitalization which remained at a level below the book value of our net assets for an extended period of time, we performed an interim assessment of impairment of the goodwill in our content and media reporting unit in the third quarter of 2014. Based on our analyses, we determined that the implied fair value of goodwill was substantially lower than the carrying value of goodwill for the content and media reporting unit and as a result, we determined that the implied fair value of the goodwill in the content and media reporting unit was zero. Accordingly, we recorded $232.3 million for the goodwill impairment charge in 2014.
We performed our annual impairment analysis in the fourth quarter of 2015, and determined that no impairment of goodwill existed at December 31, 2015.
6. Other Balance Sheet Items
Other long term assets consisted of the following (in thousands):
|
|
|
December 31, |
|
December 31, |
|
||
|
|
|
2015 |
|
2014 |
|
||
|
Long-term portion of promissory note |
|
$ |
— |
|
$ |
4,505 |
|
|
Other |
|
|
1,173 |
|
|
1,550 |
|
|
Other assets |
|
$ |
1,173 |
|
$ |
6,055 |
|
F-20
During the year ended December 31 2015, we received a payment of $5.1 million, plus accrued and unpaid interest, on the promissory note that we received as part of the consideration for the sale of our CoveritLive business in July 2014. This promissory note had a principal amount of $5.6 million and was originally due in full by July 2016. The early repayment of $5.1 million, plus accrued and unpaid interest, satisfied all amounts owed to us under the promissory note and the promissory note was discharged. The discount from the carrying value of the promissory note was approximately $0.1 million, which was recorded as interest income (expense), net.
At December 31, 2015 and 2014, we had a cash collateralized standby letter of credit for approximately $1.2 million and $1.4 million, respectively, included in long-term assets, associated with one of our leases.
Accrued expenses and other liabilities consisted of the following (in thousands):
|
|
|
December 31, |
|
December 31, |
|
||
|
|
|
2015 |
|
2014 |
|
||
|
Accrued payroll and related items |
|
$ |
5,916 |
|
$ |
4,693 |
|
|
Acquisition holdback |
|
|
607 |
|
|
8,958 |
|
|
Artist payables |
|
|
2,816 |
|
|
2,250 |
|
|
Other |
|
|
5,830 |
|
|
8,324 |
|
|
Accrued expenses and other current liabilities |
|
$ |
15,169 |
|
$ |
24,225 |
|
In July 2015, as part of the consideration for our purchase of Society6, we paid $7.4 million in cash and issued 122,638 shares of our common stock to the sellers of Society6 upon the expiration of the holdback period.
During the year ended December 31, 2015, we recognized severance costs of $2.2 million in connection with targeted reductions in force as a result of initiatives to improve operating efficiency. These severance costs were recognized in the consolidated statements of operations for the year ended December 31, 2015 as follows: $1.1 million in product development costs, $0.6 million in service costs, $0.4 million in general and administrative costs, and $0.1 million in sales and marketing costs. As of December 31, 2015, there was $0.5 million of related accrued severance included in accrued expenses and other current liabilities in the consolidated balance sheet. An additional $0.2 million of related retention and severance costs will be expensed over the applicable retention periods, which extend through the first quarter of 2016. Changes to the severance accrual during the year ended December 31, 2015 are as follows (in thousands):
|
Balance at December 31, 2014 |
|
$ |
— |
|
New charges |
|
|
2,183 |
|
Cash payments |
|
|
(1,698) |
|
Balance at December 31, 2015 |
|
$ |
485 |
7. Debt
In November 2014, we repaid all amounts outstanding under our credit agreement, dated August 29, 2013, with Silicon Valley Bank, as administrative agent, and the lenders and other agents party thereto (the “Credit Agreement”) and terminated the Credit Agreement and the related Guarantee and Collateral Agreement. The Credit Agreement had provided for a $100.0 million senior secured term loan facility (the “Term Loan Facility”) and a $125.0 million senior secured revolving loan facility (the “Revolving Loan Facility”), each of which was scheduled to mature on August 29, 2018. At the time of termination, there was approximately $73.8 million outstanding under the Term Loan Facility, no principal balance outstanding under the Revolving Loan Facility and an outstanding standby letter of credit with a face amount of approximately $1.4 million. We used cash on hand to pay all outstanding principal, interest and other amounts owing under the Credit Agreement as of the termination date and to cash collateralize the outstanding standby letter of credit.
In connection with entering into the Credit Agreement in August 2013, we incurred debt issuance costs of $1.9 million. Debt issuance costs are capitalized and amortized into interest expense over the term of the underlying debt. Due
F-21
to the repayment in full of all amounts under the credit facility in November 2014, there were no amortized deferred debt issuance costs during 2015. During the year ended December 31, 2014 and 2013, we amortized $0.5 million and $0.2 million, respectively of deferred debt issuance costs. In connection with the termination of the Credit Agreement, we recorded a non-cash expense of $1.7 million from the acceleration of unamortized debt issuance costs during the year ended December 31, 2014.
8. Commitments and Contingencies
Leases
We conduct our operations utilizing leased office facilities in various locations under operating leases with non-cancelable periods ending between February 2018 and February 2020.
The following is a schedule of future minimum lease payments under operating and capital leases as of December 31, 2015 (in thousands):
|
|
|
Operating |
|
|
|
|
|
leases |
|
|
|
Year ending December 31, |
|
|
|
|
|
2016 |
|
$ |
2,033 |
|
|
2017 |
|
|
2,089 |
|
|
2018 |
|
|
3,493 |
|
|
2019 |
|
|
1,482 |
|
|
2020 |
|
|
27 |
|
|
Thereafter |
|
|
— |
|
|
Total minimum lease payments |
|
$ |
9,124 |
|
We incurred rent expense of $2.9 million, $3.5 million and $6.7 million, respectively, for the years ended December 31, 2015, 2014 and 2013. As of December 31, 2015 and 2014, other long-term liabilities include a deferred rent liability of $1.6 million.
Litigation
From time to time we are a party to various legal matters incidental to the conduct of our business. Certain of our outstanding legal matters include speculative claims for indeterminate amounts of damages. We record a liability when we believe that it is probable that a loss has been incurred and the amount can be reasonably estimated. Based on our current knowledge, we do not believe that there is a reasonable possibility that the final outcome of the pending or threatened legal proceedings to which we are a party, either individually or in the aggregate, will have a material adverse effect on our future financial results. However, the outcome of such legal matters is subject to significant uncertainties.
Taxes
From time to time, various federal, state and other jurisdictional tax authorities undertake reviews of the Company and its filings. In evaluating the exposure associated with various tax filing positions, we accrue charges for possible exposures. We believe any adjustments that may ultimately be required as a result of any of these reviews will not be material to our consolidated financial statements.
Indemnifications
In the normal course of business, we have provided certain indemnities, commitments and guarantees under which we may be required to make payments in relation to certain transactions. These indemnities include intellectual property indemnities to our customers, indemnities to our directors and officers to the maximum extent permitted under the laws of Delaware, indemnifications related to our lease agreements and indemnifications to sellers or buyers in connection
F-22
with acquisitions and dispositions, respectively. In addition, our advertiser, content creation and distribution partner agreements contain certain indemnification provisions, which are generally consistent with those prevalent in our industry. We have not incurred significant obligations under indemnification provisions historically, and do not expect to incur significant obligations in the future. Accordingly, we have not recorded any liability for these indemnities.
9. Income Taxes
Income (loss) before income taxes from continuing operations consisted of the following (in thousands):
|
|
|
|
|
|
|
|
|
|
|
|
|
|
|
2015 |
|
2014 |
|
2013 |
|
|||
|
Domestic |
|
$ |
(43,518) |
|
$ |
(267,758) |
|
$ |
(11,555) |
|
|
Foreign |
|
|
72 |
|
|
(3,104) |
|
|
193 |
|
|
Loss from continuing operation before income taxes |
|
$ |
(43,446) |
|
$ |
(270,862) |
|
$ |
(11,362) |
|
The income tax benefit (expense) from continuing operations consisted of the following (in thousands):
|
|
|
|
|
|
|
|
|
|
|
|
|
|
|
2015 |
|
2014 |
|
2013 |
|
|||
|
Current (expense) benefit: |
|
|
|
|
|
|
|
|
|
|
|
Federal |
|
$ |
— |
|
$ |
— |
|
$ |
— |
|
|
State |
|
|
(32) |
|
|
(58) |
|
|
(276) |
|
|
International |
|
|
(23) |
|
|
(99) |
|
|
(69) |
|
|
Deferred (expense) benefit: |
|
|
|
|
|
|
|
|
|
|
|
Federal |
|
|
— |
|
|
14,028 |
|
|
(2,136) |
|
|
State |
|
|
— |
|
|
831 |
|
|
(398) |
|
|
International |
|
|
— |
|
|
11 |
|
|
23 |
|
|
Total income tax benefit (expense) from continuing operations |
|
$ |
(55) |
|
$ |
14,713 |
|
$ |
(2,856) |
|
The reconciliation of the federal statutory income tax rate of 35% to our effective income tax rate from continuing operations is as follows (in thousands):
|
|
|
|
|
|
|
|
|
|
|
|
|
|
|
2015 |
|
2014 |
|
2013 |
|
|||
|
Expected income tax benefit (expense) at U.S. statutory rate |
|
$ |
15,198 |
|
$ |
94,801 |
|
$ |
3,977 |
|
|
Difference between U.S. and foreign taxes |
|
|
6 |
|
|
21 |
|
|
12 |
|
|
State tax (expense) benefit, net of federal taxes |
|
|
983 |
|
|
4,828 |
|
|
(131) |
|
|
Non-deductible stock-based compensation |
|
|
(982) |
|
|
(3,845) |
|
|
(2,832) |
|
|
Meals and entertainment |
|
|
(135) |
|
|
(129) |
|
|
(266) |
|
|
Goodwill impairment |
|
|
— |
|
|
(25,841) |
|
|
— |
|
|
Non-deductible officer compensation |
|
|
— |
|
|
(43) |
|
|
— |
|
|
Change in statutory state tax rate |
|
|
(1,604) |
|
|
(865) |
|
|
(253) |
|
|
Federal impact of state deferred taxes |
|
|
— |
|
|
— |
|
|
110 |
|
|
Valuation allowance |
|
|
(13,509) |
|
|
(53,463) |
|
|
(3,648) |
|
|
Other |
|
|
(12) |
|
|
(751) |
|
|
175 |
|
|
Total income tax expense from continuing operations |
|
$ |
(55) |
|
$ |
14,713 |
|
$ |
(2,856) |
|
F-23
The tax effects of temporary differences that give rise to significant portions of the deferred tax assets and deferred tax liabilities are presented below (in thousands):
|
|
|
December 31, |
|
December 31, |
|
||
|
|
|
2015 |
|
2014 |
|
||
|
Deferred tax assets: |
|
|
|
|
|
|
|
|
Accrued liabilities not currently deductible |
|
$ |
3,454 |
|
$ |
2,305 |
|
|
Intangible assets—excess of tax basis over financial statement basis |
|
|
45,138 |
|
|
54,647 |
|
|
Federal impact of deferred state taxes |
|
|
(4,518) |
|
|
(3,198) |
|
|
Deferred revenue |
|
|
— |
|
|
165 |
|
|
Net operating losses |
|
|
50,038 |
|
|
35,814 |
|
|
Stock-based compensation |
|
|
2,565 |
|
|
5,783 |
|
|
Other |
|
|
203 |
|
|
(56) |
|
|
|
|
|
96,880 |
|
|
95,460 |
|
|
Deferred tax liabilities: |
|
|
|
|
|
|
|
|
Intangible assets—excess of financial statement basis over tax basis |
|
|
(1,751) |
|
|
(1,245) |
|
|
Property and equipment |
|
|
(2,251) |
|
|
(5,739) |
|
|
|
|
|
(4,002) |
|
|
(6,984) |
|
|
Valuation allowance |
|
|
(92,878) |
|
|
(88,476) |
|
|
Net deferred tax liabilities |
|
$ |
— |
|
$ |
— |
|
|
|
|
|
|
|
|
|
|
|
Current |
|
$ |
551 |
|
$ |
334 |
|
|
Non-current |
|
|
(551) |
|
|
(334) |
|
|
|
|
$ |
— |
|
$ |
— |
|
We had federal net operating loss (“NOL”) carryforwards of approximately $143.4 million and $110.7 million as of December 31, 2015 and 2014, respectively, which expire between 2021 and 2035. In addition, as of December 31, 2015 and 2014 we had state NOL carryforwards of approximately $73.0 million and $44.5 million, which expire between 2016 and 2035.
Sections 382 and 383 of the Internal Revenue Code of 1986, as amended, provide for annual limitations on the utilization of net operating loss and credit carryforwards if we were to undergo an ownership change, as defined in Section 382. Changes in our equity structure and the acquisitions made by us in prior years, including Trails.com, Maps a La Carte, Pagewise, Indieclick and Saatchi Art, resulted in such an ownership change. Currently, we do not expect the utilization of our net operating loss and tax credit carryforwards in the near term to be materially affected as no significant limitations are expected to be placed on these carryforwards as a result of our previous ownership changes.
We reduce the deferred tax asset resulting from future tax benefits by a valuation allowance if, based on the weight of the available evidence, it is more likely than not that some portion or all of these deferred taxes will not be realized. We have determined it is more likely than not that we will not realize the benefit of all our deferred tax assets and accordingly a valuation allowance of $92.9 million and $88.5 million against our deferred taxes was required at December 31, 2015 and 2014, respectively. The change in the valuation allowance for the year ended December 31, 2015 was an increase of $4.4 million, all of which was recorded in income tax benefit (expense) from continuing operations. As we have no sustained history of generating book income, the ultimate future realization of these excess deferred tax assets is not more likely than not and thus subject to a valuation allowance.
Accounting standards related to stock-based compensation prohibit the tax attributes related to the exercise of employee stock options from being realized in the financial statements until they result in a decrease to taxes payable. Therefore, we have not included unrealized stock option tax attributes in our deferred tax assets. Cumulative tax attributes excluded through 2015 were $18.2 million. The benefit of these deferred tax assets will be recorded to equity when they reduce taxes payable.
F-24
We are subject to the accounting guidance for uncertain income tax positions. We believe that our income tax positions and deductions will be sustained on audit and do not anticipate any adjustments that will result in a material adverse effect on our financial condition, results of operations, or cash flow.
Our policy for recording interest and penalties associated with audits and uncertain tax positions is to record such items as a component of income tax expense, and amounts recognized to date are not material. There are no material uncertain income tax positions and there were no material changes recorded during 2015, 2014 or 2013 and we do not expect our uncertain tax position to change during the next twelve months. The total gross amount of unrecognized tax benefits was not material for the years ended December 31, 2015 and 2014.
We file a U.S. federal and various state tax returns. The tax years 2008 to 2015 remain subject to examination by the Internal Revenue Service and most tax years since our incorporation are subject to examination by various state authorities.
10. Employee Benefit Plan
We have a defined contribution plan under Section 401(k) of the Internal Revenue Code (“401(k) Plan”) covering all full-time employees who meet certain eligibility requirements. Eligible employees may defer up to 90% of their pre-tax eligible compensation, up to the annual maximum allowed by the Internal Revenue Service. Under the 401(k) Plan, we may, but are not obligated to, match a portion of the employee contributions up to a defined maximum. We made matching contributions of $1.1 million, $1.7 million and $2.0 million for the years ended December 31, 2015, 2014 and 2013, respectively.
11. Stock-based Compensation Plans and Awards
Stock Incentive Plans
The 2010 Incentive Award Plan (the "2010 Plan") was adopted by the board of directors, and approved by the Company’s stockholders in August 2010. In connection with the adoption of the 2010 Plan on August 5, 2010, 0.06 million stock-based awards then available for grant under the 2006 Plan were canceled. Any stock-based awards outstanding under the 2006 Plan when the 2010 Plan was adopted that subsequently are forfeited, expire or lapse are available for future grants under the 2010 Plan. An amended and restated version of the 2010 Plan (the "2010 A&R Plan") was adopted by the board of directors on April 23, 2015 and approved by the Company’s stockholders on June 11, 2015. Following the Separation, up to 5.6 million stock options, restricted stock, restricted stock unit and other incentive awards were reserved for future grant to employees, officers, non-employee directors, and consultants, and such options or awards may be designated as incentive or non-qualified may be granted under the 2010 A&R Plan. In addition, awards available for grant under the 2010 A&R Plan shall be increased on an annual basis as of January 1st of each fiscal year through January 2020 by an amount equal to the lesser of (i) 1.2 million (ii) 5% of the total shares outstanding as of the end of the prior fiscal year and (iii) such lesser amount as determined by the Administrator of the 2010 Plan. As of December 31, 2015, 3.5 million stock-based awards were available for future grant under the 2010 Plan. Generally, stock option grants have 10-year terms and vest either annually or monthly over a 3 or 4-year period. Restricted stock unit awards generally vest either annually or quarterly over a 3 or 4-year period. Certain stock options and restricted stock unit awards have accelerated vesting provisions in the event of a change in control.
F-25
Valuation of Awards
The per share fair value of stock options granted with service conditions was determined on the date of grant using the Black-Scholes-Merton option pricing model with the following weighted average assumptions:
|
|
|
|
|
|
|
|
|
|
|
|
Year ended December 31, |
|
||||
|
|
|
2015 |
|
2014 |
|
2013 |
|
|
Expected life (in years) |
|
5.94 |
|
5.89 |
|
5.50 |
|
|
Risk-free interest rate |
|
1.69 |
% |
1.82 |
% |
0.83 |
% |
|
Expected volatility range |
|
53.4 |
% |
54.1 |
% |
51 |
% |
|
Expected dividend yield |
|
— |
|
— |
|
— |
|
In addition, 1.3 million options were awarded to our chief executive officer during the quarter ended September 30, 2014. These options were determined on the date of grant using the Hull-White model with the following assumptions: volatility 61%, risk-free interest rate 2.43%, early exercise multiple 2.9 years, and dividend rate 0%.
The expected term of stock options granted represents the weighted average period that the stock options are expected to remain outstanding. We determine the expected term assumption based on our historical exercise behavior combined with estimates of the post-vesting holding period. Expected volatility is based on historical volatility of peer companies in our industry that have similar vesting and contractual terms. The risk free interest rate is based on the implied yield currently available on U.S. Treasury issues with terms approximately equal to the expected life of the option. We currently have no history or expectation of paying cash dividends on our common stock.
Award Activity
Stock Options
Stock option activity is as follows (in thousands, except per share data):
|
|
|
|
|
|
|
|
Weighted |
|
|
|
|
|
|
|
|
|
|
|
|
average |
|
|
|
|
|
|
|
|
|
|
Weighted |
|
remaining |
|
|
|
|
|
|
|
Number of |
|
|
average |
|
contractual |
|
Aggregate |
|
|
|
|
|
options |
|
|
exercise |
|
term |
|
intrinsic |
|
|
|
|
|
outstanding |
|
|
price |
|
(in years) |
|
value |
|
|
|
Outstanding at December 31, 2014 |
|
3,473 |
|
$ |
8.65 |
|
9.33 |
|
$ |
353 |
|
|
Options granted |
|
1,056 |
|
$ |
5.37 |
|
|
|
|
|
|
|
Options exercised |
|
(15) |
|
$ |
4.39 |
|
|
|
|
|
|
|
Options forfeited or cancelled |
|
(1,315) |
|
$ |
7.40 |
|
|
|
|
|
|
|
Outstanding at December 31, 2015 |
|
3,199 |
|
$ |
8.10 |
|
8.67 |
|
$ |
409 |
|
|
Exercisable at December 31, 2015 |
|
861 |
|
$ |
9.21 |
|
7.71 |
|
$ |
39 |
|
|
Vested and expected to vest at December 31, 2015 |
|
2,895 |
|
$ |
8.38 |
|
8.62 |
|
$ |
313 |
|
The pre-tax aggregate intrinsic value of outstanding and exercisable stock options is based on the difference between the estimated fair value of our common stock at December 31, 2015 and 2014 and their exercise prices, respectively for all awards where the fair value of our common stock exceeds the exercise price. Options expected to vest reflect an estimated forfeiture rate.
F-26
Information related to stock-based compensation activity is as follows (in thousands, except per share data):
|
|
|
Year ended December 31, |
|
|||||||
|
|
|
2015 |
|
2014 |
|
2013 |
|
|||
|
Weighted average fair value of options granted (per option) |
|
$ |
2.74 |
|
$ |
4.21 |
|
$ |
3.92 |
|
|
Intrinsic value of options exercised |
|
$ |
13 |
|
$ |
303 |
|
$ |
2,179 |
|
As of December 31, 2015, there was approximately $7.4 million of stock-based compensation expense related to the non-vested portion of stock options, which is expected to be recognized over a weighted average period of 2.5 years.
Restricted Stock Units
|
|
|
|
|
Weighted |
|
|
|
|
|
|
|
average |
|
|
|
|
|
Number of |
|
grant date |
|
|
|
|
|
Shares |
|
fair value |
|
|
|
Unvested at December 31, 2014 |
|
857 |
|
$ |
10.28 |
|
|
Granted |
1,005 |
$ |
5.26 | |||
|
Vested |
|
(278) |
|
$ |
10.53 |
|
|
Forfeited |
|
(607) |
|
$ |
8.06 |
|
|
Unvested at December 31, 2015 |
|
977 |
|
$ |
6.42 |
|
The total fair value of restricted stock vested was $2.9 million, $18.3 million and $17.4 million for the years ended December 31, 2015, 2014 and 2013, respectively.
As of December 31, 2015, there was approximately $4.4 million of unrecognized stock-based compensation cost related to non-vested RSUs and restricted shares. The amount is expected to be recognized over a weighted average period of 2.4 years. To the extent that the forfeiture rate is different from that anticipated, stock-based compensation expense related to these awards will be different.
In January 2016, we issued 0.5 million restricted stock units to our chief executive officer in connection with an amended employment agreement. In February 2016, we issued 1.2 million restricted stock units in connection with our annual equity grants.
Employee Stock Purchase Plan
In May 2011, we commenced our first offering under the ESPP, which allows eligible employees to purchase, through payroll deductions, a limited amount of our common stock at a 15% discount to the lower of market price as of the beginning or ending of each six-month purchase period. Participants can authorize payroll deductions for amounts up to the lesser of 15% of their qualifying wages or the statutory limit under the U.S. Internal Revenue Code. The ESPP provides up to a 24-month offering period which is comprised of four consecutive six-month purchase periods commencing May and November. A maximum of 750 shares of common stock may be purchased by each participant at six-month intervals during the offering period. The fair value of the ESPP options granted is determined using a Black-Scholes-Merton model and is amortized over the remaining life of the 24-month offering period of the ESPP. The Black-Scholes-Merton model included an assumption for expected volatility of between 58% and 60% for each of the four purchase periods. In November 2015, we suspended the ESPP plan after the November 2015 purchase. During the years ended December 31, 2015 and 2013 we recognized $0.5 million and $1.8 million of expense, respectively, in relation to the ESPP. The expense related to the year ended December 31, 2014 was not material. There were 1.7 million shares of common stock remaining authorized for issuance under the ESPP at December 31, 2015.
F-27
Stock-based Compensation Expense
Stock-based compensation expense related to all employee and non-employee stock-based awards was as follows (in thousands):
|
|
|
Year ended December 31, |
|
|
|||||||
|
|
|
2015 |
|
2014 |
|
2013 |
|
|
|||
|
Service costs |
|
$ |
1,084 |
|
$ |
1,422 |
|
$ |
2,420 |
|
|
|
Sales and marketing |
|
|
588 |
|
|
683 |
|
|
3,823 |
|
|
|
Product development |
|
|
1,836 |
|
|
4,745 |
|
|
3,835 |
|
|
|
General and administrative |
|
|
4,054 |
|
|
12,016 |
|
|
12,525 |
|
|
|
Discontinued operations |
|
|
— |
|
|
2,949 |
|
|
4,781 |
|
|
|
Total stock-based compensation |
|
|
7,562 |
|
|
21,815 |
|
|
27,384 |
|
|
|
Income tax benefit related to stock-based compensation included in net income (loss) |
|
|
— |
|
|
(706) |
|
|
(782) |
|
|
|
|
|
$ |
7,562 |
|
$ |
21,109 |
|
$ |
26,602 |
|
|
There was no income tax benefit related to stock-based compensation included in net income (loss) for the year-ended December 31, 2015 as the Company generated current year taxable losses without stock-based compensation.
During the years ended December 31, 2015, 2014 and 2013, $0.4 million, $1.0 million and $2.0 million respectively, of stock-based compensation expense related to stock options was capitalized, primarily as part of internally developed software projects.
Stock-based compensation expense for accelerations and modifications was immaterial for the year ended December 31, 2015. During the year ended December 31, 2014, we accelerated the vesting of certain outstanding equity instruments for three employees, resulting in the recognition of $3.5 million of expense.
In connection with the Separation completed in the year ended December 31, 2014, and subsequent 1-for-5 reverse stock split, all of our outstanding equity-based compensation awards were adjusted as follows:
Stock Options. Immediately prior to the Separation, each stock option that had an exercise price greater than 120% of the trading price of our common stock on the New York Stock Exchange on July 31, 2014, was adjusted by reducing the per share exercise price and making a corresponding reduction in the number of shares of common stock subject to the stock option, so that the value of the such stock option was approximately equal before and after such adjustment. Immediately prior to the Separation (but following the adjustment), each stock option that was vested, or was unvested and held by an individual who was employed or engaged by us following the Separation, was split into a Demand Media stock option and a Rightside stock option with a combined value that approximately equaled the value of the Demand Media stock option immediately prior to the Separation. Unvested Demand Media stock options held by a Rightside employee were accelerated then split equally between Demand Media and Rightside stock options.
Restricted Stock Units. Immediately prior to the Separation, each RSU award that was held by an individual who was employed or engaged by us following the Separation and was granted prior to March 1, 2014, was split into a Demand Media RSU award and a Rightside RSU award with a combined value that approximately equaled the value of the underlying Demand Media RSU award immediately prior to the Separation. Each RSU award held by an individual who was employed or engaged by Rightside or its affiliates following the Separation was converted into a Rightside RSU award covering a number of Rightside shares such that the pre-distribution value of the pre-Separation value of the Demand Media RSU award was approximately preserved.
F-28
12. Stockholders’ Equity
Reverse Stock Split
On August 1, 2014, we completed the Separation of Rightside from Demand Media, Inc. The Separation was structured as a pro rata tax-free dividend involving the distribution of all outstanding shares of Rightside common stock to holders of Demand Media common stock as of the record date (the “Distribution”). Immediately following the Distribution, we enacted a 1-for-5 reverse stock split with respect to all of our outstanding shares of common stock, which is reflected retrospectively throughout the consolidated financial statements.
Stock Repurchases
Under our February 8, 2012 stock repurchase plan, as amended, we are authorized to repurchase up to $50.0 million of our common stock from time to time. Since April 2013, we have not repurchased any shares of common stock. Approximately $19.2 million remains available under the repurchase plan at December 31, 2015. The timing and actual number of shares repurchased will depend on various factors including price, corporate and regulatory requirements, debt covenant requirements, alternative investment opportunities and other market conditions.
Shares repurchased by us are accounted for when the transaction is settled. As of December 31, 2015, there were no unsettled share repurchases. The par value of shares repurchased and retired is deducted from common stock and any excess over par value is deducted from additional paid in capital. Direct costs incurred to repurchase the shares are included in the total cost of the shares.
Voting Rights
Each share of common stock has the right to one vote per share.
13. Fair Value of Financial Instruments
Fair value represents the exchange price that would be received for an asset or paid to transfer a liability (an exit price) in the principal or most advantageous market for the asset or liability in an orderly transaction between market participants on the measurement date. We measure our financial assets and liabilities in three levels, based on the markets in which the assets and liabilities are traded and the reliability of the assumptions used to determine fair value.
|
· |
Level 1—valuations for assets and liabilities traded in active exchange markets, or interest in open-end mutual funds that allow a company to sell its ownership interest back at net asset value on a daily basis. Valuations are obtained from readily available pricing sources for market transactions involving identical assets, liabilities or funds. |
|
· |
Level 2—valuations for assets and liabilities traded in less active dealer, or broker markets, such as quoted prices for similar assets or liabilities or quoted prices in markets that are not active. Level 2 includes U.S. Treasury, U.S. government and agency debt securities, and certain corporate obligations. Valuations are usually obtained from third-party pricing services for identical or comparable assets or liabilities. |
|
· |
Level 3—valuations for assets and liabilities that are derived from other valuation methodologies, such as option pricing models, discounted cash flow models and similar techniques, and not based on market exchange, dealer, or broker traded transactions. Level 3 valuations incorporate certain assumptions and projections in determining the fair value assigned to such assets or liabilities. |
In determining fair value, we utilize valuation techniques that maximize the use of observable inputs and minimize the use of unobservable inputs to the extent possible and consider counterparty credit risk in our assessment of fair value.
The carrying amounts of our financial instruments, which include cash and cash equivalents, accounts receivable, restricted cash and accounts payable approximate fair value because of their short maturities.
F-29
Financial assets and liabilities carried at fair value on a recurring basis were as follows (in thousands):
|
|
|
Balance at December 31, 2015 |
|
||||||||||
|
|
|
Level 1 |
|
Level 2 |
|
Level 3 |
|
Total |
|
||||
|
Assets: |
|
|
|
|
|
|
|
|
|
|
|
|
|
|
Cash equivalents (1) |
|
$ |
5,007 |
|
$ |
— |
|
$ |
— |
|
$ |
5,007 |
|
|
|
|
$ |
5,007 |
|
$ |
— |
|
$ |
— |
|
$ |
5,007 |
|
|
|
|
Balance at December 31, 2014 |
|
||||||||||
|
|
|
Level 1 |
|
Level 2 |
|
Level 3 |
|
Total |
|
||||
|
Assets: |
|
|
|
|
|
|
|
|
|
|
|
|
|
|
Cash equivalents (1) |
|
$ |
5,000 |
|
$ |
— |
|
$ |
— |
|
$ |
5,000 |
|
|
Promissory note |
|
$ |
— |
|
$ |
— |
|
$ |
4,946 |
|
$ |
4,946 |
|
|
|
|
$ |
5,000 |
|
$ |
— |
|
$ |
4,946 |
|
$ |
9,946 |
|
|
(1) |
Comprises money market funds which are included in Cash and cash equivalents in the accompanying consolidated balance sheet. |
For financial assets that utilize Level 1 and Level 2 inputs, we utilize both direct and indirect observable price quotes, including quoted market prices (Level 1 inputs) or inputs that are derived principally from or corroborated by observable market data (Level 2 inputs).
Certain assets, including goodwill and intangible assets, are also subject to measurement at fair value on a nonrecurring basis, if they are deemed to be impaired as the result of an impairment review. For the year ended December 31, 2014, due to unexpected revenue declines attributable to lower traffic and monetization yield on certain of our content and media websites, we lowered our future cash flow expectations. As a result of the decline in our cash flow forecast as well as a sustained decline in our market capitalization which remained at a level below the book value of our net assets for an extended period of time, we performed an interim assessment of impairment of the goodwill in our content and media reporting unit in the third quarter of 2014. Based on our analyses, we determined that the implied fair value of goodwill was substantially lower than the carrying value of goodwill for the content and media reporting unit and as a result, we determined that the implied fair value of the goodwill in the content and media reporting unit was zero. Accordingly, we recorded $232.3 million for the goodwill impairment charge in 2014. These estimated fair value measurements were calculated using unobservable inputs, primarily using the income and market approach, specifically the discounted cash flow method and market comparables, which are classified as Level 3 within the fair value hierarchy. The amount and timing of future cash flows within those analyses was based on our most recent future cash flow expectations, long-term strategic plans and other estimates including the amount and timing of future expected cash flows, terminal value growth rate and the appropriate market-participant risk-adjusted discount rates.
14. Discontinued Operations
On August 1, 2014, we completed the Separation of Rightside from Demand Media, Inc. As a result of the Separation, the financial results of Rightside are presented as discontinued operations in our consolidated statements of
F-30
operations for the years ended December 31, 2014 and 2013. Following the Separation, the following activity in our statement of operations was reclassified from continuing operations to discontinued operations:
|
|
|
Year ended December 31, |
|
||||
|
|
|
2014 |
|
2013 |
|
||
|
Service revenue |
|
$ |
107,721 |
|
$ |
185,187 |
|
|
|
|
|
|
|
|
|
|
|
Service costs |
|
|
92,588 |
|
|
143,607 |
|
|
Sales and marketing |
|
|
5,632 |
|
|
10,170 |
|
|
Product and development |
|
|
8,203 |
|
|
12,002 |
|
|
General and administrative |
|
|
14,819 |
|
|
20,263 |
|
|
Amortization of intangible assets |
|
|
4,243 |
|
|
7,890 |
|
|
Total operating expenses |
|
|
125,485 |
|
|
193,932 |
|
|
Operating loss |
|
|
(17,764) |
|
|
(8,745) |
|
|
Other income (expense), net |
|
|
7,017 |
|
|
4,174 |
|
|
Loss before income taxes |
|
$ |
(10,747) |
|
$ |
(4,571) |
|
|
Income tax expense |
|
|
(461) |
|
|
(1,385) |
|
|
Net loss |
|
$ |
(11,208) |
|
$ |
(5,956) |
|
Capital expenditures for discontinued operations for the years ended December 31, 2014 and 2013 were $2.7 million and $8.4 million, respectively.
15. Acquisitions and Dispositions
Acquisitions
We account for acquisitions of businesses using the purchase method of accounting where the cost is allocated to the underlying net tangible and intangible assets acquired, based on their respective estimated fair values. The excess of the purchase price over the estimated fair values of the net assets acquired is recorded as goodwill.
Determining the fair value of certain acquired assets and liabilities is subjective in nature and often involves the use of significant estimates and assumptions, including, but not limited to, the selection of appropriate valuation methodology, projected revenue, expenses and cash flows, weighted average cost of capital, discount rates, estimates of advertiser and publisher turnover rates and estimates of terminal values.
During the years ended December 31, 2014 and 2013, we acquired businesses consistent with our strategic plan of acquiring, consolidating and developing Internet media properties and marketplace businesses. In addition to identifiable assets acquired in these business combinations, our goodwill primarily derives from the ability to generate synergies across our businesses. As of December 31, 2015, our goodwill primarily results from our acquisition of marketplace businesses.
On August 8, 2014, we acquired Saatchi Online, Inc., a Delaware corporation (“Saatchi Online”), pursuant to an Agreement and Plan of Merger whereby Saatchi Online became a wholly owned subsidiary of Demand Media (the “Merger”). After giving effect to working capital adjustments as of the closing date, the purchase price consisted of approximately $4.8 million in cash after giving effect to working capital adjustments and 1,049,959 shares of our common stock, valued at approximately $10.3 million based on Demand Media’s stock price on the closing date of the Merger. Of the $1.7 million from the cash portion of the purchase price that was placed into escrow to be applied by us towards satisfaction of post-closing indemnification obligations of the former stockholders of Saatchi Online and/or post-closing adjustments to the purchase price, approximately $0.9 million was paid to us to cover post-closing indemnification claims and approximately $0.2 million was released to the selling stockholders in connection with a multi-party settlement agreement and the expiration of the post-closing indemnification period in August 2015. Approximately $0.6 million remains in the escrow account as of December 31, 2015 to cover estimated claims related to pre-closing VAT amounts, and any remaining portion of the escrow amount that is not required to cover the estimated
F-31
pre-closing VAT amounts will be paid to the former stockholders of Saatchi Online, Inc. upon final determination of the pre-closing VAT amounts.
The Saatchi acquisition is included in our consolidated financial statements as of the date of the acquisition. The allocation of the purchase consideration, for business acquisitions made by us during the year ended December 31, 2014 is as follows (in thousands):
|
Goodwill |
|
$ |
10,358 |
|
|
Technology |
|
|
2,327 |
|
|
Artist relationships |
|
|
1,852 |
|
|
License agreement |
|
|
419 |
|
|
Customer relationships |
|
|
962 |
|
|
Other assets and liabilities assumed |
|
|
(866) |
|
|
Total |
|
$ |
15,052 |
|
Customer relationships have a useful life of 3 years, developed technology, and the license agreement have useful lives of 5 years, and the artist relationship has a useful life of 10 years. Goodwill, which is comprised of the excess of the purchase consideration over the fair value of the identifiable net assets acquired, is primarily derived from assembled workforce and our ability to generate synergies with its services. The goodwill of $10.4 million is not expected to be deductible for tax purposes.
On June 20, 2013, we completed the acquisition of Society6, an online marketplace and e-commerce platform. The purchase price consideration of $94.3 million was comprised of cash of $76.1 million and 464,576 shares of common stock valued at $18.2 million, based on our stock price on the date of acquisition. We held back $7.9 million in cash and 122,638 shares of common stock (as adjusted for the Separation and the 1-for-5 reverse stock split) to secure post-closing indemnification obligations of the sellers and/or post-closing adjustments to the purchase price, and in July 2015, we paid $7.4 million in cash and issued 122,638 shares of our common stock to the sellers of Society6 following the expiration of the indemnification holdback period. Artist relationships and non-compete have a useful life of 3 years, developed technology has a useful life of four years, and trade name have an ten year useful life. Goodwill, which is comprised of the excess of the purchase consideration over the fair value of the identifiable net assets acquired, is primarily derived from assembled workforce and our ability to generate synergies with its services.
In March 2013, we acquired Creativebug, an online destination for arts and crafts instruction based in San Francisco, California, for an $8.0 million cash purchase price consideration. $0.8 million cash was held back by us to secure post-closing indemnification obligations of the sellers and/or post-closing adjustments to the purchase price. Of the holdback, $0.4 million that is not subject to then-pending claims was paid 9 months after the closing date, and the remainder of the holdback that is not subject to then-pending claims was paid 18 months after the closing date. During July 2014, we completed the sale of our Creativebug business.
The Society6 and Creativebug acquisitions are included in our consolidated financial statements as of the date of the acquisition. The allocation of the purchase consideration, for business acquisitions made by us during the year ended December 31, 2013 is as follows (in thousands):
|
|
|
|
|
|
|
|
|
|
|
|
|
|
|
Creativebug |
|
Society6 |
|
Total |
|
|||
|
Goodwill |
|
$ |
4,459 |
|
$ |
76,676 |
|
$ |
81,135 |
|
|
Media content |
|
|
3,390 |
|
|
- |
|
|
3,390 |
|
|
Technology |
|
|
- |
|
|
2,587 |
|
|
2,587 |
|
|
Artist relationships |
|
|
- |
|
|
9,867 |
|
|
9,867 |
|
|
Non-compete agreements |
|
|
699 |
|
|
192 |
|
|
891 |
|
|
Trade names |
|
|
132 |
|
|
3,419 |
|
|
3,551 |
|
|
Customer relationships |
|
|
43 |
|
|
- |
|
|
43 |
|
|
Other assets and liabilities assumed |
|
|
(723) |
|
|
1,581 |
|
|
858 |
|
|
Total |
|
$ |
8,000 |
|
$ |
94,322 |
|
$ |
102,322 |
|
F-32
Supplemental Pro forma Information (unaudited)
Supplemental information on an unaudited pro forma basis, as if the 2014 and 2013 acquisitions had been consummated as of January 1, 2013, is as follows (in thousands):
|
|
|
Year ended December 31, |
|
||||
|
|
|
2014 |
|
2013 |
|
||
|
Revenue |
|
$ |
174,691 |
|
$ |
222,790 |
|
|
Net loss |
|
$ |
(272,988) |
|
$ |
(24,484) |
|
The unaudited pro forma supplemental information is based on estimates and assumptions which we believe are reasonable and reflect amortization of intangible assets as a result of the acquisitions. The pro forma results are not necessarily indicative of the results that have been realized had the acquisitions been consolidated in the tables above as of January 1, 2013.
Dispositions
We sold our Creativebug business in July 2014 and received $10.0 million in cash, inclusive of $1.0 million held in escrow for one year from the closing date as a holdback amount to cover indemnity claims, resulting in a gain on sale of $0.2 million, recorded in other income, net. The holdback amount was received in 2015. We also sold our CoveritLive business in July 2014 and received $4.5 million of cash and promissory note with a principal amount of $5.6 million, resulting in a gain on sale of $0.6 million, recorded in other income, net. During the year ended December 31, 2015, we agreed to an early repayment of the promissory note and received $5.1 million in cash, plus accrued and unpaid interest, which satisfied all amounts owed to us under the promissory note.
In February 2015, we sold our Pluck social media business for $3.8 million in cash after working capital adjustments, resulting in a gain of $2.1 million. During the year ended December 31, 2015, we also sold certain non-core online properties for a total consideration of $1.2 million, resulting in a gain of $1.0 million, recorded in other income, net.
16. Business Segments
We operate in one operating segment. Our chief operating decision maker (“CODM”) manages our operations on a consolidated basis for purposes of evaluating financial performance and allocating resources. The CODM reviews separate revenue information for its Content & Media and Marketplace offerings. All other financial information is reviewed by the CODM on a consolidated basis. All of the Company’s principal operations and assets are located in the United States.
Revenue derived from the Company’s Content & Media and Marketplaces is as follows (in thousands):
|
|
|
Year ended December 31, |
|
|
|||||||
|
|
|
2015 |
|
2014 |
|
2013 |
|
|
|||
|
Content & Media |
|
$ |
73,814 |
|
$ |
137,038 |
|
$ |
195,080 |
|
|
|
Marketplaces |
|
|
52,155 |
|
|
35,391 |
|
|
14,331 |
|
|
|
Total revenue |
|
$ |
125,969 |
|
$ |
172,429 |
|
$ |
209,411 |
|
|
F-33
Revenue by geographic region, as determined based on the location of our customers or the anticipated destination of use was as follows:
|
|
|
Year ended December 31, |
|
|
|||||||
|
|
|
2015 |
|
2014 |
|
2013 |
|
|
|||
|
Domestic |
|
$ |
107,258 |
|
$ |
152,437 |
|
$ |
196,499 |
|
|
|
International |
|
|
18,711 |
|
|
19,992 |
|
|
12,912 |
|
|
|
Total revenue |
|
$ |
125,969 |
|
$ |
172,429 |
|
$ |
209,411 |
|
|
17. Concentrations
Concentrations of Credit and Business Risk
Financial instruments that potentially subject us to a concentration of credit risk consist of cash and cash equivalents, marketable securities and accounts receivable.
At December 31, 2015, our cash and cash equivalents and marketable securities were maintained primarily with six major U.S. financial institutions and three foreign banks. We also have used three Internet payment processors in both periods. Deposits with these institutions at times exceed the federally insured limits, which potentially subject us to concentration of credit risk. We have not experienced any losses related to these balances and believe that there is minimal risk.
A substantial portion of our advertising revenue is generated through arrangements with one advertising network partner. We may not be successful in renewing any of these agreements, or if they are renewed, they may not be on terms as favorable as current agreements. We may not be successful in renewing our agreements with advertising network partners on commercially acceptable terms.
The percentage of revenue generated through advertising network partners representing more than 10% of consolidated revenue is as follows:
|
|
|
|
|
|
|
|
|
|
|
|
Year ended December 31, |
|
||||
|
|
|
2015 |
|
2014 |
|
2013 |
|
|
|
|
36 |
% |
50 |
% |
56 |
% |
Advertising network partners comprising more than 10% of the consolidated accounts receivable balance was as follows:
|
|
|
Year ended December 31, |
|
|
||
|
|
|
2015 |
|
2014 |
|
|
|
Google, Inc. |
|
26 |
% |
42 |
% |
|
F-34
18. Net Income (Loss) Per Share
The following table sets forth the computation of basic and diluted net income (loss) per share of common stock (in thousands, except per share data):
|
|
|
Year ended December 31, |
|
|
|||||||
|
|
|
2015 |
|
2014 |
|
2013 |
|
|
|||
|
Net loss from continuing operations |
|
$ |
(43,501) |
|
$ |
(256,149) |
|
$ |
(14,218) |
|
|
|
Net loss from discontinued operations |
|
|
— |
|
|
(11,208) |
|
|
(5,956) |
|
|
|
Net loss |
|
$ |
(43,501) |
|
$ |
(267,357) |
|
$ |
(20,174) |
|
|
|
|
|
|
|
|
|
|
|
|
|
|
|
|
Weighted average common shares outstanding |
|
|
19,938 |
|
|
18,748 |
|
|
17,729 |
|
|
|
Weighted average unvested restricted stock awards |
|
|
— |
|
|
(3) |
|
|
(22) |
|
|
|
Weighted average common shares outstanding—basic and diluted |
|
|
19,938 |
|
|
18,745 |
|
|
17,707 |
|
|
|
|
|
|
|
|
|
|
|
|
|
|
|
|
Earnings (Loss) per share—basic and diluted |
|
|
|
|
|
|
|
|
|
|
|
|
Net loss from continuing operations |
|
$ |
(2.18) |
|
$ |
(13.66) |
|
$ |
(0.80) |
|
|
|
Net loss from discontinued operations |
|
|
— |
|
|
(0.60) |
|
|
(0.34) |
|
|
|
Net loss per share |
|
$ |
(2.18) |
|
$ |
(14.26) |
|
$ |
(1.14) |
|
|
For the years ended December 31, 2015, 2014 and 2013, we excluded 0.1 million, 0.2 million shares, and 0.2 million shares respectively, from the calculation of diluted weighted average shares outstanding, as their inclusion would have been antidilutive.
F-35
EXHIBIT INDEX
|
Exhibit No. |
|
Description of Exhibit |
|
|
2.1 |
|
Separation and Distribution Agreement between Demand Media, Inc. and Rightside Group, Ltd., dated as of August 1, 2014 (incorporated by reference to Exhibit 2.1 to the Company's Current Report on Form 8-K filed with the SEC on August 7, 2014) |
|
|
2.2 |
|
Agreement and Plan of Merger, dated as of August 8, 2014, by and among Demand Media, Inc., Gallery Merger Sub, Inc., Saatchi Online, Inc. and Shareholder Representative Services LLC (incorporated by reference to Exhibit 2.1 to the Company's Current Report on Form 8-K filed with the SEC on August 11, 2014) |
|
|
3.1 |
|
Amended and Restated Certificate of Incorporation of Demand Media, Inc., as amended effective August 1, 2014 (incorporated by reference to Exhibit 3.1 to the Company’s Registration Statement on Form S-3 filed with the SEC on August 29, 2014) |
|
|
3.2 |
|
Amended and Restated Bylaws of Demand Media, Inc. (incorporated by reference to Exhibit 3.02 to the Company’s Annual Report on Form 10-K filed with the SEC on March 1, 2011) |
|
|
4.1 |
|
Form of Demand Media, Inc. Common Stock Certificate (incorporated by reference to Exhibit 4.1 to the Company’s Quarterly Report on Form 10-Q filed with the SEC on November 10, 2014) |
|
|
4.2 |
|
Third Amended and Restated Stockholders’ Agreement, among Demand Media, Inc., and the stockholders listed on Exhibit A thereto, dated March 3, 2008 (incorporated by reference to Exhibit 4.02 to the Company’s Registration Statement on Form S-1 (File No. 333-168612) filed with the SEC on August 6, 2010) |
|
|
4.2A |
|
Amendment No. 1 to Third Amended and Restated Stockholders’ Agreement, dated October 21, 2010 (incorporated by reference to Exhibit 4.03 to Amendment No. 3 to the Company’s Registration Statement on Form S-1 (File No. 333-168612) filed with the SEC on October 29, 2010) |
|
|
4.2B |
|
Waiver of Registration Rights and Amendment to Stockholders’ Agreement, dated August 24, 2012 (incorporated by reference to Exhibit 4.1 to the Company’s Quarterly Report on Form 10-Q filed with the SEC on November 13, 2012) |
|
|
10.1 |
† |
Form of Indemnification Agreement entered into by and between Demand Media, Inc. and each of its directors and executive officers (incorporated by reference to Exhibit 10.01 to Amendment No. 2 to the Company’s Registration Statement on Form S-1 (File No. 333-168612) filed with the SEC on October 12, 2010) |
|
|
10.2 |
† |
Amended and Restated Demand Media, Inc. 2006 Equity Incentive Plan, adopted April 2006 and amended and restated on June 26, 2008 (incorporated by reference to Exhibit 10.03 to the Company’s Registration Statement on Form S-1 (File No. 333-168612) filed with the SEC on August 6, 2010) |
|
|
10.2A |
† |
First Amendment to the Amended and Restated Demand Media, Inc. 2006 Equity Incentive Plan, dated June 1, 2009 (incorporated by reference to Exhibit 10.03A to the Company’s Registration Statement on Form S-1 (File No. 333-168612) filed with the SEC on August 6, 2010) |
|
|
10.3 |
† |
Form of Demand Media, Inc. 2006 Equity Incentive Plan Restricted Stock Purchase Agreement (incorporated by reference to Exhibit 10.06 to the Company’s Registration Statement on Form S-1 (File No. 333-168612) filed with the SEC on August 6, 2010) |
|
|
10.4 |
† |
Form of Demand Media, Inc. 2006 Equity Incentive Plan Stock Option Agreement (incorporated by reference to Exhibit 10.07 to the Company’s Registration Statement on Form S-1 (File No. 333-168612) filed with the SEC on August 6, 2010) |
|
|
10.5 |
† |
Amended and Restated Demand Media, Inc. 2010 Incentive Award Plan, adopted June 2015 (incorporated by reference to Appendix A to the Company’s Proxy Statement for its 2015 Annual Meeting of Stockholders, filed with the SEC on April 28, 2015) |
|
|
10.6 |
† |
Form of Demand Media, Inc. 2010 Incentive Award Plan Stock Option Grant Notice and Stock Option Agreement, as amended (incorporated by reference to Exhibit 10.1 to the Company’s Quarterly Report on Form 10-Q filed with the SEC on November 5, 2015) |
|
|
Exhibit No. |
|
Description of Exhibit |
|
|
10.7 |
† |
Form of Demand Media, Inc. 2010 Incentive Award Plan Restricted Stock Unit Award Grant Notice and Restricted Stock Unit Award Agreement (incorporated by reference to Exhibit 10.1 to the Company’s Quarterly Report on Form 10-Q filed with the SEC on November 5, 2015) |
|
|
10.8 |
† |
Form of Demand Media, Inc. 2010 Incentive Award Plan Restricted Stock Award Grant Notice and Restricted Stock Award Agreement (incorporated by reference to Exhibit 10.2 to the Company’s Quarterly Report on Form 10-Q filed with the SEC on August 12, 2011) |
|
|
10.9 |
† |
Demand Media, Inc. 2010 Employee Stock Purchase Plan, dated September 27, 2010 (incorporated by reference to Exhibit 10.26 to Amendment No. 3 to the Company’s Registration Statement on Form S-1 (File No. 333-168612) filed with the SEC on October 29, 2010) |
|
|
10.10 |
† |
Amended and Restated Employment Agreement, dated as of January 5, 2016, by and between Demand Media, Inc. and Sean Moriarty (incorporated by reference to Exhibit 10.1 to the Company’s Current Report on Form 8-K filed with the SEC on January 7, 2016) |
|
|
10.11 |
† |
Employment Agreement between Demand Media, Inc. and Rachel Glaser, dated as of March 4, 2015 (incorporated by reference to Exhibit 10.14 to the Company’s Annual Report on Form 10-K filed with the SEC on March 16, 2015) |
|
|
10.12 |
† |
Amended and Restated Employment Agreement between Demand Media, Inc. and Peter Kim, dated as of March 4, 2015 (incorporated by reference to Exhibit 10.15 to the Company’s Annual Report on Form 10-K filed with the SEC on March 16, 2015) |
|
|
10.13 |
† |
Amended and Restated Employment Agreement by and between Brian Pike and Demand Media, Inc., dated as of May 21, 2015 (incorporated by reference to Exhibit 10.1 to the Company’s Current Report on Form 8-K filed with the SEC on May 21, 2015) |
|
|
10.14 |
† |
Second Amended and Restated Employment Agreement between Demand Media, Inc. and Julie Campistron, dated as of November 1, 2013 (incorporated by reference to Exhibit 10.17 to the Company’s Annual Report on Form 10-K filed with the SEC on March 16, 2015) |
|
|
10.14A |
† |
First Amendment to Second Amended and Restated Employment Agreement between Demand Media, Inc. and Julie Campistron, dated as of April 30, 2014 (incorporated by reference to Exhibit 10.17A to the Company’s Annual Report on Form 10-K filed with the SEC on March 16, 2015) |
|
|
10.14B |
† |
Second Amendment to Second Amended and Restated Employment Agreement between Demand Media, Inc. and Julie Campistron, dated as of December 1, 2014 (incorporated by reference to Exhibit 10.17B to the Company’s Annual Report on Form 10-K filed with the SEC on March 16, 2015) |
|
|
10.15 |
† |
Consulting Agreement by and between Julie Campistron and Demand Media, Inc., dated as of May 21, 2015 (incorporated by reference to Exhibit 10.2 to the Company’s Current Report on Form 8-K filed with the SEC on May 21, 2015) |
|
|
10.16 |
† |
Second Amended and Restated Employment Agreement between Demand Media, Inc. and Daniel Weinrot, dated as of December 1, 2014 (incorporated by reference to Exhibit 10.19 to the Company’s Annual Report on Form 10-K filed with the SEC on March 16, 2015) |
|
|
10.17 |
† |
Employment Agreement by and between Wendy Voong and Demand Media, Inc., dated as of July 28, 2015 (incorporated by reference to Exhibit 10.1 to the Company’s Current Report on Form 8-K filed with the SEC on August 3, 2015) |
|
|
10.18 |
|
Google Services Agreement entered into by Google Inc. and Demand Media, Inc., effective as of November 1, 2014 (portions of this exhibit have been omitted pursuant to a request for confidential treatment) (incorporated by reference to Exhibit 10.1 to the Company’s Current Report on Form 8-K filed with the SEC on February 9, 2015) |
|
|
10.18A |
|
Amendment Number One to Google Services Agreement between Google Inc. and Demand Media, Inc., dated February 6, 2015 (portions of this exhibit have been omitted pursuant to a request for confidential treatment) (incorporated by reference to Exhibit 10.2 to the Company’s Current Report on Form 8-K filed with the SEC on February 9, 2015) |
|
|
Exhibit No. |
|
Description of Exhibit |
|
|
10.19 |
|
Transition Services Agreement between Demand Media, Inc. and Rightside Group, Ltd., dated as of August 1, 2014 (incorporated by reference to Exhibit 10.1 to the Company's Current Report on Form 8-K filed with the SEC on August 7, 2014) |
|
|
10.20 |
|
Employee Matters Agreement between Demand Media, Inc. and Rightside Group, Ltd., dated as of August 1, 2014 (incorporated by reference to Exhibit 10.2 to the Company's Current Report on Form 8-K filed with the SEC on August 7, 2014) |
|
|
10.21 |
|
Tax Matters Agreement between Demand Media, Inc. and Rightside Group, Ltd., dated as of August 1, 2014 (incorporated by reference to Exhibit 10.3 to the Company's Current Report on Form 8-K filed with the SEC on August 7, 2014) |
|
|
10.22 |
|
Intellectual Property Assignment and License Agreement between Demand Media, Inc. and Rightside Operating Co., dated as of July 30, 2014 (incorporated by reference to Exhibit 10.4 to the Company's Current Report on Form 8-K filed with the SEC on August 7, 2014) |
|
|
10.23 |
† |
Demand Media, Inc. Outside Director Compensation Program (updated as of February 2016) (incorporated by reference to Exhibit 10.1 to the Company’s Current Report on Form 8-K filed with the SEC on February 12, 2016) |
|
|
14.1 |
|
Code of Business Conduct and Ethics (incorporated by reference to Exhibit 14.01 to the Company’s Annual Report on Form 10-K filed with the SEC on March 1, 2011) |
|
|
21.1 |
|
List of subsidiaries of Demand Media, Inc. (filed herewith) |
|
|
23.1 |
|
Consent of Independent Registered Public Accounting Firm (filed herewith) |
|
|
24.1 |
|
Power of Attorney (included on signature page hereto) |
|
|
31.1 |
|
Certification of the Principal Executive Officer pursuant to Rules 13a-14(a) and 15d-14(a) of the Securities Exchange Act of 1934, as amended, as adopted pursuant to Section 302 of the Sarbanes-Oxley Act of 2002 (filed herewith) |
|
|
31.2 |
|
Certification of the Principal Financial Officer pursuant to Rules 13a-14(a) and 15d-14(a) of the Securities Exchange Act of 1934, as amended, as adopted pursuant to Section 302 of the Sarbanes-Oxley Act of 2002 (filed herewith) |
|
|
32.1 |
|
Certification of the Principal Executive Officer pursuant to 18 U.S.C. Section 1350, as adopted pursuant to Section 906 of the Sarbanes-Oxley Act of 2002 (furnished herewith) |
|
|
32.2 |
|
Certification of the Principal Financial Officer pursuant to 18 U.S.C. Section 1350, as adopted pursuant to Section 906 of the Sarbanes-Oxley Act of 2002 (furnished herewith) |
|
|
101.INS |
XBRL Instance Document (filed herewith) |
||
|
101.SCH |
|
XBRL Taxonomy Extension Schema Document (filed herewith) |
|
|
101.CAL |
|
XBRL Taxonomy Extension Calculation Linkbase Document (filed herewith) |
|
|
101.DEF |
|
XBRL Taxonomy Extension Definition Linkbase Document (filed herewith) |
|
|
101.LAB |
XBRL Taxonomy Extension Label Linkbase Document (filed herewith) |
||
|
101.PRE |
|
XBRL Taxonomy Extension Presentation Linkbase Document (filed herewith) |
|
|
|
|
† Indicates management contract or compensatory plan, contract or arrangement. |