Attached files
| file | filename |
|---|---|
| EX-99.2 - EX-99.2 - HOPE BANCORP INC | hope-06302020ex992.htm |
| EX-99.1 - EX-99.1 - HOPE BANCORP INC | hope-06302020ex991.htm |
| 8-K - 8-K - HOPE BANCORP INC | hope-20200730.htm |

2020 Second Quarter Earnings Conference Call Friday, July 31 2020 1

Forward Looking Statements & Additional Disclosures This presentation may contain statements regarding future events or the future financial performance of the Company that constitute forward‐looking statements within the meaning of Section 27A of the Securities Act of 1933, as amended, and Section 21E of the Securities Exchange Act of 1934, as amended. These forward‐looking statements relate to, among other things, expectations regarding the business environment in which we operate, projections of future performance, perceived opportunities in the market, and statements regarding our business strategies, objectives and vision. Forward‐ looking statements include, but are not limited to, statements preceded by, followed by or that include the words “will,” “believes,” “expects,” “anticipates,” “intends,” “plans,” “estimates” or similar expressions. With respect to any such forward‐looking statements, the Company claims the protection provided for in the Private Securities Litigation Reform Act of 1995. These statements involve risks and uncertainties. The Company’s actual results, performance or achievements may differ significantly from the results, performance or achievements expressed or implied in any forward‐looking statements. The risks and uncertainties include, but are not limited to: possible deterioration in economic conditions in our areas of operation; interest rate risk associated with volatile interest rates and related asset‐liability matching risk; liquidity risks; risk of significant non‐earning assets, and net credit losses that could occur, particularly in times of weak economic conditions or times of rising interest rates; the failure of or changes to assumptions and estimates underlying the Company’s allowances for loan losses, including the timing and effects of the implementation of the current expected credit losses model; and regulatory risks associated with current and future regulations, and the COVID‐19 pandemic and its impact on our financial position, results of operations, liquidity, and capitalization. For additional information concerning these and other risk factors, see the Company’s most recent Annual Report on Form 10‐K. The Company does not undertake, and specifically disclaims any obligation, to update any forward‐looking statements to reflect the occurrence of events or circumstances after the date of such statements except as required by law. 2
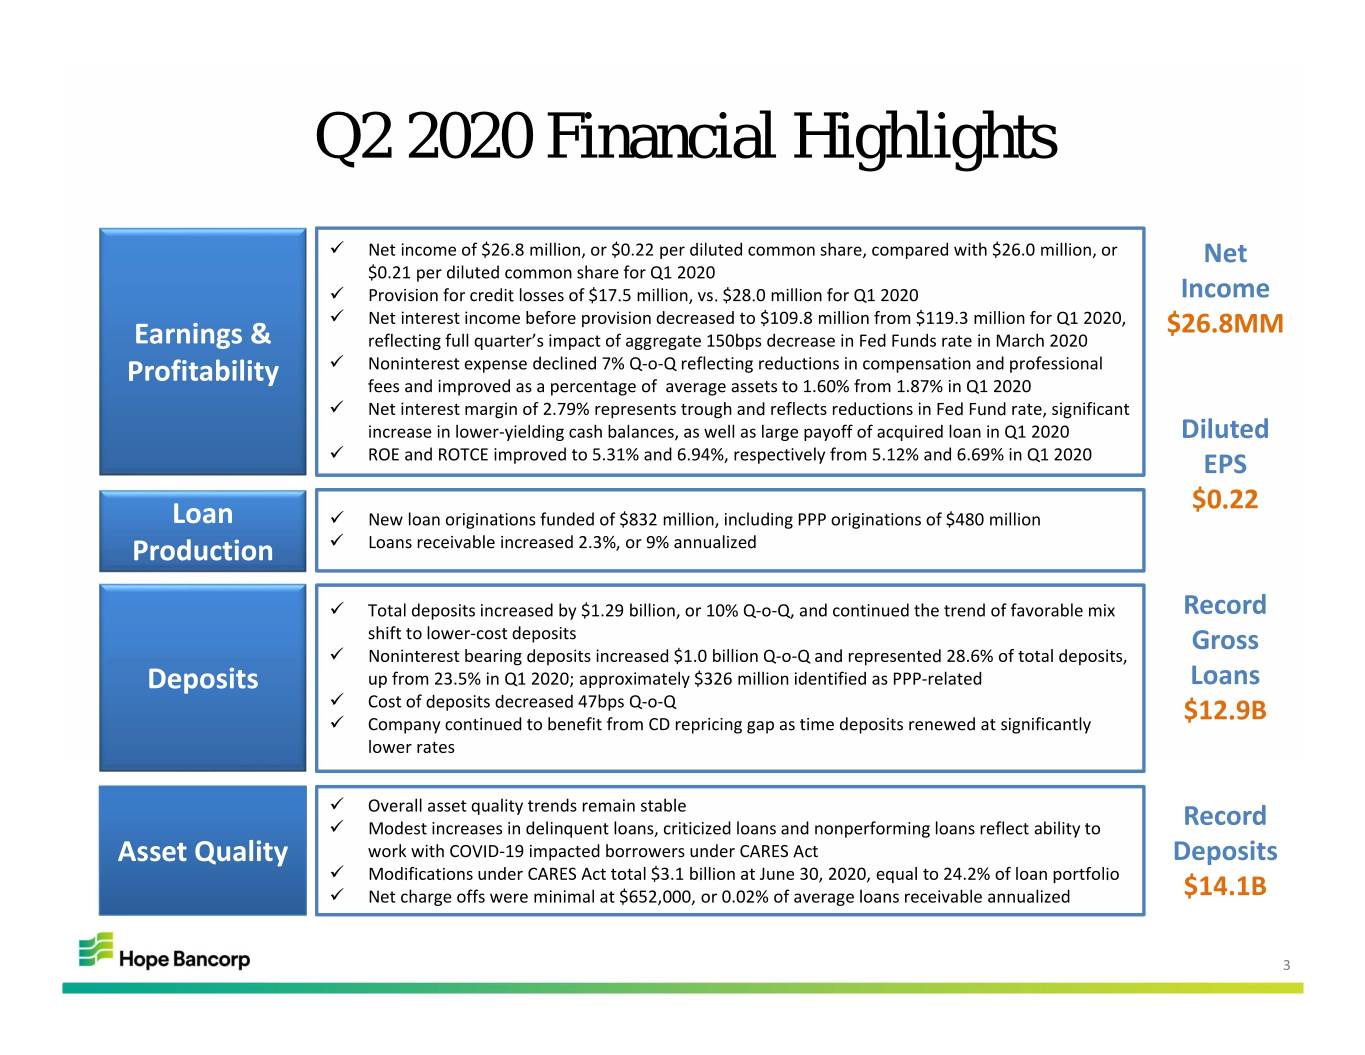
Q2 2020 Financial Highlights Net income of $26.8 million, or $0.22 per diluted common share, compared with $26.0 million, or Net $0.21 per diluted common share for Q1 2020 Provision for credit losses of $17.5 million, vs. $28.0 million for Q1 2020 Income Net interest income before provision decreased to $109.8 million from $119.3 million for Q1 2020, $26.8MM Earnings & reflecting full quarter’s impact of aggregate 150bps decrease in Fed Funds rate in March 2020 Noninterest expense declined 7% Q‐o‐Q reflecting reductions in compensation and professional Profitability fees and improved as a percentage of average assets to 1.60% from 1.87% in Q1 2020 Net interest margin of 2.79% represents trough and reflects reductions in Fed Fund rate, significant increase in lower‐yielding cash balances, as well as large payoff of acquired loan in Q1 2020 Diluted ROE and ROTCE improved to 5.31% and 6.94%, respectively from 5.12% and 6.69% in Q1 2020 EPS $0.22 Loan New loan originations funded of $832 million, including PPP originations of $480 million Production Loans receivable increased 2.3%, or 9% annualized Total deposits increased by $1.29 billion, or 10% Q‐o‐Q, and continued the trend of favorable mix Record shift to lower‐cost deposits Gross Noninterest bearing deposits increased $1.0 billion Q‐o‐Q and represented 28.6% of total deposits, Deposits up from 23.5% in Q1 2020; approximately $326 million identified as PPP‐related Loans Cost of deposits decreased 47bps Q‐o‐Q Company continued to benefit from CD repricing gap as time deposits renewed at significantly $12.9B lower rates Overall asset quality trends remain stable Modest increases in delinquent loans, criticized loans and nonperforming loans reflect ability to Record Asset Quality work with COVID‐19 impacted borrowers under CARES Act Deposits Modifications under CARES Act total $3.1 billion at June 30, 2020, equal to 24.2% of loan portfolio Net charge offs were minimal at $652,000, or 0.02% of average loans receivable annualized $14.1B 3
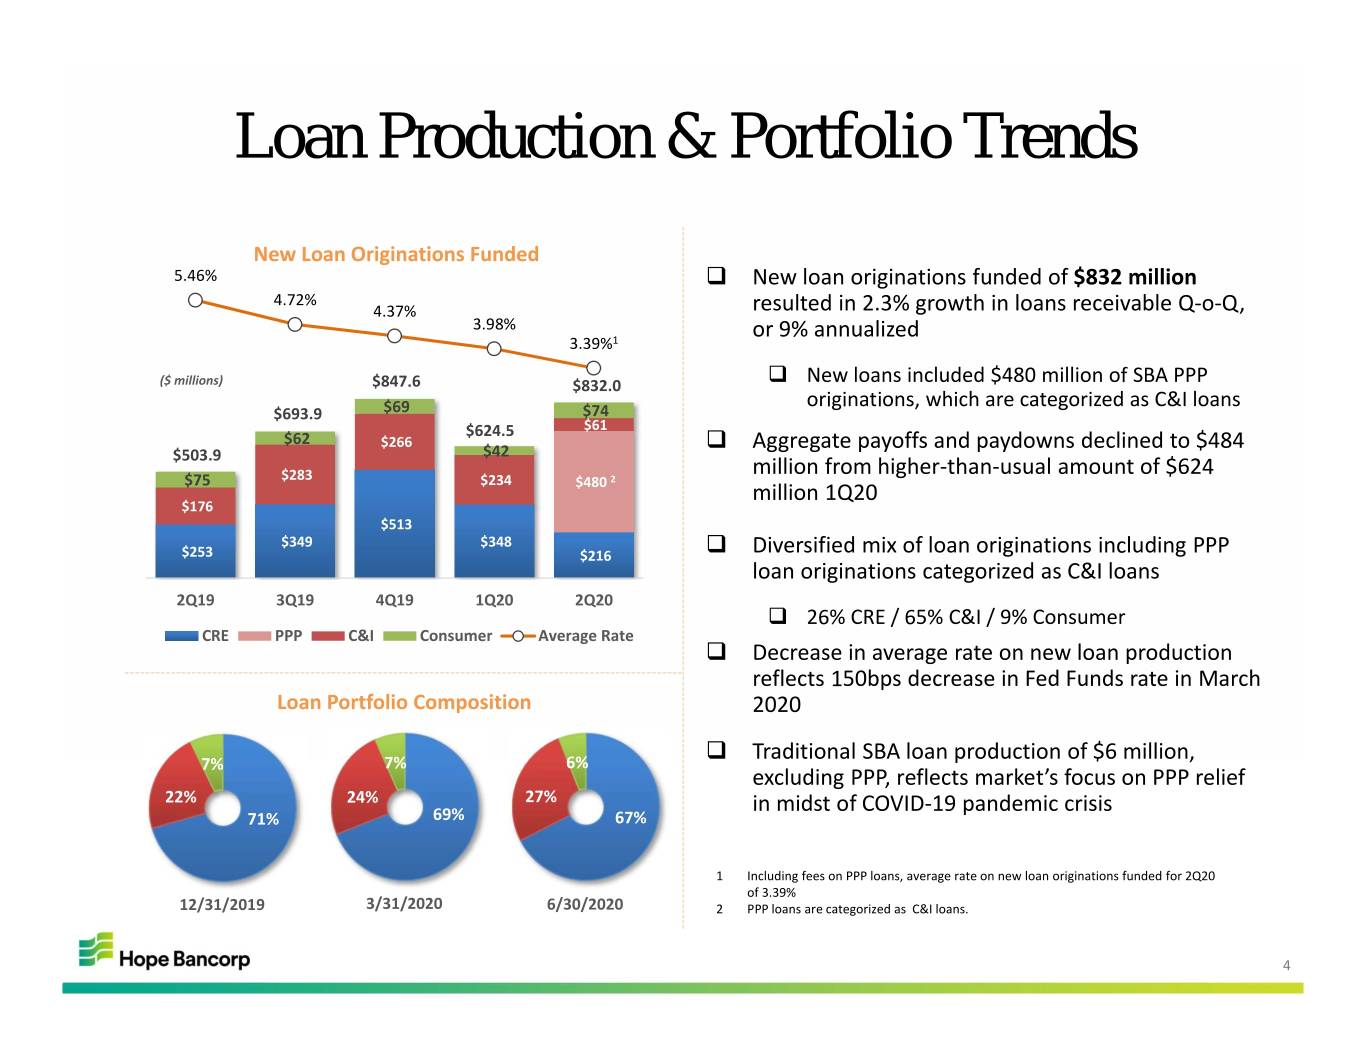
Loan Production & Portfolio Trends New Loan Originations Funded 5.46% New loan originations funded of $832 million 4.72% 4.37% resulted in 2.3% growth in loans receivable Q‐o‐Q, 3.98% or 9% annualized 3.39%1 ($ millions) $847.6 $832.0 New loans included $480 million of SBA PPP originations, which are categorized as C&I loans $693.9 $69 $74 $624.5 $61 $62 $266 $42 Aggregate payoffs and paydowns declined to $484 $503.9 million from higher‐than‐usual amount of $624 $75 $283 $234 2 $480 million 1Q20 $176 $513 $349 $348 $253 $216 Diversified mix of loan originations including PPP loan originations categorized as C&I loans 2Q19 3Q19 4Q19 1Q20 2Q20 26% CRE / 65% C&I / 9% Consumer CRE PPP C&I Consumer Average Rate Decrease in average rate on new loan production reflects 150bps decrease in Fed Funds rate in March Loan Portfolio Composition 2020 Traditional SBA loan production of $6 million, 7% 7% 6% excluding PPP, reflects market’s focus on PPP relief 22% 24% 27% in midst of COVID‐19 pandemic crisis 71% 69% 67% 1 Including fees on PPP loans, average rate on new loan originations funded for 2Q20 of 3.39% 12/31/2019 3/31/2020 6/30/2020 2 PPP loans are categorized as C&I loans. 4
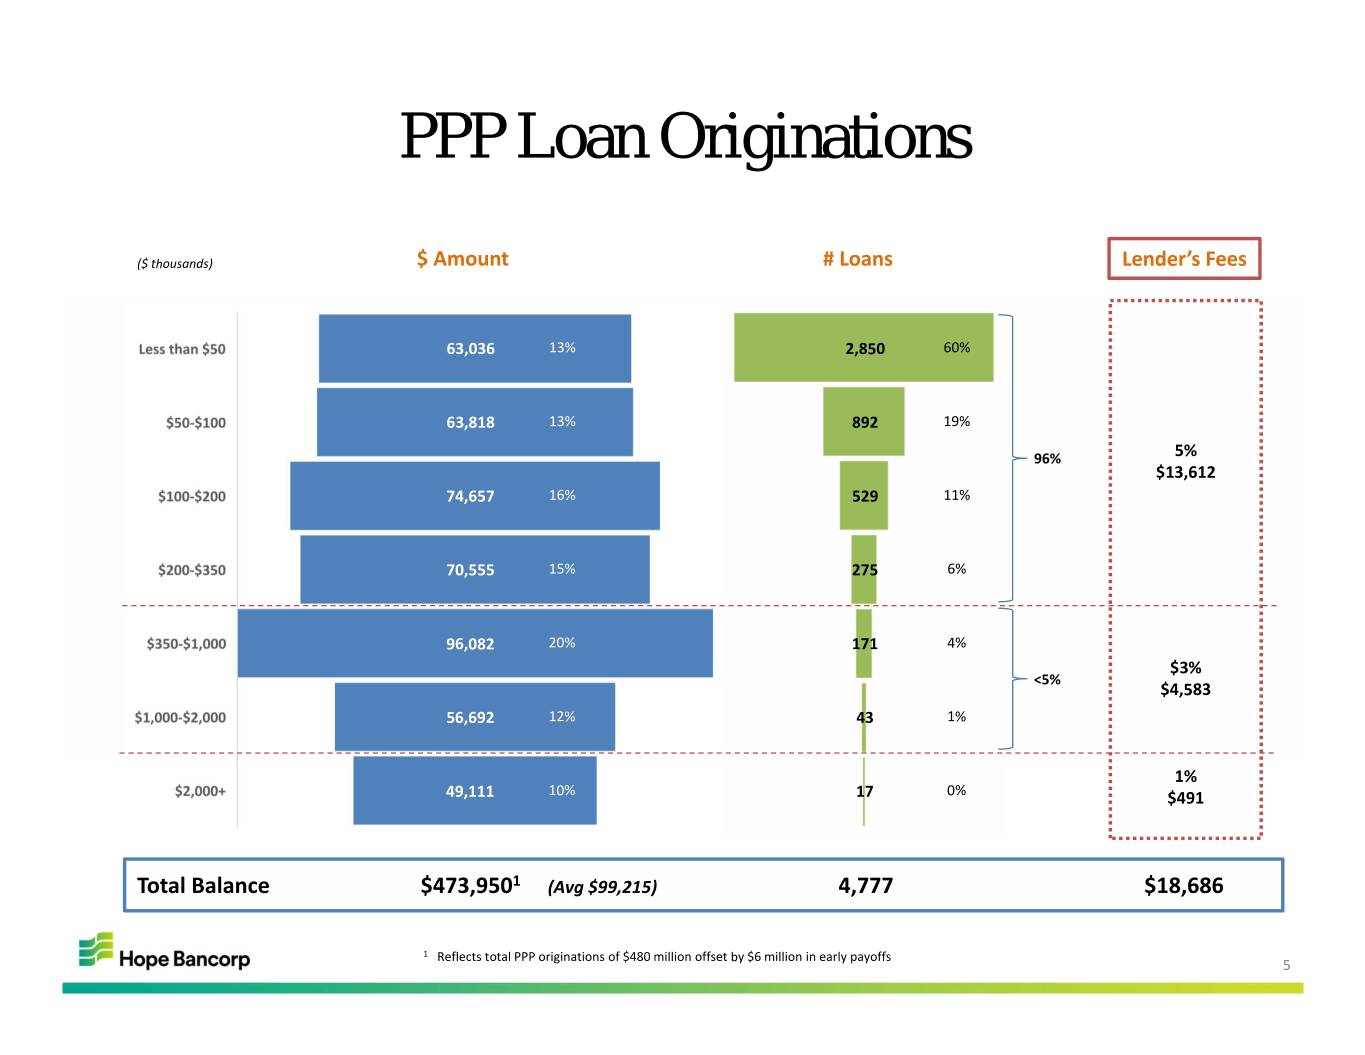
PPP Loan Originations ($ thousands) $ Amount # Loans Lender’s Fees 63,036 13% 2,850 60% 63,818 13% 892 19% 96% 5% $13,612 74,657 16% 529 11% 70,555 15% 275 6% 96,082 20% 171 4% $3% <5% $4,583 56,692 12% 43 1% 1% 49,111 10% 17 0% $491 Total Balance $473,9501 (Avg $99,215) 4,777 $18,686 1 Reflects total PPP originations of $480 million offset by $6 million in early payoffs 5
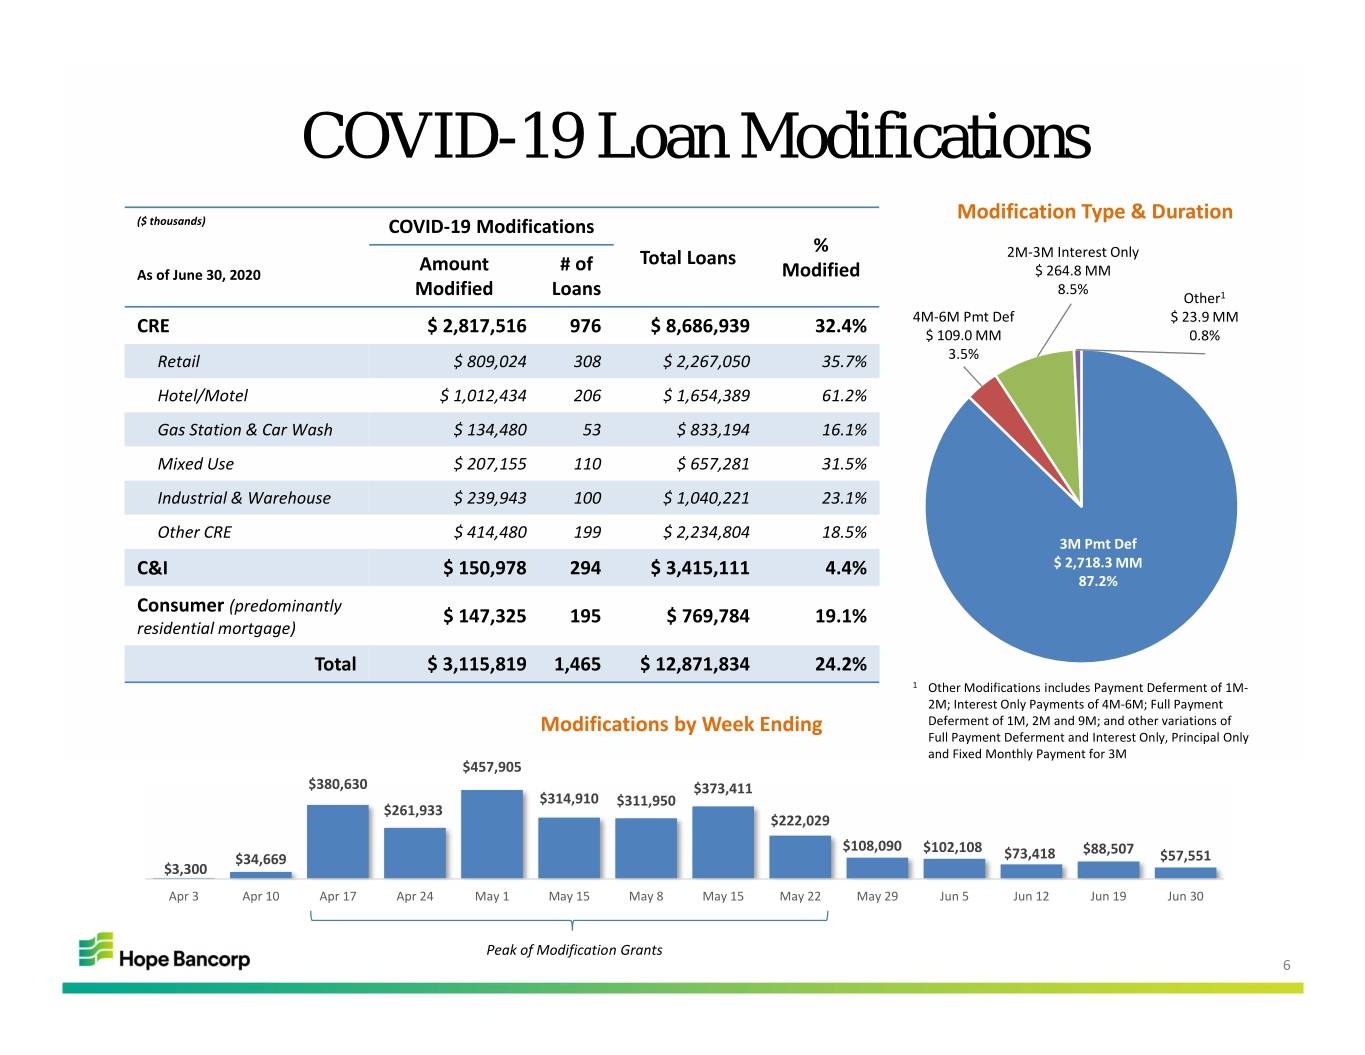
COVID-19 Loan Modifications Modification Type & Duration ($ thousands) COVID‐19 Modifications % 2M‐3M Interest Only Amount # of Total Loans As of June 30, 2020 Modified $ 264.8 MM 8.5% Modified Loans Other1 4M‐6M Pmt Def $ 23.9 MM CRE $ 2,817,516 976 $ 8,686,939 32.4% $ 109.0 MM 0.8% Retail $ 809,024 308 $ 2,267,050 35.7% 3.5% Hotel/Motel $ 1,012,434 206 $ 1,654,389 61.2% Gas Station & Car Wash $ 134,480 53 $ 833,194 16.1% Mixed Use $ 207,155 110 $ 657,281 31.5% Industrial & Warehouse $ 239,943 100 $ 1,040,221 23.1% Other CRE $ 414,480 199 $ 2,234,804 18.5% 3M Pmt Def C&I $ 150,978 294 $ 3,415,111 4.4% $ 2,718.3 MM 87.2% Consumer (predominantly $ 147,325 195 $ 769,784 19.1% residential mortgage) Total $ 3,115,819 1,465 $ 12,871,834 24.2% 1 Other Modifications includes Payment Deferment of 1M‐ 2M; Interest Only Payments of 4M‐6M; Full Payment Modifications by Week Ending Deferment of 1M, 2M and 9M; and other variations of Full Payment Deferment and Interest Only, Principal Only and Fixed Monthly Payment for 3M $457,905 $380,630 $373,411 $314,910 $311,950 $261,933 $222,029 $108,090 $102,108 $88,507 $34,669 $73,418 $57,551 $3,300 Apr 3Apr 10 Apr 17 Apr 24 May 1 May 15 May 8 May 15 May 22 May 29 Jun 5Jun 12 Jun 19 Jun 30 Peak of Modification Grants 6
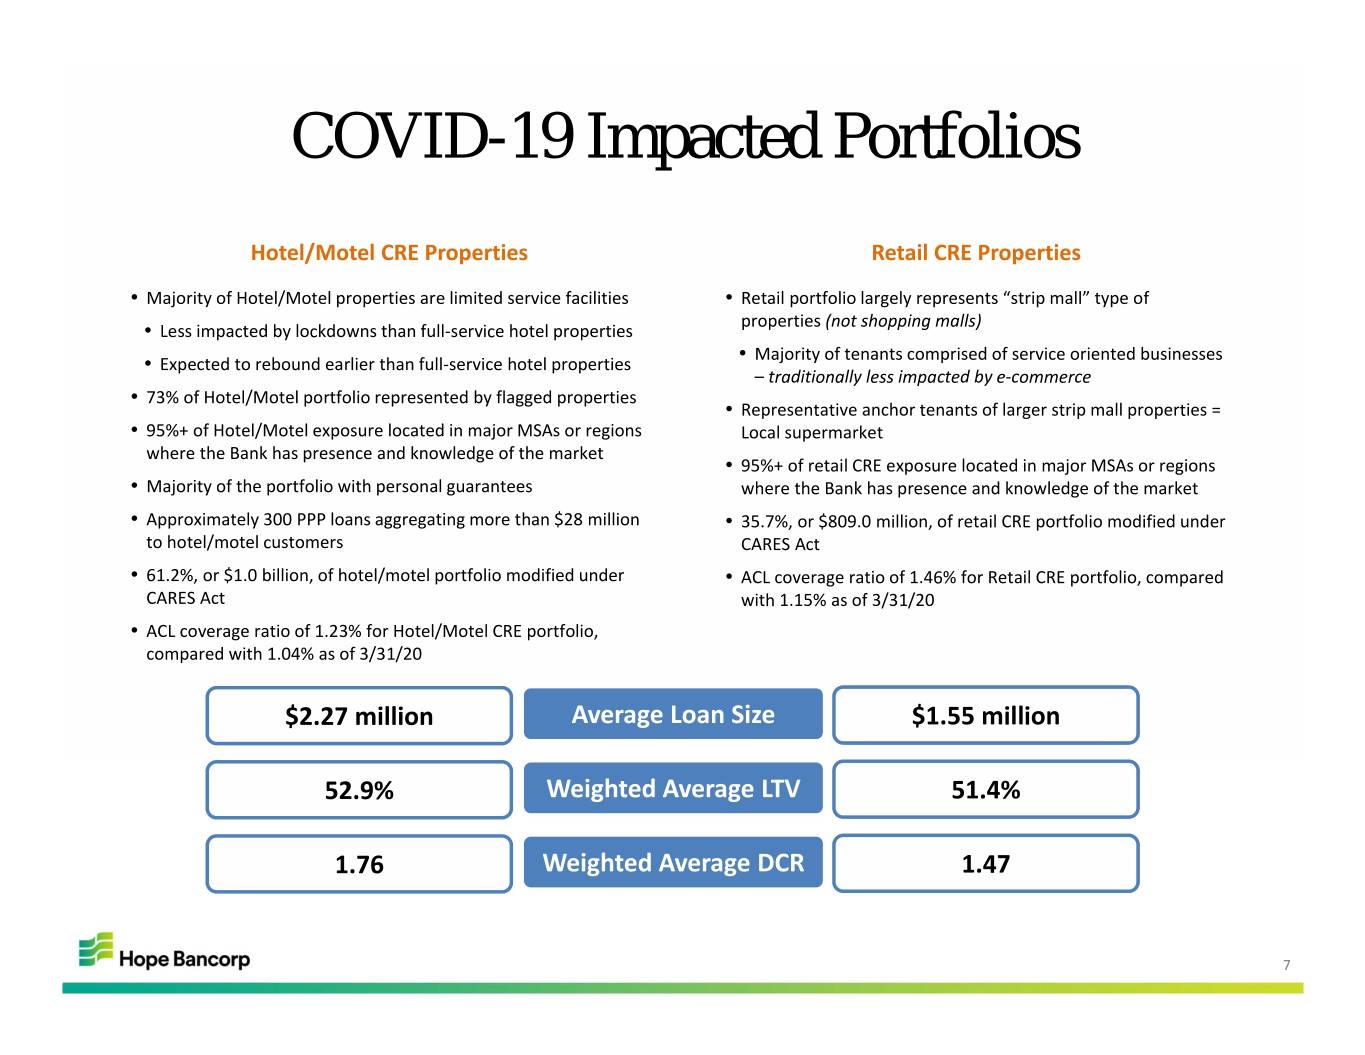
COVID-19 Impacted Portfolios Hotel/Motel CRE Properties Retail CRE Properties • Majority of Hotel/Motel properties are limited service facilities • Retail portfolio largely represents “strip mall” type of properties (not shopping malls) • Less impacted by lockdowns than full‐service hotel properties • Majority of tenants comprised of service oriented businesses • Expected to rebound earlier than full‐service hotel properties – traditionally less impacted by e‐commerce • 73% of Hotel/Motel portfolio represented by flagged properties • Representative anchor tenants of larger strip mall properties = • 95%+ of Hotel/Motel exposure located in major MSAs or regions Local supermarket where the Bank has presence and knowledge of the market • 95%+ of retail CRE exposure located in major MSAs or regions • Majority of the portfolio with personal guarantees where the Bank has presence and knowledge of the market • Approximately 300 PPP loans aggregating more than $28 million • 35.7%, or $809.0 million, of retail CRE portfolio modified under to hotel/motel customers CARES Act • 61.2%, or $1.0 billion, of hotel/motel portfolio modified under • ACL coverage ratio of 1.46% for Retail CRE portfolio, compared CARES Act with 1.15% as of 3/31/20 • ACL coverage ratio of 1.23% for Hotel/Motel CRE portfolio, compared with 1.04% as of 3/31/20 $2.27 million Average Loan Size $1.55 million 52.9% Weighted Average LTV 51.4% 1.76 Weighted Average DCR 1.47 7
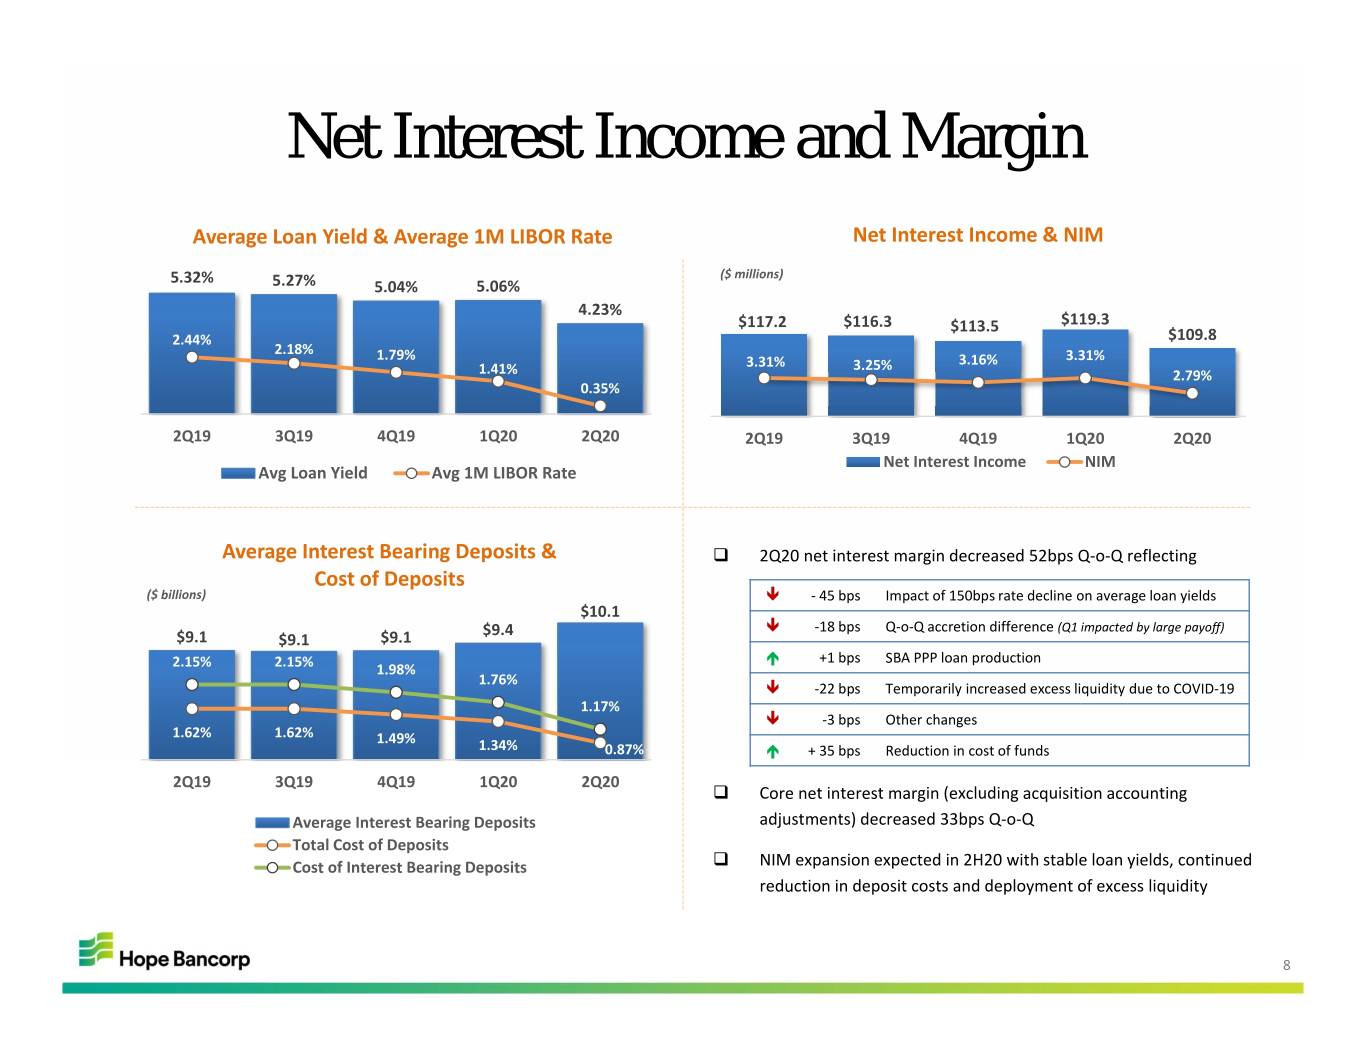
Net Interest Income and Margin Average Loan Yield & Average 1M LIBOR Rate Net Interest Income & NIM 5.32% ($ millions) 5.27% 5.04% 5.06% 4.23% $117.2 $116.3 $113.5 $119.3 2.44% $109.8 2.18% 1.79% 3.31% 3.31% 3.25% 3.16% 1.41% 2.79% 0.35% 2Q19 3Q19 4Q19 1Q20 2Q20 2Q19 3Q19 4Q19 1Q20 2Q20 Net Interest Income NIM Avg Loan Yield Avg 1M LIBOR Rate Average Interest Bearing Deposits & 2Q20 net interest margin decreased 52bps Q‐o‐Q reflecting Cost of Deposits ($ billions) ‐ 45 bps Impact of 150bps rate decline on average loan yields $10.1 $9.4 ‐18 bps Q‐o‐Q accretion difference (Q1 impacted by large payoff) $9.1 $9.1 $9.1 +1 bps SBA PPP loan production 2.15% 2.15% 1.98% 1.76% ‐22 bps Temporarily increased excess liquidity due to COVID‐19 1.17% ‐3 bps Other changes 1.62% 1.62% 1.49% 1.34% 0.87% + 35 bps Reduction in cost of funds 2Q19 3Q19 4Q19 1Q20 2Q20 Core net interest margin (excluding acquisition accounting Average Interest Bearing Deposits adjustments) decreased 33bps Q‐o‐Q Total Cost of Deposits Cost of Interest Bearing Deposits NIM expansion expected in 2H20 with stable loan yields, continued reduction in deposit costs and deployment of excess liquidity 8
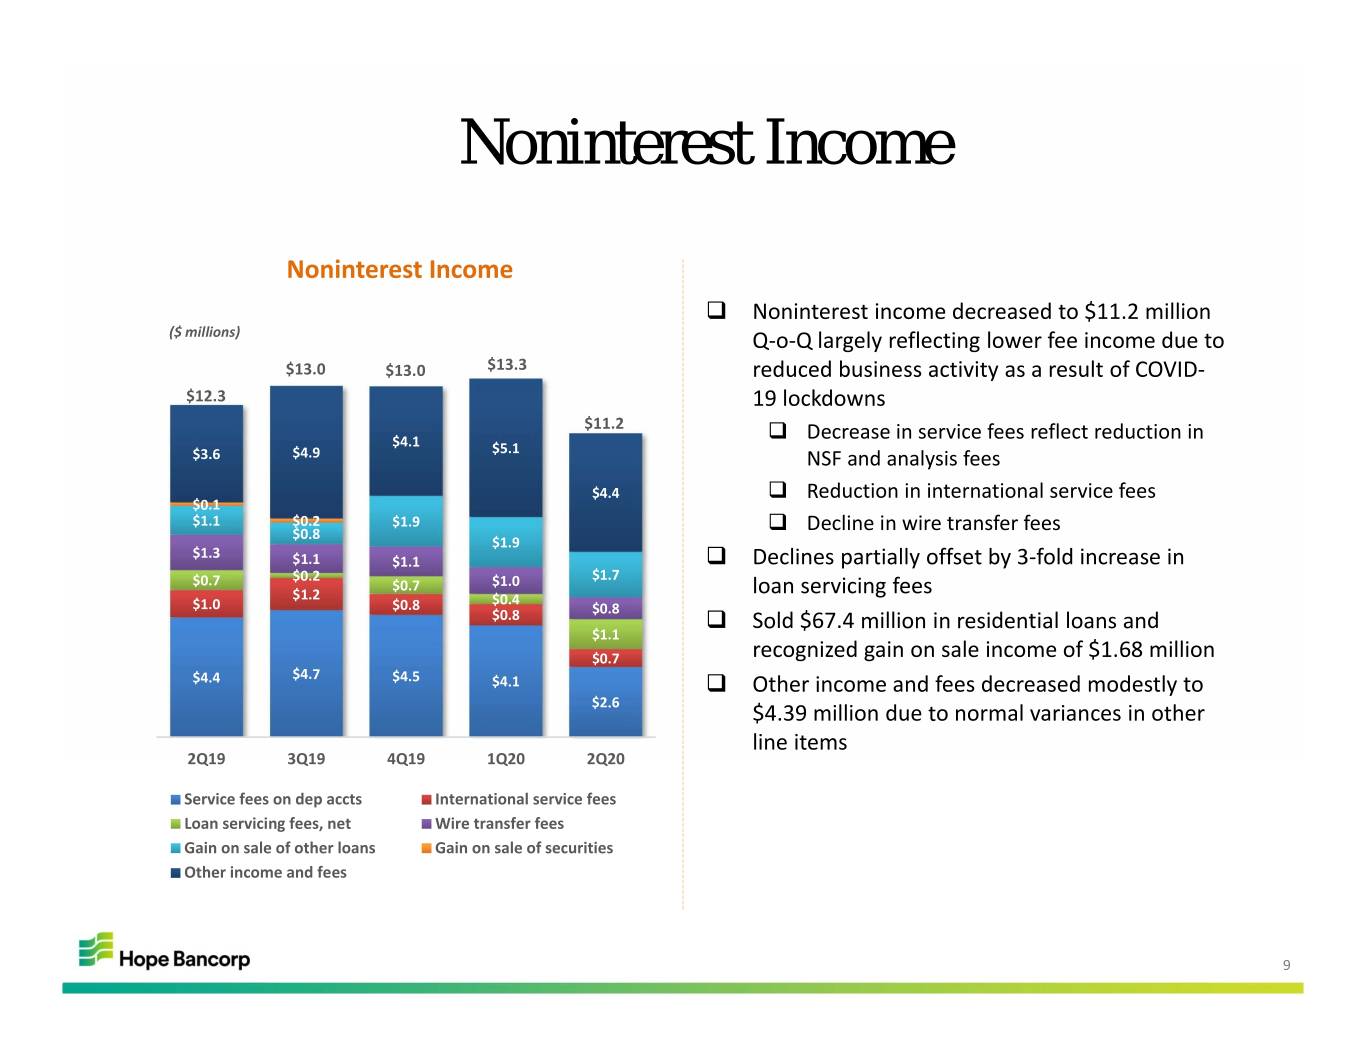
Noninterest Income Noninterest Income Noninterest income decreased to $11.2 million ($ millions) Q‐o‐Q largely reflecting lower fee income due to $13.0 $13.0 $13.3 reduced business activity as a result of COVID‐ $12.3 19 lockdowns $11.2 $4.1 Decrease in service fees reflect reduction in $3.6 $4.9 $5.1 NSF and analysis fees $4.4 Reduction in international service fees $0.1 $1.1 $0.2 $1.9 $0.8 Decline in wire transfer fees $1.9 $1.3 $1.1 $1.1 Declines partially offset by 3‐fold increase in $0.2 $1.7 $0.7 $0.7 $1.0 loan servicing fees $1.2 $0.4 $1.0 $0.8 $0.8 $0.8 Sold $67.4 million in residential loans and $1.1 $0.7 recognized gain on sale income of $1.68 million $4.4 $4.7 $4.5 $4.1 Other income and fees decreased modestly to $2.6 $4.39 million due to normal variances in other line items 2Q19 3Q19 4Q19 1Q20 2Q20 Service fees on dep accts International service fees Loan servicing fees, net Wire transfer fees Gain on sale of other loans Gain on sale of securities Other income and fees 9
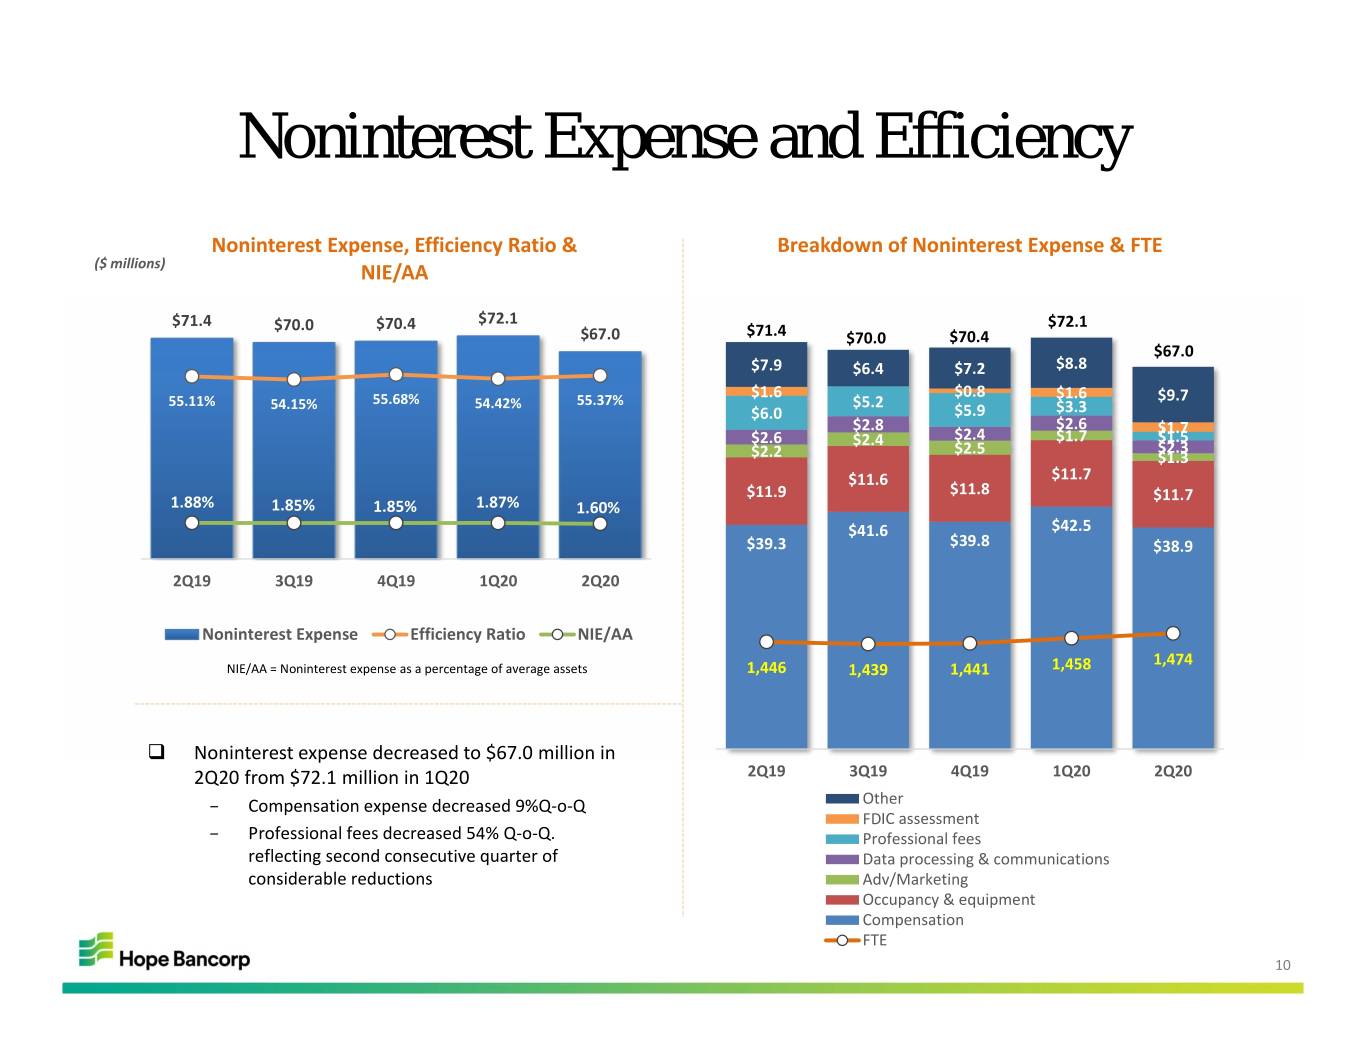
Noninterest Expense and Efficiency Noninterest Expense, Efficiency Ratio & Breakdown of Noninterest Expense & FTE ($ millions) NIE/AA $71.4 $70.0 $70.4 $72.1 $72.1 $67.0 $71.4 $70.0 $70.4 $67.0 $7.9 $6.4 $7.2 $8.8 $1.6 $0.8 $1.6 $9.7 55.11% 54.15% 55.68% 54.42% 55.37% $5.2 $6.0 $5.9 $3.3 $2.8 $2.6 $1.7 $2.6 $2.4 $1.7 $1.5 $2.4 $2.5 $2.3 $2.2 $1.3 $11.6 $11.7 $11.9 $11.8 $11.7 1.88% 1.85% 1.85% 1.87% 1.60% $41.6 $42.5 $39.3 $39.8 $38.9 2Q19 3Q19 4Q19 1Q20 2Q20 Noninterest Expense Efficiency Ratio NIE/AA 1,474 NIE/AA = Noninterest expense as a percentage of average assets 1,446 1,439 1,441 1,458 Noninterest expense decreased to $67.0 million in 2Q20 from $72.1 million in 1Q20 2Q19 3Q19 4Q19 1Q20 2Q20 – Compensation expense decreased 9%Q‐o‐Q Other FDIC assessment – Professional fees decreased 54% Q‐o‐Q. Professional fees reflecting second consecutive quarter of Data processing & communications considerable reductions Adv/Marketing Occupancy & equipment Compensation FTE 10
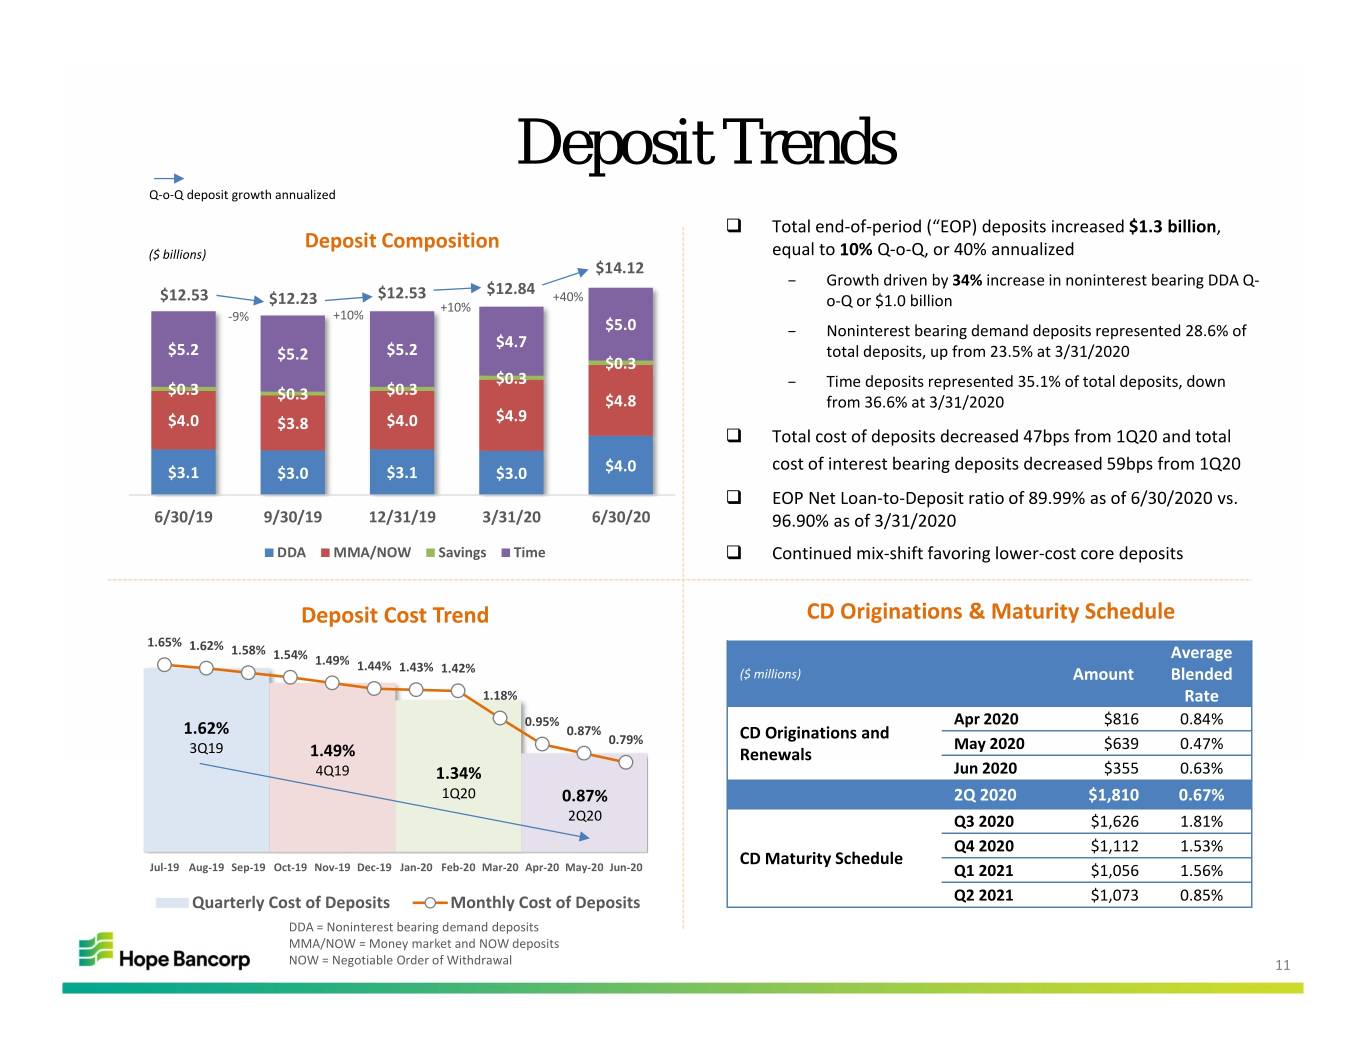
Deposit Trends Q‐o‐Q deposit growth annualized Total end‐of‐period (“EOP) deposits increased $1.3 billion, Deposit Composition ($ billions) equal to 10% Q‐o‐Q, or 40% annualized $14.12 – Growth driven by 34% increase in noninterest bearing DDA Q‐ $12.53 $12.53 $12.84 +40% $12.23 +10% o‐Q or $1.0 billion ‐9% +10% $5.0 – Noninterest bearing demand deposits represented 28.6% of $4.7 $5.2 $5.2 $5.2 total deposits, up from 23.5% at 3/31/2020 $0.3 $0.3 – $0.3 $0.3 Time deposits represented 35.1% of total deposits, down $0.3 $4.8 from 36.6% at 3/31/2020 $4.0 $3.8 $4.0 $4.9 Total cost of deposits decreased 47bps from 1Q20 and total cost of interest bearing deposits decreased 59bps from 1Q20 $3.1 $3.0 $3.1 $3.0 $4.0 EOP Net Loan‐to‐Deposit ratio of 89.99% as of 6/30/2020 vs. 6/30/19 9/30/19 12/31/19 3/31/20 6/30/20 96.90% as of 3/31/2020 DDA MMA/NOW Savings Time Continued mix‐shift favoring lower‐cost core deposits Deposit Cost Trend CD Originations & Maturity Schedule 1.65% 1.62% 1.58% 1.54% Average 1.49% 1.44% 1.43% 1.42% ($ millions) Amount Blended 1.18% Rate 0.95% Apr 2020 $816 0.84% 1.62% 0.87% CD Originations and 0.79% May 2020 $639 0.47% 3Q19 1.49% Renewals 4Q19 1.34% Jun 2020 $355 0.63% 1Q20 0.87% 2Q 2020 $1,810 0.67% 2Q20 Q3 2020 $1,626 1.81% Q4 2020 $1,112 1.53% CD Maturity Schedule Jul‐19 Aug‐19 Sep‐19 Oct‐19 Nov‐19 Dec‐19 Jan‐20 Feb‐20 Mar‐20 Apr‐20 May‐20 Jun‐20 Q1 2021 $1,056 1.56% Quarterly Cost of Deposits Monthly Cost of Deposits Q2 2021 $1,073 0.85% DDA = Noninterest bearing demand deposits MMA/NOW = Money market and NOW deposits NOW = Negotiable Order of Withdrawal 11
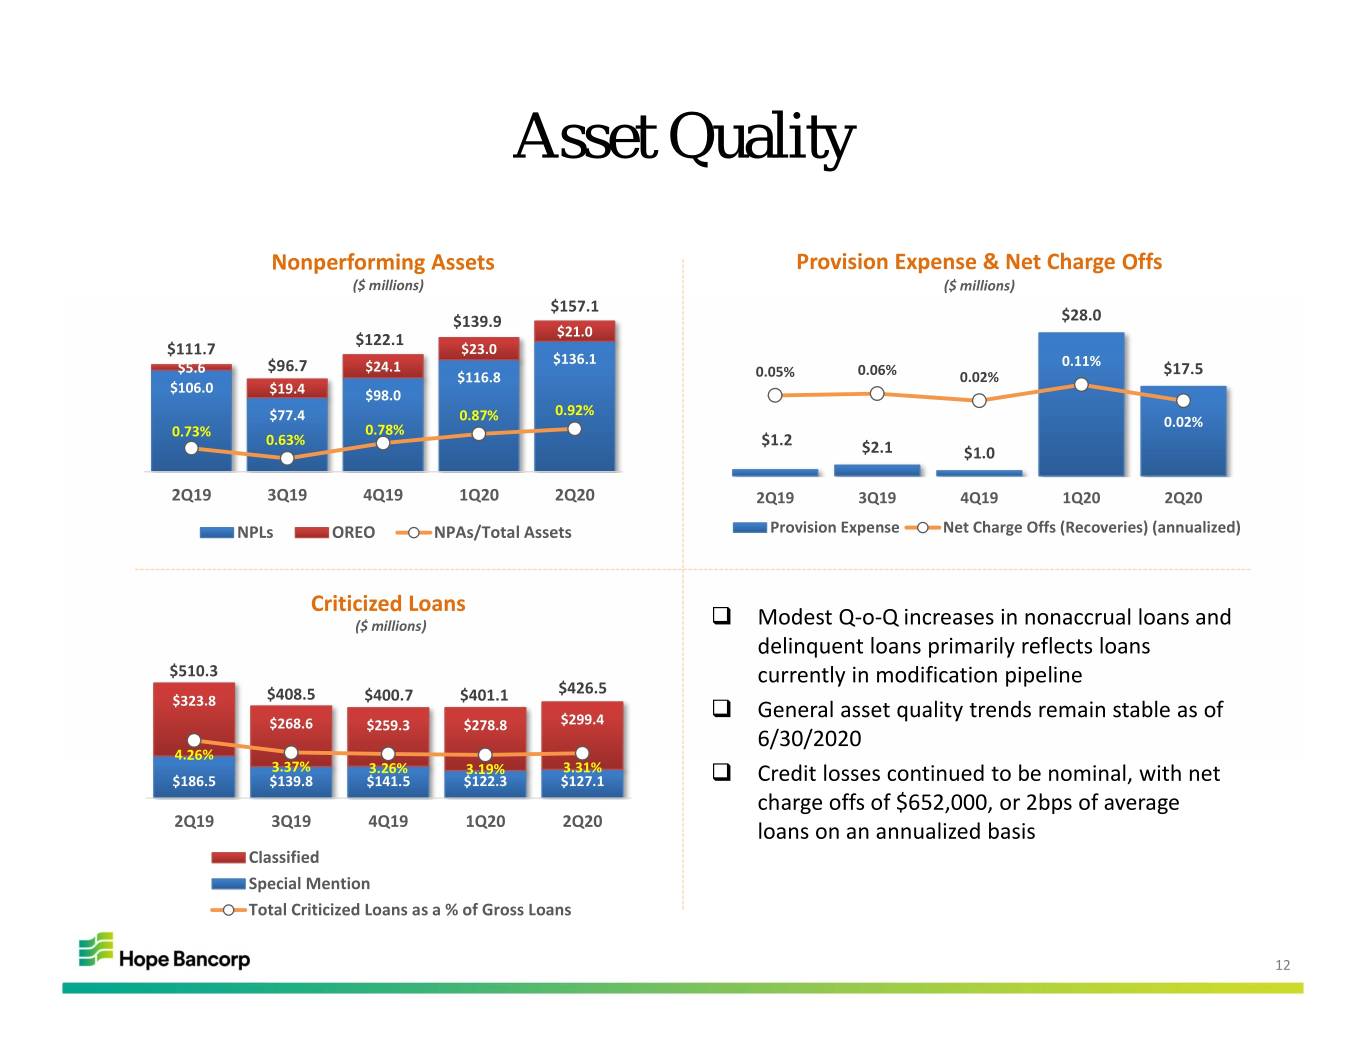
Asset Quality Nonperforming Assets Provision Expense & Net Charge Offs ($ millions) ($ millions) $157.1 $139.9 $28.0 $122.1 $21.0 $111.7 $23.0 $136.1 $5.6 $96.7 $24.1 0.11% $116.8 0.05% 0.06% 0.02% $17.5 $106.0 $19.4 $98.0 0.92% $77.4 0.87% 0.02% 0.73% 0.78% 0.63% $1.2 $2.1 $1.0 2Q19 3Q19 4Q19 1Q20 2Q20 2Q19 3Q19 4Q19 1Q20 2Q20 NPLs OREO NPAs/Total Assets Provision Expense Net Charge Offs (Recoveries) (annualized) Criticized Loans ($ millions) Modest Q‐o‐Q increases in nonaccrual loans and delinquent loans primarily reflects loans $510.3 currently in modification pipeline $408.5 $400.7 $401.1 $426.5 $323.8 General asset quality trends remain stable as of $268.6 $259.3 $278.8 $299.4 6/30/2020 4.26% 3.37% 3.26% 3.19% 3.31% $186.5 $139.8 $141.5 $122.3 $127.1 Credit losses continued to be nominal, with net charge offs of $652,000, or 2bps of average 2Q19 3Q19 4Q19 1Q20 2Q20 loans on an annualized basis Classified Special Mention Total Criticized Loans as a % of Gross Loans 12
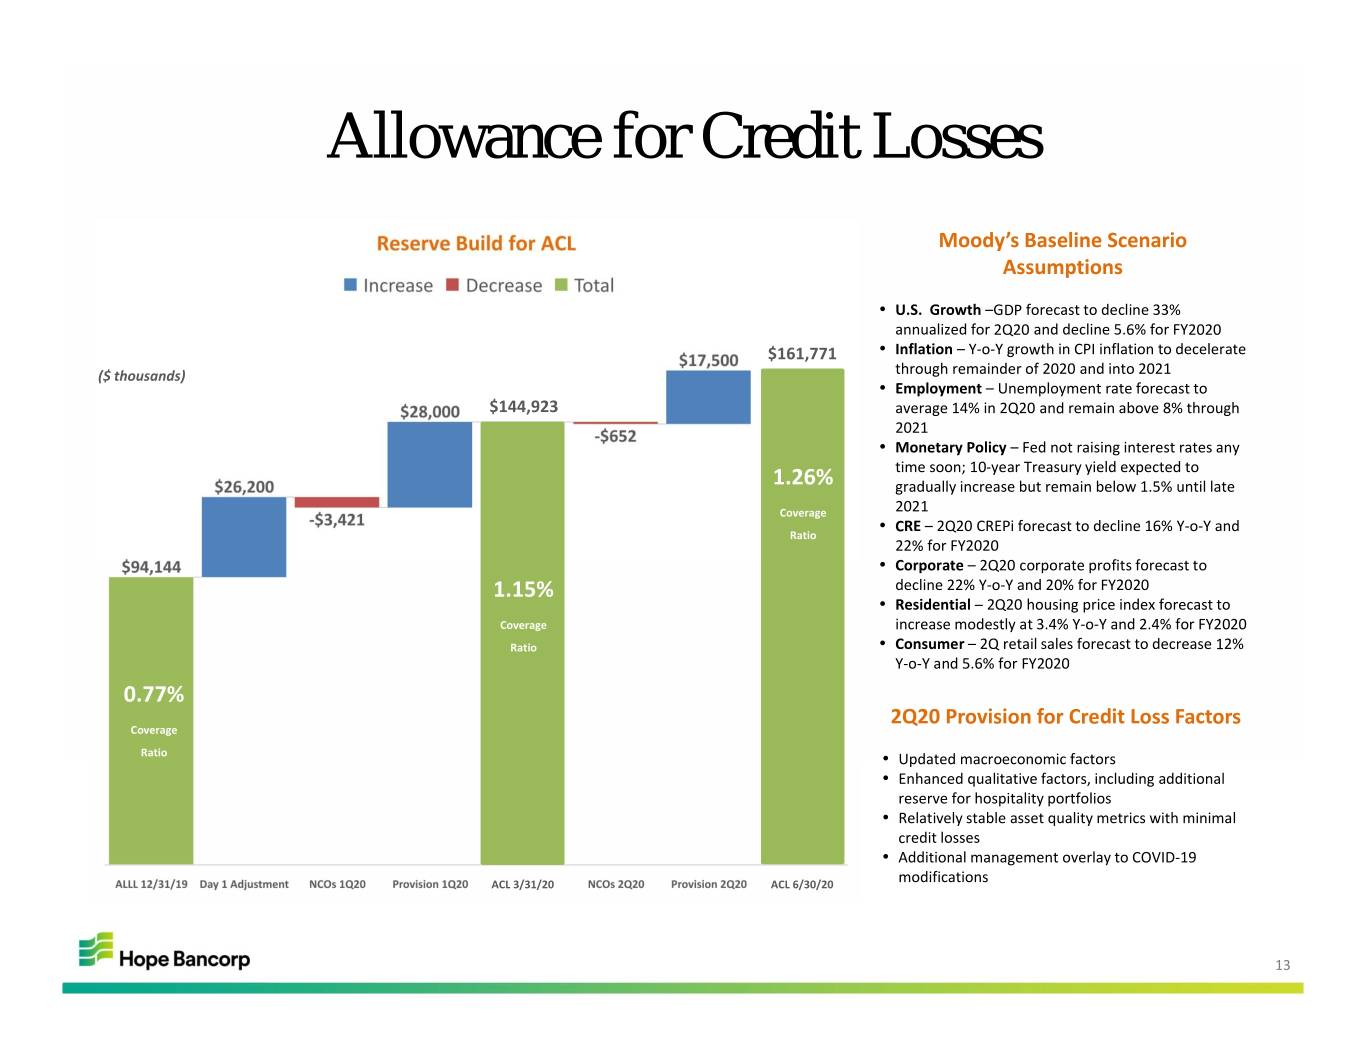
Allowance for Credit Losses Moody’s Baseline Scenario Assumptions • U.S. Growth –GDP forecast to decline 33% annualized for 2Q20 and decline 5.6% for FY2020 $161,771 • Inflation –Y‐o‐Y growth in CPI inflation to decelerate ($ thousands) through remainder of 2020 and into 2021 • Employment –Unemployment rate forecast to $144,923 average 14% in 2Q20 and remain above 8% through 2021 • Monetary Policy –Fed not raising interest rates any time soon; 10‐year Treasury yield expected to 1.26% gradually increase but remain below 1.5% until late Coverage 2021 • CRE –2Q20 CREPi forecast to decline 16% Y‐o‐Y and Ratio 22% for FY2020 • Corporate –2Q20 corporate profits forecast to 1.15% decline 22% Y‐o‐Y and 20% for FY2020 • Residential –2Q20 housing price index forecast to Coverage increase modestly at 3.4% Y‐o‐Y and 2.4% for FY2020 Ratio • Consumer –2Q retail sales forecast to decrease 12% Y‐o‐Y and 5.6% for FY2020 0.77% 2Q20 Provision for Credit Loss Factors Coverage Ratio • Updated macroeconomic factors • Enhanced qualitative factors, including additional reserve for hospitality portfolios • Relatively stable asset quality metrics with minimal credit losses • Additional management overlay to COVID‐19 ACL 3/31/20 ACL 6/30/20 modifications 13
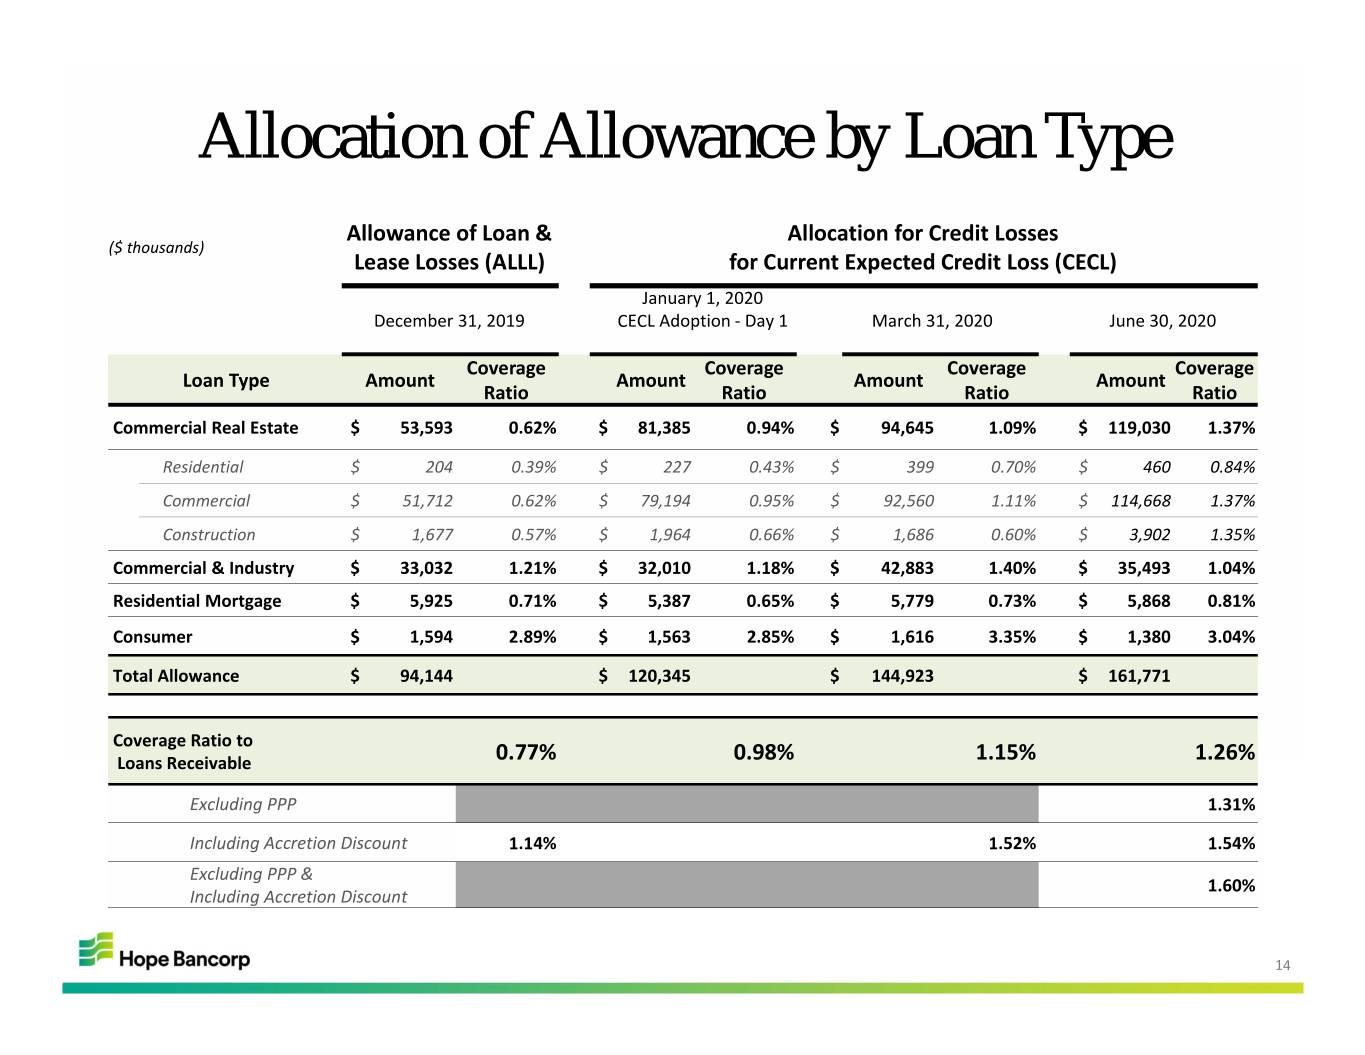
Allocation of Allowance by Loan Type Allowance of Loan & Allocation for Credit Losses ($ thousands) Lease Losses (ALLL) for Current Expected Credit Loss (CECL) January 1, 2020 December 31, 2019 CECL Adoption ‐ Day 1March 31, 2020 June 30, 2020 Coverage Coverage Coverage Coverage Loan Type Amount Amount Amount Amount Ratio Ratio Ratio Ratio Commercial Real Estate $ 53,593 0.62% $ 81,385 0.94% $ 94,645 1.09% $ 119,030 1.37% Residential $ 204 0.39% $ 227 0.43% $ 399 0.70% $ 460 0.84% Commercial $ 51,712 0.62% $ 79,194 0.95% $ 92,560 1.11% $ 114,668 1.37% Construction $ 1,677 0.57% $ 1,964 0.66% $ 1,686 0.60% $ 3,902 1.35% Commercial & Industry $ 33,032 1.21% $ 32,010 1.18% $ 42,883 1.40% $ 35,493 1.04% Residential Mortgage $ 5,925 0.71% $ 5,387 0.65% $ 5,779 0.73% $ 5,868 0.81% Consumer $ 1,594 2.89% $ 1,563 2.85% $ 1,616 3.35% $ 1,380 3.04% Total Allowance $ 94,144 $ 120,345 $ 144,923 $ 161,771 Coverage Ratio to Loans Receivable 0.77% 0.98% 1.15% 1.26% Excluding PPP 1.31% Including Accretion Discount 1.14% 1.52% 1.54% Excluding PPP & 1.60% Including Accretion Discount 14
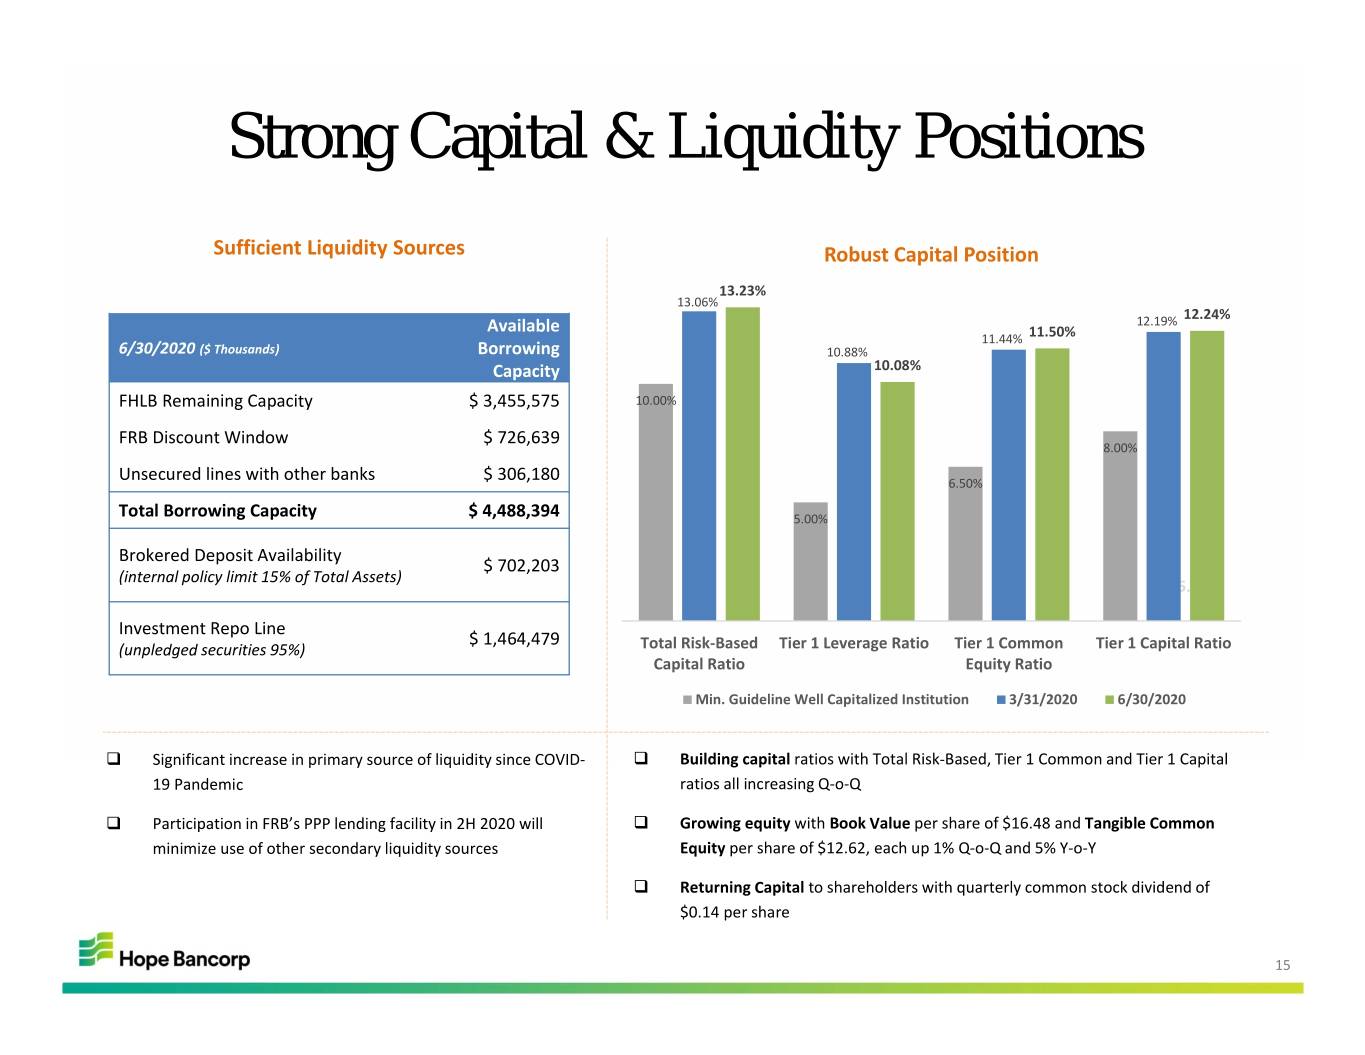
Strong Capital & Liquidity Positions Sufficient Liquidity Sources Robust Capital Position 13.23% 13.06% 12.24% Available 12.19% 11.44% 11.50% 6/30/2020 ($ Thousands) Borrowing 10.88% Capacity 10.08% FHLB Remaining Capacity $ 3,455,575 10.00% FRB Discount Window $ 726,639 8.00% Unsecured lines with other banks $ 306,180 6.50% Total Borrowing Capacity $ 4,488,394 5.00% Brokered Deposit Availability $ 702,203 (internal policy limit 15% of Total Assets) 5.00% Investment Repo Line $ 1,464,479 (unpledged securities 95%) Total Risk‐Based Tier 1 Leverage Ratio Tier 1 Common Tier 1 Capital Ratio Capital Ratio Equity Ratio Min. Guideline Well Capitalized Institution 3/31/2020 6/30/2020 Significant increase in primary source of liquidity since COVID‐ Building capital ratios with Total Risk‐Based, Tier 1 Common and Tier 1 Capital 19 Pandemic ratios all increasing Q‐o‐Q Participation in FRB’s PPP lending facility in 2H 2020 will Growing equity with Book Value per share of $16.48 and Tangible Common minimize use of other secondary liquidity sources Equity per share of $12.62, each up 1% Q‐o‐Q and 5% Y‐o‐Y Returning Capital to shareholders with quarterly common stock dividend of $0.14 per share 15
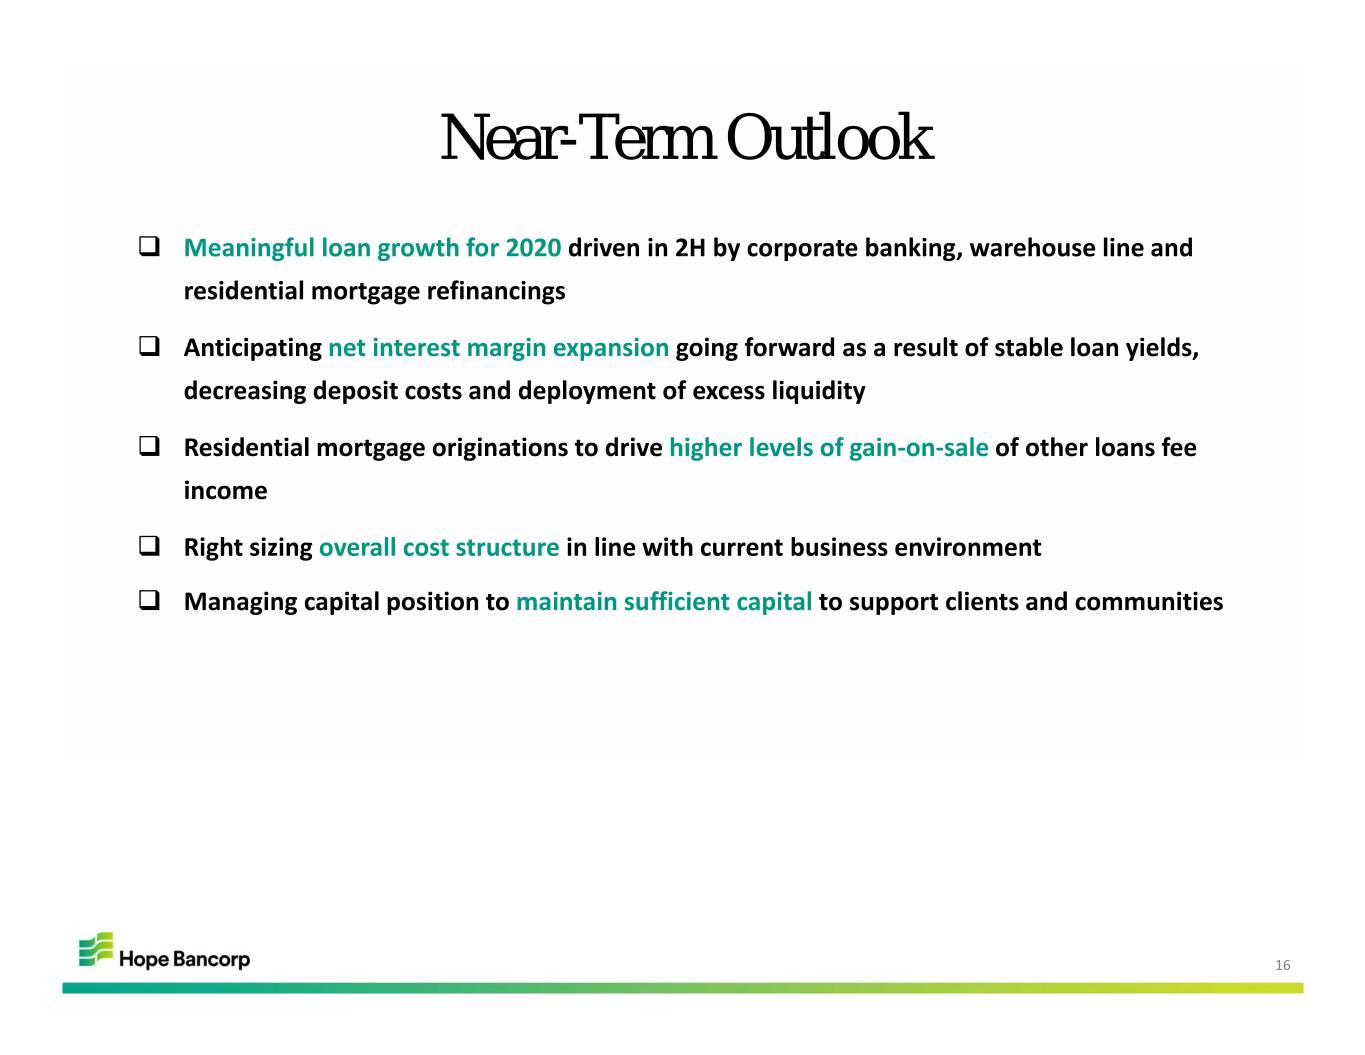
Near-Term Outlook Meaningful loan growth for 2020 driven in 2H by corporate banking, warehouse line and residential mortgage refinancings Anticipating net interest margin expansion going forward as a result of stable loan yields, decreasing deposit costs and deployment of excess liquidity Residential mortgage originations to drive higher levels of gain‐on‐sale of other loans fee income Right sizing overall cost structure in line with current business environment Managing capital position to maintain sufficient capital to support clients and communities 16

17

2020 Second Quarter Earnings Conference Call Q&A 18
