Attached files
Table of Contents
UNITED STATES
SECURITIES AND EXCHANGE COMMISSION
WASHINGTON, D.C. 20549
FORM 10-K
| x | ANNUAL REPORT PURSUANT TO SECTION 13 OR 15(d) OF THE SECURITIES EXCHANGE ACT OF 1934 |
For the fiscal year ended December 31, 2010
or
| ¨ | TRANSITION REPORT PURSUANT TO SECTION 13 OR 15(d) OF THE SECURITIES EXCHANGE ACT OF 1934 |
For the transition period from to
Commission File # 000-50245
NARA BANCORP, INC.
(Exact name of Registrant as specified in its charter)
| Delaware | 95-4849715 | |
| (State or other jurisdiction of incorporation or organization) |
(I.R.S. Employer identification Number) |
3731 Wilshire Boulevard
Suite 1000
Los Angeles, California 90010
(Address of principal executive offices) (Zip Code)
Registrant’s telephone number, including area code: (213) 639-1700
Securities registered pursuant to Section 12(b) of the Act
| Title of Class |
Name of Exchange on Which Registered | |
| Common Stock, par value $0.001 per share | The NASDAQ Stock Market, LLC |
Securities registered pursuant to Section 12(g) of the Act: None
Indicate by check mark if the registrant is a well-known seasoned issuer, as defined in Rule 405 of the Securities Act. Yes ¨ No x
Indicate by check mark if the registrant is not required to file reports pursuant to Section 13 or Section 15(d) of the Act. Yes ¨ No x
Indicate by check mark whether the Registrant (1) has filed all reports required to be filed by Section 13 or 15(d) of the Securities Exchange Act of 1934 during the preceding 12 months (or for such shorter period that the Registrant was required to file such reports), and (2) has been subject to such filing requirements for the past 90 days. Yes x No ¨
Indicate by check mark whether the registrant has submitted electronically and posted on its corporate Web site, if any, every Interactive Data File required to be submitted and posted pursuant to Rule 405 of Regulation S-T (§232.405 of this chapter) during the preceding 12 months (or for such shorter period that the registrant was required to submit and post such files). ¨ Yes ¨ No
Indicate by check mark if disclosure of delinquent filers pursuant to Item 405 of Regulation S-K is not contained herein, and will not be contained, to the best of Registrant’s knowledge, in definitive proxy or information statements incorporated by reference in Part III of this Form 10-K or any amendment to this Form 10-K x
Indicate by check mark whether the registrant is a large accelerated filer, an accelerated filer, a non-accelerated filer or a smaller reporting company. See definitions of “accelerated filer,” “large accelerated filer” and “smaller reporting company” in Rule 12b-2 of the Exchange Act. (Check one):
Large accelerated filer ¨ Accelerated filer x Non-accelerated filer ¨ Smaller Reporting Company ¨
Indicate by check mark whether the registrant is a shell company (as defined in Rule 12b-2 of the Act). Yes ¨ No x
The aggregate market value of the Common Stock held by non-affiliates of the Registrant based upon the closing sale price of the Common Stock as of the last business day of the Registrant’s most recently completed second fiscal quarter, June 30, 2010, as reported on the NASDAQ Global Select Market, was approximately $319,974,000.
Number of shares outstanding of the Registrant’s Common Stock as of January 31, 2011: 37,983,027
Documents Incorporated by Reference: Definitive Proxy Statement for the 2011 Annual Meeting of Shareholders – Part III
Table of Contents
| Page | ||||||
| PART I | ||||||
| 3 | ||||||
| Item 1. | 3 | |||||
| 3 | ||||||
| 4 | ||||||
| 4 | ||||||
| 6 | ||||||
| 6 | ||||||
| 7 | ||||||
| 7 | ||||||
| 7 | ||||||
| 9 | ||||||
| 10 | ||||||
| 18 | ||||||
| Item 1A. | 19 | |||||
| Item 1B. | 27 | |||||
| Item 2. | 27 | |||||
| Item 3. | 28 | |||||
| Item 4. | 28 | |||||
| PART II | ||||||
| Item 5. | 29 | |||||
| Item 6. | 32 | |||||
| Item 7. | Management’s Discussion and Analysis of Financial Condition and Results of Operations |
33 | ||||
| Item 7A. | 71 | |||||
| Item 8. | 74 | |||||
| Item 9. | Changes in and Disagreements with Accountants on Accounting and Financial Disclosure |
74 | ||||
| Item 9A. | 74 | |||||
| Item 9B. | 75 | |||||
| PART III | ||||||
| Item 10. | 76 | |||||
| Item 11. | 76 | |||||
| Item 12. | Security Ownership of Certain Beneficial Owners and Management and Related Stockholder Matters |
76 | ||||
| Item 13. | Certain Relationships and Related Transactions, and Director Independence |
76 | ||||
| Item 14. | 76 | |||||
| PART IV | ||||||
| Item 15. | 77 | |||||
2
Table of Contents
Some statements in this Annual Report on Form 10-K constitute forward-looking statements within the meaning of Section 27A of the Securities Act of 1933, as amended (the “Securities Act”) and Section 21E of the Securities Exchange Act of 1934, as amended (the “Exchange Act”). These forward-looking statements relate to, among other things, expectations regarding the business environment in which we operate, projections of future performance, perceived opportunities in the market and statements regarding our business strategies, objectives and vision. Forward-looking statements include, but are not limited to, statements preceded by, followed by or that include the word “will,” “believes,” “expects,” “anticipates,” “intends,” “plans,” “estimates” or similar expressions. These statements involve risks and uncertainties. Our actual results, performance or achievements may differ significantly from the results, performance or achievements expressed or implied in such forward-looking statements. For a more detailed discussion of factors that might cause such a difference, see Item 1A, “Risk Factors”. Nara Bancorp does not undertake, and specifically disclaims any obligation, to update any forward looking statements to reflect the occurrence of events or circumstances after the date of such statements except as required by law.
| Item 1. | BUSINESS |
Nara Bancorp, Inc. (“Nara Bancorp” on a parent-only basis, and the “Company,” “we” or “our” on a consolidated basis) is a bank holding company headquartered in Los Angeles, California. We offer commercial banking loan and deposit products through our wholly owned subsidiary, Nara Bank, a California state-chartered bank (the “Bank” or “Nara Bank”). Nara Bank primarily focuses its business in Korean communities in California, in the New York City metropolitan area, and New Jersey. Our headquarters are located at 3731 Wilshire Boulevard, Suite 1000, Los Angeles, California 90010, and our telephone number at that address is (213) 639-1700.
Nara Bancorp is registered as a bank holding company and is regulated in that capacity by the Board of Governors of the Federal Reserve System (the “Federal Reserve Board” or “FRB”). Nara Bancorp was organized for the purpose of becoming the holding company for Nara Bank through a corporate reorganization that was completed in January 2005. Nara Bank’s deposits are insured by the Federal Deposit Insurance Corporation (“FDIC”), up to applicable limits, and Nara Bank is a member of the Federal Reserve System.
Nara Bank opened for business in June 1989 under the name “United Citizens National Bank” as a national banking association, was renamed “Nara Bank, National Association” in January 1994 and, in January 2005, became “Nara Bank” upon converting to a California state-chartered bank in connection with its holding company reorganization transaction.
Nara Bank has supplemented its internal growth through strategic acquisitions in its primary market areas in California, New York and New Jersey.
On December 9, 2010, Nara Bancorp entered into an Agreement and Plan of Merger (the “Merger Agreement”) under which we have agreed, subject to the satisfaction of certain terms and conditions of the Merger Agreement, to merge Center Financial Corporation (“Center Financial”) with and into Nara Bancorp in an all stock transaction, which we refer to as the “Center Merger.” We cannot assure you that the Center Merger will be consummated as scheduled, or at all. See “Pending Center Merger” for a description of the terms of the Center Merger and “Item 1.A. Risk Factors – Risks Relating to the Center Merger” for a description of risks relating to the Center Merger.
3
Table of Contents
We consider our business to have three primary segments: Banking Operations, Trade Finance Services and Small Business Administration Lending Services. Further information regarding our business segments is provided in Note 19 of Notes to Consolidated Financial Statements contained elsewhere in this report.
We file reports with the Securities and Exchange Commission (the “SEC”), which include our proxy statements, annual reports on Form 10-K, quarterly reports on Form 10-Q and current reports on Form 8-K. These reports and other information on file can be inspected and copied on official business days at the Public Reference Room of the SEC at 100 F Street, N.E., Washington D.C., 20549. The public may obtain information on the operation of the Public Reference Room by calling the SEC at 1-800-SEC-0330. The SEC maintains a website that contains the reports, proxy and information statements and other information we file with them. The address of the site is http://www.sec.gov. Our website address is http://www.narabank.com. Electronic copies of our annual reports on Form 10-K, quarterly reports on Form 10-Q and current reports on Form 8-K, and amendments to those reports, are available free of charge by visiting the Investor Relations section of our website. These reports are generally posted as soon as reasonably practicable after they are electronically filed with the SEC.
Our principal business activities are conducted through Nara Bank and consist of earning interest on loans and investment securities that are funded by customer deposits and other borrowings. Operating revenues consist of the difference between interest received, interest paid, gains and losses on the sale of financial assets and fees earned for financial services provided. Interest rates are highly sensitive to many factors that are beyond our control, such as general economic conditions, new legislation affecting the banking industry, and the policies of various governmental and regulatory authorities, in particular those of the Federal Reserve Board. Although our business may vary with local and national economic conditions, such variations are not seasonal in nature.
Through our network of 23 branches and one loan production office, we offer commercial banking loan and deposit products to our customers, who typically are small- to medium-sized businesses and individuals in our market areas. We accept deposits and originate a variety of loans, including commercial business loans, commercial real estate loans, trade finance loans, and Small Business Administration (“SBA”) loans. Nara Bank offers cash management services to our business customers. To better meet our customers’ needs, our mini-market branches generally offer extended hours from 9 a.m. to 6 p.m. Each of our branches operates 24-hour automated teller machines (“ATMs”). We also provide debit card services to all customers and courier services to qualifying customers. Personal banking officers focus on customers to better support their banking needs. In addition, most of our branches offer travelers’ checks, safe deposit boxes, notary services and other customary bank services. We also offer 24-hour banking by telephone. Our website at www.narabank.com offers internet banking services and applications in both English and Korean.
Commercial Business Loans
We provide commercial loans to businesses for various purposes such as for working capital, purchasing inventory, debt refinancing, business acquisitions and other business related financing needs. Commercial loans are typically classified as (1) short-term loans (or lines of credit) or (2) long-term loans (or term loans to businesses). Short term loans are often used to finance current assets such as inventory and accounts receivable and typically have terms of one year with interest paid monthly on the outstanding balance and the principal balance due at maturity. Long term loans typically have terms of 5 to 7 years with principal and interest paid monthly. The credit worthiness of our borrowers is determined before a loan is originated and is periodically reviewed to ascertain whether credit quality changes have occurred. Commercial business loans are typically collateralized by the borrower’s business assets and/or real estate.
4
Table of Contents
Our commercial business loan portfolio includes trade finance loans from Nara Bank’s Corporate Banking Center, which generally serves businesses involved in international trade activities. These loans are typically collateralized by business assets and are used to meet the short-term working capital needs (accounts receivable and inventory financing) of our borrowers. The Corporate Banking Center also issues and advises on letters of credit for export and import businesses. The underwriting procedure for this type of credit is the same as for commercial business loans. We offer the following types of letters of credit to customers:
| • | Commercial: An undertaking by the issuing bank to pay for a commercial transaction. |
| • | Standby: An undertaking by the issuing bank to pay for the non-performance of the applicant customer. |
| • | Revocable: Letter of credit that can be modified or cancelled by the issuing bank at any time with notice to the beneficiary (does not provide the beneficiary with a firm promise of payment). |
| • | Irrevocable: Letter of credit that cannot be altered or cancelled without mutual consent of all parties. |
| • | Sight: Letter of credit requiring payment upon presentation of conforming shipping documents. |
| • | Usance: Letter of credit which allows the buyer to delay payment up to a designated number of days after presentation of shipping documents. |
| • | Import: Letter of credit issued to assist customers in purchasing goods from overseas. |
| • | Export: Letter of credit issued to assist customers selling goods from overseas. |
| • | Transferable: Letter of credit which allows the beneficiary to transfer its drawing (payment) rights, in part of full, to another party. |
| • | Non-transferable: Letter of credit which does not allow the beneficiary to transfer their right, in part of full, to another. |
Our trade finance services include the issuance and negotiation of letters of credit, as well as the handling of documentary collections. On the export side, we provide advice and negotiation of commercial letters of credit, and we transfer and issue back-to-back letters of credit. We also provide importers with trade finance lines of credit, which allow for the issuance of commercial letters of credit and the financing of documents received under such letters of credit, as well as documents received under documentary collections. Exporters are assisted through export lines of credit as well as through immediate financing of clean documents presented under export letters of credit.
Commercial Real Estate Loans
Real estate loans are extended for the purchase and refinance of commercial real estate and are generally secured by first deeds of trust. The maturities on such loans are generally restricted to seven years with a 25-year principal amortization schedule and a balloon payment due at maturity. We offer both fixed and floating rate commercial real estate loans. It is our general policy to restrict commercial real estate loan amounts to 70% of the appraised value of the property at the date of origination.
Small Business Administration Loans
The Bank also extends loans partially secured by the SBA. The Bank extends SBA loans known as SBA 7(a) loans and SBA 504 loans. SBA 7(a) loans are typically extended for working capital needs, purchase of inventory, purchase of machinery and equipment, debt refinance, business acquisitions, start-up financing, or to purchase or construct owner-occupied commercial property. SBA 7(a) loans are typically term loans with maturities up to 10 years for loans not secured by real estate and up to 25 years for real estate secured loans. SBA loans are fully amortizing with monthly payments of principal and interest. SBA loans are typically floating rate loans that are secured by business assets and/or real estate. Depending on the loan amount, each loan is typically
5
Table of Contents
guaranteed 75% to 85% by the SBA, with a maximum gross loan amount to any one small business borrower of $5.0 million, and a maximum SBA guaranteed amount of $3.75 million.
The SBA 7(a) loans we generate represent an important segment of our non-interest income due to our ability to sell the guaranteed portion in the secondary market at a premium, while earning servicing fee income on the sold portion over the remaining life of the loan. Therefore, in addition to the interest yield earned on the un-guaranteed portion of the SBA 7(a) loans that are not sold, we recognize income from gains on sales and from loan servicing on the SBA 7(a) loans that are sold.
SBA 504 loans are typically extended for the purpose of purchasing owner-occupied commercial real estate or long-term capital equipment. SBA 504 loans are typically extended for up to 20 years or the life of the asset being financed. SBA 504 loans are financed as a participation loan between the Bank and the SBA through a Certified Development Company (“CDC”). Generally, the loans are structured so as to give the Bank a 50% first deed of trust (“TD”), the CDC a 40% second TD, and the remaining 10% is funded by the borrower. Rates for the first TD Bank loans are subject to normal bank commercial rates, and the second TD CDC loans are fixed for the life of the loans based on certain indices.
All of our SBA loans are originated through Nara Bank’s SBA Loan Department. The SBA Loan Department is staffed by loan officers who provide assistance to qualified businesses. The Bank has been designated as an SBA Preferred Lender, which is the highest designation awarded by the SBA. This designation generally facilitates a more efficient marketing and approval process for SBA loans. We have attained SBA Preferred Lender status nationwide.
Consumer Loans
Our consumer loans consist of home equity and signature loans, with a majority of our consumer loan portfolio currently consisting of signature loans. Effective February 28, 2007, we discontinued originating auto loans and effective January 1, 2008, we discontinued originating new home equity loans, due to the lack of scalability and profitability of these types of loans. The consumer loans totaled $11.3 million at December 31, 2010, compared to $16.9 million at December 31, 2009.
The main objectives of our investment strategy are to provide a source of on-balance sheet liquidity while providing a means to manage our interest rate risk, and to generate an adequate level of interest income without taking undue risks. Subject to various restrictions, our investment policy permits investment in various types of securities, certificates of deposit (“CD”s) and federal funds sold. Our investment portfolio consists of government sponsored agency bonds, mortgage backed securities, collateralized mortgage obligations (“CMOs”), corporate bonds, municipal bonds, and mutual funds. For a detailed breakdown of our investment portfolio, see Item 7 “Management’s Discussion and Analysis of Financial Condition and Results of Operations – Financial Condition – Investment Security Portfolio.”
Our securities are classified for accounting purposes as available-for-sale. We do not maintain a held-to-maturity or trading portfolio. Securities purchased to meet investment-related objectives such as liquidity management or interest rate risk and which may be sold as necessary to implement management strategies, are designated as available-for-sale at the time of purchase. At December 31, 2010, we had $528.3 million in securities available-for-sale. We purchased $190.6 million, and sold $201.8 million in investment securities during 2010.
We attract both short-term and long-term deposits from the general public by offering a wide range of deposit products and services. Through our branch network, we provide our banking customers with personal and
6
Table of Contents
business checking accounts, money market accounts, savings, certificates of deposit, individual retirement accounts, 24-hour ATMs, internet banking and bill-pay services.
FDIC-insured deposits are our primary source of funds. As part of our asset-liability management, we analyze our retail deposits’ maturities and interest rates to monitor and manage the cost of retail funds, to the extent feasible in the context of changing market conditions, as well as to promote stability in our supply of funds. For more deposit information, see Item 7 “Management’s Discussion and Analysis of Financial Condition and Results of Operations – Financial Condition – Deposits.”
When we have more funds than required for our reserve requirements or short-term liquidity needs, we sell federal funds to other financial institutions. Conversely, when we have less funds than required, we may borrow funds from the Federal Home Loan Bank of San Francisco (“FHLB”), the Federal Reserve Bank of San Francisco or our correspondent banks. In addition, we may borrow from the FHLB on a longer term basis to provide funding for certain loan or investment securities strategies, as well as asset-liability management strategies.
The FHLB functions in a reserve credit capacity for qualifying financial institutions. As a member, we are required to own capital stock in the FHLB and may apply for advances from the FHLB utilizing qualifying mortgage loans and certain securities as collateral. The FHLB offers a full range of borrowing programs on its advances with terms ranging from one day to thirty years at competitive market rates. A prepayment penalty is usually imposed for early repayment of these advances. Information concerning FHLB borrowings is included in Note 7 of “Notes to Consolidated Financial Statements”
As a member of the Federal Reserve Bank system, we may also borrow from the Federal Reserve Bank of San Francisco. The maximum amount that we may borrow from the Federal Reserve Bank’s discount window is 96% of the fair value of the securities that we pledge and up to 63% of the outstanding principal balance of the qualifying loans that we pledge. At December 31, 2010, the outstanding principal balance of qualifying loans was $394.5 million and no borrowing were outstanding against this line.
We have 23 banking offices in areas having high concentrations of Korean Americans, of which 16 are located in the Los Angeles, Orange County, Oakland and Silicon Valley (Santa Clara County) areas of California, and 7 are located in the New York metropolitan area and New Jersey. We also have one loan production office located in Dallas. The banking and financial services industry generally, and in our market areas specifically, are highly competitive. The increasingly competitive environment is a result primarily of strong competition among the banks servicing the Korean-American community, changes in regulation, changes in technology and product delivery systems, and the consolidation among financial services companies. In addition, federal legislation may have the effect of further increasing the pace of consolidation within the financial services industry. See “Supervision and Regulation”.
We compete for loans, deposits, and customers with other commercial banks, savings and loan associations, securities and brokerage companies, mortgage companies, insurance companies, finance companies, money market funds, credit unions, and other non-bank financial service providers. Many of these competitors are much larger in total assets and capitalization, have greater access to capital markets, are more widely recognized, have broader geographic scope, and offer a broader range of financial services than we do.
On December 9, 2010, we entered into a definitive agreement to merge Center Financial in an all stock transaction valued at $285.7 million, or approximately $7.16 per Center Financial share based on the closing
7
Table of Contents
price on December 8, 2010, which is the day prior to public announcement of the transaction. As of February 17, 2011, the transaction was valued at $314.1 million, or approximately $7.87 per Center Financial share. The boards of directors of both companies each unanimously approved the Center Merger. While there can be no assurance as to the timing, or that the Center Merger will be completed at all, we are working to complete the Center Merger in the second half of 2011. The consummation of the Center Merger is subject to regulatory approval, the approval of the shareholders of both Nara Bancorp and Center Financial, and other closing conditions. Additional important information concerning this transaction and related matters will be contained in a joint proxy statement/prospectus that will be mailed to all of our stockholders, and to the shareholders of Center Financial, in connection with the stockholders meetings of the two companies at which stockholder approval of the merger will be requested. The proxy statement will also be available free of charge on our website, and the Registration Statement on Form S-4 that we will file with the SEC in connection with the merger, of which the proxy statement will be a part, will be available on the SEC’s website at www.sec.gov. Concurrently with or as soon as reasonably practicable after the consummation of the Center Merger, Nara Bank and Center Bank will be merged as well.
Center Financial Corporation is the holding company of Center Bank, a community bank offering a full range of financial services for diverse ethnic and small business customers. Founded in 1986 and specializing in commercial and SBA loans and trade finance products, Center Bank has grown to be one of the nation’s leading financial institutions focusing on the Korean-American community, with total assets of $2.27 billion at December 31, 2010. If the Center Merger had been completed at that date, the combined company would be the largest Korean American banking company in the United States. Headquartered in Los Angeles, Center Bank operates a total of 22 full-service branches and two loan production office. It has 16 full-service branches located in Southern California and three branches in Northern California. Center Bank also operates two branches and one loan production office in the Seattle area, one branch in Chicago and a loan production office in Denver. Center Bank is a California state-chartered institution and its deposits are insured by the FDIC.
Upon consummation of the Center Merger, each share of common stock of Center Financial issued and outstanding immediately prior to the effective time of the Center Merger (the “Effective Time”) will be converted into and become exchangeable for 0.7804 of a share of common stock of Nara Bancorp, subject to the payment of cash in lieu of the issuance of fractional shares. Based on the number of shares Center Financial common stock outstanding on the date of the Merger Agreement, this will result in approximately 31.1 million Nara Bancorp shares being exchanged for approximately 39.9 million outstanding Center Financial shares, subject to adjustment in certain limited circumstances. Nara Bancorp stockholders will own 55% of the combined company and Center Financial stockholders will own 45%.
The combined entity will be led by executive management and board members from both companies. Alvin Kang, President and Chief Executive Officer of Nara Bancorp, will be Chief Executive Officer of the combined company. Ki Suh Park, Nara Bancorp’s current Chairman of the Board of Directors, will serve as Chairman of the Board of the combined bank holding company, and Chang Hwi Kim, Center Financial’s Compensation Committee Chair, will serve as Vice Chairman of the Board of the combined bank holding company. For the bank level Board of Directors, Kevin S. Kim, Center Financial’s Audit Committee Chair, will serve as Chairman, and Scott Yoon-suk Whang, Nara Bancorp’s Compensation Committee Chair, will serve as Vice Chairman. The Board of Directors of each of the combined company and bank will have equal representation, consisting of seven directors from each of Nara Bancorp and Center Financial, who include Korean-American business entrepreneurs and community leaders, banking industry and business professionals.
Nara and Center Financial are currently considering the name under which the combined company will operate. A Consolidation Committee consisting of two representatives from the pre-merger board of directors of each company will oversee the integration process. Director Chang Hwi Kim of Center Financial will serve as Chairman of the Consolidation Committee.
The Merger Agreement contains representations and warranties customary for transactions of this type. In addition, each party has agreed to various customary covenants and agreements, including, among others, (i) to
8
Table of Contents
conduct its business in the ordinary course consistent with past practice during the interim period between the execution of the Merger Agreement and consummation of the Merger, (ii) not to engage in certain kinds of transactions during this period, (iii) to convene and hold a meeting of its stockholders to consider and vote upon the Merger, notwithstanding any acquisition proposal or intervening material event arising after signing, (iv) to recommend approval of the Merger to its stockholders and, subject to certain exceptions, not make any changes to such recommendation, (v) not solicit, initiate, or knowingly encourage any alternative proposal to acquire Center Financial or Nara Bancorp; and (vi) subject to certain exceptions, not to provide any non-public information in connection with any such proposal, or engage in any discussions or negotiations regarding or any such proposal.
The representations and warranties of each party set forth in the Merger Agreement (a) have been qualified by confidential disclosures made to the other party in connection with the Merger Agreement, (b) will not survive consummation of the Center Merger and cannot be the basis for any claims under the Merger Agreement by the other party after the Center Merger is consummated, (c) are qualified in certain circumstances by a materiality standard which may differ from what may be viewed as material by investors, (d) were made only as of the date of the Merger Agreement or such other date as is specified in the Merger Agreement and (e) may have been included in the Merger Agreement for the purpose of allocating risk between Center Financial and Nara Bancorp rather than establishing matters as facts.
The Merger Agreement also contains certain termination rights for Center Financial and Nara Bancorp and provides that, in connection with the termination of the Merger Agreement under specified circumstances, Center Financial or Nara may be required to pay the other a termination fee of $10 million or $2.5 million depending on the circumstances. The termination fee is only payable on some types of termination and the amount of the fee for those types of termination will further depend on certain additional facts.
We cannot assure you that the Center Merger will be consummated as scheduled, or at all. See “Item 1.A. Risk Factors – Risks Relating to the Center Merger” for a description of risks relating to the Center Merger.
Economic Conditions, Government Policies and Legislation
Our profitability, like that of most financial institutions, depends, among other things, on interest rate differentials. In general, the difference between the interest expense on interest-bearing liabilities, such as deposits and borrowings, and the interest income on our interest-earning assets, such as loans we extend to our customers and securities held in our investment portfolio, as well as the level of non-interest bearing deposits, have a significant impact on our profitability. Interest rates are highly sensitive to many factors that are beyond our control, such as the economy, inflation, unemployment, consumer spending and political events. The impact that future changes in domestic and foreign economic and political conditions might have on our performance cannot be predicted.
Our business is also influenced by the monetary and fiscal policies of the federal government and the policies of regulatory agencies, particularly the FRB. The FRB implements national monetary policies (with objectives such as curbing inflation or preventing recession) through its open-market operations in U.S. government securities, by adjusting the required level of reserves for depository institutions subject to its reserve requirements, and by varying the targeted federal funds and discount rates applicable to borrowings by depository institutions. The actions of the FRB in these areas influence the growth of bank loans, investments, and deposits and also affect interest rates earned on interest-earning assets and paid on interest-bearing liabilities. The nature and impact on Nara Bancorp and the Bank of future changes in monetary and fiscal policies cannot be predicted.
From time to time, legislation and regulations are enacted or adopted which have the effect of increasing the cost of doing business, limiting or expanding permissible activities, or affecting the competitive balance between banks and other financial services providers. Proposals to change the laws and regulations governing the
9
Table of Contents
operations and taxation of banks, bank holding companies, and other financial institutions and financial services providers are frequently made in the U.S. Congress, in the state legislatures, and before various regulatory agencies. These proposals may result in changes in banking statutes and regulations and our operating environment in substantial and unpredictable ways. If enacted, such legislation could increase or decrease the cost of doing business, limit or expand permissible activities or affect the competitive balance among banks, savings associations, credit unions, and other financial institutions. We cannot predict whether any of this potential legislation will be enacted, and if enacted, the effect that it, or any implementing regulations, would have on our financial condition or results of operations. See “Supervision and Regulation.”
General
Nara Bank is a California state chartered bank that is subject to regulation and examination by the California Department of Financial Institutions (the “DFI”) and by the FRB as a member bank of the Federal Reserve System. Customer deposits are insured up to statutory limits by the FDIC and Nara Bank is therefore also subject to regulations of the FDIC. The Bank is subject to supervision and regulation of its business activities, including, among others, capital standards, general investment authority, deposit taking and borrowing authority, mergers, establishment of branch offices, and permitted subsidiary investments and activities. Nara Bancorp is registered with and subject to examination by the FRB as a bank holding company and is also subject to the bank holding company provisions of the California Financial Code, including being subject to examination by the DFI. These regulatory systems are intended primarily for the protection of depositors, the FDIC insurance fund and the banking system as a whole, rather than for the protection of shareholders or other investors.
The following paragraphs summarize certain of the laws and regulations that apply to us and to the Bank. These descriptions of statutes and regulations and their possible effects do not purport to be complete descriptions of all of the provisions of those statutes and regulations and their possible effects on us, nor do they purport to identify every statute and regulation that may apply to us.
Recent Developments
In response to the recent economic downturn and financial industry instability, legislative and regulatory initiatives have been, and will likely continue to be, introduced and implemented, which could substantially intensify the regulation of the financial services industry. We cannot predict whether or when potential legislation or new regulations will be enacted, and if enacted, the effect that new legislation or any implemented regulations and supervisory policies would have on our financial condition and results of operations. Moreover, especially in the current economic environment, bank regulatory agencies have been very aggressive in responding to concerns and trends identified in examinations, and this has resulted in the increased issuance of enforcement actions to financial institutions requiring action to address credit quality, liquidity and risk management and capital adequacy, as well as other safety and soundness concerns.
Through its authority under the Emergency Economic Stabilization Act of 2008 (the “EESA”), as amended by the American Recovery and Reinvestment Act of 2009 (the “ARRA”), the U.S. Treasury (“Treasury”) implemented the Capital Purchase Program under the Treasury’s Troubled Asset Relief Program (the “CPP”), a program designed to bolster eligible healthy institutions by injecting capital into these institutions. We participated in the CPP so that we could continue to lend and support our current and prospective clients, especially during this unstable economic environment. Under the terms of our participation, we received $67 million in exchange for the issuance of shares of Fixed Rate Cumulative Perpetual Preferred Stock, Series A (the “Series A Preferred Stock”) and a warrant to purchase common stock and thereby became subject to various requirements, including certain restrictions on paying dividends on our common stock and repurchasing our equity securities, unless the Treasury has consented. Additionally, in order to participate in the CPP, we were required to adopt certain standards for executive compensation and corporate governance.
10
Table of Contents
On December 29, 2009, after consultations with the DFI and FRB, the Board of Directors of Nara Bank adopted resolutions providing, among other things, that the Board submit written plans to the DFI and FRB to reduce the Bank’s credit risk profile and improve credit administration; submit a capital plan and a three year strategic plan and obtain prior DFI and FRB approval of dividends; and provide prior notice to the DFI and FRB of senior executive officer and director changes. The Board established an Oversight Committee to ensure prompt compliance with the resolutions. The Board of Directors of Nara Bancorp also adopted similar resolutions for Nara Bancorp after consultations with the FRB. The resolutions adopted by Nara Bancorp also required prior FRB approval for Nara Bancorp to issue, increase or renew any debt or issue trust preferred securities or for Nara Bancorp to make payments or other distributions in connection with its trust preferred securities. Based upon the most recent FRB examination, that in part considered financial information as of June 30, 2010, the FRB found that the Board and management fully satisfied a number of the resolutions’ requirements and maintained ongoing compliance with others. Among other actions, we strengthened our credit risk management and administration practices, developed improved capital and liquidity and funds management plans, and complied with the ongoing prior approval requirement for dividends and payments relating to trust preferred securities. As a result, the FRB and DFI requested the rescission of the original resolutions, and their replacement with a modified joint Nara Bank and Nara Bancorp resolution, adopted on December 8, 2010. The new resolution requires the submission of a Board governance and oversight plan, a liquidity and funds management plan relating to the identification and monitoring of volatile liabilities, an updated capital and strategic plan with budget, ongoing asset quality improvement reporting, and the prior approval of dividends and any interest payments relating to trust preferred securities.
Bank Holding Company Regulation
Nara Bancorp is registered as a bank holding company pursuant to the Bank Holding Company Act (“BHCA”) and that capacity is subject to supervision and examination by the FRB and its authority to:
| • | Require periodic reports and such additional information as the FRB may require; |
| • | Require bank holding companies to maintain increased levels of capital (See “Capital Requirements”); |
| • | Require that bank holding companies serve as a source of financial and managerial strength to subsidiary banks and commit resources as necessary to support each subsidiary bank; |
| • | Restrict the ability of bank holding companies to obtain dividends or other distributions from their subsidiary banks; |
| • | Terminate an activity or terminate control of or liquidate or divest certain subsidiaries, affiliates or investments if the FRB determines the activity or the control of the subsidiary or affiliate constitutes a significant risk to the financial safety, soundness or stability of any bank subsidiary; |
| • | Require the prior approval of senior executive officer or director changes; |
| • | Regulate provisions of certain bank holding company debt, including the authority to impose interest ceilings and reserve requirements on such debt and require prior approval to purchase or redeem securities in certain situations; and |
| • | Approve or disapprove acquisitions and mergers with banks and consider certain competitive, management, financial or other factors in granting these approvals in addition to similar California or other state banking agency approvals which may also be required. |
The FRB’s view is that in serving as a source of strength to its subsidiary banks, a bank holding company should stand ready to use available resources to provide adequate capital funds to its subsidiary banks during periods of financial stress or adversity and should maintain financial flexibility and capital-raising capacity to obtain additional resources for assisting its subsidiary banks. A bank holding company’s failure to meet its source-of-strength obligations may constitute an unsafe and unsound practice or a violation of the FRB’s regulations, or both. The source-of-strength doctrine most directly affects bank holding companies where a bank
11
Table of Contents
holding company’s subsidiary bank fails to maintain adequate capital levels. In such a situation, the subsidiary bank will be required by the bank’s federal regulator to take “prompt corrective action.” See “Prompt Corrective Action” below.
Subject to prior notice or FRB approval, bank holding companies may generally engage in, or acquire shares of companies engaged in, activities determined by the FRB to be so closely related to banking or managing or controlling banks as to be a proper incident thereto. Bank holding companies which elect and retain “financial holding company” status pursuant to the Gramm-Leach-Bliley Act of 1999 (“GLBA”) may engage without prior FRB approval in these nonbanking activities and broader securities, insurance, merchant banking and other activities that are determined by the FRB, in consultation with the Treasury, to be “financial in nature” or are incidental or complementary to activities that are financial in nature. In order to elect and retain financial holding company status, all depository institution subsidiaries of a bank holding company must be well capitalized, well managed, and, except in limited circumstances, be in satisfactory compliance with the Community Reinvestment Act (“CRA”), which requires banks to help meet the credit needs of the communities in which they operate. Failure to maintain compliance with these requirements or correct any non-compliance within a fixed time period could lead to divestiture of subsidiary banks or the requirement to conform require all activities those permissible for a bank holding company. Nara Bancorp has not elected financial holding company status.
Securities Exchange Act of 1934
Nara Bancorp’s common stock is publicly held and listed on NASDAQ, and Nara Bancorp is subject to the periodic reporting, information, proxy solicitation, insider trading, corporate governance and other requirements and restrictions of the Securities Exchange Act of 1934 and the regulations of the SEC promulgated hereunder and the listing requirements of NASDAQ.
Sarbanes-Oxley Act
Nara Bancorp is subject to the accounting oversight and corporate governance requirements of the Sarbanes-Oxley Act of 2002, including, among other things, required executive certification of financial presentations, increased requirements for board audit committees and their members, and enhanced disclosure of controls and procedures and internal control over financial reporting.
Dodd-Frank Act
On July 21, 2010, financial regulatory reform legislation entitled the “Dodd-Frank Wall Street Reform and Consumer Protection Act” (the “Dodd-Frank Act”) was signed into law. The Dodd-Frank Act implements extensive changes across the financial regulatory landscape, including provisions that, among other things, will:
| • | Centralize responsibility for consumer financial protection by creating a new agency, the Consumer Financial Protection Bureau, responsible for implementing, examining, and enforcing compliance with federal consumer financial laws. |
| • | Apply to most bank holding companies the same leverage and risk-based capital requirements applicable to insured depository institutions. The Bancorp’s existing trust preferred securities will continue to be treated as Tier 1 capital. |
| • | Change the assessment base for federal deposit insurance from the amount of insured deposits to consolidated assets less tangible capital, eliminate the ceiling on the size of the Deposit Insurance Fund (“DIF”) and increase the floor of the size of the DIF, which generally will require an increase in the level of assessments for institutions, such as the Bank, with assets in excess of $10 billion. |
| • | Impose comprehensive regulation of the over-the-counter derivatives market, which would include certain provisions that would effectively prohibit insured depository institutions from conducting certain derivatives businesses in the institution itself. |
12
Table of Contents
| • | Implement corporate governance revisions, including with regard to executive compensation and proxy access by shareholders, that apply to all public companies, not just financial institutions. |
| • | Make permanent the $250,000 limit for federal deposit insurance and increase the cash limit of the Securities Investor Protection Corporation protection from $100,000 to $250,000 and provide unlimited federal deposit insurance until January 1, 2013 for non-interest bearing demand transaction accounts at all insured depository institutions. |
| • | Repeal the federal prohibitions on the payment of interest on demand deposits, thereby permitting depository institutions to pay interest on business transactions and other accounts. |
| • | Increase the authority of the FRB to examine the Bank and its non-bank subsidiaries. |
Many aspects of the Dodd-Frank Act are subject to rulemaking and will take effect over several years, making it difficult to anticipate the overall financial impact on us, its customers or the financial industry more generally. Provisions in the legislation that affect deposit insurance assessments, payment of interest on demand deposits, and interchange fees could increase the costs associated with deposits as well as place limitations on certain revenues that those deposits may generate.
Bank Regulation
Nara Bank is subject to regulation, supervision, and regular examination by the DFI and the FRB, and must also comply with applicable regulations of the FDIC. Federal and state laws and regulations which are specifically applicable to banks regulate, among other things, the scope of their business, their investments, their reserves against deposits, the timing of the availability of deposited funds, their activities relating to dividends, investments, loans, the nature and amount of and collateral for certain loans, borrowings, capital requirements, certain check-clearing activities, branching, and mergers and acquisitions. California banks are also subject to FRB Regulation O and Federal Reserve Act Sections 23A and 23B and FRB Regulation W, which restrict or limit loans or extensions of credit to “insiders”, including officers directors and principal shareholders, and loans or extension of credit by banks to affiliates or purchases of assets from affiliates, including parent bank holding companies, except pursuant to certain limits and exceptions and only on terms and conditions at least as favorable as those prevailing for comparable transactions with unaffiliated parties.
The federal and California regulatory structure gives the bank regulatory agencies extensive discretion in connection with their supervisory and enforcement activities and examination policies, including policies with respect to the classification of assets and the establishment of adequate loan loss reserves for regulatory purposes. The regulatory agencies have adopted guidelines to assist in identifying and addressing potential safety and soundness concerns. The guidelines establish operational and managerial standards generally relating to: (1) internal controls, information systems, and internal audit systems; (2) loan documentation; (3) credit underwriting; (4) interest-rate risk exposure; (5) asset growth and asset quality; and (6) compensation, fees, and benefits. Further, the regulatory agencies have adopted safety and soundness guidelines for asset quality and for evaluating and monitoring earnings to ensure that earnings are sufficient for the maintenance of adequate capital and reserves. If as a result of an examination, the DFI or the FRB should determine that the financial condition, capital resources, asset quality, earnings prospects, management, liquidity, or other aspects of the Bank’s operations are unsatisfactory or that the Bank or its management is violating or has violated any law or regulation, the DFI and the FRB, and separately the FDIC as insurer of the Bank’s deposits, have authority to:
| • | Require affirmative action to correct any conditions resulting from any violation or practice; |
| • | Direct an increase in capital and the maintenance of higher specific minimum capital ratios, which may preclude the Bank from being deemed well capitalized and restrict its ability to accept certain brokered deposits; |
| • | Restrict the Bank’s growth geographically, by products and services, or by mergers and acquisitions; |
13
Table of Contents
| • | Enter into or issue informal or formal enforcement actions, including memoranda of understanding, written agreements and consent or cease and desist orders or prompt corrective action orders to take corrective action and cease unsafe and unsound practices; |
| • | Require prior approval of senior executive officer or director changes; |
| • | Remove officers and directors and assess civil monetary penalties; and |
| • | Take possession of, close and liquidate the Bank or appoint the FDIC as receiver under certain circumstances. |
Under the Federal Deposit Insurance Act (“FDI Act”) and the California Financial Code, California state chartered commercial banks may generally engage in any activity permissible for national banks. Additionally, Nara Bank may form subsidiaries to engage in the many so-called “closely related to banking” or “nonbanking” activities commonly conducted by national banks in operating subsidiaries. Further, California banks may conduct certain “financial” activities in a subsidiary to the same extent that national banks may conduct such activities, provided the bank is and remains well capitalized, well managed and in satisfactory compliance with the CRA. Nara Bank currently does not conduct activities in subsidiaries.
Capital Requirements
The federal banking agencies have adopted risk-based capital guidelines for bank holding companies and banks that are expected to provide a measure of capital that reflects the degree of risk associated with a banking organization’s operations for both transactions reported on the balance sheet as assets, such as loans, and those recorded as off-balance sheet items, such as commitments, letters of credit and recourse arrangements. Under these capital guidelines, banking organizations are required to maintain certain minimum capital ratios, which are obtained by dividing its qualifying capital by its total risk-adjusted assets and off-balance sheet items. In general, the dollar amounts of assets and certain off-balance sheet items are “risk-adjusted” and assigned to various risk categories. Qualifying capital is classified depending on the type of capital as follows:
| • | “Tier 1 capital” consists of common equity, retained earnings, qualifying non-cumulative perpetual preferred stock, a limited amount of qualifying cumulative perpetual preferred stock and minority interests in the equity accounts of consolidated subsidiaries (including trust-preferred securities), less goodwill and certain other intangible assets. In determining bank holding company compliance with holding company level capital requirements, qualifying Tier 1 capital may consist of trust-preferred securities, subject to certain criteria and quantitative limits for inclusion of restricted core capital elements in Tier 1 capital. |
| • | “Tier 2 capital” includes, among other things, hybrid capital instruments, perpetual debt, mandatory convertible debt securities, qualifying term subordinated debt, preferred stock that does not qualify as Tier 1 capital, a limited amount of allowance for loan and lease losses. |
| • | “Tier 3 capital” consists of qualifying unsecured subordinated debt. |
Under the capital guidelines, there are three fundamental capital ratios: a total risk-based capital ratio, a Tier 1 risk-based capital ratio and a Tier 1 leverage ratio. To be deemed “well capitalized” a bank must have a total risk-based capital ratio, a Tier 1 risk-based capital ratio and a Tier 1 leverage ratio of at least 10%, 6% and 5%, respectively. At December 31, 2010, the respective capital ratios of Nara Bancorp and Nara Bank exceeded the minimum percentage requirements to be deemed “well-capitalized” as provided in the schedule in Note 14 of Notes to Consolidated Financial Statements.
Pursuant to federal regulations, banks must maintain capital levels commensurate with the level of risk to which they are exposed, including the volume and severity of problem loans. The federal banking agencies may change existing capital guidelines or adopt new capital guidelines in the future and have required many banks
14
Table of Contents
and bank holding companies subject to enforcement actions to maintain capital ratios in excess of the minimum ratios otherwise required to be deemed well capitalized, in which case institutions may no longer be deemed well capitalized and may therefore be subject to restrictions on taking brokered deposits.
The current risk-based capital guidelines are based upon the 1988 capital accord of the International Basel Committee on Banking Supervision, a committee of central banks and bank supervisors and regulators from the major industrialized countries that develops broad policy guidelines for use by each country’s supervisors in determining the supervisory policies they apply. A new international accord, referred to as Basel II, became mandatory for large or “core” international banks outside the U.S. in 2008 (total assets of $250 billion or more or consolidated foreign exposures of $10 billion or more) and emphasizes internal assessment of credit, market and operational risk, as well as supervisory assessment and market discipline in determining minimum capital requirements. It is optional for other banks. In September 2010, the Group of Governors and Heads of Supervisors of the Basel Committee on Banking Supervision, the oversight body of the Basel Committee, published its “calibrated” capital standards for major banking institutions, referred to as Basel III. Under these standards, when fully phased-in on January 1, 2019, banking institutions will be required to maintain heightened Tier 1 common equity, Tier 1 capital, and total capital ratios, as well as maintaining a “capital conservation buffer.” The Tier 1 common equity and Tier 1 capital ratio requirements will be phased-in incrementally between January 1, 2013 and January 1, 2015; the deductions from common equity made in calculating Tier 1 common equity will be phased-in incrementally over a four-year period commencing on January 1, 2014; and the capital conservation buffer will be phased-in incrementally between January 1, 2016 and January 1, 2019. The Basel Committee also announced that a countercyclical buffer of 0% to 2.5% of common equity or other fully loss-absorbing capital will be implemented according to national circumstances as an extension of the conservation buffer.
Nara Bancorp and Nara Bank are required by the U.S. bank regulatory agencies to also maintain a leverage capital ratio designed to supplement the risk-based capital guidelines. Banks and bank holding companies that have received the highest rating of the five categories used by regulators to rate banks and that are not anticipating or experiencing any significant growth must maintain a ratio of Tier 1 capital (net of all intangibles) to adjusted total assets of at least 3%. All other institutions are required to maintain a leverage ratio of at least 100 to 200 basis points above the 3% minimum, for a minimum of 4% to 5%. As of December 31, 2010, Nara Bancorp and Nara Bank’s leverage capital ratios were 12.6% and 12.3%, respectively, exceeding regulatory minimums.
Prompt Corrective Action
The federal banking agencies have issued regulations pursuant to the FDI Act defining five categories in which an insured depository institution will be placed, based on the level of its capital ratios: well-capitalized, adequately-capitalized, undercapitalized, significantly undercapitalized, and critically undercapitalized. A bank that may otherwise meet the minimum requirements to be classified as well-capitalized, adequately capitalized, or undercapitalized may be treated instead as though it were in the next lower capital category if the appropriate federal banking agency, after notice and opportunity for hearing, determines that an unsafe or unsound condition, or an unsafe or unsound practice, warrants such treatment. Under the prompt corrective action regulations, the subsidiary bank will be required to submit to its federal regulator a capital restoration plan and to comply with the plan. Each parent company that controls the subsidiary bank will be required to provide assurances of compliance by the bank with the capital restoration plan. However, the aggregate liability of such parent companies will not exceed the lesser of (i) 5% of the bank’s total assets at the time it became undercapitalized and (ii) the amount necessary to bring the bank into compliance with the plan. Failure to restore capital under a capital restoration plan can result in the bank’s being placed into receivership if it becomes critically undercapitalized. A bank subject to prompt corrective action also may affect its parent bank holding company in other ways. These include possible restrictions or prohibitions on dividends to the parent bank holding company by the bank; subordinated debt payments to the parent; and other transactions between the bank and the holding company. In addition, the regulators may impose restrictions on the ability of the holding company itself to pay
15
Table of Contents
dividends; require divestiture of holding company affiliates that pose a significant risk to the bank; or require divestiture of the undercapitalized subsidiary bank. At each successive lower-capital category, an insured bank may be subject at the agencies’ discretion to impose more restrictions under the agencies’ prompt corrective action regulations, including restrictions on the bank’s activities.
Deposit Insurance
The FDIC is an independent federal agency that insures deposits of federally insured banks and savings institutions, up to prescribed statutory limits for each depositor, through the Deposit Insurance Fund (the “DIF”) and safeguards the safety and soundness of the banking and savings industries. The FDIC insures our customer deposits. The Dodd-Frank Act permanently raised the standard maximum deposit insurance amount to $250,000. On November 9, 2010, the FDIC Board of Directors issued a final rule to implement the Dodd-Frank Act that provides temporary unlimited deposit insurance coverage for non-interest bearing accounts from December 31, 2010, through December 31, 2012. This temporary unlimited coverage is in addition to, and separate from, the coverage of at least $250,000 available to depositors under the FDIC's general deposit insurance rules.
The amount of FDIC assessments paid by each DIF member institution is based on its relative risk of default as measured by regulatory capital ratios and other supervisory factors. Since 2008, there have been higher levels of bank failures which has dramatically increased resolution costs of the FDIC and depleted the DIF. In order to maintain a strong funding position and restore reserve ratios of the DIF, the FDIC has increased assessment rates of insured institutions and may continue to do so in the future. As of December 31, 2010, the Bank’s assessment rate averaged 5 cents per $100 in assessable deposits. On November 12, 2009, the FDIC adopted a requirement for institutions to prepay in 2009 their estimated quarterly risk-based assessments for the fourth quarter of 2009 and for all of 2010, 2011 and 2012.
We are generally unable to control the amount of premiums that we are required to pay for FDIC insurance. If there are additional bank or financial institution failures or if the FDIC otherwise determines, we may be required to pay even higher FDIC premiums than the recently increased levels. These announced increases and any future increases in FDIC insurance premiums may have a material and adverse affect on our earnings. Further, all FDIC-insured institutions are required to pay assessments to the FDIC to fund interest payments on bonds issued by the Financing Corporation (“FICO”), an agency of the Federal government established to recapitalize the predecessor to the DIF. The FICO assessment rates, which are determined quarterly, averaged 0.0026% of insured deposits in fiscal 2010. These assessments will continue until the FICO bonds mature in 2017.
The FDIC implemented two temporary programs under the Temporary Liquidity Guaranty Program (“TLGP”): the Transaction Account Guarantee Program (“TAGP”) (to provide deposit insurance for the full amount of most non-interest bearing transaction accounts through December 31, 2010) and the Debt Guarantee Program (to guarantee certain unsecured debt of financial institutions and their holding companies through the earlier of the maturity date of the debt or June 30, 2012). Nara Bank was a participant in the TAGP which expired on December 31, 2010. Nara Bank was also a participant of the Debt Guarantee Program which expired on October 31, 2009, but only issued senior unsecured debt in the form of interbank certificate of deposits during that Program. Such interbank CDs were all closed in 2009. On October 20, 2009, the FDIC established a limited, six-month emergency guarantee facility whereby, certain participating entities, including the Bank, can apply to the FDIC for permission to issue FDIC-guaranteed debt during the period starting October 31, 2009 through April 30, 2010. The FDIC charges “systemic risk special assessments” to depository institutions that participate in the TLGP.
The FDIC has redefined its deposit insurance premium assessment base to be an institution’s average consolidated total assets minus average tangible equity as required by the Dodd-Frank Act and revised deposit insurance assessment rate schedules in light of the changes to the assessment base. The proposed rate schedule and other revisions to the assessment rules, which were adopted by the FDIC Board of Directors on February 7, 2011, would become effective April 1, 2011 and would be used to calculate the June 30, 2011.
16
Table of Contents
The FDIC may terminate a depository institution’s deposit insurance upon a finding that the institution’s financial condition is unsafe or unsound or that the institution has engaged in unsafe or unsound practices that pose a risk to the DIF or that may prejudice the interest of the bank’s depositors. The termination of deposit insurance for a bank would also result in the revocation of the bank’s charter by the DFI.
Restrictions on Dividends and Other Capital Distributions
Both California and federal law limit the payment of dividends by the Bank. Under the California Financial Code, the Bank is permitted to pay dividends out of the Bank’s net profits up to the lesser of retained earnings or the Bank’s net income for the last three fiscal years (less any distributions made to shareholders during such period), or with the prior written approval of the DFI, in an amount not exceeding the greatest of (i) the Bank’s retained earnings, (ii) its net income for the Bank’s last fiscal year and (iii) the Bank’s net income for its current fiscal year. Under federal law and the regulations of the FRB, the Bank may not, without FRB approval, pay dividends exceeding the Bank’s net income for its current year and two preceding fiscal years, less the sum of dividends paid during such periods and any transfers required by the FRB or required to be made for the retirement of preferred stock. In addition to the foregoing specific statutory and regulatory limitations, as a matter of general bank regulatory policy the FRB discourages the payment of dividends on common stock by bank holding companies and by banks that are members of the Federal Reserve System in amounts exceeding the paying entity’s net income available to common stockholders for the preceding four quarters. Dividends by Nara Bank are also subject to the prior written approval of the FRB and the DFI pursuant to the resolution adopted by the Board of Directors on December 8, 2010.
It is the FRB’s policy that bank holding companies generally pay dividends on common stock only out of income available over the past year, and only if prospective earnings retention is consistent with the organization’s expected future needs and financial condition. It is also the FRB’s policy that bank holding companies should not maintain dividend levels that undermine their ability to be a source of strength to its banking subsidiaries. Additionally, in consideration of the current financial and economic environment, the FRB has indicated that bank holding companies should carefully review their dividend policy and has discouraged payment ratios that are at maximum allowable levels unless both asset quality and capital are very strong. Nara Bancorp is also restricted as to declaration and the payment of dividends without the prior written approval of the FRB by the resolution recently adopted by the Board of Directors.
Under the terms of the CPP, for so long as any preferred stock issued by Nara Bancorp under the CPP remains outstanding, Nara Bancorp is prohibited from increasing dividends on its common stock, and from making certain repurchases of equity securities, including its common stock, without the Treasury’s consent until the third anniversary of the Treasury’s investment or until the Treasury has transferred all of the preferred stock it purchased from Nara Bancorp under the CPP to third parties. The terms of our Series A Preferred Stock and Junior Subordinated Securities also limit our ability to pay dividends on our common stock. If we are not current in our payment of dividends on our Series A Preferred Stock or in our payment of interest on our Junior Subordinated Securities, we may not pay dividends on our common stock.
Operations and Consumer Compliance Laws
The Bank must comply with numerous federal anti-money laundering and consumer protection statutes and implementing regulations, including but not limited to the Truth in Savings Act, Electronic Funds Transfer Act, Expedite Funds Availability Act, the USA PATRIOT Act of 2001, the Bank Secrecy Act, the CRA, the Equal Credit Opportunity Act, the Truth in Lending Act, the National Flood Insurance Act and various other federal and state privacy protection laws. Noncompliance with these laws could subject the Bank to lawsuits and could also result in administrative penalties, including, fines and reimbursements. Nara Bancorp and the Bank are also subject to federal and state laws prohibiting unfair or fraudulent business practices, untrue or misleading advertising and unfair competition.
17
Table of Contents
These laws and regulations mandate certain disclosure requirements and regulate the manner in which financial institutions must deal with customers when taking deposits, making loans, collecting loans, and providing other services. Failure to comply with these laws and regulations can subject the Bank to various penalties, including but not limited to enforcement actions, injunctions, fines or criminal penalties, punitive damages to consumers, and the loss of certain contractual rights.
As of December 31, 2010, we had 376 full-time equivalent employees. None of our employees are represented by a union or covered by a collective bargaining agreement. Management believes that its relations with its employees are good.
18
Table of Contents
| Item 1A. | RISK FACTORS |
Before deciding to purchase, hold or sell our common stock, you should carefully consider the risks described below in addition to the other cautionary statements and risks described elsewhere, and the other information contained, in this Report and in our other filings with the SEC, including our subsequent reports on Forms 10-Q and 8-K. The risks and uncertainties described below are not the only ones we face. Additional risks and uncertainties not presently known to us or that we currently deem immaterial may also affect our business. If any of these known or unknown risks or uncertainties actually occurs, our business, financial condition and results of operations may be seriously harmed. In that event, the market price for our common stock will likely decline.
If we fail to maintain an effective system of internal controls and disclosure controls and procedures, we may not be able to accurately report our financial results or prevent fraud. Effective internal controls and disclosure controls and procedures are necessary for us to provide reliable financial reports and disclosures to stockholders, to prevent fraud and to operate successfully as a public company. If we cannot provide reliable financial reports and disclosures or prevent fraud, our business may be adversely affected and our reputation and operating results would be harmed. Any failure to develop or maintain effective internal controls and disclosure controls and procedures or difficulties encountered in their implementation may also result in regulatory enforcement action against us, adversely affect our operating results or cause us to fail to meet our reporting obligations.
Economic conditions in California, New York or South Korea may adversely affect our loan portfolio and reduce the demand for our services. We focus our business primarily in Korean-American communities in California, the greater New York City metropolitan area and New Jersey. Adverse economic conditions in our market areas have had a material adverse impact on the quality of our business. A continued economic slowdown in California, New York, or South Korea may have any or all of the following consequences, any of which may reduce our net income and adversely affect our financial condition:
| • | loan delinquencies may increase, |
| • | problem assets and foreclosures may increase, |
| • | the level and duration of deposits may decline, |
| • | demand for our products and services may decline and |
| • | collateral for loans may decline in value below the principal amount owed by the borrower. |
Our allowance for loan losses may not cover actual loan losses. If our actual loan losses exceed the amount we have allocated for estimated probable incurred losses, it will hurt our business. We try to limit the risk that borrowers will fail to repay loans by carefully underwriting our loans, but losses nevertheless occur in the ordinary course of lending operations. We create allowances for estimated loan losses through provisions that are recorded as reductions in income in our accounting records. We base these allowances on estimates of the following:
| • | historical experience with our loans, |
| • | evaluation of current economic conditions and other factors, |
| • | reviews of the quality, mix and size of the overall loan portfolio, |
| • | reviews of delinquencies and |
| • | the quality of the collateral underlying our loans. |
If our allowance estimates are inadequate, we may incur losses, our financial condition may be materially and adversely affected and we may be required to raise additional capital to enhance our capital position. In
19
Table of Contents
addition, various regulatory agencies, as an integral part of their examination process, periodically review the adequacy of our allowance. These agencies may require us to establish additional allowances based on their judgment of the information available at the time of their examinations. No assurance can be given that we will not sustain loan losses in excess of present or future levels of the allowance for loan losses.
We have a high level of loans secured by real estate collateral. A further downturn in the real estate market may seriously impair our loan portfolio. As of December 31, 2010, approximately 74% of our loan portfolio consisted of loans secured by various types of real estate. There has been a general slowdown in the economy and in, declines in value in the commercial real estate market in Southern California, along with high levels of unemployment. Continued deterioration in the real estate market generally and in commercial real estate values in particular, along with high levels of unemployment, may result in additional loan charge-offs and provisions for loan losses , which may have an adverse effect on our net income and capital levels.
Changes in interest rates affect our profitability. Changes in prevailing interest rates may hurt our business. We derive our income mainly from the difference or “spread” between the interest earned on loans, securities and other interest-earning assets, and interest paid on deposits, borrowings and other interest-bearing liabilities. In general, the wider the spread, the more net interests income we earn. When market rates of interest change, the interest we receive on our assets and the interest we pay on our liabilities will fluctuate. This can cause decreases in our spread and can greatly affect our income. In addition, interest rate fluctuations can affect how much money we may be able to lend. The interest rate risk inherent in our lending, investing, and deposit taking activities is a significant market risk to us and our business. There can be no assurance that we will be successful in minimizing the adverse effects of changes in interest rates.
If we lose key employees, our business may suffer. Our future success depends on the continued employment of existing senior management personnel. If we lose key employees temporarily or permanently, it may hurt our business. We may be particularly hurt if our key employees became employed by our competitors in the Korean American banking industry. In addition, the America Recovery and Reinvestment Act of 2009 places certain restrictions on executive compensation that may impact our ability to attract, retain and motivate senior management personnel.
Environmental laws may force us to pay for environmental problems. The cost of cleaning up or paying damages and penalties associated with environmental problems may increase our operating expenses. When a borrower defaults on a loan secured by real property, we often purchase the property in foreclosure or accept a deed to the property surrendered by the borrower. We may also take over the management of commercial properties whose owners have defaulted on loans. We also lease premises where our branches and other facilities are located and where environmental problems may exist. Although we have lending, foreclosure and facilities guidelines intended to exclude properties with an unreasonable risk of contamination, hazardous substances may exist on some of the properties that we own, lease, manage or occupy. We may face the risk that environmental laws may force us to clean up the properties at our expense. The cost of cleaning up a property may exceed the value of the property. We may also be liable for pollution generated by a borrower’s operations if we take a role in managing those operations after a default. We may find it difficult or impossible to sell contaminated properties.
We are exposed to the risks of natural disasters. A significant portion of our operations is concentrated in Southern California. California is in an earthquake-prone region. A major earthquake may result in material loss to us. A significant percentage of our loans are and will be secured by real estate. Many of our borrowers may suffer uninsured property damage, experience interruption of their businesses or lose their jobs after an earthquake. Those borrowers might not be able to repay their loans, and the collateral for such loans may decline significantly in value. Unlike a bank with operations that are more geographically diversified, we are vulnerable to greater losses if an earthquake, fire, flood or other natural catastrophe occurs in Southern California.
An increase in non-performing assets would reduce our income and increase our expenses. If the level of non-performing assets increases in the future, it may adversely affect our operating results and financial
20
Table of Contents
condition. Non-performing assets are mainly loans on which the borrowers are not making their required payments. Non-performing assets also include loans that have been restructured to permit the borrower to have smaller payments and real estate that has been acquired through foreclosure of unpaid loans. To the extent that assets are non-performing, we have less or lower earning assets generating interest income and an increase in credit related expenses, including provisions for loan losses.
We may experience adverse effects from acquisitions. We have acquired other banking companies and bank offices in the past and consider additional acquisitions as opportunities arise. If we do not adequately address the financial and operational risks associated with acquisitions of other companies, including in connection with our pending merger transaction with Center Financial Corporation described elsewhere in this Report, we may incur material unexpected costs and disruption of our business. Risks involved in acquisitions of other companies include:
| • | the risk of failure adequately to evaluate the asset quality of the acquired company; |
| • | difficulty in assimilating the operations, technology and personnel of the acquired company; |
| • | diversion of management’s attention from other important business activities; |
| • | difficulty in maintaining good relations with the loan and deposit customers of the acquired company; |
| • | inability to maintain uniform standards, controls, procedures and policies; |
| • | potentially dilutive issuances of equity securities or the incurrence of debt and contingent liabilities; and |
| • | amortization of expenses related to acquired intangible assets that have finite lives. |
Liquidity risks may impair our ability to fund operations and jeopardize our financial condition. Liquidity is essential to our business. An inability to raise funds through deposits, borrowings, the sale of loans, and other sources may have a material adverse effect on our liquidity. Our access to funding sources in amounts adequate to finance our activities may be impaired by factors that affect us specifically or the financial services industry in general. Factors that may detrimentally impact our access to liquidity sources include a decrease in the level of our business activity due to a market downturn or adverse regulatory action against us. Our ability to acquire deposits or borrow may also be impaired by factors that are not specific to us, such as a severe disruption of the financial markets or negative views and expectations about the prospects for the financial services industry as a whole.
The level of our problem assets, occurrence of operating losses or a failure to comply with requirements of the agencies which regulate us may result in regulatory actions against us which may adversely affect our business and the market price of our common stock. The DFI, the FDIC and the FRB each have authority to take actions to require that we comply with applicable regulatory capital requirements, cease engaging in what they perceive to be unsafe or unsound practices or make other changes in our business. Among others, the corrective measures that such regulatory authorities may take include requiring us to enter into informal or formal agreements regarding our operations, the issuance of cease and desist orders to refrain from engaging in unsafe and unsound practices, removal of officers and directors and the assessment of civil monetary penalties. See “Item 1. Business – Supervision and Regulation” for a further description of such regulatory powers. Beginning in the latter part of 2008, we experienced increases in the level of our problem assets, which have resulted in increases in our net loan charge-offs and provisions for loan and lease losses and caused operating losses. We implemented an action plan to address the adverse developments and noted that in the second half of 2010, the Bank’s charge-off trends moderated. Based upon the most recent safety and soundness examination, based in part on financial information as of June 30, 2010, the Bank was requested by the FRB and DFI to submit ongoing quarterly progress reports on its efforts to improve asset quality. Additionally, the Bank was instructed to updated plans for the maintenance of its capital and improvement of its earnings and has committed, through a resolution adopted by its Board of Directors, that it will not declare or pay dividends without written prior
21
Table of Contents
approval of the FRB and DFI. See “Item 7. Management’s Discussion and Analysis of Financial Condition and Results of Operations – Overview.” Failure by the Bank to comply with the plans that have been submitted, or with revised plans if the initial plans are not accepted by the FRB and DFI, or with the other provisions of the resolution adopted by the Bank’s Board of Directors may result in more formal regulatory action with respect to the Bank. Regulatory action may also be taken with respect to the Nara Bancorp.
Increased deposit insurance costs may adversely affect our results of operations. Due to the greatly increased rate of bank failures experienced in the current period of financial stress, as well as the extraordinary programs in which the FDIC has been involved to support the banking industry generally, the FDIC’s Deposit Insurance Fund has been substantially depleted and the FDIC has incurred substantially increased operating costs. For these reasons, the FDIC has significantly increased the rates of deposit insurance premiums that it charges insured banks, including Nara Bank, which has increased our costs of operation. Additional increases in the deposit insurance premium rates of the FDIC or other increases in costs related to deposit insurance may be imposed, which may result in further increases in Nara Bank’s operating costs.
Changes in accounting standards may affect how we record and report our financial condition and results of operations. Our accounting policies and methods are fundamental to how we record and report our financial condition and results of operations. From time to time, the Financial Accounting Standards Board and SEC change the financial accounting and reporting standards that govern the preparation of our financial statements. These changes and their impacts on us can be hard to predict and may result in unexpected and materially adverse impacts on our reported financial condition and results of operations.
We are subject to operational risks relating to our technology and information systems. The continued efficacy of our technology and information systems, related operational infrastructure and relationships with third party vendors in our ongoing operations is integral to our performance. Failure of any of these resources, including but not limited to operational or systems failures, interruptions of client service operations and ineffectiveness of or interruption in third party data processing or other vendor support, may cause material disruptions in our business, impairment of customer relations and exposure to liability for our customers, as well as action by bank regulatory authorities.
Our business reputation is important and any damage to it may have a material adverse effect on our business. Our reputation is very important for our business, as we rely on our relationships with our current, former and potential clients and stockholders, and in the communities we serve. Any damage to our reputation, whether arising from regulatory, supervisory or enforcement actions, matters affecting our financial reporting or compliance with SEC and exchange listing requirements, negative publicity, or our conduct of our business or otherwise may have a material adverse effect on our business.
As we expand outside our California markets, we may encounter additional risks that may adversely affect us. Currently, the substantial majority of our offices are located in California, but we also have seven offices in New York and New Jersey. Over time, we may seek to establish offices to serve Korean-American communities in other parts of the United States. In the course of these expansion activities, we may encounter significant risks including increased marketing and administrative expenses and operational difficulties arising from our efforts to attract business in new markets, manage operations in noncontiguous geographic markets, comply with local laws and regulations and effectively and consistently manage our non-California personnel and business. If we are unable to manage these risks, our operations may be adversely affected.
Adverse conditions in South Korea may adversely affect our business. A substantial number of our customers have economic and cultural ties to South Korea and, as a result, we are likely to feel the effects of adverse economic and political conditions in South Korea. If economic conditions in South Korea deteriorate, we may, among other things, be exposed to economic and transfer risk, and may experience an outflow of deposits by our customers with connections to South Korea. Transfer risk may result when an entity is unable to obtain the foreign exchange needed to meet its obligations or to provide liquidity. This may adversely impact the
22
Table of Contents
recoverability of investments in or loans made to such entities. Adverse economic conditions in South Korea may also negatively impact asset values and the profitability and liquidity of our customers who operate in this region.
Our use of appraisals in deciding whether to make loans secured by real property does not ensure that the value of the real property collateral will be sufficient to repay our loans. In considering whether to make a loan secured by real property, we require an appraisal of the property. However, an appraisal is only an estimate of the value of the property at the time the appraisal is made and requires the exercise of a considerable degree of judgment and adherence to professional standards. If the appraisal does not reflect the amount that may be obtained upon sale or foreclosure of the property, whether due to a decline in property value after the date of the original appraisal or defective preparation of the appraisal, we may not realize an amount equal to the indebtedness secured by the property and as a result, we may suffer losses.
Legislative and regulatory actions taken to address the recent stresses in the banking industry may significantly affect our financial condition, results of operations, liquidity and stock price. Economic conditions, particularly in the financial markets, have resulted in government regulatory agencies and legislative bodies placing increased scrutiny on the banking industry. The U.S. government has intervened on an unprecedented scale, responding to what has been commonly referred to as the financial crisis. In addition to the CPP, in which we participated by selling $67 million of our Series A Preferred Stock and a warrant to purchase up to 1,042,531 shares (which has been subsequently reduced to 521,266 shares) of our common stock (the “Warrant”) to the Treasury, the U.S. government has taken steps that include enhancing the liquidity support available to financial institutions, establishing a commercial paper funding facility, temporarily guaranteeing money market funds and certain types of bank and other debt issuances, and increasing the levels of insurance on bank deposits. The U.S. government’s probable eventual withdrawal of support to the liquidity of financial markets may have an adverse impact on the operations of Nara Bancorp. Our participation in the CPP subjects us to additional restrictions, oversight and costs that may have an adverse impact on our business, financial condition and results of operations and the price of our common stock.
Congress, through the EESA AND ARRA, has imposed a number of restrictions and limitations on the operations of banks and other financial services companies participating in the federal programs. In addition, new proposals for legislation continue to be introduced in Congress that may further substantially increase regulation of the financial services industry and impose restrictions on the operations and general ability of commercial banks and other companies in the industry to conduct business consistent with historical practices relating to, among others, interest rates, lending practices and compensation practices. Compliance with such current and potential regulation may significantly increase our costs, impede the efficiency of our internal business processes, make it more difficult to attract and retain key employees, require us to increase our regulatory capital and limit our ability to pursue business opportunities in an efficient manner.
Changes in governmental regulation may impair our operations or restrict our growth. Federal and state bank regulatory agencies regulate many aspects of our operations. These areas include:
| • | the capital that must be maintained, |
| • | the dividend that may be paid, |
| • | the kinds of activities that we may be engaged in, |
| • | the compensation that may be paid, |
| • | the kinds and amounts of investments that can be made, |
| • | the locations of our offices, |
| • | how much interest can be paid on demand deposits, |
| • | insurance of deposits and the premiums that must be paid for this insurance, and |
| • | how much cash must be set aside as reserves for deposits. |
23
Table of Contents
We are subject to significant governmental supervision and regulation. These regulations are intended primarily for the protection of depositors. Statutes and regulations affecting our business may be changed at any time, and the interpretation of these statutes and regulations by examining authorities may also change. Within the last several years, Congress and the federal bank regulatory authorities have made significant changes to these statutes and regulations. There can be no assurance that such changes to the statutes and regulations or in their interpretation will not adversely affect our business. Nara Bank is subject to regulation and examination by the DFI and the FRB and Nara Bancorp is subject to the rules and regulations of the FRB. In addition to governmental supervision and regulation, Nara Bank and Nara Bancorp are subject to changes in other federal and state laws, including changes in tax laws, which may materially affect the banking industry. If we fail to comply with federal and state bank regulations, the regulators may limit our activities or growth, fine us or force the bank into receivership. Banking laws and regulations change from time to time. Bank regulations can hinder our ability to compete with financial services companies that are not regulated or are less regulated.
Implementation of the various provisions of the Dodd-Frank Act may increase our operating costs or otherwise have a material effect on our business, financial condition or results of operations. On July 21, 2010 President Obama signed the Dodd-Frank Act financial reform legislation. This landmark legislation includes, among other things: (i) the creation of a Financial Services Oversight Council to identify emerging systemic risks and improve interagency cooperation; (ii) the elimination of the Office of Thrift Supervision and the transfer of oversight of federally chartered thrift institutions and their holding companies to the Office of the Comptroller of the Currency and the Federal Reserve; (iii) the creation of a Consumer Financial Protection Agency authorized to promulgate and enforce consumer protection regulations relating to financial products that would affect banks and non-bank finance companies; (iv) the establishment of new capital and prudential standards for banks and bank holding companies, including the elimination of the ability to treat trust preferred securities as Tier 1 capital; (v) the termination of investments by the Treasury under the TARP; (vi) enhanced regulation of financial markets, including the derivatives, securitization and mortgage origination markets; (vii) the elimination of certain proprietary trading and private equity investment activities by banks; (viii) the elimination of barriers to de novo interstate branching by banks; (ix) a permanent increase of the previously implemented temporary increase of FDIC deposit insurance to $250,000; (x) the authorization of interest-bearing transaction accounts and (xi) changes in the calculation of FDIC deposit insurance assessments and an increase in the minimum designated reserve ratio for the DIF.
Certain provisions of the legislation are not immediately effective or are subject to required studies and implementing regulations. Further, community banks with less than $10 billion in assets (less than $15 billion with respect to trust preferred securities) are exempt from certain provisions of the legislation. We cannot predict how this significant new legislation may be interpreted and enforced nor how implementing regulations and supervisory policies may affect us. There can be no assurance that these or future reforms will not significantly increase our compliance or operating costs or otherwise have a significant impact on our business, financial condition and results of operations.
Our stock price may become more volatile, which may result in substantial losses for our stockholders. The market price of our common stock may be subject to wider fluctuations in response to a number of factors, including:
| • | issuing new equity securities; |
| • | the amount of our common stock outstanding and the trading volume of our stock; |
| • | actual or anticipated changes in our future financial performance; |
| • | changes in financial performance estimates of us by securities analysts; |
| • | competitive developments, including announcements by us or our competitors of new products or services or significant contracts, acquisitions, strategic partnerships, joint ventures or capital commitments; |
| • | the operating and stock performance of our competitors; |
24
Table of Contents
| • | changes in interest rates; |
| • | changes in key personnel; |
| • | changes in economic conditions that affect the Bank’s performance; and |
| • | changes in legislation or regulations that affect the Bank. |
We have suspended declaration and payment of dividends on our common stock. Our ability to declare and pay dividends in the future, as well as the ability of the Bank to make dividend payments to us, will be subject to regulatory, statutory and other restrictions. In March, 2009, we announced the suspension of our prior policy of paying quarterly dividends in order to preserve capital. In addition, Nara Bancorp has agreed with the FRB and the Bank has agreed with the DFI and FRB that neither will declare or pay dividends without the prior written regulatory approval. Further, under Federal Reserve Board policy, bank holding companies are expected to inform and consult with the Federal Reserve Supervisory Staff prior to declaring and paying a dividend that exceeds the holding company’s earnings for the period in which the dividend is being paid. Our ability to declare and pay dividends on our outstanding common stock and preferred stock is also subject to further limitations under applicable federal and state law and regulations. See “Item 1. Business – Supervision and Regulation.”
Our outstanding preferred stock impacts net income available to our common stockholders and earnings per common share, and the Warrant as well as other potential issuances of equity securities may be dilutive to holders of our common stock. The dividends declared and the accretion on discount on our outstanding preferred stock will reduce the net income available to common stockholders and our earnings per common share. Our outstanding preferred stock would also receive preferential treatment in the event of our liquidation, dissolution, or winding up. Additionally, the ownership interest of the existing holders of our common stock will be diluted to the extent the Warrant is exercised. The 521,266 shares of common stock underlying the Warrant represent approximately 1.4% of the shares of our common stock outstanding as of December 31, 2010 (including the shares issuable upon exercise of the Warrant in total shares outstanding). Although the Treasury Department has agreed not to vote any of the shares of common stock it receives upon exercise of the Warrant, a transferee of any portion of the Warrant or of any shares of common stock acquired upon exercise of the Warrant is not bound by this restriction. In addition, to the extent options to purchase common stock under our stock option plans are exercised, holders of our common stock will incur dilution of their ownership interest in Nara Bancorp. We are not restricted from issuing additional common stock or preferred stock, including any securities that are convertible into or exchangeable for, or that represent the right to receive, common stock or preferred stock or any substantially similar securities. If we sell additional equity or convertible debt securities, these sales may result in increased dilution to our stockholders
A continued decline in the value of our common stock may result in future impairment of our intangible assets. We assess the carrying value of intangible assets, including goodwill, at least annually in order to determine whether such assets are impaired. In reviewing the carrying value of intangible assets, we look to the market value of our common stock, compared to the book value. We further assess the recoverability of such intangible assets by evaluating the fair value of the related business unit. If recoverability is deemed impaired, a write down of such intangible assets would be required.
Risks Relating to the Center Merger
Consummation of the Center Merger will cause an immediate reduction in our stockholders’ voting interests in us. In the Center Merger, each of Center Financial’s common shares issued and outstanding immediately prior to the effective time of the Center Merger will be converted into and become exchangeable for 0.7804 of a share of our common stock , subject to the payment of cash lieu of the issuance of fractional shares. If the Center Merger is consummated, based on the number of our common shares outstanding on the date hereof, our stockholders will own approximately 55% of the combined company’s outstanding common stock and Center Financial stockholders will own approximately 45% of the combined company’s outstanding
25
Table of Contents
common stock. Consequently, our stockholders may have less influence over the management and policies of the combined company following the Center Merger than they currently exercise over our management and policies.
Consummation of the Center Merger could result in dilution to our existing stockholders under certain circumstances. The merger exchange ratio was fixed on December 9, 2010, the date of the signing of the Merger Agreement, and is not subject to adjustment based on changes in the trading price of our or Center Financial’s common stock before the closing of the Center Merger. It is possible that the conversion of Center Financial common shares into our common shares may result in the issuance of our common shares at an implied price that is less than our net asset value per share at the time of such conversion, which would result in dilution to the net asset value per share of our common stock.
We may be not be able to realize the anticipated benefits of the Center Merger, including estimated cost savings and synergies, or it may take longer than anticipated to achieve such benefits. The realization of the benefits anticipated as a result of the Center Merger, including cost savings and synergies, will depend in part on the integration of Center Financial’s operations with our operations. There can be no assurance that Center Financial’s operations can be integrated successfully into our operations in a timely fashion, or at all. The dedication of management resources to such integration may divert attention from our day-to-day business and there can be no assurance that there will not be substantial costs associated with the transition process or that there will not be other material adverse effects as a result of these integration efforts. Such effects, including, but not limited to, incurring unexpected costs or delays in connection with such integration, may have a material adverse effect on our financial results.
The fairness opinion obtained by us from our financial advisor will not reflect changes in circumstances between signing the Merger Agreement and completion of the Center Merger. In connection with our board of directors’ consideration and approval of the Center Merger, the directors received an opinion from our financial advisor, Keefe, Bruyette & Woods, Inc. that the exchange ratio provided for in the Merger Agreement is fair from a financial point of view. We have not obtained an updated opinion as of the date of this Annual Report from our financial advisor and we do not anticipate obtaining an updated opinion prior to closing of the Center Merger. Changes in our operations and prospects, general market and economic conditions and other factors that may be beyond our control, and on which our financial advisor’s opinion was based, may significantly alter the value of Center Financial or the prices of shares of our common stock or Center Financial common stock by the time the Center Merger is completed. The opinion does not speak as of the time the Center Merger will be completed or as of any date other than the date of the opinion. Because we do not currently anticipate asking our financial advisor to update its opinion, the opinion will not address the fairness of the exchange ratio from a financial point of view at the time the Center Merger is completed.
Required regulatory approvals may not be received, may take longer to receive than expected or may impose conditions that are not anticipated or cannot be met. Before the transactions contemplated in the Merger Agreement, including both the holding company merger and the bank merger may be completed, various approvals must be obtained from the bank regulatory authorities. Although Nara Bancorp and Central Financial have each reported profits in recent quarters, both companies have had significant quarterly losses within the past two years and have been subjects of informal regulatory action, consisting of memoranda of understanding with bank regulatory authorities in the case of Center Financial and the adoption of board of directors resolutions at the request of bank regulatory authorities in the case of Nara Bancorp, directed toward reducing nonperforming assets, resolving perceived weaknesses in lending and specified other banking operations and, in Center Financial’s case, attaining and maintaining specified, higher than normal, regulatory capital ratios. To obtain regulatory approval of the Center Merger, we must provide adequate information to the regulatory authorities to demonstrate to them that we have satisfactorily addressed these regulatory issues. We anticipate that this may result in a longer than normal regulatory approval process and therefore do not expect to be able to complete the Center Merger before mid- to late 2011. In addition, for these or other reasons, the relevant bank regulatory authorities may impose conditions on the completion of the merger transactions or require changes to the terms of the Merger Agreement. Such conditions or changes may have the effect of delaying completion of the
26
Table of Contents
transactions contemplated in the Merger Agreement or imposing additional costs on or limiting the growth of the combined company, or may include requirements for changes in the business of the combined company, any of which effects may have a material adverse effect on the combined company following consummation of the Center Merger.
We will be subject to business uncertainties and contractual restrictions while the Center Merger is pending. Uncertainty about the effect of the Center Merger on employees and customers may have an adverse effect on both Nara Bancorp and Center Financial. These uncertainties may impair our ability to attract or motivate key personnel until the Center Merger is completed and may cause customers and others that deal with us to seek to change existing business relationships with either of us. If key employees depart because of issues relating to the uncertainty and difficulty of integration or a desire not to remain with the business, the combined company’s business following the Center Merger may be negatively affected. In addition, the Merger Agreement restricts each of us from making acquisitions and taking other specified actions until the Center Merger occurs, without the consent of the other. These restrictions may prevent each company from pursuing attractive business opportunities that may arise prior to the completion of the Center Merger.
If the Center Merger does not close, we will not benefit from the expenses incurred in pursuing it. If the Center Merger is not completed, we will have incurred substantial expenses for which no ultimate benefit will have been received. We have incurred out-of-pocket expenses in connection with the Center Merger for investment banking, legal and accounting fees and financial printing and other related charges, much of which will be incurred even if the Center Merger is not completed.
Termination of the Merger Agreement may negatively affect us. If the Merger Agreement is terminated, we may suffer various adverse consequences, including:
| • | our business may have been adversely impacted by the failure to pursue other beneficial opportunities due to the focus of management on the Center Merger, without realizing any of the anticipated benefits of completing the Center Merger; and |
| • | the market price of our common stock might decline to the extent that the market price prior to termination reflects a market assumption that the Center Merger will be completed. |
Under certain circumstances, we or Center Financial would be obligated to pay the other a termination fee upon termination of the Merger Agreement. The Merger Agreement provides in certain circumstances for the payment by us or Center Financial of a termination fee to the other in the amount of $10 million or $2.5 million , depending on the circumstances. See “Pending Center Merger” for a description of the terms of the Center Merger. Payment of a termination fee by us, if required under the circumstances, may adversely affect our financial condition and liquidity.
| Item 1B. | Unresolved Staff Comments. |
None.
| Item 2. | PROPERTIES |
Our principal executive offices are located at 3731 Wilshire Blvd., Suite 1000, Los Angeles, California 90010. We conduct our operations through 23 branch offices and one loan production office. We lease all of our offices. We believe our present facilities are adequate for our current needs. We also believe that, if necessary, we could secure suitable alternative facilities on similar terms, without adversely impacting our operations.
As of December 31, 2010, premises and equipment, net of accumulated depreciation and amortization, totaled $10.9 million. Total occupancy expense, including furniture and equipment expense for the year ended December 31, 2010, was $13.3 million. Total lease expense for the year ended December 31, 2010 was $6.6 million.
27
Table of Contents
| Item 3. | LEGAL PROCEEDINGS |
The Company is a nominal defendant in Thomas Chung v. Nara Bancorp, Inc., et al, a shareholder derivative lawsuit which purports to be brought on the Company’s behalf by Mr. Thomas Chung, a former chairman of the Company’s board of directors (the “Chung Lawsuit”) and which was filed on May 20, 2008 in the Superior Court of California, County of Los Angeles. The Chung Lawsuit alleges that the members of the Company’s board of directors as composed on the date the lawsuit was filed, as well as the Company’s board of directors as it was composed in March 2005 (collectively, the “Boards”) breached their fiduciary duties to the Company’s shareholders and mismanaged corporate assets.
The Chung Lawsuit further alleges that the 2005 restatement of the Company’s 2002 Consolidated Financial Statements was not required and was undertaken by the Board as composed in 2005 in bad faith. Mr. Chung further alleges that the restatement resulted in a decline of $54 million in the value of the Company’s outstanding stock, and that the Board as composed in 2008 breached its fiduciary duties by failing to pursue the claims alleged in the Chung Lawsuit. The letter between Mr. Chung and Mr. Benjamin Hong, the restatement of the Company’s 2002 Consolidated Financial Statements and certain related matters are further described in the Form 8-K/A filed by the Company with the SEC on March 31, 2005.
The complaint seeks damages exceeding $54 million from the Boards, together with reimbursement from all defendants of Mr. Chung’s legal costs incurred in pursuing the Chung Lawsuit. If any damages are recovered in the purported shareholder derivative lawsuit, such damages, but not any awards of legal costs to Mr. Chung would be payable to Nara Bancorp.
Nara Bancorp was granted a motion for summary judgment on October 20, 2010. Mr. Chung filed an appeal with the California Court of Appeal, Second Appellate District on December 28, 2010 seeking reversal of the trial court’s decision. Nara Bancorp believes that the Chung Lawsuit is without merit.
We are involved in routine litigation incidental to our business, none of which is expected to have a material adverse effect on us.
| Item 4. | RESERVED |
28
Table of Contents
| Item 5. | MARKET FOR REGISTRANT’S COMMON EQUITY, RELATED STOCKHOLDER MATTERS AND ISSUER PURCHASES OF EQUITY SECURITIES |
Our common stock is traded on the Nasdaq Global Select Market under the symbol “NARA”.
We had approximately 3,186 beneficial owners and 491 registered holders of our common stock as of February 9, 2011. The following table sets forth, the range of high and low sales prices for, and quarterly dividend paid on our common stock for the calendar quarters indicated.
| Quarters ended: |
High Sales Price | Low Sales Price | Dividends | |||||||||
| December 31, 2010 |
$ | 9.86 | $ | 6.98 | — | |||||||
| September 30, 2010 |
$ | 8.43 | $ | 5.96 | — | |||||||
| June 30, 2010 |
$ | 10.24 | $ | 7.34 | — | |||||||
| March 31, 2010 |
$ | 11.78 | $ | 8.33 | — | |||||||
| December 31, 2009 |
$ | 12.23 | $ | 6.21 | — | |||||||
| September 30, 2009 |
$ | 9.16 | $ | 4.49 | — | |||||||
| June 30, 2009 |
$ | 5.50 | $ | 2.80 | — | |||||||
| March 31, 2009 |
$ | 9.95 | $ | 2.05 | — | |||||||
The closing price for our common stock on the Nasdaq Global Select Market on February 9, 2011 was $9.78 per share.
In March 2009, we announced our decision to suspend our prior policy of paying quarterly cash dividends in order to preserve capital. Future dividends are subject to the discretion of our Board of Directors after its consideration of a number of factors, including our future earnings, financial condition, bank regulatory capital requirements, cash needs and general business conditions. In addition, Nara Bancorp agreed as a condition of its issuance of the Series A Preferred Stock to the Treasury under the CPP that it would not pay cash dividends on its common stock at a quarterly rate greater than $0.0275 per share, or redeem, purchase or acquire any of its common stock or other equity securities, without the prior approval of the Treasury Department while the Series A Preferred Stock remains outstanding.
Nara Bancorp’s ability to pay dividends is subject to restrictions set forth in the Delaware General Corporation Law. The Delaware General Corporation Law provides that a Delaware corporation may pay dividends either (i) out of the corporation’s surplus (as defined by Delaware law), or (ii) if there is no surplus, out of the corporation’s net profits for the fiscal year in which the dividend is declared and/or the preceding fiscal year. In addition, the payment of dividends by Nara Bancorp is subject to review and possible limitation by the FRB under its authority as regulator of bank holding companies. In general, the FRB discourages the payment of dividends on common stock in amounts exceeding a holding company’s net income available to common stockholders for the four quarters preceding a dividend payment. If we defer interest on the subordinated debentures issued in connection with our trust preferred securities, Nara Bancorp would also be prohibited from paying any dividends on our common stock or preferred stock until Nara Bancorp is current on its interest payments.
Nara Bancorp’s ability to pay cash dividends in the future will depend in large part on the ability of the Bank to pay dividends on its capital stock to Nara Bancorp. The ability of the Bank to declare a cash dividend to Nara Bancorp is subject to compliance with its minimum capital requirements, additional limitations under federal and California law and regulations and policies of the FRB. The board of directors of Nara Bancorp and the Bank adopted a revised joint Board resolution (the “Revised Resolution”) at the request of the FRB and DFI on December 8, 2010. The Revised Resolution continues to prohibit us from declaring or paying dividends without the prior written approval of the FRB and the DFI.
29
Table of Contents
The applicable statutory and regulatory limitations on the declaration and payment of dividends are further described in “Item 1. Business – Supervision and Regulation.”
We did not repurchase any of our securities during 2010 and do not currently have any publicly announced repurchase plan. Our ability to repurchase common stock is subject to prior approval of the FRB and the U.S. Treasury Department pursuant to the agreements we entered into in connection with our participation in the Treasury Department’s Capital Purchase Program.
Securities Authorized for Issuance Under Equity Compensation Plans
| Plan Category |
Number of securities to be issued upon exercise of outstanding options, warrants and rights (a) |
Weighted average exercise price of outstanding options, warrants and rights (b) |
Number of securities remaining available for future issuance under equity compensation plans excluding securities reflected in Column (a) (c) |
|||||||||
| Equity compensation plans approved by security holders |
533,250 | $ | 9.73 | 1,196,000 | ||||||||
| Equity compensation plans not approved by security holders |
— | $ | — | — | ||||||||
| Total |
533,250 | $ | 9.73 | 1,196,000 | ||||||||
30
Table of Contents
Stock Performance Graph
The following graph compares the yearly percentage change in the cumulative total shareholder return (stock price appreciation plus reinvested dividends) on the common stock of the Company with (i) the cumulative total return of the Nasdaq Market Index, (ii) the cumulative total return of the S&P Small Cap 600 Index, (iii) a published index comprised of banks and thrifts selected by SNL Financial LLC , and (iv) the cumulative total return of the S&P 500 Index. The graph assumes an initial investment of $100 and reinvestment of dividends. Points on the graph represent the performance as of the last business day of each of the years indicated. The graph is not necessarily indicative of future price performance.
The following graph does not constitute soliciting material and shall not be deemed filed or incorporated by reference into any filing by Nara Bancorp under the Securities Act of 1933, as amended, or the Securities Exchange Act of 1934, as amended, except to the extent that we may specifically incorporate this graph by reference.
COMPARATIVE CUMULATIVE TOTAL RETURN
AMONG NARA BANCORP, NASDAQ MARKET INDEX, S&P SMALLCAP 600 INDEX,
SNL BANK & THRIFT INDEX AND, S&P 500 INDEX
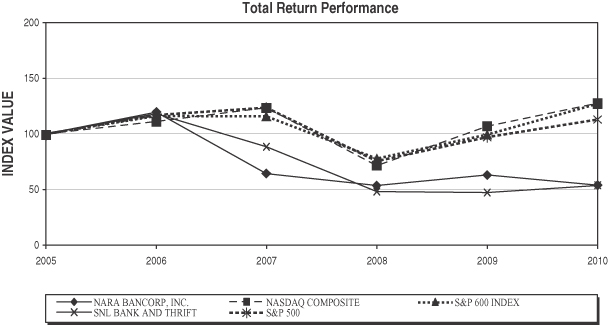
ASSUMES $100 INVESTED ON DEC. 31, 2005
ASSUMES DIVIDENDS REINVESTED
FISCAL YEAR ENDING DEC. 31, 2010
| Period Ending | ||||||||||||||||||||||||
| Index |
12/31/05 | 12/31/06 | 12/31/07 | 12/31/08 | 12/31/09 | 12/31/10 | ||||||||||||||||||
| Nara Bancorp, Inc. |
100.00 | 118.35 | 66.51 | 56.56 | 65.25 | 56.70 | ||||||||||||||||||
| NASDAQ Composite |
100.00 | 110.39 | 122.15 | 73.32 | 106.57 | 125.91 | ||||||||||||||||||
| S&P 600 Index |
100.00 | 115.12 | 114.78 | 79.11 | 99.34 | 125.49 | ||||||||||||||||||
| SNL Bank and Thrift |
100.00 | 116.85 | 89.10 | 51.24 | 50.55 | 56.44 | ||||||||||||||||||
| S&P 500 |
100.00 | 115.79 | 122.16 | 76.96 | 97.33 | 111.99 | ||||||||||||||||||
31
Table of Contents
| Item 6. | SELECTED FINANCIAL DATA |
The following table presents selected financial and other data of Nara Bancorp as of and for each of the years in the five-year period ended December 31, 2010. The information below should be read in conjunction with, and is qualified in its entirety by: the more detailed information included elsewhere herein, including our Audited Consolidated Financial Statements and Notes thereto.
| For The Year Ended December 31, | ||||||||||||||||||||
| 2010 | 2009 | 2008 | 2007 | 2006 | ||||||||||||||||
| (Dollars in thousands, except share and per share data) | ||||||||||||||||||||
| Income Statement Data: |
||||||||||||||||||||
| Interest income |
$ | 150,436 | $ | 158,045 | $ | 166,928 | $ | 175,773 | $ | 155,831 | ||||||||||
| Interest expense |
42,052 | 65,699 | 70,707 | 78,568 | 61,216 | |||||||||||||||
| Net interest income |
108,384 | 92,346 | 96,221 | 97,205 | 94,615 | |||||||||||||||
| Provision for loan losses |
84,630 | 61,023 | 48,825 | 7,530 | 3,754 | |||||||||||||||
| Net interest income after provision for loan losses |
23,754 | 31,323 | 47,396 | 89,675 | 90,861 | |||||||||||||||
| Noninterest income |
24,481 | 18,468 | 13,993 | 22,573 | 19,269 | |||||||||||||||
| Noninterest expense |
63,374 | 61,713 | 57,009 | 56,450 | 53,927 | |||||||||||||||
| Income before income tax provision (benefit) |
(15,139 | ) | (11,922 | ) | 4,380 | 55,798 | 56,203 | |||||||||||||
| Income tax provision (benefit) |
(7,900 | ) | (6,199 | ) | 1,625 | 22,599 | 22,397 | |||||||||||||
| Net income (loss) |
$ | (7,239 | ) | $ | (5,723 | ) | $ | 2,755 | $ | 33,199 | $ | 33,806 | ||||||||
| Dividends and discount accretion on preferred stock |
(4,291 | ) | (4,276 | ) | (474 | ) | — | — | ||||||||||||
| Net income (loss) available to common stockholders |
$ | (11,530 | ) | $ | (9,999 | ) | $ | 2,281 | $ | 33,199 | $ | 33,806 | ||||||||
| Per Common Share Data: |
||||||||||||||||||||
| Earnings (loss)—basic |
$ | (0.30 | ) | $ | (0.35 | ) | $ | 0.09 | $ | 1.27 | $ | 1.31 | ||||||||
| Earnings (loss)—diluted |
(0.30 | ) | (0.35 | ) | 0.09 | 1.25 | 1.28 | |||||||||||||
| Book value (period end, excluding preferred stock and warrants) |
7.69 | 7.99 | 8.49 | 8.48 | 7.15 | |||||||||||||||
| Cash dividends declared per common share |
— | — | 0.11 | 0.11 | 0.11 | |||||||||||||||
| Number of common shares outstanding (period end) |
37,983,027 | 37,824,007 | 26,246,560 | 26,193,560 | 26,107,560 | |||||||||||||||
| Balance Sheet Data—At Period End: |
||||||||||||||||||||
| Assets |
$ | 2,963,296 | $ | 3,227,957 | $ | 2,672,054 | $ | 2,423,410 | $ | 2,046,985 | ||||||||||
| Securities available for sale and held to maturity |
528,262 | 782,690 | 406,586 | 258,773 | 163,851 | |||||||||||||||
| Gross loans, net of unearned loan fees |
||||||||||||||||||||
| (excludes loans held for sale and guaranteed portion of delinquent SBA loans) |
2,134,061 | 2,208,943 | 2,098,443 | 2,008,729 | 1,714,865 | |||||||||||||||
| Deposits |
2,176,114 | 2,434,190 | 1,938,603 | 1,833,346 | 1,712,235 | |||||||||||||||
| Federal Home Loan Bank borrowings |
350,000 | 350,000 | 350,000 | 297,000 | 76,000 | |||||||||||||||
| Subordinated debentures |
39,268 | 39,268 | 39,268 | 39,268 | 39,268 | |||||||||||||||
| Stockholders’ equity |
358,563 | 367,975 | 289,953 | 222,180 | 186,627 | |||||||||||||||
| Average Balance Sheet Data: |
||||||||||||||||||||
| Assets |
$ | 3,007,294 | $ | 3,038,969 | $ | 2,544,667 | $ | 2,216,514 | $ | 1,934,913 | ||||||||||
| Securities available for sale and held to maturity |
516,460 | 619,594 | 298,886 | 199,293 | 185,587 | |||||||||||||||
| Gross loans, including loans held for sale |
2,173,840 | 2,124,615 | 2,089,803 | 1,879,457 | 1,593,453 | |||||||||||||||
| Deposits |
2,213,940 | 2,291,346 | 1,855,629 | 1,772,230 | 1,645,527 | |||||||||||||||
| Stockholders’ equity |
364,159 | 304,770 | 238,800 | 204,863 | 166,206 | |||||||||||||||
| Selected Performance Ratios: |
||||||||||||||||||||
| Return on average assets(1) |
-0.24 | % | -0.19 | % | 0.11 | % | 1.50 | % | 1.75 | % | ||||||||||
| Return on average stockholders’ equity(2) |
-1.99 | % | -1.88 | % | 1.15 | % | 16.21 | % | 20.34 | % | ||||||||||
| Average stockholders’ equity to average assets |
12.11 | % | 10.03 | % | 9.38 | % | 9.24 | % | 8.59 | % | ||||||||||
| Dividend payout ratio |
||||||||||||||||||||
| (Dividends per share/earnings per share) |
0.00 | % | 0.00 | % | 122.22 | % | 8.66 | % | 8.40 | % | ||||||||||
| Net interest spread(3) |
3.34 | % | 2.64 | % | 3.22 | % | 3.41 | % | 3.96 | % | ||||||||||
| Net interest margin(4) |
3.75 | % | 3.15 | % | 3.96 | % | 4.60 | % | 5.14 | % | ||||||||||
| Yield on interest-earning assets(5) |
5.21 | % | 5.39 | % | 6.87 | % | 8.32 | % | 8.47 | % | ||||||||||
| Cost of interest-bearing liabilities(6) |
1.86 | % | 2.75 | % | 3.65 | % | 4.91 | % | 4.51 | % | ||||||||||
| Efficiency ratio(7) |
47.70 | % | 55.69 | % | 51.73 | % | 47.13 | % | 47.35 | % | ||||||||||
32
Table of Contents
| For The Year Ended December 31, | ||||||||||||||||||||
| 2010 | 2009 | 2008 | 2007 | 2006 | ||||||||||||||||
| (Dollars in thousands) | ||||||||||||||||||||
| Regulatory Capital Ratios: |
||||||||||||||||||||
| Bancorp: Leverage |
12.61 | % | 12.36 | % | 12.61 | % | 10.77 | % | 11.19 | % | ||||||||||
| Tier 1 risk-based |
16.42 | % | 16.73 | % | 14.32 | % | 11.84 | % | 12.17 | % | ||||||||||
| Total risk-based |
17.69 | % | 17.99 | % | 15.58 | % | 12.78 | % | 13.22 | % | ||||||||||
| Bank: Leverage |
12.27 | % | 11.77 | % | 12.43 | % | 10.36 | % | 10.55 | % | ||||||||||
| Tier I risk-based |
16.00 | % | 16.02 | % | 14.10 | % | 11.41 | % | 11.49 | % | ||||||||||
| Total risk-based |
17.27 | % | 17.29 | % | 15.34 | % | 12.34 | % | 12.54 | % | ||||||||||
| Asset Quality Data: |
||||||||||||||||||||
| Nonaccrual loans |
$ | 43,803 | $ | 51,674 | $ | 37,580 | $ | 16,592 | $ | 3,271 | ||||||||||
| Loans 90 days or more past due and still accruing |
— | — | — | — | — | |||||||||||||||
| Total nonperforming loans |
43,803 | 51,674 | 37,580 | 16,592 | 3,271 | |||||||||||||||
| Other real estate owned |
1,581 | 2,044 | 2,969 | — | — | |||||||||||||||
| Restructured loans (accruing) |
35,103 | 64,341 | 3,256 | 765 | 298 | |||||||||||||||
| Total nonperforming assets |
$ | 80,487 | $ | 118,059 | $ | 43,805 | $ | 17,357 | $ | 3,569 | ||||||||||
| Asset Quality Ratios (8): |
||||||||||||||||||||
| Nonperforming loans to gross loans |
2.05 | % | 2.34 | % | 1.79 | % | 0.83 | % | 0.19 | % | ||||||||||
| Nonperforming assets to total assets |
2.72 | % | 3.66 | % | 1.64 | % | 0.72 | % | 0.17 | % | ||||||||||
| Allowance for loan losses to gross loans |
2.92 | % | 2.69 | % | 2.07 | % | 1.00 | % | 1.11 | % | ||||||||||
| Allowance for loan losses to nonperforming loans |
142 | % | 115 | % | 116 | % | 121 | % | 584 | % | ||||||||||
| Net charge-offs to average gross loans |
3.76 | % | 2.12 | % | 1.22 | % | 0.35 | % | 0.14 | % | ||||||||||
| (1) | Net income (loss) divided by the average assets |
| (2) | Net income (loss) divided by the average stockholders’ equity |
| (3) | Difference between the average yield on interest-earning assets and the average rate paid on interest-bearing liabilities |
| (4) | Net interest income expressed as a percentage of average interest-earning assets |
| (5) | Interest income divided by the average interest-earning assets |
| (6) | Interest expense divided by the average interest-bearing liabilities |
| (7) | Noninterest expense divided by the sum of net interest income plus noninterest income |
| (8) | Excluding guaranteed portion of delinquent SBA loans. |
| Item 7. | MANAGEMENT’S DISCUSSION AND ANALYSIS OF FINANCIAL CONDITION AND RESULTS OF OPERATIONS |
You should read the following discussion and analysis of our financial condition and results of operations together with our Consolidated Financial Statements and accompanying notes presented elsewhere in this Report. This discussion and analysis contains forward-looking statements that involve risks, uncertainties and assumptions. Our actual results may differ materially from those anticipated in these forward-looking statements as a result of many factors, including those set forth under Item 1A “Risk Factors” and elsewhere in this Report.
Overview
Nara Bancorp, Inc. is a bank holding company headquartered in Los Angeles, California. We offer a full range of commercial banking and consumer deposit products through our wholly owned subsidiary, Nara Bank, a California state-chartered bank. Nara Bank primarily focuses its business in Korean-American communities in California, in the New York City metropolitan area, and New Jersey. We offer our banking services through our network of 23 banking offices in California, the New York metropolitan area and New Jersey and one loan production office located in Dallas, Texas, to our customers who typically are small- to medium-sized businesses in our market areas. We accept deposits and originate a variety of loans including commercial business loans, commercial real estate loans, trade finance and SBA loans. We have discontinued origination of consumer loans, but continue to service such loans in our portfolio.
33
Table of Contents
Our principal business involves earning interest on loans and investment securities that are funded by customer deposits and other borrowings. Our operating income and net income are derived primarily from the difference between interest income received from interest-earning assets and interest expense paid on interest-bearing liabilities and, to a lesser extent, from fees received in connection with servicing loan and deposit accounts and income from the sale of SBA loans. Our major expenses are the interest we pay on deposits and borrowings, provisions for loan losses and general operating expenses, which primarily consist of salaries and employee benefits and occupancy costs. Interest rates are highly sensitive to many factors that are beyond our control, such as changes in the national economy and in the related monetary policies of the Board of Governors of the Federal Reserve System, inflation, unemployment, consumer spending and political events. We cannot predict the impact that these factors and future changes in domestic and foreign economic and political conditions might have on our performance.
We have a significant business and geographic concentration in the Korean-American communities in California, the New York City metropolitan area and New Jersey and our results are affected by economic conditions in these areas and in South Korea. A further decline in economic and business conditions in our market areas and in South Korea may have a material impact on the quality of our loan portfolio or the demand for our products and services, which in turn may have a material adverse effect on our results of operations.
On December 9, 2010, we entered into a definitive agreement to merge with Center Financial in an all stock transaction valued at $285.7 million, or approximately $7.16 per Center Financial share based on the closing price on December 8, 2010. As of February 17, 2011, the transaction was valued at $314.1 million, or approximately $7.87 per Center Financial share. The boards of directors of both companies each unanimously approved the Center Merger. While there can be no assurance as to the exact timing, or that the Center Merger will be completed at all, we are working to complete the Center Merger in the second half of 2011. The consummation of the Center Merger is subject to regulatory approval, the approval of the shareholders of both Nara Bancorp and Center Financial, and other customary closing conditions.
Upon consummation of the Center Merger, each share of common stock of Center Financial issued and outstanding immediately prior to the effective time of the Center Merger (the “Effective Time”) will be converted into and become exchangeable for 0.7804 of a share of common stock of Nara Bancorp, subject to the payment of cash in lieu of the issuance of fractional shares. Based on the number of shares Center Financial common stock outstanding on the date of the Merger Agreement and not including the effect of outstanding in-the-money options, this will result in approximately 31.1 million Nara Bancorp shares being exchanged for approximately 39.9 million outstanding Center Financial shares, subject to adjustment in certain limited circumstances. Nara Bancorp shareholders will own 55% of the combined company and Center Financial shareholders will own 45%.
We cannot assure you that the Center Merger will be consummated as scheduled, or at all. See “Risk Factors —Risks Relating to the Center Merger” for a description of risks relating to the Center Merger.
The board of directors of Nara Bancorp and the Bank adopted a revised joint Board resolution (the “Revised Resolution”) at the request of the FRB and DFI on December 8, 2010. The Revised Resolution replaces the joint Resolution previously adopted at the request of the FRB and DFI on December 29, 2009and requires us to update and submit capital, strategic, earnings improvement, and liquidity and funds management plans to the FRB and DFI. We have submitted all required plans, which cover: strategic planning; earnings improvement; governance and board oversight; liquidity and funds management; and, capital in accordance with the Revised Resolution’s timing requirements. The Revised Resolution continues to prohibit us from declaring or paying dividends without the prior written approval of the FRB and the DFI.
The plans that have been submitted pursuant to the Revised Resolution are currently being reviewed by the FRB and DFI. Failure to comply with those plans or revised plan if the initial plans are not accepted by the FRB and DFI or to comply with the other provisions of the Revised Resolution could result in more formal regulatory
34
Table of Contents
action being taken with respect to the Bank or Nara Bancorp. In addition, the adoption of the Revised Resolution does not preclude any other regulatory action being taken with respect to the Bank or Nara Bancorp.
Critical Accounting Policies
Our financial statements are prepared in accordance with accounting principles generally accepted in the United States of America and general practices within the banking industry. The financial information contained within these statements is, to a significant extent, financial information that is based on approximate measures of the financial effects of transactions and events that have already occurred. All of our significant accounting policies are described in Note 1 of our Consolidated Financial Statements presented elsewhere herein and are essential to understanding Management’s Discussion and Analysis of Financial Condition and Results of Operations. GAAP requires management to make estimates and judgments that affect the reported amounts of assets and liabilities, revenues and expenses, and related disclosures of contingent assets and liabilities at the date of our financial statements. Actual results may differ from these estimates under different assumptions or conditions.
The following is a summary of the more judgmental and complex accounting estimates and principles affecting the financial condition and results reported in our financial statements. In each area, we have identified the variables we believe to be the most important in the estimation process. We use the best information available to us to make the estimations necessary to value the related assets and liabilities in each of these areas.
Accounting for the allowance for loan losses involves significant judgments and assumptions by management, which has a material impact on the carrying value of net loans. The judgments and assumptions used by management are based on historical data and management’s analysis of other qualitative factors, including the current economic environment as described under “Financial Condition—Allowance for Loan Losses” below.
We evaluate securities for other-than-temporary impairment on at least a quarterly basis, and more frequently when economic or market concerns warrant such evaluation. Consideration is given to the financial condition and near-term prospects of the issuer; the length of time and the extent to which the fair value has been less than cost, and our intention to sell, or it is more likely than not that we will be required to sell, a security in an unrealized loss position before recovery of its amortized cost basis. In analyzing an issuer’s financial condition, we consider whether the securities are issued by the federal government or its agencies, whether downgrades by bond rating agencies have occurred, and the results of reviews of the issuer’s financial condition. We do not believe that we had any investment securities available for sale with unrealized losses that would be deemed to be “other-than-temporarily” impaired as of December 31, 2010. Investment securities are discussed in more detail under “Financial Condition—Investment Securities Portfolios” below.
Certain SBA loans that we have the intent to sell prior to maturity are designated as held for sale at origination and are recorded at the lower of cost or fair value, on an aggregate basis. A valuation allowance is established if the aggregate fair value of such loans is lower than their cost, and operations are charged or credited for valuation adjustments. A portion of the premium on sale of SBA loans is recognized as other operating income at the time of the sale. The remaining portion of the premium (relating to the portion of the loan retained) is deferred and amortized over the remaining life of the loan as an adjustment to yield. Servicing assets are recognized when loans are sold with servicing retained. Servicing assets are recorded based on the present value of the contractually specified servicing fee, net of servicing costs, over the estimated life of the loan, using a discount rate based on the related note rate plus 1% to 2%. The market rate is used to determine servicing costs. Servicing assets are amortized in proportion to and over the period of estimated future servicing income. Management periodically evaluates the servicing asset for impairment, which is the amount, if any, by which the carrying value of the servicing asset exceeds the relative fair value of the servicing asset. Impairment, if it occurs, is recognized as a write down or charge-off in the period of impairment.
35
Table of Contents
The provision for income taxes is based on income reported for financial statement purposes, and differs from the amount of taxes currently payable, since certain income and expense items are reported for financial statement purposes in different periods than those for tax reporting purposes. Taxes are discussed in more detail in Note 9 to our Consolidated Financial Statements presented elsewhere herein. Accrued taxes represent the net estimated amount due or to be received from taxing authorities. In estimating accrued taxes, we assess the relative merits and risks of the appropriate tax treatment of transactions taking into account statutory, judicial, and regulatory guidance in the context of our tax position. We account for income taxes using the asset and liability approach, the objective of which is to establish deferred tax assets and liabilities for the temporary differences between the financial reporting basis and the tax basis of our assets and liabilities at enacted tax rates expected to be in effect when such amounts are realized or settled. Deferred tax assets are reduced by a valuation allowance when, in the opinion of management, it is more likely than not that some portion, or all, of the deferred tax asset will not be realized. In assessing the realization of deferred tax assets, management evaluates both positive and negative evidence, including the existence of any cumulative losses in the current year and the prior two years, the amount of taxes paid in available carry-back years, the forecasts of future income and taxable income, applicable tax planning strategies, and assessments of current and future economic and business conditions. This analysis is updated quarterly and adjusted as necessary.
Results of Operations
General
Our most significant source of income is net interest income, which is the difference between our interest income and our interest expense. Generally, interest income is generated from the loans we extend to our customers and investments, and interest expense is generated from interest-bearing deposits our customers have with us and borrowings that we may have, such as Federal Home Loan Bank of San Francisco borrowings and subordinated debentures. Our ability to generate profitable levels of net interest income is largely dependent on our ability to manage the levels of interest earning assets and interest-bearing liabilities, and the rates received or paid on them, as well as our ability to maintain sound asset quality and appropriate levels of capital and liquidity. As mentioned above, interest income and interest expense may fluctuate based on factors beyond our control, such as economic or political conditions.
We attempt to minimize the effect of interest rate fluctuations on net interest margin by monitoring our interest-sensitive assets and our interest-sensitive liabilities. Net interest income can be affected by a change in the composition of assets and liabilities, such as replacing higher yielding loans with a like amount of lower yielding investment securities. Changes in the level of nonaccrual loans and changes in volume and interest rates can also affect net interest income. Volume changes are caused by differences in the level of interest-earning assets and interest-bearing liabilities. Interest rate changes result from differences in yields earned on assets and rates paid on liabilities.
The other significant source of our income is non-interest income including service charges and fees on deposit accounts, fees from trade finance activities and the issuance of letters of credit, and net gains on sale of loans that were held for sale and investment securities available for sale. Our non-interest income can be reduced by net losses on sales of other real estate owned and charges for other than temporary impairment on investment securities and derivative instruments.
In addition to interest expense, our income is impacted by provisions for loan losses, and non-interest expenses, primarily salaries and benefits and occupancy expense.
Net Income
Our net income (loss) available to common stockholders was ($11.5 million) for 2010 compared to ($10.0 million) for 2009 and $2.3 million for 2008. Our earnings (loss) per common share based on fully diluted shares
36
Table of Contents
were ($0.30), ($0.35) and $0.09 for 2010, 2009 and 2008, respectively. The return on average assets was -0.24%, -0.19% and 0.11% and the return on average stockholders’ equity was -1.99%, -1.88% and 1.15% for these same periods.
The decline in earnings for 2010 was primarily due to increases in loan loss provisions and non-interest expense, partially offset by increases in net interest margin and non-interest income. During 2009, net income decreased as compared with 2008 primarily due to increases in loan loss provisions, non-interest expense and dividends and discount accretion on preferred stock and decrease in net interest income due to compression in our net interest margin, partially offset by an increase in non-interest income and income tax benefits.
Operations Summary
| Year Ended December 31, | ||||||||||||||||||||||||||||
| Increase (Decrease) |
Increase (Decrease) |
|||||||||||||||||||||||||||
| (Dollars in thousands) | 2010 | Amount | % | 2009 | Amount | % | 2008 | |||||||||||||||||||||
| Interest income |
$ | 150,436 | ($ | 7,609 | ) | (5 | )% | $ | 158,045 | ($ | 8,883 | ) | (5 | )% | $ | 166,928 | ||||||||||||
| Interest expense |
42,052 | (23,647 | ) | (36 | )% | 65,699 | (5,008 | ) | (7 | )% | 70,707 | |||||||||||||||||
| Net interest income |
108,384 | 16,038 | 17 | % | 92,346 | (3,875 | ) | (4 | )% | 96,221 | ||||||||||||||||||
| Provision for loan losses |
84,630 | 23,607 | 39 | % | 61,023 | 12,198 | 25 | % | 48,825 | |||||||||||||||||||
| Non-interest income |
24,481 | 6,013 | 33 | % | 18,468 | 4,475 | 32 | % | 13,993 | |||||||||||||||||||
| Non-interest expense |
63,374 | 1,661 | 3 | % | 61,713 | 4,704 | 8 | % | 57,009 | |||||||||||||||||||
| Income before income tax provision |
(15,139 | ) | (3,217 | ) | (27 | )% | (11,922 | ) | (16,302 | ) | (372 | )% | 4,380 | |||||||||||||||
| Income tax provision |
(7,900 | ) | (1,701 | ) | (27 | )% | (6,199 | ) | (7,824 | ) | (481 | )% | 1,625 | |||||||||||||||
| Net income |
$ | (7,239 | ) | ($ | 1,516 | ) | (26 | )% | $ | (5,723 | ) | ($ | 8,478 | ) | (308 | )% | $ | 2,755 | ||||||||||
Net Interest Margin and Net Interest Rate Spread
We analyze our earnings performance using, among other measures, the net interest spread and net interest margin. The net interest spread represents the difference between the average yield on interest-earning assets and average rate paid on interest-bearing liabilities. Net interest income, when expressed as a percentage of average total interest-earning assets, is referred to as the net interest margin. Our net interest margin is affected by changes in the yields earned on assets and rates paid on liabilities, as well as the ratio of the amounts of interest-earning assets to interest-bearing liabilities.
Interest rates charged on our loans are affected principally by the demand for such loans, the supply of money available for lending purposes, and other competitive factors. These factors are in turn affected by general economic conditions and other factors including those beyond our control, such as federal economic policies, the general supply of money in the economy, legislative tax policies, governmental budgetary matters, and the actions of the Federal Reserve Board. The table below presents the average yield on each category of interest-earning assets, the average rate paid on each category of interest-bearing liabilities, and the resulting net interest spread and net interest margin for each year in the three-year period ended December 31, 2010.
37
Table of Contents
Average Balance Sheet and Analysis of Net Interest Income
| Year Ended December 31, | ||||||||||||||||||||||||||||||||||||
| 2010 | 2009 | 2008 | ||||||||||||||||||||||||||||||||||
| Average Balance |
Interest Income/ Expense |
Average Yield/ Rate |
Average Balance |
Interest Income/ Expense |
Average Yield/ Rate |
Average Balance |
Interest Income/ Expense |
Average Yield/ Rate |
||||||||||||||||||||||||||||
| (Dollars in thousands) | ||||||||||||||||||||||||||||||||||||
| INTEREST-EARNING ASSETS: |
||||||||||||||||||||||||||||||||||||
| Loans(1)(2)(3) |
$ | 2,173,840 | $ | 134,390 | 6.18 | % | $ | 2,124,615 | $ | 131,416 | 6.19 | % | $ | 2,089,803 | $ | 151,172 | 7.23 | % | ||||||||||||||||||
| Securities(3) |
516,460 | 15,141 | 2.93 | % | 619,594 | 25,742 | 4.15 | % | 298,886 | 14,416 | 4.82 | % | ||||||||||||||||||||||||
| Other investments |
192,459 | 856 | 0.44 | % | 171,270 | 680 | 0.40 | % | 23,498 | 1,010 | 4.30 | % | ||||||||||||||||||||||||
| Federal funds sold |
6,082 | 49 | 0.81 | % | 14,806 | 207 | 1.40 | % | 16,816 | 330 | 1.96 | % | ||||||||||||||||||||||||
| Total interest-earning assets |
2,888,841 | 150,436 | 5.21 | % | 2,930,285 | 158,045 | 5.39 | % | 2,429,003 | 166,928 | 6.87 | % | ||||||||||||||||||||||||
| Non-interest earning assets: |
||||||||||||||||||||||||||||||||||||
| Cash and due from bank |
29,844 | 71,025 | 33,376 | |||||||||||||||||||||||||||||||||
| Premises and equipment, net |
11,082 | 11,585 | 11,674 | |||||||||||||||||||||||||||||||||
| Accrued interest receivable |
9,560 | 10,246 | 8,781 | |||||||||||||||||||||||||||||||||
| Intangible assets |
3,312 | 3,857 | 4,587 | |||||||||||||||||||||||||||||||||
| Other assets |
64,655 | 11,971 | 57,246 | |||||||||||||||||||||||||||||||||
| Total non-interest earning assets |
118,453 | 108,684 | 115,664 | |||||||||||||||||||||||||||||||||
| Total assets |
$ | 3,007,294 | $ | 3,038,969 | $ | 2,544,667 | ||||||||||||||||||||||||||||||
| INTEREST-BEARING LIABILITIES: |
||||||||||||||||||||||||||||||||||||
| Deposits: |
||||||||||||||||||||||||||||||||||||
| Demand, interest-bearing |
$ | 608,051 | 6,374 | 1.05 | % | $ | 467,764 | 8,948 | 1.91 | % | $ | 280,055 | 8,264 | 2.95 | % | |||||||||||||||||||||
| Savings |
135,008 | 3,274 | 2.43 | % | 125,877 | 3,948 | 3.14 | % | 133,791 | 4,920 | 3.68 | % | ||||||||||||||||||||||||
| Time certificates |
1,118,383 | 18,234 | 1.63 | % | 1,397,419 | 37,740 | 2.70 | % | 1,113,667 | 40,896 | 3.67 | % | ||||||||||||||||||||||||
| FHLB advances |
353,384 | 12,099 | 3.42 | % | 356,528 | 13,041 | 3.66 | % | 372,142 | 13,932 | 3.74 | % | ||||||||||||||||||||||||
| Other borrowings |
42,895 | 2,071 | 4.83 | % | 37,883 | 2,022 | 5.34 | % | 37,683 | 2,695 | 7.15 | % | ||||||||||||||||||||||||
| Total interest-bearing liabilities |
2,257,721 | 42,052 | 1.86 | % | 2,385,471 | 65,699 | 2.75 | % | 1,937,338 | 70,707 | 3.65 | % | ||||||||||||||||||||||||
| Non-interest bearing liabilities and equity |
||||||||||||||||||||||||||||||||||||
| Demand deposits |
352,498 | 300,286 | 328,116 | |||||||||||||||||||||||||||||||||
| Other liabilities |
32,916 | 48,442 | 40,413 | |||||||||||||||||||||||||||||||||
| Stockholders’ equity |
364,159 | 304,770 | 238,800 | |||||||||||||||||||||||||||||||||
| Total liabilities and stockholders’ equity |
$ | 3,007,294 | $ | 3,038,969 | $ | 2,544,667 | ||||||||||||||||||||||||||||||
| NET INTEREST INCOME AND YIELD: |
|
|||||||||||||||||||||||||||||||||||
| Net interest income |
$ | 108,384 | $ | 92,346 | $ | 96,221 | ||||||||||||||||||||||||||||||
| Net interest margin |
3.75 | % | 3.15 | % | 3.96 | % | ||||||||||||||||||||||||||||||
| Net interest margin, excluding non-accrual interest |
3.80 | % | 3.20 | % | 3.99 | % | ||||||||||||||||||||||||||||||
| Net interest margin, excluding non-accrual interest and loan prepayment fee income |
3.78 | % | 3.18 | % | 3.92 | % | ||||||||||||||||||||||||||||||
| Net interest spread(4) |
3.34 | % | 2.64 | % | 3.22 | % | ||||||||||||||||||||||||||||||
| Net interest spread(5) |
3.60 | % | 2.94 | % | 3.75 | % | ||||||||||||||||||||||||||||||
| Cost of funds(6) |
1.61 | % | 2.45 | % | 3.12 | % | ||||||||||||||||||||||||||||||
| (1) | Interest income on loans includes amortization of loan fees and net interest settlements from interest rate swaps and prepayment fees received on loan pay-offs. See the table below for detail. The average balance of loans is net of deferred loan fees. |
| Year ended December 31, |
Loan Fees | Deferred (Fees) cost |
Loan prepayment fee income |
Non-accrual Loan Income(expense) |
||||||||||||
| (In thousands) | ||||||||||||||||
| 2010 |
$ | 1,855 | $ | (2,261 | ) | $ | 525 | $ | (1,415 | ) | ||||||
| 2009 |
$ | 1,311 | $ | (2,343 | ) | $ | 632 | $ | (1,470 | ) | ||||||
| 2008 |
$ | 1,556 | $ | (1,505 | ) | $ | 1,668 | $ | (689 | ) | ||||||
38
Table of Contents
| (2) | Average balances of loans are net of deferred loan fees and costs and include non-accrual loans and loans held for sale, but excludes the guaranteed portion of delinquent SBA loans. |
| (3) | Interest income and yields are not presented on a tax-equivalent basis. |
| (4) | Interest on interest-earning assets minus interest on interest-bearing liabilities |
| (5) | Interest on interest-earning assets minus interest on interest-bearing liabilities and non-interest bearing deposits |
| (6) | Interest on interest-bearing liabilities and non-interest bearing deposits |
The following table illustrates changes in interest income (including loan fees) and interest expense and the amounts of such changes attributable to variations in interest rates and volumes for the period indicated. The variances attributable to simultaneous volume and rate changes have been allocated to the “change due to volume” and the “change due to rate” categories in proportion to the relationship of the absolute dollar amounts attributable solely to the change in volume and to the change in rate.
| Year Ended December 31, | ||||||||||||||||||||||||
| 2010 compared to 2009 | 2009 compared to 2008 | |||||||||||||||||||||||
| Net Increase (Decrease) |
Change due to | Net Increase (Decrease) |
Change due to | |||||||||||||||||||||
| Rate | Volume | Rate | Volume | |||||||||||||||||||||
| (In thousands) | ||||||||||||||||||||||||
| INTEREST INCOME: |
||||||||||||||||||||||||
| Interest and fees on loans |
$ | 2,974 | $ | (69 | ) | $ | 3,043 | $ | (19,756 | ) | $ | (22,237 | ) | $ | 2,481 | |||||||||
| Interest on other investments |
176 | 87 | 89 | (330 | ) | (1,644 | ) | 1,314 | ||||||||||||||||
| Interest on securities |
(10,601 | ) | (6,772 | ) | (3,829 | ) | 11,326 | (2,244 | ) | 13,570 | ||||||||||||||
| Interest on federal funds sold |
(158 | ) | (66 | ) | (92 | ) | (123 | ) | (87 | ) | (36 | ) | ||||||||||||
| TOTAL INTEREST INCOME |
$ | (7,609 | ) | $ | (6,820 | ) | $ | (789 | ) | $ | (8,883 | ) | $ | (26,212 | ) | $ | 17,329 | |||||||
| INTEREST EXPENSE: |
||||||||||||||||||||||||
| Interest on demand deposits |
$ | (2,574 | ) | $ | (4,774 | ) | $ | 2,200 | $ | 684 | $ | (3,577 | ) | $ | 4,261 | |||||||||
| Interest on savings |
(674 | ) | (945 | ) | 271 | (972 | ) | (693 | ) | (279 | ) | |||||||||||||
| Interest on time certificates of deposit |
(19,506 | ) | (12,971 | ) | (6,535 | ) | (3,156 | ) | (12,224 | ) | 9,068 | |||||||||||||
| Interest on FHLB |
(942 | ) | (828 | ) | (114 | ) | (891 | ) | (315 | ) | (576 | ) | ||||||||||||
| Interest on other borrowings |
49 | (204 | ) | 253 | (673 | ) | (687 | ) | 14 | |||||||||||||||
| TOTAL INTEREST EXPENSE |
$ | (23,647 | ) | $ | (19,722 | ) | $ | (3,925 | ) | $ | (5,008 | ) | $ | (17,496 | ) | $ | 12,488 | |||||||
| NET INTEREST INCOME |
$ | 16,038 | $ | 12,902 | $ | 3,136 | $ | (3,875 | ) | $ | (8,716 | ) | $ | 4,841 | ||||||||||
Net Interest Income and Net Interest Margin
Net interest income was $108.4 million for 2010, compared to $92.3 million for 2009 and $96.2 million for 2008. The net interest margin was 3.75% for 2010 compared to 3.15% for 2009 and 3.96% for 2008. Interest income reversed for non-accrual loans (net of income recognized) was $1.4 million for 2010, compared to $1.5 million for 2009 and $689 thousand for 2008. Excluding this effect, the net interest margin for 2010, 2009 and 2008 was 3.80%, 3.20% and 3.99%, respectively.
Comparison of 2010 with 2009
Net interest income increased $16.0 million, or 17%, during 2010. The increase in net interest income was due to the increase in the net interest margin. The cost of deposits decreased during 2010 due to the decrease in the rates paid on certificates of deposit upon renewal and on money market accounts as a result of the decline in market interest rates. There was no change to the prime rate during 2010.
Comparison of 2009 with 2008
Net interest income decreased $3.9 million, or 4%, during 2009. The decline in net interest income was due to the decline in the net interest margin, as well as a significant shift in asset allocation from loans receivable to
39
Table of Contents
liquid assets and investment securities with lower yields. The net interest margin was lower during 2009 primarily due to the lag effect of deposit pricing. There was no change to the prime rate during 2009.
Interest Income
Interest income was $150.4 million for 2010, compared to $158.0 million for 2009 and $166.9 million for 2008. The yield on average interest-earning assets was 5.21% for 2010, compared to 5.39% for 2009 and 6.87% for 2008.
Comparison of 2010 with 2009
The decrease in interest income of $7.6 million, or 5%, for 2010 compared to 2009 was primarily due to a decrease in the average yield on average interest-earning assets, particularly in investment securities. The yield on average investment securities was 2.93% for 2010, compared to 4.15% for 2009. The decrease in the average yield on investment securities was due to sale of investment securities totaling $201.8 million with an average yield of 4.89%, which was replaced by new investment securities purchased in 2010, which had lower yields than the weighted average yield of the portfolio as a result of decreases in market interest rates.
The average yield on loans for 2010 was 6.18%, compared to 6.19% for 2009. Average loans increased $49.2 million to $2.2 billion for 2010 from $2.1 billion for 2009.
Comparison of 2009 with 2008
The decrease in interest income of $8.9 million, or 5%, for 2009 compared to 2008 was primarily due to a decline in the prime rate in late 2008 to which our adjustable rate loans are tied, partially offset by a 21% growth in average interest-earning assets, mostly investment securities. Average interest earning assets increased $501 million to $2.9 billion for 2009, compared to $2.4 billion for 2008. The increase in average investment securities accounted for 64% of the increase in average interest earning assets.
The average yield on loans decreased 104 basis points to 6.19% for 2009, compared to 7.23% for 2008. Average loans increased $34.8 million to $2.1 billion for 2009 from $2.09 billion for 2008. Interest income on securities increased $11.3 million, or 79%, to $25.7 million for 2009 from $14.4 million for 2008, primarily due to the growth in the securities portfolio. The average yield on investment securities for 2009 decreased to 4.15% from 4.82% for 2008, due to new investment securities purchased in 2009, which had lower yields than the weighted average yield of the portfolio. The investment securities purchased during 2009 amounted to $768 million with an average yield of 3.80%.
Interest Expense
Deposits
Interest expense on deposits was $27.9 million for 2010 compared to $50.6 million for 2009 and $54.1 million for 2008. The average cost of total deposits was 1.26% for 2010 compared to 2.21% for 2009 and 2.91% for 2008. The average cost of interest-bearing deposits was 1.50% for 2010 compared to 2.54% for 2009 and 3.54% for 2008.
Comparison of 2010 with 2009
The decrease in interest expense on total deposits of $22.8 million, or 45%, for 2010 compared to 2009 was primarily due to the decrease in the rates paid on certificates of deposits upon renewal and on money market accounts as a result of the decline in market interest rates.
40
Table of Contents
Comparison of 2009 with 2008
The decrease in interest expense on total deposits of $3.5 million, or 6%, for 2009 compared to 2008 was due to the decrease in rates paid on deposits as we lowered the rates several times in 2009, partially offset by an increase in average interest-bearing deposits. Average interest-bearing deposits increased $463.5 million, or 30% during 2009 while average non-interest bearing deposits decreased $27.8 million, or 8%, during the same period.
Borrowings
Borrowings include borrowings from the FHLB, the FRB, federal funds purchased and subordinated debentures. As part of our asset liability management, we utilize FHLB borrowings to supplement our deposit source of funds. Therefore, there may be fluctuations in these balances depending on the short-term liquidity and longer-term financing needs of the Bank.
Average FHLB and other borrowings was $396.3 million in 2010, compared to $394.4 million in 2009 and $409.8 million in 2008. Interest expense on FHLB borrowings was $12.1 million for 2010, compared to $13.0 million for 2009 and $13.9 million for 2008. The average cost of those borrowings was 3.42% for 2010, compared to 3.66% for 2009 and 3.74% for 2008. Interest expense on subordinated debentures was $1.9 million for 2010, compared to $2.0 million for 2009 and $2.7 million for 2008.
The average cost of subordinated debentures, was 4.71% for 2010, compared to 5.34% for 2009 and 7.15% for 2008. The fluctuation in the average cost of other borrowings was due to changes in the 3-month LIBOR, to which all but one of our issues of subordinated debentures are tied. For 2010, the 3-month LIBOR average was 0.34% compared to 0.69% and 2.93% for 2009 and 2008, respectively.
Provision for Loan Losses
The provision for loan losses reflects our judgment of the current period cost associated with credit risk inherent in our loan portfolio. The loan loss provision for each period is dependent upon many factors, including loan growth, net charge-offs, changes in the composition of the loan portfolio, delinquencies, assessments by management, third parties’ and regulators’ examination of the loan portfolio, the value of the underlying collateral on problem loans and the general economic conditions in our market areas. Specifically, the provision for loan losses represents the amount charged against current period earnings to achieve an allowance for loan losses that, in our judgment, is adequate to absorb probable incurred losses inherent in our loan portfolio. Periodic fluctuations in the provision for loan losses result from management’s assessment of the adequacy of the allowance for loan losses; however, actual loan losses may vary in material respects from current estimates. If the allowance for loan losses is inadequate, it may have a material adverse effect on our financial condition.
Comparison of 2010 with 2009
The provision for loan losses was $84.6 million for 2010, an increase of $23.6 million, or 39%, from $61.0 million for 2009. The increase is primarily due to an additional $26.3 million of charge-offs taken on over $60 million of problem loans that were transferred to loans held for sale at June 30, 2010 and sold in a bulk sale in the third quarter 2010. Net charge-offs increased to $81.7 million for 2010, compared to $45.0 million for 2009. The increase in net charge-offs was mostly due to an increase in partial charge-offs on impaired loans resulting primarily from declines in collateral values on collateral dependent loans as well as the charge-offs associated with the loans transferred to loans held for sale. Total classified loans decreased to $136.0 million at December 31, 2010, compared to $157.2 million at December 31, 2009, primarily due to $115 million of problem loans sold during the year in which the majority were classified as well as the charge-off of classified loans, offset by $131.0 million in additional classified credits during the year.
Comparison of 2009 with 2008
The provision for loan losses was $61.0 million for 2009, an increase of $12.2 million, or 25%, from $48.8 million for 2008. The increase is primarily due to higher net charge-offs, an increase in loss migration factors
41
Table of Contents
based on continued deterioration in the portfolio and increasing Watch List loans, as well as changes in qualitative factors that may adversely affect the loan portfolio. Net charge-offs increased to $45.0 million for 2009, compared to $25.4 million for 2008. The increase in net charge-offs was mostly due to an increase in partial charge-offs on impaired loans resulting primarily from declines in collateral values on collateral dependent loans. Total classified loans increased significantly to $157.2 million at December 31, 2009, compared to $65.5 million at December 31, 2008, partially due to the increase in Troubled Debt Restructured loans.
See “Financial Condition—Allowance for Loan Losses” for a description of our methodology for determining the allowance for loan losses.
Non-interest Income
Non-interest income was $24.5 million for 2010, compared to $18.5 million for 2009 and $14.0 million for 2008.
Comparison of 2010 with 2009
Service charges on deposit accounts decreased $320 thousand, or 5%, to $6.5 million for 2010 from $6.8 million for 2009. The decrease was primarily due to overdraft, or non-sufficient funds (“NSF”) charges assessed on deposit customers, which decreased $299 thousand, or 6%, to $4.8 million for 2010 from $5.1 million for 2009 as the volume of accounts incurring on NSF charge declined. Net gains on sales of SBA loans increased $706 thousand, or 102%, to $1.4 million in 2010 from $694 thousand in 2009. Total SBA loan originations during 2010 increased $43.4 million, or 386% to $54.6 million compared to $11.2 million for 2009 due to the recovery of the SBA secondary market. Sales of SBA loans for 2010 was $27.4 million compared to $11.0 million for 2009. The increase in net gains on sales of SBA loans was also due to the increase in premium paid. The average premium increased to 9.38% for 2010 compared to 6.14% for 2009. Other loans sold in 2010 and 2009 were $77.2 million and $13.7 million, respectively. Net gains on sales of other loans increased $3.6 million, or 500%, to $4.4 million for 2010 from $728 thousand for 2009. The increase in net gains on sales of other loans was due to the sale of problem assets of $61.1 million, which had been written down to estimated market value at June 30, 2010, but which resulted in a net gain of $3.7 million during third quarter of 2010.
Net gains on sales of securities available-for-sale increased $2.0 million, or 45%, to $6.4 million for 2010 from $4.4 million for 2009. A total of $201.8 million in available-for-sale investment securities were sold during 2010 as part of the rebalancing of duration and mix of the investment securities portfolio. Net losses on sales of other real estate owned (“OREO”) increased $285 thousand, or 89%, to ($605 thousand) for 2010 from ($320 thousand) for 2009. We sold 13 properties during 2010 compared to 11 properties in 2009.
Comparison of 2009 with 2008
Service charges on deposit accounts decreased $595 thousand, or 8%, to $6.8 million for 2009 from $7.4 million for 2008. The decrease was primarily due to NSF charges, which decreased $421 thousand, or 8%, to $5.1 million for 2009 from $5.5 million for 2008 due to lower volume of NSF charges. Net gains on sales of SBA loans decreased $906 thousand, or 57%, to $694 thousand in 2009 from $1.6 million in 2008. The origination of SBA loans declined significantly starting in the second quarter of 2008 due to the tightening of our underwriting standards and decreases in business sales transactions due to the slowdown in the economy. Total SBA loan originations during 2009 were $11.2 million compared to $49.2 million for 2008. Sales of SBA loans during 2009 also decreased to $11.0 million compared to $42.3 million for 2008. The decrease in net gains on sales of SBA loans was partially offset by the increase in premium paid. The average premium increased to 6.14% for 2009 compared to 4.97% for 2008. Other loans sold in 2009 and 2008 were $13.7 million and $11.7 million, respectively. Net gains on sales of other loans increased $547 thousand, or 302%, to $728 thousand for 2009 from $181 thousand for 2008.
Net gains on sales of securities available-for-sale increased $3.6 million, or 415%, to $4.4 million for 2009 from $860 thousand for 2008. A total of $235.3 million in available-for-sale investment securities were sold
42
Table of Contents
during 2009 as part of a rebalancing of duration and mix of our investment securities portfolio. Net losses on sales of other real estate owned (“OREO”) decreased $683 thousand, or 68%, to ($320 thousand) for 2009 from ($1.0 million) for 2008. During 2009, valuation of the underlying properties upon foreclosure was closer to actual value realized upon sale of the properties. We sold eleven properties during 2009 compared to three in 2008. During the second quarter of 2008, we recognized an other than temporary impairment (“OTTI”) charge of ($1.7 million) on a non-agency asset backed security with a book value of $1.7 million. The impairment charge was due to a down grade of the security by one of the rating agencies. The security has been written down in full. We have no other non-agency asset-backed securities in the investment portfolio. This write-down adversely affected non-interest income for 2008.
A breakdown of non-interest income by category is shown below:
| Year Ended December 31, | ||||||||||||||||||||||||||||
| Increase (Decrease) |
Increase (Decrease) |
|||||||||||||||||||||||||||
| (Dollars in thousands) | 2010 | Amount | % | 2009 | Amount | % | 2008 | |||||||||||||||||||||
| Non-interest Income: |
||||||||||||||||||||||||||||
| Service charges on deposit accounts |
$ | 6,464 | $ | (320 | ) | (5 | )% | $ | 6,784 | $ | (595 | ) | (8 | )% | $ | 7,379 | ||||||||||||
| International service fees |
2,369 | 363 | 18 | 2,006 | (44 | ) | (2 | ) | 2,050 | |||||||||||||||||||
| Loan servicing fees, net |
1,836 | (30 | ) | (2 | ) | 1,866 | (191 | ) | (9 | ) | 2,057 | |||||||||||||||||
| Wire transfer fees |
1,192 | (140 | ) | (11 | ) | 1,332 | (224 | ) | (14 | ) | 1,556 | |||||||||||||||||
| Net gains on sales of SBA loans |
1,400 | 706 | 102 | 694 | (906 | ) | (57 | ) | 1,600 | |||||||||||||||||||
| Net gains on sales of other loans |
4,368 | 3,640 | 500 | 728 | 547 | 302 | 181 | |||||||||||||||||||||
| Net gains on sales of securities available for sale |
6,396 | 1,969 | 45 | 4,427 | 3,567 | 415 | 860 | |||||||||||||||||||||
| Net (loss) on sale of OREO |
(605 | ) | (285 | ) | (89 | ) | (320 | ) | 683 | 68 | (1,003 | ) | ||||||||||||||||
| Net valuation losses on interest rate swaps |
(857 | ) | (411 | ) | (92 | ) | (446 | ) | 103 | 19 | (549 | ) | ||||||||||||||||
| Other than temporary impairment |
— | — | — | — | 1,713 | 100 | (1,713 | ) | ||||||||||||||||||||
| Other income and fees |
1,918 | 521 | 37 | 1,397 | (178 | ) | (11 | ) | 1,575 | |||||||||||||||||||
| Total non-interest income |
$ | 24,481 | $ | 6,013 | 33 | % | $ | 18,468 | $ | 4,475 | 32 | % | $ | 13,993 | ||||||||||||||
Non-interest Expense
Non-interest expense was $63.4 million for 2010, compared to $61.7 million for 2009 and $57.0 million for 2008. The increases were $1.7 million, or 3% for 2010 and $4.7 million, or 8%, for 2009.
Comparison of 2010 with 2009
The increase in non-interest expense for 2010 over 2009 was primarily due to increases in furniture and equipment, credit related, and other expense, partially offset by a decrease in the FDIC insurance premium. Furniture and equipment expense increased $614 thousand, or 21% to $3.5 million for 2010 from $2.9 million for 2009. The increase was primarily due to an increase in depreciation expense for information technology equipment purchased in 2010. Credit related expenses increased $374 thousand, or 8% to $4.8 million for 2010 from $4.4 million for 2009. This increase was primarily due to an increase in loan collection related expense. Other expense increased $494 thousand, or 8% to $6.5 million for 2010 from $6.1 million for 2009. The increase was primarily due to Center merger related expenses such as investment banking and legal fees of $1.0 million, offset by a decrease in legal settlement expense of $567 thousand. The decrease in the FDIC insurance premium was due to a one-time assessment of $1.47 million paid on June 30, 2009. Excluding the one-time assessment, the FDIC insurance premium increased $1.2 million, or 32%, due to an increase in the assessment rate.
43
Table of Contents
Comparison of 2009 with 2008
The increase in non-interest expense for 2009 over 2008 was primarily due to increases in the FDIC insurance premium, credit related expenses and occupancy expense, partially offset by a decrease in salaries and employee benefits. The FDIC insurance premium increased by $3.8 million, or 270%, to $5.2 million 2009, compared to $1.4 million for 2008. The increase was due to an increase in the FDIC insurance assessment rate effective in the second quarter of 2009. In addition, a one-time special assessment fee was imposed by the FDIC on all insured depository institutions. The Bank paid $1.5 million during the second quarter of 2009 as a result of this special assessment. Credit related expenses increased $3.2 million, or 280% to $4.4 million for 2009 from $1.2 million for 2008. This increase was primarily due to a significant increase in loan collection related expense and OREO valuation allowances and related expenses. The OREO valuation allowances and related expenses increased $1.5 million to $1.7 million for 2009 from $220 thousand for 2008. Salaries and employee benefits decreased $3.5 million, or 11.9% to $25.4 million for 2009 from $28.9 million for 2008. The decrease was due to decreases in bonus expense and in the number of FTE employees. The number of FTE employees decreased to 337 at 2009 year-end compared to 366 at 2008 year-end. The increase in occupancy expense is primarily due to the opening of new branches during 2008 and 2009. We opened a branch in the Fashion District of Downtown, Los Angeles in July of 2008 and a branch in Fort Lee, New Jersey in April of 2009.
A breakdown of non-interest expense by category is provided below:
| Year Ended December 31, | ||||||||||||||||||||||||||||
| Increase (Decrease) | Increase (Decrease) | |||||||||||||||||||||||||||
| (Dollars in thousands) | 2010 | Amount | % | 2009 | Amount | % | 2008 | |||||||||||||||||||||
| Non-interest Expense: |
||||||||||||||||||||||||||||
| Salaries and employee benefits |
$ | 25,261 | $ | (176 | ) | (1 | )% | $ | 25,437 | $ | (3,450 | ) | (12 | )% | $ | 28,887 | ||||||||||||
| Occupancy |
9,767 | (151 | ) | (2 | ) | 9,918 | 786 | 9 | 9,132 | |||||||||||||||||||
| Furniture and equipment |
3,540 | 614 | 21 | 2,926 | 97 | 3 | 2,829 | |||||||||||||||||||||
| Advertising and marketing |
2,020 | 349 | 21 | 1,671 | (358 | ) | (18 | ) | 2,029 | |||||||||||||||||||
| Data processing and communications |
3,954 | 212 | 6 | 3,742 | 467 | 14 | 3,275 | |||||||||||||||||||||
| Professional fees |
2,538 | 214 | 9 | 2,324 | 363 | 19 | 1,961 | |||||||||||||||||||||
| FDIC assessment |
4,968 | (269 | ) | (5 | ) | 5,237 | 3,822 | 270 | 1,415 | |||||||||||||||||||
| Credit related expense |
4,781 | 374 | 8 | 4,407 | 3,246 | 280 | 1,161 | |||||||||||||||||||||
| Other |
6,545 | 494 | 8 | 6,051 | (269 | ) | (4 | ) | 6,320 | |||||||||||||||||||
| Total non-interest expense: |
$ | 63,374 | $ | 1,661 | 3 | % | $ | 61,713 | $ | 4,704 | 8 | % | $ | 57,009 | ||||||||||||||
Income Tax Provision
The provision (benefit) for income taxes for 2010 was ($7.9 million) compared to ($6.2 million) in 2009 and $1.6 million in 2008. The effective income tax (benefit) rate was (52%) for 2010 compared to (52%) for 2009 and 37% for 2008. The higher effective benefit tax rates during 2010 and 2009 compared to the statutory tax rate was primarily due to the impact of state taxes and tax credits in a loss year. The lower effective tax rate for 2008 was due to the lower state taxes and the greater impact of the low-income housing tax credit due to lower pre-tax income.
We are subject to U.S. federal income tax as well as income tax of the state of California and various other state income taxes. The total amount of unrecognized tax benefits was $151 thousand at January 1, 2010 and $202 thousand at December 31, 2010 and is primarily for uncertainties related to California enterprise zone loan interest deductions taken in prior years. The total amount of tax benefits that, if recognized, would favorably impact the effective tax rate was $151 thousand and $202 thousand at January 1, 2010 and December 31, 2010, respectively. The amount of unrecognized tax benefits increased due to current year accrual of $33 thousand and an additional interest accrual of $18 thousand for prior years. During the fourth quarter of 2010, the California Franchise Tax Board examined our 2007 and 2008 enterprise zone loan interest deductions and did not propose
44
Table of Contents
any adjustments that were deemed material. We recognize interest and penalties related to income tax matters in income tax expense. We had approximately $23 thousand and $11 thousand for interest and penalties accrued at December 31, 2010 and 2009, respectively.
Financial Condition
Our total assets were $2.96 billion at December 31, 2010 compared to $3.23 billion at December 31, 2009, a decrease of $264.7 million or 8%. Total assets decreased as we liquidated investment securities to fund withdrawals of high rate retail jumbo time deposits at their maturities.
Loan Portfolio
We offer various products designed to meet the credit needs of our borrowers. Our lending activities primarily consist of commercial real estate loans, commercial business loans and trade finance loans. We discontinued the origination of consumer loans; however, we continue to service the existing consumer loan portfolio, which totaled $11.3 million at December 31, 2010. During 2010, new loans originated were $376.4 million compared to $424.4 million for 2009. Gross loans outstanding (net of deferred loan fees and costs), excluding loans held for sale and the guaranteed portion of delinquent SBA loans, decreased by $74.9 million, or 3%, to $2.13 billion at December 31, 2010 compared to $2.21 billion at December 31, 2009. Average loans outstanding, as a percentage of our average total interest-earning assets, were 75% for 2010 compared to 73% for 2009. Average loans were $2.17 billion and $2.12 billion for the years ended December 31, 2010 and 2009, respectively. The increase in average loans was $49.2 million, or 2% during 2010, and $34.8 million, or 2%, during 2009. Loan growth remained concentrated in commercial real estate loans although growth slowed during 2010 due to the economy and tightening credit standards. The rates of interest charged on adjustable rate loans are set at specified spreads based on the prime lending rate and accordingly vary as the prime lending rate varies. Approximately 52% of our total loans were adjustable rate loans at December 31, 2010, compared to 48% at December 31, 2009. Approximately 30% of new loan originations were fixed rate loans for 2010 compared to 59% for 2009.
With certain exceptions, we are permitted under applicable law to make unsecured loans to single borrowers (including certain related persons and entities) in aggregate amounts of up to 15% of the sum of our total capital and our allowance for loan losses (as defined for regulatory purposes) and certain capital notes and debentures issued by us (if any). As of December 31, 2010, our lending limit was approximately $63.1 million per borrower for unsecured loans. For lending limit purposes, a secured loan is defined as a loan secured by collateral having a current fair value of at least 100% of the amount of the loan or extension of credit at all times and satisfying certain other requirements. In addition to unsecured loans, we are permitted to make such collateral-secured loans in an additional amount up to 10% (for a total of 25%) of our total capital and the allowance for loan losses for a total limit of $105.2 million to one borrower. The largest aggregate amount of loans that the Bank had outstanding to any one borrower and related entities was $33.1 million, which were performing as agreed at December 31, 2010.
45
Table of Contents
The following table shows the composition of our loan portfolio by type of loan on the dates indicated:
| December 31, | ||||||||||||||||||||||||||||||||||||||||
| (Dollars in thousands) | 2010 | 2009 | 2008 | 2007 | 2006 | |||||||||||||||||||||||||||||||||||
| Amount | % | Amount | % | Amount | % | Amount | % | Amount | % | |||||||||||||||||||||||||||||||
| Loan portfolio composition: |
||||||||||||||||||||||||||||||||||||||||
| Real estate loans: |
||||||||||||||||||||||||||||||||||||||||
| Residential |
$ | 2,263 | 0 | % | $ | 4,801 | 0 | % | $ | 5,280 | 0 | % | $ | 7,412 | 0 | % | $ | 3,217 | 0 | % | ||||||||||||||||||||
| Commercial |
1,524,650 | 71 | % | 1,595,219 | 73 | % | 1,406,068 | 67 | % | 1,300,494 | 65 | % | 1,122,816 | 66 | % | |||||||||||||||||||||||||
| Construction |
46,900 | 2 | % | 54,084 | 2 | % | 61,524 | 3 | % | 61,920 | 3 | % | 37,241 | 2 | % | |||||||||||||||||||||||||
| Total real estate loans |
1,573,813 | 73 | % | 1,654,104 | 75 | % | 1,472,872 | 70 | % | 1,369,826 | 68 | % | 1,163,274 | 68 | % | |||||||||||||||||||||||||
| Commercial business |
491,811 | 23 | % | 487,736 | 22 | % | 531,953 | 26 | % | 527,498 | 26 | % | 428,190 | 25 | % | |||||||||||||||||||||||||
| Trade finance |
57,430 | 3 | % | 51,411 | 2 | % | 66,603 | 3 | % | 78,055 | 4 | % | 76,367 | 4 | % | |||||||||||||||||||||||||
| Consumer and other |
13,268 | 1 | % | 18,035 | 1 | % | 28,520 | 1 | % | 34,809 | 2 | % | 49,201 | 3 | % | |||||||||||||||||||||||||
| Total loans outstanding |
2,136,322 | 100 | % | 2,211,286 | 100 | % | 2,099,948 | 100 | % | 2,010,188 | 100 | % | 1,717,032 | 100 | % | |||||||||||||||||||||||||
| Less: deferred loan fees |
(2,261 | ) | (2,343 | ) | (1,505 | ) | (1,459 | ) | (2,167 | ) | ||||||||||||||||||||||||||||||
| Gross loans receivable |
2,134,061 | 2,208,943 | 2,098,443 | 2,008,729 | 1,714,865 | |||||||||||||||||||||||||||||||||||
| Less: allowance for loan losses |
(62,320 | ) | (59,424 | ) | (43,419 | ) | (20,035 | ) | (19,112 | ) | ||||||||||||||||||||||||||||||
| Loans receivable, excluding guaranteed portion of delinquent SBA loans |
2,071,741 | 2,149,519 | 2,055,024 | 1,988,694 | 1,695,753 | |||||||||||||||||||||||||||||||||||
| Guaranteed portion of delinquent SBA loans |
13,684 | 12,490 | 20,911 | 4,492 | 2,367 | |||||||||||||||||||||||||||||||||||
| Loans receivable, net |
$ | 2,085,425 | $ | 2,162,009 | $ | 2,075,935 | $ | 1,993,186 | $ | 1,698,120 | ||||||||||||||||||||||||||||||
Real Estate Loans
Our real estate loans consist primarily of loans secured by deeds of trust on commercial real estate, including SBA loans secured by commercial real estate. It is our general policy to restrict commercial real estate loan amounts to 70% of the appraised value of the property at the time of loan funding. We offer both fixed and floating interest rate loans. The maturities on such loans are generally up to seven years (with payments determined on the basis of principal amortization schedules of up to 25 years and a balloon payment due at maturity). Residential real estate loans comprise less than 1% of the total loan portfolio, and are currently not being offered by the Bank. This pool of residential real estate loans is made up of loans funded in prior years that are still being serviced by the Bank. Construction loans are also a small portion of the total real estate portfolio, comprising approximately 2% of total loans outstanding. Total real estate loans, consisting primarily of commercial real estate loans, decreased $80.3 million or 4.9%, to $1.6 billion at December 31, 2010 from $1.7 billion at December 31, 2009.
Other Loans
Commercial business loans include term loans to businesses, lines of credit, trade finance facilities, and SBA loans. Business term loans are generally provided to finance business acquisitions, working capital, and/or equipment purchases. Lines of credit are generally provided to finance short-term working capital needs. Trade finance facilities are generally provided to finance import and export activities. SBA loans are provided to small businesses under the U.S. SBA guarantee program. Short-term credit facilities (payable within one year) typically provide for periodic interest payments, with principal payable at maturity. Term loans (usually 5 to 7 years) normally provide for monthly payments of both principal and interest. SBA commercial loans usually have a longer maturity (7 to 10 years). These credits are regularly reviewed on a periodic basis, and most loans are secured by business assets and/or real estate. During 2010, commercial business loans increased $4.1 million, or 0.8%, to $491.8 million at December 31, 2010 from $487.7 million at December 31, 2009. Consumer loans comprise less than 1% of the total loan portfolio. Most of our consumer loan portfolio consists of automobile loans, home equity lines and loans, and signature (unsecured) lines of credit and loans. We ceased offering auto loans in February 2007 and ceased offering home equity loans in January 2008.
46
Table of Contents
We provide lines of credit to business customers usually on an annual renewal basis. We normally do not make loan commitments in material amounts for periods in excess of one year.
The following table shows our loan commitments and letters of credit outstanding at the dates indicated:
| December 31, | ||||||||||||||||||||
| (Dollars in thousands) | 2010 | 2009 | 2008 | 2007 | 2006 | |||||||||||||||
| Commitments to extend credit |
$ | 205,752 | $ | 198,807 | $ | 200,170 | $ | 224,837 | $ | 214,685 | ||||||||||
| Standby letters of credit |
9,777 | 9,907 | 9,354 | 15,231 | 12,786 | |||||||||||||||
| Other commercial letters of credit. |
30,180 | 23,575 | 17,183 | 18,552 | 27,146 | |||||||||||||||
| $ | 245,709 | $ | 232,289 | $ | 226,707 | $ | 258,620 | $ | 254,617 | |||||||||||
Non-performing Assets
Non-performing assets consist of non-accrual loans, accruing loans that are 90 days or more past due, accruing restructured loans and OREO.
Loans are placed on non-accrual status when they become 90 days or more past due, unless the loan is both well-secured and in the process of collection. Loans may be placed on non-accrual status earlier if the full and timely collection of principal or interest becomes uncertain. When a loan is placed on non-accrual status, unpaid accrued interest is charged against interest income. Loans are charged off when the collection is determined unlikely. Loans are restructured when, for economic or legal reasons related to the borrower’s financial difficulties, the bank grants a concession to the borrower that it would not otherwise consider. OREO consists of real estate acquired by the Bank through foreclosure or similar means, including by deed from the owner in lieu of foreclosure, and is held for sale.
Non-performing assets were $80.5 million at December 31, 2010, compared to $118.1 million at December 31, 2009. The change in non-performing assets in 2010 was primarily due to decreases in restructured loans. Restructured loans as defined by FASB ASC 310-40 “Troubled Debt Restructurings by Creditors”, decreased during 2010 to $35.1 million at December 31, 2010, compared to $64.3 million at December 31, 2009. Of the $29.2 million in decreased levels of non-performing TDR’s, $13.6 million is attributable to 47 loans which were included in the bulk loan pool sale effective as of June 30, 2010.
The amount of additional interest income that the Bank would have recorded in 2010, 2009 and 2008, if non-accrual loans had been current in accordance with their original contracted terms, was $2.3 million, $3.2 million and $348 thousand, respectively. The following table illustrates the composition of non-performing assets as of the dates indicated:
| December 31, | ||||||||||||||||||||
| (Dollars in thousands) | 2010 | 2009 | 2008 | 2007 | 2006 | |||||||||||||||
| Non-accrual loans |
$ | 43,803 | $ | 51,674 | $ | 37,580 | $ | 16,592 | $ | 3,271 | ||||||||||
| Loans past due 90 days or more, still accruing |
— | — | — | — | — | |||||||||||||||
| Total nonperforming loans |
43,803 | 51,674 | 37,580 | 16,592 | 3,271 | |||||||||||||||
| Other real estate owned |
1,581 | 2,044 | 2,969 | — | — | |||||||||||||||
| Restructured loans |
35,103 | 64,341 | 3,256 | 765 | 298 | |||||||||||||||
| Total non-performing assets |
$ | 80,487 | $ | 118,059 | $ | 43,805 | $ | 17,357 | $ | 3,569 | ||||||||||
We did not have any commitments to extend additional credit on restructured loans as of December 31, 2010 or 2009.
47
Table of Contents
The following table provides information on nonaccrual loans and loans past due over 90 days still on accrual by class of loans as of December 31, 2010 and 2009:
| As of December 31, 2010 | ||||||||||||
| Non-accrual Loans* |
Loans past due 90 days or more, still accruing* |
Total nonperforming loans* |
||||||||||
| (In Thousands) | ||||||||||||
| Real estate loans: |
||||||||||||
| Residential |
$ | — | $ | — | $ | — | ||||||
| Commercial |
||||||||||||
| Retail |
1,615 | — | 1,615 | |||||||||
| Hotel & Motel |
1,187 | — | 1,187 | |||||||||
| Gas Station & Car Wash |
3,054 | — | 3,054 | |||||||||
| Mixed Use |
3,968 | — | 3,968 | |||||||||
| Industrial & Warehouse |
3,690 | — | 3,690 | |||||||||
| Other |
4,834 | — | 4,834 | |||||||||
| Construction |
8,547 | — | 8,547 | |||||||||
| Total |
26,895 | — | 26,895 | |||||||||
| Commercial business |
15,991 | — | 15,991 | |||||||||
| Trade finance |
469 | — | 469 | |||||||||
| Consumer and other |
448 | — | 448 | |||||||||
| $ | 43,803 | $ | — | $ | 43,803 | |||||||
| * | Adjustment to recorded investment is not deemed material to this presentation. |
| As of December 31, 2009 | ||||||||||||
| Non-accrual Loans* |
Loans past due 90 days or more, still accruing* |
Total nonperforming loans* |
||||||||||
| (In Thousands) | ||||||||||||
| Real estate loans: |
||||||||||||
| Residential |
$ | — | $ | — | $ | — | ||||||
| Commercial |
||||||||||||
| Retail |
6,660 | — | 6,660 | |||||||||
| Hotel & Motel |
4,489 | — | 4,489 | |||||||||
| Gas Station & Car Wash |
8,413 | — | 8,413 | |||||||||
| Mixed Use |
6,595 | — | 6,595 | |||||||||
| Industrial & Warehouse |
1,729 | — | 1,729 | |||||||||
| Other |
12,468 | — | 12,468 | |||||||||
| Construction |
— | — | — | |||||||||
| Total |
40,354 | — | 40,354 | |||||||||
| Commercial business |
10,275 | — | 10,275 | |||||||||
| Trade finance |
— | — | — | |||||||||
| Consumer and other |
1,045 | — | 1,045 | |||||||||
| $ | 51,674 | $ | — | $ | 51,674 | |||||||
| * | Adjustment to recorded investment is not deemed material to this presentation. |
48
Table of Contents
The following tables present information on nonaccrual loans by type of businesses the borrowers are engaged in as of December 31, 2010 and 2009:
| December 31, 2010 | ||||||||||||||||||||||||
| Type of Business | Real Estate and Rental and Leasing |
Retail Trade/ Wholesale Trade |
Construction | Finance and Insurance |
Other | Total | ||||||||||||||||||
| (In Thousands) | ||||||||||||||||||||||||
| Real estate loans: |
||||||||||||||||||||||||
| Residential |
$ | — | $ | — | $ | — | $ | — | $ | — | $ | — | ||||||||||||
| Commercial |
9,460 | 4,506 | 894 | — | 3,488 | 18,348 | ||||||||||||||||||
| Construction |
— | — | 8,547 | — | — | 8,547 | ||||||||||||||||||
| Total |
9,460 | 4,506 | 9,441 | — | 3,488 | 26,895 | ||||||||||||||||||
| Commercial business |
939 | 4,654 | 34 | 5,027 | 5,337 | 15,991 | ||||||||||||||||||
| Trade finance |
— | 469 | — | — | — | 469 | ||||||||||||||||||
| Consumer and other |
— | — | — | — | 448 | 448 | ||||||||||||||||||
| $ | 10,399 | $ | 9,629 | $ | 9,475 | $ | 5,027 | $ | 9,273 | $ | 43,803 | |||||||||||||
| December 31, 2009 | ||||||||||||||||||||||||
| Type of Business | Real Estate and Rental and Leasing |
Retail Trade/ Wholesale Trade |
Construction | Finance and Insurance |
Other | Total | ||||||||||||||||||
| (In Thousands) | ||||||||||||||||||||||||
| Real estate loans: |
||||||||||||||||||||||||
| Residential |
$ | — | $ | — | $ | — | $ | — | $ | — | $ | — | ||||||||||||
| Commercial |
11,145 | 9,768 | 1,702 | 1,494 | 16,245 | 40,354 | ||||||||||||||||||
| Construction |
— | — | — | — | — | — | ||||||||||||||||||
| Total |
11,145 | 9,768 | 1,702 | 1,494 | 16,245 | 40,354 | ||||||||||||||||||
| Commercial business |
1,608 | 4,988 | 318 | — | 3,361 | 10,275 | ||||||||||||||||||
| Trade finance |
— | — | — | — | — | — | ||||||||||||||||||
| Consumer and other |
— | 749 | — | — | 296 | 1,045 | ||||||||||||||||||
| $ | 12,753 | $ | 15,505 | $ | 2,020 | $ | 1,494 | $ | 19,902 | $ | 51,674 | |||||||||||||
49
Table of Contents
Maturity and Repricing of Loans
The following table illustrates the maturity distribution and repricing intervals of loans outstanding as of December 31, 2010. The table also shows the distribution of such loans between those with variable or floating interest rates and those with fixed or predetermined interest rates.
| December 31, 2010 | ||||||||||||||||
| Loans Maturing and repricing | ||||||||||||||||
| (Dollars in thousands) | ||||||||||||||||
| Within One Year |
Between One and Five Years |
After Five Years |
Total Loans Outstanding |
|||||||||||||
| Real estate loans: |
||||||||||||||||
| Residential |
$ | — | $ | 2,166 | $ | 97 | $ | 2,263 | ||||||||
| Commercial |
158,612 | 1,067,039 | 298,999 | 1,524,650 | ||||||||||||
| Construction |
32,285 | 14,615 | — | 46,900 | ||||||||||||
| Total real estate loans |
190,897 | 1,083,820 | 299,096 | 1,573,813 | ||||||||||||
| Commercial business loans |
125,344 | 299,236 | 67,231 | 491,811 | ||||||||||||
| Trade finance loans |
57,430 | — | — | 57,430 | ||||||||||||
| Consumer loans |
8,222 | 4,051 | 995 | 13,268 | ||||||||||||
| Total |
$ | 381,893 | $ | 1,387,107 | $ | 367,322 | $ | 2,136,322 | ||||||||
| Loans with fixed interest rates |
$ | 92,826 | $ | 804,103 | $ | 125,704 | $ | 1,022,633 | ||||||||
| Loans with variable interest rates without interest rate floors |
102,558 | 357,507 | 117,716 | 577,781 | ||||||||||||
| Loans with variable interest rates with interest rate floors |
186,510 | 225,496 | 123,902 | 535,908 | ||||||||||||
| Total |
$ | 381,894 | $ | 1,387,106 | $ | 367,322 | $ | 2,136,322 | ||||||||
Concentrations
Loan concentrations are considered to exist when there are significant amounts of loans to multiple borrowers engaged in similar activities, which would cause them to be similarly affected by economic or other conditions. The following table summarizes the industry concentrations exceeding 10% of our loan portfolio as of the dates indicated:
| December 31, | ||||||||||||||||||||||||||||||||||||||||
| (Dollars in thousands) | 2010 | 2009 | 2008 | 2007 | 2006 | |||||||||||||||||||||||||||||||||||
| Amount | %
of Portfolio Percent |
Amount | %
of Portfolio Percent |
Amount | %
of Portfolio Percent |
Amount | %
of Portfolio Percent |
Amount | %
of Portfolio Percent |
|||||||||||||||||||||||||||||||
| Wholesale Trade |
$ | 149,686 | 7 | % | $ | 126,017 | 6 | % | $ | 129,541 | 6 | % | $ | 196,853 | 10 | % | $ | 193,194 | 11 | % | ||||||||||||||||||||
| Retail Trade |
521,349 | 24 | % | 515,009 | 23 | % | 524,763 | 25 | % | 508,252 | 25 | % | 441,434 | 26 | % | |||||||||||||||||||||||||
| Services |
485,738 | 23 | % | 655,981 | 30 | % | 639,807 | 30 | % | 573,455 | 29 | % | 483,708 | 28 | % | |||||||||||||||||||||||||
| Finance, Insurance, Property Management |
727,767 | 34 | % | 748,264 | 34 | % | 633,572 | 30 | % | 628,683 | 31 | % | 538,062 | 31 | % | |||||||||||||||||||||||||
| Total |
$ | 1,884,540 | 88 | % | $ | 2,045,271 | 93 | % | $ | 1,927,683 | 92 | % | $ | 1,907,243 | 95 | % | $ | 1,656,398 | 96 | % | ||||||||||||||||||||
| Total Loans Outstanding |
$ | 2,136,322 | $ | 2,211,286 | $ | 2,099,948 | $ | 2,010,188 | $ | 1,717,032 | ||||||||||||||||||||||||||||||
Our lending activities are predominately in California, in the New York City metropolitan area, and New Jersey. At December 31, 2010, California represented 62% of the total loans outstanding and New York and New Jersey represented 29%. The remaining 9% of total loans outstanding represented other states. Although we have a diversified loan portfolio, a substantial portion of the loan portfolio and credit performance depends on the
50
Table of Contents
economic stability of Southern California. California has experienced significant declines in real estate values and adverse effects of the recession. California’s unemployment rate in December 2010 was approximately 12.5%. Our loan portfolio has been affected by the economy, but the impact is lessened by having most of its loans in large metropolitan California cities rather than in the outlying suburban communities that have seen higher declines in real estate values.
Allowance for Loan Losses
The Bank has implemented a multi-faceted process to identify, manage, and mitigate the credit risks that are inherent in the loan portfolio. For new loans, we fully analyze each loan application package, with experienced reviewers and approvers. In accordance with current lending approval authority guidelines, a majority of loans are approved by the Management Loan Committee (“MLC”), which is comprised of the Chief Executive Officer, Chief Credit Officer, Chief Operating Officer, and Eastern Regional Manager. For existing loans, the Bank maintains a systematic loan review program, which includes internally conducted reviews and quarterly reviews by external loan review consultants. Based on these reviews, loans are graded as to their overall credit quality, which is measured based on: the sufficiency of credit and collateral documentation; proper lien perfection; proper approval by loan committee(s); adherence to any loan agreement covenants; compliance with internal policies and procedures, and with laws and regulations; adequacy and strength of repayment sources including borrower or collateral generated cash flow; payment performance; and liquidation value of the collateral. We closely monitor loans that management has determined require further supervision because of the loan size, loan structure, and/or specific circumstances of the borrower.
When principal or interest on a loan is 90 days or more past due, a loan is normally placed on non-accrual status unless it is considered to be both well-secured and in the process of collection. Further, a loan is considered a loss in whole or in part when (1) it appears that loss exposure on the loan exceeds the collateral value for the loan, (2) servicing of the unsecured portion has been discontinued, or (3) collection is not anticipated due to the borrower’s financial condition and general economic conditions in the borrower’s industry. Any loan or portion of a loan judged by management to be uncollectible is charged against the allowance for loan losses, while any recoveries are credited to such allowance.
The allowance for loan losses was $62.3 million at December 31, 2010, compared to $59.4 million at December 31, 2009. The allowance for loan losses increased $2.9 million, or 4.9%, during 2010, primarily due to the effect of increased charge-offs on historical loss rates for loans subject to general loan loss allowances, and increased specific reserves on impaired loans. The Bank recorded provisions for loan losses of $84.6 million in 2010, compared to $61.0 million in 2009 and $48.8 million in 2008. During 2010, the Bank charged off $84.7 million in loans outstanding, and recovered $2.9 million in loans previously charged off. The increase in charge-off during 2010 included $26.3 million of additional charge-offs related to loans transferred to held-for-sale at June 30, 2010. Total Watch List loans at December 31, 2010 were $165.6 million compared to $199.9 million at December 31, 2009. The allowance for loan losses was 2.92% of gross loans at December 31, 2010, compared to 2.69% at December 31, 2009.
For loans not classified as impaired loans, general loan loss allowances are provided to cover probable and inherent losses. The allowance is determined based first on a quantitative analysis using a loss migration methodology. The loans are classified by type and loan grade, and the historical loss migration is tracked for the various stratifications. See “Financial Condition—Allowance for Loan Losses Methodology” for a detailed description of our loan loss methodology.
Impaired loans as defined by FASB ASC 310-10-35, “Accounting by Creditors for Impairment of a Loan” totaled $122.7 million and $120.5 million, respectively as of December 31, 2010 and December 31, 2009, with specific allowances of $21.1 million and $19.8 million, respectively. Management and the Loan and Credit Policy Committee of the Bank review the adequacy of the allowance for loan losses at least quarterly. Based upon these evaluations, and internal and external reviews of the overall quality of our loan portfolio, management and the LCPC believe that the allowance for loan losses was adequate to absorb estimated probable incurred losses inherent in the loan portfolio as of December 31, 2010. However, no assurances can be given that the Bank will not experience further losses in excess of the allowance, which may require additional future provisions for loan losses.
51
Table of Contents
The following table provides information on impaired loans for the periods indicated:
| As of and for the Year Ended December 31, |
||||||||
| 2010 | 2009 | |||||||
| (In Thousands) | ||||||||
| With Allocated Allowance |
||||||||
| Without charge-off |
$ | 63,944 | $ | 69,771 | ||||
| With charge-off |
4,188 | 3,385 | ||||||
| With No Allocated Allowance |
||||||||
| Without charge-off |
42,015 | 32,253 | ||||||
| With charge-off |
12,540 | 15,131 | ||||||
| Allowance on Impaired Loans |
(21,102 | ) | (19,803 | ) | ||||
| Impaired Loans, net of allowance |
$ | 101,585 | $ | 100,737 | ||||
| Average Impaired Loans |
$ | 123,242 | $ | 84,593 | ||||
The year-end impaired loans are set forth in the following table:
| As of December 31, 2010 | ||||||||||||
| Impaired Loan Balance* |
Related Allowance |
Average Balance |
||||||||||
| (In Thousands) | ||||||||||||
| With Related Allowance: |
||||||||||||
| Real Estate—Residential |
$ | — | $ | — | $ | — | ||||||
| Real Estate—Commercial |
||||||||||||
| Retail |
7,347 | (1,518 | ) | 7,498 | ||||||||
| Hotel & Motel |
5,349 | (987 | ) | 11,439 | ||||||||
| Gas Station & Car Wash |
3,142 | (1,411 | ) | 8,844 | ||||||||
| Mixed Use |
308 | (53 | ) | 2,334 | ||||||||
| Industrial & Warehouse |
7,539 | (1,729 | ) | 2,453 | ||||||||
| Other |
2,697 | (448 | ) | 5,711 | ||||||||
| Real Estate—Construction |
5,789 | (1,686 | ) | 4,027 | ||||||||
| Commercial Business |
35,961 | (13,270 | ) | 29,753 | ||||||||
| Trade Finance |
— | — | — | |||||||||
| Consumer and Other |
— | — | 89 | |||||||||
| $ | 68,132 | $ | (21,102 | ) | $ | 72,148 | ||||||
| With No Related Allowance |
||||||||||||
| Real Estate—Residential |
$ | — | $ | — | $ | — | ||||||
| Real Estate—Commercial |
||||||||||||
| Retail |
9,127 | — | 10,100 | |||||||||
| Hotel & Motel |
8,619 | — | 7,299 | |||||||||
| Gas Station & Car Wash |
5,197 | — | 8,361 | |||||||||
| Mixed Use |
3,660 | — | 4,635 | |||||||||
| Industrial & Warehouse |
367 | 2,510 | ||||||||||
| Other |
17,530 | — | 10,853 | |||||||||
| Real Estate—Construction |
4,469 | — | 2,481 | |||||||||
| Commercial Business |
5,029 | — | 4,550 | |||||||||
| Trade Finance |
469 | — | 287 | |||||||||
| Consumer and Other |
88 | — | 18 | |||||||||
| $ | 54,555 | $ | — | $ | 51,094 | |||||||
| Total |
$ | 122,687 | $ | (21,102 | ) | $ | 123,242 | |||||
| * | Adjustment to recorded investment is not deemed material to this presentation. |
52
Table of Contents
| As of December 31, 2009 | ||||||||
| Impaired Loan Balance* |
Related Allowance |
|||||||
| (In Thousands) | ||||||||
| With Related Allowance: |
||||||||
| Real Estate—Residential |
$ | — | $ | — | ||||
| Real Estate—Commercial |
||||||||
| Retail |
7,954 | (1,812 | ) | |||||
| Hotel & Motel |
13,743 | (3,143 | ) | |||||
| Gas Station & Car Wash |
20,496 | (3,965 | ) | |||||
| Mixed Use |
5,459 | (1,067 | ) | |||||
| Industrial & Warehouse |
358 | (54 | ) | |||||
| Other |
2,674 | (811 | ) | |||||
| Real Estate—Construction |
2,342 | (275 | ) | |||||
| Commercial Business |
20,130 | (8,676 | ) | |||||
| Trade Finance |
— | — | ||||||
| Consumer and Other |
— | — | ||||||
| $ | 73,156 | $ | (19,803 | ) | ||||
| With No Related Allowance |
||||||||
| Real Estate—Residential |
$ | — | $ | — | ||||
| Real Estate—Commercial |
||||||||
| Retail |
8,390 | — | ||||||
| Hotel & Motel |
8,864 | — | ||||||
| Gas Station & Car Wash |
8,896 | — | ||||||
| Mixed Use |
4,693 | — | ||||||
| Industrial & Warehouse |
1,443 | — | ||||||
| Other |
11,630 | |||||||
| Real Estate—Construction |
— | — | ||||||
| Commercial Business |
3,468 | — | ||||||
| Trade Finance |
— | — | ||||||
| Consumer and Other |
— | — | ||||||
| $ | 47,384 | $ | — | |||||
| Total |
$ | 120,540 | $ | (19,803 | ) | |||
| * | Adjustment to recorded investment is not deemed material to this presentation. |
The following table illustrates total delinquent loans as of the dates indicated:
| DELINQUENT LOANS BY TYPE* | 12/31/2010 | 12/31/2009 | 12/31/2008 | 12/31/2007 | 12/31/2006 | |||||||||||||||
| (In thousands) | ||||||||||||||||||||
| Real estate—Residential |
$ | 46 | $ | 784 | $ | — | $ | — | $ | — | ||||||||||
| Real estate—Commercial |
21,016 | 51,876 | 22,230 | 24,810 | 3,458 | |||||||||||||||
| Real estate—Construction |
8,547 | — | 6,179 | — | — | |||||||||||||||
| Commercial business |
17,530 | 15,303 | 20,937 | 8,797 | 4,389 | |||||||||||||||
| Trade finance |
469 | — | 93 | 37 | — | |||||||||||||||
| Consumer and other |
491 | 1,514 | 1,776 | 1,030 | 1,104 | |||||||||||||||
| Total Delinquent Loans |
$ | 48,099 | $ | 69,477 | $ | 51,215 | $ | 34,674 | $ | 8,951 | ||||||||||
| Non-accrual loans included above |
$ | 43,803 | $ | 51,674 | $ | 37,580 | $ | 16,592 | $ | 3,271 | ||||||||||
| * | Delinquent over 30 days, including non-accrual loans, but excluding the guaranteed portion of delinquent SBA loans |
53
Table of Contents
The following table presents the aging of past due loans as of December 31, 2010 and 2009 by class of loans:
| As of December 31, 2010 | ||||||||||||||||
| 30-59 Days Past Due* |
60-89 Days Past Due* |
Greater than 90 Days Past Due* |
Total Past Due* |
|||||||||||||
| (In Thousands) | ||||||||||||||||
| Real estate—Residential |
$ | 46 | $ | — | $ | — | $ | — | ||||||||
| Real estate—Commercial |
||||||||||||||||
| Retail |
950 | 188 | 1,615 | 2,753 | ||||||||||||
| Hotel & Motel |
455 | — | 1,187 | 1,642 | ||||||||||||
| Gas Station & Car Wash |
— | — | 3,054 | 3,054 | ||||||||||||
| Mixed Use |
401 | — | 3,968 | 4,369 | ||||||||||||
| Industrial & Warehouse |
133 | 239 | 3,690 | 4,062 | ||||||||||||
| Other |
302 | — | 4,834 | 5,136 | ||||||||||||
| Real estate—Construction |
— | — | 8,547 | 8,547 | ||||||||||||
| Commercial business |
684 | 855 | 15,991 | 17,530 | ||||||||||||
| Trade finance |
— | — | 469 | 469 | ||||||||||||
| Consumer and other |
41 | 2 | 448 | 491 | ||||||||||||
| $ | 3,012 | $ | 1,284 | $ | 43,803 | $ | 48,099 | |||||||||
| As of December 31, 2009 | ||||||||||||||||
| 30-59 Days Past Due* |
60-89 Days Past Due* |
Greater than 90 Days Past Due* |
Total Past Due* |
|||||||||||||
| (In Thousands) | ||||||||||||||||
| Real estate—Residential |
$ | 784 | $ | — | $ | — | $ | 784 | ||||||||
| Real estate—Commercial |
||||||||||||||||
| Retail |
257 | 224 | 6,660 | 7,141 | ||||||||||||
| Hotel & Motel |
7,940 | — | 4,489 | 12,429 | ||||||||||||
| Gas Station & Car Wash |
1,543 | — | 8,413 | 9,956 | ||||||||||||
| Mixed Use |
335 | — | 6,595 | 6,930 | ||||||||||||
| Industrial & Warehouse |
— | 72 | 1,729 | 1,801 | ||||||||||||
| Other |
714 | 437 | 12,468 | 13,619 | ||||||||||||
| Real estate—Construction |
— | — | — | — | ||||||||||||
| Commercial business |
2,931 | 2,097 | 10,275 | 15,303 | ||||||||||||
| Trade finance |
— | — | — | — | ||||||||||||
| Consumer and other |
423 | 46 | 1,045 | 1,514 | ||||||||||||
| $ | 14,927 | $ | 2,876 | $ | 51,674 | $ | 69,477 | |||||||||
| * | Adjustment to recorded investment is not deemed material to this presentation. Accrued interest receivable on total loans is $6.1 million and $6.9 million and deferred loan fees on total loans are $(2.3) million and $(2.3 million) at December 31, 2010 and 2009. |
54
Table of Contents
We categorize loans into risk categories based on relevant information about the ability of borrowers to service their debt such as: current financial information, historical payment experience, credit documentation, public information, and current economic trends, among other factors. We analyze loans individually by classifying the loans as to credit risk. This analysis includes all non-homogeneous loans. This analysis is performed at least on a quarterly basis. We use the following definitions for risk ratings:
| • | Special Mention: Loans classified as special mention have a potential weakness that deserves management’s close attention. If left uncorrected, these potential weaknesses may result in deterioration of the repayment prospects for the loan or of the institution’s credit position at some future date. |
| • | Substandard: Loans classified as substandard are inadequately protected by the current net worth and paying capacity of the obligor or of the collateral pledged, if any. Loans so classified have a well-defined weakness or weaknesses that jeopardize the repayment of the debt. They are characterized by the distinct possibility that the institution will sustain some loss if the deficiencies are not corrected. |
| • | Doubtful: Loans classified as doubtful have all the weaknesses inherent in those classified as substandard, with the added characteristic that the weaknesses make collection or repayment in full, on the basis of currently existing facts, conditions, and values, highly questionable and improbable. |
The following table illustrates total watch list loans as of the dates indicated:
| WATCH LIST LOANS | 12/31/2010 | 12/31/2009 | 12/31/2008 | 12/31/2007 | 12/31/2006 | |||||||||||||||
| (In thousands) | ||||||||||||||||||||
| Special Mention |
$ | 29,573 | $ | 42,671 | $ | 71,169 | $ | 9,351 | $ | 4,708 | ||||||||||
| Substandard |
135,774 | 153,535 | 55,622 | 20,226 | 3,521 | |||||||||||||||
| Doubtful |
260 | 3,655 | 9,883 | 1,210 | 1,473 | |||||||||||||||
| Loss |
— | — | — | 10 | 28 | |||||||||||||||
| Total Watch List Loans |
$ | 165,607 | $ | 199,861 | $ | 136,674 | $ | 30,797 | $ | 9,730 | ||||||||||
Loans not meeting the criteria above that are analyzed individually as part of the above described process are considered to be pass rated loans. As of December 31, 2010 and 2009, and based on the most recent analysis performed, the risk category of loans by class of loans is as follows:
| As of December 31, 2010 | ||||||||||||||||
| Special Mention |
Substandard | Doubtful | Total | |||||||||||||
| Real estate—Residential |
$ | — | $ | 46 | $ | 46 | ||||||||||
| Real estate—Commercial |
||||||||||||||||
| Retail |
1,948 | 18,898 | — | 20,846 | ||||||||||||
| Hotel & Motel |
10,896 | 15,490 | — | 26,386 | ||||||||||||
| Gas Station & Car Wash |
8,798 | 8,923 | — | 17,721 | ||||||||||||
| Mixed Use |
364 | 5,887 | — | 6,251 | ||||||||||||
| Industrial & Warehouse |
385 | 8,871 | — | 9,256 | ||||||||||||
| Other |
1,865 | 21,431 | 23,296 | |||||||||||||
| Real estate—Construction |
— | 10,257 | — | 10,257 | ||||||||||||
| Commercial business |
4,182 | 45,054 | 260 | 49,496 | ||||||||||||
| Trade finance |
305 | 469 | — | 774 | ||||||||||||
| Consumer and other |
830 | 448 | — | 1,278 | ||||||||||||
| Total Watch List Loans |
$ | 29,573 | $ | 135,774 | $ | 260 | $ | 165,607 | ||||||||
55
Table of Contents
| As of December 31, 2009 | ||||||||||||||||
| Special Mention |
Substandard | Doubtful | Total | |||||||||||||
| Real estate—Residential |
$ | 784 | $ | — | $ | — | $ | 784 | ||||||||
| Real estate—Commercial |
||||||||||||||||
| Retail |
9,464 | 24,482 | — | 33,946 | ||||||||||||
| Hotel & Motel |
9,783 | 27,262 | — | 37,045 | ||||||||||||
| Gas Station & Car Wash |
— | 37,532 | — | 37,532 | ||||||||||||
| Mixed Use |
2,233 | 10,543 | — | 12,776 | ||||||||||||
| Industrial & Warehouse |
— | 3,017 | — | 3,017 | ||||||||||||
| Other |
7,382 | 19,924 | — | 27,306 | ||||||||||||
| Real estate—Construction |
5,802 | 736 | — | 6,538 | ||||||||||||
| Commercial business |
7,223 | 29,743 | 2,906 | 39,872 | ||||||||||||
| Trade finance |
— | — | — | — | ||||||||||||
| Consumer and other |
— | 296 | 749 | 1,045 | ||||||||||||
| Total Watch List Loans |
$ | 42,671 | $ | 153,535 | $ | 3,655 | $ | 199,861 | ||||||||
The following table shows the provision made for loan losses, the amount of loans charged off, the recoveries on loans previously charged off together with the balance in the allowance for loan losses at the beginning and end of each year, the amount of average and total loans outstanding, and other pertinent ratios as of the dates and for the years indicated:
| (Dollars in thousands) | December 31, | |||||||||||||||||||
| 2010 | 2009 | 2008 | 2007 | 2006 | ||||||||||||||||
| LOANS: |
||||||||||||||||||||
| Average gross loans receivable, including loans held for sale |
$ | 2,159,894 | $ | 2,124,615 | $ | 2,089,803 | $ | 1,879,457 | $ | 1,593,453 | ||||||||||
| Total gross loans receivables, excluding loans held for sale at end of year (net of deferred fees) |
2,134,061 | 2,208,943 | 2,098,443 | 2,008,729 | 1,714,865 | |||||||||||||||
| ALLOWANCE: |
||||||||||||||||||||
| Balance—beginning of year |
$ | 59,424 | $ | 43,419 | $ | 20,035 | $ | 19,112 | $ | 17,618 | ||||||||||
| Loans charged off: |
||||||||||||||||||||
| Commercial real estate |
58,291 | 18,218 | 4,763 | — | — | |||||||||||||||
| Construction |
848 | 6,116 | 2,614 | — | — | |||||||||||||||
| Commercial business loans |
24,157 | 19,775 | 17,801 | 6,568 | 2,553 | |||||||||||||||
| Consumer and other loans |
1,356 | 1,577 | 515 | 880 | 1,108 | |||||||||||||||
| Total loans charged off |
84,652 | 45,686 | 25,693 | 7,448 | 3,661 | |||||||||||||||
| Less: recoveries: |
||||||||||||||||||||
| Commercial and industrial real estate |
770 | 166 | 49 | — | — | |||||||||||||||
| Commercial business loans |
1,951 | 445 | 100 | 646 | 970 | |||||||||||||||
| Consumer and other loans |
197 | 57 | 103 | 195 | 431 | |||||||||||||||
| Total loan recoveries |
2,918 | 668 | 252 | 841 | 1,401 | |||||||||||||||
| Net loans charged off |
81,734 | 45,018 | 25,441 | 6,607 | 2,260 | |||||||||||||||
| Provision for loan losses |
84,630 | 61,023 | 48,825 | 7,530 | 3,754 | |||||||||||||||
| Balance—end of year |
$ | 62,320 | $ | 59,424 | $ | 43,419 | $ | 20,035 | $ | 19,112 | ||||||||||
56
Table of Contents
| (Dollars in thousands) | December 31, | |||||||||||||||||||
| 2010 | 2009 | 2008 | 2007 | 2006 | ||||||||||||||||
| RATIOS: |
||||||||||||||||||||
| Net loan charge-offs to average total loans |
3.76 | % | 2.12 | % | 1.22 | % | 0.35 | % | 0.14 | % | ||||||||||
| Allowance for loan losses to total loans at end of year |
2.92 | % | 2.69 | % | 2.07 | % | 1.00 | % | 1.11 | % | ||||||||||
| Net loan charge-offs to beginning allowance |
137.54 | % | 103.68 | % | 126.98 | % | 34.57 | % | 12.83 | % | ||||||||||
| Net loan charge-offs to provision for loan losses |
96.58 | % | 73.77 | % | 52.11 | % | 87.74 | % | 60.20 | % | ||||||||||
| Allowance for loan losses to nonperforming loans |
142 | % | 115 | % | 116 | % | 121 | % | 584 | % | ||||||||||
The activity in the allowance for loan losses by class of loans for the year ended December 31, 2010 is as follows:
| Real estate - Commercial | ||||||||||||||||||||||||||||||||||||||||||||||||||||
| Real estate - Residential |
Retail | Hotel & Motel |
Gas Station & Car Wash |
Mixed Use |
Industrial & Warehouse |
Other | Real estate - Construction |
Commercial Business |
Trade Finance |
Consumer and other |
Unallocated | Total | ||||||||||||||||||||||||||||||||||||||||
| Balance, beginning of year |
$ | 18 | $ | 7,068 | $ | 10,506 | $ | 9,034 | $ | 3,032 | $ | 1,844 | $ | 9,357 | $ | 913 | $ | 15,656 | $ | 410 | $ | 1,143 | $ | 443 | $ | 59,424 | ||||||||||||||||||||||||||
| Provision for loan losses |
19 | 9,937 | 14,695 | 8,213 | 1,587 | 4,937 | 10,722 | 3,331 | 30,930 | (218 | ) | 651 | (174 | ) | 84,630 | |||||||||||||||||||||||||||||||||||||
| Loans charged off |
(23 | ) | (11,384 | ) | (18,322 | ) | (12,342 | ) | (3,042 | ) | (3,196 | ) | (10,532 | ) | (848 | ) | (23,607 | ) | — | (1,356 | ) | — | (84,652 | ) | ||||||||||||||||||||||||||||
| Recoveries of charged offs |
— | 12 | 21 | 397 | — | — | 341 | — | 1,951 | — | 196 | — | 2,918 | |||||||||||||||||||||||||||||||||||||||
| Balance, end of year |
$ | 14 | $ | 5,633 | $ | 6,900 | $ | 5,302 | $ | 1,577 | $ | 3,585 | $ | 9,888 | $ | 3,396 | $ | 24,930 | $ | 192 | $ | 634 | $ | 269 | $ | 62,320 | ||||||||||||||||||||||||||
Allowance for Loan Losses Methodology
We maintain an allowance for loan losses to provide for estimated probable losses that are inherent in our loan portfolio. The allowance is based on our regular quarterly assessments. Our methodologies for measuring the appropriate level of the allowance include the combination of: (1) a quantitative historical loss migration Analysis (“Migration Analysis”) for pools of loans, and a qualitative analysis of subjective factors and (2) a specific allowance method for impaired loans.
The following table reflects our allocation of the allowance for loan losses by loan category and the ratio of each loan category to total loans as of the dates indicated:
| Allocation of Allowance for Loan Losses | ||||||||||||||||||||||||||||||||||||||||
| 12/31/2010 | 12/31/2009 | 12/31/2008 | 12/31/2007 | 12/31/2006 | ||||||||||||||||||||||||||||||||||||
| Amount | % | Amount | % | Amount | % | Amount | % | Amount | % | |||||||||||||||||||||||||||||||
| (Dollars in thousands) | ||||||||||||||||||||||||||||||||||||||||
| Loan Type | ||||||||||||||||||||||||||||||||||||||||
| Real estate—Residential |
$ | 14 | 0 | % | $ | 18 | 0 | % | $ | 27 | 0 | % | $ | 24 | 0 | % | $ | 21 | 0 | % | ||||||||||||||||||||
| Real estate—Commercial |
32,885 | 71 | % | 40,841 | 73 | % | 24,144 | 56 | % | 12,498 | 63 | % | 12,673 | 66 | % | |||||||||||||||||||||||||
| Real estate—Construction |
3,396 | 2 | % | 913 | 2 | % | — | 0 | % | — | 0 | % | — | 0 | % | |||||||||||||||||||||||||
| Commercial business |
24,930 | 23 | % | 15,655 | 22 | % | 18,060 | 42 | % | 6,752 | 34 | % | 5,579 | 29 | % | |||||||||||||||||||||||||
| Trade finance |
192 | 3 | % | 410 | 2 | % | — | 0 | % | — | 0 | % | — | 0 | % | |||||||||||||||||||||||||
| Consumer and other |
634 | 1 | % | 1,144 | 1 | % | 869 | 2 | % | 643 | 3 | % | 805 | 4 | % | |||||||||||||||||||||||||
| Unallocated |
269 | N/A | 443 | N/A | 319 | N/A | 118 | N/A | 34 | N/A | ||||||||||||||||||||||||||||||
| Total |
$ | 62,320 | 100 | % | $ | 59,424 | 100 | % | $ | 43,419 | 100 | % | $ | 20,035 | 100 | % | $ | 19,112 | 100 | % | ||||||||||||||||||||
57
Table of Contents
The adequacy of the allowance for loan losses is determined by management based upon an evaluation and review of the credit quality of the loan portfolio, consideration of historical loan loss experience, relevant internal and external factors that affect the collection of a loan, and other pertinent factors.
The Migration Analysis is a formula methodology based on the Bank’s actual historical net charge-off experience for each loan pool and loan risk grade (Pass, Special Mention, Substandard and Doubtful). The migration analysis is centered on the Bank’s internal credit risk rating system. Our internal loan review and external contracted credit review examinations are used to determine and validate loan risk grades. This credit review system takes into consideration factors such as: borrower’s background and experience; historical and current financial condition; credit history and payment performance; economic conditions and their impact on various industries; type, fair value and volatility of the fair value of collateral; lien position; and the financial strength of any guarantors.
A general loan loss allowance is provided on loans not specifically identified as impaired (“non-impaired loans”). The allowance is determined first based on a quantitative analysis using the Migration Analysis. The loans are classified by type and loan grade, and the historical loss migration is tracked for the various stratifications. Loss experience is quantified for the most recent 12 quarters and then weighted to give more weight to the most recent losses. That loss experience is then applied to the stratified portfolio at each quarter end. During 2009, the non-impaired Commercial Real Estate loan portfolio was stratified into ten different loan pools based on property types and the non-impaired Commercial and Industrial loan portfolio was stratified into five different loan pools based on loan type, to allocate historic loss experience to more granular loan pools. Effective June 30, 2010 four additional pools, primarily in the commercial real estate portfolio, were further stratified. In addition, a new software program, commonly used by community banks, was implemented effective June 30, 2010 and is used to track and allocate charge-offs to the various loan grades by loan pools.
The stratification of the non-impaired loan portfolio resulted in a quantitative general loan loss allowance of $23.9 million at December 31, 2010, compared to $11.3 million at December 31, 2009. The enhancement to the reserve methodology mentioned previously, allows loan losses to be migrated into for Pass loan grade levels. This extended migration analysis process resulted in higher levels of quantitative reserves being required for the various Pass graded loan pools.
Additionally, in order to systematically quantify the credit risk impact of other trends and changes within the loan portfolio, the Bank utilizes qualitative adjustments to the Migration Analysis within established parameters. The parameters for making adjustments are established under a Credit Risk Matrix that provides seven possible scenarios for each of the factors below. The matrix allows for up to three positive (Major, Moderate, and Minor), three negative (Major, Moderate, and Minor), and one neutral credit risk scenarios within each factor for each loan type pool. Generally, the factors are considered to have no significant impact (neutral) to our historical migration ratios. However, if information exists to warrant adjustment to the Migration Analysis, changes are made in accordance with the established parameters supported by narrative and/or statistical analysis. The Credit Risk Matrix and the seven possible scenarios enable the Bank to qualitatively adjust the Loss Migration Ratio by as much as 50 basis points in either direction (positive or negative) for each loan type pool. This matrix considers the following nine factors, which are patterned after the guidelines provided under the FFIEC Interagency Policy Statement on the Allowance for Loan and Lease Losses:
| • | Changes in lending policies and procedures, including underwriting standards and collection, charge-off, and recovery practices; |
| • | Changes in national and local economic and business conditions and developments, including the condition of various market segments; |
| • | Changes in the nature and volume of the loan portfolio; |
| • | Changes in the experience, ability, and depth of lending management and staff; |
| • | Changes in the trends of the volume and severity of past due and classified loans; and changes in trends in the volume of non-accrual loans and troubled debt restructurings, and other loan modifications; |
58
Table of Contents
| • | Changes in the quality of our loan review system and the degree of oversight by the Directors; |
| • | Changes in the value of underlying collateral for collateral-dependent loans; |
| • | The existence and effect of any concentrations of credit, and changes in the level of such concentrations; and |
| • | The effect of external factors such as competition and legal and regulatory requirements on the level of estimated losses in our loan portfolio. |
The qualitative loan loss allowance on the non-impaired loan portfolio was $17.0 million at December 31, 2010 compared to $28.4 million at December 31, 2009.
We also establish specific loss allowances for loans where we have identified potential credit risk conditions or circumstances related to a specific individual credit. The specific allowance amounts are determined by a method prescribed by FASB ASC 310-10-35-22, Measurement of Impairment. The loans first identified as impaired will be accounted for in accordance with one of the three acceptable valuations: 1) the present value of future cash flows discounted at the loan’s effective interest rate; 2) the loan’s observable market price; or 3) the fair value of the collateral, if the loan is collateral dependent. For the collateral dependent impaired loans, we obtain an appraisal to determine the amount of impairment at the date that the loan becomes impaired. The appraisals are based on “as is” valuation. To ensure that appraised values remain current, we generally obtain an updated appraisal every twelve months from qualified independent appraisals. Furthermore, if the most current appraisal is dated more than six months prior to the effective date of the impairment test, we validate the most current value with third party market data appropriate to the location and property type of the collateral. If the third party market data indicates that the value of our collateral property values has declined since the most recent valuation date, we adjust downward the value of the property to reflect current market conditions. If the fair value of the collateral, less cost to sell, is less than the recorded amount of the loan, we then recognize impairment by creating or adjusting an existing valuation allowance with a corresponding charge to the provision for loan losses. If an impaired loan is expected to be collected through liquidation of the collateral, the amount of impairment, depending on the size of the impaired loan, is charged off against the allowance for loan losses.
The Bank considers a loan to be impaired when it is probable that not all amounts due (principal and interest) will be collectible in accordance with the contractual terms of the loan agreement. Factors considered by management in determining impairment include payment status, collateral value and the probability of collecting scheduled principal and interest payments when due. Loans that experience insignificant payment delays and payment shortfalls generally are not classified as impaired. The significance of payment delays and payment shortfalls is determined on a case-by-case basis by taking into consideration all of the circumstances surrounding the loan and the borrower, including the length of the delay, the reasons for the delay, the borrower’s prior payment record and the amount of the shortfall in relation to the principal and interest owed.
For commercial business loans, real estate loans and certain consumer loans, we base the measurement of loan impairment on the present value of the expected future cash flows, discounted at the loan’s effective interest rate or on the fair value of the loan’s collateral if the loan is collateral dependent. We evaluate most consumer loans for impairment on a collective basis, because these loans have generally smaller balances and are homogeneous in the underwriting terms and conditions, and to the type of collateral. If a loan is deemed to be impaired, the amount of the impairment is supported by a specific allowance amount which is included in the allowance for loan losses through a charge to the provision for loan losses.
In the third quarter, 2010, based on current market conditions, we expanded the criteria for evaluating loans for impairment which resulted in an increase in impaired loans from the prior quarter. Prior to the third quarter of 2010, loans graded Substandard were not individually evaluated for impairment and only considered impaired if they were 60+ days past due, unless other events existed that qualified the loan for impairment review. Therefore, a Substandard credit that was current in its contractual payments, but was classified due to other risk issues would not necessarily be subject to individual review for impairment analysis. Effective September 30, 2010, we expanded the scope of the loans reviewed for individual impairment by including all loans over $2 million that
59
Table of Contents
were risk-graded as Substandard, even though such loans were less than 60 days delinquent and were performing under their contractual terms. Effective December 31, 2010, we expanded this scope again by now including all loans over $1 million, which added 3 loans totaling $4.6 million to aggregate impaired loans. This enhancement to our impairment analysis provided more coverage in terms of current fair values on classified loans as updated market values are required as part of the impairment analysis process.
The following table presents the allocation of the specific and general components of the allowance and loan balances by portfolio segment:
| As of December 31, 2010 | ||||||||||||||||||||||||||||
| Real estate - Residential |
Real estate - Commercial |
Real estate - Construction |
Commercial business |
Trade finance | Consumer and other |
Total | ||||||||||||||||||||||
| (In thousands) | ||||||||||||||||||||||||||||
| Impaired loans |
$ | — | $ | 70,882 | $ | 10,258 | $ | 40,990 | $ | 469 | $ | 88 | $ | 122,687 | ||||||||||||||
| Specific allowance |
$ | — | $ | 6,145 | $ | 1,686 | $ | 13,271 | $ | — | $ | — | $ | 21,102 | ||||||||||||||
| Loss coverage ratio |
0 | % | 8.67 | % | 16.44 | % | 32.38 | % | 0.00 | % | 0.00 | % | 17.20 | % | ||||||||||||||
| Non-impaired loans |
$ | 2,263 | $ | 1,453,768 | $ | 36,642 | $ | 450,821 | $ | 56,961 | $ | 13,180 | $ | 2,013,635 | ||||||||||||||
| General allowance |
$ | 14 | $ | 26,740 | $ | 1,710 | $ | 11,659 | $ | 192 | $ | 903 | $ | 41,218 | ||||||||||||||
| Loss coverage ratio |
0.62 | % | 1.84 | % | 4.67 | % | 2.59 | % | 0.34 | % | 6.85 | % | 2.05 | % | ||||||||||||||
| Total loans* |
$ | 2,263 | $ | 1,524,650 | $ | 46,900 | $ | 491,811 | $ | 57,430 | $ | 13,268 | $ | 2,136,322 | ||||||||||||||
| Total allowance for loan losses |
$ | 14 | $ | 32,885 | $ | 3,396 | $ | 24,930 | $ | 192 | $ | 903 | $ | 62,320 | ||||||||||||||
| Loss coverage ratio |
0.62 | % | 2.16 | % | 7.24 | % | 5.07 | % | 0.33 | % | 6.81 | % | 2.92 | % | ||||||||||||||
| (1) | Excludes the guaranteed portion of delinquent SBA loans. |
| (2) | Adjustment to recorded investment is not deemed material to this presentation. Accrued interest receivable on total loans is $6.1 million and $6.9 million and deferred loan fees on total loans are $(2.3) million and $(2.3 million) at December 31, 2010 and 2009. |
| As of December 31, 2009 | ||||||||||||||||||||||||||||
| Real estate - Residential |
Real estate - Commercial |
Real estate - Construction |
Commercial business |
Trade finance | Consumer and other |
Total | ||||||||||||||||||||||
| (In thousands) | ||||||||||||||||||||||||||||
| Impaired loans |
$ | — | $ | 94,600 | $ | 2,342 | $ | 23,598 | $ | — | $ | — | $ | 120,540 | ||||||||||||||
| Specific allowance |
$ | — | $ | 10,852 | $ | 275 | $ | 8,676 | $ | — | $ | — | $ | 19,803 | ||||||||||||||
| Loss coverage ratio |
0.00 | % | 11.47 | % | 11.74 | % | 36.77 | % | 0.00 | % | 0.00 | % | 16.43 | % | ||||||||||||||
| Non-impaired loans |
$ | 4,801 | $ | 1,500,619 | $ | 51,742 | $ | 464,138 | $ | 51,411 | $ | 18,035 | $ | 2,090,746 | ||||||||||||||
| General allowance |
$ | 18 | $ | 29,989 | $ | 638 | $ | 6,979 | $ | 410 | $ | 1,587 | $ | 39,621 | ||||||||||||||
| Loss coverage ratio |
0.37 | % | 2.00 | % | 1.23 | % | 1.50 | % | 0.80 | % | 8.80 | % | 1.90 | % | ||||||||||||||
| Total loans* |
$ | 4,801 | $ | 1,595,219 | $ | 54,084 | $ | 487,736 | $ | 51,411 | $ | 18,035 | $ | 2,211,286 | ||||||||||||||
| Total allowance for loan losses |
$ | 18 | $ | 40,841 | $ | 913 | $ | 15,655 | $ | 410 | $ | 1,587 | $ | 59,424 | ||||||||||||||
| Loss coverage ratio |
0.37 | % | 2.56 | % | 1.69 | % | 3.21 | % | 0.80 | % | 8.80 | % | 2.69 | % | ||||||||||||||
| (1) | Excludes the guaranteed portion of delinquent SBA loans. |
| (2) | Adjustment to recorded investment is not deemed material to this presentation. Accrued interest receivable on total loans is $6.1 million and $6.9 million and deferred loan fees on total loans are $(2.3) million and $(2.3 million) at December 31, 2010 and 2009. |
Under certain circumstances, we will provide borrowers relief through loan modifications. These modifications are either temporary in nature (“temporary modifications”), or are more substantive troubled debt restructurings. At December 31, 2010, total modified loans were $55.6 million, compared to $108.4 million at December 31, 2009. The temporary modifications generally consist of interest only payments for a three- to
60
Table of Contents
six-month period, whereby principal payments are deferred. At the end of the modification period, the remaining principal balance is re-amortized based on the original maturity date. Loans subject to temporary modifications are generally downgraded to substandard or special mention. At the end of the modification period, the loan 1) returns to the original contractual terms; 2) is further modified and accounted for as a troubled debt restructuring in accordance with ASC 310-10-35; or 3) is disposed of through foreclosure or liquidation.
Troubled Debt Restructured (“TDR”) loans are defined by ASC 310-40, “Troubled Debt Restructurings by Creditors” and ASC 470-60, “Troubled Debt Restructurings by Debtors,” and evaluated for impairment in accordance with ASC 310-10-35. The concessions may be granted in various forms, including reduction in the stated interest rate, reduction in the amount of principal amortization, forgiveness of a portion of a loan balance or accrued interest, or extension of the maturity date.
A summary of TDRs on accrual by type of concession as of December 31, 2010 and 2009 is presented below:
| As of December 31, 2010 | As of December 31, 2009 | |||||||||||||||||||||||
| Real estate - Commercial |
Commercial Business |
Total | Real estate - Commercial |
Commercial Business |
Total | |||||||||||||||||||
| (In thousands) |
||||||||||||||||||||||||
| Payment concession |
$ | 975 | $ | 8,744 | $ | 9,719 | $ | 2,993 | $ | 4,287 | $ | 7,280 | ||||||||||||
| Maturity / Amortization concession |
4,968 | 7,144 | 12,112 | 34,403 | 5,332 | 39,735 | ||||||||||||||||||
| Rate concession |
12,250 | 1,022 | 13,272 | 16,496 | 829 | 17,325 | ||||||||||||||||||
| $ | 18,193 | $ | 16,910 | $ | 35,103 | $ | 53,892 | $ | 10,448 | $ | 64,340 | |||||||||||||
TDRs on accrual status are comprised of loans that were accruing at the time of restructuring and for which the Bank anticipates full repayment of both principal and interest. TDRs that are on non-accrual can be returned to accrual status after a period of sustained performance, generally determined to be six months of timely payments as modified. Sustained performance includes the periods prior to the modification if the prior performance met or exceeded the modified terms. TDRs on accrual status at December 31, 2010 were comprised of 17 commercial real estate loans totaling $18.2 million and 43 commercial business loans totaling $16.9 million. TDRs on accrual status at December 31, 2009 were comprised of 34 commercial real estate loans totaling $53.9 million and 54 commercial business loans totaling $10.4 million. We expect that the TDRs on accrual status as of December 31, 2010, which are all performing in accordance with their restructured terms to continue to comply with the restructured terms because of the reduced principal or interest payments on these loans.
A summary of TDRs on accrual status by the type of securing properties as of December 31, 2010 and 2009 is presented below:
| As of December 31 | ||||||||
| 2010 | 2009 | |||||||
| Retail buildings |
$ | 4,832 | $ | 9,620 | ||||
| Hotels/motels |
6,193 | 16,647 | ||||||
| Gas stations/ car washes |
1,475 | 20,006 | ||||||
| Mixed-use facilities |
— | 2,907 | ||||||
| Multifamily |
— | 1,371 | ||||||
| Other |
22,603 | 13,790 | ||||||
| Total |
$ | 35,103 | $ | 64,341 | ||||
TDRs are generally downgraded to substandard. We have allocated $15.8 million and $14.1 million of specific reserves to TDRs as of December 31, 2010 and 2009, respectively. As of December 31, 2010 and 2009, we did not have any outstanding commitments to extend additional funds to these borrowers.
61
Table of Contents
Investment Security Portfolio
The main objectives of our investment strategy are to provide a source of liquidity while managing our interest rate risk, and to generate an adequate level of interest income without taking undue risks. Our investment policy permits investments in various types of securities, certificates of deposits and federal funds sold in compliance with various restrictions in the policy. Securities are classified as held to maturity or available for sale. We do not maintain a trading portfolio. The securities for which we have the ability and intent to hold to maturity are classified as held to maturity securities. All other securities are classified as available for sale.
Our available-for-sale securities totaled $528.3 million at December 31, 2010, compared to $782.7 million at December 31, 2009. We had no securities in the held to maturity category at December 31, 2010 or 2009. During 2010, $199.7 million in mortgage related securities were paid down, $201.8 million in securities were sold, $35.2 million in securities were either called or matured, and $190.6 million were purchased. All of the securities involved in these transactions were classified as available for sale. Securities with an amortized cost of $2.0 million were pledged to the FRB as required or permitted by law at December 31, 2010. We also pledged securities with an amortized cost of $265.8 million to the California State Treasurer’s Office as deposit collateral for time certificates deposit. Our investment portfolio consists of government sponsored enterprise (“GSE”) bonds, mortgage backed securities (“MBS”), CMOs, mutual funds, a corporate note and municipal bonds.
The following table summarizes the amortized cost, estimated fair value and maturity distribution of our investment securities portfolio as of dates indicated:
Investment Portfolio Balance and Fair Value
| December 31, | ||||||||||||||||||||||||
| 2010 | 2009 | |||||||||||||||||||||||
| Amortized Cost |
Estimated Fair Value |
Unrealized/ Unrecognized Gain (Loss) |
Amortized Cost |
Estimated Fair Value |
Unrealized/ Unrecognized Gain (Loss) |
|||||||||||||||||||
| (Dollars in thousands) | ||||||||||||||||||||||||
| Available-for-sale: |
||||||||||||||||||||||||
| Debt securities*: |
||||||||||||||||||||||||
| GSE Bonds |
$ | 125,429 | $ | 125,718 | $ | 289 | $ | 85,343 | $ | 85,229 | $ | (114 | ) | |||||||||||
| GSE CMOs |
101,312 | 103,201 | 1,889 | 191,711 | 191,035 | (676 | ) | |||||||||||||||||
| GSE MBS |
282,205 | 284,834 | 2,629 | 485,705 | 492,214 | 6,509 | ||||||||||||||||||
| Corporate Note |
4,473 | 3,708 | (765 | ) | 4,458 | 3,424 | (1,034 | ) | ||||||||||||||||
| Municipal Bonds |
5,258 | 5,282 | 24 | 5,259 | 5,325 | 66 | ||||||||||||||||||
| Total debt securities |
518,677 | 522,743 | 4,066 | 772,476 | 777,227 | 4,751 | ||||||||||||||||||
| Mutual funds |
5,462 | 5,519 | 57 | 5,462 | 5,463 | 1 | ||||||||||||||||||
| Total available-for-sale |
$ | 524,139 | $ | 528,262 | $ | 4,123 | $ | 777,938 | $ | 782,690 | $ | 4,752 | ||||||||||||
| * | Government Sponsored Enterprises (GSE) included GNMA, FHLB, FNMA, FHLMC, and FFCB. |
The proceeds from sales of securities and the associated gains for the year ended are listed below:
| (Dollars in thousands) |
2010 | 2009 | 2008 | |||||||||
| Proceeds |
$ | 208,142 | $ | 239,734 | $ | 76,135 | ||||||
| Gross gains |
6,296 | 4,431 | 895 | |||||||||
| Gross losses |
— | (3 | ) | (10 | ) | |||||||
62
Table of Contents
The following table summarizes the maturity of securities based on carrying value and their related weighted average yield at December 31, 2009
Investment Portfolio Maturities and Weighted Average Yields
| Within One Year | After One But Within Five Years |
After Five But Within Ten Years |
After Ten Years | Total | ||||||||||||||||||||||||||||||||||||
| Amount | Yield | Amount | Yield | Amount | Yield | Amount | Yield | Amount | Yield | |||||||||||||||||||||||||||||||
| (Dollars in thousands) | ||||||||||||||||||||||||||||||||||||||||
| Available-for-sale |
||||||||||||||||||||||||||||||||||||||||
| GSE Bonds |
$ | — | — | % | $ | — | — | % | $ | — | — | % | $ | 125,429 | 2.62 | % | $ | 125,429 | 4.00 | % | ||||||||||||||||||||
| GSE CMOs |
— | — | — | — | — | — | 101,312 | 2.87 | % | 101,312 | 2.70 | % | ||||||||||||||||||||||||||||
| GSE MBS |
— | — | — | — | 13,392 | 2.99 | % | 268,813 | 3.54 | % | 282,205 | 4.20 | % | |||||||||||||||||||||||||||
| Corporate Note |
— | — | — | — | — | — | 4,473 | 1.67 | % | 4,473 | 1.66 | % | ||||||||||||||||||||||||||||
| Municipal Bonds |
340 | 4.78 | 1,652 | 6.56 | % | 3,266 | 6.57 | % | 5,258 | 6.45 | ||||||||||||||||||||||||||||||
| Mutual funds |
— | — | — | — | — | — | 5,462 | 3.21 | % | 5,462 | 4.04 | % | ||||||||||||||||||||||||||||
| Total available |
$ | — | — | % | $ | 340 | 4.78 | % | $ | 15,044 | 3.38 | % | $ | 508,755 | 3.18 | % | $ | 524,139 | 3.81 | % | ||||||||||||||||||||
The following table shows our investments with gross unrealized losses and their estimated fair values, aggregated by investment category and length of time that individual securities have been in a continuous unrealized loss position, at December 31, 2010.
| Less than 12 months | 12 months or longer | Total | ||||||||||||||||||||||||||||||||||
| Description of |
Number of Securities |
Fair Value | Gross Unrealized Losses |
Number of Securities |
Fair Value | Gross Unrealized Losses |
Number of Securities |
Fair Value | Gross Unrealized Losses |
|||||||||||||||||||||||||||
| (Dollars in thousands) | ||||||||||||||||||||||||||||||||||||
| GSE Bonds |
4 | $ | 65,465 | $ | (770 | ) | — | $ | — | $ | — | 4 | $ | 65,465 | $ | (770 | ) | |||||||||||||||||||
| GSE CMOs |
3 | 9,091 | (187 | ) | 2 | 17,337 | (70 | ) | 5 | 26,428 | (257 | ) | ||||||||||||||||||||||||
| GSE MBS |
7 | 99,555 | (1,999 | ) | — | — | — | 7 | 99,555 | (1,999 | ) | |||||||||||||||||||||||||
| Corporate Note |
— | — | — | 1 | 3,708 | (765 | ) | 1 | 3,708 | (765 | ) | |||||||||||||||||||||||||
| Municipal Bonds |
5 | 1,929 | (31 | ) | — | — | — | 5 | 1,929 | (31 | ) | |||||||||||||||||||||||||
| 19 | $ | 176,040 | $ | (2,987 | ) | 3 | $ | 21,045 | $ | (835 | ) | 22 | $ | 197,085 | $ | (3,822 | ) | |||||||||||||||||||
ASC Topic 320 requires an entity to assess whether the entity has the intent to sell a debt security or more likely than not will be required to sell the debt security before its anticipated recovery. If either of these conditions is met, an entity must recognize an other-than-temporary impairment (“OTTI”). If an entity does not intend to sell the debt security and will not be required to sell the debt security, the entity must consider whether it will recover the amortized cost basis of the security. If the present value of expected cash flows is less than the amortized cost basis of the security, OTTI shall be considered to have occurred. OTTI is then separated into the amount of the total impairment related to credit losses and the amount of the total impairment related to all other factors. An entity determines the impairment related to credit losses by comparing the present value of cash flows expected to be collected from the security with the amortized cost basis of the security. OTTI related to the credit loss is then recognized in earnings. OTTI related to all other factors is recognized in other comprehensive income.
We evaluate securities for OTTI on at least a quarterly basis, and more frequently when economic or market concerns warrant such evaluation. Consideration is given to the financial condition and near-term prospects of the issuer, the length of time and the extent to which the fair value of the securities has been less than our cost for the securities, and our intention to sell, or whether it is more likely than not that we will be required to sell, a security in an unrealized loss position before recovery of its amortized cost basis. In analyzing an issuer’s financial condition, we consider whether the securities are issued by the federal government or its agencies, whether downgrades by bond rating agencies have occurred, and the results of reviews of the issuer’s financial condition.
63
Table of Contents
The corporate note at December 31, 2010 and 2009 consists of one bond with an amortized cost of $4.5 million and an unrealized loss of $765 thousand at December 31, 2010. The bond is scheduled to mature in May 2047, with a first call date option in May 2012. Management determined this unrealized loss did not represent OTTI at December 31, 2010 and 2009 as the investment is rated investment grade and there are no credit quality concerns with the obligor. The market value decline is deemed to be due to the current market volatility and is not reflective of management’s expectations of our ability to fully recover this investment, which may be at maturity. Interest on the corporate note has been paid as agreed and management believes this will continue in the future and the bond will be repaid in full as scheduled. For these reasons, no OTTI was recognized on the corporate note at December 31, 2010.
We consider the losses on our investments in an unrealized loss position at December 31, 2010 to be temporary based on: 1) the likelihood of recovery; 2) the information available to us relative to the extent and duration of the decline in market value; and 3) our intention not to sell, and our determination that it is more likely than not that we will not be required to sell, a security in an unrealized loss position before recovery of its amortized cost basis.
Deposits
Deposits are our primary source of funds for making loans and investment activities. We offer a wide variety of deposit account products to commercial and consumer customers. Total deposits decreased $258.1 million, or 11%, to $2.18 billion at December 31, 2010 compared to $2.43 billion at December 31, 2009.
The decrease in deposits during 2010 was primarily due to runoff of matured retail jumbo time deposits as we offered lower renewal rates. Most of the runoff was from the deposits raised during a deposit campaign held during the first and second quarter of 2009. Approximately 50% of these matured retail jumbo CDs were retained and either repriced to lower rate CDs or moved to other interest-bearing accounts. The decrease in retail jumbo CDs was offset by increases primarily in non-jumbo CDs and money market accounts. At December 31, 2010, we had $63.1 million in brokered deposits and $200.0 million in California State Treasurer deposits, compared to $18.1 million and $200.0 million, respectively, at December 31, 2009. The brokered deposits represented approximately 3% of our total deposits as of December 31, 2010 compared to 1% as of December 31, 2009. The California State Treasurer deposits have three-month maturities with a weighted average interest rate of 0.22% at December 31, 2010.
Although our deposits may vary with local and national economic conditions, we do not believe that our deposits are seasonal in nature. The following table sets forth information for the periods indicated and the balances of our deposits by category.
| December 31, | ||||||||||||||||||||||||
| 2010 | 2009 | 2008 | ||||||||||||||||||||||
| Amount | Percent | Amount | Percent | Amount | Percent | |||||||||||||||||||
| (Dollars in thousands) | ||||||||||||||||||||||||
| Demand, non-interest bearing |
$ | 388,731 | 18 | % | $ | 330,489 | 14 | % | $ | 303,656 | 16 | % | ||||||||||||
| Demand, interest bearing |
688,593 | 31 | % | 524,188 | 21 | % | 306,478 | 16 | % | |||||||||||||||
| Savings |
126,255 | 6 | % | 136,804 | 6 | % | 113,186 | 6 | % | |||||||||||||||
| Time deposit of $100,000 or more |
321,542 | 15 | % | 932,699 | 38 | % | 626,850 | 32 | % | |||||||||||||||
| Other time deposits |
650,993 | 30 | % | 510,010 | 21 | % | 588,433 | 30 | % | |||||||||||||||
| Total Deposits |
$ | 2,176,114 | 100 | % | $ | 2,434,190 | 100 | % | $ | 1,938,603 | 100 | % | ||||||||||||
64
Table of Contents
The following table indicates the maturity schedules of our time deposits, for the years indicated.
| December 31, | ||||||||||||||||||||||||
| 2010 | 2009 | 2008 | ||||||||||||||||||||||
| Amount | Percentage | Amount | Percentage | Amount | Percentage | |||||||||||||||||||
| (Dollars in thousands) | ||||||||||||||||||||||||
| Three months or less |
$ | 339,857 | 35 | % | $ | 739,857 | 51 | % | $ | 617,790 | 51 | % | ||||||||||||
| Over three months through six months |
152,838 | 16 | % | 537,378 | 37 | % | 260,652 | 21 | % | |||||||||||||||
| Over six months through twelve months |
311,210 | 32 | % | 135,265 | 10 | % | 293,798 | 24 | % | |||||||||||||||
| Over twelve months |
168,630 | 17 | % | 30,209 | 2 | % | 43,043 | 4 | % | |||||||||||||||
| Total time deposits |
$ | 972,535 | 100 | % | $ | 1,442,709 | 100 | % | $ | 1,215,283 | 100 | % | ||||||||||||
The following table indicates the maturity schedules of our time deposits in amounts of $100,000 or more as of December 31, 2010.
| December 31, 2010 | ||||||||
| (Dollars in thousands) | ||||||||
| Amount | Percentage | |||||||
| Three months or less |
$ | 216,337 | 67 | % | ||||
| Over three months through six months |
72,028 | 22 | % | |||||
| Over six months through twelve months |
24,583 | 8 | % | |||||
| Over Twelve months |
8,594 | 3 | % | |||||
| Total time deposits |
$ | 321,542 | 100 | % | ||||
There can be no assurance that we would be able to continue to replace maturing CDs at competitive rates. However, if we are unable to replace these maturing CDs with new deposits, we believe that we have adequate liquidity resources to fund these obligations through secured credit lines with the FHLB and FRB as well as with liquid assets.
Borrowings
We utilize a combination of short-term and long-term borrowings to help manage our liquidity position.
Federal Funds Purchased
Federal funds purchased generally mature within one to three business days from the transaction date. At December 31, 2010 and 2009, we did not have any federal funds purchased.
FHLB Advances
We may borrow from the FHLB on a longer term basis to provide funding for certain loan or investment securities strategies, as well as for asset liability management strategies. As of December 31, 2010 and 2009, FHLB advances totaled $350 million with average remaining maturities of 2.2 years. The weighted average rate for FHLB advances was 3.18% at year-end 2010, compared to 3.46% at year-end 2009. As of December 31, 2010, our FHLB borrowing capacity based on pledged collateral and the remaining available borrowing capacity were $543.9 million and $193.4 million, respectively. See Note 7 of Notes to Consolidated Financial Statements for more detailed information on FHLB advances.
65
Table of Contents
Secured Borrowings
Secured borrowings of $11.8 million at December 31, 2010 represents the sold portion of SBA loans sold with 90 days recourse clause. Recognition of these sales is required to be deferred until the end of the 90 day recourse period.
Subordinated Debentures
At December 31, 2010, five wholly owned subsidiary grantor trusts established by us had issued $38 million of pooled Trust Preferred Securities (“Trust Preferred Securities”). The Trust Preferred Securities accrue and pay distributions periodically at specified annual rates as provided in the related indentures for the securities. The trusts used the net proceeds from the offering to purchase a like amount of subordinated debentures (the “Debentures”) issued by us. The Debentures are the sole assets of the trusts. Our obligations under the Debentures and related documents, taken together, constitute a full and unconditional guarantee by us of the obligations of the trusts. The Trust Preferred Securities are mandatorily redeemable upon the maturity of the Debentures, or upon earlier redemption as provided in the indentures. We have the right to redeem the Debentures in whole (but not in part) on or after specific dates, at a redemption price specified in the indentures plus any accrued but unpaid interest to the redemption date. We have agreed not to pay interest on the Debentures or to issue any additional trust preferred securities without the prior written approval of the FRB.
With the adoption of FASB ASC 810, we deconsolidated the five grantor trusts. As a result, the Debentures issued by us to the grantor trusts, totaling $39.3 million, are reflected in our consolidated statements of financial condition in the liabilities section at December 31, 2010 and 2009, under the caption “subordinated debentures.” We record interest expense on the corresponding subordinated debentures in the consolidated statements of income. We also recorded $1.47 million and $1.49 million in other assets in the consolidated statements of financial condition at December 31, 2010 and 2009, respectively, for the common capital securities issued by the issuer trusts held by us.
The following table summarizes our outstanding Debentures related to the trust preferred securities at December 31, 2010.
(Dollars in thousands)
| TRUST NAME |
ISSUANCE DATE |
AMOUNT | PRINCIPAL BALANCE OF DEBENTURES |
STATED MATURITY |
ANNUALIZED COUPON RATE |
RATE AT 12/31/2010 |
INTEREST | |||||||||||||||||||
| Nara Bancorp Capital Trust I |
3/28/2001 | $ | 10,000 | $ | 10,400 | 6/8/2031 | 10.18% | 10.18 | % | June 8 and December 8 | ||||||||||||||||
| Nara Capital Trust III |
6/5/2003 | $ | 5,000 | $ | 5,155 | 6/15/2033 | |
3 month LIBOR + 3.15% |
|
3.45 | % | Every 15th of March, June, September, and December | ||||||||||||||
| Nara Statutory Trust IV |
12/22/2003 | $ | 5,000 | $ | 5,155 | 1/7/2034 | |
3 month LIBOR + 2.85% |
|
3.14 | % | Every 7th of January, April, July and October | ||||||||||||||
| Nara Statutory Trust V |
12/17/2003 | $ | 10,000 | $ | 10,310 | 12/17/2033 | |
3 month LIBOR + 2.95% |
|
3.25 | % | Every 17th of March, June, September and December | ||||||||||||||
| Nara Statutory Trust VI |
3/22/2007 | $ | 8,000 | $ | 8,248 | 6/15/2037 | |
3 month LIBOR +1.65% |
|
1.95 | % | Every 15th of March, June, September and December | ||||||||||||||
| Total Trust |
$ | 38,000 | $ | 39,268 | ||||||||||||||||||||||
66
Table of Contents
Capital Resources
Historically, our primary source of capital has primarily been the retention of earnings, net of dividend payments to shareholders. We seek to maintain capital at a level sufficient to assure our stockholders, our customers, and our regulators that our company and our bank subsidiary are financially sound. For this purpose, we perform ongoing assessments of our components of capital as well as projected sources and uses of capital in conjunction with projected increases in assets and levels of risks. We have considered, and we will continue to consider, additional sources of capital as needs arise, through the issuance of additional stock or debt. Based on our analysis of our capital needs (including any needs arising out of our financial condition and results of operations) and the input of our regulators, we may decide, or our regulators may require us, to raise additional capital. For example, we anticipate that we will raise additional capital through an offering of our common stock in connection with the pending Center Merger, although the amount of such an offering has not yet been finally decided upon. We may also use some of the proceeds of the offering in connection with redemption from the Treasury Department of our Series A Preferred Stock at some point in the future, subject to regulatory approval.
On November 21, 2008, Nara Bancorp issued 67,000 shares of its Fixed Rate Cumulative Perpetual Preferred Stock, Series A (the “Senior Preferred Stock”), having a liquidation preference of $1,000 per share, together with a ten-year warrant to purchase 1,042,531 of Nara Bancorp common stock at an exercise price of $9.64 per share, to the United States Department of the Treasury for gross proceeds of $67 million. The sale of the Senior Preferred Stock was made pursuant to the Treasury Department’s TARP Capital Purchase Program established by the Treasury Department. The warrant was reduced to 521,266 shares upon completion of qualified stock offering in November, 2009.
On October 27, 2009, we raised additional capital of approximately $82.0 million, net of costs, through a public offering of 11.5 million shares of our common stock at a price of $7.50 per share.
Our total stockholders’ equity decreased $9.4 million, or 3%, to $358.6 million at December 31, 2010 from $368.0 million at December 31, 2009. At December 31, 2010, our Tier I Capital, defined as stockholders’ equity less intangible assets, plus proceeds from the trust preferred securities, was $374.4 million, compared to $399.4 million at December 31, 2009. The decrease was primarily due to the net loss to common stockholders of $11.5 million for the year ended December 31, 2010. At December 31, 2010, Nara Bancorp’s ratio of total capital to total risk-weighted assets ratio was 17.69%, Tier I Capital to total risk weighted assets ratio was 16.42% and Tier I leverage ratio was 12.61%.
At December 31, 2010, the Bank’s total capital to total risk-weighted assets ratio was 17.27%, the Tier I Capital to total risk weighted assets ratio was 16.00% and its Tier I leverage ratio was 12.27%.
The following tables compare Nara Bancorp’s and the Bank’s actual capital at December 31, 2010 to those required by our regulatory agencies for capital adequacy classification purposes:
| As of December 31, 2010 (Dollars in thousands) | ||||||||||||||||||||||||
| Actual | Required | Excess | ||||||||||||||||||||||
| Amount | Ratio | Amount | Ratio | Amount | Ratio | |||||||||||||||||||
| Nara Bancorp, Inc |
||||||||||||||||||||||||
| Tier 1 capital to total assets |
$ | 374,353 | 12.6 | % | $ | 118,718 | 4.0 | % | $ | 255,635 | 8.6 | % | ||||||||||||
| Tier 1 risk-based capital ratio |
$ | 374,353 | 16.4 | % | $ | 91,194 | 4.0 | % | $ | 283,159 | 12.4 | % | ||||||||||||
| Total risk-based capital ratio |
$ | 403,298 | 17.7 | % | $ | 182,389 | 8.0 | % | $ | 220,909 | 9.7 | % | ||||||||||||
| As of December 31, 2010 (Dollars in thousands) | ||||||||||||||||||||||||
| Actual | Required | Excess | ||||||||||||||||||||||
| Amount | Ratio | Amount | Ratio | Amount | Ratio | |||||||||||||||||||
| Nara Bank |
||||||||||||||||||||||||
| Tier I capital to total assets |
$ | 364,397 | 12.3 | % | $ | 118,742 | 4.0 | % | $ | 245,359 | 8.3 | % | ||||||||||||
| Tier 1 risk-based capital ratio |
$ | 364,397 | 16.0 | % | $ | 91,032 | 4.0 | % | $ | 273,069 | 12.0 | % | ||||||||||||
| Total risk-based capital ratio |
$ | 393,292 | 17.3 | % | $ | 182,065 | 8.0 | % | $ | 210,931 | 9.2 | % | ||||||||||||
67
Table of Contents
Liquidity Management
Liquidity risk is the risk of reduction in our earnings or capital that would result if we were not able to meet our obligations when they come due without incurring unacceptable losses. Liquidity risk includes the risk of unplanned decreases or changes in funding sources and changes in market conditions that affect our ability to liquidate assets quickly and with minimum loss of value. Factors considered in liquidity risk management are the stability of the deposit base; the marketability, maturity, and pledging of our investments; the availability of alternative sources of funds; and our demand for credit.
The objective of our liquidity management is to have funds available to meet cash flow requirements arising from fluctuations in deposit levels and the demands of daily operations, which include funding of securities purchases, providing for customers’ credit needs, and ongoing repayment of borrowings.
We manage our liquidity actively on a daily basis and it is reviewed periodically by our management-level Asset/Liability Management Committee (“ALCO”) and the Asset Liability Management (“ALM”) Committee of the Board of Directors. This process is intended to ensure the maintenance of sufficient funds to meet our liquidity needs, including adequate cash flow for off-balance-sheet commitments. In general, our liquidity is managed daily by controlling the level of federal funds and the funds provided by cash flow from operations. To meet unexpected demands, lines of credit are maintained with the Federal Home Loan Bank of San Francisco and the Federal Reserve Bank of San Francisco. The sale of investment securities also serves as a source of funds.
Consistent with the terms of the revised Resolution adopted by the Boards of Nara Bancorp and the Bank at the request of the FRB and DFI, we have submitted a written plan to improve the oversight of liquidity and funds management by giving specific consideration to:
| • | Guidance communicated in Supervision and Regulation Letter (“SR”) 01-14: Joint Agency Advisory on Rate-Sensitive Deposits, and the development of procedures to identify, monitor, and control risks posed by potentially volatile liabilities, including significant non-relationship deposits, higher-cost funding programs, and funding concentrations. |
| • | The expansion of our Contingent Liquidity Plan to address the identified risks of the potentially volatile liabilities as well as guidance communicated in SR 10-06: Interagency Policy Statement on Funding and Liquidity Risk Management, including the addition of more extreme stress scenarios and the resultant impact on cash flow projections over various immediate and longer-term time horizons. |
We have enhanced our liquidity and funds risk management system to identify and monitor the potentially volatile retail deposits and plan to perform additional analyses of the impact to cash projections of additional liquidity stress events.
Our primary sources of liquidity are derived from financing activities, which include customer and broker deposits, federal funds facilities, and borrowings from the Federal Home Loan Bank of San Francisco and the Federal Reserve Bank Discount Window. These funding sources are augmented by payments of principal and interest on loans, proceeds from sales of loans and the liquidation or sale of securities from our available for sale portfolio. Primary uses of funds include withdrawal of and interest payments on deposits, originations of loans, purchases of investment securities, and payment of operating expenses.
Net cash inflows from operating activities totaled $135.7 million, $57.5 million and $32.2 million during 2010, 2009 and 2008, respectively. Net cash inflows from operating activities for 2010 were primarily attributable to proceeds from sales of loans.
Net cash inflows (outflows) from investing activities totaled $159.5 million, $(554.1) million and $(252.1) million during 2010, 2009 and 2008, respectively. Net cash inflows for investing activities during 2010 were primarily due to sales and maturities or called investment securities available-for-sale.
68
Table of Contents
Net cash inflows (outflows) from financing activities totaled $(248.5) million, $573.1 million and $219.8 million during 2010, 2009 and 2008, respectively. Net cash outflows from financing activities for 2010 were primarily attributable to decrease in deposits.
Our total assets decreased as we used investments to fund withdrawals of high rate retail jumbo time deposits at their maturities.
When we have more funds than required for our reserve requirements or short-term liquidity needs, we sell federal funds to other financial institutions. Conversely, when we have less funds than required, we may borrow funds from the FHLB or the FRB’s Discount Window. The maximum amount that we are currently available to borrow on an overnight basis from the FHLB and the FRB is $433.8 million. The Federal Home Loan Bank System functions as a line of credit facility for qualifying financial institutions. As a member, we are required to own capital stock in the Federal Home Loan Bank of San Francisco and may apply for advances from the FHLB utilizing as collateral, qualifying mortgage loans and certain securities as collateral for these advances. The Federal Home Loan Bank of San Francisco has suspended the regular stock dividend beginning with the fourth quarter of 2008 to preserve capital and recently reinstated partial redemptions of excess capital stock in May of 2010.
At times we maintain a portion of our liquid assets in interest-bearing cash deposits with other banks, in overnight federal funds sold to other banks, and in investment securities available-for-sale that are not pledged. Our liquid assets, consisting of cash and cash equivalent, interest-bearing cash deposits with other banks, overnight federal funds sold to other banks, liquid investment securities available for sale, and loan repayments within 30 days, were $510.5 million at December 31, 2010 compared to $713.7 million at December 31, 2009. Cash and cash equivalents, including federal funds sold were $172.3 million at December 31, 2010 compared to $125.6 million at December 31, 2009. See “Financial Condition – Deposits” for a discussion of liquidity plan for maturing CDs.
Because our primary sources and uses of funds are deposits and loans, the relationship between gross loans and total deposits provides one measure of our liquidity. Typically, the closer the ratio of loans to deposits is to or exceeds 100%, the more we rely on borrowings and other sources to provide liquidity. Alternative sources of funds such as FHLB advances, brokered deposits and other collateralized borrowings that provide liquidity as needed from diverse liability sources are an important part of our asset/liability management strategy. For 2010, our gross loan to deposit ratio averaged 98%, compared to an average ratio of 93% and 113% for 2009 and 2008, respectively.
We believe our liquidity sources to be stable and adequate to meet our day-to-day cash flow requirements. At December 31, 2010, we are not aware of any trends, events or uncertainties that had or were reasonably likely to have a material effect on our liquidity position. As of December 31, 2010, we are not aware of any material commitments for capital expenditures in the foreseeable future.
Off-Balance- Sheet Activities and Contractual Obligations
The Bank routinely engages in activities that involve, to varying degrees, elements of risk that are not reflected, in whole or in part, in the Consolidated Financial Statements. These activities are part of our normal course of business and include traditional off-balance-sheet credit-related financial instruments, interest rate swap contracts, operating leases and long-term debt.
Traditional off-balance-sheet credit-related financial instruments are primarily commitments to extend credit and standby letters of credit. These activities may require us to make cash payments to third parties in the event certain specified future events occur. The contractual amounts represent the extent of our exposure in these off-balance-sheet activities. However, since certain off-balance-sheet commitments, particularly standby letters of credit, are expected to expire or be only partially used, the total amount of commitments does not necessarily represent future cash requirements. These activities are necessary to meet the financing needs of our customers.
69
Table of Contents
The Bank also has entered into interest rate swap and cap contracts where we are required to either receive cash from or pay cash to counterparties depending on changes in interest rates. We utilize interest rate swap and cap contracts to help manage the risk of changing interest rates. Our accounting for interest rate swap and cap contracts is discussed below under Item 7A. “Quantitative and Qualitative Disclosures about Market Risk.”
We do not anticipate that our current off-balance-sheet activities will have a material impact on our future results of operations or financial condition. Further information regarding risks from our off-balance-sheet financial instruments can be found in Note 12 of the Notes to Consolidated Financial Statements and in Item 7A. — “Quantitative and Qualitative Disclosures about Market Risk.”
We lease our banking facilities and equipment under non-cancelable operating leases, which have remaining terms of up to 10 years. Our facility lease obligations are discussed in Note 12 of the Notes to Consolidated Financial Statements.
The following table summarizes Nara Bancorp’s contractual obligations and commitments to make future payments as of December 31, 2010. Payments for time deposits and borrowings do not include interest.
| Payments due by period | ||||||||||||||||||||
| Total | Less than 1 year | 1-3 years | 3-5 years | Over 5 years | ||||||||||||||||
| (Dollars in thousands) | ||||||||||||||||||||
| Contractual Obligations and Commitments |
||||||||||||||||||||
| Time Deposits |
$ | 972,535 | $ | 803,905 | $ | 156,236 | $ | 12,394 | $ | — | ||||||||||
| Subordinated Debentures |
39,268 | — | — | — | 39,268 | |||||||||||||||
| Federal Home Loan Bank Borrowings |
350,000 | 65,000 | 200,000 | 80,000 | 5,000 | |||||||||||||||
| Operating Lease Obligations |
39,622 | 7,003 | 12,862 | 11,582 | 8,175 | |||||||||||||||
| Unused committments to extend credit |
205,752 | 159,141 | 35,684 | 3,888 | 7,039 | |||||||||||||||
| Standby letters of credit |
9,777 | 9,484 | 293 | — | — | |||||||||||||||
| Other commercial letters of credit |
30,180 | 30,156 | 24 | — | — | |||||||||||||||
| Total |
$ | 1,647,134 | $ | 1,074,689 | $ | 405,099 | $ | 107,864 | $ | 59,482 | ||||||||||
Recently Issued Accounting Standards
FASB ASU 2011-01, “Receivables (Topic 310), Deferral of the Effective Date of Disclosures about Troubled Debt Restructurings in Update No. 2010-20” — Under the existing effective date in FASB ASU 2010-20, public-entity creditors would have provided disclosures about troubled debt restructuring for periods beginning on or after December 15, 2010. ASU 2011-01 temporarily defers that effective date, enabling public-entity creditors to provide those disclosures (paragraphs 310-10-50-31 through 50-34) after the Financial Accounting Standards Board clarifies the guidance for determining what constitutes a troubled debt restructuring. In the proposed Accounting Standards Update, Receivables (Topic 310), Clarifications to Accounting for Troubled Debt Restructurings by Creditors, the Board proposed that the clarifications would be effective for interim and annual periods ending after June 15, 2011. For the new disclosures about troubled debt restructurings in FASB ASU 2011-01, those clarifications would be applied retrospectively to the beginning of the fiscal year in which the proposal is adopted. We have not yet evaluated the impact of adoption of ASU 2010-29 on our Consolidated Financial Statements for periods after adoption.
FASB ASU 2010-29, “Business Combinations (Topic 805), Disclosure of Supplementary Pro Forma Information for Business Combinations” — ASU 2010-29 specifies that if a public entity presents comparative financial statements, the entity should disclose revenue and earnings of the combined entity as though the business combination(s) that occurred during the current year had occurred as of the beginning of the comparable prior annual reporting period only. The amendments also expand the supplemental pro forma disclosures to include a description of the nature and amount of material, nonrecurring pro forma adjustments directly attributable to the business combination included in the reported pro forma revenue and earnings. ASU 2010-29
70
Table of Contents
affects any public entity as defined by Topic 805 that enters into business combinations that are material on an individual or aggregate basis. This guidance is effective prospectively for business combinations for which the acquisition date is on or after the beginning of the first annual reporting period on or after December 15, 2010. We have not yet evaluated the impact of adoption of ASU 2010-29 on our Consolidated Financial Statements for periods after adoption.
FASB ASU 2010-28, “Intangibles — Goodwill and Other (Topic 350), When to Perform Step 2 of the Goodwill Impairment Test for Reporting Units with Zero or Negative Carrying Amounts” — ASU 2010-28 affects all entities that have recognized goodwill and have one or more reporting units whose carrying amount for purposes of performing Step 1 of the goodwill impairment test is zero or negative. ASU 2010-28 modifies Step 1 so that for those reporting units, an entity is required to perform Step 2 of the goodwill impairment test if it is more likely than not that a goodwill impairment exists. In determining whether it is more likely than not that a goodwill impairment exists, an entity should consider whether there are any adverse qualitative factors indicating that an impairment may exist. The qualitative factors are consistent with existing guidance, which requires that goodwill of a reporting unit be tested for impairment between annual tests if an event occurs or circumstances change that would more likely than not reduce the fair value of a reporting unit below its carrying amount. For public entities, this guidance is effective for fiscal years, and interim periods within those years, beginning after December 15, 2010. The guidance is effective for an public entity’s first annual period that ends on or after December 15, 2010. Adoption of ASU 2010-28 is not expected to have a significant impact on our Consolidated Financial Statements.
FASB ASU 2010-20, “Receivable (Topic 310), Disclosures about the Credit Quality of Financing Receivables and the Allowance for Credit Losses” — ASU 2010-20 requires new and enhanced disclosures about the credit quality of an entity’s financing receivables and its allowance for credit losses. The new and amended disclosure requirements focus on such areas as nonaccrual and past due financing receivables, allowance for credit losses related to financing receivables, impaired loans, credit quality information and modifications. The ASU requires an entity to disaggregate new and existing disclosures based on how it develops its allowance for credit losses and how it manages credit exposures. For public entities, the disclosures as of the end of a reporting period are effective for interim and annual reporting periods ending on or after December 15, 2010. The disclosures about activity that occurs during a reporting period are effective for interim and annual reporting periods beginning on or after December 15, 2010. See Note 3 of Notes to the Consolidated Financial Statements for the required disclosures at December 31, 2010.
| Item 7A. | QUANTITATIVE AND QUALITATIVE DISCLOSURES ABOUT MARKET RISK |
The objective of our asset and liability management activities is to improve our earnings by adjusting the type and mix of assets and liabilities to effectively address changing conditions and risks. Through overall management of our balance sheet and by controlling various risks, we seek to optimize our financial returns within safe and sound parameters. Our operating strategies for attaining this objective include managing our net interest margin through appropriate risk/return pricing of assets and liabilities and emphasizing growth in retail deposits, as a percentage of interest-bearing liabilities, to reduce our cost of funds. We also seek to improve earnings by controlling non-interest expense, and enhancing non-interest income. We use risk management instruments to modify interest rate characteristics of certain assets and liabilities to hedge against our exposure to interest rate fluctuations, reducing the effects these fluctuations might have on associated cash flows or values. We also perform periodic internal analyses to measure, evaluate and monitor market risk.
Interest Rate Risk
Market risk is the risk of loss to future earnings, to the fair value of our assets and liabilities, or to future cash flows that may result from changes in the price of a financial instrument. Interest rate risk is the most significant market risk impacting us. Interest rate risk occurs when interest rate sensitive assets and liabilities do not reprice simultaneously or at the same rate of interest or in equal volume. A key objective of our asset and
71
Table of Contents
liability management is to manage interest rate risk associated with changing asset and liability cash flows, values of our assets and liabilities, and market interest rate movements. The management of our interest rate risk is governed by policies reviewed and approved annually by the Board of Directors of the Bank. The Board delegates responsibility for interest rate risk management to the Asset/Liability Management (“ALM”) Committee of the board and the Asset and Liability Management Committee (“ALCO”), which is composed of the Bank’s senior executives and other designated officers.
The fundamental objective of our ALCO is to manage our exposure to interest rate fluctuations while maintaining adequate levels of liquidity and capital. ALCO meets regularly to monitor the interest rate risk, the sensitivity of our assets and liabilities to interest rate changes, the book and fair values of assets and liabilities, and our investment activities and directs changes in the composition of our interest earning assets and interest bearing liabilities. ALCO reports at least quarterly to the ALM. Our strategy has been to reduce the sensitivity of our earnings to interest rate fluctuations by more closely matching the effective maturities or repricing characteristics of our assets and liabilities. Certain assets and liabilities, however, may react in different degrees to changes in market interest rates. Further, interest rates on certain types of assets and liabilities may fluctuate prior to changes in market interest rates, while interest rates on other types may lag behind. We consider the anticipated effects of these factors when implementing our interest rate risk management objectives.
Swaps and Caps
As part of our asset and liability management strategy, we may enter into derivative financial instruments, such as interest rate swaps, caps and floors, with the overall goal of minimizing the impact of interest rate fluctuations on our net interest margin. Interest rate swaps and caps involve the exchange of fixed-rate and variable-rate interest payment obligations without the exchange of the underlying notional amounts.
In January of 2008, we entered into five interest rate swap agreements with an aggregate notional amount of $50 million. Under these swap agreements, we received a floating rate, resetting semi-annually based on the 6 Month London-Interbank Offered Rate (“6 Mo. LIBOR”), and paid a fixed rate of 3.57%, until January 2010. These interest rate swap agreements are considered “free-standing” due to non-designation of a hedge relationship to any of its financial assets or liabilities. These interest swap agreements matured on January 14, 2010 and the Company did not have any outstanding interest rate swap agreements at December 31, 2010.
During the third quarter of 2009, we entered into two two-year interest rate cap agreements with an aggregate notional amount of $50 million. Under these cap agreements, we receive quarterly payments from the counterparty when the quarterly resetting 3 Month London-Interbank Offered Rate (“3 Mo. LIBOR”) exceeds the strike level of 2.00%. The upfront fee paid to the counterparty in entering into these two interest rate cap agreements was $359 thousand. During the first quarter of 2010, we entered into another three-year interest rate cap agreement with an aggregate notional amount of $50 million. Under this cap agreement, we also receive quarterly payments from the counterparty when the quarterly resetting 3 Mo. LIBOR exceeds the strike level of 2.00%. The upfront fee paid to the counterparty in entering into this interest rate cap agreement was $890 thousand. These interest rate cap agreements are considered “free-standing” due to non-designation of a hedge relationship to any of its financial assets or liabilities. Under FASB ASC 815, valuation gains or losses on interest rate caps not designated as hedging instruments are recognized in earnings. At December 31, 2010, the aggregate fair value of the outstanding interest rate caps was $167 thousand and we recognized mark-to-market losses on valuation of $901 thousand in 2010. See Note 17 of Notes to Consolidated Financial Statements for more detailed information on swaps and caps.
Interest Rate Sensitivity
Our monitoring activities related to managing interest rate risk include both interest rate sensitivity “gap” analysis and the use of a simulation model. While traditional gap analysis provides a simple picture of the interest rate risk embedded in the statement of financial condition, it provides only a static view of interest rate
72
Table of Contents
sensitivity at a specific point in time and does not measure the potential volatility in forecasted results relating to changes in market interest rates over time. Accordingly, we combine the use of gap analysis with the use of a simulation model, which provides a dynamic assessment of interest rate sensitivity.
The interest rate sensitivity gap is defined as the difference between the amount of interest-earning assets anticipated to reprice within a specific time period and the amount of interest-bearing liabilities anticipated to reprice within that same time period. A gap is considered positive when the amount of interest rate sensitive assets repricing within a specific time period exceeds the amount of interest-bearing liabilities repricing within that same time period. A positive cumulative gap suggests that earnings will increase when interest rates rise and decrease when interest rates fall. A negative cumulative gap suggests that earnings will increase when interest rates fall and decrease when interest rates rise.
The following table illustrates our combined asset and liability repricing as of December 31, 2010:
| 0 - 90 days or Less |
Over 90 Days to 365 days |
1 - 5 years Amount |
Over 5 years Amount |
Total | ||||||||||||||||
| (Dollars in thousands) | ||||||||||||||||||||
| Total Investments(1) |
$ | 199,692 | $ | 77,567 | $ | 273,355 | $ | 150,493 | $ | 701,107 | ||||||||||
| Loan Total Total Loans(2) |
659,644 | 239,470 | 916,158 | 361,661 | 2,176,933 | |||||||||||||||
| Rate Sensitive Assets |
859,336 | 317,037 | 1,189,513 | 512,154 | 2,878,040 | |||||||||||||||
| TCD $100,000 or more |
216,337 | 96,611 | 8,594 | — | 321,542 | |||||||||||||||
| TCD under $100,000 |
123,520 | 367,437 | 160,036 | — | 650,993 | |||||||||||||||
| Money Market accounts and other |
688,593 | — | — | — | 688,593 | |||||||||||||||
| Savings accounts |
69,919 | 32,491 | 19,663 | 4,182 | 126,255 | |||||||||||||||
| Borrowings from FHLB |
50,000 | 15,000 | 280,000 | 5,000 | 350,000 | |||||||||||||||
| Subordinated Debentures |
28,000 | — | — | 10,000 | 38,000 | |||||||||||||||
| Rate Sensitive Liabilities |
1,176,369 | 511,539 | 468,293 | 19,182 | 2,175,383 | |||||||||||||||
| Interest Rate Cap |
100,000 | (50,000 | ) | (50,000 | ) | — | ||||||||||||||
| Net Gap Position |
$ | (217,033 | ) | $ | (244,502 | ) | $ | 671,220 | $ | 492,972 | ||||||||||
| Cumulative Gap Position |
$ | (217,033 | ) | $ | (461,535 | ) | $ | 209,685 | $ | 702,657 | ||||||||||
| (1) | Inludes investment securities, federal funds sold, FRB stock, FHLB stocks, and interest bearing deposits with other financial institutions. |
| (2) | Includes loans held for sale of $26.9 million. |
The simulation model discussed above provides our ALCO with the ability to simulate our net interest income. In order to measure, at December 31, 2010, the sensitivity of our forecasted net interest income to changing interest rates, both in rising and falling interest rate scenarios, were projected and compared to base market interest rate forecasts. One application of our simulation model measures the impact of market interest rate changes on the net present value of estimated cash flows from our assets and liabilities, defined as our market value of equity. This analysis assesses the changes in market values of interest rate sensitive financial instruments that would occur in response to an instantaneous and sustained increase in market interest rates.
73
Table of Contents
Our net interest income and market value of equity exposure related to these hypothetical changes in market interest rates are illustrated in the following table.
| December 31, 2010 | December 31, 2009 | |||||||||||||||
| Simulated Rate Changes |
Estimated Net Interest Income Sensitivity |
Market Value Of Equity Volatility |
Estimated Net Interest Income Sensitivity |
Market Value Of Equity Volatility |
||||||||||||
| + 200 basis points |
(3.12 | )% | (4.62 | )% | (6.47 | )% | (10.29 | )% | ||||||||
| + 100 basis points |
(2.92 | )% | (2.27 | )% | (4.06 | )% | (4.31 | )% | ||||||||
| - 100 basis points |
0.56 | % | 0.24 | % | 2.35 | % | 1.89 | % | ||||||||
| - 200 basis points |
(4.33 | %) | (0.57 | )% | (1.61 | %) | 1.77 | % | ||||||||
The estimated sensitivity does not necessarily represent our forecast of future results and the estimated results may not be indicative of actual changes to our net interest income. These estimates are based upon a number of assumptions including: the nature and timing of interest rate levels including yield curve shape, prepayment on loans and securities, pricing strategies on loans and deposits, and replacement of asset and liability cash flows. While the assumptions used are based on current economic and local market conditions, there is no assurance as to the predictive nature of these conditions including how customer preferences or competitor influences may change. The ALM, which oversees our interest rate risk management, has established the exposure limits for acceptable changes in net interest income and market value of equity related to these hypothetical changes in market interest rates. Given the limitations of the analyses, management believes that these hypothetical changes are considered tolerable and manageable as of December 31, 2010.
| Item 8. | FINANCIAL STATEMENTS AND SUPPLEMENTARY DATA |
The following Consolidated Financial Statements of Nara Bancorp, together with the reports thereon of Crowe Horwath LLP, begin on page F-1 of this Report and are incorporated herein by reference:
Report of Independent Registered Public Accounting Firm
Consolidated Statements of Financial Condition as of December 31, 2010 and 2009
Consolidated Statements of Income for the Years Ended December 31, 2010, 2009 and 2008
Consolidated Statements of Cash Flows for the Years Ended December 31, 2010, 2009 and 2008
Notes to Consolidated Financial Statements for the Years Ended December 31, 2010, 2009 and 2008
See “Item 15. Exhibits and Financial Statement Schedules” for financial statements filed as a part of this Report.
| Item 9. | CHANGES IN AND DISAGREEMENTS WITH ACCOUNTANTS ON ACCOUNTING AND FINANCIAL DISCLOSURE |
None
| Item 9A. | CONTROLS AND PROCEDURES |
a. Evaluation of disclosure controls and procedures
We conducted an evaluation under the supervision and with the participation of our management, including our Chief Executive Officer and Chief Financial Officer, of the effectiveness of the design and operation of our disclosure controls and procedures (as defined in Rule 13a-15(e) under the Exchange Act) as of December 31, 2010. Based upon that evaluation, our Chief Executive Officer and Chief Financial Officer determined that our disclosure controls and procedures were effective to ensure that material information required to be disclosed by
74
Table of Contents
us in the reports that we file or submit under the Exchange Act is recorded, processed, summarized and reported as and when required. The consolidated financial statements were prepared in conformity with accounting principles generally accepted in the United States of America and include amounts based on management’s best estimates and judgments.
b. Management’s Annual Report on Internal Control Over Financial Reporting
The management of Nara Bancorp, Inc. (the “Company”) is responsible for establishing and maintaining adequate internal control over financial reporting for the Company as defined in Rule 13a-15(f) under the Exchange Act. This system, which management has chosen to base on the framework set forth in Internal Control-Integrated Framework, published by the Committee of Sponsoring Organizations of the Treadway Commission (“COSO”), and which is effected by the Company’s board of directors, management and other personnel, is designed to provide reasonable assurance regarding the reliability of financial reporting and the preparation of financial statements for external purposes in accordance with accounting principles generally accepted in the United States of America.
The Company’s internal control over financial reporting includes those policies and procedures that (1) pertain to the maintenance of records that, in reasonable detail, accurately and fairly reflect the transactions and dispositions of the assets of the Company; (2) provide reasonable assurance that transactions are recorded as necessary to permit preparation of financial statements in accordance with generally accepted accounting principles, and that receipts and expenditures of the Company are being made only in accordance with authorizations of management and the directors of the Company; and (3) provide reasonable assurance regarding prevention or timely detection of unauthorized acquisition, use, or disposition of the Company’s assets that could have a material effect on the financial statements.
Because of its inherent limitations, a system of internal control over financial reporting can provide only reasonable assurance and may not prevent or detect misstatements. Further, because of changes in conditions, effectiveness of internal controls over financial reporting may vary over time.
With the participation of the Company’s Chief Executive Officer and Chief Financial Officer, management has conducted an evaluation of the effectiveness of the Company’s system of internal control over financial reporting. Based on this evaluation, management determined that the Company’s system of internal control over financial reporting was effective as of December 31, 2010.
| /S/ ALVIN D. KANG | /S/ PHILIP E. GULDEMAN | |||
| Alvin D. Kang | Phillip E. Guldeman | |||
| President and Chief Executive Officer |
Executive Vice President and Chief Financial Officer | |||
| Los Angeles, California | Los Angeles, California | |||
| February 18, 2011 | February 18, 2011 | |||
c. Evaluation of Changes in Internal Control Over Financial Reporting
There were no significant changes in our internal control over financial reporting or in other factors in the fourth quarter of 2010 that have materially affected or are reasonably likely to materially affect, the Company’s internal control over financial reporting.
d. Report of Independent Registered Public Accounting Firm
Our independent registered public accounting firm has issued a audit report on our internal control over financial reporting which is included on page F-2 of this report.
| Item 9B. | OTHER INFORMATION |
None.
75
Table of Contents
| Item 10. | DIRECTORS, EXECUTIVE OFFICERS AND CORPORATE GOVERNANCE |
The information required by this Item is incorporated herein by reference to the section of Nara Bancorp’s definitive Proxy Statement for its 2011 Annual Meeting of Stockholders (the “2011 Proxy Statement”) entitled “Election of Directors” and the discussion of the Code of Ethics and Business Conduct in the Nomination and Governance Committee Report. The 2011 Proxy Statement will be filed with the SEC within 120 days after December 31, 2010.
| Item 11. | EXECUTIVE COMPENSATION |
The information required by this Item is incorporated herein by reference to the sections of the 2011 Proxy Statement entitled “Election of Directors, “Director Compensation,” “Compensation Discussion and Analysis” and “Compensation Committee Interlocks and Insider Participation.”
| Item 12. | SECURITY OWNERSHIP OF CERTAIN BENEFICIAL OWNERS AND MANAGEMENT AND RELATED STOCKHOLDER MATTERS. |
The information required by this Item is incorporated herein by reference to the sections of the 2011 Proxy Statement entitled “Security Ownership of Certain Beneficial Owners.”
| Item 13. | CERTAIN RELATIONSHIPS AND RELATED TRANSACTIONS, AND DIRECTOR INDEPENDENCE |
The information required by this Item is incorporated herein by reference to the sections of the 2011 Proxy Statement entitled “Certain Relationships and Related Transactions.”
| Item 14. | PRINCIPAL ACCOUNTANT FEES AND SERVICES |
The information required by this Item is incorporated herein by reference to the section of the 2011 Proxy Statement entitled “Ratification of the Selection of the Independent Registered Public Accounting Firm.”
76
Table of Contents
PART IV
| Item 15. | EXHIBITS AND FINANCIAL STATEMENT SCHEDULES |
(a) and (c) Financial Statements and Schedules.
The financial statements listed under Item 8. “Financial Statements and Supplementary Data” are filed as part of this Annual Report on Form 10-K. All schedules have been omitted since the required information is not applicable or is not present in amounts sufficient to require submission of the schedule or because the information required is included in the Financial Statements and related notes.
(b) List of Exhibits
| Number |
Description | |
| 2.1 | Agreement and Plan of Merger, dated as of December 9, 2010, between Nara Bancorp, Inc. and Center Financial Corporation (incorporated herein by reference to the Current Report on Form 8-K, Exhibit 2.1, filed with the SEC on December 9, 2010) | |
| 3.1 | Certificate of Incorporation of the Company, filed with the Delaware Secretary of State on June 5, 2000 (incorporated herein by reference to Appendix III to the prospectus included in the Registration Statement on Form S-4 filed with the SEC on November 16, 2000, SEC file number 333-50126) | |
| 3.2 | Certificate of Amendment of Certificate of Incorporation of the Company, filed with the Delaware Secretary of State on May 31, 2002 (incorporated herein by reference to the Registration Statement on Form S-8, Exhibit 3.3, filed with the SEC on February 5, 2003, SEC file number 333-102974) | |
| 3.3 | Certificate of Amendment of Certificate of Incorporation of the Company, filed with the Delaware Secretary of State on June 1, 2004 (incorporated herein by reference to the Quarterly Report on Form 10-Q, Exhibit 3.1.1, filed with the SEC on November 8, 2004) | |
| 3.4 | Certificate of Amendment of Certificate of Incorporation of the Company, filed with the Delaware Secretary of State on November 2, 2005 (incorporated herein by reference to the Proxy Statement on Schedule 14A, Appendix B, filed with the SEC on September 6, 2005) | |
| 3.5 | Certificate of Amendment of Certificate of Incorporation of the Company, filed with the Delaware Secretary of State on July 20, 2007 (incorporated herein by reference to the Proxy Statement on Schedule 14A, Appendix C, filed with the SEC on April 19, 2007) | |
| 3.6 | Certificate of Amendment of Certificate of Incorporation of the Company, filed with the Delaware Secretary of State on August 6, 2010 (incorporated herein by reference to the Proxy Statement on Schedule 14A, Proposal No. 4, filed with the SEC on May 24, 2010) | |
| 3.7 | Amended and Restated Bylaws of Nara Bancorp, Inc. (incorporated herein by reference to the Current Report on Form 8-K, Exhibit 3.1, filed with the SEC on December 28, 2007) | |
| 4.1 | Form of Stock Certificate of Nara Bancorp, Inc. (incorporated herein by reference to Pre- Effective Amendment No.1 to the Registration Statement on Form S-4, Exhibit 4.1, filed with the SEC on December 5, 2000, SEC file number 333-50126) | |
| 4.2 | Amended and Restated Declaration of Trust, dated March 28, 2001, by and among Delaware Trustee, Wilmington Trust Company as Property Trustee, Nara Bancorp and the Administrative Trustees named therein (incorporated herein by reference to the Annual Report on Form 10-K, Exhibit 4.5, for the year ended December 31, 2001, filed with the SEC on April 1, 2002) | |
| 4.3 | Indenture, dated March 28, 2001, between Nara Bancorp and Wilmington Trust Company as Debenture Trustee (incorporated herein by reference to the Annual Report on Form 10-K, Exhibit 4.6, for the year ended December 31, 2001, filed with the SEC on April 1, 2002) | |
| 4.4 | Common Securities Guarantee Agreement, dated March 28, 2001, of Nara Bancorp (incorporated herein by reference to the Annual Report on Form 10-K, Exhibit 4.7, for the year ended December 31, 2001, filed with the SEC on April 1, 2002) | |
77
Table of Contents
| 4.5 | Capital Securities Guarantee Agreement, dated March 28, 2001, between Nara Bancorp and Wilmington Trust Company as Guarantee Trustee (incorporated herein by reference to the Annual Report on Form 10-K, Exhibit 4.8, for the year ended December 31, 2001, filed with the SEC on April 1, 2002) | |
| 4.6 | Amended and Restated Declaration of Trust, dated June 5, 2003, by and among The Bank of New York as Property Trustee, The Bank of New York (Delaware) as Delaware Trustee, Nara Bancorp as Depositor and the Administrative Trustees as named therein (incorporated herein by reference to the Current Report on Form 8-K/A, Exhibit 99.1, filed with the SEC on May 2, 2008) | |
| 4.7 | Junior Subordinated Indenture, dated June 5, 2003, between the Nara Bancorp as Issuer and The Bank of New York as Trustee (incorporated herein by reference to the Current Report on Form 8-K/A, Exhibit 99.2, filed with the SEC on May 2, 2008) | |
| 4.8 | Guarantee Agreement, dated June 5, 2003, by and between Nara Bancorp and The Bank of New York as Guarantee Trustee (incorporated herein by reference to the Current Report on Form 8-K/A, Exhibit 99.3, filed with the SEC on May 2, 2008) | |
| 4.9 | Amended and Restated Declaration of Trust, dated December 17, 2003, by and among U.S. Bank National Association as Institutional Trustee, Nara Bancorp as Sponsors and the Administrators as named therein (incorporated herein by reference to the Current Report on Form 8-K/A, Exhibit 99.4, filed with the SEC on May 2, 2008) | |
| 4.10 | Indenture, dated December 17, 2003 between Nara Bancorp as Issuer and U.S. Bank National Association as Trustee (incorporated herein by reference to the Current Report on Form 8-K, Exhibit 99.5, filed with the SEC on May 2, 2008) | |
| 4.11 | Guarantee Agreement, dated December 17, 2003, by and between Nara Bancorp and U.S. Bank National Association as Guarantee Trustee (incorporated herein by reference to the Current Report on Form 8-K, Exhibit 99.6, filed with the SEC on May 2, 2008) | |
| 4.12 | Amended and Restated Declaration of Trust, dated December 22, 2003, by and among Wells Fargo Delaware Trust Company as Delaware Trustee and Nara Bancorp as Sponsor (incorporated herein by reference to the Current Report on Form 8-K, Exhibit 99.7, filed with the SEC on May 2, 2008) | |
| 4.13 | Indenture, dated December 22, 2003, between Nara Bancorp, Inc. as Issuer and Wells Fargo Bank, National Association as Trustee (incorporated herein by reference to the Current Report on Form 8-K, Exhibit 99.8, filed with the SEC on May 2, 2008) | |
| 4.14 | Guarantee Agreement, dated December 22, 2003, by and between Nara Bancorp and Wells Fargo Bank, National Association as Guarantee Trustee (incorporated herein by reference to the Current Report on Form 8-K, Exhibit 99.9, filed with the SEC on May 2, 2008) | |
| 4.15 | Amended and Restated Declaration of Trust, dated March 22, 2007, by and among Wilmington Trust Company, Nara Bancorp, Inc., and the Administrators named therein (incorporated herein by reference to the Current Report on Form 8-K, Exhibit 4.1, filed with the SEC on March 22, 2007) | |
| 4.16 | Indenture, dated March 22, 2007, by and between Nara Bancorp, Inc. and Wilmington Trust Company (incorporated herein by reference to the Current Report on Form 8-K, Exhibit 4.2, filed with the SEC on March 22, 2007) | |
| 4.17 | Guarantee Agreement, dated March 22, 2007, by and between Nara Bancorp, Inc. and Wilmington Trust Company (incorporated herein by reference to the Current Report on Form 8-K, Exhibit 4.3, filed with the SEC on March 22, 2007) | |
| 4.18 | Certificate of Designations for Fixed Rate Cumulative Perpetual Preferred Stock, Series A of Nara Bancorp, Inc. (incorporated herein by reference to the Current Report on Form 8-K, Exhibit 4.1, filed with the SEC on November 28, 2008) | |
78
Table of Contents
| 4.19 | Form of Nara Bancorp, Inc. Series A Preferred Stock Certificate (incorporated herein by reference to the Current Report on Form 8-K, Exhibit 4.2, filed with the SEC on November 28, 2008) | |
| 4.20 | Warrant to Purchase Common Stock of Nara Bancorp, Inc. (incorporated herein by reference to the Current Report on Form 8-K, Exhibit 4.3, filed with the SEC on November 28, 2008) | |
| 10.1 | Amended and Restated Nara Bancorp, Inc. 2007 Equity Incentive Plan (incorporated herein by reference to the Current Report on Form 8-K, filed with the SEC on July 26, 2007) | |
| 10.2 | Nara Bancorp, Inc. 2001 Nara Bank 2000 Continuation Long Term Incentive Plan (incorporated herein by reference to the Registration Statement on Form S-8, Exhibit 99.2, filed with the SEC on April 9, 2001, SEC file number 333-58508) | |
| 10.3 | Nara Bank Deferred Compensation Plan (incorporated herein by reference to the Annual Report on Form 10-K, Exhibit 10.3, for the year ended December 31, 2001, filed with the SEC on April 1, 2002) | |
| 10.4 | Tax Sharing Agreement among Nara Bancorp, Nara Bank, N.A., Nara Bancorp Capital Trust I and Nara Loan Center Corporation (incorporated herein by reference to the Annual Report on Form 10-K, Exhibit 10.11, for the year ended December 31, 2001, filed with the SEC on April 1, 2002) | |
| 10.5 | Affiliate Agreement between Nara Bancorp and Nara Bank, N.A. (incorporated herein by reference to the Annual Report on Form 10-K, Exhibit 10.12, for the year ended December 31, 2001, filed with the SEC on April 1, 2002) | |
| 10.6 | Form of Nara Bancorp, Inc. Option Agreement (entered into by directors Jesun Paik and named executive officers Alvin D. Kang, Bonita I. Lee, and Kyu Kim) (incorporated herein by reference to the Annual Report on Form 10-K, Exhibit 10.6, for the year ended December 31, 2006, filed with the SEC on March 15, 2007) | |
| 10.7 | Form of Change in Control Agreement (entered into by named executive officer Alvin D. Kang, Bonita I. Lee, and Mark H. Lee) (incorporated herein by reference to the Current Report on Form 8-K, Exhibit 99.1, filed with the SEC on August 6, 2008) | |
| 10.8 | Form of Nara Bank Long Term Incentive Agreement (entered into by named executive officers Alvin D. Kang, Kyu Kim, and Bonita I. Lee) (incorporated herein by reference to the Annual Report on Form 10-K, Exhibit 10.10, for the year ended December 31, 2008, filed with the SEC on March 3, 2009) | |
| 10.9 | Form of Nara Bancorp, Inc. 2007 Equity Incentive Plan Notice of Performance Unit/ Share Award Grant and Agreement (entered into by directors Jesun Paik, Hyon M. (John) Park, Ki Suh Park, and Scott Whang and named executive officers Alvin D. Kang, Bonita I. Lee, Kyu Kim, and Mark H. Lee) (incorporated herein by reference to the Current Report on Form 8-K, Exhibit 10.2, filed with the SEC on December 6, 2007) | |
| 10.10 | Letter Agreement, between Nara Bancorp, Inc. and the United States Treasury, dated November 21, 2008, including the Securities Purchase Agreement attached thereto, with respect to the issuance and sale of the Senior Preferred Stock and the Warrant referred to therein (incorporated herein by reference to the Current Report on Form 8-K/A, Exhibit 10.1, filed with the SEC on December 17, 2008) | |
| 10.11 | Employment offer letter among Nara Bancorp, Inc., Nara Bank and Philip E. Guldeman, dated November 10, 2010 and effective December 17, 2010 (incorporated herein by reference to the Current Report on Form 8-K, Exhibit 99.1, filed with the SEC on December 20, 2010) | |
| 12.1 | Computation of Ratio of Earnings to Fixed Charges and Preferred Stock Dividends and Discount Accretion* | |
| 14.1 | Director Code of Ethics and Business Conduct* | |
| 14.2 | Code of Ethics and Business Conduct* | |
79
Table of Contents
| 21.1 | List of Subsidiaries (incorporated by reference to the Annual Report on Form 10-K, Exhibit 21.1, for the year ended December 31, 2009, filed with the SEC on March 15, 2010) | |
| 23.1 | Consent of Crowe Horwath LLP * | |
| 31.1 | Certification of Chief Executive Officer pursuant to section 302 of Sarbanes-Oxley of 2002* | |
| 31.2 | Certification of Chief Financial Officer pursuant to section 302 of Sarbanes-Oxley of 2002* | |
| 32.1 | Certification of Chief Executive Officer pursuant to section 906 of the Public Company Accounting Reform and Investor Protection Act of 2002* | |
| 32.2 | Certification of Chief Financial Officer pursuant to section 906 of the Public Company Accounting Reform and Investor Protection Act of 2002* | |
| 99.1 | Certification of Chief Executive Officer pursuant to Interim Final Rule—TARP Standards for Compensation and Corporate Governance at 31 CFR Part 30* | |
| 99.2 | Certification of Chief Financial Officer pursuant to Interim Final Rule—TARP Standards for Compensation and Corporate Governance at 31 CFR Part 30* | |
| * | Filed herewith |
Except as noted above, Form 8-K, Form 10-K and proxy statements filed by the Company and identified in the Exhibit Index have SEC file number 000-50245.
80
Table of Contents
SIGNATURES
Pursuant to the requirements of Section 13 or 15(d) of the Securities Exchange Act of 1934, the registrant has duly caused this report to be signed on its behalf by the undersigned, thereunto duly authorized.
| NARA BANCORP, INC. | ||
| By: | /s/ ALVIN D. KANG | |
| Alvin D. Kang | ||
| President and Chief Executive Officer | ||
Pursuant to the requirements of the Securities Exchange Act of 1934, this report has been signed below by the following persons on behalf of the registrant in the capacities and on the dates indicated.
| By: | /S/ KI SUH PARK |
February 18, 2011 | Ki Suh Park | |||
| Director and Chairman of Company the Bank | ||||||
| By: | /S/ STEVEN D. BROIDY |
February 18, 2011 | Steven D. Broidy | |||
| Director and Vice-Chairman of the Bank | ||||||
| By: | /S/ LOUIS COSSO |
February 18, 2011 | Louis Cosso | |||
| Director | ||||||
| By: | /S/ JESUN PAIK |
February 18, 2011 | Jesun Paik | |||
| Director | ||||||
| By: | /S/ JOHN PARK |
February 18, 2011 | John Park | |||
| Director | ||||||
| By: | /S/ SCOTT YOON-SUK WHANG |
February 18, 2011 | Scott Yoon-Suk Whang | |||
| Director | ||||||
| By | /S/ ALVIN D. KANG |
February 18, 2011 | Alvin D. Kang | |||
| Director, President and Chief Executive Officer (Principal Executive Officer) | ||||||
| By | /S/ PHILIP E. GULDEMAN |
February 18, 2011 | Philip E. Guldeman | |||
| Executive Vice President and Chief Financial Officer (Principal Financial and Accounting Officer) | ||||||
81
Table of Contents
Nara Bancorp, Inc. and Subsidiaries
Consolidated Financial Statements at December 31, 2010 and 2009 and
for Each of the Three Years in the Period Ended December 31, 2010 and
Report of Independent Registered Public Accounting Firm thereon.
F-1
Table of Contents
REPORT OF INDEPENDENT REGISTERED PUBLIC ACCOUNTING FIRM
Board of Directors and Stockholders
Nara Bancorp, Inc.
Los Angeles, California
We have audited the accompanying consolidated statements of financial condition of Nara Bancorp, Inc. and Subsidiaries (the Company) as of December 31, 2010 and 2009, and the related consolidated statements of income, changes in stockholders’ equity and cash flows for each of the years in the three-year period ended December 31, 2010. We also have audited the Company’s internal control over financial reporting as of December 31, 2010, based on criteria established in Internal Control—Integrated Framework issued by the Committee of Sponsoring Organizations of the Treadway Commission (COSO). The Company’s management is responsible for these consolidated financial statements, for maintaining effective internal control over financial reporting, and for its assessment of the effectiveness of internal control over financial reporting included in the accompanying Management’s Report on Internal Control Over Financial Reporting located in Item 9a of Form 10-K . Our responsibility is to express an opinion on these financial statements and an opinion on the Company’s internal control over financial reporting based on our audits.
We conducted our audits in accordance with the standards of the Public Company Accounting Oversight Board (United States). Those standards require that we plan and perform the audits to obtain reasonable assurance about whether the financial statements are free of material misstatement and whether effective internal control over financial reporting was maintained in all material respects. Our audit of the financial statements included examining, on a test basis, evidence supporting the amounts and disclosures in the financial statements, assessing the accounting principles used and significant estimates made by management, and evaluating the overall financial statement presentation. Our audit of internal control over financial reporting included obtaining an understanding of internal control over financial reporting, assessing the risk that a material weakness exists, testing and evaluating the design and operating effectiveness of internal control based on the assessed risk, and performing such other procedures as we considered necessary in the circumstances. We believe that our audits provide a reasonable basis for our opinions.
A company’s internal control over financial reporting is a process designed to provide reasonable assurance regarding the reliability of financial reporting and the preparation of financial statements for external purposes in accordance with generally accepted accounting principles. A company’s internal control over financial reporting includes those policies and procedures that (1) pertain to the maintenance of records that, in reasonable detail, accurately and fairly reflect the transactions and dispositions of the assets of the company; (2) provide reasonable assurance that transactions are recorded as necessary to permit preparation of financial statements in accordance with generally accepted accounting principles, and that receipts and expenditures of the company are being made only in accordance with authorizations of management and directors of the company; and (3) provide reasonable assurance regarding prevention or timely detection of unauthorized acquisition, use, or disposition of the company’s assets that could have a material effect on the financial statements.
Because of its inherent limitations, internal control over financial reporting may not prevent or detect misstatements. Also, projections of any evaluation of effectiveness to future periods are subject to the risk that controls may become inadequate because of changes in conditions, or that the degree of compliance with the policies or procedures may deteriorate.
In our opinion, the consolidated financial statements referred to above present fairly, in all material respects, the financial position of Nara Bancorp, Inc. and Subsidiaries as of December 31, 2010 and 2009, and the results of their operations and their cash flows for each of the years in the three-year period ended December 31, 2010 in conformity with accounting principles generally accepted in the United States of America. Also in our opinion, the Company maintained, in all material respects, effective internal control over financial reporting as of December 31, 2010, based on criteria established in Internal Control—Integrated Framework issued by the Committee of Sponsoring Organizations of the Treadway Commission (COSO).
CROWE HORWATH LLP
Sherman Oaks, California
February 18, 2011
F-2
Table of Contents
NARA BANCORP, INC. AND SUBSIDIARIES
CONSOLIDATED STATEMENTS OF FINANCIAL CONDITION
DECEMBER 31, 2010 AND 2009
| 2010 | 2009 | |||||||
| (In thousands, except share data) | ||||||||
| ASSETS | ||||||||
| Cash and cash equivalents: |
||||||||
| Cash and due from banks |
$ | 23,916 | $ | 23,739 | ||||
| Interest-bearing deposit at Federal Reserve Bank |
148,415 | 81,853 | ||||||
| Federal funds sold |
— | 20,000 | ||||||
| Total cash and cash equivalents |
172,331 | 125,592 | ||||||
| Securities available for sale, at fair value |
528,262 | 782,690 | ||||||
| Loans held for sale, at the lower of cost or fair value |
26,927 | 4,756 | ||||||
| Loans receivable, net of allowance for loan losses (December 31, 2010—$62,320 ; December 31, 2009—$59,424) |
2,085,425 | 2,162,009 | ||||||
| Other real estate owned |
1,581 | 2,044 | ||||||
| Federal Reserve Bank stock, at cost |
6,367 | 4,399 | ||||||
| Federal Home Loan Bank (FHLB) stock, at cost |
17,717 | 19,935 | ||||||
| Premises and equipment, net |
10,915 | 10,865 | ||||||
| Accrued interest receivable |
8,648 | 11,261 | ||||||
| Deferred tax assets, net |
37,072 | 28,875 | ||||||
| Customers’ liabilities on acceptances |
11,528 | 10,488 | ||||||
| Bank owned life insurance |
24,117 | 23,571 | ||||||
| Goodwill |
2,509 | 2,509 | ||||||
| Other intangible assets, net |
534 | 1,042 | ||||||
| Prepaid FDIC insurance |
9,639 | 14,148 | ||||||
| Other assets |
19,724 | 23,773 | ||||||
| Total assets |
$ | 2,963,296 | $ | 3,227,957 | ||||
F-3
Table of Contents
NARA BANCORP, INC. AND SUBSIDIARIES
CONSOLIDATED STATEMENTS OF FINANCIAL CONDITION (continued)
DECEMBER 31, 2010 AND 2009
| 2010 | 2009 | |||||||
| (In thousands, except share data) | ||||||||
| LIABILITIES AND STOCKHOLDERS’ EQUITY | ||||||||
| LIABILITIES: |
||||||||
| Deposits: |
||||||||
| Noninterest bearing |
$ | 388,731 | $ | 330,489 | ||||
| Interest bearing: |
||||||||
| Money market and other |
688,593 | 524,188 | ||||||
| Savings deposits |
126,255 | 136,804 | ||||||
| Time deposits of $100,000 or more |
321,542 | 932,699 | ||||||
| Other time deposits |
650,993 | 510,010 | ||||||
| Total deposits |
2,176,114 | 2,434,190 | ||||||
| FHLB borrowings |
350,000 | 350,000 | ||||||
| Subordinated debentures |
39,268 | 39,268 | ||||||
| Secured borrowings |
11,758 | — | ||||||
| Accrued interest payable |
4,830 | 12,674 | ||||||
| Acceptances outstanding |
11,528 | 10,488 | ||||||
| Other liabilities |
11,235 | 13,362 | ||||||
| Total liabilities |
2,604,733 | 2,859,982 | ||||||
| COMMITMENTS AND CONTINGENCIES (Note 12) |
||||||||
| STOCKHOLDERS’ EQUITY: |
||||||||
| Preferred stock, $0.001 par value—authorized 10,000,000 undesignated shares; issued and outstanding 67,000 shares of Fixed Rate Cumulative Perpetual Preferred Stock, Series A with a liquidation preference of $67,428,000 at December 31, 2010 and 2009 |
67,000 | 67,000 | ||||||
| Preferred stock discount |
(2,797 | ) | (3,737 | ) | ||||
| Common stock, $0.001 par value—authorized, 100,000,000 shares; issued and outstanding, 37,983,027 and 37,824,007 shares at December 31, 2010 and 2009, respectively |
38 | 38 | ||||||
| Capital surplus |
171,364 | 169,806 | ||||||
| Retained earnings |
120,361 | 131,891 | ||||||
| Accumulated other comprehensive income, net |
2,597 | 2,977 | ||||||
| Total stockholders’ equity |
358,563 | 367,975 | ||||||
| Total liabilities and stockholders’ equity |
$ | 2,963,296 | $ | 3,227,957 | ||||
See accompanying notes to consolidated financial statements.
F-4
Table of Contents
NARA BANCORP, INC. AND SUBSIDIARIES
CONSOLIDATED STATEMENTS OF INCOME
YEARS ENDED DECEMBER 31, 2010, 2009 AND 2008
| 2010 | 2009 | 2008 | ||||||||||
| (In thousands, except share data) | ||||||||||||
| INTEREST INCOME: |
||||||||||||
| Interest and fees on loans |
$ | 134,390 | $ | 131,416 | $ | 151,172 | ||||||
| Interest on securities |
15,141 | 25,742 | 14,416 | |||||||||
| Interest on federal funds sold and other investments |
905 | 887 | 1,340 | |||||||||
| Total interest income |
150,436 | 158,045 | 166,928 | |||||||||
| INTEREST EXPENSE: |
||||||||||||
| Interest on deposits |
27,882 | 50,636 | 54,080 | |||||||||
| Interest on FHLB advances |
12,099 | 13,041 | 13,932 | |||||||||
| Interest on other borrowings |
2,071 | 2,022 | 2,695 | |||||||||
| Total interest expense |
42,052 | 65,699 | 70,707 | |||||||||
| NET INTEREST INCOME BEFORE PROVISION FOR LOAN LOSSES |
108,384 | 92,346 | 96,221 | |||||||||
| PROVISION FOR LOAN LOSSES |
84,630 | 61,023 | 48,825 | |||||||||
| NET INTEREST INCOME AFTER PROVISION FOR LOAN LOSSES |
23,754 | 31,323 | 47,396 | |||||||||
| NON-INTEREST INCOME: |
||||||||||||
| Service charges on deposit accounts |
6,464 | 6,784 | 7,379 | |||||||||
| International service fees |
2,369 | 2,006 | 2,050 | |||||||||
| Loan servicing fees, net |
1,836 | 1,866 | 2,057 | |||||||||
| Wire transfer fees |
1,192 | 1,332 | 1,556 | |||||||||
| Net gains on sales of SBA loans |
1,400 | 694 | 1,600 | |||||||||
| Net gains on sales of other loans |
4,368 | 728 | 181 | |||||||||
| Net gains on sales and calls of securities available for sale |
6,396 | 4,427 | 860 | |||||||||
| Net losses on sales of OREO |
(605 | ) | (320 | ) | (1,003 | ) | ||||||
| Net valuation losses on interest rate swaps |
(857 | ) | (446 | ) | (549 | ) | ||||||
| Other than temporary impairment on securities available for sale |
||||||||||||
| Total impairment loss |
— | — | (1,713 | ) | ||||||||
| Loss recognized in other comprehensive income |
— | — | — | |||||||||
| Net impairment loss recognized in earnings |
— | — | (1,713 | ) | ||||||||
| Other income and fees |
1,918 | 1,397 | 1,575 | |||||||||
| Total non-interest income |
24,481 | 18,468 | 13,993 | |||||||||
| NON-INTEREST EXPENSE: |
||||||||||||
| Salaries and employee benefits |
25,261 | 25,437 | 28,887 | |||||||||
| Occupancy |
9,767 | 9,918 | 9,132 | |||||||||
| Furniture and equipment |
3,540 | 2,926 | 2,829 | |||||||||
| Advertising and marketing |
2,020 | 1,671 | 2,029 | |||||||||
| Data processing and communications |
3,954 | 3,742 | 3,275 | |||||||||
| Professional fees |
2,538 | 2,324 | 1,961 | |||||||||
| FDIC assessment |
4,968 | 5,237 | 1,415 | |||||||||
| Credit related expenses |
4,781 | 4,407 | 1,161 | |||||||||
| Other |
6,545 | 6,051 | 6,320 | |||||||||
| Total non-interest expense |
63,374 | 61,713 | 57,009 | |||||||||
| INCOME (LOSS) BEFORE INCOME TAX PROVISION (BENEFIT) |
(15,139 | ) | (11,922 | ) | 4,380 | |||||||
| INCOME TAX PROVISION (BENEFIT) |
(7,900 | ) | (6,199 | ) | 1,625 | |||||||
| NET INCOME (LOSS) |
$ | (7,239 | ) | $ | (5,723 | ) | $ | 2,755 | ||||
| DIVIDENDS AND DISCOUNT ACCRETION ON PREFERRED STOCK |
$ | (4,291 | ) | $ | (4,276 | ) | $ | (474 | ) | |||
| NET INCOME (LOSS) AVAILABLE TO COMMON STOCKHOLDERS |
$ | (11,530 | ) | $ | (9,999 | ) | $ | 2,281 | ||||
| EARNINGS (LOSS) PER COMMON SHARE: |
||||||||||||
| Basic |
$ | (0.30 | ) | $ | (0.35 | ) | $ | 0.09 | ||||
| Diluted |
$ | (0.30 | ) | $ | (0.35 | ) | $ | 0.09 | ||||
F-5
Table of Contents
NARA BANCORP, INC. AND SUBSIDIARIES
CONSOLIDATED STATEMENTS OF CHANGES IN STOCKHOLDERS’ EQUITY
YEARS ENDED DECEMBER 31, 2010, 2009 AND 2008
| Preferred Stock |
Preferred Stock Discount |
Common Stock | Capital Surplus |
Retained Earnings |
Accumulated Other Comprehensive Income (Loss), net |
Comprehensive Income (Loss) |
||||||||||||||||||||||||||
| Shares | Amount | |||||||||||||||||||||||||||||||
| (In thousands, except share data) | ||||||||||||||||||||||||||||||||
| BALANCE, JANUARY 1, 2008 |
$ | — | $ | — | 26,193,560 | $ | 26 | $ | 79,974 | $ | 142,491 | $ | (311 | ) | ||||||||||||||||||
| Issuance of 67,000 shares of TARP preferred stock |
67,000 | (4,766 | ) | |||||||||||||||||||||||||||||
| Stock options exercised |
53,000 | 443 | ||||||||||||||||||||||||||||||
| Stock-based compensation |
1,660 | |||||||||||||||||||||||||||||||
| Issuance of common stock warrant |
4,766 | |||||||||||||||||||||||||||||||
| Cash dividends accrued (5%) |
(372 | ) | ||||||||||||||||||||||||||||||
| Accretion of preferred stock discount |
102 | (102 | ) | |||||||||||||||||||||||||||||
| Cash dividends declared ($ 0.11 per common share) |
(2,882 | ) | ||||||||||||||||||||||||||||||
| Comprehensive income (loss): |
||||||||||||||||||||||||||||||||
| Net income |
2,755 | $ | 2,755 | |||||||||||||||||||||||||||||
| Other comprehensive income (loss): |
||||||||||||||||||||||||||||||||
| Change in unrealized gain (loss) on securities available for sale, net of tax |
(921 | ) | (921 | ) | ||||||||||||||||||||||||||||
| Change in unrealized gain (loss) on interest-only strips, net of tax |
— | — | ||||||||||||||||||||||||||||||
| Change in unrealized gain (loss) on interest rate swaps, net of tax |
90 | 90 | ||||||||||||||||||||||||||||||
| Total comprehensive income (loss) |
$ | 1,924 | ||||||||||||||||||||||||||||||
| BALANCE, DECEMBER 31, 2008 |
$ | 67,000 | $ | (4,664 | ) | 26,246,560 | $ | 26 | $ | 86,843 | $ | 141,890 | $ | (1,142 | ) | |||||||||||||||||
F-6
Table of Contents
NARA BANCORP, INC. AND SUBSIDIARIES
CONSOLIDATED STATEMENTS OF CHANGES IN STOCKHOLDERS’ EQUITY (continued)
YEARS ENDED DECEMBER 31, 2010, 2009 AND 2008
| Preferred Stock |
Preferred Stock Discount |
Common Stock | Capital Surplus |
Retained Earnings |
Accumulated Other Comprehensive Income (Loss), net |
Comprehensive Income (Loss) |
||||||||||||||||||||||||||
| Shares | Amount | |||||||||||||||||||||||||||||||
| (In thousands, except share data) | ||||||||||||||||||||||||||||||||
| BALANCE, JANUARY 1, 2009 |
$ | 67,000 | $ | (4,664 | ) | 26,246,560 | $ | 26 | $ | 86,843 | $ | 141,890 | $ | (1,142 | ) | |||||||||||||||||
| Issuance of additional stock under public offering, net of offering costs |
11,500,000 | $ | 12 | 81,960 | ||||||||||||||||||||||||||||
| Issuance of additional shares pursuant to various stock plans |
77,447 | (81 | ) | |||||||||||||||||||||||||||||
| Tax effects of stock plan |
(408 | ) | ||||||||||||||||||||||||||||||
| Stock-based compensation |
1,492 | |||||||||||||||||||||||||||||||
| Cash dividends accrued (5%) |
(3,349 | ) | ||||||||||||||||||||||||||||||
| Accretion of preferred stock discount |
927 | (927 | ) | |||||||||||||||||||||||||||||
| Comprehensive income (loss): |
||||||||||||||||||||||||||||||||
| Net loss |
(5,723 | ) | $ | (5,723 | ) | |||||||||||||||||||||||||||
| Other comprehensive income (loss): |
||||||||||||||||||||||||||||||||
| Change in unrealized gain (loss) on securities available for sale, net of tax |
4,193 | 4,193 | ||||||||||||||||||||||||||||||
| Change in unrealized gain (loss) on interest-only strips, net of tax |
10 | 10 | ||||||||||||||||||||||||||||||
| Change in unrealized gain (loss) on interest rate swaps, net of tax |
(84 | ) | (84 | ) | ||||||||||||||||||||||||||||
| Total comprehensive income (loss) |
$ | (1,604 | ) | |||||||||||||||||||||||||||||
| BALANCE, DECEMBER 31, 2009 |
$ | 67,000 | $ | (3,737 | ) | 37,824,007 | $ | 38 | $ | 169,806 | $ | 131,891 | $ | 2,977 | ||||||||||||||||||
F-7
Table of Contents
NARA BANCORP, INC. AND SUBSIDIARIES
CONSOLIDATED STATEMENTS OF CHANGES IN STOCKHOLDERS’ EQUITY (continued)
YEARS ENDED DECEMBER 31, 2010, 2009 AND 2008
| Preferred Stock |
Preferred Stock Discount |
Common Stock | Capital Surplus |
Retained Earnings |
Accumulated Other Comprehensive Income (Loss), net |
Comprehensive Income (Loss) |
||||||||||||||||||||||||||
| Shares | Amount | |||||||||||||||||||||||||||||||
| (In thousands, except share data) | ||||||||||||||||||||||||||||||||
| BALANCE, JANUARY 1, 2010 |
$ | 67,000 | $ | (3,737 | ) | 37,824,007 | $ | 38 | $ | 169,806 | $ | 131,891 | $ | 2,977 | ||||||||||||||||||
| Issuance of additional shares pursuant to various stock plans |
159,020 | 1,150 | ||||||||||||||||||||||||||||||
| Tax effects of stock plan |
32 | |||||||||||||||||||||||||||||||
| Stock-based compensation |
376 | |||||||||||||||||||||||||||||||
| Cash dividends accrued (5%) |
(3,351 | ) | ||||||||||||||||||||||||||||||
| Accretion of preferred stock discount |
940 | (940 | ) | |||||||||||||||||||||||||||||
| Comprehensive income (loss): |
||||||||||||||||||||||||||||||||
| Net loss |
(7,239 | ) | $ | (7,239 | ) | |||||||||||||||||||||||||||
| Other comprehensive income (loss): |
||||||||||||||||||||||||||||||||
| Change in unrealized gain (loss) on securities available for sale, net of tax |
(355 | ) | (355 | ) | ||||||||||||||||||||||||||||
| Change in unrealized gain (loss) on interest-only strips, net of tax |
1 | 1 | ||||||||||||||||||||||||||||||
| Change in unrealized gain (loss) on interest rate swaps, net of tax |
(26 | ) | (26 | ) | ||||||||||||||||||||||||||||
| Total comprehensive income (loss) |
$ | (7,619 | ) | |||||||||||||||||||||||||||||
| BALANCE, DECEMBER 31, 2010 |
$ | 67,000 | $ | (2,797 | ) | 37,983,027 | $ | 38 | $ | 171,364 | $ | 120,361 | $ | 2,597 | ||||||||||||||||||
See accompanying notes to consolidated financial statements.
F-8
Table of Contents
NARA BANCORP, INC. AND SUBSIDIARIES
CONSOLIDATED STATEMENTS OF CASH FLOWS
YEARS ENDED DECEMBER 31, 2010, 2009 AND 2008
| 2010 | 2009 | 2008 | ||||||||||
| (In thousands) | ||||||||||||
| CASH FLOWS FROM OPERATING ACTIVITIES |
||||||||||||
| Net income (loss) |
($ | 7,239 | ) | ($ | 5,723 | ) | $ | 2,755 | ||||
| Adjustments to reconcile net income to net cash from operating activities: |
||||||||||||
| Depreciation, amortization, net of discount accretion |
10,977 | 5,006 | 2,817 | |||||||||
| Stock-based compensation expense |
376 | 1,492 | 1,660 | |||||||||
| Provision for loan losses |
84,630 | 61,023 | 48,825 | |||||||||
| Other than temporary impairment on securities available for sale |
— | — | 1,713 | |||||||||
| Valuation adjustment of a loan held for sale |
— | — | 334 | |||||||||
| Valuation adjustment of OREO |
2,155 | 2,276 | 229 | |||||||||
| Proceeds from sales of loans |
110,885 | 25,429 | 43,873 | |||||||||
| Originations of loans held for sale |
(46,045 | ) | (5,221 | ) | (39,790 | ) | ||||||
| Deferred gain on transfer of assets |
(1,166 | ) | — | — | ||||||||
| Net gains on sales of SBA and other loans |
(5,768 | ) | (1,422 | ) | (1,781 | ) | ||||||
| Net gains on sales and calls of securities available for sale |
(6,396 | ) | (4,427 | ) | (860 | ) | ||||||
| Net losses on sales of OREO |
605 | 320 | 1,003 | |||||||||
| Net valuation losses on interest rate swaps and caps |
857 | 446 | 549 | |||||||||
| Increase in cash surrender value on bank owned life insurance |
(546 | ) | (222 | ) | (441 | ) | ||||||
| FHLB stock dividends |
— | — | (1,018 | ) | ||||||||
| Change in accrued interest receivable |
2,613 | (3,093 | ) | 1,180 | ||||||||
| Change in deferred income taxes |
(7,910 | ) | (6,372 | ) | (9,884 | ) | ||||||
| Change in other assets and FDIC prepayment |
8,627 | (15,744 | ) | (16,601 | ) | |||||||
| Change in accrued interest payable |
(7,844 | ) | 4,125 | (1,932 | ) | |||||||
| Change in other liabilities |
(3,072 | ) | (363 | ) | (439 | ) | ||||||
| Net cash provided by operating activities |
135,739 | 57,530 | 32,192 | |||||||||
| CASH FLOWS FROM INVESTING ACTIVITIES |
||||||||||||
| Net change in loans receivable |
(100,783 | ) | (167,651 | ) | (133,210 | ) | ||||||
| Proceeds from sales of commercial real estate loans |
— | — | 11,863 | |||||||||
| Purchase of premises and equipment |
(2,973 | ) | (1,650 | ) | (3,454 | ) | ||||||
| Purchase of securities available for sale |
(190,577 | ) | (787,755 | ) | (269,977 | ) | ||||||
| Proceeds from disposition of equipment |
2 | — | — | |||||||||
| Proceeds from sales of OREO |
10,363 | 5,162 | 1,838 | |||||||||
| Proceeds from sales of securities available for sale |
208,142 | 239,734 | 76,135 | |||||||||
| Proceeds from matured or called, or paiddown securities available for sale |
235,063 | 160,189 | 65,692 | |||||||||
| Purchase of Federal Reserve Bank stock |
(1,968 | ) | (2,079 | ) | (67 | ) | ||||||
| Purchase of FHLB stock |
— | — | (8,725 | ) | ||||||||
| Redemption of Federal Home Loan Bank stock |
2,218 | — | 5,249 | |||||||||
| Net cash received from branch acquisition |
— | — | 2,555 | |||||||||
| Net cash provided by / (used in) investing activities |
159,487 | (554,050 | ) | (252,101 | ) | |||||||
F-9
Table of Contents
NARA BANCORP, INC. AND SUBSIDIARIES
CONSOLIDATED STATEMENTS OF CASH FLOWS (continued)
YEARS ENDED DECEMBER 31, 2010, 2009 AND 2008
| 2010 | 2009 | 2008 | ||||||||||
| (In thousands) | ||||||||||||
| CASH FLOWS FROM FINANCING ACTIVITIES |
||||||||||||
| Net increase (decrease) in deposits |
$ | (258,076 | ) | $ | 495,587 | $ | 102,258 | |||||
| Net change in secured borrowings |
11,758 | — | — | |||||||||
| Repayments of FHLB borrowings |
(35,000 | ) | (50,000 | ) | (193,000 | ) | ||||||
| Proceeds from FHLB borrowings |
35,000 | 50,000 | 246,000 | |||||||||
| Issuance of preferred stock, net of discount |
— | — | 62,234 | |||||||||
| Issuance of common stock warrant |
— | — | 4,766 | |||||||||
| Issuance of additional common stock |
— | 81,972 | — | |||||||||
| Issuance of additional stock pursuant to various stock plan |
1,150 | — | 443 | |||||||||
| Tax effects on issuance of shares from stock plan |
32 | (489 | ) | — | ||||||||
| Payments of cash dividends |
(3,351 | ) | (4,015 | ) | (2,882 | ) | ||||||
| Net cash provided by / (used in) financing activities |
(248,487 | ) | 573,055 | 219,819 | ||||||||
| NET INCREASE (DECREASE) IN CASH AND CASH EQUIVALENTS |
46,739 | 76,535 | (90 | ) | ||||||||
| CASH AND CASH EQUIVALENTS, BEGINNING OF YEAR |
125,592 | 49,057 | 49,147 | |||||||||
| CASH AND CASH EQUIVALENTS, END OF YEAR |
$ | 172,331 | $ | 125,592 | $ | 49,057 | ||||||
| SUPPLEMENTAL DISCLOSURES OF CASH FLOW INFORMATION |
||||||||||||
| Interest paid |
$ | 49,896 | $ | 61,574 | $ | 72,639 | ||||||
| Income taxes paid (refund) |
$ | (1,458 | ) | $ | (4,671 | ) | $ | 16,174 | ||||
| SUPPLEMENTAL SCHEDULE OF NONCASH INVESTMENT ACTIVITIES |
||||||||||||
| Transfer from loans receivable to other real estate owned |
$ | 12,660 | $ | 6,833 | $ | 6,039 | ||||||
| Transfer from loans receivable to loans held for sale |
$ | 80,077 | $ | 13,721 | $ | 12,016 | ||||||
| Investment securities purchases pending future settlement |
$ | — | $ | — | $ | 21,449 | ||||||
| Reduction of common stock warrants |
$ | — | $ | (2,383 | ) | $ | — | |||||
| Acquisition: |
||||||||||||
| Fair value of non-cash assets acquired |
$ | — | $ | — | $ | 44 | ||||||
| Fair value of deposits assumed |
$ | — | $ | — | $ | 2,999 | ||||||
| Goodwill acquired |
$ | — | $ | — | $ | 350 | ||||||
| Other intangible assets acquired |
$ | — | $ | — | $ | 50 | ||||||
See accompanying notes to consolidated financial statements.
F-10
Table of Contents
NARA BANCORP, INC. AND SUBSIDIARIES
NOTES TO CONSOLIDATED FINANCIAL STATEMENTS
YEARS ENDED DECEMBER 31, 2010, 2009 AND 2008
1. SUMMARY OF SIGNIFICANT ACCOUNTING POLICIES
Principles of Consolidation—The accounting and reporting policies of Nara Bancorp, Inc. and Subsidiaries (the “Company”) are in accordance with accounting principles generally accepted in the United States of America and conform to practices within the banking industry. The consolidated financial statements include the accounts of Nara Bancorp, Inc. (“Nara Bancorp”) and its wholly owned subsidiaries, principally Nara Bank (the “Bank”). The consolidated financial statements also include the accounts of the Bank’s wholly owned subsidiary, Nara Real Estate Trust, which was a Maryland real estate investment trust that held only loans secured by real estate. The subsidiary was dissolved in July, 2009. Nara Loan Center, a New Jersey corporation organized in 2000, was another subsidiary of the Bank until it was dissolved in April, 2008 after the acquisition of a branch office in New Jersey.
Nara Bancorp was formed as a holding company of the Bank and registered with the Securities and Exchange Commission under the Securities Act of 1933 on December 5, 2000. Effective February 2, 2001, upon consummation of the reorganization of the Bank into a holding company structure, each of the Bank’s common shares at par value of $3 was exchanged for one share of Nara Bancorp’s common stock at par value of $0.001. The reorganization was accounted for at historical cost in a manner similar to a pooling of interests.
The Bank, previously a national association, converted to a California state-chartered bank on January 3, 2005, and maintains 23 branch operations and one loan production office offering a full range of commercial banking and, to a lesser extent, consumer financial services to our customers, who typically are small- to medium-sized businesses and individuals in our market areas.
Cash Flows—Cash and cash equivalents include cash and due from banks, interest-earning deposits, federal funds sold and term federal funds sold, which have original maturities less than 90 days. The Company is required to maintain reserve and clearing balances with the Federal Reserve Bank under the Federal Reserve Act. The reserve and clearing requirement balance was approximately $18.4 million at December 31, 2010 and $22.5 million at December 31, 2009. Net cash flows are reported for customer loan and deposit transactions, deferred income taxes and other assets and liabilities.
Securities—Securities are classified and accounted for as follows:
| (i) | Securities that the Company has the positive intent and ability to hold to maturity are classified as “held to maturity” and reported at amortized cost. At December 31, 2010 and 2009, we did not own securities in this category; |
| (ii) | Securities are classified as “available for sale” when they might be sold before maturity and are reported at fair value. Unrealized holding gains and losses are reported as a separate component of stockholders’ equity in accumulated other comprehensive income (loss), net of taxes. |
Accreted discounts and amortized premiums on securities are included in interest income using the interest method, and realized gains or losses related to sales of securities are calculated using the specific identification method, without anticipating prepayments, except for mortgage-backed securities where prepayments are expected.
Management evaluates securities for other than temporary impairment (“OTTI”) at least on a quarterly basis and more frequently when economic conditions warrant such evaluation. For securities in an unrealized loss position, management considers the extent and duration of the unrealized loss, and the financial condition and near-term prospects of the issuer. Management also assesses whether it intends to sell, or it is more likely than not that it will be required to sell, a security in an unrealized loss position before recovery of its amortized cost
F-11
Table of Contents
NARA BANCORP, INC. AND SUBSIDIARIES
NOTES TO CONSOLIDATED FINANCIAL STATEMENTS—(Continued)
basis. If either of the criteria regarding intent or requirement to sell is met, the entire difference between amortized cost and fair value is recognized as impairment through earnings. For debt securities that do not meet the aforementioned criteria, the amount of impairment is split into two components as follows: 1) OTTI related to credit loss, which must be recognized in the income statement and 2) other-than-temporary impairment (OTTI) related to other factors, which is recognized in other comprehensive income. The credit loss is defined as the difference between the present value of the cash flows expected to be collected and the amortized cost basis. For equity securities, the entire amount of impairment is recognized through earnings.
Derivative Financial Instruments and Hedging Transactions—As part of our asset and liability management strategy, we may enter into derivative financial instruments, such as interest rate swaps, caps and floors, with the overall goal of minimizing the impact of interest rate fluctuations on our net interest margin. The Company’s interest rate swaps and caps involve the exchange of fixed-rate and variable-rate interest payment obligations without the exchange of the underlying notional amounts and are therefore accounted for as “stand-alone” derivatives. Changes in the fair value of the stand-alone derivatives are reported in earnings as non-interest income. As part of the Company’s overall risk management, the Company’s Asset Liability Committee, which meets monthly, monitors and measures interest rate risk and the sensitivity of assets and liabilities to interest rate changes, including the impact of derivative transactions.
Loans—Loans that management has the intent and ability to hold for the foreseeable future or until maturity or payoff are reported at the principal balance outstanding, net of any unearned interest, deferred loan fees and costs, and an allowance for loan losses. Interest income is accrued on the unpaid principal balance. Loan origination fees, net of certain direct origination costs, are deferred and recognized in interest income using the level-yield method without anticipating prepayments. Interest on loans is credited to income as earned and is accrued only if deemed collectible. Generally, loans are placed on non-accrual status if principal or interest payments become 90 days past due and/or management deems the collectibility of the principal and/or interest to be in question, as well as when required by regulatory requirements. Loans to a customer whose financial condition has deteriorated are considered for non-accrual status whether or not the loan is 90 days or more past due. Generally, payments received on non-accrual loans are recorded as principal reductions. Loans are returned to accrual status when all the principal and interest amounts contractually due are brought current and future payments are reasonably assured.
Nonrefundable fees, net of certain direct costs, associated with the origination or acquisition of loans are deferred and recognized as an adjustment of the loan yield over the life of the loan. Other loan fees and charges, representing service costs for the prepayment of loans, for delinquent payments or for miscellaneous loan services, are recorded as income when collected.
SBA Loans—Certain Small Business Administration (“SBA”) loans that the Company has the intent to sell prior to maturity have been designated as held for sale at origination and are recorded at the lower of cost or fair value, on an aggregate basis. A valuation allowance is established if the aggregate fair value of such loans is lower than their cost, and charged to earnings. Gains or losses recognized upon the sale of loans are determined on a specific identification basis. SBA loan transfers are accounted for as sales when control over the loan has been surrendered. Control over such loans is deemed to be surrendered when (1) the assets have been isolated from the Company, (2) the transferee obtains the right (free of conditions that constrain it from taking advantage of that right) to pledge or exchange the transferred assets, and (3) the Company does not maintain effective control over the transferred assets through an agreement to repurchase them before their maturity.
Loan Servicing Assets—The Company typically sells the guaranteed portion of SBA loans and retains the unguaranteed portion (“retained interest”). A portion of the premium on sale of SBA loans is recognized as gain on sale of loans at the time of the sale by allocating the carrying amount between the asset sold and the retained
F-12
Table of Contents
NARA BANCORP, INC. AND SUBSIDIARIES
NOTES TO CONSOLIDATED FINANCIAL STATEMENTS—(Continued)
interest, based on their relative fair values. During 2010, in accordance with newly issued accounting literature, this gain was deferred until the 90 day recourse period expired. This resulted in $1.2 million of gains being deferred at December 31, 2010 and secured borrowings of $11.8 million. In February 2011 the SBA amended their agreements and effective for all loans submitted for secondary market sales on or after February 15, 2011, the gain will again be recognized at the time of sale. The remaining portion of the premium is recorded as a discount on the retained interest and is amortized over the remaining life of the loan as an adjustment to yield. The retained interest, net of any discount, are included in loans receivable—net of allowance for loan losses in the accompanying consolidated statements of financial condition.
Servicing assets are recognized when SBA loans are sold with servicing retained with the income statement effect recorded in gains on sales of SBA loans. Servicing assets are initially recorded at fair value based on the present value of the contractually specified servicing fee, net of servicing costs, over the estimated life of the loan, using a discount rate based on the related note rate, plus 1 to 2%. The Company’s servicing costs approximates industry average servicing costs of 40 basis points. All classes of servicing assets are subsequently measured using the amortization method which requires servicing rights to be amortized into non-interest income in proportion to, and over the period of, the estimated future net servicing income of the underlying loans. The Company has capitalized $283 thousand, $200 thousand and $765 thousand of servicing assets during 2010, 2009 and 2008, respectively, and amortized $868 thousand, $1.1 million and $1.6 million during the years ended December 31, 2010, 2009 and 2008, respectively. The carrying amount of servicing assets was $2.2 million and $2.8 million at December 31, 2010 and 2009, respectively.
Management periodically evaluates servicing assets for impairment based upon the fair value of the rights as compared to carrying amount. Impairment is determined by stratifying rights into groupings based on predominant risk characteristics, such as interest rate, loan type and investor type. Impairment is recognized through a valuation allowance for an individual grouping, to the extent that fair value is less than the carrying amount. If the Company later determines that all or a portion of the impairment no longer exists for a particular grouping, a reduction of the allowance may be recorded as an increase to income. At December 31, 2010, the fair value of servicing assets was determined using a weighted-average discount rate of 5.7% and prepayment speed of 14.8%. At December 31, 2009, the fair value of servicing assets was determined using a weighted-average discount rate of 5.7% and prepayment speed of 14.7%. The fair values of servicing assets were approximately $4.0 million and $4.5 million at December 31, 2010 and 2009, respectively, on serviced loans totaling $222.7 million and $239.8 million at December 31, 2010 and 2009 and is included in other assets in the accompanying consolidated statements of condition. No impairment charges were required in 2010, 2009, or 2008.
The estimated annual amortization of servicing assets as of December 31, 2010, for each of the succeeding five fiscal years is indicated in the table below:
| Year Ending December 31 |
||||
| (In thousands) | ||||
| 2011 |
$ | 471 | ||
| 2012 |
373 | |||
| 2013 |
292 | |||
| 2014 |
225 | |||
| 2015 |
269 | |||
| Thereafter |
579 | |||
| $ | 2,209 | |||
F-13
Table of Contents
NARA BANCORP, INC. AND SUBSIDIARIES
NOTES TO CONSOLIDATED FINANCIAL STATEMENTS—(Continued)
Servicing fee income which is reported on the income statement as “Loan Servicing Fees, net” is recorded for fees earned for servicing loans. The fees are based on a contractual percentage of the outstanding principal or a fixed amount per loan and are recorded as income when earned. The amortization of mortgage servicing rights is netted against loan servicing fee income. Servicing fees totaled $2.4 million, $2.6 million and $3.0 million for the years ended December 31, 2010, 2009 and 2008, respectively. Late fees and ancillary fees related to loan servicing are not material.
Allowance for Loan Losses—The allowance for loan losses is a valuation allowance for probable incurred credit losses that are inherent in the loan portfolio. Loan losses are charged against the allowance when management believes the uncollectibility of a loan balance is confirmed. Subsequent recoveries, if any, are credited to the allowance. Management estimates the allowance balance required using past loan loss experience, the nature and volume of the portfolio, information about specific borrower situations and estimated collateral values, economic conditions, and other factors. Allocations of the allowance may be made for specific loans, but the entire allowance is available for any loan that, in management’s judgment, should be charged-off.
In addition, the Company is subject to periodic examination by its federal and state examiners, and may be required by such regulators to recognize additions to the allowance for loan losses based on their assessment of credit information available to them at the time of their examinations.
The allowance consists of specific and general components. The specific component relates to loans that are individually classified as impaired. The general component covers non-impaired loans and is based on historical loss experience adjusted for qualitative factors.
A loan is considered impaired when, based on current information and events, it is probable that the Company will be unable to collect all amounts due according to the contractual terms of the loan agreement. Loans, for which the terms have been modified, and for which the borrower is experiencing financial difficulties, may be considered troubled debt restructurings and classified as impaired. Factors considered by management in determining impairment include payment status, collateral values, and the probability of collecting scheduled principal and interest payments when due. Loans that experience insignificant payment delays and payment shortfalls generally are not deemed to be impaired. Management determines the significance of payment delays and payment shortfalls on a case-by-case basis, taking into consideration all of the circumstances surrounding the loan and the borrower, including the length of the delay, the reasons for the delay, the borrower’s prior payment record, and the amount of the shortfall in relation to the principal and interest owed. Impairment is measured on a loan by loan basis by either the present value of expected future cash flows discounted at the loan’s effective interest rate, or the fair value of the collateral if the loan is collateral dependent. Large groups of smaller balance homogeneous loans are collectively evaluated for impairment. Accordingly, the Company does not separately identify individual consumer and residential loans for impairment disclosures.
The general component covers non-impaired loans and is based on historical loss experience adjusted for current factors. The historical loss experience is determined by portfolio segment and is based on the actual loss history experienced by the Company over the most recent three years. Effective June 30, 2010, the Bank utilizes an automated software program which allows for detailed and comprehensive migration of loan losses through all grade levels within an individual loan’s credit cycle, with more emphasis, or weight, on the more current quarters in the loss horizon period. This actual loss experience is supplemented with other economic factors based on the risks present for each portfolio segment. These economic factors include consideration of the following: levels of and trends in delinquencies and impaired loans; levels of and trends in charge-offs and recoveries; trends in volume and terms of loans; effects of any changes in risk selection and underwriting standards; other changes in lending policies, procedures, and practices; experience, ability, and depth of lending management and other relevant staff; national and local economic trends and conditions; industry conditions; and
F-14
Table of Contents
NARA BANCORP, INC. AND SUBSIDIARIES
NOTES TO CONSOLIDATED FINANCIAL STATEMENTS—(Continued)
effects of changes in credit concentrations. The following major portfolio segments have been identified: Real estate loans (residential, commercial, and construction), commercial business loans, trade finance loans, and consumer/other loans. Due to the overall high level of real estate loans within the loan portfolio as a whole, as compared to other portfolio segments, for risk assessment and allowance purposes this segment was segregated into more granular pools by collateral property type. Construction and land loans have the highest qualitative adjustments for economic and other credit risk factors, such as the incomplete status of the collateral and deleterious effect of the recent economic downturn on these types of properties during, but total balances in these portfolio segments are not a concentration in the overall portfolio. The commercial real estate loan portfolio segment as a whole had the next highest level of qualitative adjustments due to the effects of local markets and economies on the underlying collateral property values, as well as for industry concentrations and risks related to the commercial business tenants. Commercial real estate loans secured by hotels, golf courses, and gas station/car washes pose an industry concentration risk within this portfolio segment, have historically shown higher credit risk than in other collateral property types, and were negatively impacted by the effect of the recent poor economy on the hospitality and recreation industries as well as increasing fuel and travel costs. These factors resulted in higher qualitative adjustments made to these sub-portfolio segments. Within the commercial business and trade finance portfolio segments, risk analysis is performed based on concentrations within industries, as well as by individual loan type. Commercial business loans granted under various SBA-guaranteed programs show higher historical risks as these loans are made to small businesses which were more negatively impacted by the economic issues of past few years. This impact resulted in increased qualitative adjustments for this sub-portfolio segment during the year. Trade finance loans show minimal historical losses and have the lowest level of inherent risk as they are generally structured for transaction based funding and businesses within this portfolio segment were less impacted by local market downturns. Qualitative adjustments made to this portfolio segment are generally minor as a result.
Effective December 31, 2010 the Bank expanded its scope of the loans reviewed for individual impairment by including all loans over $1 million that were risk-graded as Substandard, even though such loans were less than 60 days delinquent and were performing under their contractual terms. Previously, Substandard loans over $2 million were subject to impairment analysis. This enhancement added three loans totaling $4.6 million to impaired loans in four quarter 2010. The Bank also implemented a qualitative adjustment factor for Pass-4 (Watch) graded loans. Prior to December 31, 2010, all levels of Pass-rated loans were combined and analyzed as a single pool of loans for historical loss trends. This process allows the Bank to reserve for the slightly increased level of risk, or potential weakness, associated with Pass-4/Watch loans.
The process of assessing the adequacy of the allowance for loan losses is necessarily subjective. Further, and particularly in terms of economic downturns, it is reasonably possible that future credit losses may exceed historical loss levels and may also exceed management’s current estimates of incurred credit losses inherent within the loan portfolio. As such, there can be no assurance that future loan charge-offs will not exceed management’s current estimate of what constitutes a reasonable allowance for loan losses.
Impairment losses are included in the allowance for loan losses through a charge to the provision for loan losses. Upon disposition of an impaired loan, any unpaid balance is charged off to the allowance for loan losses.
Concentration of Credit Risk—Our loan portfolio is divided into three general markets: California, New York / New Jersey, and all other states. The California market represents the biggest credit market concentration (62.1%) followed by New York / New Jersey (28.6%) and All Other States (9.3%). Within the California market, most of our business activity is with customers located within Los Angeles County (35.4%). Therefore, the Company’s exposure to credit risk is significantly affected by changes in the economy in the Los Angeles County area.
F-15
Table of Contents
NARA BANCORP, INC. AND SUBSIDIARIES
NOTES TO CONSOLIDATED FINANCIAL STATEMENTS—(Continued)
Within our CRE loan portfolio, the largest industry concentrations are hotel/motel (17.5%), gas stations (16.2%), multi-tenant retail building (15.4%), and mixed-use facilities (10.2%). Within our commercial and industrial loan portfolio, the largest industry concentrations are supermarkets (26.6%), wholesalers (21.0%), and manufacturing (10.8%).
Federal Home Loan Bank (FHLB) Stock—The Bank is a member of the FHLB system. Members are required to own a certain amount of stock based on the level of borrowings and other factors, and may invest in additional amounts. FHLB stock is carried at cost, classified as a restricted security, and periodically evaluated for impairment based on ultimate recovery of par value. Both cash and stock dividends are reported as income.
Federal Reserve Bank (FRB) Stock—The Bank is a member of its regional Federal Reserve Bank. FRB stock is carried at cost, classified as a restricted security, and periodically evaluated for impairment based on ultimate recovery of par value. Both cash and stock dividends are reported as income.
Premises and Equipment—Premises and equipment are stated at cost less accumulated depreciation and amortization. Depreciation on furniture, fixtures and equipment is computed on the straight-line method over the estimated useful lives of the related assets, which range from 3 to 5 years for furniture, fixtures and equipment.
Leasehold improvements are capitalized and amortized on the straight-line method over the term of the lease or the estimated useful lives of the improvements up to 40 years, whichever is shorter. An accelerated method of depreciation is followed, as appropriate, for federal income tax purposes.
Other Real Estate Owned—Other real estate owned, which represents real estate acquired through foreclosure in satisfaction of commercial and real estate loans, is stated at fair value less estimated selling costs of the real estate. Loan balances in excess of the fair value of the real estate acquired at the date of acquisition are charged to the allowance for loan losses. Any subsequent operating expenses or income, reduction in estimated fair values, and gains or losses on disposition of such properties are charged or credited to current operations.
Goodwill and Intangible Assets—Goodwill resulting from business combinations prior to January 1, 2009 represents the excess of the purchase price over the fair value of the net assets of businesses acquired. Goodwill resulting from business combinations after January 1, 2009 is generally determined as the excess of the fair value of the consideration transferred, plus the fair value of any noncontrolling interests in the acquiree, over the fair value of the net assets acquired and liabilities assumed as of the acquisition date. Goodwill and intangible assets acquired in a purchase business combination and determined to have an indefinite useful life are not amortized, but tested for impairment at least annually. The Company has selected December 31 as the date to perform the annual impairment test. Intangible assets with definite useful lives are amortized over their estimated useful lives to their estimated residual values. Goodwill is the only intangible asset with an indefinite life on our balance sheet. The Company tested goodwill for impairment as of December 31, 2010 and 2009 noting no impairment of recorded goodwill.
Stock-Based Compensation—Compensation cost is recognized for stock options and restricted stock awards issued to employees, based on the fair value of these awards at the date of grant. A Black-Scholes model is utilized to estimate the fair value of stock options, while the market price of the Company’s common stock at the date of grant is used for restricted stock awards. Compensation cost is recognized over the required service period, generally defined as the vesting period. For awards with graded vesting, compensation cost is recognized on a straight-line basis over the requisite service period for the entire award.
Income Taxes—Income tax expense is the total of the current year income tax due or refundable and the change in deferred tax assets and liabilities. Deferred income tax assets and liabilities represent the tax effects, based on current tax law, of future deductible or taxable amounts attributable to events that have been recognized
F-16
Table of Contents
NARA BANCORP, INC. AND SUBSIDIARIES
NOTES TO CONSOLIDATED FINANCIAL STATEMENTS—(Continued)
in the financial statements. In assessing the realizability of deferred tax assets, management considers whether it is more likely than not that some portion or all of the deferred tax assets will not be realized. The ultimate realization of deferred tax assets is dependent upon the generation of future taxable income during the periods in which those temporary differences become deductible. Management considers the scheduled reversal of deferred tax liabilities, the projected future taxable income and tax planning strategies in making this assessment. A valuation allowance, if needed, reduces deferred tax assets to the amount expected to be realized.
A tax position is recognized as a benefit only if it is “more likely than not” that the tax position would be sustained in a tax examination, with a tax examination being presumed to occur. The amount recognized is the largest amount of tax benefit that is greater than 50% likely of being realized on examination. For tax positions not meeting the “more likely than not” test, no tax benefit is recorded. The Company recognizes interest and / or penalties related to income tax matters in income tax expense.
Employee Stock Ownership Plan (ESOP)—Compensation expense is based on the market price of shares as they are committed to be released to participant accounts. Dividends on allocated ESOP shares reduce retained earnings.
Earnings per Common Share—Basic Earnings per Common Share is computed by dividing net income (loss) available to common stockholders by the weighted-average number of common shares outstanding for the period. Allocated ESOP shares are considered outstanding for this calculation. Diluted Earnings per Common Share reflects the potential dilution of securities that could share in the earnings of the Company. Earnings and dividends per share are restated for all stock splits and stock dividends through the date of issuance of the financial statements.
Equity—The Company accrues for preferred stock dividends as earned and for common stock dividends as declared. Preferred stock dividends of $3.4 million and $3.3 million were paid in 2010 and 2009 and there were $428,000 of preferred stock dividends accrued but unpaid at December 31, 2010 and 2009. There were no common stock dividends declared during 2010 and 2009. Accrued preferred and common stock dividends are included in other liabilities.
Bank Owned Life Insurance—The Company has purchased life insurance policies on certain key executives and directors. Bank owned life insurance (“BOLI”) is recorded at the amount that can be realized under the insurance contract at the balance sheet date, which is the cash surrender value adjusted for other charges or other amounts due that are probable at settlement.
Comprehensive Income—Comprehensive income consists of net income and other comprehensive income (loss). Other comprehensive income (loss) includes unrealized gains and losses on securities available for sale, cash flow hedges, and interest-only strips which are also recognized as separate components of stockholders’ equity, net of tax.
Loss Contingencies—Loss contingencies, including claims and legal actions arising in the ordinary course of business, are recorded as liabilities when the likelihood of loss is probable and an amount or range of loss can be reasonably estimated. Management believes there are no such matters that would have a material effect on the consolidated financial statements as of December 31, 2010 or 2009.
Loan Commitments and Related Financial Instruments—Financial instruments include off-balance sheet credit instruments, such as commitments to make loans and commercial letters of credit, issued to meet customer financing needs. The face amount for these items represents the exposure to loss, before considering customer collateral or ability to repay. Such financial instruments are recorded when they are funded. See Note 12, Commitments and Contingencies, to these Consolidated Financial Statements for further discussion.
F-17
Table of Contents
NARA BANCORP, INC. AND SUBSIDIARIES
NOTES TO CONSOLIDATED FINANCIAL STATEMENTS—(Continued)
Fair Values of Financial Instruments—Fair values of financial instruments are estimated using relevant market information and other assumptions, as more fully disclosed in a separate note. Fair value estimates involve uncertainties and matters of significant judgment regarding interest rates, credit risk, prepayments, and other factors, especially in the absence of broad markets for particular items. Changes in assumptions or in market conditions could significantly affect the estimates.
Operating Segments—Internal financial information is primarily reported and aggregated in three lines of business, banking, trade finance service, and SBA lending services.
Impairment of Long-Lived Assets—The Company evaluates long-lived assets for impairment whenever events or changes in circumstances indicate that the carrying value of an asset may not be recoverable. If the estimated future cash flows (undiscounted) over the remaining useful life of the asset are less than the carrying value, an impairment loss would be recorded to reduce the related asset to its estimated fair value.
Transfer of Financial Assets—Transfers of financial assets are accounted for as sales, when control over the assets has been relinquished. Control over transferred assets is deemed to be surrendered when the assets have been isolated from the Company, the transferee obtains the right (free of conditions that constrain it from taking advantage of that right) to pledge or exchange the transferred assets, and the Company does not maintain effective control over the transferred assets through an agreement to repurchase them before their maturity.
Use of Estimates in the Preparation of Consolidated Financial Statements—The preparation of consolidated financial statements in conformity with U.S. generally accepted accounting principles requires management to make estimates and assumptions that affect the reported amounts of assets and liabilities and disclosure of contingent assets and liabilities at the date of the financial statements and the reported amounts of revenues and expenses during the reporting period. Actual results could differ from those estimates. Material estimates that are susceptible to change in the near term relate to the determination of the allowance and provision for loan losses, the evaluation of other than temporary impairment of investment securities, accounting for derivatives and hedging activities, determining the carrying value for cash surrender value of life insurance, disclosures about segment information, carrying value of goodwill and other intangible assets, accounting for deferred tax assets and related valuation allowances, the determination of the fair values of investment securities and other financial instruments, accounting for lease arrangements, accounting for incentive compensation, profit sharing and bonus payments and the valuation of servicing assets.
Reclassifications—Some items in the prior year financial statements were reclassified to conform to the current presentation.
Recent Accounting Pronouncements
FASB ASU 2010-20, “Receivable (Topic 310), Disclosures about the Credit Quality of Financing Receivables and the Allowance for Credit Losses”—ASU 2010-20 requires new and enhanced disclosures about the credit quality of an entity’s financing receivables and its allowance for credit losses. The new and amended disclosure requirements focus on such areas as nonaccrual and past due financing receivables, allowance for credit losses related to financing receivables, impaired loans, credit quality information and modifications. The ASU requires an entity to disaggregate new and existing disclosures based on how it develops its allowance for credit losses and how it manages credit exposures. For public entities, the disclosures as of the end of a reporting period are effective for interim and annual reporting periods ending on or after December 15, 2010. The disclosures about activity that occurs during a reporting period are effective for interim and annual reporting periods beginning on or after December 15, 2010. See Note 3 to these Consolidated Financial Statements for the required disclosures at December 31, 2010.
F-18
Table of Contents
NARA BANCORP, INC. AND SUBSIDIARIES
NOTES TO CONSOLIDATED FINANCIAL STATEMENTS—(Continued)
Newly Issued But Not Yet Effective Accounting Pronouncements
FASB ASU 2010-28, “Intangibles—Goodwill and Other (Topic 350), When to Perform Step 2 of the Goodwill Impairment Test for Reporting Units with Zero or Negative Carrying Amounts”—ASU 2010-28 affects all entities that have recognized goodwill and have one or more reporting units whose carrying amount for purposes of performing Step 1 of the goodwill impairment test is zero or negative. ASU 2010-28 modifies Step 1 so that for those reporting units, an entity is required to perform Step 2 of the goodwill impairment test if it is more likely than not that a goodwill impairment exists. In determining whether it is more likely than not that a goodwill impairment exists, an entity should consider whether there are any adverse qualitative factors indicating that an impairment may exist. The qualitative factors are consistent with existing guidance, which requires that goodwill of a reporting unit be tested for impairment between annual tests if an event occurs or circumstances change that would more likely than not reduce the fair value of a reporting unit below its carrying amount. For public entities, this guidance is effective for fiscal years, and interim periods within those years, beginning after December 15, 2010. Adoption of ASU 2010-28 is not expected to have a significant impact on our consolidated financial statements.
2. SECURITIES AVAILABLE FOR SALE
The following is a summary of securities available for sale at December 31:
| 2010 | ||||||||||||||||
| Amortized Cost |
Gross Unrealized Gains |
Gross Unrealized Losses |
Estimated Fair Value |
|||||||||||||
| (In thousands) | ||||||||||||||||
| Debt securities*: |
||||||||||||||||
| GSE bonds |
$ | 125,429 | $ | 1,059 | $ | (770 | ) | $ | 125,718 | |||||||
| GSE collateralized mortgage obligations |
101,312 | 2,146 | (257 | ) | 103,201 | |||||||||||
| GSE mortgage-backed securities |
282,205 | 4,628 | (1,999 | ) | 284,834 | |||||||||||
| Corporate note |
4,473 | — | (765 | ) | 3,708 | |||||||||||
| Municipal bonds |
5,258 | 55 | (31 | ) | 5,282 | |||||||||||
| Total debt securities |
518,677 | 7,888 | (3,822 | ) | 522,743 | |||||||||||
| Mutual funds |
5,462 | 57 | — | 5,519 | ||||||||||||
| Total |
$ | 524,139 | $ | 7,945 | $ | (3,822 | ) | $ | 528,262 | |||||||
| 2009 | ||||||||||||||||
| Amortized Cost |
Gross Unrealized Gains |
Gross Unrealized Losses |
Estimated Fair Value |
|||||||||||||
| (In thousands) | ||||||||||||||||
| Debt securities*: |
||||||||||||||||
| GSE bonds |
$ | 85,343 | $ | 354 | $ | (468 | ) | $ | 85,229 | |||||||
| GSE collateralized mortgage obligations |
191,711 | 1,273 | (1,949 | ) | 191,035 | |||||||||||
| GSE mortgage-backed securities |
485,705 | 7,333 | (824 | ) | 492,214 | |||||||||||
| Corporate note |
4,458 | — | (1,034 | ) | 3,424 | |||||||||||
| Municipal bonds |
5,259 | 78 | (12 | ) | 5,325 | |||||||||||
| Total debt securities |
772,476 | 9,038 | (4,287 | ) | 777,227 | |||||||||||
| Mutual funds |
5,462 | 1 | — | 5,463 | ||||||||||||
| Total |
$ | 777,938 | $ | 9,039 | $ | (4,287 | ) | $ | 782,690 | |||||||
| * | As of December 31, 2010 and 2009, Government Sponsored Enterprises (GSE) included GNMA, FHLB, FNMA, FHLMC, and FFCB, and are all residential based investments. |
F-19
Table of Contents
NARA BANCORP, INC. AND SUBSIDIARIES
NOTES TO CONSOLIDATED FINANCIAL STATEMENTS—(Continued)
At year-end 2010 and 2009, there were no holdings of securities of any one issuer, other than the U.S. Government and its agencies, in an amount greater than 10% of stockholders’ equity.
The proceeds from sales of securities and the associated gains are listed below:
| 2010 | 2009 | 2008 | ||||||||||
| (In thousands) | ||||||||||||
| Proceeds |
$ | 208,142 | $ | 239,734 | $ | 76,135 | ||||||
| Gross gains |
6,296 | 4,413 | 865 | |||||||||
| Gross losses |
— | (3 | ) | (10 | ) | |||||||
The tax expense related to these net realized gains and losses was $3.3 million, $2.3 million and $319 thousand, respectively.
The proceeds from calls of securities were $35.3 million, $24.6 million and $20.1 million for 2010, 2009 and 2008 with gross gains of $100 thousand, $17 thousand and $5 thousand, respectively. There were no losses on calls.
The amortized cost and estimated fair value of debt securities at December 31, 2010, by contractual maturity, are shown below. Expected maturities may differ from contractual maturities because borrowers may have the right to call or prepay obligations with or without call or prepayment penalties. Securities not due at a single maturity date are shown separately.
| Amortized Cost |
Estimated Fair Value |
|||||||
| (In thousands) | ||||||||
| Available for sale: |
||||||||
| Due within one year |
$ | — | $ | — | ||||
| Due after one year through five years |
340 | 346 | ||||||
| Due after five years through ten years |
1,652 | 1,675 | ||||||
| Due after ten years |
133,168 | 132,687 | ||||||
| GSE collaterized mortgage obligations |
101,312 | 103,201 | ||||||
| GSE mortgage-backed securities |
282,205 | 284,834 | ||||||
| Mutual funds |
5,462 | 5,519 | ||||||
| $ | 524,139 | $ | 528,262 | |||||
Securities with carrying values of approximately $270.3 million and $243.2 million at December 31, 2010 and 2009, respectively, were pledged to secure public deposits, various borrowings and for other purposes as required or permitted by law.
F-20
Table of Contents
NARA BANCORP, INC. AND SUBSIDIARIES
NOTES TO CONSOLIDATED FINANCIAL STATEMENTS—(Continued)
The following table shows the gross unrealized losses and fair value of securities, aggregated by investment category and length of time that individual securities have been in a continuous unrealized loss position, at December 31, 2010 and 2009.
| At December 31, 2010: | Less than 12 months | 12 months or longer | Total | |||||||||||||||||||||||||||||||||
| Description of Securities |
Number of Securities |
Fair Value | Gross Unrealized Losses |
Number of Securities |
Fair Value |
Gross Unrealized Losses |
Number of Securities |
Fair Value | Gross Unrealized Losses |
|||||||||||||||||||||||||||
| (In thousands) | ||||||||||||||||||||||||||||||||||||
| GSE bonds |
4 | $ | 65,465 | $ | (770 | ) | — | $ | — | $ | — | 4 | $ | 65,465 | $ | (770 | ) | |||||||||||||||||||
| GSE collaterized mortgage obligations |
3 | 9,091 | (187 | ) | 2 | 17,337 | (70 | ) | 5 | 26,428 | (257 | ) | ||||||||||||||||||||||||
| GSE mortgage-backed securities |
7 | 99,555 | (1,999 | ) | — | — | — | 7 | 99,555 | (1,999 | ) | |||||||||||||||||||||||||
| Corporate note |
— | — | — | 1 | 3,708 | (765 | ) | 1 | 3,708 | (765 | ) | |||||||||||||||||||||||||
| Municipal bonds |
5 | 1,929 | (31 | ) | — | — | — | 5 | 1,929 | (31 | ) | |||||||||||||||||||||||||
| 19 | $ | 176,040 | $ | (2,987 | ) | 3 | $ | 21,045 | $ | (835 | ) | 22 | $ | 197,085 | $ | (3,822 | ) | |||||||||||||||||||
| At December 31, 2009: | Less than 12 months | 12 months or longer | Total | |||||||||||||||||||||||||||||||||
| Description of Securities |
Number of Securities |
Fair Value | Gross Unrealized Losses |
Number of Securities |
Fair Value |
Gross Unrealized Losses |
Number of Securities |
Fair Value | Gross Unrealized Losses |
|||||||||||||||||||||||||||
| (In thousands) | ||||||||||||||||||||||||||||||||||||
| GSE bonds |
12 | $ | 45,067 | $ | (468 | ) | — | $ | — | $ | — | 12 | $ | 45,067 | $ | (468 | ) | |||||||||||||||||||
| GSE collaterized mortgage obligations |
8 | 79,518 | (1,251 | ) | 5 | 28,494 | (698 | ) | 13 | 108,012 | (1,949 | ) | ||||||||||||||||||||||||
| GSE mortgage-backed securities |
22 | 104,900 | (823 | ) | 1 | 59 | (1 | ) | 23 | 104,959 | (824 | ) | ||||||||||||||||||||||||
| Corporate note |
— | — | — | 1 | 3,424 | (1,034 | ) | 1 | 3,424 | (1,034 | ) | |||||||||||||||||||||||||
| Municipal bonds |
4 | 1,506 | (12 | ) | — | — | — | 4 | 1,506 | (12 | ) | |||||||||||||||||||||||||
| 46 | $ | 230,991 | $ | (2,554 | ) | 7 | $ | 31,977 | $ | (1,733 | ) | 53 | $ | 262,968 | $ | (4,287 | ) | |||||||||||||||||||
We evaluate securities for other-than-temporary impairment on at least a quarterly basis, and more frequently when economic or market concerns warrant such evaluation. Consideration is given to the financial condition and near-term prospects of the issuer; the length of time and the extent to which the fair value has been less than cost, and our intention to sell, or it is more likely than not that it will be required to sell, a security in an unrealized loss position before recovery of its amortized cost basis. In analyzing an issuer’s financial condition, we consider whether the securities are issued by the federal government or its agencies, whether downgrades by bond rating agencies have occurred, and the results of reviews of the issuer’s financial condition.
During the second quarter 2008, we received a downgrade notification from one of the rating agencies on a non-agency asset-backed security. The downgrade reduced the credit rating from investment grade to substantially below investment grade, requiring an OTTI charge of $1.7 million to write down the security value to zero. We have no other non-agency asset-backed securities in portfolio. The corporate note at December 31, 2010 and 2009 consists of one bond with an amortized cost of $4.5 million and an unrealized loss of $765 thousand at December 31, 2010. The bond is scheduled to mature in May 2047, with a first call date option in
F-21
Table of Contents
NARA BANCORP, INC. AND SUBSIDIARIES
NOTES TO CONSOLIDATED FINANCIAL STATEMENTS—(Continued)
May 2012. Management determined this unrealized loss did not represent other-than-temporary impairment at December 31, 2010 as the investment is rated investment grade and there are no credit quality concerns with the obligor. The market value decline is deemed to be due to the current market volatility and is not reflective of management’s expectations of their ability to fully recover this investment. Interest on the corporate note has been paid as agreed and management believes this will continue in the future and the bond will be repaid in full as scheduled. For these reasons, no other-than-temporary impairment was recognized on the corporate note at December 31, 2010.
We consider the losses on our investments in an unrealized loss position at December 31, 2010 to be temporary based on: 1) the likelihood of recovery; 2) the information relative to the extent and duration of the decline in market value; and 3) the Company’s intention not to sell, or it is more likely than not that it will not be required to sell, a security in an unrealized loss position before recovery of its amortized cost basis.
3. LOANS RECEIVABLE AND THE ALLOWANCE FOR LOAN LOSSES
The following is a summary of loans by major category at December 31:
| 2010 | 2009 | |||||||
| (In thousands) | ||||||||
| Loan portfolio composition |
||||||||
| Real estate loans: |
||||||||
| Residential |
$ | 2,263 | $ | 4,801 | ||||
| Commercial & industrial |
1,524,650 | 1,595,219 | ||||||
| Construction |
46,900 | 54,084 | ||||||
| Total real estate loans |
1,573,813 | 1,654,104 | ||||||
| Commercial business |
491,811 | 487,736 | ||||||
| Trade finance |
57,430 | 51,411 | ||||||
| Consumer and other |
13,268 | 18,035 | ||||||
| Total loans outstanding |
2,136,322 | 2,211,286 | ||||||
| Less: deferred loan fees |
(2,261 | ) | (2,343 | ) | ||||
| Gross loans receivable |
2,134,061 | 2,208,943 | ||||||
| Less: allowance for loan losses |
(62,320 | ) | (59,424 | ) | ||||
| Loans receivable, excluding guaranteed portion of delinquent SBA loans |
2,071,741 | 2,149,519 | ||||||
| Guaranteed portion of delinquent SBA loans |
13,684 | 12,490 | ||||||
| Loans receivable, net |
$ | 2,085,425 | $ | 2,162,009 | ||||
Activity in the allowance for loan losses is as follows for the years ended December 31:
| 2010 | 2009 | 2008 | ||||||||||
| (In thousands) | ||||||||||||
| Balance, beginning of year |
$ | 59,424 | $ | 43,419 | $ | 20,035 | ||||||
| Provision for loan losses |
84,630 | 61,023 | 48,825 | |||||||||
| Loans charged off |
(84,652 | ) | (45,686 | ) | (25,693 | ) | ||||||
| Recoveries of charge-offs |
2,918 | 668 | 252 | |||||||||
| Balance, end of year |
$ | 62,320 | $ | 59,424 | $ | 43,419 | ||||||
F-22
Table of Contents
NARA BANCORP, INC. AND SUBSIDIARIES
NOTES TO CONSOLIDATED FINANCIAL STATEMENTS—(Continued)
The activity in the allowance for loan losses by class of loans for the year ended December 31, 2010 is as follows:
| Real estate - Commercial | Real estate - Construction |
Commercial Business |
Trade Finance |
Consumer and other |
Unallocated | Total | ||||||||||||||||||||||||||||||||||||||||||||||
| Real estate - Residential |
Retail | Hotel & Motel |
Gas Station & Car Wash |
Mixed Use | Industrial & Warehouse |
Other | ||||||||||||||||||||||||||||||||||||||||||||||
| Balance, beginning of year |
$ | 18 | $ | 7,068 | $ | 10,506 | $ | 9,034 | $ | 3,032 | $ | 1,844 | $ | 9,357 | $ | 913 | $ | 15,656 | $ | 410 | $ | 1,143 | $ | 443 | $ | 59,424 | ||||||||||||||||||||||||||
| Provision for loan losses |
19 | 9,937 | 14,695 | 8,213 | 1,587 | 4,937 | 10,722 | 3,331 | 30,930 | (218 | ) | 651 | (174 | ) | 84,630 | |||||||||||||||||||||||||||||||||||||
| Loans charged off |
(23 | ) | (11,384 | ) | (18,322 | ) | (12,342 | ) | (3,042 | ) | (3,196 | ) | (10,532 | ) | (848 | ) | (23,607 | ) | — | (1,356 | ) | — | (84,652 | ) | ||||||||||||||||||||||||||||
| Recoveries of charged offs |
— | 12 | 21 | 397 | — | — | 341 | — | 1,951 | — | 196 | — | 2,918 | |||||||||||||||||||||||||||||||||||||||
| Balance, end of year |
$ | 14 | $ | 5,633 | $ | 6,900 | $ | 5,302 | $ | 1,577 | $ | 3,585 | $ | 9,888 | $ | 3,396 | $ | 24,930 | $ | 192 | $ | 634 | $ | 269 | $ | 62,320 | ||||||||||||||||||||||||||
The allowance for loan losses is comprised of specific loss allowances for impaired loans and general loan loss allowances based on quantitative and qualitative analyses.
Individually impaired loans were as follows:
| As of and for the Year Ended December 31, |
||||||||
| 2010 | 2009 | |||||||
| (In Thousands) | ||||||||
| With Allocated Allowance |
||||||||
| Without charge-off |
$ | 63,944 | $ | 69,771 | ||||
| With charge-off |
4,188 | 3,385 | ||||||
| With No Allocated Allowance |
||||||||
| Without charge-off |
42,015 | 32,253 | ||||||
| With charge-off |
12,540 | 15,131 | ||||||
| Allowance on Impaired Loans |
(21,102 | ) | (19,803 | ) | ||||
| Impaired Loans, net of allowance |
$ | 101,585 | $ | 100,737 | ||||
| Average Impaired Loans |
$ | 123,242 | $ | 84,593 | ||||
| Interest income recognized during impairment |
6,188 | 4,466 | ||||||
| Cash-basis interest income recognized |
6,135 | 4,249 | ||||||
F-23
Table of Contents
NARA BANCORP, INC. AND SUBSIDIARIES
NOTES TO CONSOLIDATED FINANCIAL STATEMENTS—(Continued)
The year-end impaired loans are set forth in the following table by class of loans.
| As of December 31, 2010 | ||||||||||||
| Unpaid Principal Balance |
Related Allowance |
Average Balance |
||||||||||
| (In Thousands) | ||||||||||||
| With Related Allowance: |
||||||||||||
| Real Estate—Residential |
$ | — | $ | — | $ | — | ||||||
| Real Estate—Commercial |
||||||||||||
| Retail |
$ | 7,347 | $ | (1,518 | ) | $ | 7,498 | |||||
| Hotel & Motel |
5,349 | (987 | ) | 11,439 | ||||||||
| Gas Station & Car Wash |
3,142 | (1,411 | ) | 8,844 | ||||||||
| Mixed Use |
308 | (53 | ) | 2,334 | ||||||||
| Industrial & Warehouse |
7,539 | (1,729 | ) | 2,453 | ||||||||
| Other |
2,697 | (448 | ) | 5,711 | ||||||||
| Real Estate—Construction |
5,789 | (1,686 | ) | 4,027 | ||||||||
| Commercial Business |
35,961 | (13,270 | ) | 29,753 | ||||||||
| Trade Finance |
— | — | — | |||||||||
| Consumer and Other |
— | — | 89 | |||||||||
| $ | 68,132 | $ | (21,102 | ) | $ | 72,148 | ||||||
| With No Related Allowance |
||||||||||||
| Real Estate—Residential |
$ | — | $ | — | $ | — | ||||||
| Real Estate—Commercial |
||||||||||||
| Retail |
9,127 | — | 10,100 | |||||||||
| Hotel & Motel |
8,619 | — | 7,299 | |||||||||
| Gas Station & Car Wash |
5,197 | — | 8,361 | |||||||||
| Mixed Use |
3,660 | — | 4,635 | |||||||||
| Industrial & Warehouse |
367 | 2,510 | ||||||||||
| Other |
17,530 | — | 10,853 | |||||||||
| Real Estate—Construction |
4,469 | — | 2,481 | |||||||||
| Commercial Business |
5,029 | — | 4,550 | |||||||||
| Trade Finance |
469 | — | 287 | |||||||||
| Consumer and Other |
88 | — | 18 | |||||||||
| $ | 54,555 | $ | — | $ | 51,094 | |||||||
| Total |
$ | 122,687 | $ | (21,102 | ) | $ | 123,242 | |||||
| * | Adjustment to recorded investment is not deemed material to this presentation. Accrued interest receivable on total loans is $6.1 million and $6.9 million and deferred loan fees on total loans are $(2.3) million and $(2.3 million) at December 31, 2010 and 2009. |
F-24
Table of Contents
NARA BANCORP, INC. AND SUBSIDIARIES
NOTES TO CONSOLIDATED FINANCIAL STATEMENTS—(Continued)
The following table provides nonaccrual and loans past due over 90 days still on accrual by class of loans as of December 31, 2010:
| As of December 31, 2010 | ||||||||||||
| Non-accrual Loans* |
Loans past due 90 days or more, still accruing* |
Total nonperforming loans* |
||||||||||
| (In Thousands) | ||||||||||||
| Real estate loans: |
||||||||||||
| Residential |
$ | — | $ | — | $ | — | ||||||
| Commercial |
||||||||||||
| Retail |
1,615 | — | 1,615 | |||||||||
| Hotel & Motel |
1,187 | — | 1,187 | |||||||||
| Gas Station & Car Wash |
3,054 | — | 3,054 | |||||||||
| Mixed Use |
3,968 | — | 3,968 | |||||||||
| Industrial & Warehouse |
3,690 | — | 3,690 | |||||||||
| Other |
4,834 | — | 4,834 | |||||||||
| Construction |
8,547 | — | 8,547 | |||||||||
| Total |
26,895 | — | 26,895 | |||||||||
| Commercial business |
15,991 | — | 15,991 | |||||||||
| Trade finance |
469 | — | 469 | |||||||||
| Consumer and other |
448 | — | 448 | |||||||||
| $ | 43,803 | $ | — | $ | 43,803 | |||||||
| * | Adjustment to recorded investment is not deemed material to this presentation. |
Non accrual loans and loans past due 90 days still on accrual were $51.7 million and $0, respectively, as of December 31, 2009.
The following table presents the aging of past due loans as of December 31, 2010 by class of loans:
| As of December 31, 2010 | ||||||||||||||||
| 30-59 Days Past Due* |
60-89 Days Past Due* |
Greater than 90 Days Past Due* |
Total Past Due* |
|||||||||||||
| (In Thousands) | ||||||||||||||||
| Real estate—Residential |
$ | 46 | $ | — | $ | — | $ | 46 | ||||||||
| Real estate—Commercial |
||||||||||||||||
| Retail |
950 | 188 | 1,615 | 2,753 | ||||||||||||
| Hotel & Motel |
455 | — | 1,187 | 1,642 | ||||||||||||
| Gas Station & Car Wash |
— | — | 3,054 | 3,054 | ||||||||||||
| Mixed Use |
401 | — | 3,968 | 4,369 | ||||||||||||
| Industrial & Warehouse |
133 | 239 | 3,690 | 4,062 | ||||||||||||
| Other |
302 | — | 4,834 | 5,136 | ||||||||||||
| Real estate—Construction |
— | — | 8,547 | 8,547 | ||||||||||||
| Commercial business |
684 | 855 | 15,991 | 17,530 | ||||||||||||
| Trade finance |
— | — | 469 | 469 | ||||||||||||
| Consumer and other |
41 | 2 | 448 | 491 | ||||||||||||
| $ | 3,012 | $ | 1,284 | $ | 43,803 | $ | 48,099 | |||||||||
F-25
Table of Contents
NARA BANCORP, INC. AND SUBSIDIARIES
NOTES TO CONSOLIDATED FINANCIAL STATEMENTS—(Continued)
| * | Adjustment to recorded investment is not deemed material to this presentation. Accrued interest receivable on total loans is $6.1 million and $6.9 million and deferred loan fees on total loans are $(2.3) million and $(2.3 million) at December 31, 2010 and 2009. |
We categorize loans into risk categories based on relevant information about the ability of borrowers to service their debt such as: current financial information, historical payment experience, credit documentation, public information, and current economic trends, among other factors. We analyze loans individually by classifying the loans as to credit risk. This analysis includes all non-homogeneous loans. This analysis is performed at least on a quarterly basis. We use the following definitions for risk ratings:
| • | Special Mention: Loans classified as special mention have a potential weakness that deserves management’s close attention. If left uncorrected, these potential weaknesses may result in deterioration of the repayment prospects for the loan or of the institution’s credit position at some future date. |
| • | Substandard: Loans classified as substandard are inadequately protected by the current net worth and paying capacity of the obligor or of the collateral pledged, if any. Loans so classified have a well-defined weakness or weaknesses that jeopardize the repayment of the debt. They are characterized by the distinct possibility that the institution will sustain some loss if the deficiencies are not corrected. |
| • | Doubtful: Loans classified as doubtful have all the weaknesses inherent in those classified as substandard, with the added characteristic that the weaknesses make collection or repayment in full, on the basis of currently existing facts, conditions, and values, highly questionable and improbable. |
Loans not meeting the criteria above that are analyzed individually as part of the above described process are considered to be Pass-rated loans. As of December 31, 2010, and based on the most recent analysis performed, the risk category of loans by class of loans is as follows:
| As of December 31, 2010 | ||||||||||||||||
| Special Mention |
Substandard | Doubtful | Total | |||||||||||||
| Real estate—Residential |
$ | — | $ | 46 | $ | 46 | ||||||||||
| Real estate—Commercial |
||||||||||||||||
| Retail |
1,948 | 18,898 | — | 20,846 | ||||||||||||
| Hotel & Motel |
10,896 | 15,490 | — | 26,386 | ||||||||||||
| Gas Station & Car Wash |
8,798 | 8,923 | — | 17,721 | ||||||||||||
| Mixed Use |
364 | 5,887 | — | 6,251 | ||||||||||||
| Industrial & Warehouse |
385 | 8,871 | — | 9,256 | ||||||||||||
| Other |
1,865 | 21,431 | 23,296 | |||||||||||||
| Real estate—Construction |
— | 10,257 | — | 10,257 | ||||||||||||
| Commercial business |
4,182 | 45,054 | 260 | 49,496 | ||||||||||||
| Trade finance |
305 | 469 | — | 774 | ||||||||||||
| Consumer and other |
830 | 448 | — | 1,278 | ||||||||||||
| Total Watch List Loans |
$ | 29,573 | $ | 135,774 | $ | 260 | $ | 165,607 | ||||||||
The adequacy of the allowance for loan losses is determined by management based upon an evaluation and review of the credit quality of the loan portfolio, consideration of historical loan loss experience, relevant internal and external factors that affect the collection of a loan, and other pertinent factors.
The Migration Analysis is a formula methodology based on the Bank’s actual historical net charge-off experience for each loan pool and loan risk grade (Pass, Special Mention, Substandard and Doubtful). The migration analysis is centered on the Bank’s internal credit risk rating system. Our internal loan review and
F-26
Table of Contents
NARA BANCORP, INC. AND SUBSIDIARIES
NOTES TO CONSOLIDATED FINANCIAL STATEMENTS—(Continued)
external contracted credit review examinations are used to determine and validate loan risk grades. This credit review system takes into consideration factors such as: borrower’s background and experience; historical and current financial condition; credit history and payment performance; economic conditions and their impact on various industries; type, fair value and volatility of the fair value of collateral; lien position; and the financial strength of any guarantors.
A general loan loss allowance is provided on loans not specifically identified as impaired (“non-impaired loans”). The allowance is determined first based on a quantitative analysis using a loss migration methodology. The loans are classified by type and loan grade, and the historical loss migration is tracked for the various stratifications. Loss experience is quantified for the most recent 12 quarters and then weighted to give more weight to the most recent losses. That loss experience is then applied to the stratified portfolio at each quarter end. During 2009, the non-impaired Commercial Real Estate loan portfolio was stratified into ten different loan pools based on property types and the non-impaired Commercial and Industrial loan portfolio was stratified into five different loan pools based on loan type, to allocate historic loss experience to more granular loan pools. Effective June 30, 2010 four additional pools, primarily in the commercial real estate portfolio, were further stratified. In addition, a new software program was implemented effective June 30, 2010 and is used to track and allocate charge-offs to the various loan grades by loan pools.
The stratification of the non-impaired loan portfolio resulted in a quantitative general loan loss allowance of $23.9 million at December 31, 2010, compared to $11.3 million at December 31, 2009. The enhancement to the reserve methodology mentioned previously enables loan losses to be allocated into the Pass loan grade levels. This extended migration analysis process resulted in higher levels of quantitative reserves being required for the various Pass graded loan pools.
Additionally, in order to systematically quantify the credit risk impact of other trends and changes within the loan portfolio, the Bank utilizes qualitative adjustments to the Migration Analysis within established parameters. The parameters for making adjustments are established under a Credit Risk Matrix that provides seven possible scenarios for each of the factors below. The matrix allows for up to three positive (Major, Moderate, and Minor), three negative (Major, Moderate, and Minor), and one neutral credit risk scenarios within each factor for each loan type pool. Generally, the factors are considered to have no significant impact (neutral) to our historical migration ratios. However, if information exists to warrant adjustment to the Migration Analysis, changes are made in accordance with the established parameters supported by narrative and/or statistical analysis. The Credit Risk Matrix and the seven possible scenarios enable the Bank to qualitatively adjust the Loss Migration Ratio by as much as 50 basis points in either direction (positive or negative) for each loan type pool. This matrix considers the following nine factors, which are patterned after the guidelines provided under the FFIEC Interagency Policy Statement on the Allowance for Loan and Lease Losses:
| • | Changes in lending policies and procedures, including underwriting standards and collection, charge-off, and recovery practices. |
| • | Changes in national and local economic and business conditions and developments, including the condition of various market segments. |
| • | Changes in the nature and volume of the loan portfolio. |
| • | Changes in the experience, ability, and depth of lending management and staff. |
| • | Changes in the trends of the volume and severity of past due and classified loans; and changes in trends in the volume of non-accrual loans and troubled debt restructurings, and other loan modifications. |
| • | Changes in the quality of our loan review system and the degree of oversight by the Directors. |
| • | Changes in the value of underlying collateral for collateral-dependent loans. |
F-27
Table of Contents
NARA BANCORP, INC. AND SUBSIDIARIES
NOTES TO CONSOLIDATED FINANCIAL STATEMENTS—(Continued)
| • | The existence and effect of any concentrations of credit, and changes in the level of such concentrations. |
| • | The effect of external factors such as competition and legal and regulatory requirements on the level of estimated losses in our loan portfolio. |
The qualitative loan loss allowance on the non-impaired loan portfolio was $17.0 million at December 31, 2010 compared to $28.4 million at December 31, 2009.
We also establish specific loss allowances for loans where we have identified potential credit risk conditions or circumstances related to a specific individual credit. The specific allowance amounts are determined by a method prescribed by FASB ASC 310-10-35-22, Measurement of Impairment. The loans identified as impaired will be accounted for in accordance with one of the three acceptable valuations: 1) the present value of future cash flows discounted at the loan’s effective interest rate; 2) the loan’s observable market price; or 3) the fair value of the collateral, if the loan is collateral dependent. For the collateral dependent impaired loans, we obtain an appraisal to determine the amount of impairment at the date that the loan become impaired. The appraisals are based on “as is” valuation. To ensure that appraised values remain current, we generally obtain an updated appraisal every twelve months from qualified independent appraisals. Furthermore, if the most current appraisal is dated more than six months prior to the effective date of the impairment test, we validate the most current value with third party market data appropriate to the location and property type of the collateral. If the third party market data indicates that the value of our collateral property values has declined since the most recent valuation date, we adjust downward the value of the property to reflect current market conditions. If the fair value of the collateral, less cost to sell, is less than the recorded amount of the loan, we then recognize impairment by creating or adjusting an existing valuation allowance with a corresponding charge to the provision for loan losses. If an impaired loan is expected to be collected through liquidation of the collateral, the amount of impairment, depending on the size of the impaired loan, is charged off against the allowance for loan losses.
The Bank considers a loan to be impaired when it is probable that not all amounts due (principal and interest) will be collectible in accordance with the contractual terms of the loan agreement. Factors considered by management in determining impairment include payment status, collateral value and the probability of collecting scheduled principal and interest payments when due. Loans that experience insignificant payment delays and payment shortfalls generally are not classified as impaired. The significance of payment delays and payment shortfalls is determined on a case-by-case basis by taking into consideration all of the circumstances surrounding the loan and the borrower, including the length of the delay, the reasons for the delay, the borrower’s prior payment record and the amount of the shortfall in relation to the principal and interest owed.
For commercial business loans, real estate loans and certain consumer loans, we base the measurement of loan impairment on the present value of the expected future cash flows, discounted at the loan’s effective interest rate or on the fair value of the loan’s collateral if the loan is collateral dependent. We evaluate most consumer loans for impairment on a collective basis, because these loans have generally smaller balances and are homogeneous in the underwriting terms and conditions, and in the type of collateral. If a loan is deemed to be impaired, the amount of the impairment is supported by a specific allowance amount which is included in the allowance for loan losses through a charge to the provision for loan losses.
In the third quarter, 2010, based on current market conditions, we expanded the criteria for evaluating loans for impairment which resulted in an increase in impaired loans from the prior quarter. Prior to the third quarter of 2010, loans graded Substandard were not individually evaluated for impairment and only considered impaired if they were 60+ days past due, unless other events existed that qualified the loan for impairment review. Therefore, a Substandard credit that was current in its contractual payments, but was classified due to other risk issues would not necessarily be subject to individual review for impairment analysis. Effective September 30, 2010, we expanded the scope of the loans reviewed for individual impairment by including all loans over $2 million that
F-28
Table of Contents
NARA BANCORP, INC. AND SUBSIDIARIES
NOTES TO CONSOLIDATED FINANCIAL STATEMENTS—(Continued)
were risk-graded as Substandard, even though such loans were less than 60 days delinquent and were performing under their contractual terms. Effective December 31, 2010, we expanded this scope again by now including all loans over $1 million, which added 3 loans totaling $4.6 million to aggregate impaired loans. This enhancement to our impairment analysis provided more coverage in terms of current fair values on classified loans as updated market values are required as part of the impairment analysis process.
The following table presents loans by portfolio segment and impairment method at December 31, 2010 and 2009:
| As of December 31, 2010 | ||||||||||||||||||||||||||||
| Real estate - Residential |
Real estate - Commercial |
Real estate - Construction |
Commercial business |
Trade finance |
Consumer and other |
Total | ||||||||||||||||||||||
| (In Thousands) | ||||||||||||||||||||||||||||
| Impaired loans |
$ | — | $ | 70,882 | $ | 10,258 | $ | 40,990 | $ | 469 | $ | 88 | $ | 122,687 | ||||||||||||||
| Specific allowance |
$ | — | $ | 6,145 | $ | 1,686 | $ | 13,271 | $ | — | $ | — | $ | 21,102 | ||||||||||||||
| Loss coverage ratio |
0 | % | 8.67 | % | 16.44 | % | 32.38 | % | 0.00 | % | 0.00 | % | 17.20 | % | ||||||||||||||
| Non-impaired loans |
$ | 2,263 | $ | 1,453,768 | $ | 36,642 | $ | 450,821 | $ | 56,961 | $ | 13,180 | $ | 2,013,635 | ||||||||||||||
| General allowance |
$ | 14 | $ | 26,740 | $ | 1,710 | $ | 11,659 | $ | 192 | $ | 903 | $ | 41,218 | ||||||||||||||
| Loss coverage ratio |
0.62 | % | 1.84 | % | 4.67 | % | 2.59 | % | 0.34 | % | 6.85 | % | 2.05 | % | ||||||||||||||
| Total loans(1) |
$ | 2,263 | $ | 1,524,650 | $ | 46,900 | $ | 491,811 | $ | 57,430 | $ | 13,268 | $ | 2,136,322 | ||||||||||||||
| Total allowance for loan losses |
$ | 14 | $ | 32,885 | $ | 3,396 | $ | 24,930 | $ | 192 | $ | 903 | $ | 62,320 | ||||||||||||||
| Loss coverage ratio |
0.62 | % | 2.16 | % | 7.24 | % | 5.07 | % | 0.33 | % | 6.81 | % | 2.92 | % | ||||||||||||||
| (1) | Excludes the guaranteed portion of delinquent SBA loans. |
| (2) | Adjustment to recorded investment is not deemed material to this presentation. Accrued interest receivable on total loans is $6.1 million and $6.9 million and deferred loan fees on total loans are $(2.3) million and $(2.3 million) at December 31, 2010 and 2009. |
| As of December 31, 2009 | ||||||||||||||||||||||||||||
| Real estate - Residential |
Real estate - Commercial |
Real estate - Construction |
Commercial business |
Trade finance |
Consumer and other |
Total | ||||||||||||||||||||||
| (In Thousands) | ||||||||||||||||||||||||||||
| Impaired loans |
$ | — | $ | 94,600 | $ | 2,342 | $ | 23,598 | $ | — | $ | — | $ | 120,540 | ||||||||||||||
| Specific allowance |
$ | — | $ | 10,852 | $ | 275 | $ | 8,676 | $ | — | $ | — | $ | 19,803 | ||||||||||||||
| Loss coverage ratio |
0.00 | % | 11.47 | % | 11.74 | % | 36.77 | % | 0.00 | % | 0.00 | % | 16.43 | % | ||||||||||||||
| Non-impaired loans |
$ | 4,801 | $ | 1,500,619 | $ | 51,742 | $ | 464,138 | $ | 51,411 | $ | 18,035 | $ | 2,090,746 | ||||||||||||||
| General allowance |
$ | 18 | $ | 29,989 | $ | 638 | $ | 6,979 | $ | 410 | $ | 1,587 | $ | 39,621 | ||||||||||||||
| Loss coverage ratio |
0.37 | % | 2.00 | % | 1.23 | % | 1.50 | % | 0.80 | % | 8.80 | % | 1.90 | % | ||||||||||||||
| Total loans(1) |
$ | 4,801 | $ | 1,595,219 | $ | 54,084 | $ | 487,736 | $ | 51,411 | $ | 18,035 | $ | 2,211,286 | ||||||||||||||
| Total allowance for loan losses |
$ | 18 | $ | 40,841 | $ | 913 | $ | 15,655 | $ | 410 | $ | 1,587 | $ | 59,424 | ||||||||||||||
| Loss coverage ratio |
0.37 | % | 2.56 | % | 1.69 | % | 3.21 | % | 0.80 | % | 8.80 | % | 2.69 | % | ||||||||||||||
| (1) | Excludes the guaranteed portion of delinquent SBA loans. |
| (2) | Adjustment to recorded investment is not deemed material to this presentation. Accrued interest receivable on total loans is $6.1 million and $6.9 million and deferred loan fees on total loans are $(2.3) million and $(2.3 million) at December 31, 2010 and 2009. |
F-29
Table of Contents
NARA BANCORP, INC. AND SUBSIDIARIES
NOTES TO CONSOLIDATED FINANCIAL STATEMENTS—(Continued)
Under certain circumstances, we will provide borrowers relief through loan modifications. These modifications are either temporary in nature (“temporary modifications”), or are more substantive troubled debt restructurings. At December 31, 2010, total modified loans were $55.6 million, compared to $108.4 million at December 31, 2009. The temporary modifications generally consist of interest only payments for a three- to six- month period, whereby principal payments are deferred. At the end of the modification period, the remaining principal balance is re-amortized based on the original maturity date. Loans subject to temporary modifications are generally downgraded to Substandard or Special Mention. At the end of the modification period, the loan 1) returns to the original contractual terms; 2) is further modified and accounted for as a troubled debt restructuring in accordance with ASC 310-10-35; or 3) is disposed of through foreclosure or liquidation.
Troubled Debt Restructured (“TDR”) loans are defined by ASC 310-40, “Troubled Debt Restructurings by Creditors” and ASC 470-60, “Troubled Debt Restructurings by Debtors,” and evaluated for impairment in accordance with ASC 310-10-35. The concessions may be granted in various forms, including reduction in the stated interest rate, reduction in the amount of principal amortization, forgiveness of a portion of a loan balance or accrued interest, or extension of the maturity date.
A summary of TDR on accrual by type of concession as of December 31, 2010 and 2009 is presented below:
| As of December 31, 2010 | As of December 31, 2009 | |||||||||||||||||||||||
| Real estate - Commercial |
Commercial Business |
Total | Real estate - Commercial |
Commercial Business |
Total | |||||||||||||||||||
| (In Thousands) | ||||||||||||||||||||||||
| Payment concession |
$ | 975 | $ | 8,744 | $ | 9,719 | $ | 2,993 | $ | 4,287 | $ | 7,280 | ||||||||||||
| Maturity / Amortization concession |
4,968 | 7,144 | 12,112 | 34,403 | 5,332 | 39,735 | ||||||||||||||||||
| Rate concession |
12,250 | 1,022 | 13,272 | 16,496 | 829 | 17,325 | ||||||||||||||||||
| $ | 18,193 | $ | 16,910 | $ | 35,103 | $ | 53,892 | $ | 10,448 | $ | 64,340 | |||||||||||||
TDRs on accrual status are comprised of loans that were accruing at the time of restructuring and for which the Bank anticipates full repayment of both principal and interest. TDRs that are on non-accrual can be returned to accrual status after a period of sustained performance, generally determined to be six months of timely payments as modified. Sustained performance includes the periods prior to the modification if the prior performance met or exceeded the modified terms. TDRs on accrual status at December 31, 2010 were comprised of 17 commercial real estate loans totaling $18.2 million and 43 commercial business loans totaling $16.9 million. TDRs on accrual status at December 31, 2009 were comprised of 34 commercial real estate loans totaling $53.9 million and 54 commercial business loans totaling $10.4 million. We expect that the TDRs on accrual status as of December 31, 2010, which are all performing in accordance with their restructured terms to continue to comply with the restructured terms because of the reduced principal or interest payments on these loans.
We have allocated $15.8 million and $14.1 million of specific reserves to TDRs as of December 31, 2010 and 2009, respectively. As of December 31, 2010 and 2009, we did not have any outstanding commitments to extend additional funds to these borrowers.
F-30
Table of Contents
NARA BANCORP, INC. AND SUBSIDIARIES
NOTES TO CONSOLIDATED FINANCIAL STATEMENTS—(Continued)
4. PREMISES AND EQUIPMENT, NET
Premises and equipment, net consisted of the following at December 31:
| 2010 | 2009 | |||||||
| (In thousands) | ||||||||
| Furniture, fixtures and equipment |
$ | 12,949 | $ | 10,915 | ||||
| Leasehold improvements |
14,605 | 13,886 | ||||||
| 27,554 | 24,801 | |||||||
| Accumulated depreciation and amortization |
(16,639 | ) | (13,936 | ) | ||||
| $ | 10,915 | $ | 10,865 | |||||
Depreciation and amortization expense on furniture, fixtures and equipment and leasehold improvements was approximately $2.9 million, $2.8 million and $2.8 million for the years ended December 31, 2010, 2009 and 2008, respectively.
5. GOODWILL AND OTHER INTANGIBLE ASSETS
The carrying amount of goodwill amounted to $2.5 million at December 31, 2010 and 2009. Goodwill is tested for impairment on an annual basis as of December 31, or more frequently as events occur, or as current circumstances and conditions warrant. The Company records impairment writedowns as charges to noninterest expense and adjustments to the carrying value of goodwill. Subsequent reversals of goodwill impairment are prohibited. The Company also has premiums on acquired deposits which represent the intangible value of depositor relationships resulting from deposit liabilities assumed in various acquisitions. Other intangibles are tested for impairment on an annual basis, or more frequently as events occur, or as current circumstances and conditions warrant. The gross carrying amount of deposit premiums totaled $5.9 million at December 31, 2010 and 2009, and the related accumulated amortization totaled $5.3 million and $4.8 million at December 31, 2010 and 2009, respectively. The Company did not record any impairment writedowns on deposit premiums during 2010, 2009 and 2008. The Company amortizes premiums on acquired deposits based on the projected useful lives of the related deposits. Total amortization expense on deposit premiums was $508 thousand, $585 thousand and $665 thousand for the years ended December 31, 2010, 2009 and 2008, respectively.
F-31
Table of Contents
NARA BANCORP, INC. AND SUBSIDIARIES
NOTES TO CONSOLIDATED FINANCIAL STATEMENTS—(Continued)
Following is a summary of the Company’s intangible assets at December 31:
| 2010 | 2009 | |||||||||||||||||||
| Gross Carrying Amount |
Accumulated Amortization |
Gross Carrying Amount |
Accumulated Amortization |
|||||||||||||||||
| (In thousands) | ||||||||||||||||||||
| Goodwill: |
||||||||||||||||||||
| Goodwill—KEBNY acquisition |
$ | 1,117 | $ | (242 | ) | $ | 1,117 | $ | (242 | ) | ||||||||||
| Goodwill—Asiana Bank acquisition |
1,284 | — | 1,284 | — | ||||||||||||||||
| Goodwill—Provident Bank acquisition |
350 | — | 350 | — | ||||||||||||||||
| Total |
$ | 2,751 | $ | (242 | ) | $ | 2,751 | $ | (242 | ) | ||||||||||
| Intangible assets: | Amortization period |
|||||||||||||||||||
| Core deposit—KEBNY acquisition |
10 years | $ | 881 | $ | (881 | ) | $ | 881 | $ | (881 | ) | |||||||||
| Core deposit—IBKNY acquisition |
10 years | 1,187 | (1,118 | ) | 1,187 | (1,004 | ) | |||||||||||||
| Core deposit—Asiana Bank acquistion |
10 years | 1,018 | (898 | ) | 1,018 | (799 | ) | |||||||||||||
| Core deposit—KEB, Broadway acquisition |
10 years | 2,726 | (2,382 | ) | 2,726 | (2,086 | ) | |||||||||||||
| Core deposit—Provident Bank acquisition |
1 year | 50 | (50 | ) | 50 | (50 | ) | |||||||||||||
| Total |
$ | 5,862 | $ | (5,329 | ) | $ | 5,862 | $ | (4,820 | ) | ||||||||||
6. DEPOSITS
Interest expense for time deposits for the years ended December 31 was as follows:
| 2010 | 2009 | 2008 | ||||||||||
| (In thousands) | ||||||||||||
| Time deposits of $100,000 or more |
$ | 7,361 | $ | 17,830 | $ | 27,033 | ||||||
| Other time deposits |
10,873 | 19,910 | 13,863 | |||||||||
| Total |
$ | 18,234 | $ | 37,740 | $ | 40,896 | ||||||
Included in time deposits of $100,000 or more were $200.0 million in California State Treasurer’s deposits at December 31, 2010 and 2009. The California State Treasurer’s deposits are subject to withdrawal based on the State’s periodic evaluations. The Company is required to pledge eligible collateral of at least 110% of outstanding deposits. At December 31, 2010 and 2009, securities with carrying values of approximately $268.3 million and $237.6 million, respectively, were pledged as collateral for the California State Treasurer’s deposits.
Brokered time deposits of $24.8 million and $243 thousand are included in other time deposits at December 31, 2010 and 2009, respectively.
F-32
Table of Contents
NARA BANCORP, INC. AND SUBSIDIARIES
NOTES TO CONSOLIDATED FINANCIAL STATEMENTS—(Continued)
At December 31, 2010, the scheduled maturities for time deposits were as follows:
| Year
Ended December 31 |
||||
| (In thousands) | ||||
| 2011 |
$ | 803,905 | ||
| 2012 |
156,078 | |||
| 2013 |
158 | |||
| 2014 |
— | |||
| 2015 |
12,394 | |||
| $ | 972,535 | |||
7. BORROWINGS
The Company maintains a secured credit facility with the Federal Home Loan Bank of San Francisco (“FHLB – SF”) against which the Company may take advances. The borrowing capacity is limited to the lower of 30% of the Bank’s total assets or the Bank’s collateral capacity, which was $543.9 million at December 31, 2010. The terms of this credit facility require the Company to pledge with the FHLB, eligible collateral equal to at least 100% of outstanding advances.
At December 31, 2010 and December 31, 2009, real estate secured loans with a carrying amount of approximately $1.1 billion were pledged as collateral for borrowings from the FHLB. At December 31, 2010 and December 31, 2009, other than FHLB stock, no securities were pledged as collateral for borrowings from the FHLB.
At December 31, 2010 and December 31, 2009, FHLB borrowings were $350 million, had a weighted average interest rate of 3.18% and 3.46%, respectively, and had various maturities through September 2016. At December 31, 2010, $150 million of the advances were putable advances with various putable dates and strike prices. During 2010, the Bank obtained $35 million of additional FHLB advances, and repaid $35 million during the same period. The new advances have a weighted average cost of 1.01% with average remaining maturities of 2.7 years. The cost of FHLB borrowings as of December 31, 2010 ranged between 0.68% and 4.57%. At December 31, 2010, the Company had a remaining borrowing capacity of $193.4 million.
At December 31, 2010, the contractual maturities for FHLB borrowings were as follows:
| Contractual Maturities |
Maturity/ Put Date |
|||||||
| (In thousand) | ||||||||
| Due within one year |
$ | 65,000 | $ | 215,000 | ||||
| Due after one year through five years |
280,000 | 130,000 | ||||||
| Due after five years through ten years |
5,000 | 5,000 | ||||||
| $ | 350,000 | $ | 350,000 | |||||
In addition, as a member of the Federal Reserve Bank (“FRB”) system, we may also borrow from the Federal Reserve Bank of San Francisco. The maximum amount that we may borrow from the Federal Reserve Bank’s discount window is 96% of the fair value of the securities that are pledged and 63% of the outstanding principal balance of the qualifying loans that are pledged. At December 31, 2010, the outstanding principal balance of the qualifying loans was $394.5 million. As of December 31, 2010 and 2009, there was no borrowing outstanding against the line.
F-33
Table of Contents
NARA BANCORP, INC. AND SUBSIDIARIES
NOTES TO CONSOLIDATED FINANCIAL STATEMENTS—(Continued)
Secured borrowings of $11.8 million at December 31, 2010 represents the sold portion of SBA loans sold with 90 days recourse clause. Recognition of these sales is required to be deferred until the end of the 90 day recourse period. Refer to Footnote 1, Loan Servicing Assets, for further information.
8. SUBORDINATED DEBENTURES
At December 31, 2010, five wholly-owned subsidiary grantor trusts established by Nara Bancorp had issued $38 million of pooled Trust Preferred Securities (“trust preferred securities”). Trust preferred securities accrue and pay distributions periodically at specified annual rates as provided in the indentures. The trusts used the net proceeds from the offering to purchase a like amount of subordinated debentures (the “Debentures”) of Nara Bancorp. The Debentures are the sole assets of the trusts. Nara Bancorp’s obligations under the subordinated debentures and related documents, taken together, constitute a full and unconditional guarantee by Nara Bancorp of the obligations of the trusts. The trust preferred securities are mandatorily redeemable upon the maturity of the Debentures, or upon earlier redemption as provided in the indentures. Nara Bancorp has the right to redeem the Debentures in whole (but not in part) on or after specific dates, at a redemption price specified in the indentures plus any accrued but unpaid interest to the redemption date. Nara Bancorp also has a right to defer consecutive payments of interest on the debentures for up to five years.
The following table is a summary of trust preferred securities and debentures at December 31, 2010:
| (Dollars in Thousands) | ||||||||||||||||||||||||||||
| Issuance Trust |
Issuance Date |
Trust Preferred Security Amount |
Subordinated Debentures Amount |
Rate Type |
Initial Rate |
Rate at 12/31/10 |
Maturity Date |
|||||||||||||||||||||
| Nara Bancorp Capital Trust I |
03/28/2001 | $ | 10,000 | $ | 10,400 | Fixed | 10.18 | % | 10.18 | % | 06/08/2031 | |||||||||||||||||
| Nara Capital Trust III |
06/05/2003 | 5,000 | 5,155 | Variable | 4.44 | % | 3.45 | % | 06/15/2033 | |||||||||||||||||||
| Nara Statutory Trust IV |
12/22/2003 | 5,000 | 5,155 | Variable | 4.02 | % | 3.14 | % | 01/07/2034 | |||||||||||||||||||
| Nara Statutory Trust V |
12/17/2003 | 10,000 | 10,310 | Variable | 4.12 | % | 3.25 | % | 12/17/2033 | |||||||||||||||||||
| Nara Statutory Trust VI |
03/22/2007 | 8,000 | 8,248 | Variable | 7.00 | % | 1.95 | % | 06/15/2037 | |||||||||||||||||||
| TOTAL ISSUANCE |
$ | 38,000 | $ | 39,268 | ||||||||||||||||||||||||
The Company’s investment in the common trust securities of the issuer trusts of $1.5 million at December 31, 2010 and December 31, 2009 is included in other assets. Although the securities issued by of the trusts are not included as a component of stockholders’ equity in the consolidated balance sheets, the securities are treated as capital for regulatory purposes. Specifically, under applicable regulatory guidelines, the $38 million of securities issued by the trusts qualify as Tier 1 capital, along with the $64.2 million of our outstanding Fixed Rate Cumulative Perpetual Preferred Stock, net of discount. The trust preferred security debt issuances are includable in Tier I capital up to a maximum of 25% of capital on an aggregate basis. Any amount that exceeds 25% qualifies as Tier 2 capital. At December 31, 2010, all of the $38 million of the trusts’ securities qualified as Tier 1 capital along with the $64.2 million of preferred stock. In July 2010 Dodd-Frank Wall Street Reform and Consumer Protection Act (the “Dodd-Frank Act”) was signed into law which, among other things, limits to bank holding companies having total assets of more than $15 billion the ability to treat trust preferred security debt issuances as Tier 1 capital. Since the Company had less than $15 billion in assets at December 31, 2010, under the Dodd-Frank Act, it will be able to continue to include its existing trust preferred securities in Tier 1 capital.
The Board of Governors of the Federal Reserve System, which is Nara Bancorp’s federal banking regulator, has promulgated a modification of the capital regulations affecting trust preferred securities. Under this modification, beginning March 31, 2011, the Company is required to use a more restrictive formula to determine
F-34
Table of Contents
NARA BANCORP, INC. AND SUBSIDIARIES
NOTES TO CONSOLIDATED FINANCIAL STATEMENTS—(Continued)
the amount of trust preferred securities that can be included in regulatory Tier I capital. The Company will be allowed to include in Tier I capital an amount of trust preferred securities equal to no more than 25% of the sum of all core capital elements, which is generally defined as stockholders’ equity less certain intangibles, including core deposit intangibles, net of any related deferred income tax liability. The existing regulations in effect limit the amount of trust preferred securities that can be included in Tier I capital to 25% of the sum of core capital elements without a deduction for permitted intangibles. The adoption of this modification is not expected to have a material impact on the inclusion of our trust preferred securities for purposes of Tier 1 capital.
9. INCOME TAXES
A summary of income tax provision (benefit) follows for the years ended December 31:
| Current | Deferred | Total | ||||||||||
| (In thousands) | ||||||||||||
| 2010 |
||||||||||||
| Federal |
$ | (463 | ) | $ | (4,906 | ) | $ | (5,369 | ) | |||
| State |
473 | (3,004 | ) | (2,531 | ) | |||||||
| $ | 10 | $ | (7,910 | ) | $ | (7,900 | ) | |||||
| 2009 |
||||||||||||
| Federal |
$ | 469 | $ | (4,497 | ) | $ | (4,028 | ) | ||||
| State |
(296 | ) | (1,875 | ) | (2,171 | ) | ||||||
| $ | 173 | $ | (6,372 | ) | $ | (6,199 | ) | |||||
| 2008 |
||||||||||||
| Federal |
$ | 8,656 | $ | (6,932 | ) | $ | 1,724 | |||||
| State |
2,854 | (2,953 | ) | (99 | ) | |||||||
| $ | 11,510 | $ | (9,885 | ) | $ | 1,625 | ||||||
A reconciliation of the difference between the federal statutory income tax rate and the effective tax rate is shown in the following table for the years ended December 31:
| 2010 | 2009 | 2008 | ||||||||||
| Statutory tax rate (benefit) |
(35 | )% | (35 | )% | 35 | % | ||||||
| State taxes (benefit)-net of federal tax effect |
(11 | ) | (12 | ) | (1 | ) | ||||||
| CRA investment tax credit |
(4 | ) | (4 | ) | (9 | ) | ||||||
| Valuation allowance |
— | — | 14 | |||||||||
| Other |
(2 | ) | (1 | ) | (2 | ) | ||||||
| (52 | )% | (52 | )% | 37 | % | |||||||
F-35
Table of Contents
NARA BANCORP, INC. AND SUBSIDIARIES
NOTES TO CONSOLIDATED FINANCIAL STATEMENTS—(Continued)
Deferred tax assets and liabilities at December 31, 2010 and 2009 are comprised of the following:
| 2010 | 2009 | |||||||
| (In thousands) | ||||||||
| Deferred tax assets: |
||||||||
| Statutory bad debt deduction less than financial statement provision |
$ | 29,160 | $ | 27,081 | ||||
| Net operating loss carryforward |
6,600 | 2,490 | ||||||
| Capital loss carryforward |
— | 612 | ||||||
| Investment security provision |
802 | 802 | ||||||
| Lease expense |
1,510 | 1,510 | ||||||
| State tax deductions |
1 | — | ||||||
| Accrued compensation |
469 | 333 | ||||||
| Deferred compensation |
452 | 606 | ||||||
| Mark to market on loans held for sale |
801 | 33 | ||||||
| Depreciation |
540 | 937 | ||||||
| Nonaccrual loan interest |
645 | 595 | ||||||
| Other real estate owned |
205 | 226 | ||||||
| Tax credits |
1,191 | — | ||||||
| Other |
733 | 238 | ||||||
| Non-qualified stock option and restricted unit expense |
1,549 | 1,551 | ||||||
| Amortization of intangibles |
324 | 276 | ||||||
| 44,982 | 37,290 | |||||||
| Deferred tax liabilities: |
||||||||
| FHLB stock dividends |
(490 | ) | (569 | ) | ||||
| Deferred loan costs |
(1,018 | ) | (1,722 | ) | ||||
| State taxes deferred and other |
(3,692 | ) | (2,677 | ) | ||||
| Prepaid expenses |
(1,013 | ) | (828 | ) | ||||
| State tax credit |
— | (23 | ) | |||||
| Unrealized gain on securities available for sale |
(1,628 | ) | (1,900 | ) | ||||
| Unrealized gain on interest rate swaps |
(35 | ) | (53 | ) | ||||
| Unrealized gain on interest only strips |
(34 | ) | (31 | ) | ||||
| (7,910 | ) | (7,803 | ) | |||||
| Valuation allowance on capital loss carryforward |
— | (612 | ) | |||||
| Net deferred tax assets: |
$ | 37,072 | $ | 28,875 | ||||
At December 31, 2010, the Company had capital loss carryforwards of approximately $1.3 million expired. The Company previously recorded a valuation allowance against the entire capital loss carryforward. Income tax expense is the total of the current year income tax due or refundable and the change in deferred tax assets and liabilities. Deferred tax assets and liabilities are recognized for the future tax consequences attributable to differences between the financial statement carrying amounts of existing assets and liabilities and their respective tax bases and operating loss and tax credit carry forwards. Deferred tax assets and liabilities are measured using enacted tax rates expected to apply to taxable income in the years in which those temporary differences are expected to be recovered or settled. The effect on deferred tax assets and liabilities of a change in tax rates is recognized in income in the period that includes the enactment date.
Deferred tax assets are reduced by a valuation allowance when, in the opinion of management, it is more likely than not that some portion, or all, of the deferred tax asset will not be realized. In assessing the realization
F-36
Table of Contents
NARA BANCORP, INC. AND SUBSIDIARIES
NOTES TO CONSOLIDATED FINANCIAL STATEMENTS—(Continued)
of deferred tax assets, management evaluates both positive and negative evidence, including the existence of any cumulative losses in the current year and the prior two years, the amount of taxes paid in available carry-back years, the forecasts of future income, applicable tax planning strategies, and assessments of current and future economic and business conditions. This analysis is updated quarterly and adjusted as necessary. Based on the analysis, the Company has determined that a valuation allowance for deferred tax assets was not required as of December 31, 2010.
A summary of the Company’s net operating loss carry-forwards is as follows:
| FEDERAL | STATE | |||||||||||||||||||||||
| Remaining Amount |
Expires | Annual Limitation |
Remaining Amount |
Expires | Annual Limitation |
|||||||||||||||||||
| (In thousands) | ||||||||||||||||||||||||
| 2010 |
||||||||||||||||||||||||
| Nara Ownership Change |
$ | — | N/A | $ | — | $ | 124 | 2014 | $ | 83 | ||||||||||||||
| Korea First Bank of New York |
4,967 | 2019 | 497 | — | N/A | — | ||||||||||||||||||
| Asiana |
1,841 | 2015 | 348 | 723 | 2012 | 348 | ||||||||||||||||||
| Nara Bank Net Operating Loss |
8,323 | 2025 | N/A | 11,735 | 2030 | N/A | ||||||||||||||||||
| Total |
$ | 15,131 | $ | 845 | $ | 12,582 | $ | 431 | ||||||||||||||||
| 2009 |
||||||||||||||||||||||||
| Nara Ownership Change |
$ | — | N/A | $ | — | $ | 124 | 2014 | $ | 83 | ||||||||||||||
| Korea First Bank of New York |
4,967 | 2019 | 497 | — | N/A | — | ||||||||||||||||||
| Asiana |
1,841 | 2015 | 348 | 723 | 2012 | 348 | ||||||||||||||||||
| Total |
$ | 6,808 | $ | 845 | $ | 847 | $ | 431 | ||||||||||||||||
For the 2009 and 2010 tax years, the state of California suspended the utilization of Net Operating Losses (“NOLs”). Suspended NOLs for 2009 and 2010 will be allowed additional carryover periods of two years and one year, respectively. The Federal net operating loss created in 2010 of $8.3 million can be carried back two years and carried forward 15 years.
The Company has Low Income Housing tax credits of $848 thousand, which will begin to expire in 2024. The Company also has California Enterprise Zone hiring credits of $343 thousand, which do not expire.
The Company and our subsidiaries are subject to U.S. federal income tax as well as income tax of the state of California and various other state income taxes. The statute of limitations related to the consolidated Federal income tax return is closed for all tax years up to and including 2006. The expiration of the statute of limitations related to the various state income tax returns that the Company and subsidiaries file, varies by state. The Company is currently under examination by the California Franchise Tax Board for the 2007 and 2008 tax years. While the outcome of the examination is unknown, the Company expects no material adjustments.
F-37
Table of Contents
NARA BANCORP, INC. AND SUBSIDIARIES
NOTES TO CONSOLIDATED FINANCIAL STATEMENTS—(Continued)
A reconciliation of the beginning and ending amount of unrecognized tax benefits for the years ended December 31 is as follows:
| 2010 | 2009 | |||||||
| (In thousands) | ||||||||
| Balance at January 1, |
$ | 151 | $ | 352 | ||||
| Additions based on tax positions related to the current year |
33 | 47 | ||||||
| Additions based on tax positions related to the prior year |
18 | 83 | ||||||
| Settlements |
— | (277 | ) | |||||
| Reductions due to the expiration of the statute of limitations |
— | (54 | ) | |||||
| Balance at December 31, |
$ | 202 | $ | 151 | ||||
The total amount of unrecognized tax benefits was $151 thousand at January 1, 2010 and $202 thousand at December 31, 2010 and is primarily for uncertainties related to California enterprise zone loan interest deductions taken in prior years. The total amount of tax benefits that, if recognized, would favorably impact the effective tax rate was $151 thousand and $202 thousand at December 31, 2009 and December 31, 2010, respectively. The amount of unrecognized tax benefits increased due to the current year accrual of $33 thousand and additional interest accrual of $18 thousand for prior years. We do not expect the total amount of unrecognized tax benefits to significantly change in the next twelve months.
We recognize interest and penalties related to income tax matters in income tax expense. We had approximately $23 thousand and $11 thousand for interest and penalties accrued at December 31, 2010 and 2009, respectively.
10. STOCK BASED INCENTIVE PLANS
The Company has a stock based incentive plan, the 2007 Nara Bancorp, Inc. Equity Incentive Plan (“2007 Plan”). The 2007 Plan, which was approved by our stockholders on May 31, 2007, provides for grants of stock options, stock appreciation rights (“SARs”), restricted stock, performance shares and performance units (sometimes referred to individually or collectively as “awards”) to non-employee directors, officers, employees and consultants of the Company. Stock options may be either “incentive stock options” (“ISOs”), as defined in Section 422 of the Internal Revenue Code of 1986, as amended (the “Code”), or nonqualified stock options (“NQSOs”).
The 2007 Plan gives the Company flexibility to (i) attract and retain qualified non-employee directors, executives and other key employees and consultants with appropriate equity-based awards, (ii) motivate high levels of performance, (iii) recognize employee contributions to the Company’s success, and (iv) align the interests of Plan participants with those of the Company’s stockholders. The exercise price for shares under an ISO may not be less than 100% of fair market value (“FMV”) on the date the award is granted under Code Section 422. Similarly, under the terms of the 2007 Plan the exercise price for SARs and NQSOs may not be less than 100% of FMV on the date of grant. Performance units are awarded to a participant at the market price of the Company’s common stock on the date of award (after the lapse of the restriction period and the attainment of the performance criteria). No minimum exercise price is prescribed for performance shares and restricted stock awarded under the 2007 Plan.
ISOs, SARs and NQSOs have vesting periods of three to five years and have 10-year contractual terms. Restricted stock, performance shares, and performance units will be granted with a restriction period of not less than one year from the grant date for performance-based awards and not less than three years from the grant date for time-based vesting of grants. Compensation expense for awards is recorded over the vesting period.
F-38
Table of Contents
NARA BANCORP, INC. AND SUBSIDIARIES
NOTES TO CONSOLIDATED FINANCIAL STATEMENTS—(Continued)
The 2007 Plan reserves 1,300,000 shares for issuance. 1,196,000 shares were available for future grants as of December 31, 2010.
The total shares reserved for issuance will serve as the underlying value for all equity awards under the 2007 Plan. With the exception of the shares underlying stock options and restricted stock awards, the board of directors may choose to settle the awards by paying the equivalent cash value or by delivering the appropriate number of shares.
The stock plan adopted in 2000, under which options and restricted units were previously granted to employees, officers, and directors of the Company, is no longer active and no additional equity awards may be granted under the plan. Options were granted under the 2000 Plan with an exercise price equal to the fair market value on the date of grant with vesting periods from three to five years and have 10-year contractual terms. Some restricted units were awarded under the 2000 plan to participants at the fair market value of the Company’s common stock on the date of award and all units granted under this plan were fully vested on the third anniversary of the grant. Compensation expense for the awards was recorded over the vesting period.
For the year ended December 31, 2010, 20,000 shares of restricted stock awards were granted under the 2007 Plan. The fair value of restricted stock awards granted is the fair market value of the Company’s common stock on the date of grant. In 2010 and 2008 no stock options were granted, but in 2009 40,000 options were granted. The fair value of each option granted for the year ended December 31, 2009 was estimated on the date of grant using a Black-Scholes valuation model that uses the assumptions noted in the following table. Expected stock price volatility was based on the historical volatility of our stock. We use historical data to estimate the option exercise and employee terminations within the valuation model. The expected term of options granted is derived from the output of the option valuation model and represents the period of time that options granted are expected to be outstanding. The risk-free interest rate for periods within the contractual life of the option is based on the U.S. Treasury yield curve in effect at the time of grant.
| 2009 | ||||
| Risk-free interest rate |
2.3 | % | ||
| Expected option life (years) |
6.2 | |||
| Expected stock price volatility |
51.2 | % | ||
| Dividend yield |
3.4 | % | ||
| Weighted average fair value of options granted during the period |
$ | 0.44 | ||
A summary of stock option activity under the Plan for the year ended December 31, 2010 is as follows:
| Number of Shares |
Weighted- Average Exercise Price Per Share |
Weighted- Average Remaining Contractual Life (Years) |
Aggregate Intrinsic Value |
|||||||||||||
| Outstanding—January 1, 2010 |
1,033,250 | $ | 11.80 | |||||||||||||
| Granted |
— | — | ||||||||||||||
| Exercised |
(140,000 | ) | 8.08 | |||||||||||||
| Forfeited/canceled |
(360,000 | ) | 16.33 | |||||||||||||
| Outstanding—December 31, 2010 |
533,250 | $ | 9.73 | 3.12 | $ | 887,000 | ||||||||||
| Options exercisable—December 31, 2010 |
501,250 | $ | 9.80 | 2.80 | $ | 848,000 | ||||||||||
| Unvested options expected to vest after December 31, 2010 |
23,539 | $ | 8.64 | 8.21 | $ | 29,000 | ||||||||||
F-39
Table of Contents
NARA BANCORP, INC. AND SUBSIDIARIES
NOTES TO CONSOLIDATED FINANCIAL STATEMENTS—(Continued)
The aggregate intrinsic value of options exercised for the years ended December 31, 2010, 2009 and 2008 was $113 thousand, $0 and $71 thousand, respectively. The tax benefit realized for options exercised for the years ending December 31, 2010, 2009 and 2008 was $44 thousand, $0 and $0, respectively.
A summary of restricted unit activity under the Plan for the year ended December 31, 2010 was as follows:
| Number of Shares |
Weighted- Average Grant Date Fair Value |
Weighted- Average Remaining Contractual Life (Years) |
||||||||||
| Outstanding—January 1, 2010 |
128,120 | $ | 16.34 | |||||||||
| Granted |
28,500 | 7.78 | ||||||||||
| Vested |
(87,640 | ) | 17.60 | |||||||||
| Forfeited/canceled |
(10,680 | ) | 16.49 | |||||||||
| Outstanding—December 31, 2010 |
58,300 | $ | 10.23 | 8.86 | ||||||||
The total fair value of performance units vested for the years ended December 31, 2010, 2009 and 2008 was $100 thousand, $586 thousand and $0, respectively.
The amount charged against income, before income tax benefit of $124 thousand, $562 thousand and $552 thousand, in relation to the stock-based payment arrangements was $376 thousand, $1.5 million and $1.7 million for 2010, 2009 and 2008, respectively. At December 31, 2010, unrecognized compensation expense related to non-vested stock option grants and restricted units aggregated $199 thousand, and is expected to be recognized over a weighted average period of 2.44 years.
The estimated annual stock-based compensation as of December 31, 2010 for each of the succeeding years is indicated in the table below:
| Stock Based Compensation Expense |
||||
| (in thousands) | ||||
| For the year ended December 31: |
||||
| 2011 | $ | 60 | ||
| 2012 | 44 | |||
| 2013 | 43 | |||
| 2014 | 37 | |||
| 2015 | 15 | |||
| Total |
$ | 199 | ||
11. EMPLOYEE BENEFIT PLANS
Deferred Compensation Plan— In 1996, the Company established a deferred compensation plan that permits eligible officers and directors to defer a portion of their compensation. In 2001, the Board of Directors approved and the Company established a deferred compensation plan that allows key executives of the Company additional deferment of their compensation. The deferred compensation plan is still in effect and was amended in 2007 to be in compliance with the new IRC §409 (A) regulations. The deferred compensation, together with accrued accumulated interest, is distributable in cash after retirement or termination of service. The deferred compensation liabilities at December 31, 2010 and 2009 amounted to $1.1 million and $1.4 million, respectively, which are included in other liabilities in the accompanying consolidated statement of financial condition. Interest expense recognized under the deferred compensation plan totaled $42 thousand, $58 thousand and $121 thousand for 2010, 2009 and 2008, respectively.
F-40
Table of Contents
NARA BANCORP, INC. AND SUBSIDIARIES
NOTES TO CONSOLIDATED FINANCIAL STATEMENTS—(Continued)
In 2008, the Company established and the Board approved a Long Term Incentive Plan (“LTIP”) that rewards the named executive officers (“NEO”) with deferred compensation if the Company meets certain performance goals, the NEOs meet individual performance goals, and the NEOs remain employed for a pre-determined period (between five and ten years, depending on the officer). The Company did not meet the required performance goals, and thus the Company did not incur any liabilities or expense under the LTIP for 2010 and 2009.
The Company has insured the lives of certain officers and directors who participate in the deferred compensation plan. The Company has also purchased life insurance policies and entered into split dollar life insurance agreements with certain directors and officers. Under the terms of the split dollar life insurance agreements, a portion of the death benefits received by the Bank will be paid to beneficiaries named by the directors and officers. However, upon separation of service, all death benefits accrue to the Company.
401(k) Savings Plan—In 1996, the Company established a 401(k) savings plan, which is open to all eligible employees who are 21 years old or over and have completed three months of service. The plan requires the Bank to match 100% up to 3% of employee deferrals and 50% of the next 2% of employee deferrals for an additional contribution of up to 1% during the plan year. Employer matching is immediately vested in full regardless of the service term. Total employer contributions to the plan and expense amounted to approximately $0, $360 thousand and $623 thousand for 2010, 2009 and 2008, respectively. Effective September 7, 2009, the Company has amended the Plan to discontinue with the safe harbor employer matching contributions.
Employees Stock Ownership Plan (“ESOP”)—In 1996, the Company established an ESOP, which is open to all eligible employees who have completed one year of service working at least 1,000 hours. The Company’s contributions to the ESOP represent an annual profit-sharing bonus paid to employees. Such contributions and available forfeitures are allocated to active employees based on the percentage that their compensation represents of the total compensation of eligible employees. The Company purchased 10,259, 0 and 0 shares of its common stock for the ESOP in 2010, 2009 and 2008, respectively. The Company’s contribution and expense to the ESOP was approximately $100 thousand, $0 and $0 for 2010, 2009 and 2008, respectively. As of December 31, 2010 and 2009, the ESOP held 162,773 and 158,357 shares, and there were no unallocated shares. On an annual basis, the Board determines the amount to contribute to the ESOP as a profit sharing bonus.
Upon termination, plan participants are paid in cash or retain their vested balance in the ESOP. During 2010, 2009 and 2008, shares withdrawn from the ESOP by participants who terminated their employment with the Company amounted to 5,843, 18,289 and 15,966 shares, respectively. During 2010, 2009 and 2008, no shares were added to the ESOP plan from dividend reinvestments.
12. COMMITMENTS AND CONTINGENCIES
The Company leases its premises under non-cancelable operating leases, and at December 31, 2010, the future minimum rental commitments under these leases are as follows:
| (In thousands) | ||||
| 2011 |
$ | 7,003 | ||
| 2012 |
6,572 | |||
| 2013 |
6,290 | |||
| 2014 |
5,975 | |||
| 2015 |
5,607 | |||
| Thereafter |
8,175 | |||
| $ | 39,622 | |||
F-41
Table of Contents
NARA BANCORP, INC. AND SUBSIDIARIES
NOTES TO CONSOLIDATED FINANCIAL STATEMENTS—(Continued)
Operating lease expense recorded under such leases in 2010, 2009 and 2008 amounted to approximately $6.6 million, $6.3 million and $ 5.8 million, respectively.
In the normal course of business, the Company is involved in various legal claims. Management has reviewed all legal claims against the Company with counsel for the fiscal year ended December 31, 2010, and has taken into consideration the views of such counsel as to the outcome of the claims. In management’s opinion, the final disposition of all such claims will not have a material adverse effect on the consolidated financial condition, results of operations or cash flows of the Company. As of December 31, 2010 and 2009, the Company recorded an accrued liability of $0 and $105 thousand, respectively, for litigation settlements.
The Company is a party to financial instruments with off-balance-sheet risk in the normal course of business to meet the financing needs of its customers. These financial instruments include commitments to extend credit, standby letters of credit and other commercial letters of credit. These instruments involve, to varying degrees, elements of credit and interest rate risk in excess of the amount recognized in the consolidated statements of financial condition. The Company’s exposure to credit loss in the event of nonperformance by the other party to commitments to extend credit and standby letters of credit and other commercial letters of credit is represented by the contractual notional amount of those instruments. The Company uses the same credit policies in making commitments and conditional obligations as it does for extending loan facilities to customers. The Company evaluates each customer’s creditworthiness on a case-by-case basis. The amount of collateral obtained, if deemed necessary by the Company upon extension of credit, is based on management’s credit evaluation of the counterparty. Collateral held varies but may include accounts receivable; inventory; property, plant and equipment; and income-producing properties.
Commitments at December 31, 2010 and 2009 are summarized as follows:
| 2010 | 2009 | |||||||
| (In thousands) | ||||||||
| Commitments to extend credit |
$ | 205,752 | $ | 198,807 | ||||
| Standby letters of credit |
9,777 | 9,907 | ||||||
| Other commercial letters of credit |
30,180 | 23,575 | ||||||
| $ | 245,709 | $ | 232,289 | |||||
Commitments and letters of credit generally have variable rates that are tied to the prime rate. The amount of fixed rate commitments is not considered material to this presentation. From time to time, the Company enters into certain types of contracts that contingently require the Company to indemnify parties against third party claims and other obligations customarily indemnified in the ordinary course of the Company’s business. The terms of such obligations vary, and, generally, a maximum obligation is not explicitly stated. Therefore, the overall maximum amount of the obligations cannot be reasonably estimated. The most significant of these contracts relate to certain agreements with the Company’s officers and directors under which the Company may be required to indemnify such persons for liabilities arising out of their employment relationship. Historically, the Company has not been obligated to make significant payments for these obligations, and no liabilities have been recorded for these obligations on its consolidated statements of financial condition as of December 31, 2010 and 2009.
F-42
Table of Contents
NARA BANCORP, INC. AND SUBSIDIARIES
NOTES TO CONSOLIDATED FINANCIAL STATEMENTS—(Continued)
13. FAIR VALUE
FASB ASC 820, Fair Value Measurements and Disclosures, establishes a fair value hierarchy which requires an entity to maximize the use of observable inputs and minimize the use of unobservable inputs when measuring fair value. The standard describes three levels of inputs that may be used to measure fair value:
Level 1: Quoted prices (unadjusted) for identical assets or liabilities in active markets that the entity has the ability to access as of the measurement date.
Level 2: Significant other observable inputs other than Level 1 prices such as quoted prices for similar assets or liabilities; quoted prices in markets that are not active; or other inputs that are observable or can be corroborated by observable market data.
Level 3: Significant unobservable inputs that reflect a reporting entity’s own assumptions about the assumptions that market participants would use in pricing an asset or liability.
Securities Available for Sale
The fair values of securities available for sale are determined by obtaining quoted prices on nationally recognized securities exchanges (Level 1 inputs) or matrix pricing, which is a mathematical technique widely used in the industry to value debt securities without relying exclusively on quoted prices for the specific securities but rather by relying on the securities relationship to other benchmark quoted securities (Level 2 inputs).
Impaired Loans
The fair values of impaired loans are generally measured for impairment using the practical expedients permitted by FASB ASC 310-10-35 including impaired loans measured at an observable market price (if available), or at the fair value of the loan’s collateral (if the loan is collateral dependent). Fair value of the loan’s collateral, when the loan is dependent on collateral, is determined by appraisals or independent valuation, which is then adjusted for the cost related to liquidation of the collateral. These are considered Level 3 inputs.
Derivatives
The fair value of our derivative financial instruments, including interest rate swaps and caps, is based on derivative valuation models using market data inputs as of the valuation date that can generally be verified and do not typically involve significant management judgments. (Level 2 inputs).
Other Real Estate Owned
Other real estate owned is valued at the time the loan is foreclosed upon and the asset is transferred to other real estate owned. The value is based primarily on third party appraisals, less costs to sell and result in a Level 3 classification of the inputs for determining fair value. Other real estate owned is reviewed and evaluated on at least an annual basis for additional impairment and adjusted accordingly, based on the same factors identified above.
Loans held for sale
Loans held for sale are carried at the lower of cost or fair value, as determined by outstanding commitments from investors, or based on recent comparable sales, if available, and if not available, are based on discounted cash flows using current market rates applied to the estimated life and credit risk (Level 2 inputs) or may be assessed based upon the fair value of the collateral which is obtained from recent real estate appraisals. These
F-43
Table of Contents
NARA BANCORP, INC. AND SUBSIDIARIES
NOTES TO CONSOLIDATED FINANCIAL STATEMENTS—(Continued)
appraisals may utilize a single valuation approach or a combination of approaches including comparable sales and the income approach. Adjustments are routinely made in the appraisal process by the appraisers to adjust for differences between the comparable sales and income data available. Such adjustments are typically significant and result in Level 3 classification of the inputs for determining fair value.
Assets and liabilities measured at fair value on a recurring basis are summarized below:
| Fair Value Measurements Using | ||||||||||||||||
| At December 31, 2010 | Quoted Prices in Active Markets for Identical Assets (Level 1) |
Significant Other Observable Inputs (Level 2) |
Significant Unobservable Inputs (Level 3) |
|||||||||||||
| (In thousands) | ||||||||||||||||
| Assets: |
||||||||||||||||
| Securities available for sale: |
||||||||||||||||
| GSE bonds |
$ | 125,718 | $ | — | $ | 125,718 | $ | — | ||||||||
| GSE collateralized mortgage obligations |
103,201 | — | 103,201 | — | ||||||||||||
| GSE mortgage-backed securities |
284,834 | — | 284,834 | — | ||||||||||||
| Corporate note |
3,708 | — | 3,708 | — | ||||||||||||
| Municipal bonds |
5,258 | — | 5,258 | — | ||||||||||||
| Mutual funds |
5,519 | 5,519 | — | — | ||||||||||||
| Derivatives—Interest rate caps |
167 | — | 167 | — | ||||||||||||
There were no significant transfers between Level 1 and 2 during 2010.
| Fair Value Measurements Using | ||||||||||||||||
| At December 31, 2009 | Quoted Prices in Active Markets for Identical Assets (Level 1) |
Significant Other Observable Inputs (Level 2) |
Significant Unobservable Inputs (Level 3) |
|||||||||||||
| (In thousands) | ||||||||||||||||
| Assets: |
||||||||||||||||
| Securities available for sale: |
||||||||||||||||
| GSE bonds |
$ | 85,229 | $ | — | $ | 85,229 | $ | — | ||||||||
| GSE collateralized mortgage obligations |
191,035 | — | 191,035 | — | ||||||||||||
| GSE mortgage-backed securities |
492,214 | — | 492,214 | — | ||||||||||||
| Corporate note |
3,424 | — | 3,424 | — | ||||||||||||
| Municipal bonds |
5,325 | — | 5,325 | — | ||||||||||||
| Mutual funds |
5,463 | 5,463 | — | — | ||||||||||||
| Derivatives—Interest rate caps |
177 | — | 177 | — | ||||||||||||
| Liabilities: |
||||||||||||||||
| Derivatives—Interest rate swaps |
(645 | ) | — | (645 | ) | — | ||||||||||
Fair value adjustments for interest rate caps resulted in a net expense of $901 and $181 thousand for 2010 and 2009, respectively. Fair value adjustments for interest rate swaps resulted in a net expense of $0 and $405 thousand for 2010 and 2009, respectively.
F-44
Table of Contents
NARA BANCORP, INC. AND SUBSIDIARIES
NOTES TO CONSOLIDATED FINANCIAL STATEMENTS—(Continued)
Assets measured at fair value on a non-recurring basis are summarized below:
| Fair Value Measurements at Using | ||||||||||||||||
| At December 31, 2010 | Quoted Prices in Active Markets for Identical Assets (Level 1) |
Significant Other Observable Inputs (Level 2) |
Significant Unobservable Inputs (Level 3) |
|||||||||||||
| (In thousands) | ||||||||||||||||
| Assets: |
||||||||||||||||
| Impaired loans at fair value: |
||||||||||||||||
| Real estate loans |
$ | 35,009 | $ | 35,009 | ||||||||||||
| Commercial business |
6,611 | 6,611 | ||||||||||||||
| Loans held for sale, net |
3,225 | — | 3,225 | — | ||||||||||||
| Other real estate owned |
675 | — | — | 675 | ||||||||||||
| Fair Value Measurements at Using | ||||||||||||||||
| At December 31, 2009 | Quoted Prices in Active Markets for Identical Assets (Level 1) |
Significant Other Observable Inputs (Level 2) |
Significant Unobservable Inputs (Level 3) |
|||||||||||||
| (In thousands) | ||||||||||||||||
| Assets: |
||||||||||||||||
| Impaired loans at fair value |
$ | 81,309 | $ | — | $ | 67,541 | $ | 13,768 | ||||||||
| Other real estate owned |
1,981 | — | 1,981 | — | ||||||||||||
Impaired loans, which are measured for impairment using the fair value of the loan collateral, had a loan principal balance $94.6 million at December 31, 2010, after partial charge-offs of $20.0 million. In addition, these loans had a specific valuation allowance of $11.2 million at December 31, 2010. Of this $94.6 million, $52.8 million were carried at their fair value of $41.6 million as a result of the aforementioned charge-offs and specific valuation allowances. The remaining $41.8 million were carried at cost at December 31, 2010, as the fair value of the collateral on these loans exceeded the book value for each individual credit. The Company also has impaired loans totaling $28.1 million at December 31, 2010 which are measured based on the present value of expected cash flows and are not included in the above table as this is not a measurement of fair value. Of these, $27.8 million were carried below cost as a result of charge-offs of $4.1 million or assigned specific reserves of $9.9 million at December 31, 2010. The remaining $231 thousand of impaired loans measured based on the present value of expected cash flows are carried at cost. Charge-offs and changes in specific valuation allowances during 2010 on impaired loans carried at the fair value of loan collateral at December 31, 2010 resulted in additional provision for loan losses of $ 43.2 million.
Impaired loans, which are measured for impairment using the fair value of collateral, had a carrying amount of $120.5 million at December 31, 2009, after partial charge-offs of $17.0 million. In addition, these loans had a specific valuation allowance of $19.8 million at December 31, 2009. Of the $120.5 million impaired loan portfolio at December 31, 2009, $101.1 million were carried at their fair value of $81.3 million as a result of the aforementioned charge-offs and specific valuation allowances. The remaining $19.4 million were carried at cost at December 31, 2009, as the fair value of the collateral on these loans exceeded the book value for each
F-45
Table of Contents
NARA BANCORP, INC. AND SUBSIDIARIES
NOTES TO CONSOLIDATED FINANCIAL STATEMENTS—(Continued)
individual credit. Charge-offs and changes in specific valuation allowances during 2009 on impaired loans carried at fair value at December 31, 2009 resulted in additional provision for loan losses of $51.2 million.
Other real estate owned carried at its fair value had a carrying amount of $675 thousand at December 31, 2010, which is made up of an outstanding balance of $1.1 million, with a valuation allowance of $439 thousand. Changes in the valuation allowance on other real estate owned outstanding at December 31, 2010 resulted in a write-down of $2.2 million during 2010.
Other real estate owned carried at its fair value had a carrying amount of $2.0 million at December 31, 2009, which is made up of an outstanding balance of $2.5 million, with a valuation allowance of $484 thousand. Changes in the valuation allowance on other real estate owned outstanding at December 31, 2009 resulted in a write-down of $1.7 million during 2009.
Loans held for sale, which were carried at their fair value, approximated $3.2 million, after partial charge-offs of $1.3 million and a valuation allowance of $100 thousand. Total charge-offs on loans held for sale were $33.8 million during 2010.
There were no non-accrual loans held for sale at December 31, 2009. The balance of $4.8 million in loans held for sale were carried at cost at December 31, 2009, as fair value of these loans exceeded the book value for each individual credit. The charge-offs on loans held for sale were $1.2 million during 2009.
Fair Value of Financial Instruments
Carrying amounts and estimated fair values of financial instruments, not previously presented, at years ended December 31 were as follows:,
| December 31, 2010 | ||||||||
| Carrying Amount |
Estimated Fair Value |
|||||||
| (In thousands) | ||||||||
| Financial Assets: |
||||||||
| Cash and cash equivalents |
$ | 172,331 | $ | 172,331 | ||||
| Loans held for sale |
23,702 | 25,364 | ||||||
| Loans receivable—net |
2,043,806 | 2,076,384 | ||||||
| Federal Reserve Bank stock |
6,367 | N/A | ||||||
| Federal Home Loan Bank stock |
17,717 | N/A | ||||||
| Accrued interest receivable |
8,648 | 8,648 | ||||||
| Customers’ liabilities on acceptances |
11,528 | 11,528 | ||||||
| Financial Liabilities: |
||||||||
| Noninterest-bearing deposits |
$ | (388,731 | ) | $ | (388,731 | ) | ||
| Saving and other interest bearing demand deposits |
(814,848 | ) | (814,848 | ) | ||||
| Time deposits |
(972,535 | ) | (977,762 | ) | ||||
| Borrowings from Federal Home Loan Bank |
(350,000 | ) | (365,167 | ) | ||||
| Subordinated debentures |
(39,268 | ) | (39,649 | ) | ||||
| Secured borrowing |
(11,758 | ) | (11,758 | ) | ||||
| Accrued interest payable |
(4,830 | ) | (4,830 | ) | ||||
| Bank’s liabilities on acceptances outstanding |
(11,528 | ) | (11,528 | ) | ||||
F-46
Table of Contents
NARA BANCORP, INC. AND SUBSIDIARIES
NOTES TO CONSOLIDATED FINANCIAL STATEMENTS—(Continued)
| December 31, 2009 | ||||||||
| Carrying Amount |
Estimated Fair Value |
|||||||
| (In thousands ) | ||||||||
| Financial Assets: |
||||||||
| Cash and cash equivalents |
$ | 125,592 | $ | 125,592 | ||||
| Loans held for sale |
4,756 | 4,828 | ||||||
| Loans receivable—net |
2,080,700 | 2,106,065 | ||||||
| Federal Reserve Bank stock |
4,399 | N/A | ||||||
| Federal Home Loan Bank stock |
19,935 | N/A | ||||||
| Accrued interest receivable |
11,261 | 11,261 | ||||||
| Customers’ liabilities on acceptances |
10,488 | 10,488 | ||||||
| Financial Liabilities: |
||||||||
| Noninterest-bearing deposits |
$ | (330,489 | ) | $ | (330,489 | ) | ||
| Saving and other interest bearing demand deposits |
(660,992 | ) | (660,992 | ) | ||||
| Time deposits |
(1,442,709 | ) | (1,450,103 | ) | ||||
| Borrowings from Federal Home Loan Bank |
(350,000 | ) | (363,563 | ) | ||||
| Subordinated debentures |
(39,268 | ) | (40,657 | ) | ||||
| Accrued interest payable |
(12,674 | ) | (12,674 | ) | ||||
| Bank’s liabilities on acceptances outstanding |
(10,488 | ) | (10,488 | ) | ||||
The methods and assumptions used to estimate fair value are described as follows.
The carrying amount is the estimated fair value for cash and cash equivalents, savings and other interest bearing demand deposits, accrued interest receivable and payable, customer’s and Bank’s liabilities on acceptances, non-interest-bearing deposits, short-term debt, secured borrowings, and variable rate loans or deposits that reprice frequently and fully. For fixed rate loans or deposits and for variable rate loans or deposits with infrequent repricing or repricing limits, fair value is based on discounted cash flows using current market rates applied to the estimated life and credit risk. The allowance for loan losses is considered to be a reasonable estimate of discount for credit quality concerns. Fair value of loans held for sale is based on market quotes. Fair value of time deposits and debt is based on current rates for similar financing. It was not practicable to determine the fair value of Federal Reserve Bank stock or Federal Home Loan Bank stock due to restrictions placed on their transferability. The fair value of commitments to fund loans represents fees currently charged to enter into similar agreements with similar remaining maturities and is not presented herein. The fair value of these financial instruments is not material to the consolidated financial statements.
14. STOCKHOLDERS’ EQUITY AND REGULATORY MATTERS
The Company and the Bank are subject to various regulatory capital requirements administered by the federal banking agencies. Failure to meet minimum capital requirements can initiate certain mandatory and possibly additional discretionary actions by regulators that, if undertaken, could have a direct material effect on the Company’s and the Bank’s financial statements, such as restrictions on the growth, expansion or the payment of dividends or other capital distributions or management fees. Under capital adequacy guidelines and the regulatory framework for prompt corrective action, the Company and the Bank must meet specific capital guidelines that involve quantitative measures of their assets, liabilities and certain off-balance-sheet items as calculated under regulatory accounting practices. The capital amounts and classification are also subject to qualitative judgments by the regulators about components, risk weightings and other factors. Prompt corrective action provisions are not applicable to bank holding companies.
F-47
Table of Contents
NARA BANCORP, INC. AND SUBSIDIARIES
NOTES TO CONSOLIDATED FINANCIAL STATEMENTS—(Continued)
Quantitative measures established by regulation to ensure capital adequacy require the Company and the Bank to maintain minimum ratios (set forth in the table below) of total and Tier I capital (as defined in the regulations) to risk-weighted assets (as defined) and of Tier I capital (as defined) to average assets (as defined). Management believes that, as of December 31, 2010 and 2009, the Company and the Bank met all capital adequacy requirements to which they are subject.
As of December 31, 2010 and 2009, the most recent regulatory notification categorized the Bank as well capitalized under the regulatory framework for prompt corrective action. To be categorized as well capitalized, the Bank must maintain minimum total risk-based, Tier I risk-based and Tier I leverage ratios as set forth in the table below. There are no conditions or events since the notification that management believes have changed the Bank’s category.
On November 21, 2008, the Company received $67 million from the U.S. Treasury through its TARP capital purchase plan and issued 67,000 shares of cumulative preferred stock. The preferred stock will pay cumulative dividends at the rate of 5% per year for the first five years and 9% per year thereafter. The shares are callable by the Company at par after three years if the repurchase is made with proceeds of a new offering or placement of common equity or of certain preferred stock treated as Tier 1 capital under applicable Federal banking regulations.
Prior to the earlier of the third anniversary of the closing date and the date on which the preferred shares have been redeemed in whole or the investor has transferred all of the preferred shares to third parties which are not affiliates of the investor, neither the Company nor any Company subsidiary shall, without the consent of the investor, declare or pay any dividend or make any distribution on its common stock (other than (A) regular quarterly cash dividends of not more than $0.0275, which was the amount of the last quarterly cash dividend per share declared or, if lower, publicly announced an intention to declare, on the common stock prior to October 14, 2008, as adjusted for any stock split, stock dividend, reverse stock split, reclassification or similar transaction, (B) dividends payable solely in shares of common stock and (C) dividends or distributions of rights or junior stock in connection with a stockholders’ rights plan).
The preferred stock issued qualifies as Tier 1 capital.
In conjunction with the purchase of the Company’s preferred stock, the U.S. Treasury received a warrant to purchase 1,042,531 shares of the Company’s common stock at $9.64 per share. The term of the warrant is ten years. On December 3, 2009, US Treasury approved the Company’s request for an adjustment to the Company’s warrant share position due to a qualified equity offering in November 2009, which is discussed below. The adjusted number of warrant is 521,266, or 50% of original issuance of 1,042,531.
On October 27, 2009, the Company closed an offering of $86.3 million of its common stock through an underwritten public offering of 11.5 million shares of the Company’s common stock at a price of $7.50 per share, including a 15% over-allotment option. Net proceeds were approximately $82 million. The shares were issued pursuant to a prospectus supplement filed as part of a shelf registration statement previously filed with the Securities and Exchange Commission on Form S-3 (No. 333-161992).
F-48
Table of Contents
NARA BANCORP, INC. AND SUBSIDIARIES
NOTES TO CONSOLIDATED FINANCIAL STATEMENTS—(Continued)
The Company’s and the Bank’s actual capital amounts and ratios are presented in the table below:
| Actual | Required For Capital Adequacy Purposes |
Required To Be Well Capitalized under Prompt Corrective Action Provisions |
||||||||||||||||||||||
| Amount | Ratio | Amount | Ratio | Amount | Ratio | |||||||||||||||||||
| (Dollars in thousands) | ||||||||||||||||||||||||
| As of December 31, 2010: |
||||||||||||||||||||||||
| Total capital |
||||||||||||||||||||||||
| (to risk-weighted assets): |
||||||||||||||||||||||||
| Company |
$ | 403,298 | 17.7 | % | $ | 182,389 | 8.0 | % | N/A | N/A | ||||||||||||||
| Bank |
$ | 393,292 | 17.3 | % | $ | 182,065 | 8.0 | % | $ | 227,581 | 10.0 | % | ||||||||||||
| Tier I capital |
||||||||||||||||||||||||
| (to risk-weighted assets): |
||||||||||||||||||||||||
| Company |
$ | 374,353 | 16.4 | % | $ | 91,194 | 4.0 | % | N/A | N/A | ||||||||||||||
| Bank |
$ | 364,397 | 16.0 | % | $ | 91,032 | 4.0 | % | $ | 136,549 | 6.0 | % | ||||||||||||
| Tier I capital (to average assets): |
||||||||||||||||||||||||
| Company |
$ | 374,353 | 12.6 | % | $ | 118,718 | 4.0 | % | N/A | N/A | ||||||||||||||
| Bank |
$ | 364,397 | 12.3 | % | $ | 118,742 | 4.0 | % | $ | 148,427 | 5.0 | % | ||||||||||||
| Actual | Required For Capital Adequacy Purposes |
Required To Be Well Capitalized under Prompt Corrective Action Provisions |
||||||||||||||||||||||
| Amount | Ratio | Amount | Ratio | Amount | Ratio | |||||||||||||||||||
| (Dollars in thousands) | ||||||||||||||||||||||||
| As of December 31, 2009: |
||||||||||||||||||||||||
| Total capital |
||||||||||||||||||||||||
| (to risk-weighted assets): |
||||||||||||||||||||||||
| Company |
$ | 429,666 | 18.0 | % | $ | 191,048 | 8.0 | % | N/A | N/A | ||||||||||||||
| Bank |
$ | 412,261 | 17.3 | % | $ | 190,799 | 8.0 | % | $ | 238,499 | 10.0 | % | ||||||||||||
| Tier I capital |
||||||||||||||||||||||||
| (to risk-weighted assets): |
||||||||||||||||||||||||
| Company |
$ | 399,447 | 16.7 | % | $ | 95,524 | 4.0 | % | N/A | N/A | ||||||||||||||
| Bank |
$ | 382,081 | 16.0 | % | $ | 95,399 | 4.0 | % | $ | 143,099 | 6.0 | % | ||||||||||||
| Tier I capital (to average assets): |
||||||||||||||||||||||||
| Company |
$ | 399,447 | 12.4 | % | $ | 129,248 | 4.0 | % | N/A | N/A | ||||||||||||||
| Bank |
$ | 382,081 | 11.8 | % | $ | 129,841 | 4.0 | % | $ | 162,301 | 5.0 | % | ||||||||||||
Under federal banking law, dividends declared by the Bank in any calendar year may not, without the approval of the regulatory agency, exceed its net income for that year combined with its retained income from the preceding two years. However, the regulatory agency has previously issued a bulletin to all banks outlining guidelines limiting the circumstances under which banks may pay dividends even if the banks are otherwise statutorily authorized to pay dividends. The limitations impose a requirement or in some cases suggest that prior approval of the regulatory agency should be obtained before a dividend is paid if a bank is the subject of administrative action or if the payment could be viewed by the regulatory agency as unsafe or unusual. In 2009, the Bank agreed with its primary regulatory agencies to obtain the prior written approval to pay any dividends.
F-49
Table of Contents
NARA BANCORP, INC. AND SUBSIDIARIES
NOTES TO CONSOLIDATED FINANCIAL STATEMENTS—(Continued)
15. EARNINGS PER SHARE
EPS information is as follows for the years ended December 31:
| Income (Numerator) |
Shares (Denominator) |
Per Share Amount |
||||||||||
| (In thousands, expcet share and per share data) | ||||||||||||
| 2010 |
||||||||||||
| Net loss as reported |
$ | (7,239 | ) | |||||||||
| Less: preferred stock dividends and accretion of preferred stock discount |
(4,291 | ) | ||||||||||
| Basic EPS—common stock |
$ | (11,530 | ) | 37,919,340 | $ | (0.30 | ) | |||||
| Effect of dilutive securities: |
||||||||||||
| Stock options |
— | — | ||||||||||
| Diluted EPS—common stock |
$ | (11,530 | ) | 37,919,340 | $ | (0.30 | ) | |||||
| 2009 |
||||||||||||
| Net loss as reported |
$ | (5,723 | ) | |||||||||
| Less: preferred stock dividends and accretion of preferred stock discount |
(4,276 | ) | ||||||||||
| Basic EPS—common stock |
$ | (9,999 | ) | 28,359,496 | $ | (0.35 | ) | |||||
| Effect of dilutive securities: |
||||||||||||
| Stock options |
— | — | ||||||||||
| Diluted EPS—common stock |
$ | (9,999 | ) | 28,359,496 | $ | (0.35 | ) | |||||
| 2008 |
||||||||||||
| Net income as reported |
$ | 2,755 | ||||||||||
| Less: preferred stock dividends and accretion of preferred stock discount |
(474 | ) | ||||||||||
| Basic EPS—common stock |
$ | 2,281 | 26,200,344 | $ | 0.09 | |||||||
| Effect of dilutive securities: |
||||||||||||
| Stock options |
— | 219,189 | ||||||||||
| Diluted EPS—common stock |
$ | 2,281 | 26,419,533 | $ | 0.09 | |||||||
Basic EPS excludes dilution and is computed by dividing net income available to common stockholders by the weighted average number of common shares outstanding for the period. Diluted EPS reflects the potential dilution that could occur if stock options or other contracts to issue common stock were exercised or converted to common stock that would then share in our earnings. For the years ended December 31, 2010, 2009 and 2008, stock options and restricted shares awards for approximately 533,000, 1,092,000 and 440,000 shares of common stock were excluded in computing diluted earnings per common share because they were antidilutive. Additionally, warrants to purchase 521,266, 521,266 and 1,042,531 shares of common stock were also antidilutive for years ended December 31, 2010, 2009 and 2008, respectively.
F-50
Table of Contents
NARA BANCORP, INC. AND SUBSIDIARIES
NOTES TO CONSOLIDATED FINANCIAL STATEMENTS—(Continued)
16. COMPREHENSIVE INCOME (LOSS)
Comprehensive income (loss) components and related tax effects were as follows:
| 2010 | 2009 | 2008 | ||||||||||
| (In thousands) | ||||||||||||
| Net income (loss) |
(7,239 | ) | (5,723 | ) | $ | 2,755 | ||||||
| Unrealized holding gains (losses) on securities available-for sale and interest only strips |
5,773 | 11,401 | (2,385 | ) | ||||||||
| Other than temporary impairment on securities available for sale |
— | — | 1,713 | |||||||||
| Reclassification adjustments for gains realized in income |
(6,396 | ) | (4,427 | ) | (860 | ) | ||||||
| Net unrealized gain (loss) |
(623 | ) | 6,974 | (1,532 | ) | |||||||
| Tax expense (benefit) |
(269 | ) | 2,771 | (611 | ) | |||||||
| Net of tax amount |
$ | (354 | ) | $ | 4,203 | $ | (921 | ) | ||||
| Change in fair value of the effective portion of derivatives used for cash flow hedges |
$ | — | $ | — | $ | 289 | ||||||
| Reclassification adjustment for gains realized for the ineffective portion of swaps and caps and discontinued hedge positions |
(44 | ) | (140 | ) | (140 | ) | ||||||
| Reclassification adjustments for losses realized in income for swaps and caps |
— | — | 1 | |||||||||
| Net unrealized gain (loss) |
(44 | ) | (140 | ) | 150 | |||||||
| Tax expense (benefit) |
(18 | ) | (56 | ) | 60 | |||||||
| Net of tax amount |
$ | (26 | ) | $ | (84 | ) | $ | 90 | ||||
| Total other comprehensive income (loss) |
$ | (380 | ) | $ | 4,119 | $ | (831 | ) | ||||
| Comprehensive income (loss) |
$ | (7,619 | ) | $ | (1,604 | ) | $ | 1,924 | ||||
The following is a summary of the accumulated other comprehensive income balances, net of tax:
| Balance at 12/31/2009 |
Current Period Change |
Balance at 12/31/2010 |
||||||||||
| Unrealized gains (losses) on securities available for sale |
$ | 2,851 | $ | (355 | ) | $ | 2,496 | |||||
| Unrealized gains (losses) on interest only strips |
47 | 1 | 48 | |||||||||
| Unrealized gains (losses) on interest rate swaps |
79 | (26 | ) | 53 | ||||||||
| Total |
$ | 2,977 | $ | (380 | ) | $ | 2,597 | |||||
17. DERIVATIVE FINANCIAL INSTRUMENTS AND HEDGING ACTIVITIES
As part of our asset and liability management strategy, we may enter into derivative financial instruments, such as interest rate swaps, caps and floors, with the overall goal of minimizing the impact of interest rate fluctuations on our net interest margin. Interest rate swaps and caps involve the exchange of fixed-rate and variable-rate interest payment obligations without the exchange of the underlying notional amounts.
Under the interest rate swap agreements that the Company had entered into as of December 31, 2007, the Company received a fixed rate and paid a floating rate. The interest rate swaps qualified as cash flow hedges for accounting purposes, and effectively fixed the interest rate received on the variable rate loans indexed to Prime as
F-51
Table of Contents
NARA BANCORP, INC. AND SUBSIDIARIES
NOTES TO CONSOLIDATED FINANCIAL STATEMENTS—(Continued)
of December 31, 2007. As of December 31, 2007, the amounts in accumulated other comprehensive income (loss) associated with these cash flow hedges totaled a gain of $122 thousand (net of tax of $73 thousand). During January 2008, the Company terminated the $50 million of interest rate swaps that were outstanding at December 31, 2007. The gain of $247 thousand, net of tax, on termination of the swaps is being amortized into income over the remaining life of the swaps. $26 thousand, net of tax of $18 thousand, was recognized into income during 2010.
In January of 2008, the Company entered into five interest swap agreements with an aggregate notional amount of $50 million. Under these swap agreements, the Company receives a floating rate, resetting semi-annually based on the 6 Month London-Interbank Offered Rate (6 Mo. LIBOR), and pays a fixed rate of 3.57%, until January 2010. These interest rate swap agreements are considered “free-standing” due to non-designation of a hedge relationship to any of its financial assets or liabilities. Under FASB ASC 815, valuation gains or losses on interest rate swaps not designated as hedging instruments are recognized currently in earnings. These five interest swap agreements matured on January 14, 2010; therefore, the fair value of the outstanding interest rate swaps was $0 as of December 31, 2010, compared to $(645 thousand) at December 31, 2009.
Interest rate swap information at 2009 is summarized as follows:
| (In thousands) | ||||||||||||||||
| December 31, 2009 | ||||||||||||||||
| Notional Amount |
Floating Rate |
Fixed Rate |
Maturity Date | Fair Value | ||||||||||||
| (Dollars in thousands) | ||||||||||||||||
| $10,000 | 6 Mo. LIBOR | 3.57 | % | 01/14/2010 | $ | (129.1 | ) | |||||||||
| 10,000 | 6 Mo. LIBOR | 3.57 | % | 01/14/2010 | (129.1 | ) | ||||||||||
| 10,000 | 6 Mo. LIBOR | 3.57 | % | 01/14/2010 | (129.1 | ) | ||||||||||
| 10,000 | 6 Mo. LIBOR | 3.57 | % | 01/14/2010 | (129.1 | ) | ||||||||||
| 10,000 | 6 Mo. LIBOR | 3.57 | % | 01/14/2010 | (129.1 | ) | ||||||||||
| $50,000 | $ | (645 | ) | |||||||||||||
During the third quarter of 2009, we entered into two two-year interest rate cap agreements with an aggregate notional amount of $50 million. Under these cap agreements, we receive quarterly payments from the counterparty when the quarterly resetting 3 Month London-Interbank Offered Rate (“3 Mo. LIBOR”) exceeds the strike level of 2.00%. The upfront fee paid to the counterparty in entering into these two interest rate cap agreements was $359 thousand. During the first quarter of 2010, we entered into another three-year interest rate cap agreement with an aggregate notional amount of $50 million. Under this cap agreement, we also receive quarterly payments from the counterparty when the quarterly resetting 3 Mo. LIBOR exceeds the strike level of 2.00%. The upfront fee paid to the counterpary in entering into this interest rate cap agreement was $890 thousand. These interest rate cap agreements are considered “free-standing” due to non-designation of a hedge relationship to any of its financial assets or liabilities. Under FASB ASC 815, valuation gains or losses on interest rate caps not designated as hedging instruments are recognized in earnings. At December 31, 2010, the aggregate fair value of the outstanding interest rate caps was $167 thousand and we recognized mark-to-market losses on valuation of $901 thousand in 2010.
F-52
Table of Contents
NARA BANCORP, INC. AND SUBSIDIARIES
NOTES TO CONSOLIDATED FINANCIAL STATEMENTS—(Continued)
At December 31, 2010, summary information about these interest-rate caps is as follows:
| Notional amounts |
$100.0 million | |
| Weighted average pay rates |
N/A | |
| Weighted average receive rates |
N/A | |
| Weighted average maturity |
1.37 years | |
| Fair value of combined interest rate caps |
$167 thousand |
The following tables summarize the fair value of derivative financial instruments utilized by the Company:
| Derivatives at | ||||||||||||
| December 31, 2010 | December 31, 2009 | |||||||||||
| (In thousands) | ||||||||||||
| Balance Sheet Location |
Fair Value | Balance Sheet Location |
Fair Value | |||||||||
| Derivatives not designated as hedging instruments: |
||||||||||||
| Interest rate caps |
Other Assets | $ | 167 | Other Assets | $ | 177 | ||||||
| Interest rate swaps |
Other Liabilities | — | Other Liabilities | (645 | ) | |||||||
| Total derivatives not designated as hedging instruments |
$ | 167 | $ | (468 | ) | |||||||
The effect of derivative instruments on the Consolidated Statement of Income for 2010 and 2009 are as follows:
| 12/31/2010 | 12/31/2009 | |||||||||||
| (In thousands) | ||||||||||||
| Location of Gain or (Loss) Recognized in Income on Derivatives |
Amount of Gain or (Loss) Recognized in Income on Derivatives |
|||||||||||
| Derivatives not designated as hedging instruments under FASB ASC 815: |
||||||||||||
| Interest rate contracts (1) |
Other income | $ | (901 | ) | $ | (586 | ) | |||||
| Total |
$ | (901 | ) | $ | (586 | ) | ||||||
| (1) | Includes amounts representing the net interest payments as stated in the contractual agreements and the valuation gains or (losses) on interest rate contracts not designated as hedging instruments. |
F-53
Table of Contents
NARA BANCORP, INC. AND SUBSIDIARIES
NOTES TO CONSOLIDATED FINANCIAL STATEMENTS—(Continued)
18. QUARTERLY FINANCIAL DATA (UNAUDITED)
Summarized unaudited quarterly financial data follows for the three months ended:
| March 31 | June 30 | September 30 | December 31 | |||||||||||||
| (In thousands, except per share amounts) | ||||||||||||||||
| 2010 |
||||||||||||||||
| Interest income |
$ | 38,661 | $ | 36,593 | $ | 37,130 | $ | 38,052 | ||||||||
| Interest expense |
13,418 | 9,785 | 9,520 | 9,329 | ||||||||||||
| Net interest income before provision for loan losses |
25,243 | 26,808 | 27,610 | 28,723 | ||||||||||||
| Provision for loan losses |
25,407 | 42,323 | 11,100 | 5,800 | ||||||||||||
| Net interest income after provision for loan losses |
(164 | ) | (15,515 | ) | 16,510 | 22,923 | ||||||||||
| Non-interest income |
9,384 | 3,460 | 7,339 | 4,298 | ||||||||||||
| Non-interest expense |
14,184 | 15,967 | 15,693 | 17,530 | ||||||||||||
| Income (loss) before income tax provision |
(4,964 | ) | (28,022 | ) | 8,156 | 9,691 | ||||||||||
| Income tax provision (benefit) |
(2,432 | ) | (12,145 | ) | 3,056 | 3,621 | ||||||||||
| Net income (loss) |
$ | (2,532 | ) | $ | (15,877 | ) | $ | 5,100 | $ | 6,070 | ||||||
| Dividends and discount accretion on preferred stock |
$ | (1,071 | ) | $ | (1,073 | ) | $ | (1,073 | ) | $ | (1,074 | ) | ||||
| Net income (loss) available to common stockholders |
$ | (3,603 | ) | $ | (16,950 | ) | $ | 4,027 | $ | 4,996 | ||||||
| Basic earnings (loss) per common share |
$ | (0.10 | ) | $ | (0.45 | ) | $ | 0.11 | $ | 0.13 | ||||||
| Diluted earnings (loss) per common share |
$ | (0.10 | ) | $ | (0.45 | ) | $ | 0.11 | $ | 0.13 | ||||||
The net loss in the second quarter was primarily due to the higher provision for loan losses related $63.3 million of problem assets being marketed for sale to improve the asset quality.
| March 31 | June 30 | September 30 | December 31 | |||||||||||||
| (In thousands, except per share amounts) | ||||||||||||||||
| 2009 |
||||||||||||||||
| Interest income |
$ | 36,059 | $ | 38,410 | $ | 41,706 | $ | 41,870 | ||||||||
| Interest expense |
15,620 | 17,150 | 17,473 | 15,456 | ||||||||||||
| Net interest income before provision for loan losses |
20,439 | 21,260 | 24,233 | 26,414 | ||||||||||||
| Provision for loan losses |
15,670 | 19,000 | 8,500 | 17,853 | ||||||||||||
| Net interest income after provision for loan losses |
4,769 | 2,260 | 15,733 | 8,561 | ||||||||||||
| Non-interest income |
4,365 | 3,785 | 4,894 | 5,424 | ||||||||||||
| Non-interest expense |
15,248 | 16,822 | 14,668 | 14,975 | ||||||||||||
| Income (loss) before income tax provision |
(6,114 | ) | (10,777 | ) | 5,959 | (990 | ) | |||||||||
| Income tax provision (benefit) |
(2,934 | ) | (4,769 | ) | 2,018 | (514 | ) | |||||||||
| Net income (loss) |
$ | (3,180 | ) | $ | (6,008 | ) | $ | 3,941 | $ | (476 | ) | |||||
| Dividends and discount accretion on preferred stock |
$ | (1,068 | ) | $ | (1,069 | ) | $ | (1,069 | ) | $ | (1,070 | ) | ||||
| Net income (loss) available to common stockholders |
$ | (4,248 | ) | $ | (7,077 | ) | $ | 2,872 | $ | (1,546 | ) | |||||
| Basic earnings (loss) per common share |
$ | (0.16 | ) | $ | (0.27 | ) | $ | 0.11 | $ | (0.04 | ) | |||||
| Diluted earnings (loss) per common share |
$ | (0.16 | ) | $ | (0.27 | ) | $ | 0.11 | $ | (0.04 | ) | |||||
F-54
Table of Contents
NARA BANCORP, INC. AND SUBSIDIARIES
NOTES TO CONSOLIDATED FINANCIAL STATEMENTS—(Continued)
The lower provision for loan losses in the third quarter, compared to other quarters, was primarily due to the impact of lower net charge offs and lower special mention and classified loans, partially offset by an increase in non-performing loans.
19. BUSINESS SEGMENT INFORMATION
Our management utilizes an internal reporting system to measure the performance of our various operating segments. We have identified three principal operating segments for the purposes of management reporting: banking operations, trade finance services (“TFS”) and small business administration (“SBA”) lending services.
Information related to our remaining centralized functions and eliminations of inter-segment amounts has been aggregated and included in banking operations. Although all three operating segments offer financial products and services, they are managed separately based on each segment's strategic focus. The banking operations segment focuses primarily on commercial and consumer lending and deposit operations throughout our branch network. The TFS segment focuses primarily on allowing our import/export customers to handle their international transactions. Trade finance products include the issuance and collection of letters of credit, international collection and import/export financing. The SBA segment primarily provides our customers with access to the U.S. SBA guaranteed lending program. The SBA segment also makes commercial real estate and commercial business loans, which are not under the SBA guarantee program.
Operating segment results are based on our internal management reporting process, which reflects assignments and allocations of capital, certain operating and administrative costs and the provision for loan losses. Non-interest income and non-interest expense, including depreciation and amortization, directly attributable to a segment are assigned to that business. We allocate indirect costs, including overhead expense, to the various segments based on several factors, including, but not limited to, full-time equivalent employees, loan volume and deposit volume. We evaluate the overall performance based on profit or loss from operations before income taxes, excluding gains and losses that are not expected to reoccur. Future changes in our management structure or reporting methodologies may result in changes to the measurement of our operating segment results.
The following tables present the operating results and other key financial measures for the individual operating segments for the years ended December 31, 2010, 2009 and 2008.
| Business Segment | ||||||||||||||||||||
| Banking Operations |
TFS1 | SBA | Company | |||||||||||||||||
| (Dollars in Thousands) | ||||||||||||||||||||
| 2010 |
||||||||||||||||||||
| Net interest income |
$ | 87,581 | $ | 10,675 | $ | 10,128 | $ | 108,384 | ||||||||||||
| Less provision for loan losses 2 |
55,912 | 5,432 | 23,286 | 84,630 | ||||||||||||||||
| Non-interest income |
17,294 | 2,623 | 4,564 | 3 | 24,481 | |||||||||||||||
| Net revenue (expense) |
48,963 | 7,866 | (8,594 | ) | 48,235 | |||||||||||||||
| Non-interest expense |
56,350 | 2,234 | 4,790 | 63,374 | ||||||||||||||||
| Income (loss) before income taxes |
$ | (7,387 | ) | $ | 5,632 | $ | (13,384 | ) | $ | (15,139 | ) | |||||||||
| Goodwill |
$ | 2,509 | $ | — | $ | — | $ | 2,509 | ||||||||||||
| Total assets |
$ | 2,481,402 | $ | 219,007 | $ | 262,887 | $ | 2,963,296 | ||||||||||||
| 1 | Beginning in 2010, we reevaluated our method of charging fund transfer costs to each business unit and made certain changes to the method. This change resulted in a significant difference in the fund transfer cost for the Trade Finance Operation. |
F-55
Table of Contents
NARA BANCORP, INC. AND SUBSIDIARIES
NOTES TO CONSOLIDATED FINANCIAL STATEMENTS—(Continued)
| 2 | The increase in 2010 from 2009 was primarily due to the charge-offs taken on the loans that were transferred to loans held for sale during the second quarter 2010. |
| 3 | Includes a net gain of $1.8 million allocated to the SBA segment from the net gain of $3.7 million on sales of problem loans. |
| Business Segment | ||||||||||||||||
| Banking Operations |
TFS | SBA | Company | |||||||||||||
| (Dollars in Thousands) | ||||||||||||||||
| 2009 |
||||||||||||||||
| Net interest income |
$ | 76,384 | $ | 4,637 | $ | 11,325 | $ | 92,346 | ||||||||
| Less provision for loan losses 1 |
38,602 | 3,122 | 19,299 | 61,023 | ||||||||||||
| Non-interest income |
13,667 | 2,088 | 2,713 | 18,468 | ||||||||||||
| Net revenue (expense) |
51,449 | 3,603 | (5,261 | ) | 49,791 | |||||||||||
| Non-interest expense |
51,584 | 2,968 | 7,161 | 61,713 | ||||||||||||
| Income (loss) before income taxes |
$ | (135 | ) | $ | 635 | $ | (12,422 | ) | $ | (11,922 | ) | |||||
| Goodwill |
$ | 2,509 | $ | — | $ | — | $ | 2,509 | ||||||||
| Total assets |
$ | 2,744,684 | $ | 181,135 | $ | 302,138 | $ | 3,227,957 | ||||||||
| 1 | The increase in the provision for loan losses during 2009 is due to the increase in delinquencies and impaired loans in the loan portfolio. |
| Business Segment | ||||||||||||||||
| Banking Operations |
TFS | SBA | Company | |||||||||||||
| (Dollars in Thousands) | ||||||||||||||||
| 2008 |
||||||||||||||||
| Net interest income |
$ | 78,999 | $ | 4,429 | $ | 12,793 | $ | 96,221 | ||||||||
| Less provision for loan losses |
24,141 | 7,886 | 16,798 | 48,825 | ||||||||||||
| Non-interest income |
9,386 | 2,140 | 2,467 | 13,993 | ||||||||||||
| Net revenue (expense) |
64,244 | (1,317 | ) | (1,538 | ) | 61,389 | ||||||||||
| Non-interest expense |
45,995 | 3,405 | 7,609 | 57,009 | ||||||||||||
| Income (loss) before income taxes |
$ | 18,249 | $ | (4,722 | ) | $ | (9,147 | ) | $ | 4,380 | ||||||
| Goodwill |
$ | 2,509 | $ | — | $ | — | $ | 2,509 | ||||||||
| Total assets |
$ | 2,147,194 | $ | 182,821 | $ | 342,039 | $ | 2,672,054 | ||||||||
The SBA business segment primarily originates for sale and services SBA loans generated from our loan production offices and from branch referrals. It also originates commercial real estate loans and commercial business loans, not covered by the SBA guarantee program. Total SBA business segment assets at December 31, 2010 and 2009 included SBA loans (principally, the unguaranteed portion) of $105.6 million and $103.2 million; commercial real estate loans of $124.4 million and $189.2 million; and commercial business loans of $16.4 million and $15.7 million, respectively.
F-56
Table of Contents
NARA BANCORP, INC. AND SUBSIDIARIES
NOTES TO CONSOLIDATED FINANCIAL STATEMENTS—(Continued)
20. CONDENSED FINANCIAL STATEMENTS OF PARENT COMPANY
The following presents the unconsolidated financial statements of only the parent company, Nara Bancorp, Inc., as of December 31:
STATEMENTS OF FINANCIAL CONDITION
| December 31, | ||||||||
| 2010 | 2009 | |||||||
| (In thousands) | ||||||||
| ASSETS: |
||||||||
| Cash and cash equivalents |
$ | 11,750 | $ | 15,760 | ||||
| Other assets |
4,197 | 3,487 | ||||||
| Investment in bank subsidiary |
382,976 | 388,609 | ||||||
| TOTAL ASSETS |
$ | 398,923 | $ | 407,856 | ||||
| LIABILITIES: |
||||||||
| Other borrowings |
$ | 39,268 | $ | 39,268 | ||||
| Accounts payable and other liabilities |
1,092 | 613 | ||||||
| Total liabilities |
40,360 | 39,881 | ||||||
| STOCKHOLDERS’ EQUITY |
358,563 | 367,975 | ||||||
| TOTAL LIABILITIES AND STOCKHOLDERS’ EQUITY |
$ | 398,923 | $ | 407,856 | ||||
STATEMENTS OF INCOME
| Years Ended December 31, | ||||||||||||
| 2010 | 2009 | 2008 | ||||||||||
| (In thousands) | ||||||||||||
| Interest income |
$ | 13 | $ | 50 | $ | 50 | ||||||
| Interest expense |
(1,851 | ) | (2,022 | ) | (2,695 | ) | ||||||
| Dividends from bank subsidiary |
— | 1,200 | 2,000 | |||||||||
| Other operating expense |
(2,263 | ) | (1,530 | ) | (1,352 | ) | ||||||
| Equity in undistributed earnings (losses) of bank subsidiary |
(5,574 | ) | (5,242 | ) | 3,270 | |||||||
| Income (loss) before income tax benefit |
(9,675 | ) | (7,544 | ) | 1,273 | |||||||
| Income tax benefit |
(2,436 | ) | (1,821 | ) | (1,482 | ) | ||||||
| Net income (loss) |
$ | (7,239 | ) | $ | (5,723 | ) | $ | 2,755 | ||||
F-57
Table of Contents
NARA BANCORP, INC. AND SUBSIDIARIES
NOTES TO CONSOLIDATED FINANCIAL STATEMENTS—(Continued)
STATEMENTS OF CASH FLOWS
| Years Ended December 31, | ||||||||||||
| 2010 | 2009 | 2008 | ||||||||||
| (In thousands) | ||||||||||||
| CASH FLOWS FROM OPERATING ACTIVITIES: |
||||||||||||
| Net income (loss) |
$ | (7,239 | ) | $ | (5,723 | ) | $ | 2,755 | ||||
| Adjustments to reconcile net income to net cash from operating activities: |
||||||||||||
| Amortization |
20 | 21 | 156 | |||||||||
| Stock-based compensation expense |
52 | 479 | 284 | |||||||||
| Change in other assets |
(730 | ) | 2,758 | 591 | ||||||||
| Change in accounts payable and other liabilities |
479 | (89 | ) | 24 | ||||||||
| Equity in undistributed loss (earnings) of bank subsidiary |
5,574 | 5,242 | (3,270 | ) | ||||||||
| Net cash from operating activities |
(1,844 | ) | 2,688 | 540 | ||||||||
| CASH FLOWS FROM INVESTING ACTIVITIES: |
||||||||||||
| Investment in Nara Bank |
— | (65,600 | ) | (67,000 | ) | |||||||
| Net cash from investing activities |
— | (65,600 | ) | (67,000 | ) | |||||||
| CASH FLOWS FROM FINANCING ACTIVITIES: |
||||||||||||
| Issuance of TARP preferred stock |
— | — | 67,000 | |||||||||
| Issuance of additional common stock |
— | 81,972 | ||||||||||
| Issuance of additional stock pursuant to various stock plans |
1,150 | — | 443 | |||||||||
| Tax effect on issuance of shares from stock plan |
35 | (463 | ) | — | ||||||||
| Payments of cash dividends |
(3,351 | ) | (4,015 | ) | (2,882 | ) | ||||||
| Net cash from financing activities |
(2,166 | ) | 77,494 | 64,561 | ||||||||
| NET CHANGE IN CASH AND CASH EQUIVALENTS |
(4,010 | ) | 14,582 | (1,899 | ) | |||||||
| CASH AND CASH EQUIVALENTS, BEGINNING OF YEAR |
15,760 | 1,178 | 3,077 | |||||||||
| CASH AND CASH EQUIVALENTS, END OF YEAR |
$ | 11,750 | $ | 15,760 | $ | 1,178 | ||||||
21. PENDING CENTER MERGER
On December 9, 2010, we entered into a definitive agreement to merge with Center Financial Corporation (“Center Financial”) in an all stock transaction valued at $285.7 million, or approximately $7.16 per Center Financial share based on the closing price on December 8, 2010. As of February 17, 2011, the transaction was valued at $314.1 million, or approximately $7.87 per Center Financial share.
Under the terms of the transaction, each Center Financial shareholder will receive 0.7804 shares of our common stock for each share of Center Financial common stock then owned by such shareholder. Based on the number of shares Center Financial common stock outstanding on the date of the Merger Agreement and not including the effect of outstanding in-the-money options, this will result in approximately 31.1 million Nara Bancorp shares being exchanged for approximately 39.9 million outstanding Center Financial shares, subject to adjustment in certain limited circumstances. Nara Bancorp shareholders will own 55% of the combined company and Center Financial shareholders will own 45%. The consummation of the Center Merger is subject to regulatory approval, the approval of the shareholders of both Nara Bancorp and Center Financial, and other customary closing conditions. While there can be no assurance as to the exact timing, or that the Center Merger will be completed at all, we are working to complete the Center Merger in the second half of 2011.
F-58