Attached files
| file | filename |
|---|---|
| 8-K - UNITY BANCORP INC /NJ/ | unty-8k2q20earnings.htm |
For Immediate Release | News Media & Financial Analyst Contact: |
Unity Bancorp, Inc. (NSDQ: UNTY) | Anthony Cossetti, EVP and CFO |
July 23, 2020 | (908) 713-4565 |
 Unity Bancorp Reports
Quarterly Earnings of $5.2 Million
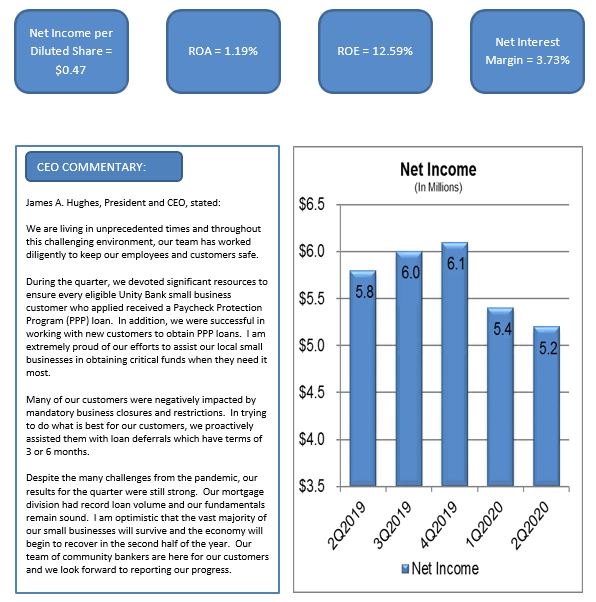
Clinton, NJ, July 23, 2020 - Unity Bancorp, Inc. (NASDAQ: UNTY), parent company of Unity Bank, reported net income of $5.2 million, or $0.47 per diluted share, for the quarter ended June 30, 2020, an 11.4 percent decrease compared to $5.8 million, or $0.53 per diluted share for the prior year’s second quarter. For the six months ended June 30, 2020, Unity reported net income of $10.5 million, or $0.96 per diluted share, an 8.9 percent decrease compared to $11.6 million or $1.05 per diluted share for the prior year’s period. The decreases in earnings were primarily due to an increased provision for loan losses, necessitated by the COVID-19 pandemic and governmental responses.
Second Quarter Earnings Highlights
• | Net interest income, our primary driver of earnings, increased $1.3 million to $15.5 million for the quarter ended June 30, 2020, compared to the prior year’s quarter, due to SBA PPP loans, commercial loan growth and a reduction in the cost of funds. |
• | Net interest margin (NIM) decreased to 3.73% for the quarter ended June 30, 2020, compared to 3.96% for the prior year’s quarter and decreased 19 basis points from 3.92% in the prior sequential quarter ended March 31, 2020. These decreases were a direct result of interest rate cuts by the Board of Governors of the Federal Reserve in response to COVID-19. |
• | The provision for loan losses was $2.5 million for the quarter ended June 30, 2020, an increase of $2.2 million from the prior year’s quarter due to the increased risk of loan defaults as a result of COVID-19. Some of our customer’s businesses have been required to close pursuant to governmental restrictions on non-essential businesses. Due to the uncertainty of COVID-19, the Company may incur elevated provisions until restrictions on businesses have been loosened and they can fully reopen. |
• | Noninterest income increased $400 thousand to $2.8 million compared to the prior year’s quarter and increased $266 thousand compared to the prior sequential quarter. The increases were primarily due to increased gains on mortgage loan sales. Mortgage banking has been strong and market conditions continue to be favorable. For the quarter ended June 30, 2020, quarterly residential mortgage loan sales totaled $67.3 million, compared to $23.6 million at June 30, 2019. |
• | Noninterest expense increased $386 thousand to $9.2 million compared to the prior year’s quarter, primarily due to increased consulting expenses incurred in connection with compliance with our Consent Order with the FDIC and NJDOBI and increased compensation due to increased mortgage commissions. Noninterest expense decreased $146 thousand compared to the prior sequential quarter. |
• | The effective tax rate was 22.3% compared to 22.0% in the prior year’s quarter. |
Balance Sheet Highlights
• | Total loans increased $166.9 million, or 11.7%, from year-end 2019 to $1.6 billion at June 30, 2020. The increase was primarily due to $136.0 million in SBA PPP loan originations. |
• | Total deposits increased $233.3 million, or 18.7%, from year-end 2019 to $1.5 billion at June 30, 2020 primarily due to increased noninterest-bearing demand deposits, resulting from the distribution of PPP funds and a strategic increase in brokered time deposits in the prior sequential quarter. |
• | Borrowed funds decreased $60.0 million to $223.0 million at June 30, 2020. |
• | Shareholders’ equity was $166.6 million at June 30, 2020, an increase of $5.9 million from year-end 2019, due primarily to retained net income. During the second quarter, the Company repurchased 200,809 shares of common stock for a total cost of $2.8 million. Under its existing buyback program, the Company can repurchase up to an additional 313,651 shares. The timing and amount of additional purchases, if any, will depend upon a number of factors including the Company’s capital needs, the performance of its loan portfolio, the need for additional provisions for loan losses, whether related to the COVID-19 pandemic or otherwise, the market price of the Company’s stock and the general impact of the COVID-19 pandemic on the economy. |
• | Book value per common share was $15.53 as of June 30, 2020. |
• | At June 30, 2020, the Community Bank Leverage Ratio was 10.01%. |
• | Nonperforming assets were $10.2 million, which consisted of $6.2 million of residential mortgage loans. The allowance to total loans ratio was 1.27% at June 30, 2020. Net recoveries were $358 thousand for the quarter. |
Paycheck Protection Program Loans
As of June 30, 2020, the Company funded 1,217 Small Business Administration (“SBA”) Paycheck Protection Program loans. Executed by the SBA, under the Paycheck Protection Program, established by the U.S. Coronavirus Aid, Relief, and Economic Security (CARES) Act, the Company was able to assist numerous small businesses in continuing to pay expenses, including payroll to retain their staff. PPP loans booked have an annual interest rate of 1% and are 100% guaranteed by the SBA. Most of these loans have a two-year term.
Loan Deferrals
During the first and second quarters of 2020, the Bank prudently worked with borrowers that may be unable to meet their contractual obligations because of the effects of COVID-19. The loan deferrals have terms of 3 or 6 months. The table below summarizes loan deferrals as of June 30, 2020.
Total deferrals to total loan portfolio | |||||||||||
(In thousands, except percentages) | Total loan portfolio balance | Loan deferrals - unpaid principal balance | % of deferrals to total loans | ||||||||
SBA loans held for sale | $ | 10,602 | $ | — | —% | ||||||
SBA loans held for investment | 36,966 | — | — | ||||||||
SBA PPP loans | 136,039 | — | — | ||||||||
Commercial loans | 792,752 | 277,323 | 35 | ||||||||
Net residential mortgage loans* | 469,987 | 68,142 | 14 | ||||||||
Consumer loans | 146,161 | 9,144 | 6 | ||||||||
Total loans | $ | 1,592,507 | $ | 354,609 | 22 | % | |||||
* A total of $88.5 million in mortgage loan forbearances were requested. $21.8 million of these mortgage loan forbearances were in current payment status as of June 30, 2020, thus a net $66.7 million is reported above.
Commercial loan customer deferrals included a concentration in those industries more impacted by the pandemic including commercial strip malls, restaurants, transport services, hotels, gyms and beauty shops.
Consent Order
• | In July 2020, Unity Bank agreed to the issuance of a Consent Order by the Federal Deposit Insurance Corporation (“FDIC”) and agreed to an Acknowledgement and Consent of the FDIC Consent Order with the Commissioner of Banking and Insurance for the State of New Jersey. The Consent Order requires the Bank to strengthen its Bank Secrecy Act (“BSA”)/anti-money laundering (“AML”) program, and to address related matters. The Bank hired a consulting firm who it has been working with to effectively address all matters pertaining to the order. |
Other Highlights
• | American Banker magazine released its list of the top publicly traded community banks. There were 511 banks with total assets of less than $2 billion as of December 31, 2019, of which Unity Bank was ranked 15th nationally. Unity Bank has been on the list for five consecutive years. |
Unity Bancorp, Inc. is a financial service organization headquartered in Clinton, New Jersey, with approximately $1.9 billion in assets and $1.5 billion in deposits. Unity Bank provides financial services to retail, corporate and small business customers through its 19 retail service centers located in Bergen, Hunterdon, Middlesex, Somerset, Union and Warren Counties in New Jersey and Northampton County in Pennsylvania. For additional information about Unity, visit our website at www.unitybank.com , or call 800-618-BANK.
This news release contains certain forward-looking statements, either expressed or implied, which are provided to assist the
reader in understanding anticipated future financial performance. These statements may be identified by use of the words “believe”, “expect”, “intend”, “anticipate”, “estimate”, “project” or similar expressions. These statements involve certain risks, uncertainties, estimates and assumptions made by management, which are subject to factors beyond the company’s control and could impede its ability to achieve these goals. These factors include those items included in our Annual Report on Form 10-K under the heading “Item IA-Risk Factors” as well as general economic conditions, trends in interest rates, the ability of our borrowers to repay their loans, our ability to manage and reduce the level of our nonperforming assets, and results of regulatory exams, among other factors.
UNITY BANCORP, INC.
SUMMARY FINANCIAL HIGHLIGHTS
June 30, 2020
Jun 30, 2020 vs. | ||||||||||||||||||||
Mar 31, 2020 | Jun 30, 2019 | |||||||||||||||||||
(In thousands, except percentages and per share amounts) | Jun 30, 2020 | Mar 31, 2020 | Jun 30, 2019 | % | % | |||||||||||||||
BALANCE SHEET DATA: | ||||||||||||||||||||
Total assets | $ | 1,900,774 | $ | 1,740,076 | $ | 1,626,737 | 9.2 | % | 16.8 | % | ||||||||||
Total deposits | 1,483,457 | 1,378,618 | 1,264,353 | 7.6 | 17.3 | |||||||||||||||
Total loans | 1,592,507 | 1,439,645 | 1,344,757 | 10.6 | 18.4 | |||||||||||||||
Total securities | 54,888 | 58,002 | 62,122 | (5.4 | ) | (11.6 | ) | |||||||||||||
Total shareholders' equity | 166,607 | 164,305 | 149,383 | 1.4 | 11.5 | |||||||||||||||
Allowance for loan losses | (20,234 | ) | (17,376 | ) | (15,965 | ) | 16.4 | 26.7 | ||||||||||||
FINANCIAL DATA - QUARTER TO DATE: | ||||||||||||||||||||
Income before provision for income taxes | $ | 6,659 | $ | 6,966 | $ | 7,480 | (4.4 | ) | (11.0 | ) | ||||||||||
Provision for income taxes | 1,488 | 1,598 | 1,646 | (6.9 | ) | (9.6 | ) | |||||||||||||
Net income | $ | 5,171 | $ | 5,368 | $ | 5,834 | (3.7 | ) | (11.4 | ) | ||||||||||
Net income per common share - Basic | $ | 0.48 | $ | 0.49 | $ | 0.54 | (2.0 | ) | (11.1 | ) | ||||||||||
Net income per common share - Diluted | $ | 0.47 | $ | 0.49 | $ | 0.53 | (4.1 | ) | (11.3 | ) | ||||||||||
Performance ratios: | ||||||||||||||||||||
Return on average assets | 1.19 | % | 1.32 | % | 1.54 | % | ||||||||||||||
Return on average equity | 12.59 | % | 13.23 | % | 16.01 | % | ||||||||||||||
Efficiency ratio (1) | 50.27 | % | 51.92 | % | 53.20 | % | ||||||||||||||
Net interest margin | 3.73 | % | 3.92 | % | 3.96 | % | ||||||||||||||
Noninterest expense to average assets | 2.10 | % | 2.29 | % | 2.32 | % | ||||||||||||||
FINANCIAL DATA - YEAR TO DATE: | ||||||||||||||||||||
Income before provision for income taxes | $ | 13,625 | $ | 14,740 | (7.6 | ) | ||||||||||||||
Provision for income taxes | 3,086 | 3,166 | (2.5 | ) | ||||||||||||||||
Net income | $ | 10,539 | $ | 11,574 | (8.9 | ) | ||||||||||||||
Net income per common share - Basic | $ | 0.97 | $ | 1.07 | (9.3 | ) | ||||||||||||||
Net income per common share - Diluted | $ | 0.96 | $ | 1.05 | (8.6 | ) | ||||||||||||||
Performance ratios: | ||||||||||||||||||||
Return on average assets | 1.25 | % | 1.55 | % | (19.4 | ) | ||||||||||||||
Return on average equity | 12.91 | % | 16.26 | % | (20.6 | ) | ||||||||||||||
Efficiency ratio | 51.08 | % | 52.87 | % | (3.4 | ) | ||||||||||||||
Net interest margin | 3.82 | % | 4.01 | % | (4.7 | ) | ||||||||||||||
Noninterest expense to average assets | 2.19 | % | 2.31 | % | (5.2 | ) | ||||||||||||||
SHARE INFORMATION: | ||||||||||||||||||||
Market price per share | $ | 14.30 | $ | 11.70 | $ | 22.70 | 22.2 | (37.0 | ) | |||||||||||
Dividends paid | $ | 0.08 | $ | 0.08 | $ | 0.08 | — | — | ||||||||||||
Book value per common share | $ | 15.53 | $ | 15.10 | $ | 13.76 | 2.8 | 12.9 | ||||||||||||
Average diluted shares outstanding (QTD) | 10,888 | 11,037 | 11,026 | (1.4 | ) | (1.3 | ) | |||||||||||||
CAPITAL RATIOS: | ||||||||||||||||||||
Total equity to total assets | 8.77 | % | 9.44 | % | 9.18 | % | ||||||||||||||
Leverage ratio (2) | 10.01 | % | 10.56 | % | 10.36 | % | ||||||||||||||
CREDIT QUALITY AND RATIOS: | ||||||||||||||||||||
Nonperforming assets | $ | 10,184 | $ | 11,178 | $ | 5,336 | (8.9 | ) | 90.9 | |||||||||||
QTD net (recoveried) chargeoffs (annualized) to QTD average loans | (0.09 | ) | % | 0.15 | % | 0.02 | % | |||||||||||||
Allowance for loan losses to total loans | 1.27 | % | 1.21 | % | 1.19 | % | ||||||||||||||
Nonperforming assets to total loans | 0.59 | % | 0.67 | % | 0.33 | % | ||||||||||||||
Nonperforming assets to total assets | 0.54 | % | 0.64 | % | 0.33 | % | ||||||||||||||
(1) | The efficiency ratio is a non-GAAP measure that represents the ratio of non-interest expenses divided by the net-interest income and non-interest income. |
(2) | The Bank adopted the CBLR in the first quarter of 2020, and will therefore not be required to comply with the Basel III capital requirements. |
UNITY BANCORP, INC.
CONSOLIDATED BALANCE SHEETS
June 30, 2020
Jun 30, 2020 vs. | ||||||||||||||||||||
Mar 31, 2020 | Jun 30, 2019 | |||||||||||||||||||
(In thousands, except percentages) | Jun 30, 2020 | Mar 31, 2020 | Jun 30, 2019 | % | % | |||||||||||||||
ASSETS | ||||||||||||||||||||
Cash and due from banks | $ | 24,066 | $ | 21,106 | $ | 21,606 | 14.0 | % | 11.4 | % | ||||||||||
Federal funds sold, interest-bearing deposits and repos | 162,617 | 136,910 | 133,234 | 18.8 | 22.1 | |||||||||||||||
Cash and cash equivalents | 186,683 | 158,016 | 154,840 | 18.1 | 20.6 | |||||||||||||||
Securities: | ||||||||||||||||||||
Securities available for sale | 53,102 | 64,275 | 45,326 | (17.4 | ) | 17.2 | ||||||||||||||
Securities held to maturity | — | — | 14,450 | — | (100.0 | ) | ||||||||||||||
Equity securities | 1,786 | 2,289 | 2,346 | (22 | ) | (23.9 | ) | |||||||||||||
Total securities | 54,888 | 66,564 | 62,122 | (17.5 | ) | (11.6 | ) | |||||||||||||
Loans: | ||||||||||||||||||||
SBA loans held for sale | 10,602 | 13,529 | 9,118 | (21.6 | ) | 16.3 | ||||||||||||||
SBA loans held for investment | 36,966 | 35,767 | 37,608 | 3.4 | (1.7 | ) | ||||||||||||||
SBA PPP loans | 136,039 | — | — | 100.0 | 100.0 | |||||||||||||||
Commercial loans | 792,752 | 765,032 | 713,878 | 3.6 | 11.0 | |||||||||||||||
Residential mortgage loans | 469,987 | 467,706 | 449,604 | 0.5 | 4.5 | |||||||||||||||
Consumer loans | 146,161 | 143,524 | 134,549 | 1.8 | 8.6 | |||||||||||||||
Total loans | 1,592,507 | 1,425,558 | 1,344,757 | 11.7 | 18.4 | |||||||||||||||
Allowance for loan losses | (20,234 | ) | (16,395 | ) | (15,965 | ) | 23.4 | 26.7 | ||||||||||||
Net loans | 1,572,273 | 1,409,163 | 1,328,792 | 11.6 | 18.3 | |||||||||||||||
Premises and equipment, net | 20,751 | 21,315 | 22,813 | (2.6 | ) | (9.0 | ) | |||||||||||||
Bank owned life insurance ("BOLI") | 26,435 | 26,323 | 25,008 | 0.4 | 5.7 | |||||||||||||||
Deferred tax assets | 7,274 | 5,559 | 5,605 | 30.9 | 29.8 | |||||||||||||||
Federal Home Loan Bank ("FHLB") stock | 11,629 | 14,184 | 9,999 | (18.0 | ) | 16.3 | ||||||||||||||
Accrued interest receivable | 11,039 | 6,984 | 7,109 | 58.1 | 55.3 | |||||||||||||||
Other real estate owned ("OREO") | 711 | 1,723 | 921 | (58.7 | ) | (22.8 | ) | |||||||||||||
Goodwill | 1,516 | 1,516 | 1,516 | — | — | |||||||||||||||
Other assets | 7,575 | 7,595 | 8,012 | (0.3 | ) | (5.5 | ) | |||||||||||||
Total assets | $ | 1,900,774 | $ | 1,718,942 | $ | 1,626,737 | 10.6 | % | 16.8 | % | ||||||||||
LIABILITIES AND SHAREHOLDERS' EQUITY | ||||||||||||||||||||
Liabilities: | ||||||||||||||||||||
Deposits: | ||||||||||||||||||||
Noninterest-bearing demand | $ | 429,899 | $ | 279,793 | $ | 275,356 | 53.6 | % | 56.1 | % | ||||||||||
Interest-bearing demand | 172,950 | 176,335 | 157,850 | (1.9 | ) | 9.6 | ||||||||||||||
Savings | 408,416 | 389,795 | 389,999 | 4.8 | 4.7 | |||||||||||||||
Time Deposits | 472,192 | 404,191 | 441,148 | 16.8 | 7.0 | |||||||||||||||
Total deposits | 1,483,457 | 1,250,114 | 1,264,353 | 18.7 | 17.3 | |||||||||||||||
Borrowed funds | 223,000 | 283,000 | 190,000 | (21.2 | ) | 17.4 | ||||||||||||||
Subordinated debentures | 10,310 | 10,310 | 10,310 | — | — | |||||||||||||||
Accrued interest payable | 228 | 455 | 414 | (49.9 | ) | (44.9 | ) | |||||||||||||
Accrued expenses and other liabilities | 17,172 | 14,354 | 12,277 | 19.6 | 39.9 | |||||||||||||||
Total liabilities | 1,734,167 | 1,558,233 | 1,477,354 | 11.3 | 17.4 | |||||||||||||||
Shareholders' equity: | ||||||||||||||||||||
Common stock | 91,103 | 90,113 | 89,327 | 1.1 | 2.0 | |||||||||||||||
Retained earnings | 79,253 | 70,442 | 60,109 | 12.5 | 31.8 | |||||||||||||||
Treasury stock, at cost | (2,991 | ) | — | — | (100.0) | (100.0) | ||||||||||||||
Accumulated other comprehensive (loss) income | (758 | ) | 154 | (53 | ) | NM | NM | |||||||||||||
Total shareholders' equity | 166,607 | 160,709 | 149,383 | 3.7 | 11.5 | |||||||||||||||
Total liabilities and shareholders' equity | $ | 1,900,774 | $ | 1,718,942 | $ | 1,626,737 | 10.6 | % | 16.8 | % | ||||||||||
COMMON SHARES AT PERIOD END: | ||||||||||||||||||||
Shares issued | 10,939 | 10,881 | 10,856 | |||||||||||||||||
Shares oustanding | 10,728 | 10,881 | 10,856 | |||||||||||||||||
Treasury shares | 211 | — | — | |||||||||||||||||
NM=Not meaningful
UNITY BANCORP, INC.
QTD CONSOLIDATED STATEMENTS OF INCOME
June 30, 2020
Jun 30, 2020 vs. | ||||||||||||||||||||||||||||
For the three months ended | Mar 31, 2020 | Jun 30, 2019 | ||||||||||||||||||||||||||
(In thousands, except percentages and per share amounts) | Jun 30, 2020 | Mar 31, 2020 | Jun 30, 2019 | $ | % | $ | % | |||||||||||||||||||||
INTEREST INCOME | ||||||||||||||||||||||||||||
Federal funds sold and interest-bearing deposits | $ | 23 | $ | 188 | $ | 232 | $ | (165 | ) | (87.8 | )% | $ | (209 | ) | (90.1 | )% | ||||||||||||
FHLB stock | 79 | 109 | 77 | (30 | ) | (27.5 | ) | 2 | 2.6 | |||||||||||||||||||
Securities: | ||||||||||||||||||||||||||||
Taxable | 437 | 511 | 461 | (74 | ) | (14.5 | ) | (24 | ) | (5.2 | ) | |||||||||||||||||
Tax-exempt | 17 | 22 | 27 | (5 | ) | (22.7 | ) | (10 | ) | (37.0 | ) | |||||||||||||||||
Total securities | 454 | 533 | 488 | (79 | ) | (14.8 | ) | (34 | ) | (7.0 | ) | |||||||||||||||||
Loans: | ||||||||||||||||||||||||||||
SBA loans | 709 | 985 | 942 | (276 | ) | (28.0 | ) | (233 | ) | (24.7 | ) | |||||||||||||||||
SBA PPP loans | 723 | — | — | 723 | 100.0 | 723 | 100.0 | |||||||||||||||||||||
Commercial loans | 9,815 | 9,933 | 9,357 | (118 | ) | (1.2 | ) | 458 | 4.9 | |||||||||||||||||||
Residential mortgage loans | 5,554 | 5,770 | 5,535 | (216 | ) | (3.7 | ) | 19 | 0.3 | |||||||||||||||||||
Consumer loans | 1,921 | 2,067 | 2,150 | (146 | ) | (7.1 | ) | (229 | ) | (10.7 | ) | |||||||||||||||||
Total loans | 18,722 | 18,755 | 17,984 | (33 | ) | (0.2 | ) | 738 | 4.1 | |||||||||||||||||||
Total interest income | 19,278 | 19,585 | 18,781 | (307 | ) | (1.6 | ) | 497 | 2.6 | |||||||||||||||||||
INTEREST EXPENSE | ||||||||||||||||||||||||||||
Interest-bearing demand deposits | 364 | 478 | 442 | (114 | ) | (23.8 | ) | (78 | ) | (17.6 | ) | |||||||||||||||||
Savings deposits | 512 | 851 | 1,188 | (339 | ) | (39.8 | ) | (676 | ) | (56.9 | ) | |||||||||||||||||
Time deposits | 2,454 | 2,447 | 2,437 | 7 | 0.3 | 17 | 0.7 | |||||||||||||||||||||
Borrowed funds and subordinated debentures | 423 | 565 | 504 | (142 | ) | (25.1 | ) | (81 | ) | (16.1 | ) | |||||||||||||||||
Total interest expense | 3,753 | 4,341 | 4,571 | (588 | ) | (13.5 | ) | (818 | ) | (17.9 | ) | |||||||||||||||||
Net interest income | 15,525 | 15,244 | 14,210 | 281 | 1.8 | 1,315 | 9.3 | |||||||||||||||||||||
Provision for loan losses | 2,500 | 1,500 | 350 | 1,000 | 66.7 | 2,150 | 614.3 | |||||||||||||||||||||
Net interest income after provision for loan losses | 13,025 | 13,744 | 13,860 | (719 | ) | (5.2 | ) | (835 | ) | (6.0 | ) | |||||||||||||||||
NONINTEREST INCOME | ||||||||||||||||||||||||||||
Branch fee income | 207 | 317 | 378 | (110 | ) | (34.7 | ) | (171 | ) | (45.2 | ) | |||||||||||||||||
Service and loan fee income | 390 | 376 | 569 | 14 | 3.7 | (179 | ) | (31.5 | ) | |||||||||||||||||||
Gain on sale of SBA loans held for sale, net | 92 | 473 | 238 | (381 | ) | (80.5 | ) | (146 | ) | (61.3 | ) | |||||||||||||||||
Gain on sale of mortgage loans, net | 1,553 | 1,051 | 630 | 502 | 47.8 | 923 | 146.5 | |||||||||||||||||||||
BOLI income | 154 | 173 | 147 | (19 | ) | (11.0 | ) | 7 | 4.8 | |||||||||||||||||||
Net security (losses) gains | 79 | (170 | ) | 98 | 249 | 146.5 | (19 | ) | (19.4 | ) | ||||||||||||||||||
Other income | 336 | 325 | 351 | 11 | 3.4 | (15 | ) | (4.3 | ) | |||||||||||||||||||
Total noninterest income | 2,811 | 2,545 | 2,411 | 266 | 10.5 | 400 | 16.6 | |||||||||||||||||||||
NONINTEREST EXPENSE | ||||||||||||||||||||||||||||
Compensation and benefits | 5,553 | 5,439 | 5,186 | 114 | 2.1 | 367 | 7.1 | |||||||||||||||||||||
Processing and communications | 769 | 708 | 748 | 61 | 8.6 | 21 | 2.8 | |||||||||||||||||||||
Furniture and equipment | 641 | 655 | 718 | (14 | ) | (2.1 | ) | (77 | ) | (10.7 | ) | |||||||||||||||||
Occupancy | 630 | 624 | 653 | 6 | 1.0 | (23 | ) | (3.5 | ) | |||||||||||||||||||
BSA expenses | 488 | 63 | — | 425 | 674.6 | 488 | 100.0 | |||||||||||||||||||||
Professional services | 261 | 269 | 277 | (8 | ) | (3.0 | ) | (16 | ) | (5.8 | ) | |||||||||||||||||
Advertising | 207 | 290 | 374 | (83 | ) | (28.6 | ) | (167 | ) | (44.7 | ) | |||||||||||||||||
Other loan expenses | 168 | 89 | 67 | 79 | 88.8 | 101 | 150.7 | |||||||||||||||||||||
Deposit insurance | 159 | 88 | 134 | 71 | 80.7 | 25 | 18.7 | |||||||||||||||||||||
Director fees | 181 | 200 | 164 | (19 | ) | (9.5 | ) | 17 | 10.4 | |||||||||||||||||||
Loan collection & OREO expenses | 1 | 186 | (10 | ) | (185 | ) | (99.5 | ) | 11 | 110.0 | ||||||||||||||||||
Other expenses | 119 | 712 | 480 | (593 | ) | (83.3 | ) | (361 | ) | (75.2 | ) | |||||||||||||||||
Total noninterest expense | 9,177 | 9,323 | 8,791 | (146 | ) | (1.6 | ) | 386 | 4.4 | |||||||||||||||||||
Income before provision for income taxes | 6,659 | 6,966 | 7,480 | (307 | ) | (4.4 | ) | (821 | ) | (11.0 | ) | |||||||||||||||||
Provision for income taxes | 1,488 | 1,598 | 1,646 | (110 | ) | (6.9 | ) | (158 | ) | (9.6 | ) | |||||||||||||||||
Net income | $ | 5,171 | $ | 5,368 | $ | 5,834 | $ | (197 | ) | (3.7 | )% | $ | (663 | ) | (11.4 | )% | ||||||||||||
Effective tax rate | 22.3 | % | 22.9 | % | 22.0 | % | ||||||||||||||||||||||
Net income per common share - Basic | $ | 0.48 | $ | 0.49 | $ | 0.54 | ||||||||||||||||||||||
Net income per common share - Diluted | $ | 0.47 | $ | 0.49 | $ | 0.53 | ||||||||||||||||||||||
Weighted average common shares outstanding - Basic | 10,792 | 10,883 | 10,843 | |||||||||||||||||||||||||
Weighted average common shares outstanding - Diluted | 10,888 | 11,037 | 11,026 | |||||||||||||||||||||||||
UNITY BANCORP, INC.
YTD CONSOLIDATED STATEMENTS OF INCOME
June 30, 2020
For the six months ended June 30, | Current YTD vs. Prior YTD | ||||||||||||||||
(In thousands, except percentages and per share amounts) | 2020 | 2019 | $ | % | |||||||||||||
INTEREST INCOME | |||||||||||||||||
Federal funds sold and interest-bearing deposits | $ | 212 | $ | 453 | $ | (241 | ) | (53.2 | )% | ||||||||
FHLB stock | 188 | 193 | (5 | ) | (2.6 | ) | |||||||||||
Securities: | |||||||||||||||||
Taxable | 948 | 937 | 11 | 1.2 | |||||||||||||
Tax-exempt | 39 | 55 | (16 | ) | (29.1 | ) | |||||||||||
Total securities | 987 | 992 | (5 | ) | (0.5 | ) | |||||||||||
Loans: | |||||||||||||||||
SBA loans | 1,694 | 1,937 | (243 | ) | (12.5 | ) | |||||||||||
SBA PPP loans | 723 | — | 723 | 100.0 | |||||||||||||
Commercial loans | 19,748 | 18,426 | 1,322 | 7.2 | |||||||||||||
Residential mortgage loans | 11,324 | 11,095 | 229 | 2.1 | |||||||||||||
Consumer loans | 3,988 | 4,185 | (197 | ) | (4.7 | ) | |||||||||||
Total loans | 37,477 | 35,643 | 1,834 | 5.1 | |||||||||||||
Total interest income | 38,864 | 37,281 | 1,583 | 4.2 | |||||||||||||
INTEREST EXPENSE | |||||||||||||||||
Interest-bearing demand deposits | 842 | 851 | (9 | ) | (1.1 | ) | |||||||||||
Savings deposits | 1,363 | 2,306 | (943 | ) | (40.9 | ) | |||||||||||
Time deposits | 4,900 | 4,445 | 455 | 10.2 | |||||||||||||
Borrowed funds and subordinated debentures | 989 | 1,253 | (264 | ) | (21.1 | ) | |||||||||||
Total interest expense | 8,094 | 8,855 | (761 | ) | (8.6 | ) | |||||||||||
Net interest income | 30,770 | 28,426 | 2,344 | 8.2 | |||||||||||||
Provision for loan losses | 4,000 | 850 | 3,150 | 370.6 | |||||||||||||
Net interest income after provision for loan losses | 26,770 | 27,576 | (806 | ) | (2.9 | ) | |||||||||||
NONINTEREST INCOME | |||||||||||||||||
Branch fee income | 523 | 746 | (223 | ) | (29.9 | ) | |||||||||||
Service and loan fee income | 766 | 1,011 | (245 | ) | (24.2 | ) | |||||||||||
Gain on sale of SBA loans held for sale, net | 565 | 554 | 11 | 2.0 | |||||||||||||
Gain on sale of mortgage loans, net | 2,604 | 980 | 1,624 | 165.7 | |||||||||||||
BOLI income | 327 | 297 | 30 | 10.1 | |||||||||||||
Net security (losses) gains | (91 | ) | 198 | (289 | ) | (146.0 | ) | ||||||||||
Other income | 662 | 647 | 15 | 2.3 | |||||||||||||
Total noninterest income | 5,356 | 4,433 | 923 | 20.8 | |||||||||||||
NONINTEREST EXPENSE | |||||||||||||||||
Compensation and benefits | 10,992 | 10,030 | 962 | 9.6 | |||||||||||||
Processing and communications | 1,477 | 1,464 | 13 | 0.9 | |||||||||||||
Furniture and equipment | 1,296 | 1,377 | (81 | ) | (5.9 | ) | |||||||||||
Occupancy | 1,253 | 1,346 | (93 | ) | (6.9 | ) | |||||||||||
BSA expenses | 550 | — | 550 | 100.0 | |||||||||||||
Professional services | 531 | 565 | (34 | ) | (6.0 | ) | |||||||||||
Advertising | 497 | 722 | (225 | ) | (31.2 | ) | |||||||||||
Director fees | 381 | 328 | 53 | 16.2 | |||||||||||||
Other loan expenses | 257 | 113 | 144 | 127.4 | |||||||||||||
Deposit insurance | 247 | 301 | (54 | ) | (17.9 | ) | |||||||||||
Loan collection & OREO expenses | 187 | 57 | 130 | 228.1 | |||||||||||||
Other expenses | 833 | 966 | (133 | ) | (13.8 | ) | |||||||||||
Total noninterest expense | 18,501 | 17,269 | 1,232 | 7.1 | |||||||||||||
Income before provision for income taxes | 13,625 | 14,740 | (1,115 | ) | (7.6 | ) | |||||||||||
Provision for income taxes | 3,086 | 3,166 | (80 | ) | (2.5 | ) | |||||||||||
Net income | $ | 10,539 | $ | 11,574 | $ | (1,035 | ) | (8.9 | )% | ||||||||
Effective tax rate | 22.6 | % | 21.5 | % | |||||||||||||
Net income per common share - Basic | $ | 0.97 | $ | 1.07 | |||||||||||||
Net income per common share - Diluted | $ | 0.96 | $ | 1.05 | |||||||||||||
Weighted average common shares outstanding - Basic | 10,838 | 10,822 | |||||||||||||||
Weighted average common shares outstanding - Diluted | 10,962 | 11,011 | |||||||||||||||
UNITY BANCORP, INC.
QUARTER TO DATE NET INTEREST MARGIN
June 30, 2020
(Dollar amounts in thousands, interest amounts and interest rates/yields on a fully tax-equivalent basis) | ||||||||||||||||||||||
For the three months ended | ||||||||||||||||||||||
June 30, 2020 | June 30, 2019 | |||||||||||||||||||||
Average Balance | Interest | Rate/Yield | Average Balance | Interest | Rate/Yield | |||||||||||||||||
ASSETS | ||||||||||||||||||||||
Interest-earning assets: | ||||||||||||||||||||||
Federal funds sold, interest-bearing deposits and repos | $ | 73,899 | $ | 23 | 0.13 | % | $ | 39,103 | $ | 232 | 2.38 | % | ||||||||||
FHLB stock | 5,976 | 79 | 5.32 | 5,236 | 77 | 5.90 | ||||||||||||||||
Securities: | ||||||||||||||||||||||
Taxable | 53,592 | 437 | 3.28 | 57,939 | 461 | 3.19 | ||||||||||||||||
Tax-exempt | 3,534 | 21 | 2.39 | 4,470 | 33 | 2.96 | ||||||||||||||||
Total securities (A) | 57,126 | 458 | 3.22 | 62,409 | 494 | 3.17 | ||||||||||||||||
Loans: | ||||||||||||||||||||||
SBA loans | 47,964 | 709 | 5.95 | 47,542 | 942 | 7.95 | ||||||||||||||||
SBA PPP loans | 100,586 | 723 | 2.89 | — | — | — | ||||||||||||||||
Commercial loans | 783,962 | 9,815 | 5.04 | 707,022 | 9,357 | 5.31 | ||||||||||||||||
Residential mortgage loans | 461,156 | 5,554 | 4.84 | 445,315 | 5,535 | 4.99 | ||||||||||||||||
Consumer loans | 145,970 | 1,921 | 5.29 | 132,804 | 2,150 | 6.49 | ||||||||||||||||
Total loans (B) | 1,539,638 | 18,722 | 4.89 | 1,332,683 | 17,984 | 5.41 | ||||||||||||||||
Total interest-earning assets | $ | 1,676,639 | $ | 19,282 | 4.63 | % | $ | 1,439,431 | $ | 18,787 | 5.24 | % | ||||||||||
Noninterest-earning assets: | ||||||||||||||||||||||
Cash and due from banks | 20,698 | 24,625 | ||||||||||||||||||||
Allowance for loan losses | (17,909 | ) | (15,955 | ) | ||||||||||||||||||
Other assets | 74,076 | 69,663 | ||||||||||||||||||||
Total noninterest-earning assets | 76,865 | 78,333 | ||||||||||||||||||||
Total assets | $ | 1,753,504 | $ | 1,517,764 | ||||||||||||||||||
LIABILITIES AND SHAREHOLDERS' EQUITY | ||||||||||||||||||||||
Interest-bearing liabilities: | ||||||||||||||||||||||
Total interest-bearing demand deposits | $ | 181,943 | $ | 364 | 0.80 | % | $ | 174,391 | $ | 442 | 1.02 | % | ||||||||||
Total savings deposits | 403,389 | 512 | 0.51 | 395,185 | 1,188 | 1.21 | ||||||||||||||||
Total time deposits | 482,734 | 2,454 | 2.04 | 422,458 | 2,437 | 2.31 | ||||||||||||||||
Total interest-bearing deposits | 1,068,066 | 3,330 | 1.25 | 992,034 | 4,067 | 1.64 | ||||||||||||||||
Borrowed funds and subordinated debentures | 107,761 | 423 | 1.58 | 94,568 | 504 | 2.14 | ||||||||||||||||
Total interest-bearing liabilities | $ | 1,175,827 | $ | 3,753 | 1.28 | % | $ | 1,086,602 | $ | 4,571 | 1.69 | % | ||||||||||
Noninterest-bearing liabilities: | ||||||||||||||||||||||
Noninterest-bearing demand deposits | 394,723 | 271,359 | ||||||||||||||||||||
Other liabilities | 17,682 | 13,697 | ||||||||||||||||||||
Total noninterest-bearing liabilities | 412,405 | 285,056 | ||||||||||||||||||||
Total shareholders' equity | 165,272 | 146,106 | ||||||||||||||||||||
Total liabilities and shareholders' equity | $ | 1,753,504 | $ | 1,517,764 | ||||||||||||||||||
Net interest spread | $ | 15,529 | 3.35 | % | $ | 14,216 | 3.55 | % | ||||||||||||||
Tax-equivalent basis adjustment | (4 | ) | (6 | ) | ||||||||||||||||||
Net interest income | $ | 15,525 | $ | 14,210 | ||||||||||||||||||
Net interest margin | 3.73 | % | 3.96 | % | ||||||||||||||||||
(A) | Yields related to securities exempt from federal and state income taxes are stated on a fully tax-equivalent basis. They are reduced by the nondeductable portion of interest expense, assuming a federal tax rate of 21 percent and applicable state rates. |
(B) | The loan averages are stated net of unearned income, and the averages include loans on which the accrual of interest has been discontinued. |
UNITY BANCORP, INC.
QUARTER TO DATE NET INTEREST MARGIN
June 30, 2020
(Dollar amounts in thousands, interest amounts and interest rates/yields on a fully tax-equivalent basis) | ||||||||||||||||||||||
For the three months ended | ||||||||||||||||||||||
June 30, 2020 | March 31, 2020 | |||||||||||||||||||||
Average Balance | Interest | Rate/Yield | Average Balance | Interest | Rate/Yield | |||||||||||||||||
ASSETS | ||||||||||||||||||||||
Interest-earning assets: | ||||||||||||||||||||||
Federal funds sold and interest-bearing deposits | $ | 73,899 | $ | 23 | 0.13 | % | $ | 69,076 | $ | 188 | 1.09 | % | ||||||||||
FHLB stock | 5,976 | 79 | 5.32 | 6,883 | 109 | 6.37 | ||||||||||||||||
Securities: | ||||||||||||||||||||||
Taxable | 53,592 | 437 | 3.28 | 60,363 | 511 | 3.40 | ||||||||||||||||
Tax-exempt | 3,534 | 21 | 2.39 | 3,783 | 27 | 2.87 | ||||||||||||||||
Total securities (A) | 57,126 | 458 | 3.22 | 64,146 | 538 | 3.38 | ||||||||||||||||
Loans: | ||||||||||||||||||||||
SBA loans | 47,964 | 709 | 5.95 | 50,528 | 985 | 7.84 | ||||||||||||||||
SBA PPP loans | 100,586 | 723 | 2.89 | — | — | — | ||||||||||||||||
Commercial loans | 783,962 | 9,815 | 5.04 | 769,497 | 9,933 | 5.19 | ||||||||||||||||
Residential mortgage loans | 461,156 | 5,554 | 4.84 | 462,748 | 5,770 | 5.02 | ||||||||||||||||
Consumer loans | 145,970 | 1,921 | 5.29 | 142,284 | 2,067 | 5.84 | ||||||||||||||||
Total loans (B) | 1,539,638 | 18,722 | 4.89 | 1,425,057 | 18,755 | 5.29 | ||||||||||||||||
Total interest-earning assets | $ | 1,676,639 | $ | 19,282 | 4.63 | % | $ | 1,565,162 | $ | 19,590 | 5.03 | % | ||||||||||
Noninterest-earning assets: | ||||||||||||||||||||||
Cash and due from banks | 20,698 | 21,942 | ||||||||||||||||||||
Allowance for loan losses | (17,909 | ) | (16,698 | ) | ||||||||||||||||||
Other assets | 74,076 | 70,381 | ||||||||||||||||||||
Total noninterest-earning assets | 76,865 | 75,625 | ||||||||||||||||||||
Total assets | $ | 1,753,504 | $ | 1,640,787 | ||||||||||||||||||
LIABILITIES AND SHAREHOLDERS' EQUITY | ||||||||||||||||||||||
Interest-bearing liabilities: | ||||||||||||||||||||||
Total interest-bearing demand deposits | $ | 181,943 | $ | 364 | 0.80 | % | $ | 193,016 | $ | 478 | 1.00 | % | ||||||||||
Total savings deposits | 403,389 | 512 | 0.51 | 394,082 | 851 | 0.87 | ||||||||||||||||
Total time deposits | 482,734 | 2,454 | 2.04 | 435,705 | 2,447 | 2.26 | ||||||||||||||||
Total interest-bearing deposits | 1,068,066 | 3,330 | 1.25 | 1,022,803 | 3,776 | 1.48 | ||||||||||||||||
Borrowed funds and subordinated debentures | 107,761 | 423 | 1.58 | 131,057 | 565 | 1.73 | ||||||||||||||||
Total interest-bearing liabilities | $ | 1,175,827 | $ | 3,753 | 1.28 | % | $ | 1,153,860 | $ | 4,341 | 1.51 | % | ||||||||||
Noninterest-bearing liabilities: | ||||||||||||||||||||||
Noninterest-bearing demand deposits | 394,723 | 307,683 | ||||||||||||||||||||
Other liabilities | 17,682 | 16,101 | ||||||||||||||||||||
Total noninterest-bearing liabilities | 412,405 | 323,784 | ||||||||||||||||||||
Total shareholders' equity | 165,272 | 163,143 | ||||||||||||||||||||
Total liabilities and shareholders' equity | $ | 1,753,504 | $ | 1,640,787 | ||||||||||||||||||
Net interest spread | $ | 15,529 | 3.35 | % | $ | 15,249 | 3.52 | % | ||||||||||||||
Tax-equivalent basis adjustment | (4 | ) | (5 | ) | ||||||||||||||||||
Net interest income | $ | 15,525 | $ | 15,244 | ||||||||||||||||||
Net interest margin | 3.73 | % | 3.92 | % | ||||||||||||||||||
(A) | Yields related to securities exempt from federal and state income taxes are stated on a fully tax-equivalent basis. They are reduced by the nondeductable portion of interest expense, assuming a federal tax rate of 21 percent and applicable state rates. |
(B) | The loan averages are stated net of unearned income, and the averages include loans on which the accrual of interest has been discontinued. |
UNITY BANCORP, INC.
YEAR TO DATE NET INTEREST MARGIN
June 30, 2020
(Dollar amounts in thousands, interest amounts and interest rates/yields on a fully tax-equivalent basis) | ||||||||||||||||||||||
For the six months ended | ||||||||||||||||||||||
June 30, 2020 | June 30, 2019 | |||||||||||||||||||||
Average Balance | Interest | Rate/Yield | Average Balance | Interest | Rate/Yield | |||||||||||||||||
ASSETS | ||||||||||||||||||||||
Interest-earning assets: | ||||||||||||||||||||||
Federal funds sold, interest-bearing deposits and repos | $ | 71,548 | $ | 212 | 0.60 | % | $ | 38,588 | $ | 453 | 2.37 | % | ||||||||||
FHLB stock | 6,429 | 188 | 5.88 | 6,089 | 193 | 6.39 | ||||||||||||||||
Securities: | ||||||||||||||||||||||
Taxable | 56,917 | 948 | 3.35 | 58,334 | 937 | 3.24 | ||||||||||||||||
Tax-exempt | 3,659 | 49 | 2.69 | 4,529 | 68 | 3.03 | ||||||||||||||||
Total securities (A) | 60,576 | 997 | 3.31 | 62,863 | 1,005 | 3.22 | ||||||||||||||||
Loans: | ||||||||||||||||||||||
SBA loans | 49,127 | 1,694 | 6.93 | 48,772 | 1,937 | 8.01 | ||||||||||||||||
SBA PPP loans | 50,412 | 723 | 2.88 | — | — | — | ||||||||||||||||
Commercial loans | 776,729 | 19,748 | 5.11 | 702,465 | 18,426 | 5.29 | ||||||||||||||||
Residential mortgage loans | 461,952 | 11,324 | 4.93 | 442,628 | 11,095 | 5.05 | ||||||||||||||||
Consumer loans | 144,127 | 3,988 | 5.56 | 129,414 | 4,185 | 6.52 | ||||||||||||||||
Total loans (B) | 1,482,347 | 37,477 | 5.08 | 1,323,279 | 35,643 | 5.43 | ||||||||||||||||
Total interest-earning assets | $ | 1,620,900 | $ | 38,874 | 4.82 | % | $ | 1,430,819 | $ | 37,294 | 5.26 | % | ||||||||||
Noninterest-earning assets: | ||||||||||||||||||||||
Cash and due from banks | 21,320 | 25,361 | ||||||||||||||||||||
Allowance for loan losses | (17,303 | ) | (15,855 | ) | ||||||||||||||||||
Other assets | 72,228 | 70,118 | ||||||||||||||||||||
Total noninterest-earning assets | 76,245 | 79,624 | ||||||||||||||||||||
Total assets | $ | 1,697,145 | $ | 1,510,443 | ||||||||||||||||||
LIABILITIES AND SHAREHOLDERS' EQUITY | ||||||||||||||||||||||
Interest-bearing liabilities: | ||||||||||||||||||||||
Total interest-bearing demand deposits | $ | 187,480 | $ | 842 | 0.90 | % | $ | 178,214 | $ | 851 | 0.96 | % | ||||||||||
Total savings deposits | 398,736 | 1,363 | 0.69 | 396,191 | 2,306 | 1.17 | ||||||||||||||||
Total time deposits | 459,218 | 4,900 | 2.15 | 396,868 | 4,445 | 2.26 | ||||||||||||||||
Total interest-bearing deposits | 1,045,434 | 7,105 | 1.37 | 971,273 | 7,602 | 1.58 | ||||||||||||||||
Borrowed funds and subordinated debentures | 119,409 | 989 | 1.67 | 114,611 | 1,253 | 2.20 | ||||||||||||||||
Total interest-bearing liabilities | $ | 1,164,843 | $ | 8,094 | 1.40 | % | $ | 1,085,884 | $ | 8,855 | 1.65 | % | ||||||||||
Noninterest-bearing liabilities: | ||||||||||||||||||||||
Noninterest-bearing demand deposits | 351,203 | 267,035 | ||||||||||||||||||||
Other liabilities | 16,891 | 14,010 | ||||||||||||||||||||
Total noninterest-bearing liabilities | 368,094 | 281,045 | ||||||||||||||||||||
Total shareholders' equity | 164,208 | 143,514 | ||||||||||||||||||||
Total liabilities and shareholders' equity | $ | 1,697,145 | $ | 1,510,443 | ||||||||||||||||||
Net interest spread | $ | 30,780 | 3.42 | % | $ | 28,439 | 3.61 | % | ||||||||||||||
Tax-equivalent basis adjustment | (10 | ) | (13 | ) | ||||||||||||||||||
Net interest income | $ | 30,770 | $ | 28,426 | ||||||||||||||||||
Net interest margin | 3.82 | % | 4.01 | % | ||||||||||||||||||
(A) | Yields related to securities exempt from federal and state income taxes are stated on a fully tax-equivalent basis. They are reduced by the nondeductable portion of interest expense, assuming a federal tax rate of 21 percent and applicable state rates. |
(B) | The loan averages are stated net of unearned income, and the averages include loans on which the accrual of interest has been discontinued. |
UNITY BANCORP, INC.
QUARTERLY ALLOWANCE FOR LOAN LOSSES AND LOAN QUALITY SCHEDULES
June 30, 2020
Amounts in thousands, except percentages | Jun 30, 2020 | Mar 31, 2020 | Dec 31, 2019 | Sep 30, 2019 | Jun 30, 2019 | |||||||||||||||
ALLOWANCE FOR LOAN LOSSES: | ||||||||||||||||||||
Balance, beginning of period | $ | 17,376 | $ | 16,395 | $ | 16,002 | $ | 15,965 | $ | 15,684 | ||||||||||
Provision for loan losses charged to expense | 2,500 | 1,500 | 500 | 750 | 350 | |||||||||||||||
19,876 | 17,895 | 16,502 | 16,715 | 16,034 | ||||||||||||||||
Less: Chargeoffs | ||||||||||||||||||||
SBA loans | — | 25 | 43 | 99 | 84 | |||||||||||||||
Commercial loans | 219 | 300 | — | 500 | — | |||||||||||||||
Residential mortgage loans | — | 200 | 75 | 130 | — | |||||||||||||||
Consumer loans | — | — | — | — | — | |||||||||||||||
Total chargeoffs | 219 | 525 | 118 | 729 | 84 | |||||||||||||||
Add: Recoveries | ||||||||||||||||||||
SBA loans | 75 | 5 | 7 | 13 | 1 | |||||||||||||||
Commercial loans | 502 | 1 | 4 | 3 | 4 | |||||||||||||||
Residential mortgage loans | — | — | — | — | — | |||||||||||||||
Consumer loans | — | — | — | — | 10 | |||||||||||||||
Total recoveries | 577 | 6 | 11 | 16 | 15 | |||||||||||||||
Net (recoveries) chargeoffs | (358 | ) | 519 | 107 | 713 | 69 | ||||||||||||||
Balance, end of period | $ | 20,234 | $ | 17,376 | $ | 16,395 | $ | 16,002 | $ | 15,965 | ||||||||||
LOAN QUALITY INFORMATION: | ||||||||||||||||||||
Nonperforming loans: | ||||||||||||||||||||
SBA loans | $ | 2,363 | $ | 1,627 | $ | 1,164 | $ | 503 | $ | 437 | ||||||||||
Commercial loans | 413 | 613 | 529 | 629 | 54 | |||||||||||||||
Residential mortgage loans | 6,192 | 6,910 | 3,936 | 4,427 | 3,924 | |||||||||||||||
Consumer loans | 505 | 505 | 20 | 23 | — | |||||||||||||||
Total nonperforming loans (1) | 9,473 | 9,655 | 5,649 | 5,582 | 4,415 | |||||||||||||||
Other real estate owned ("OREO") | 711 | 1,523 | 1,723 | 1,723 | 921 | |||||||||||||||
Nonperforming assets | 10,184 | 11,178 | 7,372 | 7,305 | 5,336 | |||||||||||||||
Less: Amount guaranteed by SBA | 307 | 427 | 59 | 63 | 68 | |||||||||||||||
Net nonperforming assets | $ | 9,877 | $ | 10,751 | $ | 7,313 | $ | 7,242 | $ | 5,268 | ||||||||||
Loans 90 days past due & still accruing | $ | — | $ | — | $ | 930 | $ | 140 | $ | — | ||||||||||
Performing Troubled Debt Restructurings (TDRs) | $ | 684 | $ | 694 | $ | 705 | $ | 718 | $ | 728 | ||||||||||
Allowance for loan losses to: | ||||||||||||||||||||
Total loans at quarter end | 1.27 | % | 1.21 | % | 1.15 | % | 1.17 | % | 1.19 | % | ||||||||||
Nonperforming loans (1) | 213.60 | 179.97 | 290.23 | 286.67 | 361.61 | |||||||||||||||
Nonperforming assets | 198.68 | 155.45 | 222.40 | 219.06 | 299.19 | |||||||||||||||
Net nonperforming assets | 204.86 | 161.62 | 224.19 | 220.96 | 303.06 | |||||||||||||||
QTD net chargeoffs (recoveries) (annualized) to QTD average loans: | ||||||||||||||||||||
SBA loans | (0.20 | )% | 0.16 | % | 0.29 | % | 0.72 | % | 0.70 | % | ||||||||||
Commercial loans | (0.15 | ) | 0.16 | — | 0.28 | — | ||||||||||||||
Residential mortgage loans | — | 0.17 | 0.06 | 0.11 | — | |||||||||||||||
Consumer loans | — | — | — | — | (0.03 | ) | ||||||||||||||
Total loans | (0.09 | )% | 0.15 | % | 0.03 | % | 0.21 | % | 0.02 | % | ||||||||||
Nonperforming loans to total loans | 0.59 | % | 0.67 | % | 0.40 | % | 0.41 | % | 0.33 | % | ||||||||||
Nonperforming assets to total assets | 0.54 | 0.64 | 0.43 | 0.44 | 0.33 | |||||||||||||||
UNITY BANCORP, INC.
QUARTERLY FINANCIAL DATA
June 30, 2020
(In thousands, except percentages and per share amounts) | Jun 30, 2020 | Mar 31, 2020 | Dec 31, 2019 | Sep 30, 2019 | Jun 30, 2019 | |||||||||||||||
SUMMARY OF INCOME: | ||||||||||||||||||||
Total interest income | $ | 19,278 | $ | 19,585 | $ | 19,312 | $ | 19,055 | $ | 18,781 | ||||||||||
Total interest expense | 3,753 | 4,341 | 4,549 | 4,651 | 4,571 | |||||||||||||||
Net interest income | 15,525 | 15,244 | 14,763 | 14,404 | 14,210 | |||||||||||||||
Provision for loan losses | 2,500 | 1,500 | 500 | 750 | 350 | |||||||||||||||
Net interest income after provision for loan losses | 13,025 | 13,744 | 14,263 | 13,654 | 13,860 | |||||||||||||||
Total noninterest income | 2,811 | 2,545 | 2,396 | 2,710 | 2,411 | |||||||||||||||
Total noninterest expense | 9,177 | 9,323 | 8,719 | 8,729 | 8,791 | |||||||||||||||
Income before provision for income taxes | 6,659 | 6,966 | 7,940 | 7,635 | 7,480 | |||||||||||||||
Provision for income taxes | 1,488 | 1,598 | 1,820 | 1,676 | 1,646 | |||||||||||||||
Net income | $ | 5,171 | $ | 5,368 | $ | 6,120 | $ | 5,959 | $ | 5,834 | ||||||||||
Net income per common share - Basic | $ | 0.48 | $ | 0.49 | $ | 0.56 | $ | 0.55 | $ | 0.54 | ||||||||||
Net income per common share - Diluted | $ | 0.47 | $ | 0.49 | $ | 0.55 | $ | 0.54 | $ | 0.53 | ||||||||||
COMMON SHARE DATA: | ||||||||||||||||||||
Market price per share | $ | 14.30 | $ | 11.70 | $ | 22.57 | $ | 22.15 | $ | 22.70 | ||||||||||
Dividends paid | $ | 0.08 | $ | 0.08 | $ | 0.08 | $ | 0.08 | $ | 0.08 | ||||||||||
Book value per common share | $ | 15.53 | $ | 15.10 | $ | 14.77 | $ | 14.25 | $ | 13.76 | ||||||||||
Weighted average common shares outstanding - Basic | 10,792 | 10,883 | 10,872 | 10,863 | 10,843 | |||||||||||||||
Weighted average common shares outstanding - Diluted | 10,888 | 11,037 | 11,057 | 11,036 | 11,026 | |||||||||||||||
Issued common shares | 10,939 | 10,894 | 10,881 | 10,869 | 10,856 | |||||||||||||||
Outstanding common shares | 10,728 | 10,883 | 10,881 | 10,869 | 10,856 | |||||||||||||||
Treasury shares | 211 | 11 | — | — | — | |||||||||||||||
PERFORMANCE RATIOS (Annualized): | ||||||||||||||||||||
Return on average assets | 1.19 | % | 1.32 | % | 1.53 | % | 1.53 | % | 1.54 | % | ||||||||||
Return on average equity | 12.59 | 13.23 | 15.41 | 15.57 | 16.01 | |||||||||||||||
Efficiency ratio (1) | 50.27 | 51.92 | 51.29 | 51.06 | 53.20 | |||||||||||||||
Noninterest expense to average assets | 2.10 | 2.29 | 2.17 | 2.24 | 2.32 | |||||||||||||||
BALANCE SHEET DATA: | ||||||||||||||||||||
Total assets | 1,900,774 | 1,740,076 | 1,718,942 | 1,664,308 | 1,626,737 | |||||||||||||||
Total deposits | 1,483,457 | 1,378,618 | 1,250,114 | 1,273,362 | 1,264,353 | |||||||||||||||
Total loans | 1,592,507 | 1,439,645 | 1,425,558 | 1,368,474 | 1,344,757 | |||||||||||||||
Total securities | 54,888 | 58,002 | 66,564 | 63,991 | 62,122 | |||||||||||||||
Total shareholders' equity | 166,607 | 164,305 | 160,709 | 154,884 | 149,383 | |||||||||||||||
Allowance for loan losses | (20,234 | ) | (17,376 | ) | (16,395 | ) | (16,002 | ) | (15,965 | ) | ||||||||||
TAX EQUIVALENT YIELDS AND RATES: | ||||||||||||||||||||
Interest-earning assets | 4.63 | % | 5.03 | % | 5.07 | % | 5.16 | % | 5.24 | % | ||||||||||
Interest-bearing liabilities | 1.28 | 1.51 | 1.59 | 1.68 | 1.69 | |||||||||||||||
Net interest spread | 3.35 | 3.53 | 3.48 | 3.48 | 3.55 | |||||||||||||||
Net interest margin | 3.73 | 3.92 | 3.88 | 3.90 | 3.96 | |||||||||||||||
CREDIT QUALITY: | ||||||||||||||||||||
Nonperforming assets | 10,184 | 11,178 | 7,372 | 7,305 | 5,336 | |||||||||||||||
QTD net chargeoffs (annualized) to QTD average loans | (0.09 | )% | 0.15 | % | 0.03 | % | 0.21 | % | 0.02 | % | ||||||||||
Allowance for loan losses to total loans | 1.27 | 1.21 | 1.15 | 1.17 | 1.19 | |||||||||||||||
Nonperforming assets to total loans | 0.59 | 0.67 | 0.40 | 0.41 | 0.33 | |||||||||||||||
Nonperforming assets to total assets | 0.54 | 0.64 | 0.43 | 0.44 | 0.33 | |||||||||||||||
(In thousands, except percentages and per share amounts) | Jun 30, 2020 | Mar 31, 2020 | Dec 31, 2019 | Sep 30, 2019 | Jun 30, 2019 | |||||||||||||||
CAPITAL RATIOS AND OTHER: | ||||||||||||||||||||
Total equity to total assets | 8.77 | % | 9.44 | % | 9.35 | % | 9.31 | % | 9.18 | % | ||||||||||
Leverage ratio (2) | 10.01 | 10.56 | 10.59 | 10.54 | 10.36 | |||||||||||||||
Number of banking offices | 19 | 19 | 19 | 19 | 19 | |||||||||||||||
Number of ATMs | 20 | 20 | 20 | 20 | 20 | |||||||||||||||
Number of employees | 191 | 205 | 203 | 194 | 185 | |||||||||||||||
(1) | The efficiency ratio is a non-GAAP measure that represents the ratio of non-interest expenses divided by the net-interest income and non-interest income. |
(2) | The Bank adopted the CBLR in the first quarter of 2020, and will therefore not be required to comply with the Basel III capital requirements. |