Attached files
| file | filename |
|---|---|
| EX-99.1 - EX-99.1 - SMARTFINANCIAL INC. | tmb-20200721xex99d1.htm |
| 8-K - 8-K - SMARTFINANCIAL INC. | tmb-20200721x8k.htm |
Exhibit 99.2
| INVESTOR CALL 2Q 2020 July 22, 2020, 10:00am Webcast: www.smartbank.com (Investor Relations) Audio Only: 888-317-6003 Confirmation #: 5925756 Miller Welborn Chairman of the Board Billy Carroll President & CEO |

| Legal Disclaimer 2 Forward-Looking Statements This presentation may contain statements that are based on management’s current estimates or expectations of future events or future results, and that may be deemed to constitute forward-looking statements as defined under the Private Securities Litigation Reform Act of 1995. These statements, including statements regarding the potential effects of the COVID-19 pandemic on the Company’s business and financial results and conditions, are not historical in nature and can generally be identified by such words as “expect,” “anticipate,” “intend,” “plan,” “believe,” “seek,” “may,” “estimate,” and similar expressions. All forward-looking statements are subject to risks, uncertainties, and other factors that may cause the actual results of SmartFinancial to differ materially from future results expressed or implied by such forward-looking statements. Such risks, uncertainties, and other factors include, among others, (1) the risk of litigation and reputational risk associated with historic acquisition activity;(2) the risk that cost savings and revenue synergies from recently completed acquisitions may not be realized or may take longer than anticipated to realize; (3) disruption from recently completed acquisitions with customer, supplier, employee, or other business relationships;(4) our ability to successfully integrate the businesses acquired as part of previous acquisitions with the business of SmartBank;(5) risks related to the completed acquisition of Progressive Financial Group, Inc.(“PFG”);(6) the risk that the anticipated benefits from the completed acquisition of PFG may not be realized in the time frame anticipated;(7) changes in management’s plans for the future;(8) prevailing, or changes in, economic or political conditions, particularly in our market areas;(9) credit risk associated with our lending activities;(10) changes in interest rates, loan demand, real estate values, or competition;(11) changes in accounting principles, policies, or guidelines;(12) changes in applicable laws, rules, or regulations, including changes to statutes, regulations or regulatory policies or practices as a result of, or in response to, COVID-19;(13) adverse results from current or future litigation, regulatory examinations or other legal and/or regulatory actions, including as a result of the Company’s participation in and execution of government programs related to the COVID-19 pandemic;(14) the impact of the COVID-19 pandemic on the Company’s assets, business, cash flows, financial condition, liquidity, prospects and results of operations;(15) potential increases in the provision for loan losses resulting from the COVID-19 pandemic; and (16) other general competitive, economic, political, and market factors, including those affecting our business, operations, pricing, products, or services. These and other factors that could cause results to differ materially from those described in the forward-looking statements can be found in SmartFinancial’s most recent annual report on Form 10-K, quarterly reports on Form 10-Q, and current reports on Form 8-K, in each case filed with or furnished to the Securities and Exchange Commission (the “SEC”) and available on the SEC’s website (www.sec.gov). Undue reliance should not be placed on forward-looking statements. SmartFinancial disclaims any obligation to update or revise any forward-looking statements contained in this release, which speak only as of the date hereof, whether as a result of new information, future events, or otherwise. Non-GAAP Financial Measures Statements included in this presentation include Non-GAAP financial measures and should be read along with the accompanying tables, which provide a reconciliation of Non-GAAP financial measures to GAAP financial measures. SmartFinancial management uses several Non-GAAP financial measures, including: (i) operating earnings, (ii) operating return on average assets, (iii) operating return on average shareholder equity, (iv) return on average tangible common equity, (v) operating return on average tangible common equity, (vi) operating efficiency ratio;(vii) tangible common equity;(viii) average tangible common equity;(ix) tangible book value;(x) operating pre-tax pre-provision earnings;(xi) operating noninterest income;(xii) operating noninterest expense; and ratios derived therefrom, in its analysis of the company's performance. Operating earnings excludes the following from net income: securities gains and losses, merger termination fee of $6.4 million in the second quarter of 2019, merger related and restructuring expenses, the effect of the December 2017 tax law change on deferred tax assets, tax benefit from director options previously exercised, and the income tax effect of adjustments. Operating return on average assets is the annualized operating earnings divided by average assets. Operating return on average shareholder equity is the annualized operating earnings divided by average equity. Return on average tangible common equity is the annualized net income divided by average tangible common equity. Operating return on average tangible common equity is the annualized operating earnings divided by average tangible common equity (Non-GAAP). The operating efficiency ratio includes an adjustment for taxable equivalent yields and excludes securities gains and losses and merger related and restructuring expenses from the efficiency ratio. Tangible common equity and average tangible common equity excludes goodwill and other intangible assets from shareholders’ equity (GAAP) and average shareholders’ equity (GAAP). Tangible book value excludes goodwill and other intangible assets less shareholders’ equity (GAAP) divided by common shares outstanding. Operating pre-tax pre-provision earnings is net interest income (GAAP) plus operating noninterest income (Non-GAAP) less operating noninterest expense (Non-GAAP). Operating noninterest income excludes the following from noninterest income: securities gains and losses, expenses related to the termination of the ADECA loan program and the merger termination fee of $6.4 million in the second quarter of 2019. Operating noninterest expense excludes the following from noninterest expense: prior year adjustments to salaries, merger related and restructuring expenses and certain franchise tax true- up expenses. Management believes that Non-GAAP financial measures provide additional useful information that allows investors to evaluate the ongoing performance of the company and provide meaningful comparisons to its peers. Management believes these non-GAAP financial measures also enhance investors' ability to compare period-to-period financial results and allow investors and company management to view our operating results excluding the impact of items that are not reflective of the underlying operating performance. Non-GAAP financial measures should not be considered as an alternative to any measure of performance or financial condition as promulgated under GAAP, and investors should consider SmartFinancial's performance and financial condition as reported under GAAP and all other relevant information when assessing the performance or financial condition of the company. Non-GAAP financial measures have limitations as analytical tools, and investors should not consider them in isolation or as a substitute for analysis of the results or financial condition as reported under GAAP. |
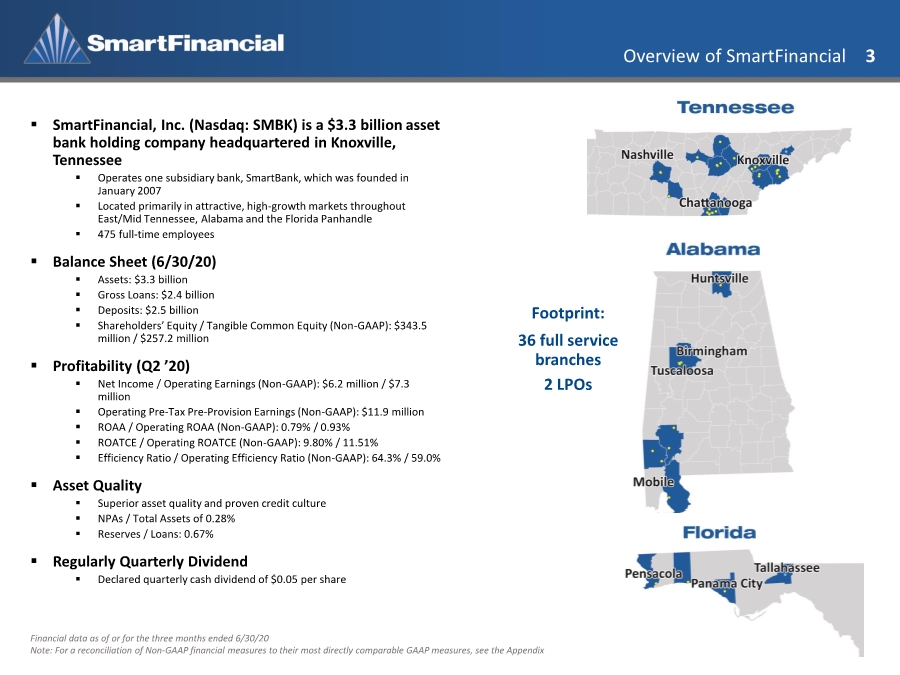
| Overview of SmartFinancial 3 ▪ SmartFinancial, Inc. (Nasdaq: SMBK) is a $3.3 billion asset bank holding company headquartered in Knoxville, Tennessee ▪ Operates one subsidiary bank, SmartBank, which was founded in January 2007 ▪ Located primarily in attractive, high-growth markets throughout East/Mid Tennessee, Alabama and the Florida Panhandle ▪ 475 full-time employees ▪ Balance Sheet (6/30/20) ▪ Assets: $3.3 billion ▪ Gross Loans: $2.4 billion ▪ Deposits: $2.5 billion ▪ Shareholders’ Equity / Tangible Common Equity (Non-GAAP): $343.5 million / $257.2 million ▪ Profitability (Q2 ’20) ▪ Net Income / Operating Earnings (Non-GAAP): $6.2 million / $7.3 million ▪ Operating Pre-Tax Pre-Provision Earnings (Non-GAAP): $11.9 million ▪ ROAA / Operating ROAA (Non-GAAP): 0.79% / 0.93% ▪ ROATCE / Operating ROATCE (Non-GAAP): 9.80% / 11.51% ▪ Efficiency Ratio / Operating Efficiency Ratio (Non-GAAP): 64.3% / 59.0% ▪ Asset Quality ▪ Superior asset quality and proven credit culture ▪ NPAs / Total Assets of 0.28% ▪ Reserves / Loans: 0.67% ▪ Regularly Quarterly Dividend ▪ Declared quarterly cash dividend of $0.05 per share Financial data as of or for the three months ended 6/30/20 Note: For a reconciliation of Non-GAAP financial measures to their most directly comparable GAAP measures, see the Appendix Footprint: 36 full service branches 2 LPOs |
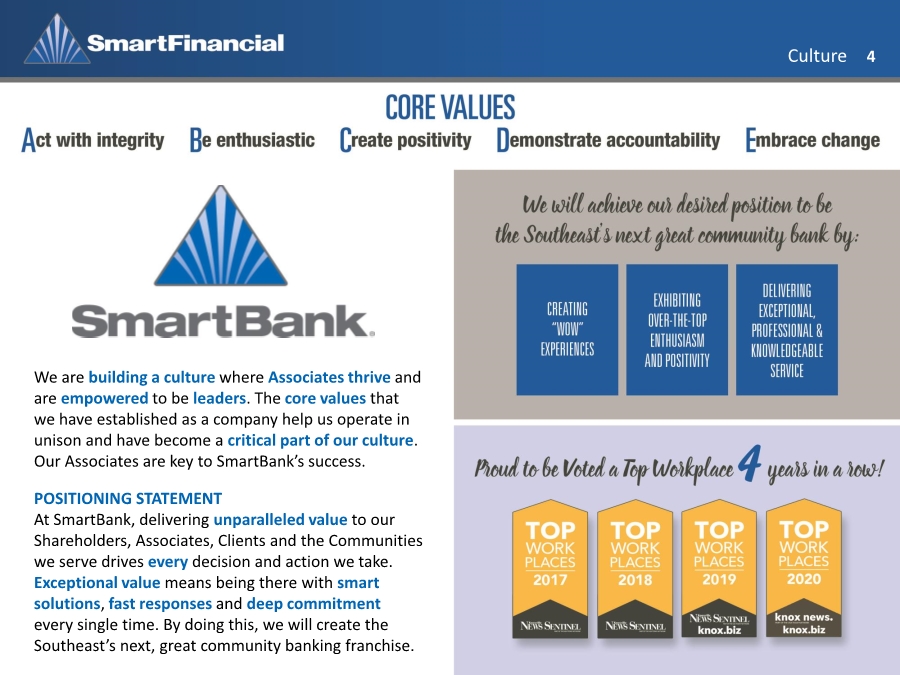
| Culture 4 We are building a culture where Associates thrive and are empowered to be leaders. The core values that we have established as a company help us operate in unison and have become a critical part of our culture. Our Associates are key to SmartBank’s success. POSITIONING STATEMENT At SmartBank, delivering unparalleled value to our Shareholders, Associates, Clients and the Communities we serve drives every decision and action we take. Exceptional value means being there with smart solutions, fast responses and deep commitment every single time. By doing this, we will create the Southeast’s next, great community banking franchise. |
| COVID-19 Update 5 COVID-19 Actions • Pandemic Response Team meets regularly to share latest COVID updates or impacts that we are seeing in all regions across our footprint. • Continue to evaluate markets on a case by case basis as to bank operations or any changes that need to be made to protect associates and clients. • Ongoing communication shared with associates on best practices regarding a safe work environment. • Provided all branches with acrylic counter-shields to be used in teller stations and pods to create space between client and associate. • Provided all locations with social distance floor markers. • Provided all locations with marketing collateral (signage posters/tent cards) with tips to promote a healthy & safe working environment. |
| Second Quarter Financial Highlights |

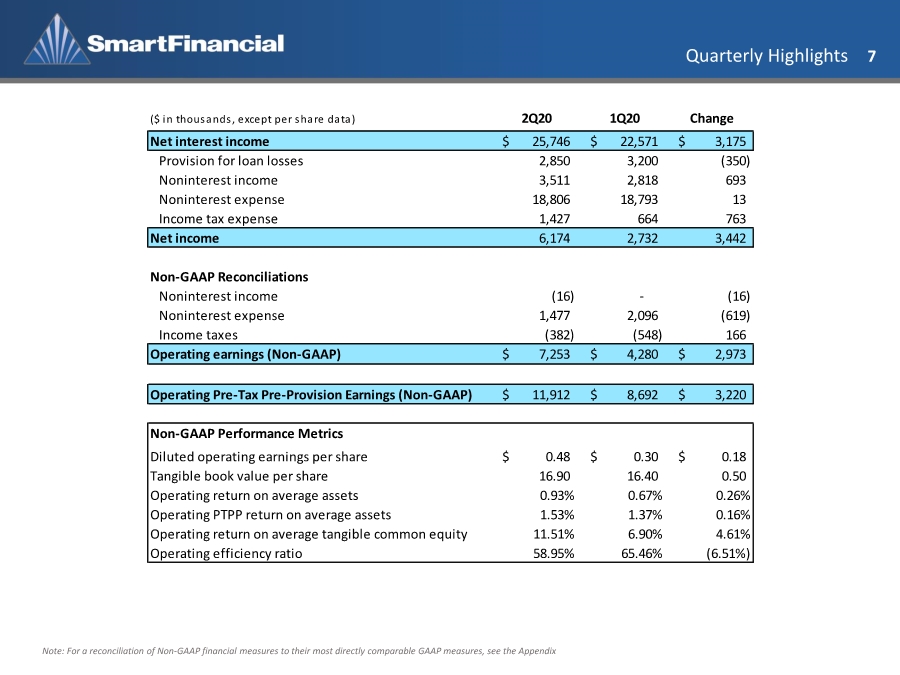
| Quarterly Highlights 7 Note: For a reconciliation of Non-GAAP financial measures to their most directly comparable GAAP measures, see the Appendix ($ in thousands, except per share data) 2Q20 1Q20 Change Net interest income 25,746 $ 22,571 $ 3,175 $ Provision for loan losses 2,850 3,200 (350) Noninterest income 3,511 2,818 693 Noninterest expense 18,806 18,793 13 Income tax expense 1,427 664 763 Net income 6,174 2,732 3,442 Non-GAAP Reconciliations Noninterest income (16) - (16) Noninterest expense 1,477 2,096 (619) Income taxes (382) (548) 166 Operating earnings (Non-GAAP) 7,253 $ 4,280 $ 2,973 $ Operating Pre-Tax Pre-Provision Earnings (Non-GAAP) 11,912 $ 8,692 $ 3,220 $ Non-GAAP Performance Metrics Diluted operating earnings per share 0.48 $ 0.30 $ 0.18 $ Tangible book value per share 16.90 16.40 0.50 Operating return on average assets 0.93% 0.67% 0.26% Operating PTPP return on average assets 1.53% 1.37% 0.16% Operating return on average tangible common equity 11.51% 6.90% 4.61% Operating efficiency ratio 58.95% 65.46% (6.51%) |
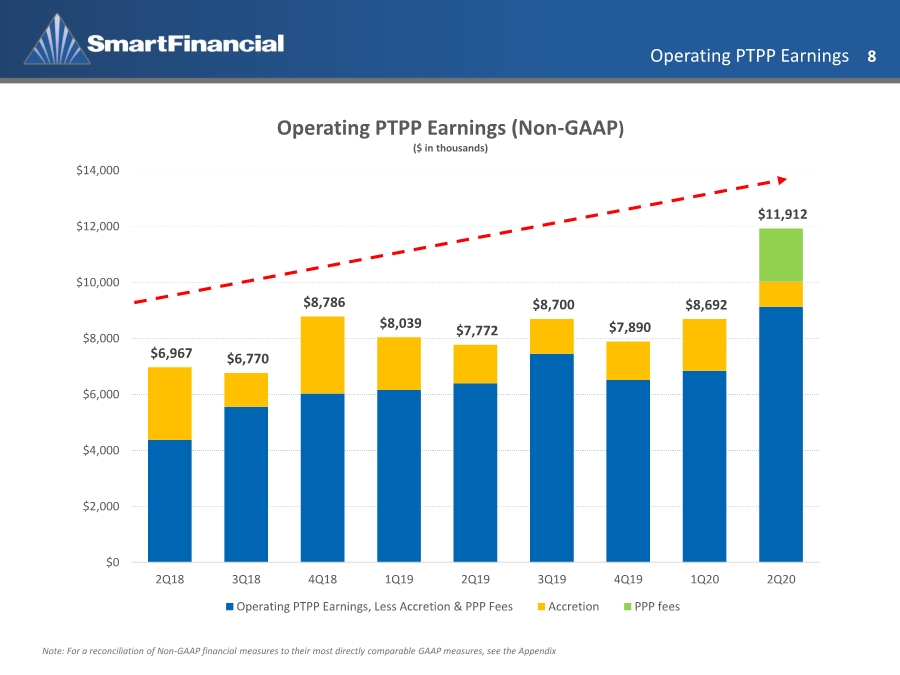
| Operating PTPP Earnings 8 Note: For a reconciliation of Non-GAAP financial measures to their most directly comparable GAAP measures, see the Appendix $6,967 $6,770 $8,786 $8,039 $7,772 $8,700 $7,890 $8,692 $11,912 $0 $2,000 $4,000 $6,000 $8,000 $10,000 $12,000 $14,000 2Q18 3Q18 4Q18 1Q19 2Q19 3Q19 4Q19 1Q20 2Q20 Operating PTPP Earnings (Non-GAAP) ($ in thousands) Operating PTPP Earnings, Less Accretion & PPP Fees Accretion PPP fees |
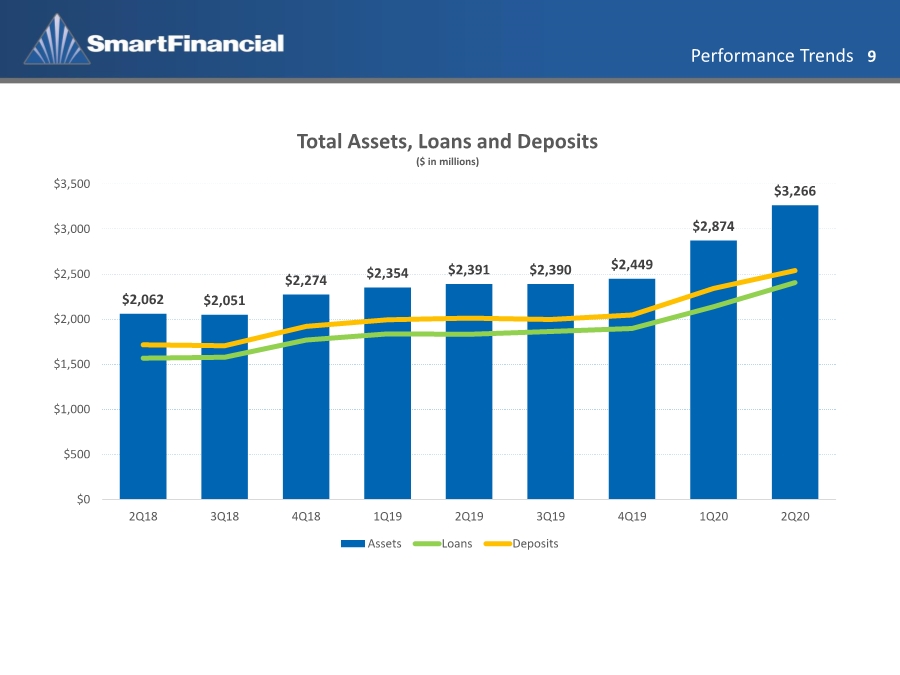
| Performance Trends 9 $2,062 $2,051 $2,274 $2,354 $2,391 $2,390 $2,449 $2,874 $3,266 $0 $500 $1,000 $1,500 $2,000 $2,500 $3,000 $3,500 2Q18 3Q18 4Q18 1Q19 2Q19 3Q19 4Q19 1Q20 2Q20 Total Assets, Loans and Deposits ($ in millions) Assets Loans Deposits |
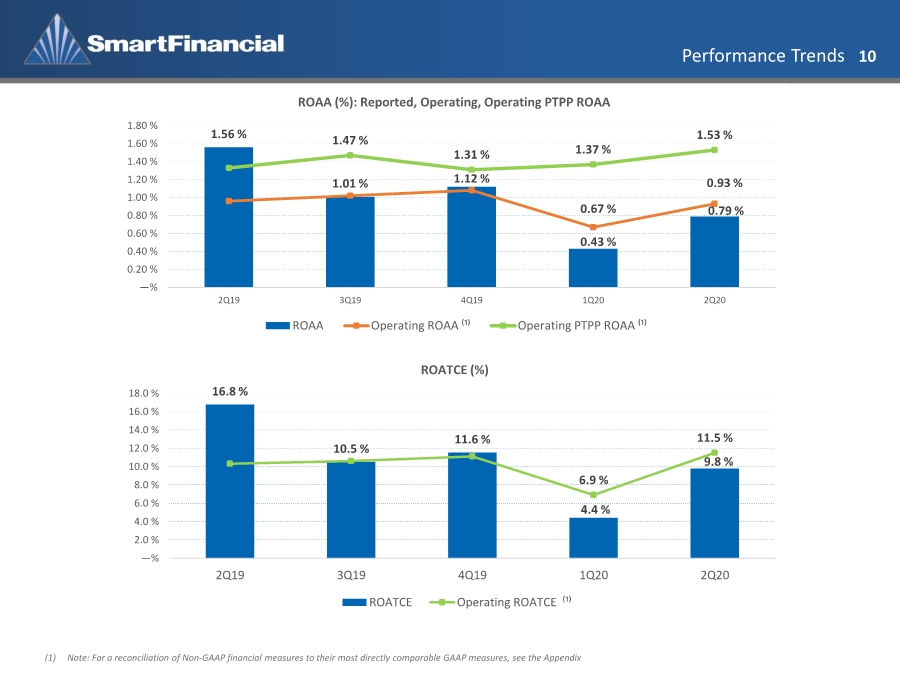
| Performance Trends 10 1.56 % 1.01 % 1.12 % 0.43 % 0.79 % 0.67 % 0.93 % 1.47 % 1.31 % 1.37 % 1.53 % —% 0.20 % 0.40 % 0.60 % 0.80 % 1.00 % 1.20 % 1.40 % 1.60 % 1.80 % 2Q19 3Q19 4Q19 1Q20 2Q20 ROAA (%): Reported, Operating, Operating PTPP ROAA ROAA Operating ROAA ⁽¹⁾ Operating PTPP ROAA ⁽¹⁾ 16.8 % 10.5 % 11.6 % 4.4 % 9.8 % 6.9 % 11.5 % —% 2.0 % 4.0 % 6.0 % 8.0 % 10.0 % 12.0 % 14.0 % 16.0 % 18.0 % 2Q19 3Q19 4Q19 1Q20 2Q20 ROATCE (%) ROATCE Operating ROATCE ⁽¹⁾ (1) Note: For a reconciliation of Non-GAAP financial measures to their most directly comparable GAAP measures, see the Appendix |
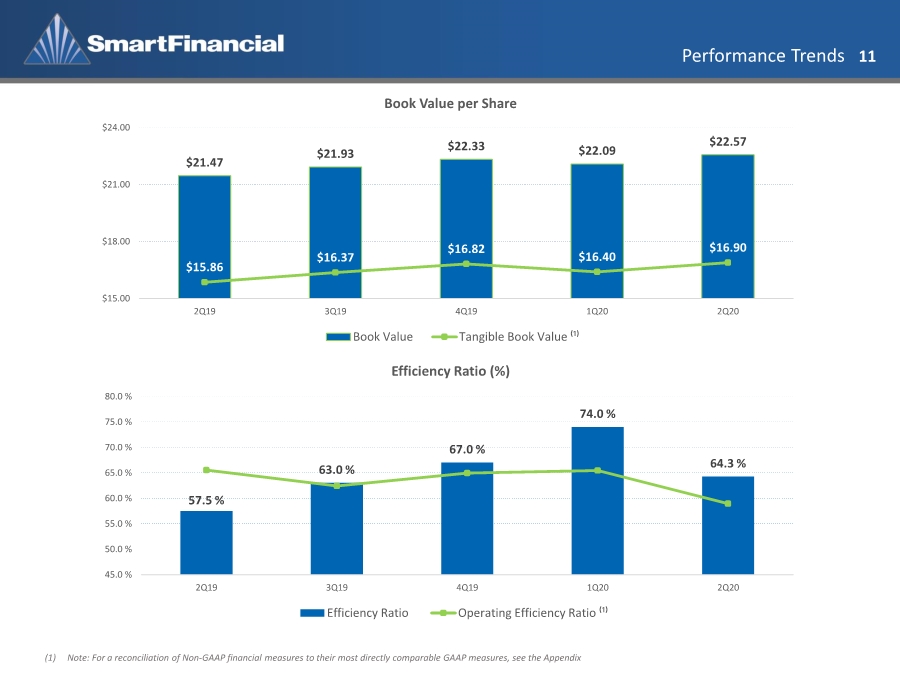
| Performance Trends 11 57.5 % 63.0 % 67.0 % 74.0 % 64.3 % 45.0 % 50.0 % 55.0 % 60.0 % 65.0 % 70.0 % 75.0 % 80.0 % 2Q19 3Q19 4Q19 1Q20 2Q20 Efficiency Ratio (%) Efficiency Ratio Operating Efficiency Ratio ⁽¹⁾ $21.47 $21.93 $22.33 $22.09 $22.57 $15.86 $16.37 $16.82 $16.40 $16.90 $15.00 $18.00 $21.00 $24.00 2Q19 3Q19 4Q19 1Q20 2Q20 Book Value per Share Book Value Tangible Book Value ⁽¹⁾ (1) Note: For a reconciliation of Non-GAAP financial measures to their most directly comparable GAAP measures, see the Appendix |
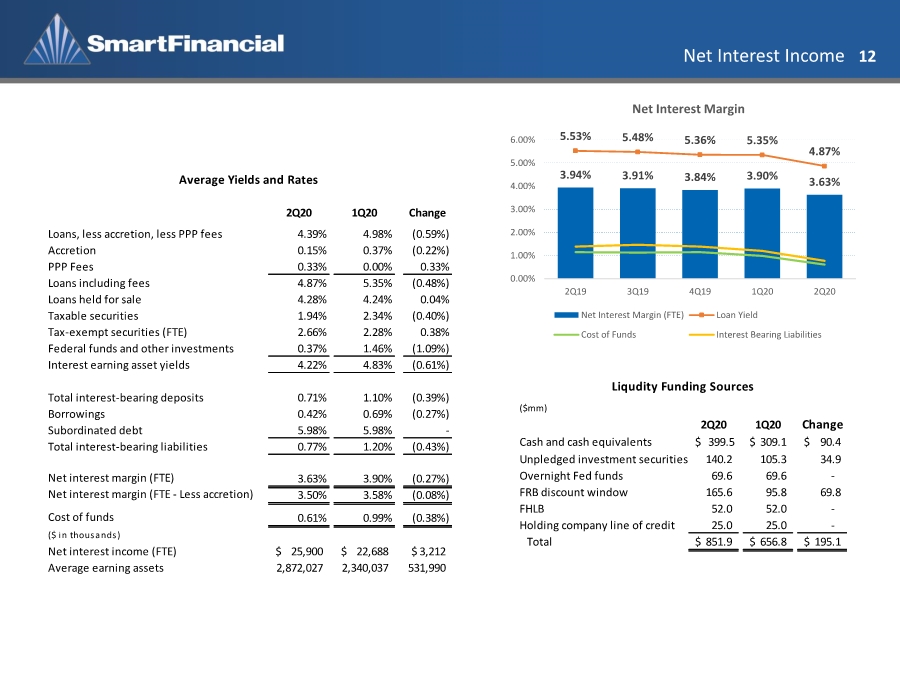
| Net Interest Income 12 3.94% 3.91% 3.84% 3.90% 3.63% 5.53% 5.48% 5.36% 5.35% 4.87% 0.00% 1.00% 2.00% 3.00% 4.00% 5.00% 6.00% 2Q19 3Q19 4Q19 1Q20 2Q20 Net Interest Margin Net Interest Margin (FTE) Loan Yield Cost of Funds Interest Bearing Liabilities ($mm) 2Q20 1Q20 Change Cash and cash equivalents $ 399.5 309.1 $ 90.4 $ Unpledged investment securities 140.2 105.3 34.9 Overnight Fed funds 69.6 69.6 - FRB discount window 165.6 95.8 69.8 FHLB 52.0 52.0 - Holding company line of credit 25.0 25.0 - Total 851.9 $ 656.8 $ 195.1 $ Liqudity Funding Sources 2Q20 1Q20 Change Loans, less accretion, less PPP fees 4.39% 4.98% (0.59%) Accretion 0.15% 0.37% (0.22%) PPP Fees 0.33% 0.00% 0.33% Loans including fees 4.87% 5.35% (0.48%) Loans held for sale 4.28% 4.24% 0.04% Taxable securities 1.94% 2.34% (0.40%) Tax-exempt securities (FTE) 2.66% 2.28% 0.38% Federal funds and other investments 0.37% 1.46% (1.09%) Interest earning asset yields 4.22% 4.83% (0.61%) Total interest-bearing deposits 0.71% 1.10% (0.39%) Borrowings 0.42% 0.69% (0.27%) Subordinated debt 5.98% 5.98% - Total interest-bearing liabilities 0.77% 1.20% (0.43%) Net interest margin (FTE) 3.63% 3.90% (0.27%) Net interest margin (FTE - Less accretion) 3.50% 3.58% (0.08%) Cost of funds 0.61% 0.99% (0.38%) ($ in thousands) Net interest income (FTE) 25,900 $ 22,688 $ 3,212 $ Average earning assets 2,872,027 2,340,037 531,990 Average Yields and Rates |
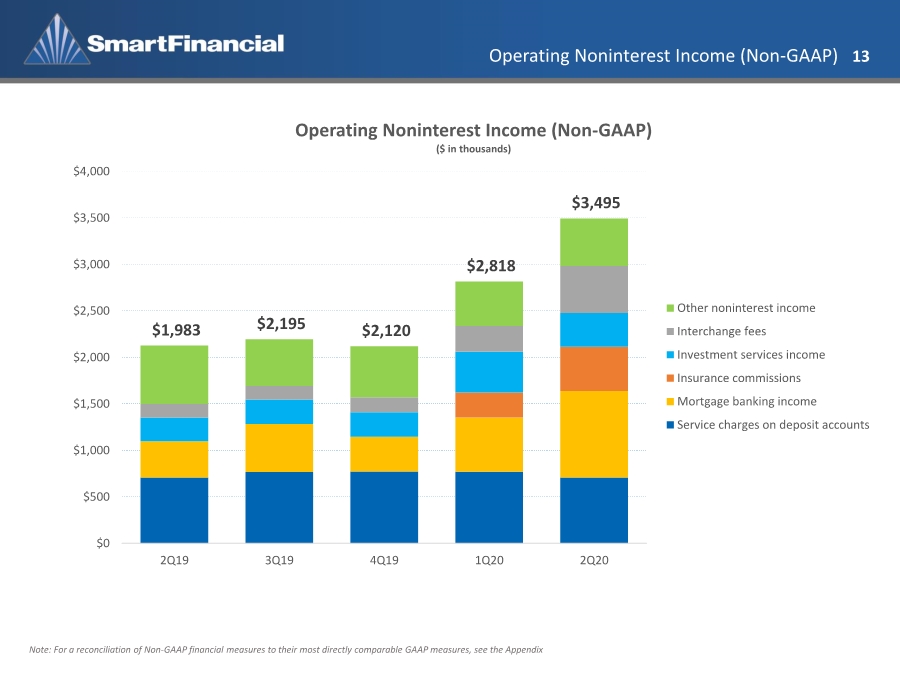
| Operating Noninterest Income (Non-GAAP) 13 Note: For a reconciliation of Non-GAAP financial measures to their most directly comparable GAAP measures, see the Appendix $1,983 $2,195 $2,120 $2,818 $3,495 $0 $500 $1,000 $1,500 $2,000 $2,500 $3,000 $3,500 $4,000 2Q19 3Q19 4Q19 1Q20 2Q20 Operating Noninterest Income (Non-GAAP) ($ in thousands) Other noninterest income Interchange fees Investment services income Insurance commissions Mortgage banking income Service charges on deposit accounts |
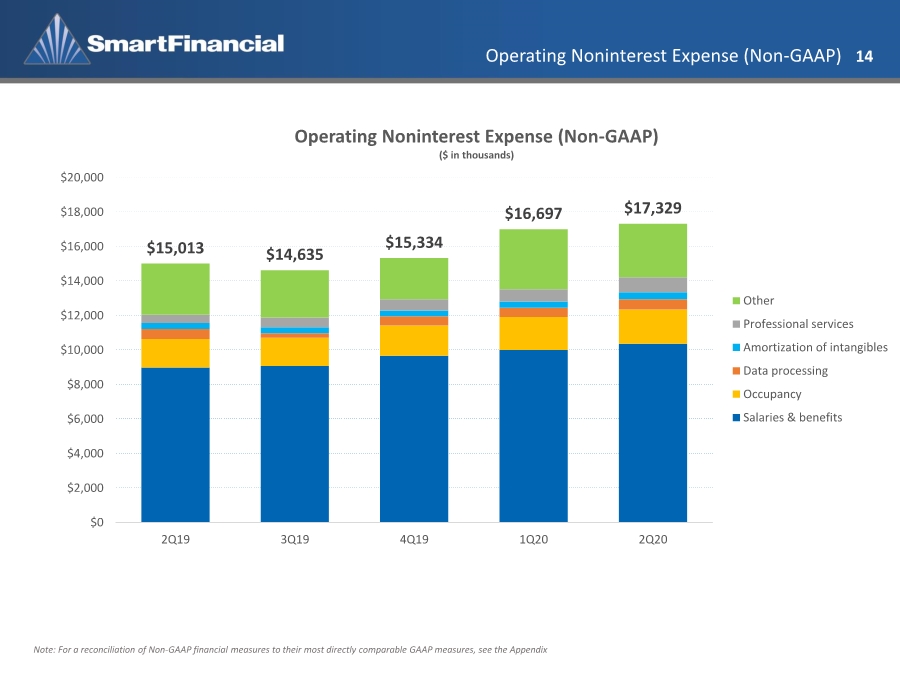
| Operating Noninterest Expense (Non-GAAP) 14 Note: For a reconciliation of Non-GAAP financial measures to their most directly comparable GAAP measures, see the Appendix $15,013 $14,635 $15,334 $16,697 $17,329 $0 $2,000 $4,000 $6,000 $8,000 $10,000 $12,000 $14,000 $16,000 $18,000 $20,000 2Q19 3Q19 4Q19 1Q20 2Q20 Operating Noninterest Expense (Non-GAAP) ($ in thousands) Other Professional services Amortization of intangibles Data processing Occupancy Salaries & benefits |
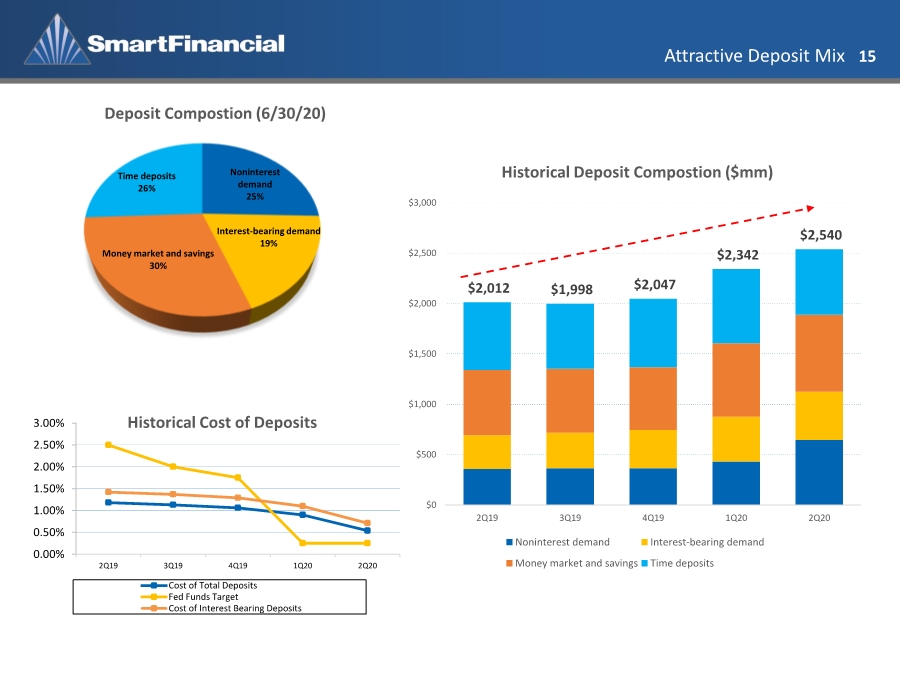
| Attractive Deposit Mix 15 Noninterest demand 25% Interest-bearing demand 19% Money market and savings 30% Time deposits 26% Deposit Compostion (6/30/20) $2,012 $1,998 $2,047 $2,342 $2,540 $0 $500 $1,000 $1,500 $2,000 $2,500 $3,000 2Q19 3Q19 4Q19 1Q20 2Q20 Historical Deposit Compostion ($mm) Noninterest demand Interest-bearing demand Money market and savings Time deposits 0.00% 0.50% 1.00% 1.50% 2.00% 2.50% 3.00% 2Q19 3Q19 4Q19 1Q20 2Q20 Historical Cost of Deposits Cost of Total Deposits Fed Funds Target Cost of Interest Bearing Deposits |
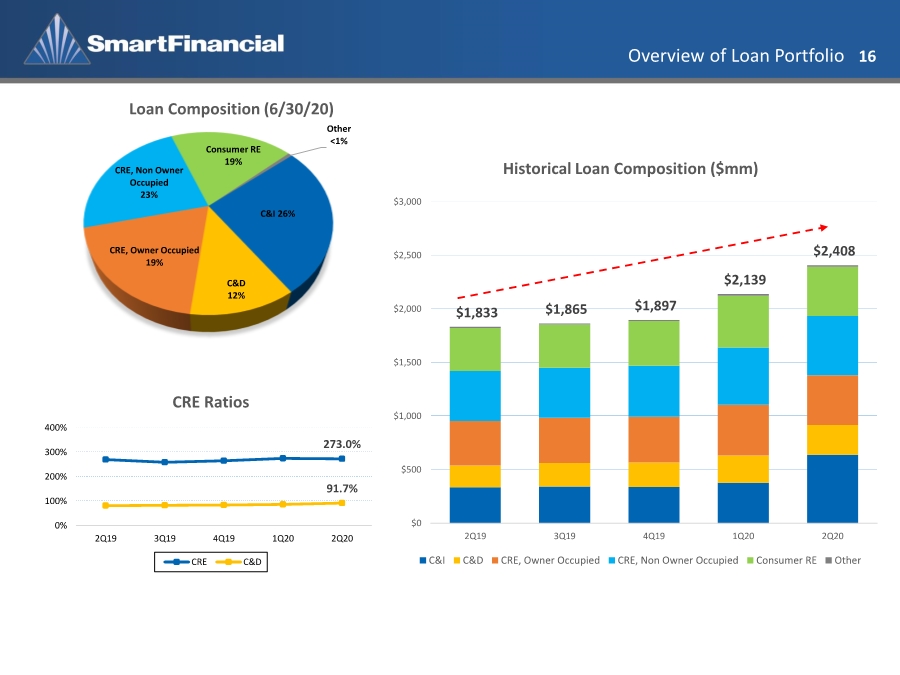
| Overview of Loan Portfolio 16 C&I 26% C&D 12% CRE, Owner Occupied 19% CRE, Non Owner Occupied 23% Consumer RE 19% Other <1% Loan Composition (6/30/20) 273.0% 91.7% 0% 100% 200% 300% 400% 2Q19 3Q19 4Q19 1Q20 2Q20 CRE Ratios CRE C&D $1,833 $1,865 $1,897 $2,139 $2,408 $0 $500 $1,000 $1,500 $2,000 $2,500 $3,000 2Q19 3Q19 4Q19 1Q20 2Q20 Historical Loan Composition ($mm) C&I C&D CRE, Owner Occupied CRE, Non Owner Occupied Consumer RE Other |
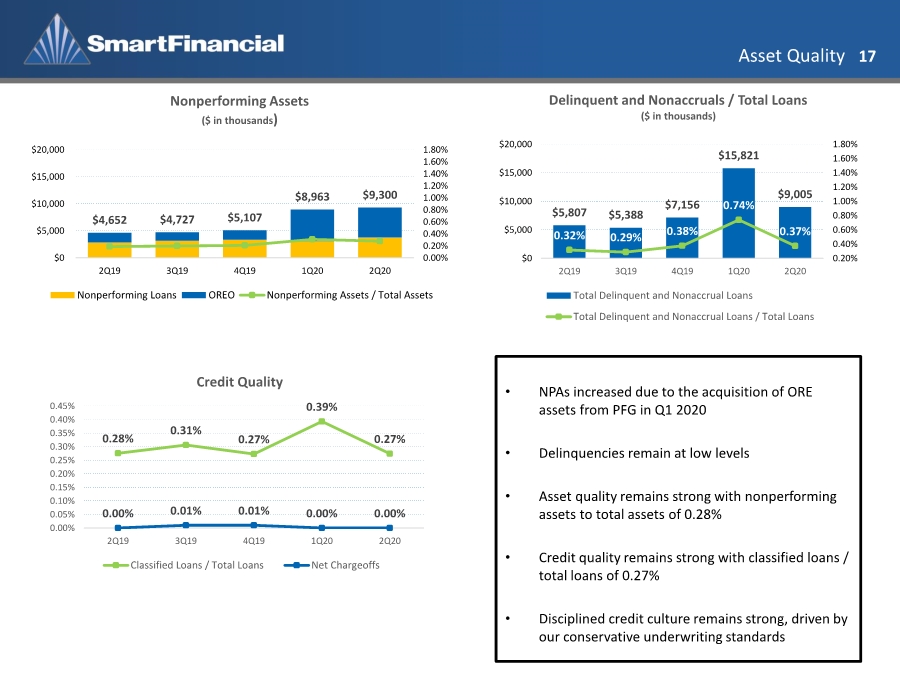
| Asset Quality 17 • NPAs increased due to the acquisition of ORE assets from PFG in Q1 2020 • Delinquencies remain at low levels • Asset quality remains strong with nonperforming assets to total assets of 0.28% • Credit quality remains strong with classified loans / total loans of 0.27% • Disciplined credit culture remains strong, driven by our conservative underwriting standards 0.28% 0.31% 0.27% 0.39% 0.27% 0.00% 0.01% 0.01% 0.00% 0.00% 0.00% 0.05% 0.10% 0.15% 0.20% 0.25% 0.30% 0.35% 0.40% 0.45% 2Q19 3Q19 4Q19 1Q20 2Q20 Credit Quality Classified Loans / Total Loans Net Chargeoffs $5,807 $5,388 $7,156 $15,821 $9,005 0.32% 0.29% 0.38% 0.74% 0.37% 0.20% 0.40% 0.60% 0.80% 1.00% 1.20% 1.40% 1.60% 1.80% $0 $5,000 $10,000 $15,000 $20,000 2Q19 3Q19 4Q19 1Q20 2Q20 Delinquent and Nonaccruals / Total Loans ($ in thousands) Total Delinquent and Nonaccrual Loans Total Delinquent and Nonaccrual Loans / Total Loans $4,652 $4,727 $5,107 $8,963 $9,300 0.00% 0.20% 0.40% 0.60% 0.80% 1.00% 1.20% 1.40% 1.60% 1.80% $0 $5,000 $10,000 $15,000 $20,000 2Q19 3Q19 4Q19 1Q20 2Q20 Nonperforming Assets ($ in thousands) Nonperforming Loans OREO Nonperforming Assets / Total Assets |
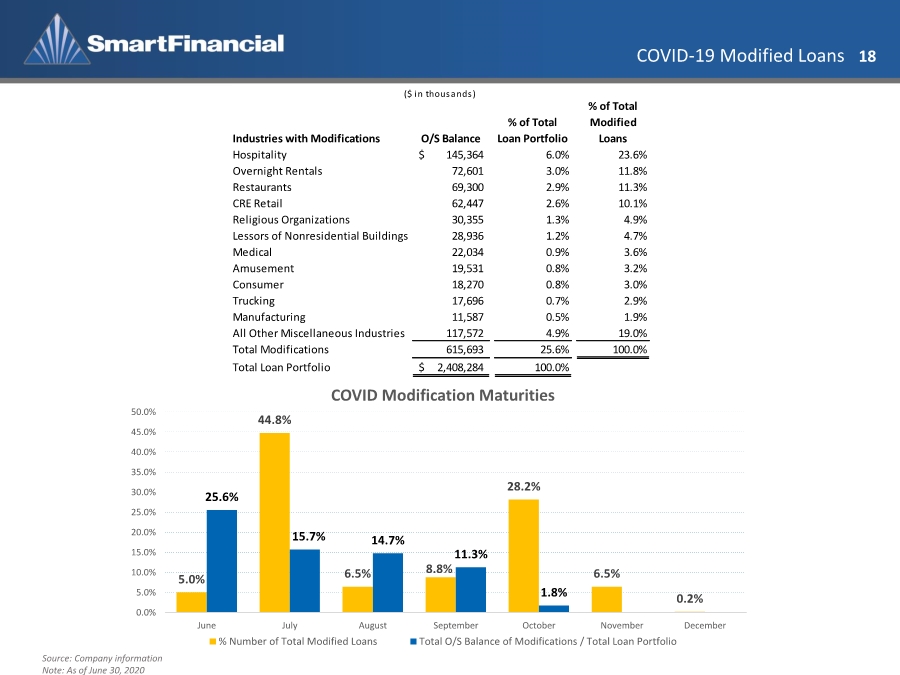
| COVID-19 Modified Loans 18 Source: Company information Note: As of June 30, 2020 5.0% 44.8% 6.5% 8.8% 28.2% 6.5% 0.2% 25.6% 15.7% 14.7% 11.3% 1.8% 0.0% 5.0% 10.0% 15.0% 20.0% 25.0% 30.0% 35.0% 40.0% 45.0% 50.0% June July August September October November December COVID Modification Maturities % Number of Total Modified Loans Total O/S Balance of Modifications / Total Loan Portfolio Industries with Modifications O/S Balance % of Total Loan Portfolio % of Total Modified Loans Hospitality 145,364 $ 6.0% 23.6% Overnight Rentals 72,601 3.0% 11.8% Restaurants 69,300 2.9% 11.3% CRE Retail 62,447 2.6% 10.1% Religious Organizations 30,355 1.3% 4.9% Lessors of Nonresidential Buildings 28,936 1.2% 4.7% Medical 22,034 0.9% 3.6% Amusement 19,531 0.8% 3.2% Consumer 18,270 0.8% 3.0% Trucking 17,696 0.7% 2.9% Manufacturing 11,587 0.5% 1.9% All Other Miscellaneous Industries 117,572 4.9% 19.0% Total Modifications 615,693 25.6% 100.0% Total Loan Portfolio 2,408,284 $ 100.0% ($ in thousands) |
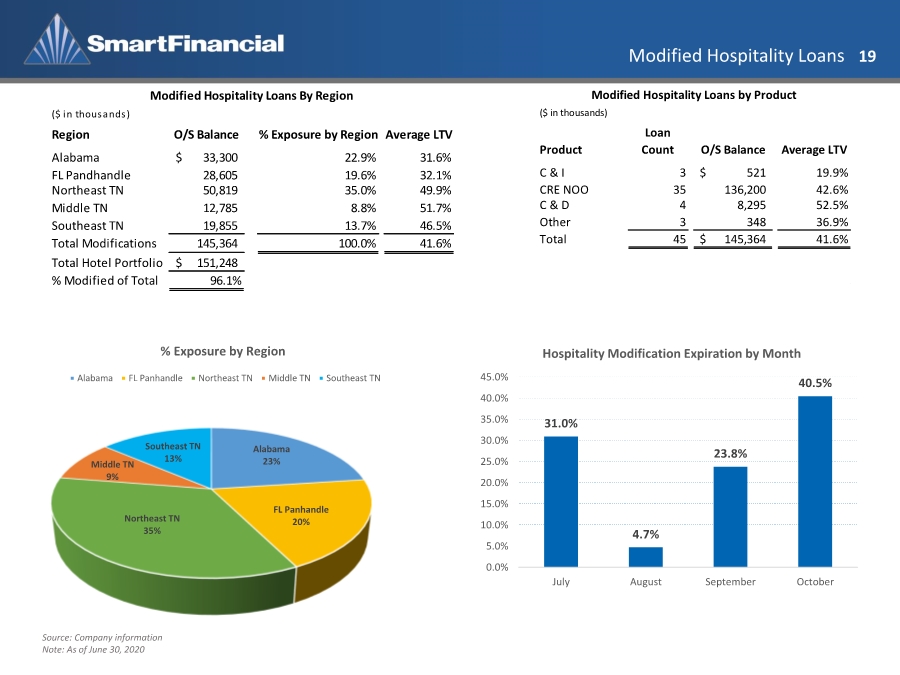
| Modified Hospitality Loans 19 Alabama 23% FL Panhandle 20% Northeast TN 35% Middle TN 9% Southeast TN 13% % Exposure by Region Alabama FL Panhandle Northeast TN Middle TN Southeast TN 31.0% 4.7% 23.8% 40.5% 0.0% 5.0% 10.0% 15.0% 20.0% 25.0% 30.0% 35.0% 40.0% 45.0% July August September October Hospitality Modification Expiration by Month Source: Company information Note: As of June 30, 2020 ($ in thousands) Region O/S Balance % Exposure by Region Average LTV Alabama 33,300 $ 22.9% 31.6% FL Pandhandle 28,605 19.6% 32.1% Northeast TN 50,819 35.0% 49.9% Middle TN 12,785 8.8% 51.7% Southeast TN 19,855 13.7% 46.5% Total Modifications 145,364 100.0% 41.6% Total Hotel Portfolio 151,248 $ % Modified of Total 96.1% Modified Hospitality Loans By Region ($ in thousands) Product Loan Count O/S Balance Average LTV C & I 3 521 $ 19.9% CRE NOO 35 136,200 42.6% C & D 4 8,295 52.5% Other 3 348 36.9% Total 45 145,364 $ 41.6% Modified Hospitality Loans by Product |
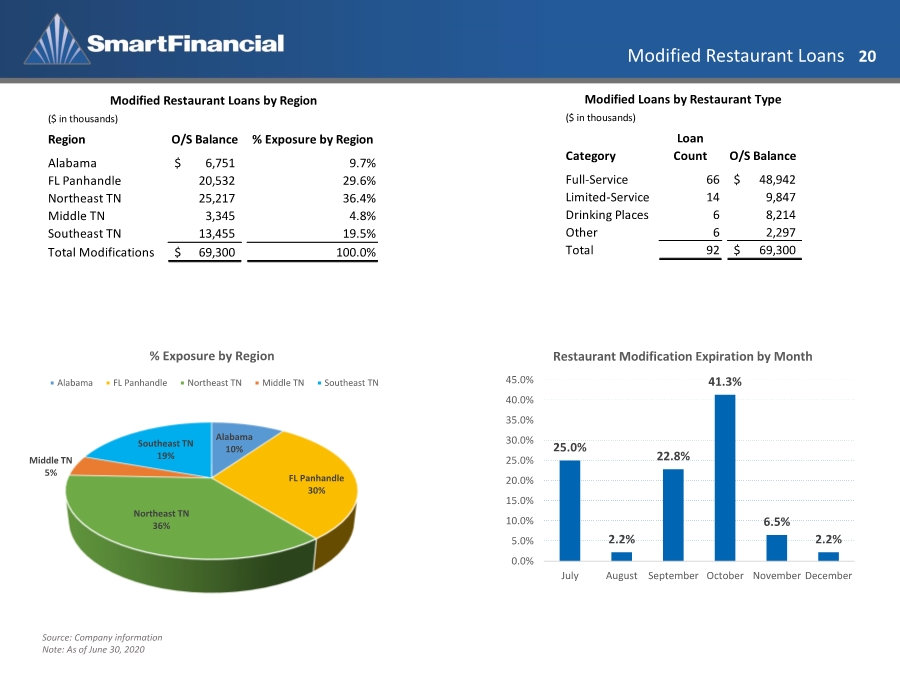
| Modified Restaurant Loans 20 25.0% 2.2% 22.8% 41.3% 6.5% 2.2% 0.0% 5.0% 10.0% 15.0% 20.0% 25.0% 30.0% 35.0% 40.0% 45.0% July August September October November December Restaurant Modification Expiration by Month Source: Company information Note: As of June 30, 2020 ($ in thousands) Category Loan Count O/S Balance Full-Service 66 48,942 $ Limited-Service 14 9,847 Drinking Places 6 8,214 Other 6 2,297 Total 92 69,300 $ Modified Loans by Restaurant Type ($ in thousands) Region O/S Balance % Exposure by Region Alabama 6,751 $ 9.7% FL Panhandle 20,532 29.6% Northeast TN 25,217 36.4% Middle TN 3,345 4.8% Southeast TN 13,455 19.5% Total Modifications 69,300 $ 100.0% Modified Restaurant Loans by Region Alabama 10% FL Panhandle 30% Northeast TN 36% Middle TN 5% Southeast TN 19% % Exposure by Region Alabama FL Panhandle Northeast TN Middle TN Southeast TN |
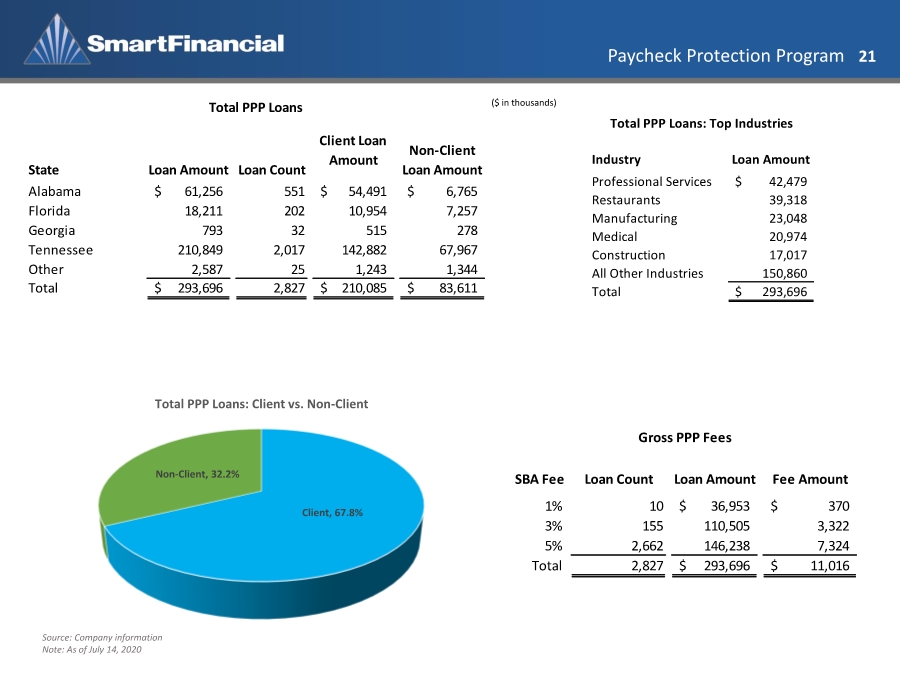
| Paycheck Protection Program 21 Client, 67.8% Non-Client, 32.2% Total PPP Loans: Client vs. Non-Client ($ in thousands) Industry Loan Amount Professional Services 42,479 $ Restaurants 39,318 Manufacturing 23,048 Medical 20,974 Construction 17,017 All Other Industries 150,860 Total 293,696 $ Total PPP Loans: Top Industries Source: Company information Note: As of July 14, 2020 State Loan Amount Loan Count Client Loan Amount Non-Client Loan Amount Alabama 61,256 $ 551 54,491 $ 6,765 $ Florida 18,211 202 10,954 7,257 Georgia 793 32 515 278 Tennessee 210,849 2,017 142,882 67,967 Other 2,587 25 1,243 1,344 Total 293,696 $ 2,827 210,085 $ 83,611 $ Total PPP Loans SBA Fee Loan Count Loan Amount Fee Amount 1% 10 36,953 $ 370 $ 3% 155 110,505 3,322 5% 2,662 146,238 7,324 Total 2,827 293,696 $ 11,016 $ Gross PPP Fees |
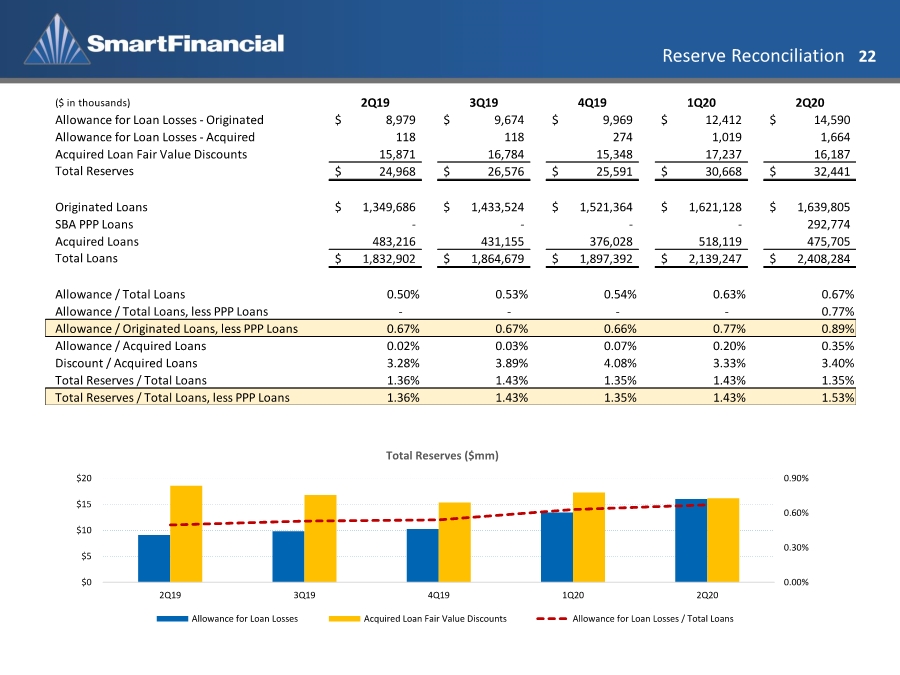
| Reserve Reconciliation 22 0.00% 0.30% 0.60% 0.90% $0 $5 $10 $15 $20 2Q19 3Q19 4Q19 1Q20 2Q20 Total Reserves ($mm) Allowance for Loan Losses Acquired Loan Fair Value Discounts Allowance for Loan Losses / Total Loans ($ in thousands) 2Q19 3Q19 4Q19 1Q20 2Q20 Allowance for Loan Losses - Originated 8,979 $ 9,674 $ 9,969 $ 12,412 $ 14,590 $ Allowance for Loan Losses - Acquired 118 118 274 1,019 1,664 Acquired Loan Fair Value Discounts 15,871 16,784 15,348 17,237 16,187 Total Reserves 24,968 $ 26,576 $ 25,591 $ 30,668 $ 32,441 $ Originated Loans 1,349,686 $ 1,433,524 $ 1,521,364 $ 1,621,128 $ 1,639,805 $ SBA PPP Loans - - - - 292,774 Acquired Loans 483,216 431,155 376,028 518,119 475,705 Total Loans 1,832,902 $ 1,864,679 $ 1,897,392 $ 2,139,247 $ 2,408,284 $ Allowance / Total Loans 0.50% 0.53% 0.54% 0.63% 0.67% Allowance / Total Loans, less PPP Loans - - - - 0.77% Allowance / Originated Loans, less PPP Loans 0.67% 0.67% 0.66% 0.77% 0.89% Allowance / Acquired Loans 0.02% 0.03% 0.07% 0.20% 0.35% Discount / Acquired Loans 3.28% 3.89% 4.08% 3.33% 3.40% Total Reserves / Total Loans 1.36% 1.43% 1.35% 1.43% 1.35% Total Reserves / Total Loans, less PPP Loans 1.36% 1.43% 1.35% 1.43% 1.53% |
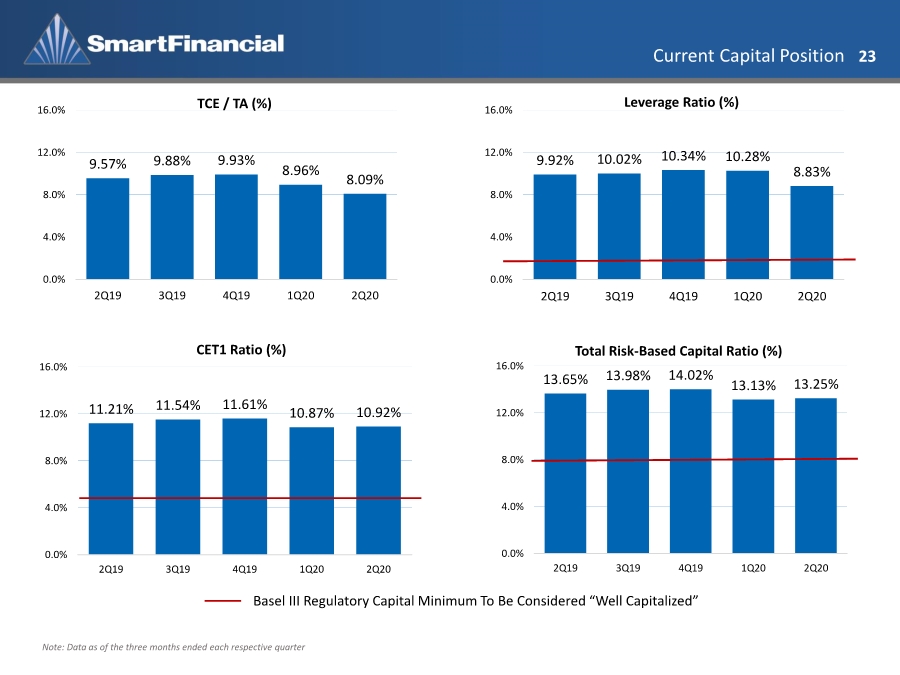
| Current Capital Position 23 Note: Data as of the three months ended each respective quarter Basel III Regulatory Capital Minimum To Be Considered “Well Capitalized” 9.57% 9.88% 9.93% 8.96% 8.09% 0.0% 4.0% 8.0% 12.0% 16.0% 2Q19 3Q19 4Q19 1Q20 2Q20 TCE / TA (%) 9.92% 10.02% 10.34% 10.28% 8.83% 0.0% 4.0% 8.0% 12.0% 16.0% 2Q19 3Q19 4Q19 1Q20 2Q20 Leverage Ratio (%) 11.21% 11.54% 11.61% 10.87% 10.92% 0.0% 4.0% 8.0% 12.0% 16.0% 2Q19 3Q19 4Q19 1Q20 2Q20 CET1 Ratio (%) 13.65% 13.98% 14.02% 13.13% 13.25% 0.0% 4.0% 8.0% 12.0% 16.0% 2Q19 3Q19 4Q19 1Q20 2Q20 Total Risk-Based Capital Ratio (%) |
| Appendix |

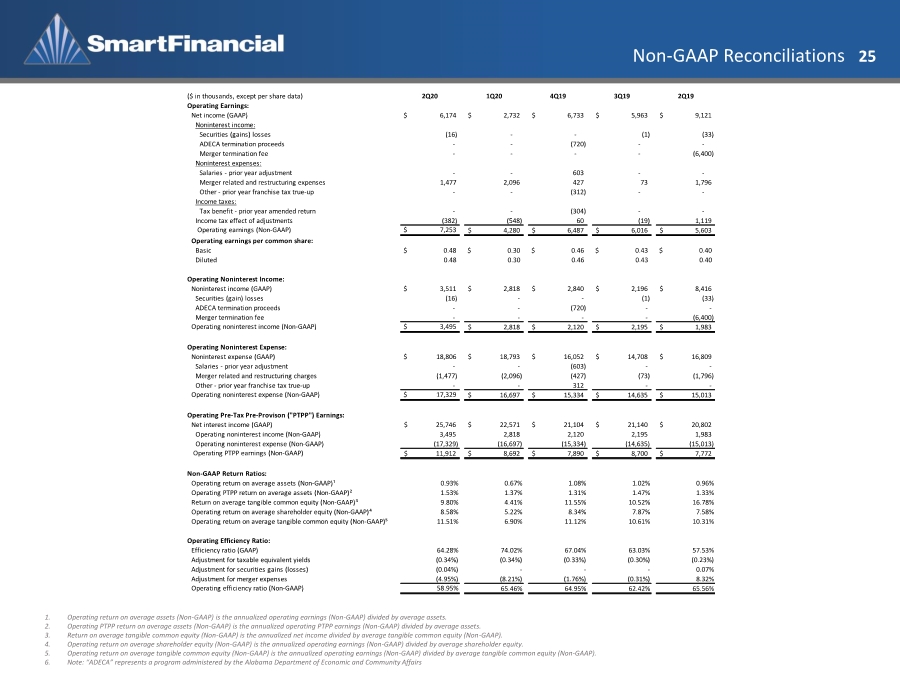
| Non-GAAP Reconciliations 25 1. Operating return on average assets (Non-GAAP) is the annualized operating earnings (Non-GAAP) divided by average assets. 2. Operating PTPP return on average assets (Non-GAAP) is the annualized operating PTPP earnings (Non-GAAP) divided by average assets. 3. Return on average tangible common equity (Non-GAAP) is the annualized net income divided by average tangible common equity (Non-GAAP). 4. Operating return on average shareholder equity (Non-GAAP) is the annualized operating earnings (Non-GAAP) divided by average shareholder equity. 5. Operating return on average tangible common equity (Non-GAAP) is the annualized operating earnings (Non-GAAP) divided by average tangible common equity (Non-GAAP). 6. Note: “ADECA” represents a program administered by the Alabama Department of Economic and Community Affairs ($ in thousands, except per share data) 2Q20 1Q20 4Q19 3Q19 2Q19 Operating Earnings: Net income (GAAP) $ 6,174 2,732 $ 6,733 $ 5,963 $ 9,121 $ Noninterest income: Securities (gains) losses (16) - - (1) (33) ADECA termination proceeds - - (720) - - Merger termination fee - - - - (6,400) Noninterest expenses: Salaries - prior year adjustment - - 603 - - Merger related and restructuring expenses 1,477 2,096 427 73 1,796 Other - prior year franchise tax true-up - - (312) - - Income taxes: Tax benefit - prior year amended return - - (304) - - Income tax effect of adjustments (382) (548) 60 (19) 1,119 Operating earnings (Non-GAAP) $ 7,253 4,280 $ 6,487 $ 6,016 $ 5,603 $ Operating earnings per common share: Basic $ 0.48 $ 0.30 $ 0.46 $ 0.43 $ 0.40 Diluted 0.48 0.30 0.46 0.43 0.40 Operating Noninterest Income: Noninterest income (GAAP) $ 3,511 2,818 $ 2,840 $ 2,196 $ 8,416 $ Securities (gain) losses (16) - - (1) (33) ADECA termination proceeds - - (720) - - Merger termination fee - - - - (6,400) Operating noninterest income (Non-GAAP) $ 3,495 2,818 $ 2,120 $ 2,195 $ 1,983 $ Operating Noninterest Expense: Noninterest expense (GAAP) $ 18,806 18,793 $ 16,052 $ 14,708 $ 16,809 $ Salaries - prior year adjustment - - (603) - - Merger related and restructuring charges (1,477) (2,096) (427) (73) (1,796) Other - prior year franchise tax true-up - - 312 - - Operating noninterest expense (Non-GAAP) $ 17,329 16,697 $ 15,334 $ 14,635 $ 15,013 $ Operating Pre-Tax Pre-Provison ("PTPP") Earnings: Net interest income (GAAP) 25,746 $ 22,571 $ 21,104 $ 21,140 $ 20,802 $ Operating noninterest income (Non-GAAP) 3,495 2,818 2,120 2,195 1,983 Operating noninterest expense (Non-GAAP) (17,329) (16,697) (15,334) (14,635) (15,013) Operating PTPP earnings (Non-GAAP) 11,912 $ 8,692 $ 7,890 $ 8,700 $ 7,772 $ Non-GAAP Return Ratios: Operating return on average assets (Non-GAAP)¹ 0.93% 0.67% 1.08% 1.02% 0.96% Operating PTPP return on average assets (Non-GAAP)² 1.53% 1.37% 1.31% 1.47% 1.33% Return on average tangible common equity (Non-GAAP)³ 9.80% 4.41% 11.55% 10.52% 16.78% Operating return on average shareholder equity (Non-GAAP)⁴ 8.58% 5.22% 8.34% 7.87% 7.58% Operating return on average tangible common equity (Non-GAAP)⁵ 11.51% 6.90% 11.12% 10.61% 10.31% Operating Efficiency Ratio: Efficiency ratio (GAAP) 64.28% 74.02% 67.04% 63.03% 57.53% Adjustment for taxable equivalent yields (0.34%) (0.34%) (0.33%) (0.30%) (0.23%) Adjustment for securities gains (losses) (0.04%) --- 0.07% Adjustment for merger expenses (4.95%) (8.21%) (1.76%) (0.31%) 8.32% Operating efficiency ratio (Non-GAAP) 58.95% 65.46% 64.95% 62.42% 65.56% |
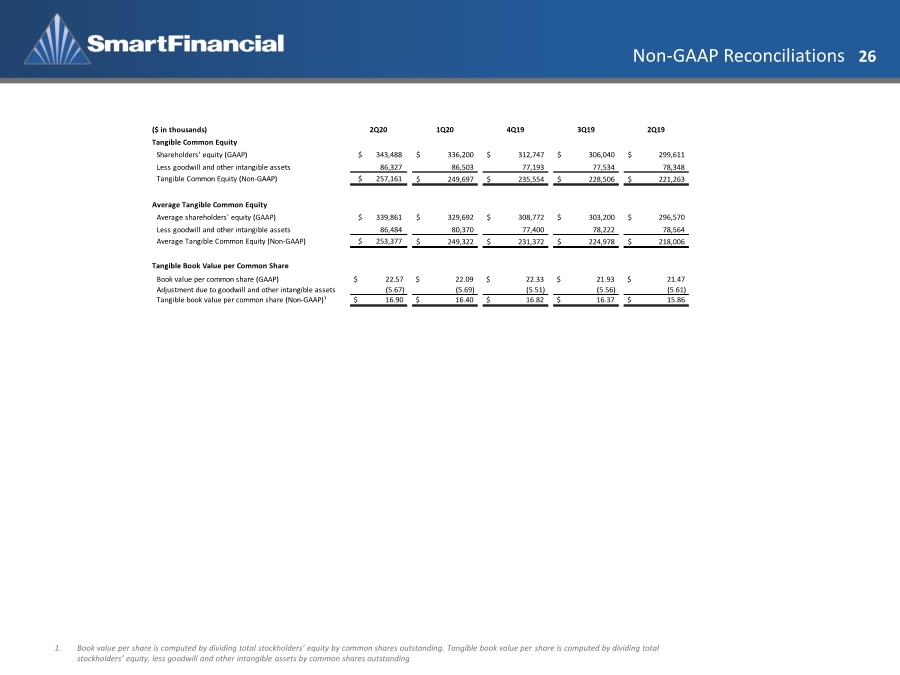
| Non-GAAP Reconciliations 26 ($ in thousands) 2Q20 1Q20 4Q19 3Q19 2Q19 Tangible Common Equity Shareholders' equity (GAAP) $ 343,488 336,200 $ 312,747 $ 306,040 $ 299,611 $ Less goodwill and other intangible assets 86,327 86,503 77,193 77,534 78,348 Tangible Common Equity (Non-GAAP) $ 257,161 249,697 $ 235,554 $ 228,506 $ 221,263 $ Average Tangible Common Equity Average shareholders' equity (GAAP) $ 339,861 329,692 $ 308,772 $ 303,200 $ 296,570 $ Less goodwill and other intangible assets 86,484 80,370 77,400 78,222 78,564 Average Tangible Common Equity (Non-GAAP) $ 253,377 249,322 $ 231,372 $ 224,978 $ 218,006 $ Tangible Book Value per Common Share Book value per common share (GAAP) $ 22.57 $ 22.09 $ 22.33 $ 21.93 $ 21.47 Adjustment due to goodwill and other intangible assets (5.67) (5.69) (5.51) (5.56) (5.61) Tangible book value per common share (Non-GAAP)¹ $ 16.90 $ 16.40 $ 16.82 $ 16.37 $ 15.86 1. Book value per share is computed by dividing total stockholders’ equity by common shares outstanding. Tangible book value per share is computed by dividing total stockholders’ equity, less goodwill and other intangible assets by common shares outstanding |
| Investor Contact 27 Billy Carroll President & CEO 865.868.0613 billy.carroll@smartbank.com Miller Welborn Chairman 423.385.3067 miller.welborn@smartbank.com 5401 Kingston Pike, Suite 600 Knoxville, TN 37919 |
|