Attached files
| file | filename |
|---|---|
| EX-99.2 - EX-99.2 - Clear Channel Outdoor Holdings, Inc. | d140543dex992.htm |
| 8-K - 8-K - Clear Channel Outdoor Holdings, Inc. | d140543d8k.htm |
Exhibit 99.1
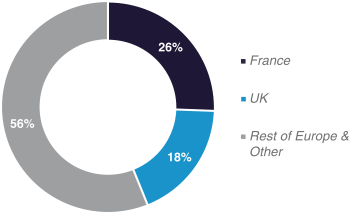
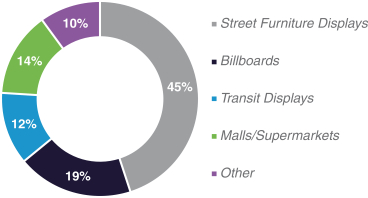
The charts below summarize the breakdown of our revenue by geography and product offering for the year ended December 31, 2019. For a description of the major markets in which we operate, see “Business—Our Major Markets.”
Revenue Breakdown By Country (2019)
Revenue by Product Offering (2019)
1
Impact of the COVID-19 Pandemic
On March 11, 2020, the COVID-19 outbreak was characterized as a pandemic by the World Health Organization. In an effort to slow the pandemic, governments around the world placed significant restrictions on travel and closed businesses, resulting in unprecedented nationwide lock-downs. Our business, along with the global economy, has been adversely affected by these developments, which have resulted in a significant reduction in time spent out of the home by consumers, reductions in consumer spending, large declines in GDP, volatile economic conditions, and business disruptions across markets globally. The full magnitude and duration of the pandemic and the resulting downturn and their impact on our business is difficult to predict.
To better ensure the health, safety and wellbeing of our employees and their families during this extraordinary time, we initially transitioned a significant portion of our employees to work from home in Italy in early March, and expanded this directive globally by the end of March. We believe these teams were able to make the shift to a remote work environment relatively seamlessly. Our advertising inventory has been used to facilitate messages of support to medical teams, first responders, delivery professionals, food service workers, and many other key workers in all parts of the world. In addition, we have provided support to governments in helping remind citizens to observe restrictions and how to stay safe.
Markets in Europe have experienced dramatic declines in customer demand as a result of COVID-19. The downward impact across some European markets started to be felt in early March, corresponding with governments issuing advice on lockdowns in markets such as Italy, France and Spain. That downward impact continued across all European markets for the majority of the second quarter. In France, our largest market, the lockdown was announced mid-March and resulted in a sharp downturn in advertising spend at the end of the first quarter. In the U.K., our second largest market, the country entered full lockdown in the last week of March.
As a result, since March, there has been a significant decline in our customers’ near-term demand as they have deferred buying decisions and reduced marketing spend. The impact of COVID-19 and the protocols
2
implemented around the world significantly affected the behavior and movement of consumers and our customers’ target audiences. Transit was the hardest hit with many people avoiding public transport for health and safety reasons. The scale and speed with which near-term demand declined, and the number of requests we received to defer or cancel contracts, has been unprecedented. We have taken, and will continue to take, steps to ensure the continuity of our platform and operations to serve our customers as local conditions permit.
In May, as new daily cases continued to fall in Europe, European countries started to gradually reopen their businesses and lift restrictions, helping mobility recover toward pre-COVID-19 levels. Following the continued return to normalized traffic levels, we are experiencing not only an uptick in bookings but also a shift in behavior from our customers, with lead time from booking to display now shorter than normal. With our high proportion of roadside advertising, we believe we are well positioned to capture the recovery in walking and driving and the resulting audience exposure to our assets.
It is unclear when an economic recovery could start and what a recovery will look like as countries emerge from this unprecedented shutdown of the global economy. In light of the rapidly-evolving impact of the COVID-19 pandemic, the magnitude and duration of its impact on our results of operations and overall financial performance will not be known until future periods. We anticipate significant adverse effects throughout our business during the remainder of the year. This is largely due to customers deferring buying decisions and reducing marketing spend.
We have taken a highly disciplined approach in managing the use of our cash through this period. We have implemented extensive cost saving initiatives, including reductions in operating costs and capital expenditures. We have taken steps that we believe will most effectively support our advertising partners to take quick advantage of renewed opportunities for connection with their customers as the pandemic restrictions begin to relax. Sales teams have been in active discussions with customers to develop advertising plans as restrictions are lifted. Importantly, we believe technology investments made before the pandemic, specifically in expanding our digital footprint, will serve to position our businesses to meet our customer’s needs. We believe that the depth of our digital inventory provides the flexibility to quickly accelerate advertising campaigns and most effectively target audiences at the right time for our advertisers. However, a second wave of the virus may result in changes or delays in our customers’ advertising plans, causing further adverse effects on our results.
Recent Developments
Our unaudited interim financial statements for the three months ended June 30, 2020 are unavailable at this time because our financial closing procedures are not yet complete. However, our results will be adversely impacted by the COVID-19 pandemic.
Our preliminary estimated range of revenue for the three months ended June 30, 2020 is expected to be between $100 million and $115 million. In addition, we expect our Adjusted EBITDA for the three months ended June 30, 2020 to be substantially negative and we do not expect to achieve positive Adjusted EBITDA for the year ended December 31, 2020.
These estimates may differ from actual results. Actual results remain subject to the completion of our quarter-end closing process, which includes a final review by our management. During the course of the preparation of the financial statements and related notes and our final review, additional items that require material adjustments to the preliminary revenue estimate presented above may be identified. Therefore, you should not place undue reliance upon these preliminary financial results. See the sections titled “Risk Factors” and “Forward-Looking Statements” for additional information regarding factors that could result in differences between the preliminary estimate of our revenue and the actual revenue we will report for the three months ended June 30, 2020.
3
The preliminary revenue estimate for the three months ended June 30, 2020 presented above has been prepared by, and is the responsibility of, management. Ernst & Young LLP, our independent auditors, has not audited, reviewed, compiled or performed any procedures with respect to such preliminary information. Accordingly, Ernst & Young LLP does not express an opinion or any other form of assurance with respect thereto.
4
SUMMARY HISTORICAL CONSOLIDATED FINANCIAL DATA
The following table sets forth summary historical consolidated financial data as of the dates and for the periods indicated. The summary historical consolidated financial data for the years ended December 31, 2019, 2018 and 2017, and as of December 31, 2019 and 2018, are derived from our audited consolidated financial statements, which are included elsewhere in this offering circular. The summary historical consolidated financial data for the three months ended March 31, 2020 and 2019 and as of March 31, 2020, are derived from our unaudited consolidated financial statements, which are included elsewhere in this offering circular. The summary historical consolidated financial data as of December 31, 2017 and March 31, 2019 are derived from our audited and unaudited consolidated financial statements, respectively, which are not included in this offering circular. In the opinion of management, the interim financial data reflects all adjustments (consisting only of normal and recurring adjustments) necessary for a fair presentation of the results for the interim periods. The summary historical financial information for the twelve months ended March 31, 2020, is not presented in accordance with GAAP and is derived by adding the historical financial information for the unaudited three months ended March 31, 2020 to the historical financial information for the year ended December 31, 2019 and subtracting the historical financial information for the unaudited three months ended March 31, 2019. The summary historical financial information for the twelve months ended March 31, 2020 has been included in this offering circular in order to provide investors with information for the latest practicable twelve-month period. Historical results are not necessarily indicative of the results to be expected for future periods and the interim results are not necessarily indicative of the results that may be expected for the full year.
The summary historical consolidated financial and other data should be read in conjunction with “Risk Factors,” “Offering Circular Summary—Impact of COVID-19 Pandemic,” “Management’s Discussion and Analysis of Financial Condition and Results of Operations,” and our consolidated financial statements and the related notes thereto included elsewhere in this offering circular. The amounts in the tables may not sum due to rounding.
| (U.S. dollars in thousands) |
Three Months Ended March 31, |
Years Ended December 31, |
Twelve Months Ended March 31, |
|||||||||||||||||||||
| 2020 | 2019 | 2019 | 2018 | 2017 | 2020 | |||||||||||||||||||
| (unaudited) | (unaudited) | (unaudited) | ||||||||||||||||||||||
| Results of Operations Data: |
||||||||||||||||||||||||
| Revenue (1) |
$ | 211,690 | $ | 243,896 | $ | 1,111,770 | $ | 1,173,616 | $ | 1,079,257 | $ | 1,079,564 | ||||||||||||
| Operating expenses: |
||||||||||||||||||||||||
| Direct operating expenses |
173,596 | 173,908 | 742,377 | 778,344 | 733,180 | 742,065 | ||||||||||||||||||
| Selling, general and administrative expenses |
53,131 | 55,205 | 235,822 | 257,125 | 233,823 | 233,748 | ||||||||||||||||||
| Corporate expenses |
8,694 | 8,425 | 28,285 | 35,736 | 49,907 | 28,554 | ||||||||||||||||||
| Depreciation and amortization |
20,356 | 19,017 | 80,642 | 83,480 | 75,867 | 81,981 | ||||||||||||||||||
| Impairment charges |
— | — | — | — | 4,159 | — | ||||||||||||||||||
| Other operating income (expense)—net |
(2,340 | ) | (377 | ) | 2,744 | 3,436 | 7,115 | 781 | ||||||||||||||||
|
|
|
|
|
|
|
|
|
|
|
|
|
|||||||||||||
| Operating income (loss) |
(46,427 | ) | (13,036 | ) | 27,388 | 22,367 | (10,564 | ) | (6,003 | ) | ||||||||||||||
| Interest expense—net |
2,583 | 12,238 | 36,878 | 48,566 | 38,934 | 27,223 | ||||||||||||||||||
| Loss on extinguishment of debt |
— | — | 10,961 | — | — | 10,961 | ||||||||||||||||||
| Other income (expense)—net |
(17,456 | ) | (2,646 | ) | 170 | (9,366 | ) | (3,081 | ) | (14,640 | ) | |||||||||||||
|
|
|
|
|
|
|
|
|
|
|
|
|
|||||||||||||
5
| (U.S. dollars in thousands) |
Three Months Ended March 31, |
Years Ended December 31, |
Twelve Months Ended March 31, |
|||||||||||||||||||||
| 2020 | 2019 | 2019 | 2018 | 2017 | 2020 | |||||||||||||||||||
| (unaudited) | (unaudited) | (unaudited) | ||||||||||||||||||||||
| Net income (loss) from continuing operations before income taxes |
(66,466 | ) | (27,920 | ) | (20,281 | ) | (35,565 | ) | (52,579 | ) | (58,827 | ) | ||||||||||||
| Income tax expense |
7,441 | 877 | 63,717 | 4,483 | 6,496 | 70,281 | ||||||||||||||||||
|
|
|
|
|
|
|
|
|
|
|
|
|
|||||||||||||
| Consolidated net loss |
(73,907 | ) | (28,797 | ) | (83,998 | ) | (40,048 | ) | (59,075 | ) | (129,108 | ) | ||||||||||||
| Less amount attributable to noncontrolling interest |
3 | 1 | 2 | 92 | 51 | 4 | ||||||||||||||||||
|
|
|
|
|
|
|
|
|
|
|
|
|
|||||||||||||
| Net loss attributable to the Company |
(73,910 | ) | (28,798 | ) | (84,000 | ) | (40,140 | ) | (59,126 | ) | (129,112 | ) | ||||||||||||
| Other comprehensive income (loss), net of tax |
1,610 | 6,557 | 26,069 | 41,582 | (60,925 | ) | 21,122 | |||||||||||||||||
|
|
|
|
|
|
|
|
|
|
|
|
|
|||||||||||||
| Comprehensive income (loss) |
(72,300 | ) | (22,241 | ) | (57,931 | ) | 1,442 | (120,051 | ) | (107,990 | ) | |||||||||||||
| Less amount attributable to noncontrolling interest |
(6 | ) | (15 | ) | (29 | ) | (28 | ) | 78 | (20 | ) | |||||||||||||
|
|
|
|
|
|
|
|
|
|
|
|
|
|||||||||||||
| Comprehensive income (loss) attributable to the Company |
$ | (72,294 | ) | $ | (22,226 | ) | $ | (57,902 | ) | $ | 1,470 | $ | (120,129 | ) | $ | (107,970 | ) | |||||||
|
|
|
|
|
|
|
|
|
|
|
|
|
|||||||||||||
| Cash Flow Data: |
||||||||||||||||||||||||
| Capital expenditures |
$ | 10,096 | $ | 11,934 | $ | 85,800 | $ | 63,967 | $ | 87,586 | $ | 83,962 | ||||||||||||
| Net cash provided by (used for) operating activities |
19,233 | 19,541 | 71,135 | 88,692 | 41,433 | 70,827 | ||||||||||||||||||
| Net cash provided by (used for) investing activities |
(9,758 | ) | (11,974 | ) | (75,494 | ) | (62,259 | ) | (90,349 | ) | (73,278 | ) | ||||||||||||
| Net cash provided by (used for) financing activities |
(285 | ) | (6,284 | ) | 6,784 | (15,793 | ) | (868 | ) | 12,783 | ||||||||||||||
| Other Financial Data: |
||||||||||||||||||||||||
| Adjusted EBITDA (1) |
(21,072 | ) | 9,601 | 123,369 | 119,849 | 75,326 | 92,696 | |||||||||||||||||
| Other Adjusted Financial Data: |
||||||||||||||||||||||||
| Ratio of senior debt to Adjusted EBITDA after giving effect to the notes offered hereby (1)(2) |
3.24x | |||||||||||||||||||||||
| First lien leverage ratio after giving effect to the notes offered |
3.24x | |||||||||||||||||||||||
| Secured leverage ratio after giving effect to the notes offered |
3.24x | |||||||||||||||||||||||
| Selected Balance Sheet Data (at end of period): |
||||||||||||||||||||||||
| Cash and cash equivalents |
$ | 43,262 | $ | 31,572 | $ | 34,498 | $ | 28,227 | $ | 21,250 | ||||||||||||||
| Current assets |
337,565 | 356,539 | 407,695 | 401,125 | 398,543 | |||||||||||||||||||
| Property, plant and equipment—net |
280,540 | 280,629 | 295,638 | 290,803 | 310,128 | |||||||||||||||||||
| Total assets |
1,500,469 | 1,799,385 | 1,592,380 | 1,248,508 | 1,277,574 | |||||||||||||||||||
| Current liabilities |
563,411 | 578,277 | 587,445 | 420,112 | 398,693 | |||||||||||||||||||
| Related party notes payable (3) |
300,684 | 1,041,849 | 301,965 | 1,047,802 | 1,079,899 | |||||||||||||||||||
| Shareholder’s equity (deficit) |
162,935 | (711,959 | ) | 236,610 | (703,717 | ) | (707,369 | ) | ||||||||||||||||
6
| (1) | We define Adjusted EBITDA as consolidated net loss, plus: income tax expense, net; all non-operating expenses (income), including other (income) expense, net, loss on extinguishment of debt, and interest expense, net; other operating (income) expense, net; impairment charges; depreciation and amortization; non-cash compensation expenses; and restructuring and other costs included within operating expenses. Restructuring and other costs include costs associated with cost savings initiatives such as severance, consulting and termination costs, and other special costs. Adjusted EBITDA is a non-GAAP financial measure. Generally, a non-GAAP financial measure is a numerical measure of a company’s performance, financial position or cash flows that either excludes or includes amounts that are not normally included or excluded in the most directly comparable measure calculated and presented in accordance with GAAP. Adjusted EBITDA does not represent and should not be considered as alternatives to net income or cash flow from operations, as determined under GAAP. We believe that Adjusted EBITDA provides investors with helpful information with respect to our operations. We present Adjusted EBITDA to provide additional information with respect to our ability to meet our future debt service, capital expenditures and working capital requirements. |
The following table summarizes the calculation of our historical Adjusted EBITDA and provides a reconciliation to our consolidated net income (loss) for the periods indicated:
| (U.S. dollars in thousands) |
Three Months Ended March 31, |
Years Ended December 31, |
Twelve Months Ended March 31 |
|||||||||||||||||||||
| 2020 | 2019 | 2019 | 2018 | 2017 | 2020 | |||||||||||||||||||
| (unaudited) | (unaudited) | (unaudited) | ||||||||||||||||||||||
| Consolidated net loss |
$ | (73,907 | ) | $ | (28,797 | ) | $ | (83,998 | ) | $ | (40,048 | ) | $ | (59,075 | ) | $ | (129,108 | ) | ||||||
| Interest expense, net |
2,583 | 12,238 | 36,878 | 48,566 | 38,934 | 27,223 | ||||||||||||||||||
| Income tax expense |
7,441 | 877 | 63,717 | 4,483 | 6,496 | 70,281 | ||||||||||||||||||
| Depreciation and amortization |
20,356 | 19,017 | 80,642 | 83,480 | 75,867 | 81,981 | ||||||||||||||||||
| Other (income) expense, net |
17,456 | 2,646 | (170 | ) | 9,366 | 3,081 | 14,640 | |||||||||||||||||
| Loss on extinguishment of debt |
— | — | 10,961 | — | — | 10,961 | ||||||||||||||||||
| Other operating (income) expense, net |
2,340 | 377 | (2,744 | ) | (3,436 | ) | (7,115 | ) | (781 | ) | ||||||||||||||
| Impairment charges |
— | — | — | — | 4,159 | — | ||||||||||||||||||
| Share-based compensation |
574 | 230 | 1,736 | 2,658 | 2,227 | 2,080 | ||||||||||||||||||
| Restructuring and other costs |
2,085 | 3,013 | 16,347 | 14,780 | 10,752 | 15,419 | ||||||||||||||||||
|
|
|
|
|
|
|
|
|
|
|
|
|
|||||||||||||
| Adjusted EBITDA |
$ | (21,072 | ) | $ | 9,601 | $ | 123,369 | $ | 119,849 | $ | 75,326 | $ | 92,696 | |||||||||||
|
|
|
|
|
|
|
|
|
|
|
|
|
|||||||||||||
| (2) | Our ratio of senior debt to Adjusted EBITDA is calculated by dividing the aggregate principal amount of our senior indebtedness to our Adjusted EBITDA for the trailing twelve month period. Our first lien leverage ratio is calculated by dividing the aggregate principal amount of our indebtedness that is secured by liens on the Collateral ranking pari passu with the liens securing the notes to our Adjusted EBITDA for the trailing twelve month period. Our secured leverage ratio is calculated by dividing the aggregate principal amount of our indebtedness that is secured by liens on the Collateral to our Adjusted EBITDA for the trailing twelve month period. For purposes of all three ratios, the aggregate principal amount of our indebtedness is calculated net of up to $50 million in unrestricted cash, and does not reflect indebtedness outstanding under the related party notes payable (including the French Intercompany Notes, which will not be subordinated to the notes offered hereby). See “Description of the Notes” for further information regarding such ratios, and footnote (3) below and “Certain Relationships and Related Party Transactions—Related Party Notes Payable” for further information regarding the related party notes payable. |
7
| (3) | In connection with this offering, and immediately prior to the closing, certain wholly-owned subsidiaries of the Issuer that are borrowers under related party notes payable to subsidiaries of Parent will capitalize interest payments due under the related party notes payable and extend the maturity date of the related party notes payable to , 2025, and certain of these related party notes payable will be subordinated to the notes offered hereby. The French Intercompany Notes will not be subordinated, but payments made under these obligations are offset in full by corresponding cash contributions to the Issuer’s other subsidiaries, such that any payments do not have any net impact on the amount of cash available to the Issuer and its subsidiaries taken as a whole. Of the $300.7 million outstanding as of March 31, 2020, $221.8 million would have been subordinated to the notes offered hereby and $78.9 million outstanding under the French Intercompany Notes would not have been subordinated. |
8
MANAGEMENT’S DISCUSSION AND ANALYSIS OF FINANCIAL CONDITION AND RESULTS OF OPERATIONS
You should read the following discussion of our results of operations and financial condition together with the information included under “Offering Circular Summary—Summary Historical Consolidated Financial Data” and the consolidated financial statements and related notes included elsewhere in this offering circular. This discussion contains forward-looking statements and involves numerous risks and uncertainties, including, but not limited to, those described under “Forward-Looking Statements” and “Risk Factors.” Actual results may differ materially from those contained in any forward-looking statements.
Management’s discussion and analysis of our financial condition and results of operations (“MD&A”) should be read in conjunction with the audited consolidated financial statements and related notes included elsewhere in this document. In this MD&A, references to (i) “we,” “us” and “our” are to Clear Channel International B.V. together with its consolidated subsidiaries, (ii) “Issuer” are to Clear Channel International B.V. without any of its subsidiaries, (iii) “Parent” and “CCOH” are to Clear Channel Outdoor Holdings, Inc., our indirect parent company, and (iv) “iHeartCommunications” are to iHeartCommunications, Inc., the indirect parent of Parent until the Separation on May 1, 2019. Certain prior period amounts included herein have been reclassified to conform to the current period presentation.
This discussion contains forward-looking statements that are subject to risks and uncertainties, and actual results may differ materially from those contained in any forward-looking statements.
Overview
Separation from iHeartCommunications
Prior to May 1, 2019, Parent was indirectly owned by iHeartCommunications and its parent company, iHeartMedia through Clear Channel Holdings, Inc. (“CCH”), a wholly-owned subsidiary of iHeartCommunications. Historically, Parent’s relationship with iHeartCommunications was governed by several agreements (the “Intercompany Agreements”) related to corporate, employee, tax and other services provided by iHeartCommunications to CCOH and its subsidiaries, including us. Certain of these costs, as applicable, were allocated to us from Parent, as further described in “Results of Operations” below.
On March 14, 2018, iHeartMedia and certain of its subsidiaries filed voluntary petitions for relief under Chapter 11 of the U.S. Bankruptcy Code. There were no material effects on our financial statements related to the iHeart Chapter 11 Cases as none of our subsidiaries or operations were guarantors of iHeartCommunications’ debt, nor were there any cross-default provisions that affected us as a result of iHeartCommunications’ default on its debt. On May 1, 2019 (the “Effective Date”), iHeartMedia emerged from bankruptcy, and CCH, CCOH and its subsidiaries, including the Company, were separated from, and ceased to be controlled by, iHeartMedia (the “Separation”). CCOH then merged with and into CCH (the “Merger”), with CCH surviving the Merger, becoming the successor to CCOH and changing its name to Clear Channel Outdoor Holdings, Inc.
In connection with the Separation, the Intercompany Agreements with iHeartCommunications were terminated, and Parent entered into a Transition Services Agreement (“TSA”) with iHeartCommunications for one year from the Effective Date (subject to certain rights of the Company to extend up to one additional year). Parent may terminate the TSA with respect to all or any individual service, in whole or in part, upon 30 days’ prior written notice, provided that any co-dependent services must be terminated concurrently.
Description of Our Business
Our revenue is derived from selling advertising space on the displays we own or operate in key markets in Europe and Singapore, consisting primarily of digital and traditional street furniture displays, billboards, transit displays and retail displays.
9
We own the majority of our advertising displays, which typically are located on sites that we either lease or own or for which we have acquired permanent easements. The significant expenses associated with our operations include site lease expenses, as well as maintenance and installation expenses. Our site lease expenses include lease payments for use of the land under our displays, as well as any revenue-sharing arrangements or minimum guaranteed amounts payable under our long-term display contracts. Our maintenance and installation expenses include costs for transporting and changing the advertising copy on our displays; related labor costs; vinyl costs, which vary according to the complexity of the advertising copy and the quantity of displays; electricity costs and costs cleaning and maintaining our displays.
Macroeconomic Indicators, Seasonality and Recent Developments
Advertising revenue is correlated to changes in gross domestic product (“GDP”) as advertising spending has historically trended in line with GDP within each market. Additionally, our results are impacted by the economic conditions in the markets in which we have operations and fluctuations in foreign currency exchange rates.
We typically experience our lowest financial performance in the first quarter of the calendar year, which has historically resulted in a loss from operations in that period. This is generally offset during the remainder of the year, as we typically experience our strongest performance in the second and fourth quarters of the calendar year.
In December 2019, it was first reported that there had been an outbreak of COVID-19 in China, which subsequently spread to most countries around the globe. In March 2020, the World Health Organization characterized the COVID-19 outbreak as a pandemic, which is still ongoing. In an effort to slow the outbreak, governments around the world placed significant restrictions on travel and closed businesses, resulting in unprecedented nationwide lock-downs. Although most lock-downs have been or are in the process of being lifted, our business, along with the global economy, has been adversely affected by these developments. Since the onset of the crisis in March, we have experienced a sharp decline in bookings and received an unprecedented level of requests to defer or cancel current contracts as customers seek to conserve cash during the economic downturn. The extent to which COVID-19 will ultimately impact our results will depend on future developments, which are highly uncertain, but the curtailed customer demand we have experienced and are continuing to experience could materially adversely impact our business, results of operations and overall financial performance in future periods.
We are closely monitoring the spread of COVID-19 and its impact on our global business, and we have implemented specific actions to strengthen our financial position and support the continuity of our platform and operations. We believe that the combination of these initiatives and cash available to us will improve our liquidity position and provide us with additional flexibility during the economic downturn; however, given the quickly evolving economic environment, continuing downward pressure we are currently seeing, and the uncertainty around how long the economic downturn and its impact on our business will last, we are unable to accurately forecast future results.
Results of Operations
Revenue and expenses “excluding the impact of movements in foreign exchange rates” in this MD&A are presented because management believes that viewing certain financial results without the impact of fluctuations in foreign currency rates facilitates period-to-period comparisons of business performance and provides useful information. Revenue and expenses “excluding the impact of movements in foreign exchange rates” are calculated by converting the current period’s revenue and expenses in local currency to U.S. dollars using average foreign exchange rates for the prior period.
Three months ended March 31, 2020 Compared to Three Months Ended March 31, 2019
Due to seasonality and uncertainty surrounding COVID-19, the results for the interim period are not indicative of expected results for the full year.
10
The comparison of our historical results of operations for the three months ended March 31, 2020 to the three months ended March 31, 2019 is as follows:
| (in thousands) | Three Months Ended March 31, |
% Change |
||||||||||
| 2020 | 2019 | |||||||||||
| Revenue |
$ | 211,690 | $ | 243,896 | (13.2 | )% | ||||||
| Operating expenses: |
||||||||||||
| Direct operating expenses (excludes depreciation and amortization) |
173,596 | 173,908 | (0.2 | )% | ||||||||
| Selling, general and administrative expenses (excludes depreciation and amortization) |
53,131 | 55,205 | (3.8 | )% | ||||||||
| Corporate expenses (excludes depreciation and amortization) |
8,694 | 8,425 | 3.2 | % | ||||||||
| Depreciation and amortization |
20,356 | 19,017 | 7.0 | % | ||||||||
| Other operating expense, net |
(2,340 | ) | (377 | ) | ||||||||
|
|
|
|
|
|||||||||
| Operating loss |
(46,427 | ) | (13,036 | ) | ||||||||
| Interest expense, net |
2,583 | 12,238 | ||||||||||
| Other expense, net |
(17,456 | ) | (2,646 | ) | ||||||||
|
|
|
|
|
|||||||||
| Net loss before income taxes |
(66,466 | ) | (27,920 | ) | ||||||||
| Income tax expense |
7,441 | 877 | ||||||||||
|
|
|
|
|
|||||||||
| Consolidated net loss |
(73,907 | ) | (28,797 | ) | ||||||||
| Less amount attributable to noncontrolling interest |
3 | 1 | ||||||||||
|
|
|
|
|
|||||||||
| Net loss attributable to the Company |
$ | (73,910 | ) | $ | (28,798 | ) | ||||||
|
|
|
|
|
|||||||||
Revenue
Revenue decreased $32.2 million, or 13.2%, during the three months ended March 31, 2020 compared to the same period of 2019. Excluding the $6.3 million impact of movements in foreign exchange rates, revenue decreased $25.9 million, or 10.6%. Revenue, particularly in France, Spain, Italy and Switzerland, was adversely affected by COVID-19 as governments locked down countries experiencing concentrated outbreaks of the virus, resulting in reduced customer demand and the loss of advertising campaigns. The non-renewal of certain contracts in Spain and Switzerland also contributed to the overall decrease in revenue, which was partially offset by a new contract in France and higher revenue from digital display expansion in the U.K. Digital revenue increased $0.2 million, or 0.3%, to $64.2 million for the three months ended March 31, 2020. Excluding the $2.0 million impact of movements in foreign exchange rates, digital revenue increased $2.2 million, or 3.4%.
Direct Operating Expenses
Direct operating expenses decreased $0.3 million, or 0.2%, during the three months ended March 31, 2020 compared to the same period of 2019. Excluding the $5.0 million impact of movements in foreign exchange rates, direct operating expenses increased $4.7 million, or 2.7%. The largest drivers of this increase were higher fixed site lease expense related to the new contract in France and higher variable expenses in the U.K. resulting from higher revenue. These increases were partially offset by lower direct operating expenses in Spain and Switzerland related to the non-renewal of certain contracts.
Selling, General and Administrative (“SG&A”) Expenses
SG&A expenses decreased $2.1 million, or 3.8%, during the three months ended March 31, 2020 compared to the same period of 2019. Excluding the $1.6 million impact of movements in foreign exchange rates, SG&A expenses decreased $0.5 million, or 0.8%.
11
Corporate Expenses
Corporate expenses increased $0.3 million, or 3.2%, during the three months ended March 31, 2020 compared to the same period of 2019. Severance costs associated with cost-savings initiatives were largely offset by an increase in Stewardship Fees charged to the Parent, which are recorded as a reduction of corporate expenses.
Depreciation and Amortization
Depreciation and amortization increased $1.3 million, or 7.0%, during the three months ended March 31, 2020 compared to the same period of 2019. Excluding the $0.5 million impact of movements in foreign exchange rates, depreciation and amortization increased $1.8 million, or 9.9%. This is primarily due to asset acquisitions, partially offset by assets becoming fully depreciated or fully amortized.
Other Operating Expense, Net
Other operating expense, net, of $2.3 million and $0.4 million for the three months ended March 31, 2020 and 2019, respectively, primarily relates to net losses on the disposal of assets.
Interest Expense, Net
Interest expense, net, decreased $9.7 million during the three months ended March 31, 2020 compared to the same period of 2019 as a result of the redemption of the Senior Notes in September 2019.
Other Expense, Net
Other expense, net, increased $14.8 million during the three months ended March 31, 2020 compared to the same period of 2019 primarily due to increases in net foreign exchange losses recognized in connection with intercompany notes denominated in various currencies.
Income Tax Expense
The effective tax rates for the three months ended March 31, 2020 and 2019 were (11.2)% and (3.1)%, respectively. The effective rates were primarily impacted by the valuation allowances recorded against deferred tax assets due to uncertainty regarding our ability to realize those assets in future periods. Specifically, we recorded an $8.6 million valuation allowance at March 31, 2020 based on significant negative evidence for the forecasted realizability of deferred tax assets in Italy due, in part, to the negative effects of COVID-19. In addition, current period losses in certain jurisdictions did not result in tax benefits due to the inability to deduct those losses for tax purposes.
12
Year Ended December 31, 2019 Compared to Year Ended December 31, 2018
The comparison of our results of operations for the years ended December 31, 2019 and 2018 is as follows:
| (U.S. dollars in thousands) | Years Ended December 31, | % Change |
||||||||||
| 2019 | 2018 | |||||||||||
| Revenue |
$ | 1,111,770 | 1,173,616 | (5.3 | )% | |||||||
| Operating expenses: |
||||||||||||
| Direct operating expenses (excludes depreciation and amortization) |
742,377 | 778,344 | (4.6 | )% | ||||||||
| Selling, general and administrative expenses (excludes depreciation and amortization) |
235,822 | 257,125 | (8.3 | )% | ||||||||
| Corporate expenses (excludes depreciation and amortization) |
28,285 | 35,736 | (20.9 | )% | ||||||||
| Depreciation and amortization |
80,642 | 83,480 | (3.4 | )% | ||||||||
| Other operating income, net |
2,744 | 3,436 | (20.1 | )% | ||||||||
|
|
|
|
|
|||||||||
| Operating income |
27,388 | 22,367 | 22.4 | % | ||||||||
| Interest expense, net |
36,878 | 48,566 | ||||||||||
| Loss on extinguishment of debt |
10,961 | — | ||||||||||
| Other income (expense), net |
170 | (9,366 | ) | |||||||||
|
|
|
|
|
|||||||||
| Net loss before income taxes |
(20,281 | ) | (35,565 | ) | ||||||||
| Income tax expense |
63,717 | 4,483 | ||||||||||
|
|
|
|
|
|||||||||
| Consolidated net loss |
(83,998 | ) | (40,048 | ) | ||||||||
| Less amount attributable to noncontrolling interest |
2 | 92 | ||||||||||
|
|
|
|
|
|||||||||
| Net loss attributable to the Company |
$ | (84,000 | ) | (40,140 | ) | |||||||
|
|
|
|
|
|||||||||
Revenue
Revenue decreased $61.8 million, or 5.3%, during 2019 compared to 2018. Excluding the $57.5 million impact from movements in foreign exchange rates, revenues decreased $4.3 million, or 0.4%, during 2019 compared to 2018. The effects of non-renewal of contracts in certain countries, including Italy and Spain, were partially offset by increases in revenue from digital display expansion in various markets, particularly in the U.K., and new contracts in France. Digital revenue increased 5.9% to $323.2 million during 2019 as compared to $305.1 million during 2018. Excluding the $16.0 million impact of movements in foreign exchange rates, digital revenue increased $34.1 million, or 11.2%, in 2019 compared to 2018.
Direct Operating Expenses
Direct operating expenses decreased $36.0 million, or 4.6%, during 2019 compared to 2018. Excluding the $39.0 million impact from movements in foreign exchange rates, direct operating expenses increased $3.0 million, or 0.4%, during 2019 compared to 2018. This increase was primarily driven by higher site lease expenses in countries experiencing revenue growth, particularly in the U.K., and in countries with new contracts, particularly in France, partially offset by lower direct operating expenses, including site lease, labor and material expenses, related to the non-renewal of contracts in Italy and Spain.
Selling, General and Administrative (“SG&A”) Expenses
SG&A expenses decreased $21.3 million, or 8.3%, during 2019 compared to 2018. Excluding the $12.4 million impact from movements in foreign exchange rates, SG&A expenses decreased $8.9 million, or 3.6%, during 2019 compared to 2018. This decrease was primarily driven by lower spending on restructuring and other cost initiatives, partially offset by higher marketing and employee compensation expenses in the U.K., primarily due to its favorable operating performance, and higher consulting fees in France.
13
Corporate Expenses
Corporate expenses decreased $7.5 million, or 20.9%, during 2019 compared to 2018. This was primarily driven by an increase in Stewardship Fees charged to Parent, which are recorded as a reduction of corporate expenses, partially offset by smaller increases in management fees allocated to us by Parent and in other corporate expenses, largely related to the investigation in Italy. Refer to Notes 7 and 10 to the Consolidated Financial Statements for additional information.
Depreciation and Amortization
Depreciation and amortization decreased $2.8 million, or 3.4%, during 2019 compared to 2018. Excluding the $4.1 million impact from movements in foreign exchange rates, depreciation and amortization increased $1.3 million. The increase is primarily due to asset acquisitions, partially offset by assets becoming fully depreciated or fully amortized.
Other Operating Income, Net
Other operating income, net, of $2.7 million and $3.4 million for 2019 and 2018, respectively, related to net gains on the disposal of assets.
Interest Expense, Net
Interest expense, net, decreased $11.7 million during 2019 compared to 2018 as a result of the redemption of the Senior Notes in September 2019.
Loss on Extinguishment of Debt
We recognized a loss on extinguishment of debt of $11.0 million in 2019 as a result of the redemption of the Senior Notes in September 2019.
Other Income (Expense), Net
Other income, net, of $0.2 million for 2019 was driven by foreign exchange gains of $1.4 million offset by loss on sale of investments.
Other expense, net, of $9.4 million for 2018 related primarily to foreign exchange losses of $8.8 million, largely recognized in connection with intercompany notes denominated in various currencies.
Income Tax Expense
In 2019, the effective tax rate of (314)% was impacted primarily by the valuation allowance recorded against deferred tax assets in certain jurisdictions due to uncertainty regarding the Company’s ability to realize those assets in future periods.
In 2018, the effective tax rate of (13)% was impacted primarily by certain nondeductible interest and other intercompany charges and the inability to benefit from losses in certain jurisdictions.
Refer to Note 11 to our Consolidated Financial Statements for additional information.
2018 Compared to 2017
For a comparison of our historical results of operations for the year ended December 31, 2018 to the year ended December 31, 2017, refer to Exhibit 99.2 of CCOH’s Current Report on Form 8-K filed with the SEC on March 5, 2019.
14
Liquidity and Capital Resources
Cash Flows
Three months ended March 31, 2020 and three months ended March 31, 2019
The following discussion highlights our cash flow activities during the three months ended March 31, 2020 and 2019:
| (in thousands) | Three Months Ended March 31, |
|||||||
| 2020 | 2019 | |||||||
| Net cash provided by (used for): |
||||||||
| Operating activities |
$ | 19,233 | $ | 19,541 | ||||
| Investing activities |
$ | (9,758 | ) | $ | (11,974 | ) | ||
| Financing activities |
$ | (285 | ) | $ | (6,284 | ) | ||
Operating Activities
During the three months ended March 31, 2020, net loss as adjusted for non-cash and non-operating items, most notably depreciation and amortization, foreign exchange transaction loss and deferred taxes, resulted in $24.6 million of net cash outflows from operating activities. This was more than offset by $43.8 million of net cash inflows related to changes in working capital balances. A decrease in accounts receivable, driven by collections exceeding sales due to a combination of normal seasonality of the business and the adverse impact of COVID-19, and an increase in accounts payable, driven by the timing of invoice payments, were partially offset by a decrease in accrued expenses, driven by payment of the 2019 bonus to employees and lower sales commissions and VAT accruals related to lower revenue.
During the three months ended March 31, 2019, net loss as adjusted for non-cash and non-operating items, most notably depreciation and amortization and non-cash capitalized interest expense, resulted in $3.2 million of net cash inflows from operating activities. Additionally, changes in working capital balances resulted in $16.4 million of net cash inflows. A decrease in accounts receivable, driven by normal seasonality of the business, and an increase in deferred revenue, driven by the invoicing of annual campaigns, were partially offset by an increase in prepaid expenses and other current assets and decreases in accounts payable and accrued expenses, driven primarily by the timing of payments.
Investing Activities
Net cash used for investing activities primarily reflects our capital expenditures of $10.1 million and $11.9 million during the three months ended March 31, 2020 and 2019, respectively, which primarily related to constructing and sustaining our street furniture and other out-of-home advertising displays, including digital boards.
Financing Activities
Net cash used for financing activities during the three months ended March 31, 2019 primarily reflects repayments on related-party notes payable of $5.4 million, whereas no payments were made on related-party notes payable during the three months ended March 31, 2020. In addition, net cash used for financing activities reflects net transfers to related parties of $0.3 million and $0.8 million during the three months ended March 31, 2020 and 2019, respectively.
15
Years ended December 31, 2019, 2018 and 2017
The following discussion highlights our cash flow activities during the years ended December 31, 2019, 2018 and 2017:
| (U.S. dollars in thousands) | Years Ended December 31, | |||||||||||
| 2019 | 2018 | 2017 | ||||||||||
| Net cash provided by (used for): |
||||||||||||
| Operating activities |
$ | 71,135 | $ | 88,692 | $ | 41,433 | ||||||
| Investing activities |
$ | (75,494 | ) | $ | (62,259 | ) | $ | (90,349 | ) | |||
| Financing activities |
$ | 6,784 | $ | (15,793 | ) | $ | (868 | ) | ||||
Operating Activities
During 2019, net loss as adjusted for non-cash and non-operating items, most notably depreciation and amortization, deferred taxes, non-cash capitalized interest expense and loss on extinguishment of debt, resulted in $92.6 million of net cash inflows from operating activities. This was partially offset by $21.5 million of net cash outflows related to changes in working capital balances, particularly accounts payable, which decreased due to the timing of payments. Cash paid for interest was $24.3 million in 2019, a decrease of $8.5 million compared to 2018 due to the redemption of the Senior Notes in September 2019.
During 2018, net loss as adjusted for non-cash and non-operating items, most notably depreciation and amortization, non-cash capitalized interest expense and foreign exchange transaction loss, resulted in $91.7 million of net cash inflows from operating activities. This was partially offset by $3.0 million of net cash outflows related to changes in working capital balances, where an increase in accounts receivable was partially offset by increases in accounts payable and accrued expenses, driven primarily by the timing of payments. Cash paid for interest was $32.8 million in 2018, an increase of $6.6 million compared to 2017 due to the issuance of $150.0 million of Senior Notes in August 2017.
During 2017, net loss as adjusted for non-cash and non-operating items, most notably depreciation and amortization and non-cash capitalized interest expense, resulted in $60.7 million of net cash inflows from operating activities. This was partially offset by $19.3 million of net cash outflows related to changes in working capital balances, particularly a decrease in accrued expenses, which were affected by the timing of payments, and an increase in accounts receivable, which was impacted by slower collections. Cash paid for interest was $26.3 million in 2017.
Investing Activities
Net cash used for investing activities primarily reflects our capital expenditures of $85.8 million, $64.0 million and $87.6 million in 2019, 2018 and 2017, respectively, which primarily related to constructing and sustaining our street furniture and other out-of-home advertising displays, including digital boards.
Financing Activities
Net cash provided by financing activities during 2019 reflects borrowings on related-party notes payable, which were primarily used to redeem the outstanding Senior Notes in September 2019. This transaction is described in further detail within this MD&A below.
Net cash used for financing activities during 2018 primarily reflects net repayments of related-party notes payable of $14.8 million.
Net cash used for financing activities during 2017 primarily reflects net transfers to related parties of $152.0 million offset by proceeds from the issuance of $150.0 million of Senior Notes in August 2017.
16
Anticipated Cash Requirements
Sources of Capital and Liquidity
Our primary sources of liquidity are cash on hand and cash flow from operations. At March 31, 2020, we had $43.3 million of cash on our balance sheet. It is CCOH’s policy to permanently reinvest the earnings of its non-U.S. subsidiaries as these earnings are generally redeployed in those jurisdictions for operating needs and continued functioning of their businesses. However, if any excess cash held by us and our subsidiaries is needed to fund operations in the U.S., CCOH has the ability to cause us to make distributions and repatriate available funds, subject to any limitations under applicable law and restrictions in our debt agreements, including the indenture governing the notes. CCOH does not have a legal obligation to do so but has the intent and ability to provide funds to us to the extent they are needed in order for us to meet our obligations as they become due.
We also have notes receivable from other wholly-owned subsidiaries of CCOH. In 2019, we reorganized our holding and financing structure and restructured our related party notes, consolidating some of our borrowing and lending activity in order to simplify intercompany funding arrangements. At March 31, 2020, we had four unsecured notes receivable from related parties, including Clear Channel Worldwide Holdings, Clear Channel Espectaculos S.L. and Clear Channel KNR Netherlands Antilles, with a total outstanding balance of $83.6 million. These notes are unsecured and bear interest at floating rates of 3.40% to 3.65% plus three-month LIBOR. As the result of an amendment, some of these notes will bear interest at 2.25% plus three-month USD LIBOR effective January 1, 2020. The note agreements allow for the provision of payment-in-kind interest, and interest is capitalized quarterly into the notes rather than paid in cash. Although the notes are repayable on demand, we have a history that supports our intent to hold these notes long-term.
Certain of our subsidiaries are the primary borrowers under various credit and overdraft facilities with European banks. As of March 31, 2020, there was $2.4 million outstanding under these facilities and there was approximately $5.3 million available for borrowings.
Uses of Capital and Liquidity
Our primary uses of liquidity are for working capital used to fund the operations of our business, capital expenditures and other funding requirements.
Prior to September 2019, we had $375.0 million aggregate principal amount outstanding of 8.75% Senior Notes, which was scheduled to mature on December 15, 2020 and bore interest at a rate of 8.75% per annum, payable semi-annually in arrears on June 15 and December 15 of each year. In September 2019, we redeemed all of the outstanding Senior Notes at a price of 102.187% of the principal amount thereof, plus accrued and unpaid interest to the redemption date, with funds provided by the Parent, thereby releasing us from our remaining obligations under the Senior Notes Indenture. During 2019, we paid $23.6 million of cash interest on this debt.
We have notes payable to other wholly-owned subsidiaries of CCOH. In 2019, we reorganized our holding and financing structure and restructured our related party notes, consolidating some of our borrowing and lending activity in order to simplify intercompany funding arrangements. As a result, at March 31, 2020, we had three unsecured related party notes payable to Clear Channel Worldwide Holdings with a total outstanding balance of $300.7 million. These notes are unsecured and bear interest at floating rates of 2.25% plus three-month USD LIBOR and 3.40% to 3.65% plus three-month EUR LIBOR. The note agreements allow for the provision of payment-in-kind interest, and interest is capitalized quarterly into the notes rather than paid out in cash. Although the notes are repayable on demand, the counterparties have represented to us that, consistent with the past, they will not require payment in the next 12 months.
The primary driver of our capital expenditure requirements is the construction of new advertising structures, including the continued deployment of digital displays in accordance with our long-term strategy to digitize our network as an alternative to traditional methods of displaying our clients’ advertisements. Additionally, we have
17
commitments relating to required purchases of property, plant, and equipment under certain street furniture contracts, and certain of our contracts contain penalties for not fulfilling our commitments related to its obligations to build bus stops, kiosks and other public amenities or advertising structures. At March 31, 2020, we had future capital expenditure commitments of $46.3 million, including $21.1 million committed for the remainder of 2020. As described below, in light of the rapidly-evolving impact of COVID-19 and the uncertainty around the related economic downturn, we are actively identifying opportunities to significantly reduce annual capital expenditures for 2020, including largely deferring discretionary growth capital expenditures, deferring sustaining capital expenditures to the extent possible, and exploring deferral options with respect to committed capital expenditures.
We also have future cash obligations under non-cancelable operating leases and other non-cancelable contracts. These costs, which are included in our direct operating expenses, have historically been satisfied by cash flows from operations. At March 31, 2020, we had future maturities of operating lease liabilities of $645.5 million, including $178.6 million maturing over the remainder of 2020, and future minimum payments under non-lease non-cancelable contracts of $772.8 million, including $130.8 million to be paid over the remainder of 2020. As described below, we are continuing discussions with landlords to align fixed site lease expenses with revenue during the economic downturn and have begun to see some success in this effort.
Trends and Uncertainties
Beginning in March 2020, we began seeing weakness in certain European markets affected by COVID-19. In light of the uncertainty presented by the unprecedented pandemic, future results are difficult to forecast. In response, we have implemented specific actions to strengthen our financial position and support the continuity of our platform and operations. These initiatives include negotiations with landlords to align fixed site lease expenses with revenue during the economic downturn; savings from lower variable compensation expense, temporary salary reductions, reduced hours for hourly employees, hiring freezes and furloughs; reducing discretionary expenses; deferring discretionary capital expenditures; and exploring options to defer our committed capital expenditures. Additionally, CCOH increased its cash on hand by selling its interest in Clear Media and by drawing $150 million on its Revolving Credit Facility. As previously described, CCOH has the intent and ability to provide funds to us to the extent they are needed in order for us to meet our obligations as they become due.
We believe that cash on hand, cash flows from operations, the initiatives that we are actively pursuing, and funding from CCOH will enable us to meet our working capital, capital expenditure and other funding requirements for at least the next 12 months. We believe our long-term plans, which include promoting outdoor media spending, capitalizing on our diverse geographic and product opportunities, and the continued deployment of digital displays, will enable us to continue generating cash flows from operations sufficient to meet our funding requirements in the long term. However, our anticipated results are subject to significant uncertainty and may be affected by events beyond our control, including prevailing economic, financial and industry conditions. Our ability to meet our funding requirements depends on the impacts from these uncertainties including the impacts related to the COVID-19 pandemic, our future operating performance, our cash flow from operations and our ability to manage our liquidity and obtain supplemental liquidity, if necessary. Additional factors may emerge as a result of the COVID-19 pandemic that could cause our expectations to change. If we are unable to generate sufficient cash through our operations or obtain sources of supplemental liquidity, we could face substantial liquidity problems, which could have a material adverse effect on our financial condition and on our ability to meet our obligations. We may take further cost-cutting measures beyond those discussed above to generate short-term liquidity in the event of an unanticipated need for cash. In addition, we regularly consider, and enter into discussions with lenders related to, potential financing alternatives, which may include supplemental liquidity through issuances of secured or unsecured debt.
We frequently evaluate strategic opportunities both within and outside our existing lines of business, and we expect from time to time to dispose of certain businesses and may pursue acquisitions. These dispositions or
18
acquisitions could be material. Specifically, as we continue to focus on operational efficiencies that drive greater margin and cash flow, CCOH will continue to review and consider opportunities to unlock shareholder value, which may include, among other things, potential asset or operational divestitures intended to deleverage and increase free cash flow.
Market Risk
We are exposed to market risks arising from changes in market rates and prices, including movements in foreign currency exchange rates and inflation.
Foreign Currency Exchange Rate Risk
We have operations in countries throughout Europe and in Singapore. Operations in these countries are measured in their local currencies, and our consolidated financial statements are presented in U.S. dollars. As a result, our financial results could be affected by factors such as changes in foreign currency exchange rates or weak economic conditions in the foreign markets in which we have operations. Changes in economic or political conditions in any of the foreign countries in which we operate, including Brexit, could result in exchange rate movement, new currency or exchange controls or other currency restrictions being imposed.
We estimate a 10% increase in the value of the U.S. dollar relative to foreign currencies would have decreased our net loss for the three months ended March 31, 2020 by $7.4 million, and a 10% decrease in the value of the U.S. dollar relative to foreign currencies would have increased our net loss for the three months ended March 31, 2020 by a corresponding amount. This analysis does not consider the implications that such currency fluctuations could have on the overall economic activity that could exist in such an environment in the U.S. or the foreign countries or on the results of operations of these foreign entities.
Inflation
Inflation is a factor in the economies in which we do business, and we continue to seek ways to mitigate its effect. Inflation has affected our performance in terms of higher costs for wages, salaries and equipment. Although the exact impact of inflation is indeterminable, we believe we have offset these higher costs by increasing the effective advertising rates of most of our outdoor display faces.
Critical Accounting Estimates
The preparation of our financial statements in conformity with U.S. GAAP requires management to make estimates, judgments and assumptions that affect the reported amounts of assets and liabilities, and disclosure of contingent assets and liabilities, at the date of the financial statements and the reported amount of expenses during the reporting period. On an ongoing basis, we evaluate our estimates that are based on historical experience and on various other assumptions that are believed to be reasonable under the circumstances. The result of these evaluations forms the basis for making judgments about the carrying values of assets and liabilities and the reported amount of revenue and expenses that are not readily apparent from other sources. Because future events and their effects cannot be determined with certainty, actual results could differ from our assumptions and estimates, and such difference could be material. Our significant accounting policies are discussed in the notes to our consolidated financial statements. Management believes that certain accounting estimates are the most critical to aid in fully understanding and evaluating our reported financial results, and they require management’s most difficult, subjective or complex judgments, resulting from the need to make estimates about the effect of matters that are inherently uncertain. These critical accounting estimates, management’s judgments and assumptions, and the effect if actual results differ from these assumptions are described in the consolidated financial statements for the year ended December 31, 2019 included in this offering circular.
In March 2020, COVID-19 was categorized as a pandemic by the World Health Organization. While the duration and severity of the effects of COVID-19 are currently unknown, we anticipate significant adverse
19
effects on our results of operations throughout our business as more customers defer advertising buying decisions and reduce marketing spend. As such, we have updated certain of our estimates and assumptions that affect the reported amounts of assets and liabilities at the date of the financial statements and the reported amount of expenses during the reporting period, as described below. There continues to be a high level of uncertainty in estimating our expected economic and operational impacts relative to COVID-19 as it is an evolving situation. As expected impacts from COVID-19 are revised, our estimates and assumptions may change, and we may experience further potential impacts to our financial statements in future periods.
Allowance for Doubtful Accounts
We evaluate the collectability of our accounts receivable based on a combination of factors. In circumstances where we are aware of a specific customer’s inability to meet its financial obligations, we record a specific reserve to reduce the amounts recorded to what we believe will be collected. For all other customers, we recognize reserves for bad debt based on historical experience for each business unit, adjusted for relative improvements or deteriorations in the agings and changes in current economic conditions.
Leases
The most significant estimates used by management in accounting for leases and the impact of these estimates are as follows:
Lease term. Lease term includes the noncancelable period of the lease together with all of the following: periods covered by an option to extend the lease if the lessee is reasonably certain to exercise that option, periods covered by an option to terminate the lease if the lessee is reasonably certain not to exercise that option, and periods covered by an option to extend (or not to terminate) the lease in which exercise of the option is controlled by the lessor. When calculating our lease liability for contracts in which we are the lessee, we generally exclude renewal periods from the lease term as we do not consider exercise of such options to be reasonably certain for most of our leases. Therefore, unless exercise of a renewal option is considered reasonably certain, the optional terms and payments are not included within the lease liability. The expected lease term is used in determining whether the lease is accounted for as an operating lease or a finance lease. A lease is considered a finance lease if the lease term is for a major part of the remaining economic life of the underlying asset. The expected lease term is also used in determining the depreciable life of the asset. An increase in the expected lease term will increase the probability that a lease may be considered a finance lease and will generally result in higher interest and depreciation expense for a leased property recorded on our balance sheet.
Incremental borrowing rate. We use the incremental borrowing rate (“IBR”) to determine the present value of lease payments at the commencement of a lease. The IBR, as defined in ASC Topic 842, is the rate of interest that a lessee would have to pay to borrow on a collateralized basis over a similar term at an amount equal to the lease payments in a similar economic environment. We also use the IBR in determining whether the lease is accounted for as an operating lease or a finance lease. An increase in the IBR decreases the net present value of the minimum lease payments and reduces the probability that a lease will be considered a finance lease.
Fair market value of leased asset. The fair market value of leased property is generally estimated based on comparable market data as provided by third-party sources. Fair market value is used in determining whether the lease is accounted for as an operating lease or a finance lease. A higher fair market value as compared to the present value of lease payments reduces the likelihood that a lease will be considered a finance lease.
Long-lived Assets
Long-lived assets, including property, plant and equipment and intangibles assets, are reported at historical cost less accumulated depreciation and amortization. We estimate the useful lives for various types of advertising structures and other long-lived assets based on our historical experience and our plans regarding how we intend
20
to use those assets. Advertising structures have different lives depending on their nature, with large format bulletins generally having longer depreciable lives and posters and other displays having shorter depreciable lives. Street furniture and transit displays are depreciated over their estimated useful lives or appropriate contractual periods, whichever is shorter. Our experience indicates that the estimated useful lives applied to our portfolio of assets have been reasonable, and we do not expect significant changes to the estimated useful lives of our long-lived assets in the future. When we determine that structures or other long-lived assets will be disposed of prior to the end of their useful lives, we estimate the revised useful lives and depreciate the assets over the revised period. We also review long-lived assets for impairment when events and circumstances indicate that depreciable and amortizable long-lived assets might be impaired and the undiscounted cash flows estimated to be generated by those assets are less than the carrying amounts of those assets. When specific assets are determined to be unrecoverable, the cost basis of the asset is reduced to reflect the current fair market value.
We use various assumptions in determining the remaining useful lives of assets to be disposed of prior to the end of their useful lives and in determining the current fair market value of long-lived assets that are determined to be unrecoverable. Estimated useful lives and fair values are sensitive to factors including contractual commitments, regulatory requirements, future expected cash flows, industry growth rates and discount rates, as well as future salvage values. Our impairment loss calculations require management to apply judgment in estimating future cash flows, including forecasting useful lives of the assets and selecting the discount rate that reflects the risk inherent in future cash flows.
Goodwill
Goodwill represents the excess of the purchase price over the fair value of identifiable net assets acquired in business combinations. We test goodwill at interim dates if events or changes in circumstances indicate that goodwill might be impaired. The fair value of our reporting unit is used to apply value to the net assets of each reporting unit. To the extent that the carrying amount of net assets would exceed the fair value, an impairment charge is recorded. The discounted cash flow approach that we use for valuing goodwill as part of the impairment testing approach involves estimating future cash flows expected to be generated from the related assets, discounted to their present value using a risk-adjusted discount rate. Terminal values are also estimated and discounted to their present value.
As described in Note 5 to our unaudited consolidated financial statements included elsewhere in this offering circular, historically, we treated each country in which we operate as a separate reporting unit for purposes of our annual goodwill impairment test; however, due to a change in the way the business is managed, we had only one reporting unit as of January 1, 2020. Corresponding with this change in our reporting units, we tested goodwill for impairment immediately before and after this change utilizing a discount rate of approximately 8.5% to 9.0% for each of our reporting units, and an estimated perpetual growth rate of 3.0%. This testing did not identify impairment.
Additionally, due to the expected impacts from COVID-19, we tested our goodwill for impairment as of March 31, 2020 in accordance with ASC 350-20-35; however, this did not result in any impairment of goodwill during the three months ended March 31, 2020. In determining the fair value of our reporting unit, we used the following assumptions:
| • | Expected cash flows underlying our business plans for the periods 2020 through 2024, which are based on detailed, multi-year forecasts performed by each of our operating segments and reflect the advertising outlook across our businesses; |
| • | Cash flows beyond 2024 are projected to grow at a perpetual growth rate, which we estimated at 3.0%; and |
| • | In order to risk adjust the cash flow projections in determining fair value, we utilized a discount rate of 9.5%. |
21
Based on our assessment using the assumptions described above, a hypothetical 10% reduction in the estimated fair value in each of our reporting units would not result in a material impairment condition.
Tax Provisions
Our estimates of income taxes and the significant items giving rise to the deferred tax assets and liabilities are shown in the notes to our consolidated financial statements and reflect our assessment of actual future taxes to be paid on items reflected in the financial statements, giving consideration to both timing and probability of these estimates. Actual income taxes could vary from these estimates due to future changes in income tax law or results from the final review of our tax returns by foreign tax authorities.
We use our best and most informed judgment to determine whether it is more likely than not that our deferred tax assets will be realized. Deferred tax assets are reduced by valuation allowances if we believe it is more likely than not that some portion or the entire asset will not be realized.
We also use our best and most informed judgment to determine whether it is more likely than not that we will sustain positions that we have taken on tax returns and, if so, the amount of benefit to initially recognize within our financial statements. We regularly review our uncertain tax positions and adjust our unrecognized tax benefits (“UTBs”) in light of changes in facts and circumstances, such as changes in tax law, interactions with taxing authorities and developments in case law. These adjustments to our UTBs may affect our income tax expense, and settlement of uncertain tax positions may require use of our cash.
Litigation Accruals
We are currently involved in certain legal proceedings. Based on current assumptions, we have accrued an estimate of the probable costs for the resolution of those claims for which the occurrence of loss is probable and the amount can be reasonably estimated. Management’s estimates have been developed in consultation with counsel and are based upon an analysis of potential results, assuming a combination of litigation and settlement strategies. Future results of operations could be materially affected by changes in these assumptions or the effectiveness of our strategies related to these proceedings. Additionally, due to the inherent uncertainty of litigation, there can be no assurance that the resolution of any particular claim or proceeding would not have a material adverse effect on our financial condition or results of operations.
Asset Retirement Obligations
ASC Subtopic 410-20 requires us to estimate our obligation to dismantle and remove our advertising structures from leased land or property and to restore the site to its original condition upon the termination or non-renewal of a lease or contract. An estimate of third-party cost information is used with respect to the dismantling of the structures and the restoration of the site, and the retirement period is estimated for each obligation based on contract terms. The interest rate used to calculate the present value of such costs over the retirement period is based on an estimated risk-adjusted credit rate for the same period.
22
CLEAR CHANNEL INTERNATIONAL B.V. AND SUBSIDIARIES
CONSOLIDATED BALANCE SHEETS
| (In thousands) | March 31, 2020 (unaudited) |
December 31, 2019 |
||||||
| CURRENT ASSETS | ||||||||
| Cash and cash equivalents |
$ | 43,262 | $ | 34,498 | ||||
| Accounts receivable |
244,502 | 322,839 | ||||||
| Less: Allowance for credit losses |
(8,254 | ) | (6,507 | ) | ||||
|
|
|
|
|
|||||
| Accounts receivable, net |
236,248 | 316,332 | ||||||
| Prepaid expenses |
27,082 | 29,366 | ||||||
| Other current assets |
30,973 | 27,499 | ||||||
|
|
|
|
|
|||||
| Total Current Assets |
337,565 | 407,695 | ||||||
| NON-CURRENT ASSETS | ||||||||
| Property, plant and equipment, net |
280,540 | 295,638 | ||||||
| Intangible assets, net |
12,107 | 12,642 | ||||||
| Goodwill |
180,518 | 185,641 | ||||||
| Operating lease right-of-use assets |
572,122 | 566,597 | ||||||
| Related party notes receivable |
83,602 | 84,897 | ||||||
| Other assets |
34,015 | 39,270 | ||||||
|
|
|
|
|
|||||
| Total Assets |
$ | 1,500,469 | $ | 1,592,380 | ||||
|
|
|
|
|
|||||
| CURRENT LIABILITIES | ||||||||
| Accounts payable |
$ | 89,673 | $ | 56,507 | ||||
| Accrued expenses |
229,336 | 286,889 | ||||||
| Current operating lease liabilities |
204,615 | 211,617 | ||||||
| Deferred revenue |
39,787 | 32,432 | ||||||
|
|
|
|
|
|||||
| Total Current Liabilities |
563,411 | 587,445 | ||||||
| NON-CURRENT LIABILITIES | ||||||||
| Related party notes payable |
300,684 | 301,965 | ||||||
| Non-current operating lease liabilities |
378,779 | 372,105 | ||||||
| Other long-term liabilities |
94,660 | 94,255 | ||||||
|
|
|
|
|
|||||
| Total Liabilities |
1,337,534 | 1,355,770 | ||||||
|
|
|
|
|
|||||
| Commitments and contingencies (Note 8) |
||||||||
| SHAREHOLDER’S EQUITY | ||||||||
| Noncontrolling interest |
331 | 334 | ||||||
| Parent Company’s net investment |
(279,074 | ) | (204,136 | ) | ||||
| Accumulated other comprehensive income |
441,678 | 440,412 | ||||||
|
|
|
|
|
|||||
| Total Shareholder’s Equity |
162,935 | 236,610 | ||||||
|
|
|
|
|
|||||
| Total Liabilities and Shareholder’s Equity |
$ | 1,500,469 | $ | 1,592,380 | ||||
|
|
|
|
|
|||||
See Notes to Consolidated Financial Statements
F-2
CLEAR CHANNEL INTERNATIONAL B.V. AND SUBSIDIARIES
CONSOLIDATED STATEMENTS OF COMPREHENSIVE LOSS
(UNAUDITED)
| (In thousands) | Three Months Ended March 31, | |||||||
| 2020 | 2019 | |||||||
| Revenue |
$ | 211,690 | 243,896 | |||||
| Operating expenses: |
||||||||
| Direct operating expenses (excludes depreciation and amortization) |
173,596 | 173,908 | ||||||
| Selling, general and administrative expenses (excludes depreciation and amortization) |
53,131 | 55,205 | ||||||
| Corporate expenses (excludes depreciation and amortization) |
8,694 | 8,425 | ||||||
| Depreciation and amortization |
20,356 | 19,017 | ||||||
| Other operating expense, net |
(2,340 | ) | (377 | ) | ||||
|
|
|
|
|
|||||
| Operating loss |
(46,427 | ) | (13,036 | ) | ||||
| Interest expense, net |
2,583 | 12,238 | ||||||
| Other expense, net |
(17,456 | ) | (2,646 | ) | ||||
|
|
|
|
|
|||||
| Net loss before income taxes |
(66,466 | ) | (27,920 | ) | ||||
| Income tax expense |
7,441 | 877 | ||||||
|
|
|
|
|
|||||
| Consolidated net loss |
(73,907 | ) | (28,797 | ) | ||||
| Less amount attributable to noncontrolling interest |
3 | 1 | ||||||
|
|
|
|
|
|||||
| Net loss attributable to the Company |
$ | (73,910 | ) | $ | (28,798 | ) | ||
|
|
|
|
|
|||||
| Other comprehensive income: |
||||||||
| Foreign currency translation adjustments |
1,610 | 6,557 | ||||||
|
|
|
|
|
|||||
| Other comprehensive income |
1,610 | 6,557 | ||||||
|
|
|
|
|
|||||
| Comprehensive loss |
(72,300 | ) | (22,241 | ) | ||||
| Less amount attributable to noncontrolling interest |
(6 | ) | (15 | ) | ||||
|
|
|
|
|
|||||
| Comprehensive loss attributable to the Company |
$ | (72,294 | ) | $ | (22,226 | ) | ||
|
|
|
|
|
|||||
See Notes to Consolidated Financial Statements
F-3
CLEAR CHANNEL INTERNATIONAL B.V. AND SUBSIDIARIES
CONSOLIDATED STATEMENTS OF CASH FLOWS
(UNAUDITED)
| (In thousands) | Three Months Ended March 31, |
|||||||
| 2020 | 2019 | |||||||
| Cash flows from operating activities: |
||||||||
| Consolidated net loss |
$ | (73,907 | ) | $ | (28,797 | ) | ||
| Reconciling items: |
||||||||
| Depreciation and amortization |
20,356 | 19,017 | ||||||
| Deferred taxes |
8,444 | 505 | ||||||
| Provision for doubtful accounts |
402 | 378 | ||||||
| Amortization of deferred financing charges and note premiums, net |
— | 475 | ||||||
| Share-based compensation |
574 | 230 | ||||||
| Loss on disposal of operating assets, net |
2,172 | 377 | ||||||
| Non-cash capitalized interest expense |
— | 8,850 | ||||||
| Foreign exchange transaction loss |
17,399 | 2,320 | ||||||
| Other reconciling items, net |
(29 | ) | (171 | ) | ||||
| Changes in operating assets and liabilities: |
||||||||
| Decrease in accounts receivable |
71,741 | 42,456 | ||||||
| Increase in prepaid expenses and other current assets |
(5,049 | ) | (11,225 | ) | ||||
| Increase (decrease) in accounts payable |
34,424 | (9,960 | ) | |||||
| Decrease in accrued expenses |
(45,983 | ) | (10,925 | ) | ||||
| Increase in deferred revenue |
7,950 | 20,294 | ||||||
| Changes in other operating assets and liabilities, net |
(19,261 | ) | (14,283 | ) | ||||
|
|
|
|
|
|||||
| Net cash provided by operating activities |
19,233 | 19,541 | ||||||
|
|
|
|
|
|||||
| Cash flows from investing activities: |
||||||||
| Purchases of property, plant and equipment |
(10,096 | ) | (11,934 | ) | ||||
| Proceeds from disposal of assets |
5 | 111 | ||||||
| Proceeds from the sale of investments |
333 | — | ||||||
| Increase in related party notes receivable, net |
— | (147 | ) | |||||
| Other investing activities, net |
— | (4 | ) | |||||
|
|
|
|
|
|||||
| Net cash used for investing activities |
(9,758 | ) | (11,974 | ) | ||||
|
|
|
|
|
|||||
| Cash flows from financing activities: |
||||||||
| Net transfers to related parties |
(285 | ) | (845 | ) | ||||
| Decrease in related party notes payable, net |
— | (5,439 | ) | |||||
|
|
|
|
|
|||||
| Net cash used for financing activities |
(285 | ) | (6,284 | ) | ||||
|
|
|
|
|
|||||
| Effect of exchange rate changes on cash, cash equivalents and restricted cash |
(2,645 | ) | (113 | ) | ||||
|
|
|
|
|
|||||
| Net increase in cash, cash equivalents and restricted cash |
6,545 | 1,170 | ||||||
| Cash, cash equivalents and restricted cash at beginning of period |
48,194 | 44,393 | ||||||
|
|
|
|
|
|||||
| Cash, cash equivalents and restricted cash at end of period |
$ | 54,739 | $ | 45,563 | ||||
|
|
|
|
|
|||||
| Supplemental Disclosures: |
||||||||
| Cash paid for interest |
271 | 236 | ||||||
| Cash paid for income taxes, net of refunds |
3,134 | 2,970 | ||||||
See Notes to Consolidated Financial Statements
F-4
CLEAR CHANNEL INTERNATIONAL B.V. AND SUBSIDIARIES
CONSOLIDATED STATEMENTS OF CHANGES IN SHAREHOLDER’S EQUITY (DEFICIT)
(UNAUDITED)
| (In thousands) | The Company | Non-controlling Interest |
Consolidated | |||||||||
| Balance, January 1, 2020 |
$ | 236,276 | $ | 334 | $ | 236,610 | ||||||
| Adoption of ASU 2016-13, Credit Losses |
(1,667 | ) | — | (1,667 | ) | |||||||
| Net income (loss) |
(73,910 | ) | 3 | (73,907 | ) | |||||||
| Foreign currency translation adjustments |
1,616 | (6 | ) | 1,610 | ||||||||
| Net transfers from related parties |
289 | — | 289 | |||||||||
|
|
|
|
|
|
|
|||||||
| Balance, March 31, 2020 |
$ | 162,604 | $ | 331 | $ | 162,935 | ||||||
|
|
|
|
|
|
|
|||||||
| (In thousands) | The Company | Non-controlling Interest |
Consolidated | |||||||||
| Balance, January 1, 2019 |
$ | (704,401 | ) | $ | 684 | $ | (703,717 | ) | ||||
| Adoption of ASC 842, Leases |
14,613 | — | 14,613 | |||||||||
| Net income (loss) |
(28,798 | ) | 1 | (28,797 | ) | |||||||
| Foreign currency translation adjustments |
6,572 | (15 | ) | 6,557 | ||||||||
| Net transfers to related parties |
(615 | ) | — | (615 | ) | |||||||
|
|
|
|
|
|
|
|||||||
| Balance, March 31, 2019 |
$ | (712,629 | ) | $ | 670 | $ | (711,959 | ) | ||||
|
|
|
|
|
|
|
|||||||
See Notes to Consolidated Financial Statements
F-5
CLEAR CHANNEL INTERNATIONAL B.V. AND SUBSIDIARIES
NOTES TO CONSOLIDATED FINANCIAL STATEMENTS
(UNAUDITED)
NOTE 1 – NATURE OF BUSINESS AND BASIS OF PRESENTATION
Nature of Business
Clear Channel Outdoor Holdings, Inc. (“CCOH” or the “Parent Company”) is an outdoor advertising company that owns and operates advertising display faces in the United States (“U.S.”) and internationally. CCOH’s international business, Clear Channel International (“CCI”), operates in Europe, Asia and Latin America and provides advertising on street furniture and transit displays, billboards, mall displays, Smartbike programs, wallscapes and other displays, which are owned or operated under lease agreements. Clear Channel International B.V. (“CCIBV” or the “Company”) is a subsidiary of the CCI business and consists of CCI operations in Europe and Singapore. These consolidated financial statements represent the consolidated results of operations, financial position and cash flows of CCIBV.
COVID-19 Update
In March 2020, the World Health Organization categorized coronavirus diseases 2019 (“COVID-19”) as a pandemic. COVID-19 continues to spread throughout countries across the world, and the duration and severity of its effects are currently unknown. The Company is implementing and evaluating actions to strengthen its financial position and support the continuity of its platform and operations.
Basis of Presentation
These consolidated financial statements are presented in accordance with U.S. generally accepted accounting principles (“GAAP”) and have been derived from the accounting records of CCIBV using the historical results of operations and historical bases of assets and liabilities of the Company. Assets, liabilities, revenues and expenses that pertain to the Company and its subsidiaries have been included in these consolidated financial statements, which include the results of operations in Belgium, Denmark, Estonia, Finland, France, the Netherlands, Ireland, Italy, Latvia, Lithuania, Norway, Poland, Singapore, Spain, Sweden, Switzerland and the United Kingdom (“U.K.”). The consolidated financial statements also include the accounts of entities for which the Company has a controlling financial interest or is the primary beneficiary. All significant intercompany accounts have been eliminated upon consolidation.
The Company utilizes the services of CCOH and CCI for certain functions, such as legal, finance, internal audit, financial reporting, tax, insurance, global information technology, environmental matters and human resources services, including various employee benefit programs. The cost of these services has been allocated to the Company and included in these consolidated financial statements. The Company’s management considers these allocations to have been made on a reasonable basis. Refer to Note 6 to the Company’s consolidated financial statements for a complete discussion of the relationship with CCOH, including a description of the costs that have been allocated to the Company.
The preparation of the consolidated financial statements in conformity with U.S. GAAP requires management to make estimates, judgments, and assumptions that affect the amounts reported in the consolidated financial statements and accompanying notes. Such estimates and assumptions affect, among other things, the Company’s goodwill, long-lived assets, operating lease right-of-use assets and operating lease liabilities, assessment of the annual effective tax rate, valuation of deferred income taxes and income tax contingencies, the allowance for doubtful accounts, assessment of our lease and non-lease contract expenses, and measurement of compensation cost for bonus and other compensation plans. The Company bases its estimates on historical experience and on various other assumptions that are believed to be reasonable under the circumstances, but actual results could differ from those estimates. The Company’s assessment of conditions and events, considered in the aggregate,
F-6
CLEAR CHANNEL INTERNATIONAL B.V. AND SUBSIDIARIES
NOTES TO CONSOLIDATED FINANCIAL STATEMENTS (CONTINUED)
(UNAUDITED)
indicate it will be able to meet its obligations as they become due within one year after the date of these financial statements. There continues to be a high level of uncertainty in estimating the expected economic and operational impacts relative to COVID-19 as it is an evolving situation. The estimates and assumptions used in the first quarter 2020 financial statements may change in future periods as the expected impacts from COVID-19 are revised, resulting in further potential impacts to the Company’s financial statements.
The consolidated financial statements included herein may not be indicative of the financial position, results of operations or cash flows had CCIBV operated as a separate entity during the periods presented or for future periods. As these consolidated financial statements present a portion of the businesses of CCOH, the net assets of CCIBV have been presented as CCOH’s net investment in CCIBV. CCOH’s investment in CCIBV includes the accumulated deficit of CCIBV, net of cash transfers related to cash management functions performed by CCOH.
Certain prior period amounts have been reclassified to conform to the 2020 presentation.
NOTE 2 – NEW ACCOUNTING PRONOUNCEMENTS
New Accounting Pronouncements Recently Adopted
As of January 1, 2020, the Company adopted Accounting Standards Update (“ASU”) 2016-13, Measurement of Credit Losses on Financial Statements, which changed the methodology used to recognize impairment of the Company’s accounts receivable. Under the ASU, financial assets are presented at the net amount expected to be collected, requiring immediate recognition of estimated credit losses expected to occur over the asset’s remaining life. This is in contrast to previous GAAP, under which credit losses were not recognized until it was probable that a loss had been incurred. The Company adopted the ASU on a modified-retrospective basis through a cumulative-effect adjustment to retained earnings as of January 1, 2020, resulting in a decrease to equity of $1.7 million. The Company performed its expected credit loss calculation based on historical accounts receivable write-offs.
New Accounting Pronouncements Not Yet Adopted
During the third quarter of 2018, the FASB issued ASU 2018-14, Compensation – Retirement Benefits (Subtopic 715-20): Disclosure Framework – Changes to the Disclosure Requirements for Defined Benefit Plans. This update is designed to improve the effectiveness of disclosures related to defined benefit plans. The standard is effective for annual and interim periods beginning after December 15, 2021 for nonpublic entities. The Company is currently evaluating the impact of the provisions of this new standard on its consolidated financial statements.
In December 2019, the FASB issued ASU 2019-12, Simplifying the Accounting for Income Taxes, which simplifies the accounting for income taxes by removing certain existing exceptions to the general principles in Topic 740. The new guidance is effective for annual and interim periods beginning after December 2020, and early adoption is permitted. The Company is currently evaluating the impact of the new guidance on its consolidated financial statements.
NOTE 3 – REVENUE
The Company generates revenue primarily from the sale of advertising space on printed and digital out-of-home advertising displays. Certain of these revenue transactions are considered leases for accounting purposes as the contracts convey to customers the right to control the use of the Company’s advertising displays for a period of time. The Company accounts for revenue from leases in accordance with the lease accounting guidance under Accounting Standards Codification (“ASC”) Topic 842; all remaining revenue transactions are accounted for as revenue from contracts with customers under ASC Topic 606.
F-7
CLEAR CHANNEL INTERNATIONAL B.V. AND SUBSIDIARIES
NOTES TO CONSOLIDATED FINANCIAL STATEMENTS (CONTINUED)
(UNAUDITED)
Disaggregation of Revenue
The following table shows revenue from contracts with customers, revenue from leases and total revenue, disaggregated by geographical region, for the three months ended March 31, 2020 and 2019:
| (In thousands) | Revenue from contracts with customers |
Revenue from leases |
Total Revenue |
|||||||||
| Three Months Ended March 31, 2020 |
| |||||||||||
| France |
$ | 47,279 | $ | 4,898 | $ | 52,177 | ||||||
| United Kingdom |
46,017 | 153 | 46,170 | |||||||||
| Rest of Europe and other |
93,894 | 19,449 | 113,343 | |||||||||
|
|
|
|
|
|
|
|||||||
| Total |
$ | 187,190 | $ | 24,500 | $ | 211,690 | ||||||
|
|
|
|
|
|
|
|||||||
| Three Months Ended March 31, 2019 |
| |||||||||||
| France |
$ | 52,359 | $ | 5,597 | $ | 57,956 | ||||||
| United Kingdom |
38,359 | 6,149 | 44,508 | |||||||||
| Rest of Europe and other |
113,143 | 28,289 | 141,432 | |||||||||
|
|
|
|
|
|
|
|||||||
| Total |
$ | 203,861 | $ | 40,035 | $ | 243,896 | ||||||
|
|
|
|
|
|
|
|||||||
Revenue from Contracts with Customers
The following tables show the Company’s beginning and ending accounts receivable and deferred revenue balances from contracts with customers:
| Three Months Ended March 31, | ||||||||
| (In thousands) | 2020 | 2019 | ||||||
| Accounts receivable, net of allowance, from contracts with customers: |
||||||||
| Beginning balance |
$ | 291,702 | $ | 246,874 | ||||
| Ending balance |
$ | 214,359 | $ | 230,247 | ||||
| Deferred revenue from contracts with customers: |
||||||||
| Beginning balance |
$ | 24,902 | $ | 22,742 | ||||
| Ending balance |
$ | 28,530 | $ | 34,911 | ||||
During the three months ended March 31, 2020 and 2019, respectively, the Company recognized $16.3 million and $14.4 million of revenue that was included in the deferred revenue from contracts with customers balance at the beginning of the quarter.
The Company’s contracts with customers generally have terms of one year or less; however, as of March 31, 2020, the Company expects to recognize $41.1 million of revenue in future periods for remaining performance obligations from current contracts with customers that have an original expected duration of greater than one year. Approximately one third of these remaining performance obligations are expected to be recognized over the next year, with the remainder to be recognized through 2025.
F-8
CLEAR CHANNEL INTERNATIONAL B.V. AND SUBSIDIARIES
NOTES TO CONSOLIDATED FINANCIAL STATEMENTS (CONTINUED)
(UNAUDITED)
NOTE 4 – PROPERTY, PLANT AND EQUIPMENT
Property, Plant and Equipment
The Company’s property, plant and equipment consisted of the following classes of assets at March 31, 2020 and December 31, 2019:
| (In thousands) | March 31, 2020 |
December 31, 2019 |
||||||
| Structures |
$ | 510,722 | $ | 519,959 | ||||
| Furniture and other equipment |
135,030 | 139,981 | ||||||
| Land, buildings and improvements |
34,031 | 34,834 | ||||||
| Construction in progress |
30,940 | 31,121 | ||||||
|
|
|
|
|
|||||
| 710,723 | 725,895 | |||||||
| Less: Accumulated depreciation |
430,183 | 430,257 | ||||||
|
|
|
|
|
|||||
| Property, plant and equipment, net |
$ | 280,540 | $ | 295,638 | ||||
|
|
|
|
|
|||||
Total depreciation expense related to property, plant and equipment for the three months ended March 31, 2020 and 2019 was $20.0 million and $18.5 million, respectively.
NOTE 5 – INTANGIBLE ASSETS AND GOODWILL
Intangible Assets
The following table presents the gross carrying amount and accumulated amortization for intangible assets as of March 31, 2020 and December 31, 2019:
| March 31, 2020 | December 31, 2019 | |||||||||||||||
| (In thousands) | Gross Carrying Amount |
Accumulated Amortization |
Gross Carrying Amount |
Accumulated Amortization |
||||||||||||
| Intangible assets |
$ | 216,765 | $ | (204,658 | ) | $ | 223,934 | $ | (211,292 | ) | ||||||
Total amortization expense related to definite-lived intangible assets for the three months ended March 31, 2020 and 2019 was $0.3 million and $0.5 million, respectively.
Goodwill
Historically, the Company treated each country in which it operates as a separate reporting unit for purposes of its annual goodwill impairment test. However, due to a change in the way the business is managed, the Company has only one reporting unit as of January 1, 2020. The Company tested goodwill for impairment for each reporting unit immediately before and after this change, and no impairment was identified.
Due to the expected negative financial statement impacts from COVID-19, the Company also tested its goodwill for impairment as of March 31, 2020; however, this did not result in any goodwill impairment charges. As expectations and projections of the financial statement impacts of COVID-19 are revised, the Company’s estimates and assumptions may change, and impairments may be recognized in future periods.
F-9
CLEAR CHANNEL INTERNATIONAL B.V. AND SUBSIDIARIES
NOTES TO CONSOLIDATED FINANCIAL STATEMENTS (CONTINUED)
(UNAUDITED)
The following table presents the changes in the carrying amount of goodwill during the three months ended March 31, 2020:
| (In thousands) | ||||
| Balance as of December 31, 2019(1) |
$ | 185,641 | ||
| Foreign currency |
(5,123 | ) | ||
|
|
|
|||
| Balance as of March 31, 2020 |
$ | 180,518 | ||
|
|
|
|||
| (1) | The balance at December 31, 2019 is net of cumulative impairments of $191.4 million. |
NOTE 6 – RELATED PARTY TRANSACTIONS
Agreements with CCOH
Cash Management Arrangement
The Parent Company’s policy is to permanently reinvest the earnings of its non-U.S. subsidiaries as these earnings are generally redeployed in those jurisdictions for operating needs and continued functioning of their businesses. However, if any excess cash held by the Company and its subsidiaries is needed to fund operations in the U.S., the Parent Company has the ability to cause the Company to make distributions and repatriate available funds, subject to any limitations under applicable law. Similarly, the Parent Company has the intent and ability to provide funds to the Company to the extent they are needed in order for the Company to meet its obligations as they become due.
Management Services
Prior to May 1, 2019, iHeartCommunications and CCOH provided management services to the Company, and starting on May 1, 2019, CCOH provides management services to the Company, which include, among other things: treasury and other financial-related services; certain executive officer services; legal and related services; licensing of intellectual property, copyrights, trademarks and other intangible assets; and other general corporate services. These services are charged to the Company based on actual direct costs incurred or allocated by CCOH based on headcount, revenue or other factors on a pro rata basis. For the three months ended March 31, 2020 and 2019, the Company recorded $5.6 million and $5.3 million, respectively, for these services, which are included in “Corporate expenses” in the Consolidated Statements of Comprehensive Loss.
Stewardship Fee
As described in Note 1, the Company is a subsidiary of CCOH, a publicly traded company. As a result, the Company incurs certain costs related to quarterly and annual reporting in order for the Parent Company to comply with the Securities and Exchange Commission (“SEC”) reporting requirements. In addition, the Company incurs costs related to the preparation of budgets, forecasts and other strategic initiatives of the Parent Company. Such costs are charged back to CCOH on a quarterly basis (“Stewardship Fees”) based on the time incurred by employees of the Company to perform the work. Stewardship fees charged to CCOH during the three months ended March 31, 2020 and 2019 were $9.6 million and $6.4 million, respectively. Such costs are included as a reduction of “Corporate expenses” in the Statements of Comprehensive Loss.
Related Party Notes
The Company has notes payable to and receivable from other wholly-owned subsidiaries of CCOH. The note agreements allow for the provision of payment-in-kind interest, and the Company’s historical policy was to settle
F-10
CLEAR CHANNEL INTERNATIONAL B.V. AND SUBSIDIARIES
NOTES TO CONSOLIDATED FINANCIAL STATEMENTS (CONTINUED)
(UNAUDITED)
quarterly interest payments and receipts in a cash-free manner, by capitalizing interest into the notes. During the three months ended March 31, 2019, the Company capitalized $8.9 million in interest payable, which had been accrued in relation to related party notes payable, and $5.5 million in interest receivable, which had been recorded as income in relation to related party notes receivable.
In late 2019, the Company reorganized its holding and financing structure and restructured its related party notes, consolidating some of its borrowing and lending activity in order to simplify intercompany funding arrangements. The new note agreements do not have a requirement that interest be paid-in-kind; as such, the Company did not capitalize any interest into its related party notes payable or related party notes receivable during the three months ended March 31, 2020.
Related Party Notes Payable
The Company is the borrower of three unsecured notes payable to Clear Channel Worldwide Holdings, Inc. These notes, which bear interest at floating rates of 2.25% plus three-month USD LIBOR and 3.40% to 3.65% plus three-month EUR LIBOR, include $221.8 million denominated in USD, with the remainder in Euro currency. Although the notes are repayable on demand, the counterparty has represented to us that, consistent with the past, it will not require payment in the next 12 months; therefore, the notes payable are presented as long-term liabilities. Related party notes payable at March 31, 2020 and December 31, 2019 were as follows:
| (In thousands) | March 31, 2020 |
December 31, 2019 |
||||||
| Notes due to Clear Channel Worldwide Holdings, Inc. |
$ | 300,684 | $ | 301,965 | ||||
Related Party Notes Receivable
The Company, as lender, has outstanding notes receivable balances with three related parties, which are unsecured and repayable on demand. The Company has a history that supports its intent to hold these notes long-term. Related party notes receivable March 31, 2020 and December 31, 2019 consisted of:
| (In thousands) | March 31, 2020 |
December 31, 2019 |
||||||
| Notes due from: |
||||||||
| Clear Channel Worldwide Holdings, Inc.(1) |
$ | 78,864 | $ | 80,146 | ||||
| Clear Channel Espectaculos S.L.(2) |
4,011 | 4,011 | ||||||
| Clear Channel KNR Neth Antilles N.V.(2) |
727 | 740 | ||||||
|
|
|
|
|
|||||
| Total Related Party Notes Receivable |
$ | 83,602 | $ | 84,897 | ||||
|
|
|
|
|
|||||
| (1) | The Company has two outstanding notes receivable from Clear Channel Worldwide Holdings, Inc. These notes, which are denominated in Euro currency, bear interest at a floating rate of 3.40% to 3.65% plus three-month EUR LIBOR. |
| (2) | The Company has outstanding notes receivable from Clear Channel Espectaculos S.L. and Clear Channel KNR Neth Antilles N.V. These notes, which are denominated in USD currency, bear interest at 2.25% plus three-month USD LIBOR. |
NOTE 7 – POSTRETIREMENT BENEFIT PLANS
Certain of the Company’s subsidiaries participate in defined-benefit or defined-contribution plans that cover substantially all regular employees. The Company deposits funds under various fiduciary-type arrangements or
F-11
CLEAR CHANNEL INTERNATIONAL B.V. AND SUBSIDIARIES
NOTES TO CONSOLIDATED FINANCIAL STATEMENTS (CONTINUED)
(UNAUDITED)
provides reserves for these plans. Benefits under the defined-benefit plans are typically based either on years of service and the employee’s compensation (generally during a fixed number of years immediately before retirement) or on annual credits. The range of assumptions that are used for the defined-benefit plans reflect the different economic environments within the various countries.
Defined-Benefit Pension Plan Financial Information
The table below presents the components of net periodic cost recognized in the Consolidated Statements of Comprehensive Loss:
| (In thousands) | Three Months Ended March 31, | |||||||
| 2020 | 2019 | |||||||
| Service cost |
$ | 808 | $ | 827 | ||||
| Settlement gain |
(359 | ) | — | |||||
| Interest cost |
674 | 927 | ||||||
| Expected returns on plan assets |
(1,286 | ) | (1,405 | ) | ||||
| Amortization of actuarial losses |
248 | 198 | ||||||
| Amortization of prior service credits |
(73 | ) | (70 | ) | ||||
|
|
|
|
|
|||||
| Total net periodic pension cost |
$ | 12 | $ | 477 | ||||
|
|
|
|
|
|||||
Plan Contributions
It is the Company’s general practice to fund amounts for pensions sufficient to meet the minimum requirements set forth in applicable employee benefits laws and local tax laws. From time to time, the Company contributes additional amounts as it deems appropriate. The Company contributed $0.6 million and $0.5 million to defined-benefit pension plans during the three months ended March 31, 2020 and 2019, respectively.
Defined-Contribution Retirement Plans
The Company’s employees participate in retirement plans administered as a service by third-party administrators. The Company contributed $2.9 million and $3.5 million to defined-contribution plans during the three months ended March 31, 2020 and 2019, respectively. Such costs were recorded within “Selling, general and administrative expenses.”
NOTE 8 – COMMITMENTS, CONTINGENCIES AND GUARANTEES
Legal Proceedings
The Company and its subsidiaries are involved in certain legal proceedings arising in the ordinary course of business and, as required, have accrued an estimate of the probable costs for the resolution of those claims for which the occurrence of loss is probable and the amount can be reasonably estimated. These estimates have been developed in consultation with counsel and are based upon an analysis of potential results, assuming a combination of litigation and settlement strategies. It is possible, however, that future results of operations for any particular period could be materially affected by changes in the Company’s assumptions or the effectiveness of its strategies related to these proceedings. Additionally, due to the inherent uncertainty of litigation, there can be no assurance that the resolution of any particular claim or proceeding would not have a material adverse effect on the Company’s financial condition or results of operations.
F-12
CLEAR CHANNEL INTERNATIONAL B.V. AND SUBSIDIARIES
NOTES TO CONSOLIDATED FINANCIAL STATEMENTS (CONTINUED)
(UNAUDITED)
Although the Company is involved in a variety of legal proceedings in the ordinary course of business, a large portion of the Company’s litigation arises in the following contexts: commercial disputes, employment and benefits related claims, land use and zoning, governmental fines, intellectual property claims, tax disputes and regulatory disputes.
Italy Investigation
During the three months ended June 30, 2018, the Company identified misstatements associated with VAT obligations in its business in Italy, which resulted in an understatement of its VAT obligation. These misstatements resulted in an understatement of other long-term liabilities of $16.9 million as of December 31, 2017. The effect of these misstatements is reflected in the historical financial statements in the appropriate periods. Upon identification of these misstatements, the Company undertook certain procedures, including a forensic investigation. In addition, the Company voluntarily disclosed the matter and findings to the Italian tax authorities in order to commence a discussion on the appropriate calculation of the VAT position.
The current expectation is that the Company may have to repay to the Italian tax authority a substantial portion of the VAT previously applied as a credit in relation to the transactions under investigation, amounting to approximately $20.4 million, including estimated possible penalties and interest. As of March 31, 2020, the Company had made payments of $8.1 million and applied VAT recoverable of $1.7 million; the timing of the remaining repayment has not been finalized. The ultimate amount to be paid may differ from the estimates, and such differences may be material.
Surety Bonds and Guarantees
As of March 31, 2020, the Company had outstanding surety bonds of $43.5 million, supported by $20.2 million of letters of credit held by CCOH, and outstanding bank guarantees of $26.2 million, of which $11.3 million were backed by cash collateral. Additionally, as of March 31, 2020, CCOH had outstanding surety bonds of $15.9 million held on behalf of the Company and its subsidiaries.
NOTE 9 – INCOME TAXES
Significant components of the provision for income tax expense are as follows:
| (In thousands) | Three Months Ended March 31, | |||||||
| 2020 | 2019 | |||||||
| Current tax expense (benefit) |
$ | (1,002 | ) | $ | 372 | |||
| Deferred tax expense |
8,443 | 505 | ||||||
|
|
|
|
|
|||||
| Income tax expense |
$ | 7,441 | $ | 877 | ||||
|
|
|
|
|
|||||
The effective tax rates for the three months ended March 31, 2020 and 2019 were (11.2)% and (3.1)%, respectively. The effective rates were primarily impacted by valuation allowances recorded against deferred tax assets due to uncertainty regarding the Company’s ability to realize those assets in future periods. Specifically, the Company recorded an $8.6 million valuation allowance at March 31, 2020 based on significant negative evidence for the forecasted realizability of deferred tax assets in Italy due, in part, to the negative effects of COVID-19. In addition, current period losses in certain jurisdictions did not result in tax benefits due to the inability to deduct those losses for tax purposes.
F-13
CLEAR CHANNEL INTERNATIONAL B.V. AND SUBSIDIARIES
NOTES TO CONSOLIDATED FINANCIAL STATEMENTS (CONTINUED)
(UNAUDITED)
NOTE 10 – OTHER INFORMATION
Balance Sheets
The following table discloses the components of “Other current assets”:
| (In thousands) | March 31, 2020 |
December 31, 2019 |
||||||
| Inventory |
$ | 17,976 | $ | 18,880 | ||||
| Restricted cash |
3,981 | 4,116 | ||||||
| Income taxes receivable |
4,117 | — | ||||||
| Other receivables |
2,718 | 2,256 | ||||||
| Deposits |
271 | 310 | ||||||
| Other |
1,910 | 1,937 | ||||||
|
|
|
|
|
|||||
| Total other current assets |
$ | 30,973 | $ | 27,499 | ||||
|
|
|
|
|
|||||
The following table discloses the components of “Other assets”:
| (In thousands) | March 31, 2020 |
December 31, 2019 |
||||||
| Restricted cash |
$ | 7,496 | $ | 9,580 | ||||
| Advertising taxes receivable |
1,871 | 7,431 | ||||||
| Deposits |
13,839 | 6,535 | ||||||
| Investments |
5,690 | 5,914 | ||||||
| Deferred income taxes(1) |
— | 4,503 | ||||||
| Prepaid expenses |
956 | 1,088 | ||||||
| Other |
4,163 | 4,219 | ||||||
|
|
|
|
|
|||||
| Total other assets |
$ | 34,015 | $ | 39,270 | ||||
|
|
|
|
|
|||||
| (1) | The decrease in deferred income tax assets is primarily due to valuation allowances recorded against deferred tax assets as it was no longer more likely than not that the assets would be realizable. Refer to Note 9 for additional details. |
The following table discloses the components of “Accrued expenses”:
| (In thousands) | March 31, 2020 |
December 31, 2019 |
||||||
| Accrued employee compensation and benefits |
$ | 77,945 | $ | 107,344 | ||||
| Accrued rent |
88,249 | 86,387 | ||||||
| Accrued taxes |
10,453 | 20,095 | ||||||
| Accrued other |
52,689 | 73,063 | ||||||
|
|
|
|
|
|||||
| Total accrued expenses |
$ | 229,336 | $ | 286,889 | ||||
|
|
|
|
|
|||||
F-14
CLEAR CHANNEL INTERNATIONAL B.V. AND SUBSIDIARIES
NOTES TO CONSOLIDATED FINANCIAL STATEMENTS (CONTINUED)
(UNAUDITED)
The following table discloses the components of “Other long-term liabilities”:
| (In thousands) | March 31, 2020 |
December 31, 2019 |
||||||
| Postretirement benefit obligation |
$ | 44,808 | $ | 46,364 | ||||
| Asset retirement obligation |
24,069 | 24,560 | ||||||
| Unrecognized tax benefits |
6,812 | 7,720 | ||||||
| Deferred income taxes(1) |
3,851 | — | ||||||
| Other |
15,120 | 15,611 | ||||||
|
|
|
|
|
|||||
| Total other long-term liabilities |
$ | 94,660 | $ | 94,255 | ||||
|
|
|
|
|
|||||
| (1) | The increase in deferred income tax liabilities is primarily due to valuation allowances recorded against deferred tax assets as it was no longer more likely than not that the assets would be realizable. Refer to Note 9 for additional details. |
Statements of Comprehensive Loss
The following table discloses the components of “Other expense, net”:
| (In thousands) | Three Months Ended March 31, | |||||||
| 2020 | 2019 | |||||||
| Foreign exchange loss |
$ | (17,399 | ) | $ | (2,320 | ) | ||
| Equity in earnings (loss) of nonconsolidated affiliates |
— | (348 | ) | |||||
| Other |
(57 | ) | 22 | |||||
|
|
|
|
|
|||||
| Total other expense, net |
$ | (17,456 | ) | $ | (2,646 | ) | ||
|
|
|
|
|
|||||
Statements of Cash Flows
The following table provides a reconciliation of cash and cash equivalents and restricted cash reported in the Consolidated Balance Sheets to the total of the amounts of cash, cash equivalents and restricted cash reported in the Consolidated Statements of Cash Flows:
| (In thousands) | March 31, 2020 |
December 31, 2019 |
||||||
| Cash and cash equivalents |
$ | 43,262 | $ | 34,498 | ||||
| Restricted cash included in: |
||||||||
| Other current assets |
3,981 | 4,116 | ||||||
| Other assets |
7,496 | 9,580 | ||||||
|
|
|
|
|
|||||
| Total cash, cash equivalents and restricted cash in the Statements of Cash Flows |
$ | 54,739 | $ | 48,194 | ||||
|
|
|
|
|
|||||
NOTE 11 – SUBSEQUENT EVENTS
In connection with the preparation of the financial statements and in accordance with ASC Subtopic 855-10, Subsequent Events – Overall, management has evaluated and reviewed the affairs of the Company for subsequent events that would impact the financial statements for the period ended March 31, 2020 through July 20, 2020, the date the financial statements were available to be issued.
F-15
CLEAR CHANNEL INTERNATIONAL B.V. AND SUBSIDIARIES
NOTES TO CONSOLIDATED FINANCIAL STATEMENTS (CONTINUED)
(UNAUDITED)
CCIBV Note
On May 15, 2020, the Company issued a promissory note (the “CCIBV Note”) in principal amount of approximately $53.0 million. The CCIBV Note, which matures on May 15, 2022, bears interest at a rate of 14.00% per annum in cash (or 16.00% per annum if paid-in-kind), to be paid quarterly. The CCIBV Note contains restrictions on restricted payments and incurrence of indebtedness by the Company and is guaranteed by the Parent Company, a certain other parent entity of CCIBV and certain subsidiaries of CCIBV.
Related-Party Note Payable
In May 2020, the Company entered into a related party note payable to Clear Channel KNR Netherlands Antilles, and as of June 30, 2020 had drawn down $52.5 million in cash. The note bears interest at the aggregate of 3 month USD LIBOR and 2.25 percent or such other rate as may be agreed between the parties. Interest will accrue and be payable quarterly and repayment is due on demand. Although the note is repayable on demand, the counterparty has represented to us that it will not require payment in the next 12 months. The note may be rolled over on the repayment date or other date as agreed between the parties.
F-16
Report of Independent Auditors
The Directors of Clear Channel International B.V.:
We have audited the accompanying consolidated financial statements of Clear Channel International B.V. and subsidiaries, which comprise the consolidated balance sheets as of December 31, 2019 and 2018 and the related consolidated statements of comprehensive income (loss), cash flows and changes in shareholder’s equity (deficit) for each of the three years in the period ended December 31, 2019, and the related notes to the consolidated financial statements.
Management’s Responsibility for the Financial Statements
Management is responsible for the preparation and fair presentation of these financial statements in conformity with U.S. generally accepted accounting principles; this includes the design, implementation and maintenance of internal control relevant to the preparation and fair presentation of financial statements that are free of material misstatement, whether due to fraud or error.
Auditor’s Responsibility
Our responsibility is to express an opinion on these financial statements based on our audits. We conducted our audits in accordance with auditing standards generally accepted in the United States. Those standards require that we plan and perform the audit to obtain reasonable assurance about whether the financial statements are free of material misstatement.
An audit involves performing procedures to obtain audit evidence about the amounts and disclosures in the financial statements. The procedures selected depend on the auditor’s judgment, including the assessment of the risks of material misstatement of the financial statements, whether due to fraud or error. In making those risk assessments, the auditor considers internal control relevant to the entity’s preparation and fair presentation of the financial statements in order to design audit procedures that are appropriate in the circumstances, but not for the purpose of expressing an opinion on the effectiveness of the entity’s internal control. Accordingly, we express no such opinion. An audit also includes evaluating the appropriateness of accounting policies used and the reasonableness of significant accounting estimates made by management, as well as evaluating the overall presentation of the financial statements.
We believe that the audit evidence we have obtained is sufficient and appropriate to provide a basis for our audit opinion.
Opinion
In our opinion, the financial statements referred to above present fairly, in all material respects, the consolidated financial position of Clear Channel International B.V. and subsidiaries at December 31, 2019 and 2018, and the consolidated results of their operations and their cash flows for each of the three years in the period ended December 31, 2019 in conformity with U.S. generally accepted accounting principles.
Adoption of New Accounting Standard
As discussed in Note 2 to the consolidated financial statements, the Company changed its method of accounting for leases effective January 1, 2019. Our opinion is not modified with respect to this matter.
/s/ Ernst & Young, LLP
San Antonio, Texas
June 30, 2020
F-17
CLEAR CHANNEL INTERNATIONAL B.V. AND SUBSIDIARIES
CONSOLIDATED BALANCE SHEETS
| (In thousands) | December 31, 2019 |
December 31, 2018 |
||||||
| CURRENT ASSETS | ||||||||
| Cash and cash equivalents |
$ | 34,498 | $ | 28,227 | ||||
| Accounts receivable, net of allowance of $6,507 and $8,253, respectively |
316,332 | 315,407 | ||||||
| Prepaid expenses |
29,366 | 30,696 | ||||||
| Other current assets |
27,499 | 26,795 | ||||||
|
|
|
|
|
|||||
| Total Current Assets |
407,695 | 401,125 | ||||||
| NON-CURRENT ASSETS | ||||||||
| Property, plant and equipment, net |
295,638 | 290,803 | ||||||
| Intangible assets, net |
12,642 | 13,524 | ||||||
| Goodwill |
185,641 | 187,741 | ||||||
| Operating lease right-of-use assets |
566,597 | — | ||||||
| Related party notes receivable |
84,897 | 249,159 | ||||||
| Other assets |
39,270 | 106,156 | ||||||
|
|
|
|
|
|||||
| Total Assets |
$ | 1,592,380 | $ | 1,248,508 | ||||
|
|
|
|
|
|||||
| CURRENT LIABILITIES | ||||||||
| Accounts payable |
$ | 56,507 | $ | 79,430 | ||||
| Accrued expenses |
286,889 | 305,037 | ||||||
| Current operating lease liabilities |
211,617 | — | ||||||
| Deferred revenue |
32,432 | 35,645 | ||||||
|
|
|
|
|
|||||
| Total Current Liabilities |
587,445 | 420,112 | ||||||
| NON-CURRENT LIABILITIES | ||||||||
| Long-term debt |
— | 371,007 | ||||||
| Related party subordinated notes payable |
301,965 | 1,047,802 | ||||||
| Non-current operating lease liabilities |
372,105 | — | ||||||
| Other long-term liabilities |
94,255 | 113,304 | ||||||
|
|
|
|
|
|||||
| Total Liabilities |
1,355,770 | 1,952,225 | ||||||
|
|
|
|
|
|||||
| Commitments and contingencies (Note 10) |
||||||||
| SHAREHOLDER’S EQUITY (DEFICIT) | ||||||||
| Noncontrolling interest |
334 | 684 | ||||||
| Parent Company’s net investment |
(204,136 | ) | (1,120,442 | ) | ||||
| Accumulated other comprehensive income |
440,412 | 416,041 | ||||||
|
|
|
|
|
|||||
| Total Shareholder’s Equity (Deficit) |
236,610 | (703,717 | ) | |||||
|
|
|
|
|
|||||
| Total Liabilities and Shareholder’s Equity (Deficit) |
$ | 1,592,380 | $ | 1,248,508 | ||||
|
|
|
|
|
|||||
See Notes to Consolidated Financial Statements
F-18
CLEAR CHANNEL INTERNATIONAL B.V. AND SUBSIDIARIES
CONSOLIDATED STATEMENTS OF COMPREHENSIVE INCOME (LOSS)
| (In thousands) | Years Ended December 31, | |||||||||||
| 2019 | 2018 | 2017 | ||||||||||
| Revenue |
$ | 1,111,770 | $ | 1,173,616 | $ | 1,079,257 | ||||||
| Operating expenses: |
||||||||||||
| Direct operating expenses (excludes depreciation and amortization) |
742,377 | 778,344 | 733,180 | |||||||||
| Selling, general and administrative expenses (excludes depreciation and amortization) |
235,822 | 257,125 | 233,823 | |||||||||
| Corporate expenses (excludes depreciation and amortization) |
28,285 | 35,736 | 49,907 | |||||||||
| Depreciation and amortization |
80,642 | 83,480 | 75,867 | |||||||||
| Impairment charges |
— | — | 4,159 | |||||||||
| Other operating income, net |
2,744 | 3,436 | 7,115 | |||||||||
|
|
|
|
|
|
|
|||||||
| Operating income (loss) |
27,388 | 22,367 | (10,564 | ) | ||||||||
| Interest expense, net |
36,878 | 48,566 | 38,934 | |||||||||
| Loss on extinguishment of debt |
10,961 | — | — | |||||||||
| Other income (expense), net |
170 | (9,366 | ) | (3,081 | ) | |||||||
|
|
|
|
|
|
|
|||||||
| Net loss before income taxes |
(20,281 | ) | (35,565 | ) | (52,579 | ) | ||||||
| Income tax expense |
63,717 | 4,483 | 6,496 | |||||||||
|
|
|
|
|
|
|
|||||||
| Consolidated net loss |
(83,998 | ) | (40,048 | ) | (59,075 | ) | ||||||
| Less amount attributable to noncontrolling interest |
2 | 92 | 51 | |||||||||
|
|
|
|
|
|
|
|||||||
| Net loss attributable to the Company |
$ | (84,000 | ) | $ | (40,140 | ) | $ | (59,126 | ) | |||
|
|
|
|
|
|
|
|||||||
| Other comprehensive income (loss), net of tax: |
||||||||||||
| Foreign currency translation adjustments |
25,932 | 40,118 | (66,885 | ) | ||||||||
| Unrealized gain on marketable securities |
— | — | 4 | |||||||||
| Pension adjustments to comprehensive income (loss), net of tax of $40, $222 and $(322), respectively |
(1,153 | ) | (1,498 | ) | 6,720 | |||||||
| Reclassification adjustment for amortization of pension actuarial gains and net period costs included in operating expenses, net of tax of $(40), $616 and $219, respectively |
1,290 | 2,962 | 879 | |||||||||
| Reclassification adjustment for realized cumulative translation adjustments on sale of businesses included in Other operating income, net |
— | — | (1,643 | ) | ||||||||
|
|
|
|
|
|
|
|||||||
| Other comprehensive income (loss), net of tax |
26,069 | 41,582 | (60,925 | ) | ||||||||
|
|
|
|
|
|
|
|||||||
| Comprehensive income (loss) |
(57,931 | ) | 1,442 | (120,051 | ) | |||||||
| Less amount attributable to noncontrolling interest |
(29 | ) | (28 | ) | 78 | |||||||
|
|
|
|
|
|
|
|||||||
| Comprehensive income (loss) attributable to the Company |
$ | (57,902 | ) | $ | 1,470 | $ | (120,129 | ) | ||||
|
|
|
|
|
|
|
|||||||
See Notes to Consolidated Financial Statements
F-19
CLEAR CHANNEL INTERNATIONAL B.V. AND SUBSIDIARIES
CONSOLIDATED STATEMENTS OF CASH FLOWS
| (In thousands) | Years Ended December 31, | |||||||||||
| 2019 | 2018 | 2017 | ||||||||||
| Cash flows from operating activities: |
||||||||||||
| Consolidated net loss |
$ | (83,998 | ) | $ | (40,048 | ) | $ | (59,075 | ) | |||
| Reconciling items: |
||||||||||||
| Depreciation and amortization |
80,642 | 83,480 | 75,867 | |||||||||
| Impairment charges |
— | — | 4,159 | |||||||||
| Deferred taxes |
53,899 | 2,432 | 5,114 | |||||||||
| Provision for doubtful accounts |
257 | 1,714 | 1,966 | |||||||||
| Amortization of deferred financing charges and note premiums, net |
1,290 | 1,778 | 1,741 | |||||||||
| Share-based compensation |
1,736 | 2,658 | 2,227 | |||||||||
| Loss on extinguishment of debt |
10,961 | — | — | |||||||||
| Gain on disposal of operating assets, net |
(2,744 | ) | (3,436 | ) | (7,115 | ) | ||||||
| Non-cash capitalized interest expense |
32,469 | 35,939 | 33,402 | |||||||||
| Foreign exchange transaction loss (gain) |
(1,423 | ) | 8,812 | 3,880 | ||||||||
| Other reconciling items, net |
(447 | ) | (1,588 | ) | (1,454 | ) | ||||||
| Changes in operating assets and liabilities: |
||||||||||||
| Increase in accounts receivable |
(1,845 | ) | (25,315 | ) | (12,237 | ) | ||||||
| Decrease (increase) in prepaid expenses and other current assets |
(15,355 | ) | 7,274 | 821 | ||||||||
| Increase (decrease) in accounts payable |
(21,195 | ) | 6,088 | 3,493 | ||||||||
| Increase (decrease) in accrued expenses |
30,208 | 11,401 | (15,173 | ) | ||||||||
| Increase (decrease) in deferred revenue |
(2,346 | ) | 5,616 | (3,489 | ) | |||||||
| Changes in other operating assets and liabilities, net |
(10,974 | ) | (8,113 | ) | 7,306 | |||||||
|
|
|
|
|
|
|
|||||||
| Net cash provided by operating activities |
71,135 | 88,692 | 41,433 | |||||||||
|
|
|
|
|
|
|
|||||||
| Cash flows from investing activities: |
||||||||||||
| Purchases of property, plant and equipment |
(85,800 | ) | (63,967 | ) | (87,586 | ) | ||||||
| Proceeds from disposal of assets |
4,983 | 2,969 | 7,947 | |||||||||
| Proceeds from the sale of investments |
848 | 469 | 6,735 | |||||||||
| Decrease (increase) in related party notes receivable, net |
5,031 | (763 | ) | (15,246 | ) | |||||||
| Other investing activities, net |
(556 | ) | (967 | ) | (2,199 | ) | ||||||
|
|
|
|
|
|
|
|||||||
| Net cash used for investing activities |
(75,494 | ) | (62,259 | ) | (90,349 | ) | ||||||
|
|
|
|
|
|
|
|||||||
| Cash flows from financing activities: |
||||||||||||
| Proceeds from long-term debt |
— | — | 156,000 | |||||||||
| Payments on long-term debt |
(383,258 | ) | (444 | ) | (648 | ) | ||||||
| Net transfers from (to) related parties |
230 | (540 | ) | (151,963 | ) | |||||||
| Increase (decrease) in related party notes payable, net |
390,402 | (14,809 | ) | 127 | ||||||||
| Other financing activities, net |
(590 | ) | — | (4,384 | ) | |||||||
|
|
|
|
|
|
|
|||||||
| Net cash provided by (used for) financing activities |
6,784 | (15,793 | ) | (868 | ) | |||||||
| Effect of exchange rate changes on cash |
1,376 | (2,501 | ) | 3,886 | ||||||||
|
|
|
|
|
|
|
|||||||
| Net increase (decrease) in cash, cash equivalents and restricted cash |
3,801 | 8,139 | (45,898 | ) | ||||||||
| Cash, cash equivalents and restricted cash at beginning of period |
44,393 | 36,254 | 82,152 | |||||||||
|
|
|
|
|
|
|
|||||||
| Cash, cash equivalents and restricted cash at end of period |
$ | 48,194 | $ | 44,393 | $ | 36,254 | ||||||
|
|
|
|
|
|
|
|||||||
| Supplemental Disclosures: |
||||||||||||
| Cash paid for interest |
$ | 24,302 | $ | 32,813 | $ | 26,250 | ||||||
| Cash paid for income taxes, net of refunds |
$ | 6,988 | $ | 8,303 | $ | 9,081 | ||||||
See Notes to Consolidated Financial Statements
F-20
CLEAR CHANNEL INTERNATIONAL B.V. AND SUBSIDIARIES
CONSOLIDATED STATEMENTS OF CHANGES IN SHAREHOLDER’S EQUITY (DEFICIT)
| (In thousands) | The Company | Non-controlling Interest |
Consolidated | |||||||||
| Balances, December 31, 2016 |
$ | (477,669 | ) | $ | 1,671 | $ | (475,998 | ) | ||||
| Net income (loss) |
(59,126 | ) | 51 | (59,075 | ) | |||||||
| Foreign currency translation adjustments |
(66,963 | ) | 78 | (66,885 | ) | |||||||
| Pension adjustments to comprehensive loss |
6,720 | — | 6,720 | |||||||||
| Payments to noncontrolling interests |
— | (3 | ) | (3 | ) | |||||||
| Disposal of non-controlling interest |
— | (1,046 | ) | (1,046 | ) | |||||||
| Net transfers to related parties |
(110,329 | ) | — | (110,329 | ) | |||||||
| Reclassification adjustments |
(764 | ) | — | (764 | ) | |||||||
| Other, net |
142 | (131 | ) | 11 | ||||||||
|
|
|
|
|
|
|
|||||||
| Balances, December 31, 2017 |
$ | (707,989 | ) | $ | 620 | $ | (707,369 | ) | ||||
|
|
|
|
|
|
|
|||||||
| Net income (loss) |
(40,140 | ) | 92 | (40,048 | ) | |||||||
| Foreign currency translation adjustments |
40,146 | (28 | ) | 40,118 | ||||||||
| Pension adjustments to comprehensive income |
(1,498 | ) | — | (1,498 | ) | |||||||
| Net transfers from related parties |
2,118 | — | 2,118 | |||||||||
| Reclassification adjustments |
2,962 | — | 2,962 | |||||||||
|
|
|
|
|
|
|
|||||||
| Balances, December 31, 2018 |
$ | (704,401 | ) | $ | 684 | $ | (703,717 | ) | ||||
|
|
|
|
|
|
|
|||||||
| Adoption of ASC 842, Leases |
14,613 | — | 14,613 | |||||||||
| Net income (loss) |
(84,000 | ) | 2 | (83,998 | ) | |||||||
| Foreign currency translation adjustments |
25,961 | (29 | ) | 25,932 | ||||||||
| Pension adjustments to comprehensive income |
(1,153 | ) | — | (1,153 | ) | |||||||
| Payments to non-controlling interests |
— | (323 | ) | (323 | ) | |||||||
| Net transfers to related parties |
(23,466 | ) | — | (23,466 | ) | |||||||
| Conversion of related party notes to equity |
1,007,432 | — | 1,007,432 | |||||||||
| Reclassification adjustments |
1,290 | 1,290 | ||||||||||
|
|
|
|
|
|
|
|||||||
| Balances, December 31, 2019 |
$ | 236,276 | $ | 334 | $ | 236,610 | ||||||
|
|
|
|
|
|
|
|||||||
See Notes to Consolidated Financial Statements
F-21
CLEAR CHANNEL INTERNATIONAL B.V. AND SUBSIDIARIES
NOTES TO CONSOLIDATED FINANCIAL STATEMENTS
NOTE 1 – NATURE OF BUSINESS AND BASIS OF PRESENTATION
Nature of Business
Clear Channel Outdoor Holdings, Inc. (“CCOH” or the “Parent Company”) is an outdoor advertising company that owns and operates advertising display faces in the United States (“U.S.”) and internationally. CCOH’s international business, Clear Channel International (“CCI”), operates in Europe, Asia and Latin America and provides advertising on street furniture and transit displays, billboards, mall displays, Smartbike programs, wallscapes and other displays, which are owned or operated under lease agreements. Clear Channel International B.V. (“CCIBV” or the “Company”) is a subsidiary of the CCI business and consists of CCI operations in Europe and Singapore. These consolidated financial statements represent the consolidated results of operations, financial position and cash flows of CCIBV.
History
CCOH became a publicly traded company through an initial public offering (“IPO”) on November 11, 2005. Prior to the IPO, CCOH was an indirect wholly-owned subsidiary of iHeartCommunications, Inc. (“iHeartCommunications”), a diversified media and entertainment company. As of December 31, 2018, Clear Channel Holdings, Inc. (“CCH”), a subsidiary of iHeartCommunications, held 89.1% of CCOH’s shares outstanding and approximately 100% of the voting power.
On March 14, 2018, iHeartMedia, Inc. (“iHeartMedia”), the parent company of iHeartCommunications, and certain of its subsidiaries including iHeartCommunications and CCH, (collectively, the “Debtors”) filed voluntary petitions for reorganization (the “iHeart Chapter 11 Cases”) under Chapter 11 of the U.S. Bankruptcy Code. CCOH and its direct and indirect subsidiaries, including the Company and its subsidiaries, did not file petitions for relief under the Bankruptcy Code and were not Debtors in the iHeart Chapter 11 Cases.
On May 1, 2019 (the “Effective Date”), iHeartMedia emerged from bankruptcy, and CCH, CCOH and its subsidiaries were separated from, and ceased to be controlled by, iHeartMedia and iHeartCommunications through a series of transactions (the “Separation”). CCOH then merged with and into CCH (the “Merger”), with CCH surviving the Merger, becoming the successor to CCOH and changing its name to Clear Channel Outdoor Holdings, Inc.
Basis of Presentation
These consolidated financial statements are presented in accordance with U.S. generally accepted accounting principles (“GAAP”) and have been derived from the accounting records of CCIBV using the historical results of operations and historical bases of assets and liabilities of the Company. Assets, liabilities, revenues and expenses that pertain to the Company and its subsidiaries have been included in these consolidated financial statements, which include the results of operations in the following markets: Belgium, Denmark, Estonia, Finland, France, the Netherlands, Ireland, Italy, Latvia, Lithuania, Norway, Poland, Singapore, Spain, Sweden, Switzerland and the United Kingdom (“U.K.”).The consolidated financial statements also include the accounts of entities for which the Company has a controlling financial interest or is the primary beneficiary. All significant intercompany accounts have been eliminated upon consolidation.
The Company utilizes the services of CCOH and CCI for certain functions, such as legal, finance, internal audit, financial reporting, tax, insurance, global information technology, environmental matters and human resources services, including various employee benefit programs. The cost of these services has been allocated to the Company and included in these consolidated financial statements. The Company’s management considers these allocations to have been made on a reasonable basis. Refer to Note 7 to the Company’s consolidated financial
F-22
CLEAR CHANNEL INTERNATIONAL B.V. AND SUBSIDIARIES
NOTES TO CONSOLIDATED FINANCIAL STATEMENTS (CONTINUED)
statements for a complete discussion of the relationship with CCOH, including a description of the costs that have been allocated to the Company.
The preparation of the consolidated financial statements in conformity with GAAP requires management to make estimates, judgments and assumptions that affect the amounts reported in the consolidated financial statements and accompanying notes including, but not limited to, legal, tax and insurance accruals. The Company bases its estimates on historical experience and on various other assumptions that are believed to be reasonable under the circumstances. Actual results could differ from those estimates.
The consolidated financial statements included herein may not be indicative of the financial position, results of operations or cash flows had CCIBV operated as a separate entity during the periods presented or for future periods. As these consolidated financial statements present a portion of the businesses of CCOH, the net assets of CCIBV have been presented as CCOH’s net investment in CCIBV. CCOH’s investment in CCIBV includes the accumulated deficit of CCIBV, net of cash transfers related to cash management functions performed by CCOH.
Certain prior period amounts have been reclassified to conform to the 2019 presentation.
NOTE 2 – SIGNIFICANT ACCOUNTING POLICIES AND NEW ACCOUNTING PRONOUNCEMENTS
Cash and Cash Equivalents
Cash and cash equivalents include all highly liquid investments with an original maturity of three months or less.
Financial Instruments
Due to their short maturity, the carrying amounts of accounts receivable, accounts payable and accrued liabilities approximated their fair values at December 31, 2019 and 2018.
Accounts Receivable
Accounts receivable are recorded when the Company has an unconditional right to payment, either because it has satisfied a performance obligation prior to receiving payment from the customer or has a non-cancelable contract that has been billed in advance in accordance with the Company’s normal billing terms.
Accounts receivable are recorded at the invoiced amount, net of allowances for doubtful accounts. The Company evaluates the collectability of its accounts receivable based on a combination of factors. In circumstances where it is aware of a specific customer’s inability to meet its financial obligations, it records a specific reserve to reduce the amounts recorded to what it believes will be collected. For all other customers, it recognizes reserves for bad debt based on historical experience of bad debts as a percent of accounts receivable for each business unit, adjusted for relative improvements or deteriorations in the aging and changes in current economic conditions. The Company believes its concentration of credit risk is limited due to the large number and the geographic diversification of its customers.
Restricted Cash
Restricted cash is recorded in “Other current assets” and “Other assets” in the Company’s Consolidated Balance Sheet. The following table provides a reconciliation of cash and cash equivalents and restricted cash reported in
F-23
CLEAR CHANNEL INTERNATIONAL B.V. AND SUBSIDIARIES
NOTES TO CONSOLIDATED FINANCIAL STATEMENTS (CONTINUED)
the Consolidated Balance Sheets to the total amounts of cash, cash equivalents and restricted cash reported in the Consolidated Statements of Cash Flows:
| (In thousands) | December 31, 2019 |
December 31, 2018 |
||||||
| Cash and cash equivalents |
$ | 34,498 | $ | 28,227 | ||||
| Restricted cash included in: |
||||||||
| Other current assets |
4,116 | 4,221 | ||||||
| Other assets |
9,580 | 11,945 | ||||||
|
|
|
|
|
|||||
| Total cash, cash equivalents and restricted cash in the Statement of Cash Flows |
$ | 48,194 | $ | 44,393 | ||||
|
|
|
|
|
|||||
Deposits
The Company has contracted rights to put structures on certain land or property. These agreements may dictate that a deposit be paid by the Company to the respective landlords and specify the terms in which the deposit will be returned to the Company. Deposits expected to be returned within 12 months are recorded as a current asset in “Other current assets,” and deposits expected to be returned in a period that is beyond 12 months are recorded as a noncurrent asset in “Other assets.” Refer to Note 12 to the Company’s consolidated financial statements for the deposit balances recorded on the Consolidated Balance Sheets as of December 31, 2019 and 2018.
Property, Plant and Equipment
Property, plant and equipment are stated at cost. Expenditures for maintenance and repairs are charged to operations as incurred, whereas expenditures for renewal and betterments are capitalized.
Depreciation is computed using the straight-line method at rates that, in the opinion of management, are adequate to allocate the cost of such assets over their estimated useful lives, which are as follows:
Buildings and improvements – 10 to 39 years
Structures – 5 to 20 years
Furniture and other equipment – 2 to 20 years
For assets associated with a lease or contract, including leasehold improvements, the assets are depreciated over the shorter of the economic life or the lease or contract term, assuming renewal periods, if appropriate.
The Company tests for possible impairment of property, plant and equipment whenever events and circumstances indicate that depreciable assets might be impaired and the undiscounted cash flows estimated to be generated by those assets are less than the carrying amounts of those assets. When specific assets are determined to be unrecoverable, the cost basis of the asset is reduced to reflect the current fair market value. The Company did not recognize any impairments of property, plant and equipment during 2019 or 2018. During 2017, the Company recognized an impairment of $2.6 million in relation to advertising assets that were no longer usable in one country.
Refer to Note 5 to the Company’s consolidated financial statements for additional disclosures about the Company’s property, plant and equipment.
Intangible Assets
Intangible assets consist of definite-lived intangible assets, which primarily include transit and street furniture contracts and other contractual rights, all of which are recorded at cost and amortized over the shorter of either
F-24
CLEAR CHANNEL INTERNATIONAL B.V. AND SUBSIDIARIES
NOTES TO CONSOLIDATED FINANCIAL STATEMENTS (CONTINUED)
the respective lives of the agreements or over the period of time the assets are expected to contribute directly or indirectly to the Company’s future cash flows. The Company periodically reviews the appropriateness of the amortization periods related to these definite-lived intangible assets.
The Company tests for possible impairment of intangible assets whenever events and circumstances indicate that they might be impaired and the undiscounted cash flows estimated to be generated by those assets are less than the carrying amounts of those assets. When a specific asset is determined to be unrecoverable, the cost basis of the asset is reduced to reflect the current fair market value. The Company did not recognize any impairments of intangible assets during 2019, 2018 or 2017.
Refer to Note 5 to the Company’s consolidated financial statements for additional disclosures about the Company’s intangible assets.
Goodwill
Adoption of ASU 2017-04
Effective on January 1, 2019, the Company early adopted the guidance under Accounting Standards Update (“ASU”) 2017-04, Simplifying the Test for Goodwill Impairment, on a prospective basis. This ASU eliminates the requirement to calculate the implied fair value of goodwill to measure a goodwill impairment charge. Instead, entities shall record an impairment charge based on the excess of a reporting unit’s carrying amount over its fair value. Although the implementation of ASU 2017-04 resulted in a change to our accounting policy around the calculation of goodwill impairment, it did not have a material impact on our consolidated financial statements.
Annual Impairment Test
The Company performs its annual goodwill impairment test on July 1 of each year. In accordance with ASU 2017-04, as previously described, the carrying amount of each reporting unit, including goodwill, is compared to the fair value of the reporting unit, and any excess, limited to the total amount of goodwill allocated to the reporting unit, is recorded as a goodwill impairment charge. In accordance with ASC 350-20-55, the Company determined that each country in which the Company operates constitutes a separate reporting unit.
The Company uses a discounted cash flow model to determine the fair value of each reporting unit, which requires the Company to estimate future cash flows expected to be generated from the reporting unit, discounted to their present value using a risk-adjusted discount rate. Terminal values are also estimated and discounted to their present value. Assessing the recoverability of goodwill requires the Company to make estimates and assumptions about sales, operating margins, growth rates and discount rates based on its budgets, business plans, economic projections, anticipated future cash flows and marketplace data. There are inherent uncertainties related to these factors and management’s judgment in applying these factors.
The Company concluded no goodwill impairment was required in 2019 or 2018. The Company recognized goodwill impairment of $1.6 million in 2017.
Leased Assets
The Company enters into contracts to use land, buildings and office space, structures, and other equipment such as automobiles and copiers. Some of these contracts enable the Company to display advertising on buses, bus shelters, trains, and other private or municipal assets. Additionally, most of the Company’s advertising structures are located on leased land. No single contract or lease is material to the Company’s operations.
F-25
CLEAR CHANNEL INTERNATIONAL B.V. AND SUBSIDIARIES
NOTES TO CONSOLIDATED FINANCIAL STATEMENTS (CONTINUED)
Adoption of ASC Topic 842 – Impact on Lessee Accounting
The Company adopted ASU 2016-02, Leases, which created ASC Topic 842, and all subsequent ASUs relating to this Topic (collectively, “ASC Topic 842”) as of January 1, 2019. This new lease accounting standard, which supersedes previous lease accounting guidance under GAAP (ASC Topic 840), results in significant changes to the balance sheets of lessees, most significantly by requiring the recognition of a right-of-use (“ROU”) asset and lease liability by lessees for those leases classified as operating leases. Adoption of this new standard had a material impact on the Company’s Consolidated Balance Sheet, but it did not have a material impact on the Company’s other consolidated financial statements.
The Company applied the transition provisions of this standard at January 1, 2019 following the optional transition method provided by ASU 2018-11; consequently, the consolidated financial statements and notes to the consolidated financial statements for periods before the date of adoption continue to be presented in accordance with ASC Topic 840. In addition, the Company elected the package of practical expedients permitted under the transition guidance within the new standard, which allowed it to not reassess whether expired or existing contracts are, or contain, leases and to carry forward the historical lease classification for those leases that commenced prior to the date of adoption.
Upon adoption of ASC Topic 842, prepaid and deferred rent balances, which were historically presented separately, were combined and presented on a net basis within the ROU asset. Additionally, deferred gains related to previous transactions that were historically accounted for as sale and operating leasebacks in accordance with ASC Topic 840 were recognized as a cumulative-effect adjustment to equity, resulting in an increase to equity, net of tax, of $14.6 million.
Lease Accounting Policies
Arrangements involving the use of property, plant and equipment are evaluated at inception to determine whether they contain a lease under ASC Topic 842. Certain of the Company’s transit and street furniture contracts do not meet the definition of a lease under ASC Topic 842 due to substantive substitution rights within those contracts; however, contracts that were historically determined to be leases under ASC Topic 840 are included in the Company’s balance sheet as of January 1, 2019, as previously described.
The Company’s leases, including land lease contracts and lease contracts for the use of space on floors, walls and exterior locations on buildings, are operating leases. The land leases generally have initial terms of between 5 and 10 years and renew indefinitely, with rental payments generally escalating at an inflation-based index. Land leases are paid in advance for periods typically ranging up to 12 months, although some are paid in advance for longer periods, or in arrears. Certain of the Company’s street furniture contracts also meet the definition of an operating lease. Most street furniture display faces are operated through contracts with municipalities, which typically have terms of up to 15 years.
Operating leases are reflected on the Company’s Consolidated Balance Sheet as “Operating lease right-of-use assets,” and the related short-term and long-term liabilities are included within “Current operating lease liabilities” and “Noncurrent operating lease liabilities,” respectively. ROU assets represent the right to use an underlying asset for the lease term, and lease liabilities represent the obligation to make lease payments arising from the lease. Operating lease ROU assets and liabilities are recognized at lease commencement based on the present value of lease payments over the lease term, and lease expense is recognized on a straight-line basis over the lease term. Expenditures for maintenance are charged to operations as incurred.
Certain of the Company’s operating lease agreements include rental payments that are based on a percentage of revenue, and others include rental payments that are adjusted periodically for inflationary changes. Percentage
F-26
CLEAR CHANNEL INTERNATIONAL B.V. AND SUBSIDIARIES
NOTES TO CONSOLIDATED FINANCIAL STATEMENTS (CONTINUED)
rent contracts, in which lease expense is calculated as a percentage of advertising revenue, and payments due to changes in inflationary adjustments are included within variable rent expense, which is accounted for separately from periodic straight-line lease expense. VAT, which is commonly assessed on the Company’s contracts, is treated as a non-lease component.
Many of the Company’s operating lease contracts permit the Company to continue operating the leased assets after the rights and obligations of the lease agreements have expired. Such contracts are not considered to be leases after they expire, and future expected payments are not included in operating lease liabilities or ROU assets. Additionally, many of the Company’s leases entered into in connection with advertising structures provide options to extend the terms of the agreements. Renewal periods are generally excluded from minimum lease payments when calculating the lease liabilities as the Company does not consider exercise of such options to be reasonably certain for most leases. Therefore, unless exercise of a renewal option is considered reasonably assured, the optional terms and payments are not included within the lease liability. The Company’s lease agreements do not contain material residual value guarantees or material restrictive covenants.
The implicit rate within the Company’s lease agreements is generally not determinable. As such, the Company uses the incremental borrowing rate (“IBR”) to determine the present value of lease payments at the commencement of the lease. The IBR, as defined in ASC Topic 842, is the rate of interest that a lessee would have to pay to borrow on a collateralized basis over a similar term at an amount equal to the lease payments in a similar economic environment.
Refer to Note 4 to the Company’s consolidated financial statements for additional disclosures about the Company’s operating leases.
Investments
In general, investments in companies in which the Company owns 20% to 50% of the voting common stock or otherwise exercises significant influence over operating and financial policies of the investee are accounted for using the equity method of accounting. The Company does not recognize gains or losses upon the issuance of securities by any of its equity-method investees; however, the Company records impairment charges for any decline in value of equity-method investments that is determined to be other-than-temporary.
The Company measures equity investments that do not result in consolidation and are not accounted for under the equity method at fair value and recognizes any changes in fair value through earnings. Investments without readily determinable fair values are measured at cost less impairment, if any, plus or minus changes resulting from observable price changes in orderly transactions for an identical or similar investment in the same issuer.
Impairments and other adjustments on these investments are recorded as a component of “Other income (expense), net” in the Consolidated Statement of Comprehensive Income (Loss), as detailed in Note 12 to the Company’s consolidated financial statements.
Asset Retirement Obligation
ASC Subtopic 410-20 requires the Company to estimate its obligation to dismantle and remove its advertising structures from leased land or property and to restore the site to its original condition upon the termination or non-renewal of a lease or contract. The Company records the present value of obligations associated with the retirement of its advertising structures as a component of “Other long-term liabilities” on the Consolidated Balance Sheet in the period in which the obligation is incurred. An estimate of third-party cost information is used with respect to the dismantling of the structures and the restoration of the site, and the retirement period is
F-27
CLEAR CHANNEL INTERNATIONAL B.V. AND SUBSIDIARIES
NOTES TO CONSOLIDATED FINANCIAL STATEMENTS (CONTINUED)
estimated for each obligation based on contract terms. The interest rate used to calculate the present value of such costs over the retirement period is based on an estimated risk-adjusted credit rate for the same period. When the liability is recorded, the cost is capitalized as part of the related advertising structures’ carrying value. Over time, accretion of the liability is recognized as an operating expense, and the capitalized cost is depreciated over the expected useful life of the related asset. Refer to Note 8 to the Company’s consolidated financial statements for additional disclosures about the Company’s asset retirement obligation.
Revenue Recognition
The Company generates revenue primarily from the sale of advertising space on printed and digital out-of-home advertising displays. These contracts, which typically cover periods of a few weeks to one year, are generally non-cancelable or require the customer to pay a fee to terminate the contract.
Certain of these revenue transactions are considered leases for accounting purposes as the agreements convey to customers the right to control the use of the Company’s advertising displays for a period of time. To qualify as a lease, fulfillment of the contract must be dependent upon the use of a specified advertising structure, the customer must have almost exclusive use of the advertising display throughout the contract term, and, upon adoption of ASC Topic 842 on January 1, 2019, the customer must also have the right to change the advertisement that is displayed throughout the contract term. The Company accounts for revenue from leases, which are all classified as operating leases, in accordance with the lease accounting guidance (ASC Topic 840 or ASC Topic 842, depending on the advertising campaign start date), while the Company’s remaining revenue transactions are accounted for as revenue from contracts with customers (ASC Topic 606).
Adoption of ASC Topic 842 – Impact on Lessee Accounting
As previously described, the Company adopted ASU 2016-02, Leases, which created ASC Topic 842, as of January 1, 2019. In addition to the aforementioned changes in lessee accounting, ASC Topic 842 also updated lessor accounting to align with certain changes in the lessee model and the revenue recognition standard (ASC Topic 606).
Under ASC Topic 842, the Company elected a practical expedient to not separate non-lease components from associated lease components if certain criteria are met. As such, each right to control the use of an advertising display that meets the lease criteria is combined with the related installation and maintenance services provided under the contract into a single lease component. Each advertising display that does not meet the lease criteria, along with any related installation and maintenance services, are non-lease components. Consideration in outdoor advertising contracts is allocated between lease and non-lease components in proportion to their relative standalone selling prices, which are generally approximated by the contractual prices for each promised service.
In accordance with the Company’s election of transition practical expedients under ASC Topic 842, revenue contracts with campaign start dates prior to January 1, 2019 were not reassessed to determine whether they qualify as a lease under the requirements of the new leasing standard. Instead, they continue to be accounted for as revenue from contracts with customers or revenue from leases based on the requirements of ASC Topic 840, and the new requirements have been applied to revenue contracts with campaign start dates on or after January 1, 2019. Because the definition of a lease is more restrictive under the new standard, fewer of our new revenue contracts meet the definition of a lease for accounting purposes, resulting in an increase in the percentage of revenue that is categorized as revenue from contracts with customers as compared to the prior year.
Revenue Accounting Policies
The Company recognizes revenue when or as it satisfies a performance obligation by transferring a promised good or service to a customer. The Company generates revenue primarily from the sale of advertising space on
F-28
CLEAR CHANNEL INTERNATIONAL B.V. AND SUBSIDIARIES
NOTES TO CONSOLIDATED FINANCIAL STATEMENTS (CONTINUED)
printed and digital displays, including street furniture and transit displays, billboards, and mall displays, which may be sold as individual units or as a network package. Revenue from these contracts is generally recognized ratably over the term of the contract as the advertisement is displayed.
The Company recognizes revenue in amounts that reflect the consideration it expects to receive in exchange for transferring goods or services to customers, excluding VAT and other similar taxes collected on behalf of governmental authorities (the “transaction price”). When this consideration includes a variable amount, the Company estimates the amount of consideration it expects to receive and only recognizes revenue to the extent that it is probable it will not be reversed in a future reporting period. Because the transfer of promised goods and services to the customer is generally within a year of scheduled payment from the customer, the Company is not typically required to consider the effects of the time value of money when determining the transaction price. Advertising revenue is reported net of agency commissions.
Trade and barter transactions represent the exchange of display space for merchandise, services or other assets in the ordinary course of business. The transaction price for these contracts is measured at the estimated fair value of the non-cash consideration received unless this is not reasonably estimable, in which case the consideration is measured based on the standalone selling price of the display space promised to the customer. Revenue is recognized on trade and barter transactions when the advertisements are displayed, and expenses are recorded ratably over a period that estimates when the merchandise, services or other assets received are utilized. Trade and barter revenues and expenses from continuing operations are included on the Consolidated Statement of Comprehensive Income (Loss) in “Revenue” and “Selling, general and administrative expenses,” respectively.
Trade and barter revenues and expenses from continuing operations were as follows:
| Year Ended December 31, | ||||||||||||
| (In thousands) | 2019 | 2018 | 2017 | |||||||||
| Trade and barter revenues |
$ | 4,198 | $ | 7,833 | $ | 6,750 | ||||||
| Trade and barter expenses |
2,363 | 5,528 | 3,659 | |||||||||
In order to appropriately identify the unit of accounting for revenue recognition, the Company determines which promised goods and services in a contract with a customer are distinct and are therefore separate performance obligations. If a promised good or service does not meet the criteria to be considered distinct, it is combined with other promised goods or services until a distinct bundle of goods or services exists. Certain of the Company’s contracts with customers include options for the customer to acquire additional goods or services for free or at a discount, and management judgment is required to determine whether these options are material rights that are separate performance obligations.
For revenue arrangements that contain multiple distinct goods or services, the Company allocates the transaction price to these performance obligations in proportion to their relative standalone selling prices. The Company has concluded that the contractual prices for the promised goods and services in its standard contracts generally approximate management’s best estimate of standalone selling price as the rates reflect various factors such as the size and characteristics of the target audience, market location and size, and recent market selling prices. However, where the Company provides customers with free or discounted services as part of contract negotiations, management uses judgment to determine how much of the transaction price to allocate to these performance obligations.
The Company receives payments from customers based on billing schedules that are established in its contracts, some of which are billed in advance while others are billed upon completion of service. Deferred revenue is recorded when payment is received from a customer before the Company has satisfied the performance
F-29
CLEAR CHANNEL INTERNATIONAL B.V. AND SUBSIDIARIES
NOTES TO CONSOLIDATED FINANCIAL STATEMENTS (CONTINUED)
obligation or a non-cancelable contract has been billed in advance in accordance with the Company’s normal billing terms.
Refer to Note 3 to the Company’s consolidated financial statements for additional disclosures about the Company’s revenue.
Contract Costs
Incremental costs of obtaining a contract primarily relate to sales commissions, which are included in “Selling, general and administrative expenses” on the Consolidated Statement of Comprehensive Income (Loss) and are generally commensurate with sales. These costs are generally expensed when incurred because the period of benefit is one year or less.
Advertising Expense
The Company records advertising expense as it is incurred. Advertising expenses were $16.9 million, $18.1 million and $14.2 million for the years ended December 31, 2019, 2018 and 2017, respectively, and are included in “Selling, general and administrative expenses” on the Consolidated Statement of Comprehensive Income (Loss).
Income Taxes
The operations of the Company are subject to current income taxes at the local statutory rate in the country where the income is earned and in accordance with the rules established by the applicable jurisdiction taxation authorities. The Company accounts for income taxes and computes its deferred income tax provision using the liability method in accordance with the provisions of ASC Subtopic 740-10, as if the Company was a separate taxpayer. Under this method, deferred tax assets and liabilities are determined based on differences between the financial reporting basis and tax basis of assets and liabilities and are measured using the enacted tax rates expected to apply to taxable income in the periods in which the deferred tax asset or liability is expected to be realized or settled. Deferred tax assets are reduced by valuation allowances if the Company believes it is more likely than not that some portion or all of the asset will not be realized. Refer to Note 11 to the Company’s consolidated financial statements for additional disclosures about the Company’s income taxes.
Foreign Currency
All results of operations are for non-U.S. subsidiaries and non-U.S. equity investees and are translated into U.S. dollars, the reporting currency of the Company, using the average exchange rates during the year. The assets and liabilities of those subsidiaries and investees are translated into U.S. dollars using the exchange rates at the balance sheet date. The related translation adjustments are recorded in a separate component of Shareholder’s Deficit on the Consolidated Balance Sheet, within “Accumulated other comprehensive income.”
Foreign currency transaction gains and losses are recorded as a component of “Other income (expense), net” in the Consolidated Statement of Comprehensive Income (Loss), as detailed in Note 12 to the Company’s consolidated financial statements.
New Accounting Pronouncements Recently Adopted
As previously described in the “Goodwill,” “Leased Assets” and “Revenue Recognition” sections of this note to the consolidated financial statements, the Company adopted ASU 2017-04 and ASC Topic 842 effective January 1, 2019.
F-30
CLEAR CHANNEL INTERNATIONAL B.V. AND SUBSIDIARIES
NOTES TO CONSOLIDATED FINANCIAL STATEMENTS (CONTINUED)
Additionally, the Company adopted ASU 2017-07, Compensation – Retirement Benefits (Topic 715): Improving the Presentation of Net Periodic Pension Cost and Net Periodic Postretirement Benefit Cost, effective January 1, 2019. This update requires bifurcation of the net benefit cost, with the service cost component being presented with other employee compensation costs in operating income and the other components being reported separately outside of operations. The implementation of ASU 2017-07 did not have a material impact on the Company’s consolidated financial statements and related disclosures.
Also effective January 1, 2019, the Company early adopted the guidance under ASU 2018-15, Customer’s Accounting for Implementation Costs Incurred in a Cloud Computing Arrangement that is a Service Contract, on a prospective basis. This update requires that a customer in a cloud computing arrangement that is a service contract follow the internal-use software guidance in ASC Subtopic 350-40 to determine which implementation costs to capitalize as assets. The implementation of ASU 2018-15 did not have a material impact on the Company’s consolidated financial statements and related disclosures.
New Accounting Pronouncements Not Yet Adopted
In June 2016, the FASB issued ASU 2016-13, Measurement of Credit Losses on Financial Statements, which changes the way entities recognize impairment of many financial assets, including accounts receivable, by requiring immediate recognition of estimated credit losses expected to occur over their remaining life. This is in contrast to current GAAP, under which credit losses are not recognized until it is probable that a loss has been incurred. The new guidance is effective for annual and interim periods beginning after December 15, 2019. The Company will adopt the ASU on a modified-retrospective basis as of January 1, 2020 through a cumulative-effect adjustment to retained earnings, which is expected to result in a decrease to equity of $1.7 million. The Company will perform its expected credit loss calculation based on historical accounts receivable write-offs.
During the third quarter of 2018, the FASB issued ASU 2018-14, Compensation – Retirement Benefits (Subtopic 715-20): Disclosure Framework – Changes to the Disclosure Requirements for Defined Benefit Plans. This update is designed to improve the effectiveness of disclosures related to defined benefit plans. The standard is effective for annual and interim periods beginning after December 15, 2021 for nonpublic entities. The Company is currently evaluating the impact of the provisions of this new standard on its consolidated financial statements.
In December 2019, the FASB issued ASU 2019-12, Simplifying the Accounting for Income Taxes, which simplifies the accounting for income taxes by removing certain existing exceptions to the general principles in Topic 740. The new guidance is effective for annual and interim periods beginning after December 2020, and early adoption is permitted. The Company is currently evaluating the impact of the new guidance on its consolidated financial statements.
F-31
CLEAR CHANNEL INTERNATIONAL B.V. AND SUBSIDIARIES
NOTES TO CONSOLIDATED FINANCIAL STATEMENTS (CONTINUED)
NOTE 3 – REVENUE
Disaggregation of Revenue
The following table shows revenue from contracts with customers, revenue from leases and total revenue, disaggregated by geographical region, for the years ended December 31, 2019, 2018 and 2017:
| (In thousands) | Revenue from contracts with customers(1) |
Revenue from leases(1) |
Total Revenue |
|||||||||
| Year Ended December 31, 2019 |
||||||||||||
| France |
$ | 262,403 | $ | 22,072 | $ | 284,475 | ||||||
| United Kingdom |
200,072 | 3,794 | 203,866 | |||||||||
| Rest of Europe and other |
506,107 | 117,322 | 623,429 | |||||||||
|
|
|
|
|
|
|
|||||||
| Total |
$ | 968,582 | $ | 143,188 | $ | 1,111,770 | ||||||
|
|
|
|
|
|
|
|||||||
| Year Ended December 31, 2018 |
||||||||||||
| France |
$ | 260,202 | $ | 25,243 | $ | 285,445 | ||||||
| United Kingdom |
118,743 | 75,380 | 194,123 | |||||||||
| Rest of Europe and other |
487,954 | 206,094 | 694,048 | |||||||||
|
|
|
|
|
|
|
|||||||
| Total |
$ | 866,899 | $ | 306,717 | $ | 1,173,616 | ||||||
|
|
|
|
|
|
|
|||||||
| Year Ended December 31, 2017 |
| |||||||||||
| France |
$ | 243,507 | $ | 26,359 | $ | 269,866 | ||||||
| United Kingdom |
111,049 | 73,306 | 184,355 | |||||||||
| Rest of Europe and other |
425,917 | 199,119 | 625,036 | |||||||||
|
|
|
|
|
|
|
|||||||
| Total |
$ | 780,473 | $ | 298,784 | $ | 1,079,257 | ||||||
|
|
|
|
|
|
|
|||||||
| (1) | As described in Note 2 to the Company’s consolidated financial statements, under ASC Topic 842, adopted as of January 1, 2019, fewer of the Company’s revenue contracts meet the definition of a lease for accounting purposes, resulting in an increase in the percentage of revenue that is categorized as revenue from contracts with customers. |
The Company’s advertising structures, which may be owned or leased, are used to generate revenue, and such revenue may be classified as revenue from contracts with customers or revenue from leases depending on the terms of the contract, as previously described in Note 2 to the Company’s consolidated financial statements.
Revenue from Contracts with Customers
The following tables show the Company’s beginning and ending accounts receivable and deferred revenue balances from contracts with customers:
| Year Ended December 31, | ||||||||||||
| (In thousands) | 2019 | 2018 | 2017 | |||||||||
| Accounts receivable, net of allowance, from contracts with customers: |
||||||||||||
| Beginning balance |
$ | 246,874 | $ | 242,215 | $ | 198,459 | ||||||
| Ending balance(1) |
$ | 291,702 | $ | 246,874 | $ | 242,215 | ||||||
| Deferred revenue from contracts with customers: |
||||||||||||
| Beginning balance |
$ | 22,742 | $ | 18,195 | $ | 16,512 | ||||||
| Ending balance(1) |
$ | 24,902 | $ | 22,742 | $ | 18,195 | ||||||
F-32
CLEAR CHANNEL INTERNATIONAL B.V. AND SUBSIDIARIES
NOTES TO CONSOLIDATED FINANCIAL STATEMENTS (CONTINUED)
| (1) | The primary driver for the increase in both the accounts receivable and deferred revenue balances from contracts with customers in 2019 is related to the implementation of ASC Topic 842 as of January 1, 2019. Because the definition of a lease is more restrictive under the new standard, fewer of the Company’s new revenue contracts meet the definition of a lease for accounting purposes, resulting in an increase in the percentage of revenue that is categorized as revenue from contracts with customers as compared to the prior year. |
Bad debt, net of recoveries, related to accounts receivable from contracts with customers was $0.1 million, $1.3 million and $1.8 million during the years ended December 31, 2019, 2018 and 2017, respectively.
During the years ended December 31, 2019, 2018 and 2017, respectively, the Company recognized $21.2 million, $18.0 million and $16.4 million of revenue that was included in the deferred revenue from contracts with customers balance at the beginning of that year.
The Company’s contracts with customers generally have terms of one year or less; however, as of December 31, 2019, the Company expects to recognize $53.3 million of revenue in future periods for remaining performance obligations from current contracts with customers that have an original expected duration of greater than one year. Approximately half of these remaining performance obligations are expected to be recognized over the next year, with the remainder to be recognized through 2025.
Revenue from Leases
As of December 31, 2019, future lease payments to be received by the Company are as follows:
| (In thousands) |
| |||
| 2020 |
$ | 40,181 | ||
| 2021 |
582 | |||
| 2022 |
150 | |||
| 2023 |
7 | |||
|
|
|
|||
| Total |
$ | 40,920 | ||
|
|
|
|||
Note that the future lease payments disclosed are limited to the non-cancelable period of the lease and, for contracts that require the customer to pay a significant fee to terminate the contract such that the customer is considered reasonably certain not to exercise this option, periods beyond the termination option. Payments scheduled for periods beyond a termination option are not included for contracts that allow cancellation by the customer without a significant fee.
NOTE 4 – LEASES
Prior to the adoption of ASC Topic 842 on January 1, 2019, total rent expense charged to operations for the years ended December 31, 2018 and 2017 was $482.7 million and $441.7 million, respectively.
The following table provides the components of ASC Topic 842 lease expense included within the Consolidated Statement of Comprehensive Loss for the year ended December 31, 2019:
| (In thousands) | Year Ended December 31, 2019 |
|||
| Operating lease expense |
$ | 233,168 | ||
| Variable lease expense |
$ | 88,589 | ||
F-33
CLEAR CHANNEL INTERNATIONAL B.V. AND SUBSIDIARIES
NOTES TO CONSOLIDATED FINANCIAL STATEMENTS (CONTINUED)
The following table provides the weighted-average remaining lease term and the weighted-average discount rate for the Company’s operating leases as of December 31, 2019:
| December 31, 2019 |
||||
| Operating lease weighted-average remaining lease term (in years) |
4.8 | |||
| Operating lease weighted-average discount rate |
4.49 | % | ||
As of December 31, 2019, the Company’s future maturities of operating lease liabilities were as follows:
| (In thousands) | ||||
| 2020 |
$ | 238,589 | ||
| 2021 |
149,699 | |||
| 2022 |
106,370 | |||
| 2023 |
69,880 | |||
| 2024 |
44,744 | |||
| Thereafter |
89,751 | |||
|
|
|
|||
| Total lease payments |
$ | 699,033 | ||
| Less: Effect of discounting |
(115,311 | ) | ||
|
|
|
|||
| Total operating lease liability |
$ | 583,722 | ||
|
|
|
|||
The following table provides supplemental cash flow information related to leases:
| (In thousands) | Year Ended December 31, 2019 |
|||
| Cash paid for amounts included in measurement of operating lease liabilities |
$ | 252,277 | ||
| Lease liabilities arising from obtaining right-of-use assets(1) |
$ | 776,039 | ||
| (1) | Includes transition liabilities upon adoption of ASC Topic 842, as well as new leases entered into during the year ended December 31, 2019. Changes in the ROU asset and liability are presented net within operating activities. |
NOTE 5 – PROPERTY, PLANT AND EQUIPMENT, INTANGIBLE ASSETS AND GOODWILL
Property, Plant and Equipment
The Company’s property, plant and equipment consisted of the following classes of assets as of December 31, 2019 and 2018:
| (In thousands) | December 31, 2019 |
December 31, 2018 |
||||||
| Structures |
$ | 519,959 | $ | 531,707 | ||||
| Furniture and other equipment |
139,981 | 123,107 | ||||||
| Land, buildings and improvements |
34,834 | 35,361 | ||||||
| Construction in progress |
31,121 | 29,884 | ||||||
|
|
|
|
|
|||||
| 725,895 | 720,059 | |||||||
| Less: Accumulated depreciation |
430,257 | 429,256 | ||||||
|
|
|
|
|
|||||
| Property, plant and equipment, net |
$ | 295,638 | $ | 290,803 | ||||
|
|
|
|
|
|||||
F-34
CLEAR CHANNEL INTERNATIONAL B.V. AND SUBSIDIARIES
NOTES TO CONSOLIDATED FINANCIAL STATEMENTS (CONTINUED)
Total depreciation expense related to property, plant and equipment for the years ended December 31, 2019, 2018 and 2017 was $79.1 million, $80.5 million and $70.9 million, respectively.
Intangible Assets
The Company’s intangible assets primarily consist of transit and street furniture contracts and other contractual rights. The following table presents the gross carrying amount and accumulated amortization for intangible assets as of December 31, 2019 and December 31, 2018:
| December 31, 2019 | December 31, 2018 | |||||||||||||||
| (In thousands) | Gross Carrying Amount |
Accumulated Amortization |
Gross Carrying Amount |
Accumulated Amortization |
||||||||||||
| Intangible assets, net |
$ | 223,934 | $ | (211,292 | ) | $ | 225,793 | $ | (212,269 | ) | ||||||
Total amortization expense related to definite-lived intangible assets for the years ended December 31, 2019, 2018 and 2017 was $1.5 million, $3.0 million and $5.0 million, respectively.
The following table presents the Company’s estimate of amortization expense for intangible assets; however, in the event that acquisitions and dispositions occur in the future, amortization expense may vary.
| (In thousands) | ||||
| 2020 |
$ | 1,320 | ||
| 2021 |
1,092 | |||
| 2022 |
791 | |||
| 2023 |
735 | |||
| 2024 |
719 | |||
| Thereafter |
7,985 | |||
|
|
|
|||
| Total |
$ | 12,642 | ||
|
|
|
|||
Goodwill
The following table presents the changes in the carrying amount of goodwill:
| (In thousands) | ||||
| Balance as of December 31, 2017(1) |
$ | 195,511 | ||
| Foreign currency |
(7,770 | ) | ||
|
|
|
|||
| Balance as of December 31, 2018 |
$ | 187,741 | ||
| Foreign currency |
(2,100 | ) | ||
|
|
|
|||
| Balance as of December 31, 2019 |
$ | 185,641 | ||
|
|
|
|||
| (1) | The balance as of December 31, 2017 is net of cumulative impairments of $191.4 million. |
NOTE 6 – LONG-TERM DEBT
Clear Channel International B.V. Senior Notes
At December 31, 2018, the Company had senior notes outstanding consisting of $375 million aggregate principal amount of 8.75% Senior Notes due 2020 (the “Senior Notes”). The Senior Notes were scheduled to mature on December 15, 2020, and interest was payable semi-annually in arrears on June 15 and December 15 of each year.
F-35
CLEAR CHANNEL INTERNATIONAL B.V. AND SUBSIDIARIES
NOTES TO CONSOLIDATED FINANCIAL STATEMENTS (CONTINUED)
Per the indenture governing the Senior Notes (“Senior Notes Indenture”), the Company had the option to redeem the notes, in whole or part, at the redemption prices set forth in the indenture. In September 2019, the Company redeemed all of the outstanding Senior Notes at a price of 102.187% of the principal amount thereof, plus accrued and unpaid interest to the redemption date, with funds provided by the Parent Company, thereby releasing the Company from its remaining obligations under the Senior Notes Indenture. As a result of this debt redemption, the Company recognized a debt extinguishment loss of $11.0 million.
Long-term debt outstanding as of December 31, 2019 and December 31, 2018 consisted of the following:
| (In thousands) | December 31, 2019 |
December 31, 2018 |
||||||
| Clear Channel International B.V. 8.75% Senior Notes Due 2020 |
$ | — | $ | 375,000 | ||||
| Original issue premium |
— | 2,701 | ||||||
| Long-term debt fees |
— | (6,694 | ) | |||||
|
|
|
|
|
|||||
| Total debt(1) |
$ | — | $ | 371,007 | ||||
| Less: Current portion |
— | — | ||||||
|
|
|
|
|
|||||
| Total long-term debt |
$ | — | $ | 371,007 | ||||
|
|
|
|
|
|||||
| (1) | At December 31, 2018, the aggregate market value of the Company’s debt based on market prices for which quotes were available was approximately $377.8 million. |
NOTE 7 – RELATED PARTY TRANSACTIONS
Agreements with iHeartCommunications
Historically, CCOH’s relationship with iHeartCommunications was governed by several agreements (the “Intercompany Agreements”) related to corporate, employee, tax and other services. Certain of these costs, as applicable, were allocated to the Company from CCOH.
As described in Note 1, on March 14, 2018, iHeartMedia and certain of its subsidiaries filed voluntary petitions for relief under Chapter 11 of the U.S. Bankruptcy Code. There were no material effects on the Company’s financial statements related to the iHeart Chapter 11 Cases as none of the Company’s subsidiaries or operations were guarantors of iHeartCommunications’ debt, nor were there any cross-default provisions that affected the Company as a result of iHeartCommunications’ default on its debt. On May 1, 2019, iHeartMedia emerged from bankruptcy, and CCH, CCOH and its subsidiaries, including the Company, were separated from, and ceased to be controlled by, iHeartMedia.
In connection with the Separation, the Intercompany Agreements with iHeartCommunications were terminated, and CCOH entered into a Transition Services Agreement (“TSA”) with iHeartCommunications for one year from the Effective Date (subject to certain rights of the Company to extend up to one additional year). CCOH may terminate the TSA with respect to all or any individual service, in whole or in part, upon 30 days’ prior written notice, provided that any co-dependent services must be terminated concurrently.
Agreements with CCOH
Cash Management Arrangement
The Parent Company’s policy is to permanently reinvest the earnings of its non-U.S. subsidiaries as these earnings are generally redeployed in those jurisdictions for operating needs and continued functioning of their
F-36
CLEAR CHANNEL INTERNATIONAL B.V. AND SUBSIDIARIES
NOTES TO CONSOLIDATED FINANCIAL STATEMENTS (CONTINUED)
businesses. However, if any excess cash held by the Company and its subsidiaries is needed to fund operations in the U.S., the Parent Company has the ability to cause the Company to make distributions and repatriate available funds, subject to any limitations under applicable law.
Similarly, the Parent Company has the intent and ability to provide funds to the Company to the extent they are needed in order for the Company to meet its obligations as they become due. As described in Note 6 to the consolidated financial statements, the Parent Company provided the funds used to repay the Senior Notes.
Management Services
Prior to May 1, 2019, iHeartCommunications and CCOH provided management services to the Company, and starting on May 1, 2019, CCOH provides management services to the Company, which include, among other things: treasury and other financial-related services; certain executive officer services; legal and related services; licensing of intellectual property, copyrights, trademarks and other intangible assets; and other general corporate services. These services are charged to the Company based on actual direct costs incurred or allocated by CCOH based on headcount, revenue or other factors on a pro rata basis. For the years ended December 31, 2019, 2018, and 2017, the Company recorded $22.1 million, $17.7 million and $34.8 million, respectively, for these services, which are included in “Corporate expenses” in the Consolidated Statement of Comprehensive Income (Loss).
Stewardship Fee
As described in Note 1, the Company is a subsidiary of CCOH, a publicly traded company. As a result, the Company incurs certain costs related to quarterly and annual reporting in order for the Parent Company to comply with the Securities and Exchange Commission (“SEC”) reporting requirements. In addition, the Company incurs costs related to the preparation of budgets, forecasts and other strategic initiatives of Parent Company. Such costs are charged back to CCOH on a quarterly basis (“Stewardship Fees”) based on the time incurred by employees of the Company to perform the work. Stewardship fees charged to CCOH during the years ended December 31, 2019, 2018 and 2017 were $35.3 million, $19.1 million and $15.5 million, respectively. Such costs are included as a reduction of “Corporate expenses” in the Statement of Comprehensive Income (Loss).
Equity Incentive Plan
Certain employees and directors of the Company and its affiliates have been granted options to purchase shares of CCOH common stock under the CCOH equity incentive plan at no less than the fair value of the underlying stock on the date of grant. Share-based compensation cost is measured at the grant date based on the fair value of the award and is recognized within “Corporate expenses” in the Statement of Comprehensive Income (Loss) on a straight-line basis over the vesting period. During the years ended December 31, 2019, 2018 and 2017, the Company recognized share-based compensation expense of $1.7 million, $2.7 million and $2.2 million, respectively.
Related Party Notes
The Company has notes payable to and receivables from other wholly-owned subsidiaries of CCOH. In 2019, the Company reorganized its holding and financing structure and restructured its related party notes, consolidating some of its borrowing and lending activity in order to simplify intercompany funding arrangements. The contribution of certain of these related party notes resulted in an increase to shareholder’s equity.
F-37
CLEAR CHANNEL INTERNATIONAL B.V. AND SUBSIDIARIES
NOTES TO CONSOLIDATED FINANCIAL STATEMENTS (CONTINUED)
Related Party Notes Payable
Related party notes payable at December 31, 2019 and December 31, 2018 consisted of:
| (In thousands) | December 31, 2019 |
December 31, 2018 |
||||||
| Notes due to: |
||||||||
| Clear Channel C.V.(1) |
$ | — | $ | 340,608 | ||||
| CCO International Holdings B.V.(1) |
— | 707,194 | ||||||
| Clear Channel Worldwide Holdings, Inc.(2) |
301,965 | — | ||||||
|
|
|
|
|
|||||
| Total Related Party Notes Payable |
$ | 301,965 | $ | 1,047,802 | ||||
|
|
|
|
|
|||||
| (1) | At December 31, 2018, the Company was the borrower of unsecured subordinated notes payable to Clear Channel C.V. and CCO International Holdings B.V. These notes, which bore interest at 3.40% plus three-month EUR or GBP LIBOR, were contributed to equity in 2019. |
| (2) | In 2019, the Company borrowed from Clear Channel Worldwide Holdings, Inc., resulting in three outstanding notes payable at December 31, 2019. These notes, which are unsecured and bear interest at floating rates of 2.25% plus three-month USD LIBOR and 3.40% to 3.65% plus three-month EUR LIBOR, include $221.8 million denominated in USD, with the remainder in Euro currency. Although the notes are repayable on demand, the counterparty has represented to us that, consistent with the past, they will not require payment in the next 12 months; therefore, the notes payable are presented as long-term liabilities. |
The note agreements allow for the provision of payment-in-kind interest, and interest is capitalized quarterly into the notes. During the years ended December 31, 2019 and 2018, the Company capitalized $32.5 million and $35.9 million in interest payable, respectively, which had been accrued in relation to related party subordinated notes payable.
Related Party Notes Receivable
The Company, as lender, has outstanding notes receivable balances with related parties, which are unsecured and repayable on demand. Related party notes receivable at December 31, 2019 and December 31, 2018 consisted of:
| (In thousands) | December 31, 2019 |
December 31, 2018 |
||||||
| Notes due from: |
||||||||
| Clear Channel C.V.(1) |
$ | — | $ | 222,777 | ||||
| CCO International Holdings B.V.(2) |
— | 10,109 | ||||||
| Clear Channel Worldwide Holdings, Inc.(3) |
80,146 | 16,273 | ||||||
| Clear Channel Espectaculos S.L.(4) |
4,011 | — | ||||||
| Clear Channel KNR Netherlands Antilles(4) |
740 | — | ||||||
|
|
|
|
|
|||||
| Total Related Party Notes Receivable |
$ | 84,897 | $ | 249,159 | ||||
|
|
|
|
|
|||||
| (1) | At December 31, 2018, the Company had an outstanding notes receivable balance with Clear Channel C.V., which bore interest at a fixed rate of 9.66%. This note was repaid in 2019 and is included in the Consolidated Statement of Cash Flows as part of the $390.4 million inflow from financing activities related to the net change in related party notes payable. |
| (2) | At December 31, 2018, the Company had an outstanding notes receivable balance with CCO International Holdings B.V., which bore interest at 3.40% plus three-month USD LIBOR. This note was contributed to equity in 2019. |
F-38
CLEAR CHANNEL INTERNATIONAL B.V. AND SUBSIDIARIES
NOTES TO CONSOLIDATED FINANCIAL STATEMENTS (CONTINUED)
| (3) | At December 31, 2018, the Company had an outstanding notes receivable balance with Clear Channel Worldwide Holdings, Inc., which bore interest at 3.65% plus three-month USD LIBOR. This note was contributed to equity in 2019. Subsequently, the Company made additional loans to Clear Channel Worldwide Holdings, Inc., resulting in two outstanding notes receivable at December 31, 2019. These notes bear interest at a floating rate of 3.40% to 3.65% plus three-month EUR LIBOR. These notes are denominated in Euro currency, and the Company has a history that supports its intent to hold these notes long-term. |
| (4) | In 2019, the Company made loans to Clear Channel Espectaculos S.L. and Clear Channel KNR Netherlands Antilles, resulting in two outstanding notes receivable at December 31, 2019. These notes, which are denominated in USD currency, bear interest at 3.65% plus three-month USD LIBOR and, as a result of an amendment, will bear interest at 2.25% plus three-month USD LIBOR effective January 1, 2020. The Company has a history that supports its intent to hold these notes long-term. |
The note agreements allow for the provision of payment-in-kind interest, and interest is capitalized quarterly into the notes. During the years ended December 31, 2019 and 2018, the Company capitalized $21.7 million and $23.1 million in interest receivable, respectively, which had been recorded as income in relation to related party notes receivable.
NOTE 8 – ASSET RETIREMENT OBLIGATION
The following table presents the activity related to the Company’s asset retirement obligation:
| Years Ended December 31, | ||||||||
| (In thousands) | 2019 | 2018 | ||||||
| Beginning balance |
$ | 25,547 | $ | 26,753 | ||||
| Adjustments due to change in estimate of related costs |
(333 | ) | 724 | |||||
| Accretion of liability |
1,472 | 1,452 | ||||||
| Liabilities settled |
(1,715 | ) | (2,286 | ) | ||||
| Foreign currency |
(411 | ) | (1,096 | ) | ||||
|
|
|
|
|
|||||
| Ending balance |
$ | 24,560 | $ | 25,547 | ||||
|
|
|
|
|
|||||
NOTE 9 – POSTRETIREMENT BENEFIT PLANS
Certain of the Company’s subsidiaries participate in defined-benefit or defined-contribution plans that cover substantially all regular employees. The Company deposits funds under various fiduciary-type arrangements or provides reserves for these plans. Benefits under the defined-benefit plans are typically based either on years of service and the employee’s compensation (generally during a fixed number of years immediately before retirement) or on annual credits. The range of assumptions that are used for the defined-benefit plans reflect the different economic environments within the various countries.
F-39
CLEAR CHANNEL INTERNATIONAL B.V. AND SUBSIDIARIES
NOTES TO CONSOLIDATED FINANCIAL STATEMENTS (CONTINUED)
Defined-Benefit Pension Plan Financial Information
The table below presents the components of net periodic cost recognized in the Consolidated Statement of Comprehensive Income (Loss):
| Years Ended December 31, | ||||||||||||
| (In thousands) | 2019 | 2018 | 2017 | |||||||||
| Service cost |
$ | 3,277 | $ | 3,625 | $ | 3,615 | ||||||
| Settlement loss |
46 | — | — | |||||||||
| Interest cost |
3,515 | 3,510 | 3,930 | |||||||||
| Expected returns on plan assets |
(5,494 | ) | (6,173 | ) | (6,535 | ) | ||||||
| Amortization of actuarial losses(1) |
1,533 | 3,086 | 1,155 | |||||||||
| Amortization of prior service costs |
(283 | ) | (172 | ) | (179 | ) | ||||||
|
|
|
|
|
|
|
|||||||
| Total net periodic pension expense |
$ | 2,594 | $ | 3,876 | $ | 1,986 | ||||||
|
|
|
|
|
|
|
|||||||
| (1) | During 2019 and 2018, several employees of our business in the U.K. transferred out of its pension plan, resulting in the recognition of unamortized losses, previously included within Accumulated other comprehensive income, as part of the net periodic pension cost for the period. |
The following tables present the changes in benefit obligations and plan assets:
| Years Ended December 31, | ||||||||
| (In thousands) | 2019 | 2018 | ||||||
| Benefit obligation: |
||||||||
| Benefit obligation beginning balance |
$ | 183,539 | $ | 209,783 | ||||
| Service cost |
3,277 | 3,625 | ||||||
| Interest cost |
3,515 | 3,510 | ||||||
| Plan participants’ contributions |
894 | 1,113 | ||||||
| Actuarial loss (gain) |
16,062 | (10,265 | ) | |||||
| Benefits paid from trusts |
(8,598 | ) | (16,090 | ) | ||||
| Foreign exchange impact |
3,958 | (9,081 | ) | |||||
| Transfer of plan obligations |
(12,357 | ) | — | |||||
| Other |
1,578 | 944 | ||||||
|
|
|
|
|
|||||
| Benefit obligation ending balance |
$ | 191,868 | $ | 183,539 | ||||
|
|
|
|
|
|||||
| Fair value of plan assets: |
||||||||
| Beginning balance, fair value of plan assets |
$ | 136,693 | $ | 159,309 | ||||
| Actual return on plan assets |
19,120 | (4,424 | ) | |||||
| Company contributions |
4,238 | 3,907 | ||||||
| Plan participants’ contributions |
894 | 1,113 | ||||||
| Benefits paid from trusts |
(8,598 | ) | (16,090 | ) | ||||
| Foreign exchange impact |
4,171 | (7,122 | ) | |||||
| Transfer of plan obligations |
(11,014 | ) | — | |||||
|
|
|
|
|
|||||
| Ending balance, fair value of plan assets |
$ | 145,504 | $ | 136,693 | ||||
|
|
|
|
|
|||||
| Under-funded status, net(1) |
$ | (46,364 | ) | $ | (46,846 | ) | ||
|
|
|
|
|
|||||
| (1) | Represents the net funded status recognized in the Consolidated Balance Sheet in “Other long-term liabilities.” |
F-40
CLEAR CHANNEL INTERNATIONAL B.V. AND SUBSIDIARIES
NOTES TO CONSOLIDATED FINANCIAL STATEMENTS (CONTINUED)
The following tables present the pre-tax net loss (gain) and amortization of prior service costs and changes in pre-tax net loss (gain) recognized in accumulated other comprehensive income:
| Years Ended December 31, | ||||||||||||
| (In thousands) | 2019 | 2018 | 2017 | |||||||||
| Beginning balance, accumulated other comprehensive income |
$ | 38,729 | $ | 41,031 | $ | 48,527 | ||||||
| Net actuarial loss (gain) arising during the period |
2,436 | 332 | (6,398 | ) | ||||||||
| Amortization of net actuarial loss |
(1,533 | ) | (3,750 | ) | (1,276 | ) | ||||||
| Amortization of prior service costs |
283 | 172 | 178 | |||||||||
| Other adjustments |
(1,323 | ) | 944 | — | ||||||||
|
|
|
|
|
|
|
|||||||
| Ending balance, accumulated other comprehensive income |
$ | 38,592 | $ | 38,729 | $ | 41,031 | ||||||
|
|
|
|
|
|
|
|||||||
| December 31, | ||||||||||||
| (In thousands) | 2019 | 2018 | 2017 | |||||||||
| Unrecognized net actuarial loss |
$ | 39,965 | $ | 38,995 | $ | 42,413 | ||||||
| Unrecognized prior service cost |
(1,373 | ) | (266 | ) | (1,382 | ) | ||||||
|
|
|
|
|
|
|
|||||||
| Total |
$ | 38,592 | $ | 38,729 | $ | 41,031 | ||||||
|
|
|
|
|
|
|
|||||||
The following table presents the assumptions used to measure the net periodic cost and the year-end benefit obligations:
| Years Ended December 31, | ||||||||||||
| 2019 | 2018 | 2017 | ||||||||||
| Weighted-average assumptions used to measure net periodic cost: |
||||||||||||
| Discount rate |
0.30% - 2.90% | 0.90% - 2.50% | 0.60% - 2.65% | |||||||||
| Expected long-term returns on plan assets |
1.50% - 5.60% | 1.00% - 5.55% | 1.50% - 5.70% | |||||||||
| Rate of compensation increases |
0.50% - 2.30% | 1.00% - 2.30% | 1.00% - 2.35% | |||||||||
| Weighted-average assumptions used to measure benefit obligations: |
||||||||||||
| Discount rate |
0.30% - 2.00% | 0.90% - 2.90% | 0.60% - 2.50% | |||||||||
| Expected long-term returns on plan assets |
1.50% - 4.40% | 1.00% - 5.60% | 1.50% - 5.55% | |||||||||
| Rate of compensation increases |
0.50% - 2.30% | 1.00% - 2.30% | 1.00% - 2.30% | |||||||||
Discount Rate
The discount rate assumptions for jurisdictions for which rates are not determined by the government reflect the yields available on high-quality, fixed income debt instruments at the measurement date. A portfolio of high-quality corporate bonds is used to construct a yield curve. The cash flows from the Company’s expected benefit obligation payments are then matched to the yield curve to derive the discount rates. In certain countries, where the markets for high-quality long-term bonds are not generally as well developed, a portfolio of long-term government bonds is used as a base, to which a credit spread is added to simulate corporate bond yields at these maturities in the jurisdiction of each plan, as the benchmark for developing the respective discount rates.
Expected Long-Term Returns on Plan Assets
Expected returns on plan assets, a component of net periodic cost, represent the expected long-term returns on plan assets based on the calculated market-related value of plan assets. Expected long-term returns on plan assets
F-41
CLEAR CHANNEL INTERNATIONAL B.V. AND SUBSIDIARIES
NOTES TO CONSOLIDATED FINANCIAL STATEMENTS (CONTINUED)
take into account long-term expectations for future returns and the investment policies and strategies of the respective plans. These rates of return are developed by the Company and are tested for reasonableness against historical returns. The use of expected long-term returns on plan assets may result in recognized pension income that is greater or less than the actual returns of those plan assets in any given year. Over time, however, the expected long-term returns are designed to approximate the actual long-term returns and therefore result in a pattern of income and cost recognition that more closely matches the pattern of the services provided by the employees. Differences between actual and expected returns are recognized as a component of net loss or gain in accumulated other comprehensive income, which is amortized as a component of net periodic cost over the service lives or life expectancy of the plan participants, depending on the plan, provided such amounts exceed certain thresholds provided by accounting standards. The market-related value of plan assets recognizes changes in the fair value of plan assets systematically over a five-year period in the expected return on plan assets line in net periodic cost.
Rate of Compensation Increases and Mortality Rate
The rate of compensation increases is determined by the Company, based upon its long-term plans for such increases. Mortality rate assumptions are based on life expectancy and death rates for different types of participants. Mortality rates are periodically updated based on actual experience.
Defined-Benefit Pension Plan Assets
The following table presents the Company’s defined-benefit pension plans’ asset classes and their associated fair value at December 31, 2019 and 2018:
| December 31, 2019 | ||||||||||||
| (In thousands) | Level 1 | Level 2 | Level 3 | |||||||||
| Cash and short-term investments |
$ | 13,294 | $ | — | $ | — | ||||||
| Equity securities |
98,400 | — | — | |||||||||
| Real estate |
— | 8,772 | — | |||||||||
| Fixed income: |
||||||||||||
| Corporate bonds |
— | 21,555 | — | |||||||||
| Annuity contracts |
— | — | — | |||||||||
| Insurance contracts |
— | 3,483 | — | |||||||||
|
|
|
|
|
|
|
|||||||
| Fair value of plan assets |
$ | 111,694 | $ | 33,810 | $ | — | ||||||
|
|
|
|
|
|
|
|||||||
| December 31, 2018 | ||||||||||||
| (In thousands) | Level 1 | Level 2 | Level 3 | |||||||||
| Cash and short-term investments |
$ | 9,195 | $ | — | $ | — | ||||||
| Equity securities |
71,709 | — | — | |||||||||
| Fixed income: |
||||||||||||
| Corporate bonds |
— | 10,154 | — | |||||||||
| Annuity contracts |
— | 42,251 | — | |||||||||
| Insurance contracts |
— | 3,384 | — | |||||||||
|
|
|
|
|
|
|
|||||||
| Fair value of plan assets |
$ | 80,904 | $ | 55,789 | $ | — | ||||||
|
|
|
|
|
|
|
|||||||
Expected Benefit Payments
The following table presents the expected benefit payments to defined-benefit pension plan participants over the next ten years. These payments have been estimated based on the same assumptions used to measure the plans’
F-42
CLEAR CHANNEL INTERNATIONAL B.V. AND SUBSIDIARIES
NOTES TO CONSOLIDATED FINANCIAL STATEMENTS (CONTINUED)
pension benefit obligation at December 31, 2019 and include benefits attributable to estimated future compensation increases, where applicable:
| (In thousands) |
| |||
| 2020 |
$ | 4,464 | ||
| 2021 |
5,311 | |||
| 2022 |
5,575 | |||
| 2023 |
6,403 | |||
| 2024 |
7,282 | |||
| 2025 - 2029 |
37,010 | |||
Plan Contributions
It is the Company’s general practice to fund amounts for pensions sufficient to meet the minimum requirements set forth in applicable employee benefits laws and local tax laws. From time to time, the Company contributes additional amounts as it deems appropriate. The Company contributed $4.2 million, $3.9 million and $3.7 million to defined-benefit pension plans during the years ended December 31, 2019, 2018 and 2017, respectively.
Defined-Contribution Retirement Plans
The Company’s employees participate in retirement plans administered as a service by third-party administrators. The Company contributed $13.0 million, $11.0 million and $12.9 million to defined-contribution retirement plans during the years ended December 31, 2019, 2018 and 2017, respectively. Such costs were recorded within “Selling, general and administrative expenses.”
NOTE 10 – COMMITMENTS, CONTINGENCIES AND GUARANTEES
Commitments
The Company has various commitments under non-cancelable contracts, including contracts that meet the definition of a lease under ASC Topic 842. Non-cancelable contracts that provide the supplier with a substantive substitution right regarding the property, plant and equipment used to fulfill the contract do not meet the definition of a lease for accounting purposes and have been included within non-lease non-cancelable contracts in the table below.
Additionally, the Company has commitments relating to required purchases of property, plant and equipment under certain street furniture contracts. Certain of the Company’s contracts contain penalties for not fulfilling its commitments related to its obligations to build bus shelters, kiosks and other public amenities or advertising structures; however, any such penalties have not historically materially impacted the Company’s financial position or results of operations.
F-43
CLEAR CHANNEL INTERNATIONAL B.V. AND SUBSIDIARIES
NOTES TO CONSOLIDATED FINANCIAL STATEMENTS (CONTINUED)
As of December 31, 2019, the Company’s future minimum payments under non-lease non-cancelable contracts in excess of one year and capital expenditure commitments consisted of the following:
| (In thousands) | Non-Lease Non-Cancelable Contracts |
Capital Expenditure Commitments |
||||||
| 2020 |
$ | 174,398 | $ | 28,094 | ||||
| 2021 |
169,646 | 10,449 | ||||||
| 2022 |
151,678 | 9,154 | ||||||
| 2023 |
126,714 | 2,556 | ||||||
| 2024 |
74,716 | 2,003 | ||||||
| Thereafter |
119,207 | 1,042 | ||||||
|
|
|
|
|
|||||
| Total |
$ | 816,359 | $ | 53,298 | ||||
|
|
|
|
|
|||||
Refer to Note 4 to the consolidated financial statements for the Company’s future maturities of operating lease liabilities as of December 31, 2019.
Legal Proceedings
The Company and its subsidiaries are involved in certain legal proceedings arising in the ordinary course of business and, as required, have accrued an estimate of the probable costs for the resolution of those claims for which the occurrence of loss is probable and the amount can be reasonably estimated. These estimates have been developed in consultation with counsel and are based upon an analysis of potential results, assuming a combination of litigation and settlement strategies. It is possible, however, that future results of operations for any particular period could be materially affected by changes in the Company’s assumptions or the effectiveness of its strategies related to these proceedings. Additionally, due to the inherent uncertainty of litigation, there can be no assurance that the resolution of any particular claim or proceeding would not have a material adverse effect on the Company’s financial condition or results of operations.
Although the Company is involved in a variety of legal proceedings in the ordinary course of business, a large portion of the Company’s litigation arises in the following contexts: commercial disputes, employment and benefits related claims, land use and zoning, governmental fines, intellectual property claims, tax disputes and regulatory disputes.
Italy Investigation
During the three months ended June 30, 2018, the Company identified misstatements associated with VAT obligations in its business in Italy, which resulted in an understatement of its VAT obligation. These misstatements resulted in an understatement of other long-term liabilities of $16.9 million as of December 31, 2017. The effect of these misstatements is reflected in the historical financial statements in the appropriate periods. Upon identification of these misstatements, the Company undertook certain procedures, including a forensic investigation. In addition, the Company voluntarily disclosed the matter and findings to the Italian tax authorities in order to commence a discussion on the appropriate calculation of the VAT position.
The current expectation is that the Company may have to repay to the Italian tax authority a substantial portion of the VAT previously applied as a credit in relation to the transactions under investigation, amounting to approximately $20.4 million, including estimated possible penalties and interest. As of December 31, 2019, the Company had made payments of $8.1 million and applied VAT recoverable of $1.7 million; the timing of the remaining repayment has not been finalized. The ultimate amount to be paid may differ from the estimates, and such differences may be material.
F-44
CLEAR CHANNEL INTERNATIONAL B.V. AND SUBSIDIARIES
NOTES TO CONSOLIDATED FINANCIAL STATEMENTS (CONTINUED)
Surety Bonds and Guarantees
As of December 31, 2019, the Company had outstanding surety bonds of $44.2 million, supported by $20.2 million of letters of credit held by CCOH, and outstanding bank guarantees of $27.0 million, of which $11.7 million were backed by cash collateral. Additionally, as of December 31, 2019, CCOH had outstanding surety bonds of $16.4 million held on behalf of the Company and its subsidiaries.
NOTE 11 – INCOME TAXES
Income Tax Expense
Significant components of the provision for income tax expense are as follows:
| (In thousands) | Years Ended December 31, | |||||||||||
| 2019 | 2018 | 2017 | ||||||||||
| Current tax expense |
$ | 9,818 | $ | 2,051 | $ | 1,382 | ||||||
| Deferred tax expense |
53,899 | 2,432 | 5,114 | |||||||||
|
|
|
|
|
|
|
|||||||
| Income tax expense |
$ | 63,717 | $ | 4,483 | $ | 6,496 | ||||||
|
|
|
|
|
|
|
|||||||
For the year ended December 31, 2019, the Company recorded income tax expense of $63.7 million as compared to $4.5 million for 2018. The change in tax was primarily due to valuation allowances recorded against deferred tax assets as it was no longer more likely than not that the assets would be realizable.
For the year ended December 31, 2018, the Company recorded income tax expense of $4.5 million as compared to $6.5 million for 2017. The change in tax was due primarily to the deferred tax benefits resulting from various country tax rate reductions in 2018.
F-45
CLEAR CHANNEL INTERNATIONAL B.V. AND SUBSIDIARIES
NOTES TO CONSOLIDATED FINANCIAL STATEMENTS (CONTINUED)
Deferred Taxes
Significant components of the Company’s deferred tax liabilities and assets as of December 31, 2019 and 2018 are as follows:
| (In thousands) | December 31, | |||||||
| 2019 | 2018 | |||||||
| Deferred tax liabilities: |
||||||||
| Operating lease right-of-use asset |
111,216 | — | ||||||
| Other |
4,610 | — | ||||||
|
|
|
|
|
|||||
| Total deferred tax liabilities |
115,826 | — | ||||||
|
|
|
|
|
|||||
| Deferred tax assets: |
||||||||
| Intangibles and fixed assets |
26,151 | 23,603 | ||||||
| Accrued expenses |
6,086 | 9,979 | ||||||
| Net operating loss carryforwards(1) |
108,893 | 107,226 | ||||||
| Bad debt reserves |
701 | 938 | ||||||
| Pension provision |
11,423 | 10,938 | ||||||
| Operating lease liabilities |
116,019 | — | ||||||
| Other |
3,635 | 5,447 | ||||||
|
|
|
|
|
|||||
| Total deferred tax assets |
272,908 | 158,131 | ||||||
| Less: Valuation allowance(2) |
152,579 | 97,034 | ||||||
|
|
|
|
|
|||||
| Total deferred tax assets, net of valuation allowance |
120,329 | 61,097 | ||||||
|
|
|
|
|
|||||
| Net deferred tax assets |
$ | 4,503 | $ | 61,097 | ||||
|
|
|
|
|
|||||
| (1) | At December 31, 2019, the Company had recorded $108.9 million (tax-effected) of deferred tax assets for net operating loss carryforwards for various jurisdictions, the majority of which may be carried forward without expiration. |
| (2) | At December 31, 2019, the Company had recorded valuation allowances of $103.9 million as an offset to the net operating losses. The remaining deferred tax valuation allowance of $48.7 million offsets other foreign deferred tax assets that are not expected to be realized. |
Effective Tax Rate
The reconciliation of income tax computed at the local country statutory rates to income tax expense is:
| (In thousands) | Years Ended December 31, | |||||||||||||||||||||||
| 2019 | 2018 | 2017 | ||||||||||||||||||||||
| Amount | Percent | Amount | Percent | Amount | Percent | |||||||||||||||||||
| Taxes computed at local statutory rates |
$ | 3,961 | 19.5 | % | $ | 7,849 | 22.1 | % | $ | 8,426 | 16.0 | % | ||||||||||||
| Adjustments in income taxes resulting from: |
||||||||||||||||||||||||
| Nondeductible items |
(12,720 | ) | (62.7 | )% | (10,746 | ) | (30.2 | )% | (8,151 | ) | (15.5 | )% | ||||||||||||
| Tax contingencies |
(352 | ) | (1.7 | )% | 6,170 | 17.3 | % | 2,943 | 5.6 | % | ||||||||||||||
| Valuation allowances |
(55,191 | ) | (272.1 | )% | (5,934 | ) | (16.7 | )% | (5,656 | ) | (10.8 | )% | ||||||||||||
| Other, net |
585 | 2.9 | % | (1,822 | ) | (5.1 | )% | (4,058 | ) | (7.7 | )% | |||||||||||||
|
|
|
|
|
|
|
|
|
|
|
|
|
|||||||||||||
| Income tax expense |
$ | (63,717 | ) | (314.1 | )% | $ | (4,483 | ) | (12.6 | )% | $ | (6,496 | ) | (12.4 | )% | |||||||||
|
|
|
|
|
|
|
|
|
|
|
|
|
|||||||||||||
F-46
CLEAR CHANNEL INTERNATIONAL B.V. AND SUBSIDIARIES
NOTES TO CONSOLIDATED FINANCIAL STATEMENTS (CONTINUED)
During 2019, the Company recorded tax expense of approximately $63.7 million. The 2019 income tax expense and (314)% effective tax rate were impacted primarily by certain foreign jurisdictions due to uncertainty regarding the Company’s ability to realize those assets in future periods.
During 2018 and 2017, the Company recorded tax expense of approximately $4.5 million and $6.5 million, respectively, resulting in effective tax rates of (13)% and (12)%, respectively. The income tax expense and effective tax rates for each of these years were impacted primarily by certain nondeductible interest and other intercompany charges and the Company’s inability to benefit from losses in certain jurisdictions.
Unrecognized Tax Benefits
The Company records interest and penalties related to unrecognized tax benefits in current income tax expense and had $3.4 million and $1.7 million of interest accrued as of December 31, 2019 and 2018, respectively. The total amount of unrecognized tax benefits at December 31, 2019 and 2018, including accrued interest and penalties, was $12.6 million and $10.0 million, respectively. As of December 31, 2019 and 2018, total unrecognized tax benefits of $7.7 million and $7.0 million, respectively, were included in “Other long-term liabilities” on the Consolidated Balance Sheets, and $4.9 million and $3.0 million, respectively, were recorded net with the Company’s deferred tax assets for its net operating loss carryforwards. The total amount of unrecognized tax benefits at December 31, 2019 and 2018 that, if recognized, would impact the effective income tax rate was $7.7 million and $7.0 million, respectively.
During 2019, the Company reversed $2.0 million in unrecognized tax benefits, inclusive of interest, primarily as a result of the expiration of statutes of limitations to assess taxes in certain jurisdictions. Substantially all material income tax matters have been concluded for years through 2015.
A reconciliation of the beginning and ending amounts of unrecognized tax benefits is as follows:
| (In thousands) | Years Ended December 31, | |||||||
| 2019 | 2018 | |||||||
| Unrecognized tax benefits, balance at beginning of period |
$ | 8,278 | $ | 12,568 | ||||
| Increases for tax position taken in the current year |
2,458 | 2,350 | ||||||
| Increases for tax positions taken in previous years |
325 | — | ||||||
| Decreases for tax positions taken in previous years |
(11 | ) | (2,116 | ) | ||||
| Decreases due to lapse of statute of limitations(1) |
(1,843 | ) | (4,524 | ) | ||||
|
|
|
|
|
|||||
| Unrecognized tax benefits, balance at end of period |
$ | 9,207 | $ | 8,278 | ||||
|
|
|
|
|
|||||
NOTE 12 – OTHER INFORMATION
Balance Sheets
The following table discloses the components of “Other current assets” as of December 31, 2019 and 2018:
| (In thousands) | December 31, 2019 |
December 31, 2018 |
||||||
| Inventory |
$ | 18,880 | $ | 15,822 | ||||
| Restricted cash |
4,116 | 4,221 | ||||||
| Other receivables |
2,256 | 3,698 | ||||||
| Deposits |
310 | 616 | ||||||
| Other |
1,937 | 2,438 | ||||||
|
|
|
|
|
|||||
| Total other current assets |
$ | 27,499 | $ | 26,795 | ||||
|
|
|
|
|
|||||
F-47
CLEAR CHANNEL INTERNATIONAL B.V. AND SUBSIDIARIES
NOTES TO CONSOLIDATED FINANCIAL STATEMENTS (CONTINUED)
The following table discloses the components of “Other assets” as of December 31, 2019 and 2018:
| (In thousands) | December 31, 2019 |
December 31, 2018 |
||||||
| Restricted cash |
$ | 9,580 | $ | 11,945 | ||||
| Advertising taxes receivable |
7,431 | 4,984 | ||||||
| Deposits |
6,535 | 6,096 | ||||||
| Investments |
5,914 | 5,806 | ||||||
| Deferred income taxes(1) |
4,503 | 61,097 | ||||||
| Prepaid expenses |
1,088 | 10,476 | ||||||
| Other |
4,219 | 5,752 | ||||||
|
|
|
|
|
|||||
| Total other assets |
$ | 39,270 | $ | 106,156 | ||||
|
|
|
|
|
|||||
| (1) | The decrease in deferred income taxes is primarily due to valuation allowances recorded against deferred tax assets as it was no longer more likely than not that the assets would be realizable. Refer to Note 11 for additional details. |
The following table discloses the components of “Accrued expenses” as of December 31, 2019 and 2018:
| (In thousands) | December 31, 2019 |
December 31, 2018 |
||||||
| Accrued employee compensation and benefits |
$ | 107,344 | $ | 106,444 | ||||
| Accrued rent(1) |
86,387 | 94,015 | ||||||
| Accrued taxes |
20,095 | 20,699 | ||||||
| Accrued other |
73,063 | 83,879 | ||||||
|
|
|
|
|
|||||
| Total accrued expenses |
$ | 286,889 | $ | 305,037 | ||||
|
|
|
|
|
|||||
| (1) | As of December 31, 2019, “Accrued rent” includes accruals for contracts that do not meet the definition of a lease under ASC Topic 842 due to substantive substitution rights. |
The following table discloses the components of “Other long-term liabilities” as of December 31, 2019 and 2018:
| (In thousands) | December 31, 2019 |
December 31, 2018 |
||||||
| Postretirement benefit obligation |
$ | 46,364 | $ | 46,846 | ||||
| Asset retirement obligation |
24,560 | 25,547 | ||||||
| Unrecognized tax benefits |
7,720 | 7,049 | ||||||
| Deferred income(1) |
— | 14,469 | ||||||
| Other |
15,611 | 19,393 | ||||||
|
|
|
|
|
|||||
| Total other long-term liabilities |
$ | 94,255 | $ | 113,304 | ||||
|
|
|
|
|
|||||
| (1) | Upon adoption of ASC Topic 842, deferred gains related to previous transactions that were historically accounted for as sale and operating leasebacks in accordance with ASC Topic 840 were recognized as a cumulative-effect adjustment to equity, resulting in a decrease to deferred income. |
F-48
CLEAR CHANNEL INTERNATIONAL B.V. AND SUBSIDIARIES
NOTES TO CONSOLIDATED FINANCIAL STATEMENTS (CONTINUED)
The following table discloses the components of “Accumulated other comprehensive income,” net of tax, as of December 31, 2019 and 2018:
| (In thousands) | December 31, 2019 |
December 31, 2018 |
||||||
| Cumulative currency translation adjustments |
$ | 473,334 | $ | 449,100 | ||||
| Cumulative pension adjustments |
(32,922 | ) | (33,059 | ) | ||||
|
|
|
|
|
|||||
| Total accumulated other comprehensive income |
$ | 440,412 | $ | 416,041 | ||||
|
|
|
|
|
|||||
Statements of Comprehensive Income (Loss)
“Other operating income, net” of $2.7 million, $3.4 million and $7.1 million during the years ended December 31, 2019, 2018 and 2017, respectively, consisted of gains on disposal of assets.
The following table discloses the components of “Other income (expense), net” for the years ended December 31, 2019, 2018 and 2017:
| (In thousands) | Years Ended December 31, | |||||||||||
| 2019 | 2018 | 2017 | ||||||||||
| Foreign exchange gain (loss) |
$ | 1,423 | $ | (8,812 | ) | $ | (3,880 | ) | ||||
| Equity in loss of nonconsolidated affiliates |
(323 | ) | (313 | ) | (1,981 | ) | ||||||
| Loss on sale of investments |
(1,484 | ) | (227 | ) | (1,045 | ) | ||||||
| Other |
554 | (14 | ) | 3,825 | ||||||||
|
|
|
|
|
|
|
|||||||
| Total other income (expense), net |
$ | 170 | $ | (9,366 | ) | $ | (3,081 | ) | ||||
|
|
|
|
|
|
|
|||||||
NOTE 13 – SUBSEQUENT EVENTS
In connection with the preparation of the financial statements and in accordance with Accounting Standards Codification 855-10, Subsequent Events – Overall, management has evaluated and reviewed the affairs of the Company for subsequent events that would impact the financial statements for the year ended December 31, 2019 through June 30, 2020, the date the financial statements were available to be issued.
COVID-19
In December 2019, it was first reported that there had been an outbreak of a new coronavirus (“COVID-19”) in China, which subsequently spread to most countries around the globe. In March 2020, the World Health Organization characterized the COVID-19 outbreak as a pandemic, which is still ongoing. In an effort to slow the outbreak, governments around the world placed significant restrictions on travel and closed businesses, resulting in unprecedented nationwide lock-downs. Although most lock-downs have been or are in the process of being lifted, our business, along with the global economy, has been adversely affected by these developments. Since the onset of the crisis in March, the Company has experienced a sharp decline in bookings and received an unprecedented level of requests to defer or cancel current contracts as customers seek to conserve cash during the economic downturn. The Company is implementing and evaluating actions to strengthen its financial position and support the continuity of its platform and operations, and the Company’s assessment of conditions and events, considered in the aggregate, indicate it will be able to meet its obligations as they become due within one year after the date of these financial statements. However, the extent to which COVID-19 will ultimately impact the Company’s results and overall economic recovery will depend on future developments, which are highly uncertain.
F-49
CLEAR CHANNEL INTERNATIONAL B.V. AND SUBSIDIARIES
NOTES TO CONSOLIDATED FINANCIAL STATEMENTS (CONTINUED)
As described in Note 1, the Company’s consolidated financial statements presented herein reflect estimates, judgments and assumptions made by management that affect the amounts reported in the consolidated financial statements and accompanying notes. Specifically, during the first quarter of 2020, the Company tested its intangible assets and goodwill for impairment due to the expected negative financial statement impacts from COVID-19; however, no impairments were identified. Additionally, at March 31, 2020, the Company recorded an $8.6 million valuation allowance based on significant negative evidence for the forecasted realizability of deferred tax assets in Italy. Because there continues to be a high level of uncertainty in estimating the expected economic and operational impacts relative to COVID-19 as it is an evolving situation, the estimates and assumptions used in these financial statements may change in future periods as the expected impacts from COVID-19 are revised.
CCIBV Note
On May 15, 2020, the Company issued a promissory note (the “CCIBV Note”) in principal amount of approximately $53.0 million. The CCIBV Note, which matures on May 15, 2022, bears interest at a rate of 14.00% per annum in cash (or 16.00% per annum if paid-in-kind), to be paid quarterly. The CCIBV Note contains restrictions on restricted payments and incurrence of indebtedness by the Company and is guaranteed by the Parent Company, a certain other parent entity of CCIBV and certain subsidiaries of CCIBV.
F-50