Attached files
| file | filename |
|---|---|
| EX-99.1 - EX-99.1 - CALIX, INC | ex991pressrelease20q2.htm |
| 8-K - 8-K - CALIX, INC | calx-20200721.htm |
Exhibit 99.2

July 21, 2020
Fellow Calix stockholders:
As the coronavirus has continued to spread around the world, the future remains uncertain. Without a vaccine, and with scant treatments available, no one knows how or when this terrible crisis will end. The escalating human cost and the massive changes in society we discussed last quarter have continued into this quarter … and will likely do so into the foreseeable future. It is critical all of us remain connected, and that is our mission.
There are two secular disruptions moving through the communications industry, and we are perfectly positioned to ride both. The pandemic is accelerating these disruptions as our lives have changed in almost every way from what they were just a little more than a quarter ago. Given more activity taking place at home on digital and social platforms, we have already seen, and are likely to continue to see, greater strain on service provider broadband networks across the globe. This in turn requires service providers to respond by increasing capacity on their networks to handle the higher data traffic. We have seen both effects driving demand for our products. The larger portion of the current demand is a pull forward to meet capacity, with the smaller effect being an acceleration of our All Platform business. For many, this response is clearly pulling forward capital investments that would have occurred in future periods be they quarters or even years. However, for innovative service providers, the pandemic presents an opportunity to seek better tools to do this most expeditiously and cost effectively. Insights and analytics available in Calix Cloud and tools inside EXOS and AXOS fit perfectly within this new normal as they enable service providers to reduce network complexity, decrease subscriber churn due to service outages and dramatically shrink network issue resolution time.
As a company, we remain focused on the health and welfare of our employees and their families. In our view, only by remaining healthy and strong can we continue to serve the needs of our customers. As we noted last quarter, we have been building a virtual culture for many years, and we accelerated our shift to an all-virtual mode, which remains in effect today. We have now made the decision to embrace a Work-From-Anywhere culture, and this operating mode dramatically reduces our physical facilities requirements. Furthermore, our customers are accelerating their interest in our All Platform offerings, and we took actions in the second quarter to align our product portfolio to this acceleration. Our second quarter financials reflect the impact of these actions as GAAP charges to our operating results.
With service providers of all types responding to the increased demand for their services, the value of our all platform offerings continues to resonate, and demand for our platforms continues to grow. With many of our customers still playing catch up to the surge in bandwidth usage on their networks continuing from what we discussed last quarter, we had a strong quarter with reported results above the high end of our guidance for revenue, non-GAAP gross margin, non-GAAP operating expenses and non-GAAP net income per diluted common share. In addition, for the fourth consecutive quarter, we generated positive operating cash flow. Despite highly limited in-person interaction during the quarter, we expanded our addressable market again this quarter as we added 18 new customers. As has been the trend over the past quarters, most of these new customers came from emerging customer verticals. This continued expansion of our customer base is fundamental to our transformation and creates a foundation for predictable, profitable growth for years to come.
1
Riding the Wave of Disruption
Our vision is focused on providing the platforms and services that enable innovative service providers to create services at a DevOps pace and provide their subscribers with an exceptional experience.
Service providers achieve this objective by building their infrastructure and service offerings on platforms. The ongoing wave of disruption sweeping across the communications space remains unprecedented in our experience. We continue to see traditional business models being disrupted as service providers of all types learn to adapt to the demands of the device-enabled subscriber. As the market continues to disrupt, the gap between subscriber needs and service provider supply continues to grow. New service providers are being created to address this unmet need, and capital is being formed to support them. We see this investment accelerating in the market, and it is well aligned with our mission; and we see the pace of existing service providers transforming to address this need hastening as well. As these service providers realign their investments, we are finding areas where our platforms can help them grow. In short, when a service provider of any type chooses to own the subscriber experience, we are well positioned to help them succeed.
Continued Transformation to an All Platform Company
Our relentless focus on the transformation of Calix into a communications cloud and software platform business yielded further progress in the second quarter of 2020. As we stated in our prior letters to stockholders, we continue to believe this transformation will manifest in improved financial performance across four measurable metrics over the long term:
•Deliberate revenue growth
•Gross margin expansion
•Disciplined operating expense investment
•Increased predictability
In the second quarter of 2020, we made solid progress on all these metrics, and we expect these metrics will continue to improve as our platforms increase as a percentage of our total business. Examples of our progress made in the quarter were:
•Added 18 new customers in the quarter from all segments of the market.
•Customers continue to recognize the power of data and analytics with Calix Cloud revenue increasing by more than 60% compared to the year ago quarter.
•Record quarter for the EXOS platform with systems shipments up more than 60% year-over-year and revenue up more than three-fold as customers increasingly decide to implement the Revenue EDGE solution to deliver a superior broadband experience for their subscribers.
•AXOS platform shipments increased by more than 70% compared to the year ago quarter as customers strive to increase bandwidth on their networks.
•As customers increasingly implement the Revenue Edge solution, we saw an eight-fold year-over-year increase in customers choosing to utilize the CommandIQTM personalization service enabling customers to elevate both their brand and their subscriber’s broadband experience.
Our near-term focus is on serving the needs of our service provider customers, while our long-term focus remains on finding like-minded customers regardless of their type, size or location. Furthermore, we remain committed to aligning our investments to our strategy and maintaining strong discipline over our operating expenses. Over the long term, we believe this focus will drive continuous improvement in our financial performance.
2
Second Quarter 2020 Financial Results
| Actual GAAP | Actual Non-GAAP | Guidance Non-GAAP | |||||||||
| Revenue | $119.0M | $119.0M | $110.0M - $114.0M | ||||||||
| Gross margin | 47.4% | 50.2% (1) | 46.0% - 48.0% (1) | ||||||||
| Operating expenses | $59.7M | $50.4M (1) | $48.0M - $50.0M (1) | ||||||||
| Net income (loss) per diluted common share | ($0.07) | $0.14 (1) | $0.03 - $0.07 (1) | ||||||||
| Operating cash flow | $2.7M | $2.7M | Positive | ||||||||
(1) Non-GAAP excludes items such as stock-based compensation, U.S. tariff and tariff-related costs, component inventory accrual, intangible asset amortization and restructuring charges. See GAAP to non-GAAP reconciliations beginning on page 15.
Overall results for the second quarter of 2020 were well above our financial guidance for the quarter as overall demand was robust and our supply chain outperformed despite the continued challenging global environment for component sourcing. Total revenue was above the high end of our guidance range, increasing 19% compared to the year-ago quarter. This strong performance was driven by demand for our platforms and the continued ramp of new offerings with the majority of growth coming from our small customer base. Non-GAAP gross margin was above the high-end of our guidance owing to improved product and customer mix. Meanwhile, our non-GAAP operating expenses undergrew revenue and were just above the high end of our guidance range due to our continued focus on maintaining financial discipline and higher incentive compensation due to the increased profitability in the second quarter, partially offset by a temporary benefit from reduced travel-related expenses. All of this resulted in earnings well above our guidance. Finally, our continuing focus on balance sheet discipline resulted in our fourth consecutive quarter of positive operating cash flow generation.
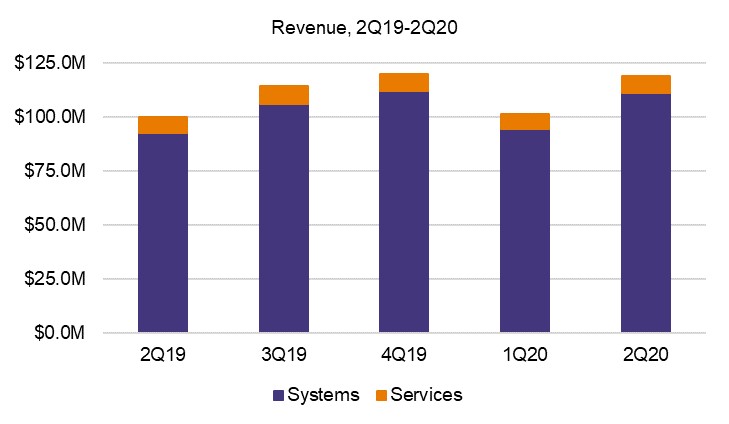
Systems revenue for the second quarter of 2020 increased 19% compared to the year ago quarter on strong demand for our Calix Cloud, EXOS and AXOS platforms along with near-term demand for our legacy systems as service providers respond to increased demand on their networks. Compared to the prior quarter, systems revenue increased 17%, which was above normal seasonality as service providers accelerated some deployments to relieve network capacity constraints. Services revenue increased 10% compared to the year ago quarter as the continued ramp in our next generation service offerings offset lower professional services related to CAF deployments. Compared to the prior quarter, services increased by 14% due to new program ramps. We continue to align our services business with our All-Platform model through the introduction of higher differentiated-value services.
3
Domestic revenue was 91% of total revenue in the second quarter and increased 26% compared to the year ago quarter due to strong demand for our platforms. International revenue was 9% of total revenue in the second quarter and declined 25% compared to the year ago quarter.
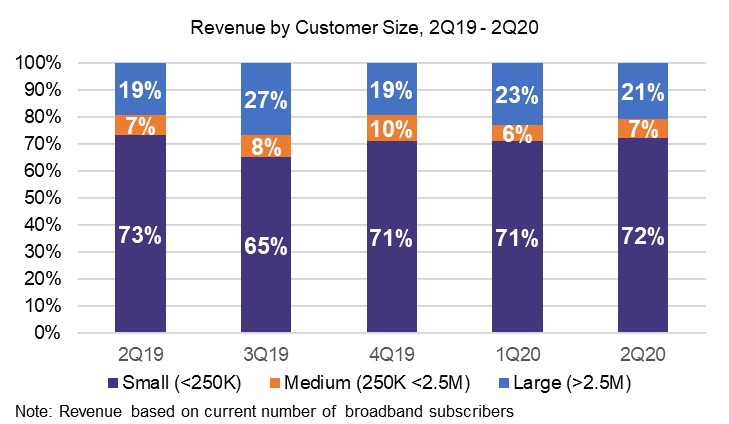
Revenue from large customers was 21% of total revenue in the second quarter of 2020 and increased by 27% compared to the year ago quarter primarily due to greater shipments to Verizon and CenturyLink. CenturyLink was our only greater than 10% of revenue customer in the quarter at 15%. Revenue from medium-sized customers was 7% of total revenue in the second quarter of 2020 and increased 14% compared to the year ago quarter reflecting the initial quarter of shipments to a new medium-size customer along with increased demand among a small subset of customers. Revenue from small customers was 72% of total revenue in the second quarter of 2020 and increased 17% as compared to the year ago quarter due to strength in demand for Calix Cloud, EXOS and AXOS platforms along with increased demand for our legacy systems. We will continue to focus on finding strategically aligned customers of all types and sizes for our all-platform business.
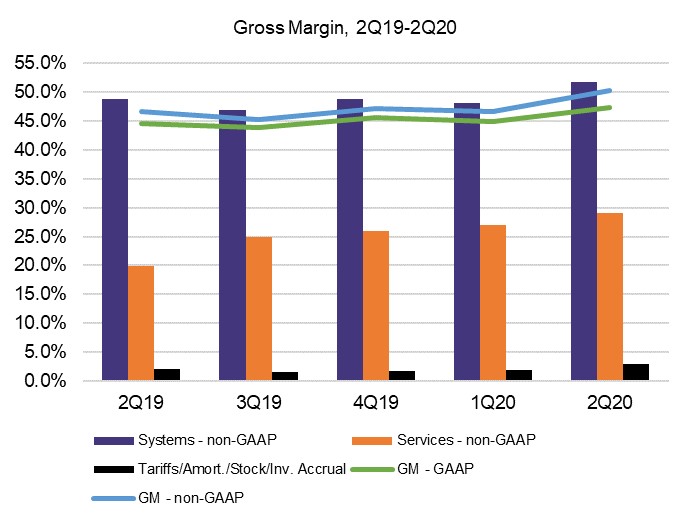
Driven by favorable product and customer mix, both GAAP and non-GAAP gross margin, increased in the second quarter of 2020 relative to the year-ago quarter. Specifically, GAAP gross margin increased 290 basis points year over year and non-GAAP gross margin increased 360 basis points year over year. Our GAAP gross margin included a component inventory accrual of $1.8 million (or 151 basis points) related to our reduction and consolidation of legacy product lines. On a GAAP basis, including the above-mentioned charge, systems gross margin increased 290 basis points compared to the year ago quarter due to favorable product and customer mix along with lower U.S. tariff and tariff-related costs. In the second quarter of 2020, U.S. tariff and tariff-related costs and intangible asset amortization costs were 125 basis points of systems gross margin compared to 200 basis points in the year ago quarter, and the component inventory accrual was 162 basis points of systems gross margin. On a non-GAAP basis, systems gross margin of 51.8% reflects increases of approximately 310 basis points year-over-year and 360 basis points sequentially. The principal drivers of both the year-over-year and sequential increase in non-GAAP systems gross margin were continued growth in our All-Platform offerings along with favorable product and customer mix. On a GAAP basis, services gross margin increased by 920 basis points compared to the year ago quarter primarily due to improved mix towards our higher gross margin support services versus lower gross margin deployment services. Sequentially,
4
on a GAAP basis, services gross margin increased by 250 basis points again due to a higher mix of support services as compared to deployment services.
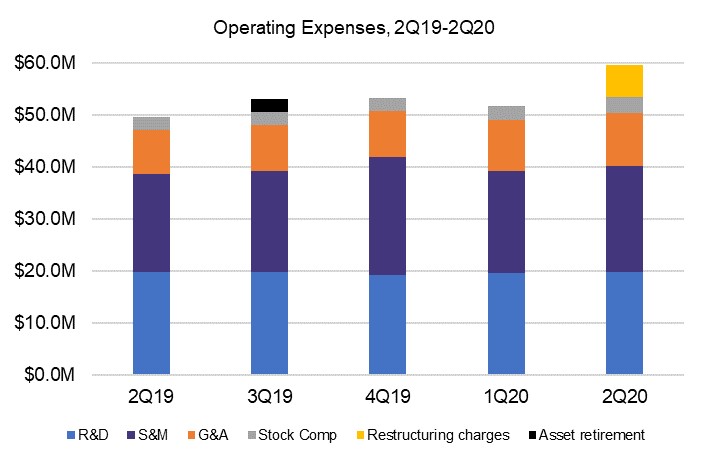
Operating expenses on a GAAP basis increased compared to the prior quarter and the year ago quarter primarily due to restructuring charges of $6.3 million. During the second quarter of 2020, we realigned our real estate portfolio to better balance our future needs as many of our employees have elected to work remotely on a permanent basis, and as a result, we recorded a facilities-related restructuring charge of $5.1 million. In addition, we took actions to further our All-Platform model, resulting in severance-related restructuring charges of $1.2 million. On a non-GAAP basis, operating expenses in the second quarter increased 7% year over year due to sales and marketing investments, higher incentive compensation and a provision for bad debt. Meanwhile, non-GAAP operating expenses increased 3% sequentially, while revenue increased by 17%, as short-term reductions in travel and entertainment expenses were offset by greater than expected incentive compensation and a provision for bad debt. As demonstrated this quarter, we expect to maintain our operating expense leverage while maintaining our pace of innovation.
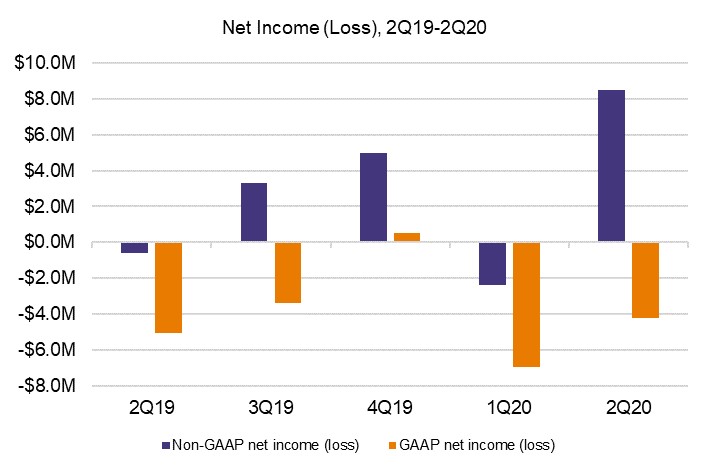
We reported a net profit on a non-GAAP basis in the second quarter of 2020. On a GAAP basis our net loss decreased by $0.8 million year-over-year, including restructuring charges of $6.3 million and a component inventory accrual of $1.8 million, from a loss of $5.0 million to a loss of $4.2 million. Our GAAP net loss for the second quarter of 2020 included restructuring charges of $6.3 million, stock-based compensation of $3.2 million, a component inventory accrual of $1.8 million, U.S. tariff and tariff-related costs of $0.7 million and intangible asset amortization of $0.7 million. With the increased revenue and higher gross margin compared with the year ago quarter, our non-GAAP profitability for the second quarter of 2020 improved by $9.1 million from a net loss of $0.6 million to a net income of $8.5 million.
5
Balance Sheet and Cash Flow
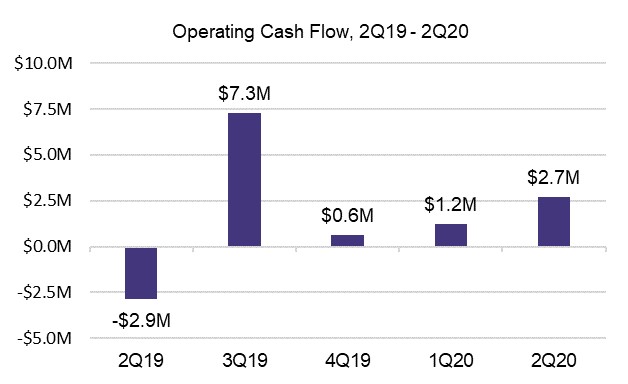
We ended the second quarter of 2020 with cash of $50.6 million, a sequential increase of $4.4 million. The sequential increase in our cash was primarily the result of positive operating cash flow of $2.7 million and proceeds from equity-based employee benefit plans of $9.2 million partially offset by lower borrowing of $4.0 million on our line of credit and capital expenditures of $2.8 million. Operating cash flow increased sequentially despite our previously disclosed inventory investment in order to improve our responsiveness to customer needs as shipment and billing linearity was improved relative to the prior quarter. Compared to the year ago quarter, our cash increased by $15.6 million primarily due to positive operating cash flow of $11.8 million and proceeds from equity-based employee benefit plans of $14.7 million partially offset by capital expenditures of $8.3 million, lower borrowing of $4.0 million on our line of credit and payments under financing arrangements of $2.8 million.
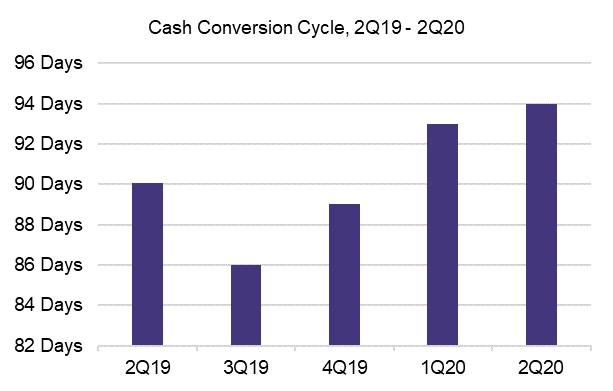
Our team remains focused on operational excellence and customer satisfaction. During the second quarter of 2020, our supply chain team performed well to meet customer needs despite continued component supply challenges caused by the coronavirus pandemic as we continue to qualify new suppliers and incur expediting costs. With our Oracle ERP transition behind us, our days sales outstanding (DSO) at quarter end returned to a more normalized level and was 45 days, down 13 days from the prior quarter and down 10 days from the prior year. Inventory turns were 5.9 at quarter end, compared to 5.2 turns in the prior quarter and 3.8 turns in the year ago quarter. The higher inventory turns in the quarter were the result of a higher level of revenue. We expect to further add to our inventory in the third quarter of 2020 to improve our ability to respond to customer needs. Days payable outstanding at quarter end was 12 days, down 23 days from the prior quarter and down 47 days from the year ago quarter. Our cash conversion cycle increased slightly to 94 days compared to 93 days in the prior quarter as the decrease in days payable outstanding offset the improvement in DSO and inventory turns. Compared to the year ago quarter, our cash conversion cycle increased by 4 days from 90 days.
We continue to believe our existing cash, expected positive operating cash flow and line of credit will provide us sufficient liquidity for our business operations while navigating the uncertainty created by the coronavirus pandemic.
6
Third Quarter 2020 Guidance
Guidance Non-GAAP | Guidance Reconciled to GAAP | |||||||
| Revenue | $127M - $131M | $127M - $131M | ||||||
| Gross margin | 48.0% - 50.0% (1) | 47.0% - 49.0% | ||||||
| Operating expenses | $50.0M - $52.0M (1) | $52.9M - $54.9M | ||||||
Net income per diluted common share(2) | $0.17 - $0.21 (1) | $0.10 - $0.14 | ||||||
Free cash flow(3) | Positive | Positive | ||||||
(1)Non-GAAP excludes items such as stock-based compensation, U.S. tariff and tariff-related costs and intangible asset amortization. See GAAP to non-GAAP reconciliation on page 15.
(2)Based on 60.8 million weighted-average diluted common shares outstanding.
(3)Free cash flow defined as operating cash flow minus capital expenditures.
Our guidance for the third quarter of 2020 reflects our expectations as of the date of this letter. These expectations reflect the normal seasonality in our business as well as our current estimate of the global impacts from the coronavirus pandemic on our business in the third quarter of 2020.
Our non-GAAP gross margin guidance for the third quarter of 2020 reflects continued growth of our platform offerings as well as favorable customer, product and regional mix, offset by a sequential increase in expediting costs as we continue to face component supply limitations.
Our non-GAAP operating expense guidance for the third quarter of 2020 reflects planned investments in sales and marketing along with a modest increase in travel and entertainment expenses. Consistent with past quarters, we remain focused on operating expense investment discipline.
Finally, we expect positive free cash flow next quarter reflecting expected GAAP and non-GAAP profitability and continued focus on working capital velocity.
7
Target Financial Model – Update
With our shift to a Work-From-Anywhere workforce and our reduced need for physical facilities, we are making two minor adjustments to our target financial model provided at our 2020 investor day on March 4, 2020 as noted below.
| Investor Day March 5, 2020 | Updated July 21, 2020 | |||||||
| Revenue | Grow 5% to 10% per year | No Change | ||||||
Non-GAAP Gross Margin(1) | Increase 100 - 200 bps per year | No Change | ||||||
Non-GAAP S&M expense(1) | 16% to 18% of revenue | No Change | ||||||
Non-GAAP R&D expense(1) | Greater of $20.0M/qtr or 32% of product gross profit | Greater of $19.2M/qtr or 30% of product gross profit | ||||||
Non-GAAP G&A expense(1) | Greater of $9.0M/qtr or 8% of revenue | Greater of $10.0M/qtr or 9% of revenue | ||||||
(1)Non-GAAP measures exclude the expected impacts from non-GAAP items such as stock-based compensation, U.S. tariff and tariff-related costs and intangible asset amortization. A reconciliation of GAAP to non-GAAP financial measures beginning with 2021 is not available on a forward-looking basis due to the high variability and low visibility with respect to these charges.
8
Summary
We are proud of our team as we focused on executing on behalf of our customers. Strong demand for our platforms along with the rapid expansion of our customer base continues to demonstrate the progress we made towards our mission in the second quarter. As we remain focused on executing on our market opportunity and supporting our customers, we expect to see our financial performance continue to improve as we drive toward our target financial model starting in 2021.
In the second quarter of 2020, we capitalized on a strong demand environment as our customers continued to respond to the increased demand for broadband. We demonstrated solid revenue growth, increased gross margin, disciplined operating expense investments and generated positive operating cash flow for the fourth consecutive quarter. Based on a strong backlog exiting the quarter and a solid pipeline of opportunities for our platforms, we are excited to project another quarter of double-digit year-over-year revenue growth, improved profitability and continued positive operating cash flow.
We see many innovative service providers looking to Calix to provide the solutions and services to enable them to improve their subscribers’ experience, thereby driving their revenue higher, lowering their churn and increasing their return on investment. With an expanding pipeline of opportunities spanning service providers of every type, we believe we are well placed to continue building Calix … an all platform company … that is positioned in front of two substantial disruptions for service providers impacting network architecture and business models. We remain committed to our vision, and we sincerely thank our employees, customers and stockholders for their continued support as we capitalize on this opportunity.
Sincerely,
 Carl Russo President & CEO |  Cory Sindelar CFO | ||||
9
Conference Call
In conjunction with this announcement, Calix will host a conference call tomorrow, July 22, 2020, at 5:30 a.m. Pacific Time (8:30 a.m. Eastern Time) to answer questions regarding our second quarter 2020 financial results. A live audio webcast and replay of the call will be available in the Investor Relations section of the Calix website at http://investor-relations.calix.com.
Live call access information: Dial-in number: (877) 407-4019 (U.S.) or (201) 689-8337 (outside the U.S.)
The conference call and webcast will include forward-looking information.
Investor Inquiries
Thomas J. Dinges, CFA
Director of Investor Relations
408-474-0080
Tom.Dinges@calix.com
About Calix
Calix, Inc. (NYSE: CALX) - Innovative communications service providers rely on Calix platforms to help them master and monetize the complex infrastructure between their subscribers and the cloud. Calix is the leading global provider of the cloud and software platforms, systems and services required to deliver the unified access network and smart premises of tomorrow. Our platforms and services help our customers build next generation networks by embracing a DevOps operating model, optimize the subscriber experience by leveraging big data analytics and turn the complexity of the smart, connected home and business into new revenue streams.
Forward-Looking Statements
Statements made in this stockholder letter and the earnings call referencing the stockholder letter that are not statements of historical fact are forward-looking statements. Forward-looking statements are subject to the “safe harbor” provisions of the Private Securities Litigation Reform Act of 1995. Forward-looking statements relate to, but are not limited to, statements about the impact of the coronavirus pandemic, potential customer or market opportunities, growth and pipeline opportunities, statements about customer anticipated purchase trends, expected customer and product mix or anticipated adoption of our platforms, systems or services offerings, industry, market and customer trends, opportunities with existing and prospective customers, the ongoing management of our global supply chain, benefits from our restructuring activities, free cash flow and liquidity, the performance of our recently implemented ERP system, the future impact, financial or otherwise, of the U.S. tariffs or any other tariffs or trade regulations that may be imposed whether by the United States or other countries, as well as our ability to effectively mitigate such impacts, and future financial performance (including the outlook for the third quarter of 2020). Forward-looking statements are subject to risks and uncertainties that could cause actual results to differ materially from expectations, including but not limited to fluctuations in our financial and operating results, the capital spending decisions of our customers, changes and disruptions in the market and industry, availability of capital in the market, changes in regulations and/or government sponsored programs, competition, our ability to achieve market acceptance of our platforms, systems and solutions, our ability to grow our customer base, fluctuations in costs associated with our systems and services including higher costs due to project delays and changes, third-party dependencies for production and resource management associated with our global supply chain that may cause delays in production and unavailability of systems to meet customer orders, which may be substantial, cost overruns, disruptions in global trade and relations, sustained or additional economic disruptions due to the COVID-19 pandemic, and other unanticipated factors, as well as the risks and uncertainties described in our annual reports on Form 10-K and our quarterly reports on Form 10-Q, each as filed with the SEC and available at www.sec.gov, particularly in the sections titled “Risk Factors.” Forward-looking statements speak only as of the date the statements are made and are based on information available to us at the time those statements are made and/or management’s good faith belief as of that time with respect to future events. Calix assumes no obligation to update forward-looking statements to reflect actual performance or results, changes in assumptions or changes in other factors affecting forward-looking information, except to the extent required by applicable securities laws. Accordingly, investors should not place undue reliance on any forward-looking statements.
Use of Non-GAAP Financial Information
The Company uses certain non-GAAP financial measures in this stockholder letter to supplement its consolidated financial statements, which are presented in accordance with GAAP. These non-GAAP measures include non-GAAP gross margin, non-GAAP operating expenses, non-GAAP net income (loss) and non-GAAP net income (loss) per diluted common share. These non-GAAP measures are provided to enhance the reader’s understanding of the Company’s operating performance as they
10
primarily exclude restructuring charges, non-cash charges for stock-based compensation, component inventory accrual associated with our reduction and consolidation of legacy product lines, intangible asset amortization, U.S. tariff and tariff-related costs and loss on asset retirement, which the Company believes are not indicative of its core operating results. Management believes that the non-GAAP measures used in this stockholder letter provide investors with important perspectives into the Company’s ongoing business performance and management uses these non-GAAP measures to evaluate financial results and to establish operational goals. The presentation of these non-GAAP measures is not meant to be a substitute for results presented in accordance with GAAP, but rather should be evaluated in conjunction with those GAAP results. A reconciliation of the non-GAAP results to the most directly comparable GAAP results is provided in this stockholder letter. The non-GAAP financial measures used by the Company may be calculated differently from, and therefore may not be comparable to, similarly titled measures used by other companies.
11
| Calix, Inc. | |||||||||||||||||||||||||||||||||||
| Condensed Consolidated Statements of Operations | |||||||||||||||||||||||||||||||||||
| (Unaudited, in thousands, except per share data) | |||||||||||||||||||||||||||||||||||
| Three Months Ended | Six Months Ended | ||||||||||||||||||||||||||||||||||
| June 27, | June 29, | June 27, | June 29, | ||||||||||||||||||||||||||||||||
| 2020 | 2019 | 2020 | 2019 | ||||||||||||||||||||||||||||||||
| Revenue: | |||||||||||||||||||||||||||||||||||
| Systems | $ | 110,841 | $ | 92,833 | $ | 205,350 | $ | 175,193 | |||||||||||||||||||||||||||
| Services | 8,182 | 7,471 | 15,355 | 14,461 | |||||||||||||||||||||||||||||||
| Total revenue | 119,023 | 100,304 | 220,705 | 189,654 | |||||||||||||||||||||||||||||||
| Cost of revenue: | |||||||||||||||||||||||||||||||||||
| Systems | 56,721 | 49,561 | 107,429 | 94,162 | |||||||||||||||||||||||||||||||
| Services | 5,897 | 6,075 | 11,247 | 12,481 | |||||||||||||||||||||||||||||||
| Total cost of revenue | 62,618 | 55,636 | 118,676 | 106,643 | |||||||||||||||||||||||||||||||
| Gross profit | 56,405 | 44,668 | 102,029 | 83,011 | |||||||||||||||||||||||||||||||
| Operating expenses: | |||||||||||||||||||||||||||||||||||
| Research and development | 20,921 | 20,700 | 41,592 | 40,030 | |||||||||||||||||||||||||||||||
| Sales and marketing | 21,343 | 19,734 | 41,967 | 39,073 | |||||||||||||||||||||||||||||||
| General and administrative | 11,193 | 9,165 | 21,862 | 17,952 | |||||||||||||||||||||||||||||||
| Restructuring charges | 6,286 | — | 6,286 | — | |||||||||||||||||||||||||||||||
| Total operating expenses | 59,743 | 49,599 | 111,707 | 97,055 | |||||||||||||||||||||||||||||||
| Loss from operations | (3,338) | (4,931) | (9,678) | (14,044) | |||||||||||||||||||||||||||||||
| Interest and other expense, net: | |||||||||||||||||||||||||||||||||||
| Interest expense, net | (617) | (142) | (907) | (250) | |||||||||||||||||||||||||||||||
| Other income (expense), net | (109) | 123 | (94) | (268) | |||||||||||||||||||||||||||||||
| Total interest and other expense, net | (726) | (19) | (1,001) | (518) | |||||||||||||||||||||||||||||||
| Loss before provision for income taxes | (4,064) | (4,950) | (10,679) | (14,562) | |||||||||||||||||||||||||||||||
| Provision for income taxes | 148 | 95 | 477 | 250 | |||||||||||||||||||||||||||||||
| Net loss | $ | (4,212) | $ | (5,045) | $ | (11,156) | $ | (14,812) | |||||||||||||||||||||||||||
| Net loss per common share: | |||||||||||||||||||||||||||||||||||
| Basic and diluted | $ | (0.07) | $ | (0.09) | $ | (0.20) | $ | (0.27) | |||||||||||||||||||||||||||
| Weighted average number of shares used to compute net loss per common share: | |||||||||||||||||||||||||||||||||||
| Basic and diluted | 57,261 | 54,624 | 56,906 | 54,339 | |||||||||||||||||||||||||||||||
12
| Calix, Inc. | ||||||||||||||
| Condensed Consolidated Balance Sheets | ||||||||||||||
| (Unaudited, in thousands) | ||||||||||||||
| June 27, | December 31, | |||||||||||||
| 2020 | 2019 | |||||||||||||
| ASSETS | ||||||||||||||
| Current assets: | ||||||||||||||
| Cash and cash equivalents | $ | 50,552 | $ | 46,829 | ||||||||||
| Restricted cash | 628 | 628 | ||||||||||||
| Accounts receivable, net | 58,590 | 46,509 | ||||||||||||
| Inventory | 36,659 | 40,153 | ||||||||||||
| Prepaid expenses and other current assets | 11,640 | 9,698 | ||||||||||||
| Total current assets | 158,069 | 143,817 | ||||||||||||
| Property and equipment, net | 20,966 | 21,527 | ||||||||||||
| Right-of-use operating leases | 11,079 | 15,864 | ||||||||||||
| Goodwill | 116,175 | 116,175 | ||||||||||||
| Other assets | 15,025 | 19,440 | ||||||||||||
| $ | 321,314 | $ | 316,823 | |||||||||||
LIABILITIES AND STOCKHOLDERS’ EQUITY | ||||||||||||||
| Current liabilities: | ||||||||||||||
| Accounts payable | $ | 10,204 | $ | 10,789 | ||||||||||
| Accrued liabilities | 64,684 | 57,546 | ||||||||||||
| Deferred revenue | 16,359 | 17,158 | ||||||||||||
| Line of credit | 26,000 | 30,000 | ||||||||||||
| Total current liabilities | 117,247 | 115,493 | ||||||||||||
| Long-term portion of deferred revenue | 18,192 | 18,340 | ||||||||||||
| Operating leases | 12,975 | 14,337 | ||||||||||||
| Other long-term liabilities | 13,732 | 14,625 | ||||||||||||
| Total liabilities | 162,146 | 162,795 | ||||||||||||
| Stockholders’ equity: | ||||||||||||||
| Common stock | 1,587 | 1,545 | ||||||||||||
| Additional paid-in capital | 912,402 | 895,899 | ||||||||||||
| Accumulated other comprehensive loss | (1,103) | (854) | ||||||||||||
| Accumulated deficit | (713,732) | (702,576) | ||||||||||||
| Treasury stock | (39,986) | (39,986) | ||||||||||||
| Total stockholders’ equity | 159,168 | 154,028 | ||||||||||||
| $ | 321,314 | $ | 316,823 | |||||||||||
13
| Calix, Inc. | ||||||||||||||
| Condensed Consolidated Statements of Cash Flows | ||||||||||||||
| (Unaudited, in thousands) | ||||||||||||||
| Six Months Ended | ||||||||||||||
| June 27, | June 29, | |||||||||||||
| 2020 | 2019 | |||||||||||||
| Operating activities: | ||||||||||||||
| Net loss | $ | (11,156) | $ | (14,812) | ||||||||||
| Adjustments to reconcile net loss to net cash provided by (used in) operating activities: | ||||||||||||||
| Stock-based compensation | 6,225 | 5,714 | ||||||||||||
| Depreciation and amortization | 7,006 | 4,644 | ||||||||||||
| Asset retirements and write-downs | 3,749 | 138 | ||||||||||||
| Changes in operating assets and liabilities: | ||||||||||||||
| Accounts receivable, net | (12,082) | 6,840 | ||||||||||||
| Inventory | 3,494 | 4,791 | ||||||||||||
| Prepaid expenses and other assets | 1,175 | 1,697 | ||||||||||||
| Accounts payable | (671) | (2,676) | ||||||||||||
| Accrued liabilities | 7,868 | (10,314) | ||||||||||||
| Deferred revenue | (947) | 3,223 | ||||||||||||
| Other long-term liabilities | (726) | (2,496) | ||||||||||||
| Net cash provided by (used in) operating activities | 3,935 | (3,251) | ||||||||||||
Investing activity – | ||||||||||||||
| Purchases of property and equipment | (4,480) | (9,538) | ||||||||||||
| Financing activities: | ||||||||||||||
| Proceeds from exercise of stock options | 5,608 | 326 | ||||||||||||
| Proceeds from employee stock purchase plans | 4,711 | 4,157 | ||||||||||||
| Taxes paid for awards vested under equity incentive plan | — | (156) | ||||||||||||
| Payments related to financing arrangements | (1,529) | (1,267) | ||||||||||||
| Proceeds from line of credit | 30,000 | 89,000 | ||||||||||||
| Repayment of line of credit | (34,000) | (94,000) | ||||||||||||
| Payments to originate the line of credit | (285) | — | ||||||||||||
| Net cash provided by (used in) financing activities | 4,505 | (1,940) | ||||||||||||
| Effect of exchange rate changes on cash, cash equivalents and restricted cash | (237) | 25 | ||||||||||||
| Net increase (decrease) in cash, cash equivalents and restricted cash | 3,723 | (14,704) | ||||||||||||
| Cash, cash equivalents and restricted cash at beginning of period | 47,457 | 50,274 | ||||||||||||
| Cash, cash equivalents and restricted cash at end of period | $ | 51,180 | $ | 35,570 | ||||||||||
14
| Calix, Inc. | ||||||||||||||||||||||||||||||||||||||||||||||||||||||||||||||
| Reconciliation of GAAP to Non-GAAP Systems Gross Margin and Gross Margin | ||||||||||||||||||||||||||||||||||||||||||||||||||||||||||||||
| (Unaudited) | ||||||||||||||||||||||||||||||||||||||||||||||||||||||||||||||
| Three Months Ended | ||||||||||||||||||||||||||||||||||||||||||||||||||||||||||||||
| June 27, 2020 | March 28, 2020 | December 31, 2019 | September 28, 2019 | June 29, 2019 | ||||||||||||||||||||||||||||||||||||||||||||||||||||||||||
| Systems Gross Margin | Gross Margin | Systems Gross Margin | Gross Margin | Systems Gross Margin | Gross Margin | Systems Gross Margin | Gross Margin | Systems Gross Margin | Gross Margin | |||||||||||||||||||||||||||||||||||||||||||||||||||||
| GAAP amount | 48.8 | % | 47.4 | % | 46.3 | % | 44.9 | % | 47.1 | % | 45.5 | % | 45.4 | % | 43.9 | % | 46.6 | % | 44.5 | % | ||||||||||||||||||||||||||||||||||||||||||
| Adjustments to GAAP amount: | ||||||||||||||||||||||||||||||||||||||||||||||||||||||||||||||
| Stock-based compensation | 0.1 | 0.1 | 0.2 | 0.2 | 0.1 | 0.2 | 0.1 | 0.2 | 0.1 | 0.2 | ||||||||||||||||||||||||||||||||||||||||||||||||||||
| Intangible asset amortization | 0.6 | 0.6 | 0.7 | 0.6 | 0.5 | 0.5 | 0.3 | 0.2 | — | — | ||||||||||||||||||||||||||||||||||||||||||||||||||||
| U.S. tariff and tariff-related costs | 0.7 | 0.6 | 1.0 | 1.0 | 1.0 | 1.0 | 1.1 | 1.0 | 2.0 | 1.9 | ||||||||||||||||||||||||||||||||||||||||||||||||||||
| Component inventory accrual | 1.6 | 1.5 | — | — | — | — | — | — | — | — | ||||||||||||||||||||||||||||||||||||||||||||||||||||
| Non-GAAP amount | 51.8 | % | 50.2 | % | 48.2 | % | 46.7 | % | 48.7 | % | 47.2 | % | 46.9 | % | 45.3 | % | 48.7 | % | 46.6 | % | ||||||||||||||||||||||||||||||||||||||||||
| Calix, Inc. | ||||||||||||||||||||||||||||||||
| Reconciliation of GAAP to Non-GAAP Operating Expenses | ||||||||||||||||||||||||||||||||
| (Unaudited, in thousands) | ||||||||||||||||||||||||||||||||
| Three Months Ended | ||||||||||||||||||||||||||||||||
| June 27, | March 28, | December 31, | September 28, | June 29, | ||||||||||||||||||||||||||||
| 2020 | 2020 | 2019 | 2019 | 2019 | ||||||||||||||||||||||||||||
| GAAP operating expenses | $ | 59,743 | $ | 51,964 | $ | 53,218 | $ | 53,053 | $ | 49,599 | ||||||||||||||||||||||
| Adjustments to GAAP amount: | ||||||||||||||||||||||||||||||||
| Stock-based compensation | (3,025) | (2,762) | (2,502) | (2,539) | (2,353) | |||||||||||||||||||||||||||
| Restructuring charges | (6,286) | — | — | — | — | |||||||||||||||||||||||||||
| Loss on asset retirement | — | — | — | (2,474) | — | |||||||||||||||||||||||||||
| Non-GAAP operating expenses | $ | 50,432 | $ | 49,202 | $ | 50,716 | $ | 48,040 | $ | 47,246 | ||||||||||||||||||||||
15
| Calix, Inc. | |||||||||||||||||||||||||||||||||||
| Reconciliation of GAAP to Non-GAAP Net Income (Loss) | |||||||||||||||||||||||||||||||||||
| (Unaudited, in thousands) | |||||||||||||||||||||||||||||||||||
| Three Months Ended | |||||||||||||||||||||||||||||||||||
| June 27, | March 28, | December 31, | September 28, | June 29, | |||||||||||||||||||||||||||||||
| 2020 | 2020 | 2019 | 2019 | 2019 | |||||||||||||||||||||||||||||||
| GAAP net income (loss) | $ | (4,212) | $ | (6,944) | $ | 497 | $ | (3,379) | $ | (5,045) | |||||||||||||||||||||||||
| Adjustments to GAAP amount: | |||||||||||||||||||||||||||||||||||
| Stock-based compensation | 3,241 | 2,984 | 2,705 | 2,762 | 2,569 | ||||||||||||||||||||||||||||||
| Intangible asset amortization | 658 | 658 | 658 | 352 | — | ||||||||||||||||||||||||||||||
| U.S. tariff and tariff-related costs | 723 | 959 | 1,138 | 1,097 | 1,855 | ||||||||||||||||||||||||||||||
| Restructuring charges | 6,286 | — | — | — | — | ||||||||||||||||||||||||||||||
Component inventory accrual | 1,793 | — | — | — | — | ||||||||||||||||||||||||||||||
| Loss on asset retirement | — | — | — | 2,474 | — | ||||||||||||||||||||||||||||||
| Non-GAAP net income (loss) | $ | 8,489 | $ | (2,343) | $ | 4,998 | $ | 3,306 | $ | (621) | |||||||||||||||||||||||||
| Calix, Inc. | ||||||||
| Reconciliation of GAAP to Non-GAAP Net Income (Loss) Per Diluted Common Share | ||||||||
| (Unaudited) | ||||||||
| Three Months Ended June 27, 2020 | ||||||||
| GAAP net loss per diluted common share | $ | (0.07) | ||||||
| Adjustments to GAAP amount: | ||||||||
| Stock-based compensation | 0.06 | |||||||
| Intangible asset amortization | 0.01 | |||||||
| U.S. tariff and tariff-related costs | 0.01 | |||||||
| Restructuring charges | 0.10 | |||||||
Component inventory accrual | 0.03 | |||||||
Non-GAAP net income per diluted common share (1) | $ | 0.14 | ||||||
(1) Based on 59.3 million weighted-average diluted common shares outstanding.
16
| Calix, Inc. | ||||||||||||||||||||||||||||||||
| Reconciliation of GAAP to Non-GAAP Guidance | ||||||||||||||||||||||||||||||||
| (Unaudited, dollars in thousands, except per share data) | ||||||||||||||||||||||||||||||||
| Three Months Ending September 26, 2020 | ||||||||||||||||||||||||||||||||
| GAAP | Stock-Based Compensation | U.S. Tariff and Tariff-related Costs | Intangible Asset Amortization | Non-GAAP | ||||||||||||||||||||||||||||
| Gross margin | 47.0% - 49.0% | 0.1% | 0.4% | 0.5% | 48.0% - 50.0% | |||||||||||||||||||||||||||
| Operating expenses | $ 52,900 - $ 54,900 | $ (2,900) | $ - | $ - | $ 50,000 - $ 52,000 | |||||||||||||||||||||||||||
Net income per diluted common share(1) | $ 0.10 - $ 0.14 | $ 0.05 | $ 0.01 | $ 0.01 | $ 0.17 - $ 0.21 | |||||||||||||||||||||||||||
(1) Based on 60.8 million weighted-average diluted common shares outstanding.
17