Attached files
| file | filename |
|---|---|
| EX-32.1 - EXHIBIT 32.1 - CALIX, INC | calx-20191231xex321.htm |
| EX-31.2 - EXHIBIT 31.2 - CALIX, INC | calx-20191231xex312.htm |
| EX-31.1 - EXHIBIT 31.1 - CALIX, INC | calx-20191231xex311.htm |
| EX-23.1 - EXHIBIT 23.1 - CALIX, INC | calx-20191231xex231kpmgcon.htm |
| EX-21.1 - EXHIBIT 21.1 - CALIX, INC | calx-20191231xex211subsidi.htm |
| EX-10.23 - EXHIBIT 10.23 - CALIX, INC | calx-20191231xex1023waiver.htm |
| EX-10.22 - EXHIBIT 10.22 - CALIX, INC | calx-20191231xex1022lsa.htm |
| EX-10.18 - EXHIBIT 10.18 - CALIX, INC | calx-20191231xex1018.htm |
| EX-10.17 - EXHIBIT 10.17 - CALIX, INC | calx-20191231xex1017.htm |
| EX-4.2 - EXHIBIT 4.2 - CALIX, INC | calx-20191231xex42descript.htm |
UNITED STATES
SECURITIES AND EXCHANGE COMMISSION
Washington, DC 20549
FORM 10-K
(Mark One)
x | ANNUAL REPORT PURSUANT TO SECTION 13 OR 15(d) OF THE SECURITIES EXCHANGE ACT OF 1934 |
For the fiscal year ended December 31, 2019
OR
o | TRANSITION REPORT PURSUANT TO SECTION 13 OR 15(d) OF THE SECURITIES EXCHANGE ACT OF 1934 |
For the transition period from to
Commission File Number: 001-34674
Calix, Inc.
(Exact Name of Registrant as Specified in Its Charter)
Delaware | 68-0438710 | |
(State or Other Jurisdiction of Incorporation or Organization) | (I.R.S. Employer Identification No.) | |
2777 Orchard Parkway San Jose, California (Address of Principal Executive Offices) | 95134 (Zip Code) | |
Registrant’s telephone number, including area code (408) 514-3000 Securities registered pursuant to Section 12(b) of the Act: | ||
Title of each class | Trading symbol | Name of each exchange on which registered |
Common Stock, $0.025 par value | CALX | The New York Stock Exchange |
Securities registered pursuant to section 12(g) of the Act: | ||
None | ||
(Title of class) | ||
Indicate by check mark if the registrant is a well-known seasoned issuer, as defined in Rule 405 of the Securities Act. Yes: o No: x
Indicate by check mark if the registrant is not required to file reports pursuant to Section 13 or Section 15(d) of the Act. Yes: o No: x
Indicate by check mark whether the registrant (1) has filed all reports required to be filed by Section 13 or 15(d) of the Securities Exchange Act of 1934 during the preceding 12 months (or for such shorter period that the registrant was required to file such reports), and (2) has been subject to such filing requirements for the past 90 days. Yes: x No: o
Indicate by check mark whether the registrant has submitted electronically every Interactive Data File required to be submitted pursuant to Rule 405 of Regulation S-T (§232.405 of this chapter) during the preceding 12 months (or for such shorter period that the registrant was required to submit such files). Yes: x No: o
Indicate by check mark whether the registrant is a large accelerated filer, an accelerated filer, a non-accelerated filer, a smaller reporting company, or an emerging growth company. See the definitions of “large accelerated filer,” “accelerated filer,” “smaller reporting company,” and “emerging growth company” in Rule 12b-2 of the Exchange Act.
Large Accelerated Filer | o | Accelerated Filer | x | ||||
Non-accelerated filer | o | Smaller Reporting Company | o | ||||
Emerging Growth Company | o | ||||||
If an emerging growth company, indicate by check mark if the registrant has elected not to use the extended transition period for complying with any new or revised financial accounting standards provided pursuant to Section 13(a) of the Exchange Act). o
Indicate by check mark whether the registrant is a shell company (as defined in Rule 12b-2 of the Exchange Act). Yes: o No: x
The aggregate market value of the Common Stock held by non-affiliates of the registrant based upon the closing sale price on the New York Stock Exchange on June 28, 2019, the last business day of the Registrant’s most recently completed second fiscal quarter, was approximately $303 million. Shares held by each executive officer, director and by each other person (if any) who owns more than 10% of the outstanding common stock have been excluded in that such persons may be deemed to be affiliates. This determination of affiliate status is not necessarily a conclusive determination for other purposes.
As of February 14, 2020, the number of shares of the registrant’s common stock outstanding was 56,564,853.
DOCUMENTS INCORPORATED BY REFERENCE
Portions of the registrant’s definitive proxy statement for its 2020 annual meeting of stockholders are incorporated by reference in Items 10, 11, 12, 13 and 14 of Part III.
Calix, Inc.
Form 10-K
TABLE OF CONTENTS
PART I | ||
Item 1. | ||
Item 1A. | ||
Item 1B. | ||
Item 2. | ||
Item 3. | ||
Item 4. | ||
PART II | ||
Item 5. | ||
Item 6. | ||
Item 7. | ||
Item 7A. | ||
Item 8. | ||
Item 9. | ||
Item 9A. | ||
Item 9B. | ||
PART III | ||
Item 10. | ||
Item 11. | ||
Item 12. | ||
Item 13. | ||
Item 14. | ||
PART IV | ||
Item 15. | ||
Item 16. | ||
2
SPECIAL NOTE REGARDING FORWARD-LOOKING STATEMENTS
This report includes forward-looking statements that involve substantial risks and uncertainties. All statements other than statements of historical facts contained in this report, including statements regarding Calix’s future financial position, business strategy and plans, product projections, anticipated market and industry trends and objectives of management for future operations, are forward-looking statements. In some cases, you can identify forward-looking statements by terminology such as “believe,” “could,” “expect,” “may,” “estimate,” “continue,” “anticipate,” “intend,” “should,” “plan,” “predict,” “will,” “would,” “project,” “potential” or the negative of these terms or other similar expressions. Forward-looking statements include Calix’s expectations concerning the outlook for its business, productivity, plans and goals for future operational improvements and capital investments, operational performance, future market conditions or economic performance and developments in the capital and credit markets and expected future financial performance.
Forward-looking statements involve a number of risks, uncertainties and assumptions, and actual results or events may differ materially from those projected or implied in those statements. Important factors that could cause such differences include:
• | our ability to predict our revenue and reduce and control costs related to our products or service offerings; |
• | fluctuations in our gross margin; |
• | the concentration of our customer base as well as our dependence on a limited number of key customers; |
• | our ability to ramp sales and achieve market acceptance of our new products and communications service providers’, or CSPs’, willingness to deploy our new products; |
• | our ability to manage our relationships with our third-party vendors, including contract manufacturers, or CMs, original design manufacturers, or ODMs, logistics providers, component suppliers and development partners; |
• | our ability to forecast our manufacturing requirements and manage our inventory; |
• | our dependence on sole-, single- and limited-source suppliers, including suppliers located primarily or solely in China where there are a number of factors that could negatively impact our supply chain; |
• | the capital spending patterns of CSPs, and any decrease or delay in capital spending by CSPs due to macro-economic conditions, regulatory uncertainties or other reasons; |
• | the impact of government-sponsored programs on our customers and the impact to our customers of a U.S. government shutdown; |
• | intense competition; |
• | our ability to develop new products or enhancements that support technological advances and meet changing CSP requirements; |
• | the length and unpredictability of our sales cycles and timing of orders; |
• | our lack of long-term, committed-volume purchase contracts with our customers; |
• | our ability to increase our sales to larger CSPs globally; |
• | our exposure to the credit risks of our customers; |
• | the interoperability of our products with CSP networks; |
• | the quality of our products, including any undetected hardware defects or bugs in our software; |
• | our ability to build and sustain an adequate and secure information technology infrastructure; and |
• | our ability to estimate future warranty obligations due to product failure rates; |
• | our products’ compliance with industry standards; |
• | our ability to expand our international operations; |
• | our ability to protect our intellectual property and the cost of doing so; |
• | our ability to obtain necessary third-party technology licenses at reasonable costs; |
• | the regulatory and physical impacts of climate change and other natural events; |
• | the attraction and retention of qualified employees and key management personnel; |
• | our ability to maintain proper and effective internal controls. |
Calix cautions you against placing undue reliance on forward-looking statements, which reflect our current beliefs and are based on information currently available to us as of the date a forward-looking statement is made. Forward-looking statements set forth in this Annual Report on Form 10-K speak only as of the date of its filing. We undertake no obligation to revise forward-looking statements to reflect future events, changes in circumstances or changes in beliefs. In the event that we do update any forward-looking statements, no inference should be made that we will make additional updates with respect to that statement, related matters or any other forward-looking statements.
3
PART I
ITEM 1. | Business |
Company Overview
Calix, Inc. (together with its subsidiaries, “Calix,” “we,” “our” or “us”) was incorporated in August 1999 and is a Delaware corporation. Calix is a leading global provider of cloud and software platforms, systems and services required to realize the unified access network and the smart, connected premises of tomorrow. Our mission is to connect everyone and everything. Calix platforms empower our customers to build new business models, rapidly deploy new services and make the promise of the smart, connected home and business a reality. Innovative CSPs rely on Calix platforms to help them master and monetize the complex infrastructure between their subscribers and the cloud. Our platforms and services help our customers build next generation networks by embracing a DevOps operating model, optimizing the subscriber experience by leveraging big data analytics and turning the increasing complexity of the subscriber edge into new revenue streams.
We are delivering software platforms that help CSPs meet emerging threats from web-scale players and reinvent how they serve their device-enabled subscribers. Our solutions enable CSPs to launch entirely new business models that capitalize on the opportunities that are being generated by the increase of new applications and devices such as streaming services, smart phones, Internet of Things, or IoT, augmented and virtual reality applications and autonomous technologies. Our customers, who are embracing our strategic platforms, recognize that providing a sensational subscriber experience enables them to compete today and in the future. We also provide cloud analytics designed to help CSPs identify subscriber needs by using network and behavioral data. The insights generated from these analytics enable CSPs to create and market new offerings that monetize their investments in their networks. Finally, we strive to put our customers and their brands first to ensure that they will always have a central place in their subscribers’ lives. Our solution strategy is intended to help our customers build and reinforce their brand presence within their subscribers’ premises. We believe this must be an element of their strategy for sustaining and growing their businesses.
Our current customers include CSPs of almost every size and type. Our solutions may be used by any entity providing communications services to a subscriber. This universe includes local and competitive exchange carriers, cable multiple system operators, or cable MSOs, wireless internet service providers, or WISPs, fiber overbuilders such as municipalities and electric cooperatives and hospitality providers. We market and sell our portfolio to CSPs globally through our direct sales force as well as in partnership with a number of resellers. We have enabled over 1,600 customers to deploy passive optical, Active Ethernet and point-to-point Ethernet fiber access networks. Our premises systems and cloud solutions enable these CSPs to provide industry leading managed Wi-Fi and a growing portfolio of subscriber services to millions of their customers.
Industry Background and Trends
CSPs compete in a rapidly changing market to deliver a range of services to their residential and business subscribers. Subscribers purchase an array of services from a variety of CSPs, starting with basic voice and data through advanced broadband services such as high-speed Internet, Internet protocol television, or IPTV, mobile broadband, high-definition, ultra-high-definition and over-the-top video and online gaming. Consumers are also rapidly adding devices that require high bandwidth, low latency services such as virtual and augmented reality as well as IoT devices that bring significant complexity to the premises network. It is likely that adoption of autonomous technologies such as self-driving cars will dramatically increase demand and complexity. Leading CSPs are deploying new capabilities and offerings such as mobile applications, network security, parental controls and Quality of Service, or QoS, that help subscribers master the complexity introduced by new devices, applications and services. We believe that the CSP is uniquely positioned to manage these capabilities and offerings on behalf of subscribers, and this position presents the greatest potential source of differentiable value for CSPs.
The rapid growth in new technologies is generating increased network traffic and putting pressure on CSPs to cost effectively upgrade and enhance their networks to meet demand. For example, Cisco Systems, Inc. estimates that global Internet Protocol, or IP, traffic on a monthly basis will increase from 122 exabytes in 2017 to 396 exabytes in 2022, representing a compound annual growth rate of 26%. In addition, Cisco Systems, Inc. estimates by 2022, the number of devices connected to IP networks will be more than three times the global population. As the corresponding smart home applications become more sophisticated, they will shift from being useful to essential. This proliferation of new devices (and usage patterns) creates a tremendous opportunity and increases the pressure on CSPs to offer new services and create revenue streams by mastering the complexity of the smart, connected home and business for their subscribers.
Web-Scale Players Have Become a Competitive Force
The level of competition among CSPs - wireline and wireless service providers, cable MSOs and other CSPs - has increased over the last decade as traditional service boundaries have fallen. All providers are now competing for the same residential and
4
business subscribers using similar types of IP-based services. The expansion of new technologies in the subscriber premises creates significant new opportunities for all CSPs. Technology innovators of all types and sizes are moving aggressively to seize that opportunity, and we are now seeing web-scale players aggressively enter subscribers’ homes and businesses via interactive smart home hubs and devices. These entrants, such as Amazon.com, Inc., or Amazon, Alphabet Inc., or Google and Microsoft Corporation, are extending their current platforms (e.g., data driven search, e-commerce) into subscriber premises with new devices and services that are helping to reshape the home environment. The simplicity of operating these devices, as well as their use of easily accessible data, enables these web-scale players to rapidly deploy new services and command a central place in the subscriber’s daily life. The level of insight that they generate by mining user data, coupled with their DevOps business model, positions them to offer and deploy services to subscribers at a pace that traditional CSP operating and business models cannot match.
IoT, virtual reality and other connected devices have become mainstream, and they will continue to become more and more prevalent in subscriber homes in 2020. According to Statista, household penetration of smart devices is 32.4% and is expected to hit 52.4% by 2024. Mordor Intelligence has estimated the smart home market at $64.60 billion in 2019, and it is expected to reach $246.42 billion by 2025 (a compounded annual growth rate of 25%). Companies such as Amazon, Google and Apple Inc. have recognized this business opportunity, and they have created and acquired significant new smart premises offerings.
To address this challenge and establish control of the device-enabled subscriber, we believe CSPs must respond by leveraging analytical tools that utilize network data and subscriber behavioral data to tailor services that meet the individual subscribers’ needs. These services include high-bandwidth packages, managed and whole home Wi-Fi as well as advanced applications such as security and parental controls. We believe these new services represent the CSP’s greatest opportunity to create new revenue streams and higher average revenue per user, or ARPU, while reducing subscriber churn. CSPs must also leverage network and subscriber data to streamline and automate subscriber facing functions such as customer service. These data-driven approaches can significantly reduce service costs, improve profitability and support investment in new services and technologies. Increasingly, companies in the communications space will embrace strategies that apply machine learning and artificial intelligence technologies that promise to dramatically improve the subscriber experience, build subscriber intimacy and loyalty, while increasing ARPU. By leveraging data to build a tighter bond with their subscribers and deliver high-value services, CSPs can more effectively meet the challenge presented by web-scale players.
The Experience Economy
In the 2020 Data-Driven Marketing & Advertising Outlook Study, over 80% of marketers said delivering a consistent customer experience is extremely or very important to their companies. Customer experience has become the most important means for many brands to differentiate themselves in today’s data-driven marketplace. Using data and insights to identify the customer’s unique path to purchase the optimal experience, companies are able to customize and personalize their interactions, removing friction, and improve effectiveness. This is driving the need for tools that continually and automatically refine segments based on changing behaviors.
Leading CSPs recognize that high operating margins rely on the experiences that connectivity enables. High performing Wi-Fi is the starting point, enabling the modern applications that subscribers expect, whether it is a low-latency gaming session or a video call with smooth frame rate. Thousands of networked products and services make our lives more convenient, entertain us or keep us safe.
Delivering a market leading, connected experience requires more than a high-bandwidth service. When subscribers complain that ‘the internet isn’t working,’ they often mean the Wi-Fi is not working and blame their CSP. On one level, owning the subscriber “experience” means ensuring that high speed data connections are not undermined by underpowered Wi-Fi hardware and that CSPs have the tools they need to manage and service subscribers cost-effectively.
At the next level, it is about creating new revenue and margin opportunities for new applications. CSPs are moving beyond commodity hardware and adding meaningful value to everyday connected experiences - whether it is providing necessities like network security and parental controls or enabling progressive services like voice controls or cloud gaming. Subscribers want a simple, safe and functional connected experience, and CSPs are perfectly positioned to lead in the experience economy.
The Shift to a DevOps Business Model
Access networks are the “life blood” of delivering the connected experience by directly and physically connecting the residential or business subscriber to the CSP’s data center, central office or similar facility, creating the on-ramp to the Internet. The access network is critical for service delivery as it governs the bandwidth capacity, service quality available to subscribers and ultimately the services and experience CSPs can provide to subscribers. Providing differentiated, high-quality, high-speed connectivity has become increasingly critical for CSPs to retain and expand their subscriber base, launch new revenue-generating services and deliver a value-added experience. To meet the demands of device-enabled subscribers, CSPs have already begun to deploy access technologies that are software defined and leverage next generation Passive Optical Network,
5
or PON, architectures such as NG-PON2, XGS-PON and 10G EPON. In doing so, they are addressing many of limitations of legacy access systems:
• | Limited capacity of outdated access architectures – Network architectures have physical limitations in their ability to scale bandwidth, avoid latency issues and deliver the advanced broadband services subscribers demand today and are expected to increasingly demand in the future. |
• | Inflexible networks that constrain subscriber offerings – Networks were designed to support a narrow range of services, and as a result, they limit the ability of CSPs to deploy the advanced broadband services increasingly demanded by their subscribers. |
• | Expensive to deploy and operate – With a wide variety of equipment installed, networks require significant downtime and labor for maintenance and upgrades, thereby placing a significant and recurring capital and operating expense burden on CSPs. |
• | Back-office systems that inhibit deployment of new services – Traditional methods for operationalizing new products and services often require significant testing and lengthy back-office integration activities. This often places CSPs at a competitive disadvantage relative to emerging service providers that are leveraging agile management practices. |
By replacing traditional hardware functions with software defined access, or SDA, as well as software defined networking, or SDN, CSPs can overcome these operational challenges and bring new products and services to market faster. Many CSPs are embracing SDA and SDN to help accelerate innovation, deploy automation, bring agility to their networks and significantly reduce service disruptions. By embracing standards-based, modular software platforms that abstract software functions from hardware, CSPs can free themselves from a dependence on specific hardware technologies and upgrade their access network to enable a DevOps business model. The winning service providers of the future will embrace SDA platforms and transform their access networks into a competitive advantage. Ultimately, this new model will enable CSPs to manage a range of access systems across every deployment scenario (e.g., central office, head-end, cabinet or mounted on a pole) in a consistent manner. With this shift they will introduce services at a pace that can then match the speed of the web-scale players.
The Imperative to Develop Lean Operating Models
We believe CSPs face a dual challenge in the coming years – mounting competitive pressure and the requirement to increase their investments in technologies that can deliver the new services that their subscribers demand. Most will need to make shifts in their operating models to thrive in the coming decade. They must implement a lean operating model that reduces the overall operating cost to run the network and deliver services to subscribers at an accelerated pace as well as at a significantly lowered cost. The adoption of new technologies that provide automation and intelligence, such as SDA, will help service providers adopt agile operating models and reduce the burden of network and back-office operations.
10 Gigabit Services Gain Momentum
The adoption of data-intensive applications like cloud gaming and remote worker high-definition video conferencing are driving the demand for 10 gigabit, or Gb, services. Many industry experts claim that CSPs are already facing ever-increasing bandwidth demand from their subscribers, and upcoming applications such as cloud-based gaming and streaming platforms are going to increase demand further. They also highlight that the move to 10 Gb services will come at a cost and one size will not fit every subscriber scenario. CSPs must have visibility and analytics to monitor and meet the evolving behaviors and usage patterns of their subscribers. As a result, we are seeing CSPs of all sizes looking to identify subscribers who would benefit from multi-gigabit services and deploy the PON technologies of their choice on a single system or network to meet subscriber demand. In fact, Ovum estimates that purchases of 10 Gb capable access systems may surpass GPON system purchases by 2021. Ideally, CSPs will embrace a network built for all PON technology such as GPON, XGS-PON, 10G EPON and NG-PON2, so they are not limited to choosing a specific PON technology to deliver 10 Gb services. We believe leading CSPs are planning to future-proof their fiber networks and deploy the right technology at the right time to optimize their capital investments.
The Rapid Emergence of Wi-Fi 6
Consumer dependence on Wi-Fi continues to increase, with 75% of people in the U.S. reporting that Wi-Fi is their primary method of connecting to the Internet, according to Parks Associates. By 2022, it is expected that most households will have as many as 50 Wi-Fi connected devices, more than double the 2017 average, according to Cisco VNI. The trends are clear: more wireless devices, higher bandwidth applications and a greater dependence on a reliable, wall-to-wall Wi-Fi.
However, this is a challenge for many CSPs that have concentrated their investment on bringing faster speeds to the home, but not connectivity inside the home. According to a 2019 Calix sponsored report by John Kendall, Associate Director, Research & Analysis at IHS Markit, consumers may have fast speeds to the house but do not find these access speeds available wirelessly
6
around the home. As a result, the Wi-Fi 6 standard (also known as IEEE 802.11ax) is fast becoming the new wireless foundation for a whole host of CSP-managed subscriber experiences: trouble-free wireless connectivity, content filtering and parental control, network security, smart home automation and more.
Altogether, the Wi-Fi 6 standard defines more than 50 features beyond the Wi-Fi 5 standard. One of the largest trends from the 2020 Consumer Electronics Show, or CES, was the emergence of Wi-Fi 6 routers and devices. Consumer brand companies such as Netgear, TPLink, D-Link and Asus have announced new products, each claiming to offer some combination of the highest Wi-Fi 6 throughput, lowest latency or greatest coverage. Similarly, other manufacturers at CES announced a number of Wi-Fi 6 enabled devices to capture the consumers’ imaginations.
The Deployment of 5th Generation, or 5G, Networks
As subscribers adopt next generation mobile applications and technologies, the demand for higher bandwidth, lower latency and dramatically higher device densities is accelerating. Because existing LTE mobile networks are increasingly challenged to meet these demands, many CSPs are announcing and moving to deploy 5G mobile networks that promise dramatically greater performance and capabilities for mobile and fixed broadband services. 5G is significantly different from previous generations in the mobile evolution, because it delivers higher bandwidth (10 Gbps per radio), lower latency (less than 1 msec) and supports a dramatically greater number of connections (1 million devices per km2). By leveraging higher frequency spectrum and more efficient data encoding, 5G offers CSPs a path to differentiate their services and shift the competitive landscape. CSPs are pursuing two major strategies to deploy 5G capabilities across their networks:
• | Upgrading existing LTE infrastructure – By upgrading their existing LTE wireless networks with 5G radios, CSPs will realize 10 to 20% higher bandwidth for 5G mobile devices. This approach will offer a quick path to 5G services for some CSPs and may differentiate their mobile broadband services. However, this incremental strategy offers relatively limited improvements in wireless capacity. |
• | Leveraging millimeter wavelength technology – Leading CSPs will deploy thousands of millimeter wave 5G small cells to realize a 5- to 10-fold increase in capacity across their mobile and fixed broadband networks. This approach will enable CSPs to support virtually any next generation mobile, augmented or virtual reality, IoT or autonomous vehicle or device application. This will open up tremendous new business opportunities for early adopters. Due to the inherent range limitations of millimeter wave technology, 5G small cells must be deployed in very close proximity to subscriber devices. This will require the deployment of thousands of 5G small cells throughout a CSPs network to deliver services to subscribers. |
With the adoption of 5G millimeter wavelength technology, CSPs will require transport that is both very capable and economically efficient. CSP cell networks will ultimately come to resemble high-density broadband access networks that leverage high-bandwidth, reliable fiber transport. To make the economics work, CSPs will ultimately need to embrace fiber efficient point-to-multi-point capabilities offered by NG-PON2 that include:
• | Aggregated 10 Gb services delivered over a single wavelength; |
• | Channel bonding to increase capacity delivered for a single service; and |
• | Multiple wave lengths over a single PON to provide unmatched resiliency and low latency operations. |
While 5G networks will be significantly more capable, the deployment of thousands of radio stations will introduce significant operational complexity for CSPs. As a result, 5G will accelerate the imperative for CSPs to adopt SDA technologies that simplify network operations and architectures. CSPs will also need to embrace advanced premises systems that exploit the capabilities delivered by 5G fixed wireless access networks to deliver an exceptional subscriber experience.
The Role of Governments in Supporting Technology Investment
As CSPs face increasing competitive pressure, they must accelerate their investments to upgrade their access networks and deploy new subscriber facing technologies. Governments around the world recognize the importance of expanding broadband networks and delivering advanced broadband services to more people and businesses. As a result, many governments have established stimulus programs or other incentives for broadband investment.
In the United States, programs like the Connect America Fund, or CAF, E-Rate and ReConnect provide billions of dollars each year to CSPs in the form of capital investment incentives and grants and loans to encourage broadband network investment in unserved or underserved communities. For example, in 2015, the CAF program was authorized to distribute $2.0 billion per year through the end of 2020 to offset the costs of installing and operating CSP operated broadband and voice networks for large service providers in the United States. Between 2016 and 2018, this program was extended to smaller service providers to distribute over $1.5 billion annually over the next 10 years to offset the costs of installing and operating CSP operated broadband and voice networks. In order to promote greater accountability, in 2019 the Federal Communications Commission,
7
or FCC, established a uniform framework for measuring the speed and latency performance for recipients of CAF. CSPs who wish to continue leveraging this program must seek new solutions that enable them to report and demonstrate their ability to meet the requirements established by this new framework. In addition, the E-Rate program was authorized to offer $1.5 billion in grants to build gigabit capable network connections to schools. The E-Rate program is funded at its current level indefinitely. Finally, in 2018, the U.S. Department of Agriculture announced a new broadband loan and grant pilot program, now called the ReConnect Program providing $1.15 billion to facilitate high speed broadband to the farms, which will allow them to increase productivity.
Dedicated to its long-term goal to close the digital divide, the FCC approved a new rural broadband fund called the Rural Digital Opportunity Fund, or RDOF, in January 2020. RDOF auctions will award over $20 billion for new broadband network and service development. The deployment of these funds will be spread across a ten-year period starting in 2021. Given the competitive nature of the reverse auction, we anticipate that many greenfield service providers will compete and likely take a portion of these funds from the larger traditional service providers, which have typically received them in the past.
Strategy Overview
We believe that many CSPs can and will evolve to provide the most relevant services and experience to their subscribers. Today, many CSPs command a privileged and strategic position in their subscribers’ premises. They provide a service that is becoming a necessity for most subscribers. With significant new technologies coming into the marketplace, the opportunities to differentiate based on the subscriber experience and generate new revenue streams are manifold. However, the journey from connectivity provider to essential provider of high bandwidth Wi-Fi and experiences for the smart, connected home and business will require significant transformation for most CSPs. Our strategy is to position Calix as the essential provider of platforms and services that enable this transformation. The principal elements of our strategy are:
Focus on Our Strategic Platforms and Solutions – Our strategy centers on increasing the market adoption of our three strategic platforms - Calix Cloud®, EXOS® (Experience eXtensible Operating System) and AXOS® (Access eXtensible Operating System).
• | Calix Cloud is a role-based analytics platform that leverages network data and subscriber behavioral data to deliver analytics and intelligence to communications professionals via role-specific dashboards. Calix Cloud provides the subscriber analytics that enable a CSP to deliver targeted marketing, services and experiences to build customer intimacy and loyalty. Calix Cloud currently includes Calix Marketing Cloud for CSP marketing teams and Calix Support Cloud for CSP customer support teams. |
• | EXOS is a carrier class smart home and business operating system that supports residential, business and mobile subscribers. EXOS, coupled with our market leading GigaSpire® premises systems, provides a unique “service enablement platform” that is designed for mastering and monetizing the complexity of the subscriber edge. EXOS enables CSPs to elevate every aspect of their business by deploying smart home and business services and generate new revenue streams. |
• | AXOS is an operating system for access networks that allows a service provider to deliver all services on a single, elastic, converged access network that is always on, simple to operate and quick to deploy. AXOS, coupled with our E-Series systems, provides a unique platform for the SDA network that enables CSPs to transform their business processes and deliver new services at DevOps speed. Armed with AXOS, CSPs can simplify their network operations, their network architectures and their business models. |
Extend Portfolio of Calix Services – Our services team helps CSPs define their transformation strategy, build new skills, implement new technologies and deploy new subscriber services. Calix Services address a CSP’s entire network and service delivery lifecycle. Our service offerings include managed services for Remote Network Monitoring, or RMS, as well as deployment enablement services to help CSPs accelerate and streamline network and premises implementation projects. We also offer customer success and professional services that are critical for driving adoption of our strategic platforms. These services allow CSPs to benefit directly from our experience working with over a thousand service providers to optimize their operations and leverage our advanced analytics to improve the operational efficiency of their teams.
Engage Directly with Customers – Calix continues to invest in our direct sales capabilities to ensure that we engage deeply with our customers to help them understand the differentiable value that our platforms provide. As an innovator and a market leader, it is important that our sales and solution engineering resources continually drive the adoption of our strategic platforms. As we deploy new solutions, we are building the expertise of our team by adding specialized resources with deep expertise in areas such as marketing, cloud platforms and network operations. Our direct model is complemented with selective programs for Calix channel partners who have established local market expertise, demonstrated the ability to generate new market opportunities and support sales of cutting-edge technologies.
8
Expand Customer Footprint Across Our Expanded Total Addressable Market – In 2019, we added over 100 new customers spanning CSPs of all types. Our diverse and growing customer footprint is a critical source of our growth as we expand our portfolio and sell additional platforms to both new and existing customers. Our platforms are dramatically expanding our total addressable market, and as such, we intend to continue to engage emerging providers that are creating entirely new customer segments, including fiber overbuilders, utilities and municipalities. We will also build on our recent momentum in penetrating service provider segments where our current share is relatively low such as cable MSOs, large CSPs and international markets.
Pursue Strategic Relationships – We expect to continue to pursue strategic technology and distribution relationships, alliances and acquisitions that help us align with CSPs’ strategic priorities. We continue to invest to ensure interoperability across the ecosystems that support our customers’ most critical business processes through our partner programs. We continue to work with current ecosystem partners while exploring a range of new partnerships to expand the services available on our platforms. By adding new solutions to our platform ecosystem, Calix is significantly enhancing the value that our platforms deliver to CSPs and their subscribers.
Portfolio Overview
By embracing open, modular, standards-based strategies, we provide intelligence and flexibility across a CSP’s entire network – from their data centers to their subscribers’ connected devices. Calix platforms are designed to provide our customers the agility that they need to offer the managed services that their subscribers demand. While we continue to support our non-AXOS and non-EXOS systems and our traditional cloud and software products, we are focused on driving the evolution and market penetration of our strategic platforms and services.
In 2019 we introduced two strategic solutions to make it easier for CSPs to quickly adopt the Calix platforms, systems and services:
• | The Revenue EDGE is a subscriber experience solution designed to transform CSP business models. The Revenue EDGE builds on the powerful EXOS platform and GigaSpire family by integrating real-time subscriber insights via Calix Cloud to enable CSPs to deploy new revenue-generating services and applications. |
• | The Intelligent Access EDGE is an SDA solution that consolidates edge routing, subscriber management, aggregation, and Optical Line Terminal, or OLT, functionality, dramatically simplifying network architectures and operations. By incorporating AXOS, CSPs can future proof their fiber networks and deploy the right technology at the right time to optimize their capital investments. |
The Calix portfolio allows for a broad range of subscriber services to be provisioned and delivered over a single unified network. These systems can deliver voice and data services, advanced broadband services, mobile broadband as well as high-definition video and online gaming. Our goal is to help CSPs simplify their network operations, network architectures and business operations while enabling them to offer new services. Our premises systems allow CSPs to master the complexity of the smart, connected home and offer new services to differentiate through the delivery of an amazing subscriber experience. Furthermore, our goal is to help CSPs elevate every aspect of their business – their brand, their service quality, their subscriber experience and their revenue streams.
9
Representation of how Calix platforms and services support a CSP’s entire network:
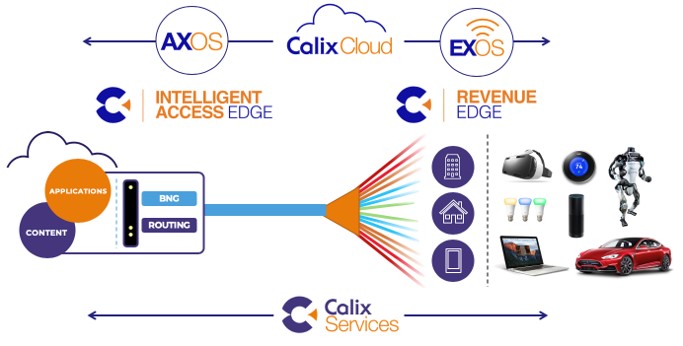
The Revenue EDGE
Calix understands that CSPs need to create and maintain a unique brand image and generate revenue streams that build on their strategic position as the preferred home connectivity provider. The growing complexity at the “subscriber edge” represents a significant opportunity for CSPs to create new revenue streams. The Revenue EDGE is an end-to-end solution that encompasses the capabilities that a CSP needs to offer new services that monetize the complexity of the subscriber edge. Successful CSPs recognize that subscribers are not all the same and leverage data-driven insights to match services with specific subscriber needs. Because CSPs can deliver and manage every Revenue EDGE service and application for the subscriber, they can eliminate the complexity and performance issues that typically impact services such as Wi-Fi, network security, parental controls and home automation. In short, with the Revenue EDGE, CSPs can now offer a value proposition that “over-the-top” players and consumer solutions simply cannot match.
Representation that depicts the components of the Revenue EDGE Solution (Foundation and Suites):
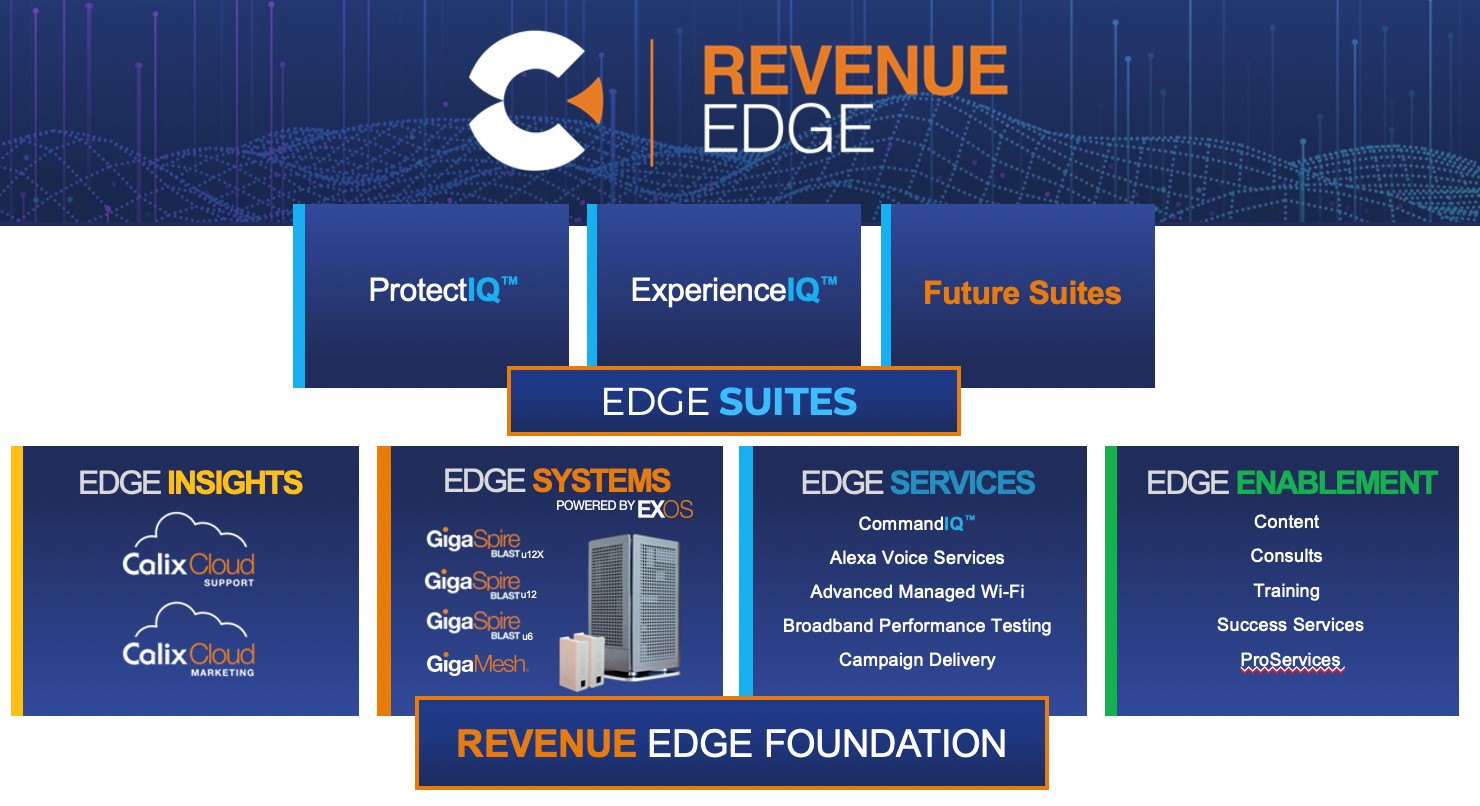
10
Revenue EDGE Insights
We believe that the company with the best data and insights will win in their market. Calix Support Cloud and Calix Marketing Cloud deliver real-time analytics and insights to enable CSPs to provide a seamless experience tailored to the ever evolving needs of their subscribers. The ability to deliver these experiences is increasingly a critical success factor for CSPs.
Calix Support Cloud – Calix Support Cloud provides customer support/care teams with data and analytics that take the guess work out of the broadband and Wi-Fi performance troubleshooting process. With Calix Support Cloud, customer support professionals can analyze a subscriber’s in-home experience to identify broadband and Wi-Fi issues and address many issues without requiring field technician intervention. With Calix Support Cloud, leading CSPs are leveraging machine learning and predictive analytics to proactively address issues before they impact the subscriber experience and reduce support call volumes, call times, “truck rolls” and operational costs.
Calix Marketing Cloud – Calix Marketing Cloud is designed for service provider marketing teams who want to leverage real-time data and analytics to be more effective and efficient in their marketing efforts. Calix Marketing Cloud includes role-based dashboards and analytics that provide insights that help marketing teams understand and target subscribers based on their needs and behaviors. CSPs who leverage Calix Marketing Cloud have experienced dramatic improvements in marketing return on investment, or ROI, and revenue growth.
EXOS Platform and Revenue EDGE Systems
EXOS Platform – EXOS is a carrier class premises operating system and software platform that supports residential, business and mobile subscribers. EXOS is the first premises operating system that is designed to help CSPs elevate every aspect of their business by rapidly deploying new services for the smart, connected home and business. All GigaSpire and GigaMesh® systems are powered by EXOS. EXOS incorporates a software model that is standards-based, fully abstracted from the hardware and always-on. Thanks to the unique architecture of EXOS, CSPs can offer new subscriber services and master the complexity of the subscriber edge. Armed with EXOS, CSPs can select and rapidly deploy services such as cloud-enabled voice services, network security and parental controls. When combined with these capabilities, EXOS offers a unique and powerful services enablement platform.
Representation that summarizes the primary benefits delivered by EXOS:
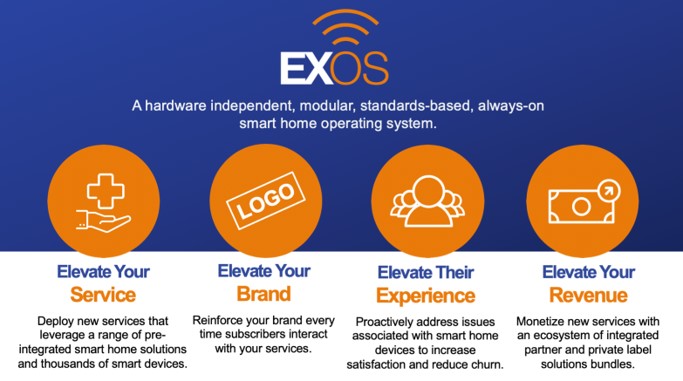
EXOS is architected to abstract software functionality from the underlying system-on-chip in premises gateways. This architecture simplifies software updates and streamlines operational processes. The EXOS abstraction layer also ensures the delivery of a consistent subscriber experience regardless of the specific hardware deployed to subscribers. EXOS leverages Linux containers that provide flexibility to CSPs when they deploy application packages to create new revenue streams. This “containerized” architecture also ensures that new applications may be deployed without the requirement to regression test the entire applications portfolio running on the system. This approach accelerates time to market for new services.
The EXOS management plane is decoupled and centralized, enabling CSPs to manage all applications simultaneously, even if applications are installed independently. The EXOS architecture ensures that subscribers receive an “always on” service and benefit from application updates without the need to “re-boot” their premises systems or schedule service visits. The
11
Microservices Aggregation Platform that supports EXOS captures data from every system or activity across a subscriber base. As CSPs deploy EXOS they can leverage this data for performance analytics, subscriber experience insights, marketing, maintenance and the application of artificial intelligence for predictive modeling.
Revenue EDGE Systems
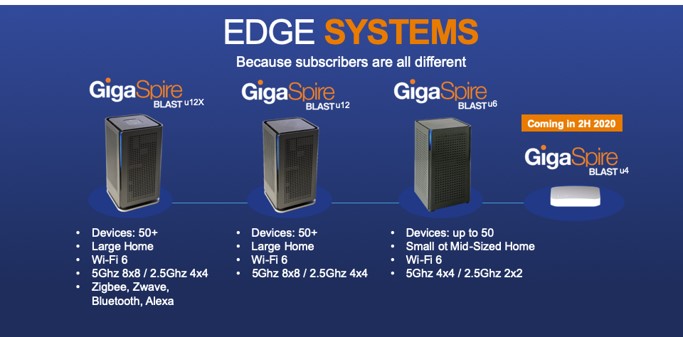
GigaSpire BLAST Systems – GigaSpire BLAST systems are powered by EXOS and provide industry leading Wi-Fi coverage and enable industry leading application scalability. With GigaSpire BLAST systems, CSPs can elevate their brand and offer new revenue generating experiences. The Calix GigaSpire BLAST systems offer:
• | Industry leading Wi-Fi performance and coverage with the latest Wi-Fi 6 technology |
• | Always-on operation, that reduces service disruptions |
• | Advanced instrumentation and analytics to enable optimal performance for all connected devices |
GigaSpire BLAST systems are available in a range of models that provide optimal performance across a range of subscriber use-cases. CSPs can choose from multiple Wi-Fi antenna configurations and form factors that offer cost and performance profiles that address differences in home size and subscriber device usage. Calix will continue to evolve this portfolio to ensure that CSPs can meet changing subscriber requirements.
GigaMesh – The Calix GigaMesh is a high-performance Wi-Fi satellite that enables ubiquitous Wi-Fi in every part of the home. The GigaMesh is powered by EXOS and optimized for interoperability with GigaSpire BLAST Systems.
Representation of the GigaSpire BLAST systems:
EDGE Services
Every Revenue EDGE system provides foundational services that elevate the subscriber experience. Foundational managed services and applications include managed Wi-Fi, Alexa Voice Services, Broadband Performance Testing and Marketing Campaign Delivery. The intuitive CommandIQ™ mobile application puts control of the home experience directly in the hands of subscribers.
CommandIQ – CommandIQ is a mobile application that provides the subscriber with a comprehensive view of all smart devices installed in their network. CommandIQ features a menu of useful options that enable the end subscriber to manage and tune their home experience by running speed tests, enabling guest Wi-Fi, adjusting parental controls and enabling network security. CSPs can also elevate their brand by skinning the application with their brand colors and logo.
Alexa Voice Services – The GigaSpire family includes Alexa-enabled systems that enable the use of any standard Alexa skill as well as Calix custom skills that provide information on network speed, device count, bandwidth-intensive devices, device performance and recently connected devices.
Advanced Managed Wi-Fi – CSPs can move ahead of their competition by being first to their market with Wi-Fi 6. More importantly, they can ensure the delivery of an amazing experience by leveraging Calix Cloud to manage and optimize the experience of every subscriber.
12
Broadband Performance Testing – CSPs can ensure that their network is delivering advertised performance levels with the Calix Broadband Performance testing solution that is delivered via EXOS-powered GigaSpire and Calix Support Cloud. CSPs can also leverage these capabilities to ensure compliance with FCC testing requirements.
Marketing Campaign Delivery – CSPs can utilize the marketing campaign delivery capability included with Calix Marketing Cloud to deliver targeted messages directly to the CommandIQ mobile application. This capability opens up an entirely new channel for communicating with subscribers regarding new services, customer service updates and special promotions.
Revenue EDGE Enablement
Revenue EDGE Enablement resources are designed to ensure that CSP teams are fully enabled to deploy, manage and monetize the services that they provide to subscribers. EDGE Enablement resources help CSPs minimize time to market and maximize ROI. These resources include marketing content, training programs, success services and professional services. Each component of the EDGE Enablement resources addresses an aspect of CSP readiness to deliver an exceptional subscriber experience.
Revenue EDGE Suites
ProtectIQ™ and ExperienceIQ™ are the first two application suites developed specifically for the Revenue EDGE Solution. The EXOS scalable architecture allows for applications to be independently developed, tested and released. This approach gives CSPs a simple way to introduce new services to subscribers and a consistent, repeatable approach to deploy and manage these applications. These solutions enable CSPs to build their brand, generate new revenue and manage and secure the smart, connected home. More importantly, the Revenue EDGE Solution enables a CSP to offer new services that they can actively manage for the subscriber. By offering capabilities such as parental controls and home network security as a managed service, the CSPs can reduce the complexity of the subscriber experience and expand the value that they are delivering to the subscriber.
ProtectIQ – ProtectIQ allows CSPs to protect and manage subscriber networks from a host of threats such as viruses, malware, intrusion and phishing, hijacking, spyware, adware and malware websites and to alert subscribers when unwanted visitors try to enter the home network. As viruses and malware become increasingly sophisticated, home networks require an equally innovative security solution. ProtectIQ enables the CSP to not only deploy the latest security software but actively manage it on behalf of a subscriber.
ExperienceIQ – ExperienceIQ provides industry leading parental controls, allowing subscribers to manage screen time, content and access from the CommandIQ application. As new applications and devices proliferate, many subscribers demand deeper control over who can access the content delivered to the people who are accessing their home networks. ExperienceIQ enables the CSP to guide the subscriber and ensure that the control settings are optimized to meet the subscriber’s objectives.
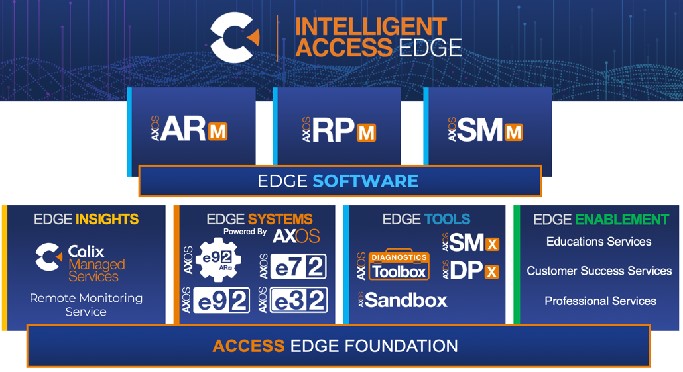
The Intelligent Access EDGE
The Intelligent Access EDGE solution redefines the access edge of the network by simplifying its architecture and operations. By collapsing multiple network elements into a single system in the access network and using specialized software modules to add and remove functionality, the solution dramatically reduces the total cost of ownership, or TCO, and the time to market for new services.
From a single point in the network, the Intelligent Access EDGE solution enables CSPs to maintain all of their services and manage their entire network with one common service model, while reducing network operational expenses by as much as 40%. Enhanced platform analytics and automation help to optimize network planning, automate critical tasks and accommodate future capabilities and services. The Intelligent Access EDGE solution is built on the award-winning Calix AXOS software platform.
13
Representation of the Intelligent Access EDGE solution:
Access EDGE Insights
The Intelligent Access EDGE Insights enable CSPs to more effectively monitor network performance and more efficiently address performance issues. Access EDGE Insights are delivered through the Calix Remote Monitoring Service, which is a cloud-based managed service offering that provides CSPs with better visibility and analytics to rapidly solve network problems that can impact subscriber experience. This cloud-based platform automatically associates and correlates disparate alarms, reducing the number of incidents that an operations team needs to analyze. The service provides continuous network alarm monitoring using the Calix Intelligent Remote Monitoring Platform and enables rapid isolation and repair through automated analysis and notification with triage and root cause of incidents affecting subscribers.
AXOS Platform and Access EDGE Systems
AXOS Platform – AXOS is a software platform built for the specific needs of the access network. The AXOS platform is an architecture built to leverage the best of data center software design and network virtualization across the challenging and variable environment of the access network. With an always-on architecture and consistent provisioning services, a CSP can leverage AXOS to deliver all services on a single, elastic, converged access network that is always on. AXOS is the only access platform with a portfolio of systems that will power networks built on all PON technologies - GPON, XGS-PON, 10G EPON and NG-PON2. With our everyPON strategy, service providers are not limited to choosing a specific PON technology to deliver the services that run on their networks. With AXOS, they can future proof their fiber networks and deploy the right technology at the right time to optimize their capital investments. Over 250 Calix customers are already deploying AXOS to simplify their operations, network and business models.
14
Representation that summarizes the primary benefits delivered by AXOS:
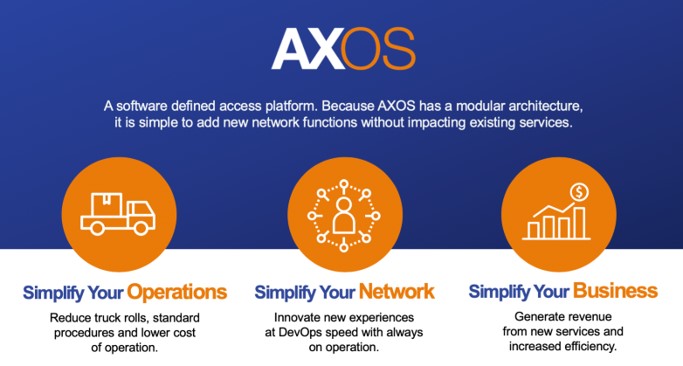
We believe AXOS offers a revolutionary way for CSPs to operate their access networks and accelerate their business transformation. AXOS achieves this because it is architected with discrete software modules that operate on top of a unique hardware abstraction layer that preserves software independence from the underlying hardware. This architecture simplifies upgrades to non-events, supports stateful, self-healing operation and facilitates virtualization of processes and services. All components within AXOS utilize standards-based YANG data models to represent the operational functions and the NETCONF protocol that enable AXOS-powered systems to fit into any open SDN orchestration and control framework. Open, published APIs also allow customers to directly program unique network applications and services.
The AXOS platform removes the complexity of network deployments by reducing the need to utilize middleware to integrate costly hardware and software. AXOS offers CSPs a path to the simplified, intelligent, unified access network that can accelerate time-to-revenue, increase service velocity, eliminate service disruptions and reduce total cost of ownership. As a result, CSPs can simplify their business models and focus investment and resources on revenue generating services and functions.
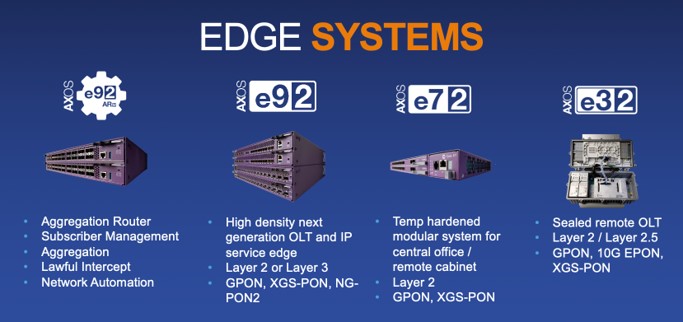
Access EDGE Systems – AXOS is implemented in our E-Series family of modular, non-blocking systems including the E9-2™, E7-2®, E3-2®, E3-16F® and E5-16F®. By offering AXOS on the entire E-Series family of systems, Calix enables our customers to meet a wide variety of deployment scenarios. The Calix Access system portfolio is designed for high availability and purpose-built for the demands of access network deployments. Our access systems are built and tested to meet or exceed network equipment-building system standards, which are a set of safety, spatial and environmental design guidelines for communications equipment. Our products are highly compatible and designed to be easily integrated into the existing operational and management infrastructure of CSP access networks.
15
AXOS E-Series systems are capable of supporting both centralized and decentralized network architectures that range from the data center edge, central office or headend to the remote cabinet or multiple dwelling unit.
Representation of the Intelligent Access EDGE Systems:
Access EDGE Tools
The AXOS Access EDGE tools are a set of foundational capabilities that enable a network operations team to continuously evolve and efficiently manage their network. AXOS Sandbox, Services Management Connector, or SMx, DOCSIS Provisioning Connector, or DPx, and the AXOS Diagnostic Toolbox provide all of the core functionality that an operations team requires to add new services, improve operational efficiency and assess network performance. Armed with this tools set, an operations team can manage the full life cycle of their network services.
AXOS Sandbox – AXOS Sandbox is a virtual testing environment that improves service introduction by eliminating the need for physical lab systems. Service providers can accelerate service delivery by reducing the time needed for lab testing, Business Support System, or BSS, and Operations Support System, or OSS, integration and software certification by deploying virtual instances of AXOS systems. AXOS Sandbox runs the actual production software release of each AXOS system.
Services Management Connector – The SMx connector is a network services domain manager that provides subscriber and services provisioning via a GUI interface. SMx provides REST/JSON northbound interface with integrated tools like SWAGGER for rapid back-office integration.
DOCSIS Provisioning Connector – The DPx connector is a virtualized DOCSIS Connector for PON networks that enables seamless SDN transition. DPx implements a microservices architecture designed to automate service delivery and management on anyPON and anyPHY into DOCSIS back office systems. DPx eliminates the need for custom OSS integration.
AXOS Diagnostics Toolbox – The AXOS Diagnostic Toolbox is an integrated set of network diagnostic tools such as Wireshark, TCP Dump and Video Channel Analyzer that enables remote management and troubleshooting of the access network. These tools help to reduce or eliminate costly truck rolls and enable network operations teams to ensure or restore high-quality services as quickly as possible.
Access EDGE Enablement
Access EDGE Enablement services are designed to ensure CSP teams are fully enabled to deploy and manage next generation networks. Calix offers a range of training courses and success and professional services to assist CSPs in every domain of network management from strategy to deployment and management.
Access EDGE Software
The AXOS modular architecture allows service providers to choose from a traditional Layer 2 network architecture or to build simplified layer 3 network architectures by consolidating key subscriber-related functions into a single solution with optional AXOS modules:
AXOS Routing Protocol Module (RPm) – RPm is designed for CSPs who are seeking to bring Layer 3 intelligence to their access network, but already have an MPLS solution or do not need an MPLS solution. RPm provides the benefits of a routed network including the security and ability to move caching and other edge compute closer to the subscriber without impacting
16
other functions in the network. CSPs can reduce provisioning overhead costs, failure groups, transport costs and simplify service and subscriber turn up.
AXOS Advanced Routing Module (ARm) – ARm is designed for CSPs seeking to bring to bring Layer 3 intelligence to their access network including MPLS capabilities. ARm provides the benefits of a routed network including the security and ability to move caching and other edge compute closer to the subscriber without impacting other functions in the network. CSPs can reduce provisioning overhead costs, failure groups, transport costs and simplify service and subscriber turn up.
AXOS Subscriber Management Module (SMm) – SMm is a software module that brings subscriber management capabilities to the access network such as authentication, authorization, accounting of subscriber sessions, address assignment, policy management and Lawful Intercept, which is short for Lawfully Authorized Electronic Surveillance for Internet Access and Services. With SMm, CSPs get unprecedented visibility into the traffic entering the network, enabling subscriber management and the use of policy and filters to prevent network attacks.
Traditional Products
Calix continues to support and sell our portfolio of non-AXOS and non-EXOS systems as well as traditional software and Compass® Cloud products that are widely deployed in customer networks. For many CSPs, the process of operationalizing new systems and transitioning to new products can be lengthy. We expect that these products will continue to be utilized in our customers’ networks for many years to come. These products include:
Calix GigaFamily – The Calix GigaFamily includes our first generation of carrier-class Wi-Fi gateways. It includes the Calix GigaCenter® and 804 mesh systems. These systems provide 802.11ac Wi-Fi and whole home Wi-Fi services. When deployed in conjunction with the Calix Cloud, the GigaFamily systems provide the capabilities required for a managed Wi-Fi offering that delivers optimized Wi-Fi services to subscribers.
Non-AXOS E-Series Access Systems and Nodes – E-Series access systems and access nodes that are designed to support an array of advanced IP-based service and run our EXA operating system. These systems are not supported by AXOS.
Calix C-Series Multiservice Access Systems – Designed to support a wide array of basic voice and data services offered by CSPs while also supporting advanced, high-speed, packet-based services such as Gigabit Ethernet, GPON, digital subscriber line, or DSL (including very high-speed DSL 2, or VDSL2) and advanced applications.
Calix B-Series Access Nodes – Consist of chassis-based nodes that are designed to support an array of advanced IP-based services offered by CSPs, including Ethernet transport and aggregation, as well as voice, data and video services over both fiber- and copper-based network architectures.
P-Series Optical Network Terminals and Residential Gateways – A broad range of non-EXOS customer premises solutions, including optical network terminals, or ONTs, and residential gateways for residential and business use in conjunction with our E-Series, C-Series and B-Series systems.
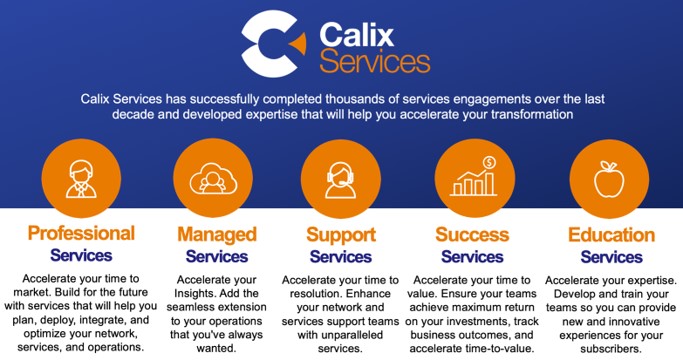
Calix Services
The Calix Services team helps CSPs define their strategy, implement new solutions and manage their networks. CSPs choose Calix platforms because of their ability to simplify network management and support an agile service delivery model. Calix Services spans the entirety of the network and service delivery lifecycle. Our expertise, developed over many years of building cutting-edge software platforms and providing critical services to our customers, positions us to be the vendor of choice. Today, the Calix Services team delivers services to CSPs of every size and every type. We are continually expanding our portfolio of service offerings to ensure that our customers realize the full potential of our platforms.
Calix Professional Services – Calix offers defined service packages to accelerate network design and deployment, optimize performance and scalability and apply field-proven best practices, processes and tools. Use cases for Calix Professional Services include the collapse of multiple network silos into a single software defined access architecture, the seamless migration to next-generation PON architectures, the deployment of managed whole home Wi-Fi services and smart home services and facilitated OSS/BSS integration services. These offerings optimize CSP end-to-end processes from operations to technology deployment to service lifecycle management.
Calix Managed Services – Our managed services feature a cloud-based remote monitoring service that monitors a CSP’s end-to-end access network (24 hours a day, 7 days a week) to ensure issues are automatically identified and assessed. This service leverages machine learning technology developed through thousands of Calix Support Services engagements with CSPs to correlate alarms, filter extraneous events and identify critical issues. The service provides incident notifications to CSP team members that include the nature, location and severity of events to help reduce mean time-to-repair.
Calix Support Services – Calix offers three tiers of support services – Standard, Essential and Vantage - that ensure software updates, the agility of operational workflows, service uptime and customer experience. Calix support tiers are designed to
17
provide optimal support to our customers who are adopting our strategic platforms - Calix Cloud, EXOS, and AXOS. Our highest support tier, Vantage, includes our Remote Monitoring service and support from a Calix service director who partners with customers to implement strategies that ensure delivery of an exceptional subscriber experience.
Calix Education Services – Calix offers an array of self-service and instructor-led, remote and onsite learning and certifications solutions to help CSPs build the skills required to successfully execute deployments and effectively run next generation networks. Calix offers specific learning paths that are designed to help CSPs enhance the skills of their teams and maximize the value that they derive when they deploy our strategic platforms.
Calix Success Services – To ensure that our customers maximize the return on their investments in our software solutions, we offer Calix Success Services. The primary focus of the Success Services engagements is the use of the data and analytics delivered through our Calix Cloud Platform to transform our customers’ business processes. Our Success Services team members leverage their domain expertise in marketing, customer support and operations to help our customers achieve their business objectives. These engagements are typically multi-year (aligned to our cloud subscription terms).
Representation of the Calix Services portfolio:
Customers
We operate a differentiated customer engagement model that focuses on direct alignment with our customers through sales, service and support. In order to allocate our product development and sales efforts efficiently, we believe that it is critical to target markets, customers and applications deliberately. We have traditionally targeted CSPs, which own, build and upgrade their own access networks and value strong relationships with their systems and software suppliers.
We classify CSPs into large, medium and small based on the number of their broadband subscribers. Large CSPs are those with wide geographic footprints and broadband subscribers of 2.5 million or more. Medium CSPs also operate typically within a wide geographic footprint but are smaller in scale with broadband subscribers that range from 250,000 to 2.5 million. Small CSPs consist primarily of over 1,000 predominantly local independent operating companies, or IOCs, typically focused on a single community or a cluster of communities. They include a growing number of municipalities, electric cooperatives, fiber overbuilders and wireless ISPs. These entities range in size from a few hundred to 250,000 broadband subscribers.
To date, we have focused primarily on CSPs in the North American market. Our existing customers’ networks serve over 100 million subscriber lines. Our customers span all sizes of broadband subscriber count from a few hundred to more than six million. A small sample of our customers includes Allo Communications; CenturyLink, Inc., or CenturyLink; CityFibre Holdings Limited; Cox Communications; Frontier Communications Corporation, or Frontier; Forked Deer Connect, LLC; Gibson Connect, LLC; Sky Cable Corporation; TDS Telecommunications LLC; Windstream Holdings, Inc., or Windstream; and Verizon Communications, Inc.
We have a few large customers who have represented a significant portion of our sales in any given period. CenturyLink accounted for 15% of total revenue in 2019, 18% in 2018 and 31% in 2017. No other customer represented more than 10% of total revenue in 2019, 2018 and 2017. In addition, our large customers represented 22% of total revenue in 2019 while our medium and small customers represented 8% and 70%, respectively.
18
Sales to customers outside the United States represented approximately 14% of our total revenue in 2019, 12% in 2018 and 11% in 2017. Historically, our sales outside the United States were predominantly to customers in the Middle East, Canada, Europe and Caribbean.
Customer Engagement Model
We design, market and sell our Calix Cloud and software platforms, systems and Calix Services predominantly through our direct sales force, supported by marketing and product management personnel. We have expanded this model to include a small number of select channel partners in North America and dozens of international channel partners, who are part of our Fiber Forward™ Partner Program. Our sales effort is organized either by named accounts or regional responsibilities. Account teams comprise sales managers, supported by solution engineers and account managers, who work to target and sell to existing and prospective CSPs. The sales process includes analyzing CSPs’ existing networks and identifying how they can utilize our products and services within their networks. Even in circumstances where a channel partner is involved, our sales and marketing personnel are often selling side-by-side with the channel partner. We believe that our direct customer engagement approach provides us with significant differentiation in the customer sales process by aligning us more closely with our customers’ changing needs.
Research and Development
Continued investment in research and development is critical to our business. Our research and development team is composed of engineers with expertise in software and cloud platforms, optics, wireless and hardware. Increasingly, our engineers are focused on enhancements to our platforms. Our teams of engineers are located in our San Jose and Petaluma facilities located in California; our Minneapolis, Minnesota facility and our Nanjing, China facility. We also outsource a portion of our software development to domestic and international third parties. Our research and development efforts are also extended by our co-development partnerships with third-party developers such as Infosys whereby we are able to utilize their substantially larger product development teams to bring cutting edge, software-based products to market while creating new revenue opportunities for both parties. Our research and development team is responsible for designing, developing and enhancing our Cloud and software platforms and systems, performing product and quality assurance testing and ensuring the compatibility of our products with third-party hardware and software products. We have made significant investments in the Calix portfolio. We intend to continue to dedicate significant resources to research and development to develop, enhance and deliver new platform features and capabilities, including investment in innovative technologies that support our business strategy.
Manufacturing
We rely substantially on CMs, ODMs and other third-party partners for the supply and distribution of our products. We work closely with these third parties to provide hardware system design, source and procure materials, manufacture and deliver our products. Our manufacturing organization consists primarily of supply chain managers, new product introduction personnel and test engineers. We tightly integrate our supply chain management and new product introduction activities with the activities outsourced to these third parties. We have made significant changes to our supply chain to align to our platform strategy and through 2019 the changes were accelerated by the imposition by the U.S. government of tariffs on goods imported from China. Such changes include the transition of manufacturing previously conducted in China to three different manufacturing partners outside China, increased leveraging of ODM partners for hardware systems design and management of raw materials used for manufacture and transition of global supply chain operations and activities to geographies outside of China, including Taiwan and Vietnam, to mitigate the impact of the U.S. tariffs. Our relationships with our CMs and ODMs allow us to decrease new product introduction time, conserve working capital, reduce product costs and minimize delivery lead times while maintaining high product quality. Order fulfillment is performed by Pegasus Logistics Group, Inc. located in Texas. We also qualify and utilize other vendors for various portions of our supply chain from time to time, including order fulfillment of our circuit boards, optics and cabinets. This model allows us to operate with lower inventory levels while maintaining the ability to scale quickly to handle increased order volume.
Product reliability is essential for our customers, who place a premium on continuity of service for their subscribers. We perform rigorous quality control testing to help ensure the reliability of our systems. Our internal manufacturing organization designs, develops and implements complex test processes to help ensure the quality and reliability of our products.
Seasonality
Fluctuations in our revenue occur due to many factors, including the varying budget cycles and seasonal buying patterns of our customers. More specifically, our customers tend to spend less in the first fiscal quarter as they are finalizing their annual capital spending budgets, and in certain regions, customers are also challenged by winter weather conditions that inhibit outside fiber deployment.
19
Intellectual Property
Our success depends upon our ability to protect our core technology and intellectual property. To accomplish this, we rely on a combination of intellectual property rights, including patents, trade secrets, copyrights and trademarks as well as customary contractual protections. In addition, we generally control access to and the use of our proprietary technology and other confidential information. This protection is accomplished through a combination of internal and external controls, including contractual protections with employees, contractors, customers and partners, and through a combination of U.S. and international intellectual property laws.
As of December 31, 2019, we held 125 U.S. patents and had three pending U.S. patent applications. One of the U.S. patents is also covered by granted international patents in three countries. As of December 31, 2019, we had no pending international patent applications. U.S. patents generally have a term of twenty years from filing. We have added to our patent portfolio since our inception. The remaining terms on the individual patents vary from five months to 17 years.
We rely on intellectual property laws as well as nondisclosure agreements, licensing arrangements and confidentiality provisions to establish and protect our proprietary rights. U.S. patent, copyright and trade secret laws afford us only limited protection, and the laws of some foreign countries do not protect proprietary rights to the same extent. Our pending patent applications may not result in issued patents, and the issued patents may not be enforceable. Any infringement of proprietary rights could result in significant litigation costs. Further, any failure by us to adequately protect our proprietary rights could result in competitors offering similar products, resulting in the loss of our competitive advantage and decreased sales.
We believe that the frequency of assertions of patent infringement continues to increase in our industry. In particular, patent holders, including entities and organizations that purchase or hold patents to monetize such rights, assert patent infringement claims as a competitive tactic as well as a source of revenue. Any claim of infringement from a third party, even claims without merit, could cause us to incur substantial costs defending against such claims and could distract our management from operating our business. Furthermore, a party making such a claim, if successful, could secure a judgment that requires us to pay substantial damages. A judgment could also include an injunction or other court order that could prevent us from selling our products. In addition, we might be required to seek a license for the use of such intellectual property, which may not be available on commercially reasonable terms or at all. Alternatively, we may be required to develop non-infringing technology, which would require significant effort and expense and may ultimately not be successful.
Competition
The communications equipment market is highly competitive. Competition in this market is based on any one or a combination of the following factors:
• | functionality; |
• | price; |
• | existing business and customer relationships; |
• | the ability of products and services, including turnkey professional services capabilities, to meet customers’ immediate and future network requirements; |
• | product quality; |
• | installation capability; |
• | service and support; |
• | scalability; and |
• | manufacturing capability. |
We compete with a number of companies within markets that we serve, and we anticipate that competition will intensify. Suppliers with which we compete include ADTRAN, Inc., or ADTRAN; Amazon; Casa Systems; Ciena Corporation; Cisco Systems Inc.; CommScope Inc.; DASAN Zhone Solutions, Inc.; Huawei Technologies Co. Ltd.; Juniper Networks Inc.; Nokia Corporation; Plume Design, Inc. and ZTE Corporation. There are also a number of smaller companies with which we compete in various geographic or vertical markets. While most of these smaller competitors lack broad national scale and product portfolios, they can offer strong competition on a deal-by-deal basis. As we expand into adjacent markets, we expect to encounter new competitors. Many of our competitors have substantially greater name recognition, manufacturing capacity and technical, financial and marketing resources as well as better established relationships with CSPs than we do. Many of our competitors have greater resources to develop products or pursue acquisitions and more experience in developing or acquiring new products and technologies and in creating market awareness for their products and technologies. In addition, a number of
20
our competitors have the financial resources to offer competitive products at below market pricing levels that could prevent us from competing effectively.
Employees
As of December 31, 2019, we employed a total of 763 employees, of which 557 employees were located in the United States. Our employees are not represented by a labor union with respect to their employment with us, except for our French employee who is subject to a collective bargaining arrangement. We have not experienced any work stoppages, and we consider our relations with our employees to be good.
Corporate Information
Calix, Inc., a Delaware corporation, was founded in August 1999. Our principal executive offices are located at 2777 Orchard Parkway, San Jose, California 95134, and our telephone number is (408) 514-3000. Our website address is www.calix.com. We do not incorporate the information on or accessible through our website into this Annual Report on Form 10-K, and you should not consider any information on, or that can be accessed through, our website as part of this Annual Report on Form 10-K. Calix®, the Calix logo design, AXOS®, Calix Cloud®, CommandIQ™, Compass®, Consumer Connect®, E3®, E5®, E7®, E9™, EXOS®, ExperienceIQ™, Fiber Forward®, GigaCenter®, GigaMesh®, GigaSpire®, ProtectIQTM and other trademarks or service marks of Calix appearing in this Annual Report on Form 10-K are the property of Calix. Trade names, trademarks and service marks of other companies appearing in this Annual Report on Form 10-K are the property of the respective holders. The SEC maintains a website at www.sec.gov that contains reports, proxy statements and other information regarding issuers that file electronically with the SEC. We post on the Investor Relations page of our website, www.calix.com, a link to our filings with the SEC free of charge, as soon as reasonably practical after they are filed electronically with the SEC.
ITEM 1A. | Risk Factors |
We have identified the following additional risks and uncertainties that may affect our business, financial condition and/or results of operations. Investors should carefully consider the risks described below, together with the other information set forth in this Annual Report on Form 10-K, before making any investment decision. The risks described below are not the only ones we face. Additional risks not currently known to us or that we currently believe are immaterial may also significantly impair our business operations. Our business could be harmed by any of these risks. The trading price of our common stock could decline due to any of these risks, and investors may lose all or part of their investment.
Risks Related to Our Business and Industry
Adverse global economic conditions, geopolitical issues and other conditions that impact our increasingly global operations, including uncertainty around global trade policies and outbreaks of pandemic diseases, could have a negative effect on our business, results of operations and financial condition and liquidity.
As a global company, our performance is affected by global economic conditions as well as geopolitical issues and other conditions with global reach. In recent years concerns about the global economic outlook have adversely affected market and business conditions in general. Macroeconomic weakness and uncertainty also make it more difficult for us to accurately forecast revenue, gross margin and expenses. Geopolitical issues, such as tariffs and trade policy changes imposed by both the United States and China beginning in late 2018 and further tariffs and other international trade policy changes have resulted in increasing tensions among China, the United States, Canada and other countries and create uncertainty for global commerce. In particular, the United States has referenced the potential imposition of tariffs on imports from other countries where we produce some of our products, such as the recent imposition of tariffs on steel imported from Vietnam. We have incurred substantial costs and diversion of resources as a result of these tariff and trade policy changes. Recently, the uncertainty over the novel coronavirus outbreak in China, which has resulted in government-imposed travel restrictions across a number of countries and closures of numerous business operations in China, may disrupt and delay our and our suppliers’ operations in China. Sustained uncertainty about, or worsening of, global economic conditions, geopolitical issues and other conditions with global impact may increase our cost of doing business or disrupt our supply chain operations and may cause our customers to reduce or delay spending and could intensify pricing pressures. Any or all of these factors could negatively affect demand for our products and our business, financial condition and result of operations. Additional risks associated with the impact of the U.S. tariffs on our business and result of operations are described in the below risk factor captioned “If we fail to manage our supply chain effectively, or if the federal government increases the imposition of tariffs to goods imported from countries where we do business, our ability to conduct our business will be materially impaired, which would adversely impact our gross margins and results of operations.” Additional risks associated with disruptions to our supply chain are described in the below risk factors captioned “Our business and results of operations may be negatively affected by the coronavirus outbreak that has severely impacted Wuhan, China, which is a primary producer of materials and components for the telecommunications industry” and “Our use of and reliance upon development resources in China may expose us to unanticipated costs or liabilities.”
21
Our business and results of operations may be negatively affected by the coronavirus outbreak that has severely impacted Wuhan, China, which is a primary producer of materials and components for the telecommunications industry.
Certain materials and components for the telecommunications industry, such as fiber optics and optical-electronic components, are produced primarily in Wuhan, China, which has been the center of the recent novel coronavirus outbreak reported to have infected more than 68,000 people with more than 1,600 deaths largely in Wuhan and the surrounding Hubei province. Wuhan and the Hubei province have been subject to containment measures implemented by local authorities, including travel restrictions, mandatory quarantine, shutdown of business activities and other measures that have impacted their economy and productivity. Furthermore, restrictions and shutdown of business activities throughout other parts of China, including of factories upon which we rely for materials and components, have been implemented in attempts to contain the transmission of the coronavirus. The continued impact of the novel coronavirus, including as to when these containment measures may be lifted, remains uncertain.
The manufacture of our products requires optical-electronic components and materials sourced from suppliers in China. Although we have limited dependencies on suppliers in Wuhan, the containment measures that began in Wuhan have been expanded to other parts of China and have included factory shutdowns at some of our suppliers. If these containment measures continue for a prolonged period, we may experience a global shortage of such components and materials. Any such shortages may negatively impact our ability to supply products to meet customer requirements, which could materially adversely affect our business and results of operations. Shortages of fiber optics and other materials due to the decreased productivity in Wuhan may delay planned fiber network buildouts by CSPs, which in turn could delay or lower demand for our products.
We have a history of losses, and we may not be able to generate positive operating income and positive cash flows in the future.
We have experienced net losses in each year of our existence. We incurred net losses of $17.7 million in 2019, $19.3 million in 2018 and $83.0 million in 2017. As of December 31, 2019, we had an accumulated deficit of $702.6 million.
We expect to continue to incur significant expenses and cash outlays for research and development associated with our platforms and systems, including our cloud and services operations, investments in innovative technologies, expansion of our product portfolio, sales and marketing, customer support and general and administrative functions as we expand our business and operations and target new customer opportunities, including larger CSPs and cable MSOs as well as additional types of regional and local providers. Given our anticipated growth and the intense competitive pressures we face, we may be unable to adequately control our operating costs or generate positive operating income.
We cannot guarantee that we will achieve profitability in the future. We will have to generate and sustain significant and consistent increased revenue, while continuing to control our expenses, in order to achieve and then maintain profitability. We may also incur significant losses in the future for a number of reasons, including the risks discussed in this “Risk Factors” section and other factors that we cannot anticipate. If we are unable to generate positive operating income and positive cash flows from operations, our liquidity, results of operations and financial condition will be adversely affected. If we are unable to generate cash flows to support our operational needs, we may need to seek other sources of liquidity, including additional borrowings, to support our working capital needs. In addition, we may choose to seek other sources of liquidity even if we believe we have generated sufficient cash flows to support our operational needs. There is no assurance that any other sources of liquidity may be available to us on acceptable terms or at all. If we are unable to generate sufficient cash flows or obtain other sources of liquidity, we will be forced to limit our development activities, reduce our investment in growth initiatives and institute cost-cutting measures, all of which would adversely impact our business and growth.
Our quarterly and annual operating results may fluctuate significantly, which may make it difficult to predict our future performance and could cause the market price of our stock to decline.
A number of factors, many of which are outside of our control, may cause or contribute to significant fluctuations in our quarterly and annual operating results. These fluctuations may make financial planning and forecasting difficult. Comparing our operating results on a period-to-period basis may not be meaningful, and you should not rely on our past results as an indication of our future performance. If our revenue or operating results fall below the expectations of investors or securities analysts, or below any guidance we may provide to the market, the market price of our stock would likely decline.
In addition to the other risk factors listed in this “Risk Factors” section, factors that have in the past and may continue to contribute to the variability of our operating results include:
• | our ability to predict our revenue and reduce and control our costs; |
• | our ability to predict product functions and features desired by our customers; |
• | the impact of global economic conditions; |
22
• | our ability to effectively manage our global supply chain operations to mitigate the impact of U.S. tariffs and other trade policies; |
• | our ability to manage our relationships with our third-party vendors, including CMs, ODMs, logistics providers, component suppliers and development partners; |
• | our ability to forecast our manufacturing and product supply requirements and manage our inventory; |
• | our dependence on sole-, single- and limited-source suppliers and supply chain partners, including suppliers located primarily or solely in China where there are a number of factors that could negatively impact our supply chain; |
• | the capital spending patterns of CSPs and any decrease or delay in capital spending by CSPs due to macro-economic conditions, regulatory uncertainties or other reasons; |
• | the impact of government-sponsored programs on our customers and the impact to our customers of U.S. federal government disruptions, such as government shutdowns, on such programs; |
• | intense competition, including market entrants whose products may be substitutes to ours; |
• | our ability to develop new products or enhancements that support technological advances and meet changing CSP requirements; |
• | our ability to ramp sales and achieve market acceptance of our new products and CSPs’ willingness to adopt and deploy our new products; |
• | the concentration of our customer base as well as our dependence on a limited number of key customers; |
• | the length and unpredictability of our sales cycles and timing of orders; |
• | our lack of long-term, committed-volume purchase contracts with our customers; |
• | our ability to increase our sales globally and to increase our customer base; |
• | our exposure to the credit risks of our customers; |
• | fluctuations in our gross margin; |
• | the interoperability of our products with CSP networks; |
• | our products’ compliance with industry standards and regulatory requirements that apply to our products and services; |
• | our ability to expand our international operations; |
• | our ability to protect our intellectual property and the cost of doing so; |
• | the quality of our products, including any undetected hardware defects or bugs in our software; |
• | our ability to manage data security risks as we grow our cloud and software portfolio; |
• | our ability to estimate future warranty and service obligations; |
• | our ability to obtain necessary third-party technology licenses at reasonable costs; |
• | the regulatory and physical impacts of climate change and other natural events; |
• | the attraction and retention of qualified employees and key management personnel; and |
• | our ability to maintain proper and effective internal controls. |
Our gross margin may fluctuate over time, and our current level of gross margin may not be sustainable.
Our current level of gross margin may not be sustainable and may be adversely affected by numerous factors, including:
• | changes in customer, geographic or product mix, including the mix of configurations within each product group; |
• | the pursuit or addition of new large customers; |
• | increased price competition, including the impact of customer discounts and rebates; |
• | our ability to effectively manage the transition of our global supply chain operations to mitigate the impact of U.S. tariffs; |
• | our ability to reduce and control product costs; |
23
• | an increase in revenue mix toward services, which typically have lower margins; |
• | changes in component pricing; |
• | changes in pricing with our third-party manufacturing partners; |
• | charges incurred due to inventory holding periods if parts ordering does not correctly anticipate product demand; |
• | introduction of new products and new technologies, which may involve higher component costs; |
• | our ability to scale our services business in order to gain desired efficiencies; |
• | changes in shipment volume; |
• | changes in or increased reliance on distribution channels; |
• | potential liabilities associated with increased reliance on third-party vendors; |
• | increased expansion efforts into new or emerging markets; |
• | increased warranty costs; |
• | excess and obsolete inventory and inventory holding charges; |
• | expediting costs incurred to meet customer delivery requirements; and |
• | potential costs associated with contractual obligations. |
Our customer base is concentrated, and there are a limited number of potential customers for our products. The loss of any of our key customers, a decrease in purchases by our key customers, pricing pressures or our inability to grow our customer base would adversely impact our revenue and results of operations and any delays in payment by a key customer could negatively impact our cash flows and working capital.
Historically, a large portion of our sales has been to a limited number of customers. For example, one customer accounted for 15% of total revenue in 2019, 18% of total revenue in 2018 and 31% of total revenue in 2017. However, we cannot anticipate the same level of purchases in the future by these or other customers who have historically comprised a larger percentage of our revenue. Although these customers now comprise a smaller percentage of our revenue, we expect that changes in the CSP market, such as financial difficulties, spending cuts or corporate consolidations that impact purchasing decisions by these customers may continue to adversely impact our revenue, and as a result, revenue from such customers may remain flat or continue to decline. For example, CenturyLink completed a large acquisition at the end of 2017, which disrupted its historical levels of purchases with us and we have continued to experience significantly reduced levels of purchases by CenturyLink compared to historical levels. There is no assurance that purchasing levels by CenturyLink will increase from current levels or return to historical levels, and we expect continued uncertainty as it continues to complete its transition activities and corporate strategies. We have experienced and expect to continue to experience delays or declines in purchases by certain CSPs due to deterioration and weakness in their financial condition. For example, Windstream, another one of our larger customers, filed a voluntary petition for relief under Chapter 11 of the U.S. Bankruptcy Code in February 2019 after it was found in default of certain debt instruments. Another customer, Frontier, recently disclosed that it was exploring alternatives that may include a filing for bankruptcy relief. Any decrease or delay in purchases and/or capital expenditure plans of any of our key customers, particularly if prolonged or sustained, or our inability to grow our sales with existing customers, may have a material negative impact on our revenue and results of operations.
We anticipate that a large portion of our revenue will continue to depend on sales to a limited number of customers. In addition, some larger customers may demand discounts and rebates or desire to purchase their access systems and software from multiple providers. As a result of these factors, our future revenue opportunities may be limited, and we may face pricing pressures, which in turn could adversely impact our margins and our profitability. The loss of, reduction in or pricing discounts associated with, orders from any key customer would significantly reduce our revenue and harm our business. Furthermore, delays in payment and/or extended payment terms from any of our key or larger customers could have a material negative impact on our cash flows and working capital to support our business operations.
Furthermore, over the years the CSP market has undergone substantial consolidation. Industry consolidation generally has negative implications for equipment suppliers, including a reduction in the number of potential customers, a decrease in aggregate capital spending and greater pricing leverage on the part of CSPs over equipment suppliers. Continued consolidation of the CSP industry and among independent local exchange carriers and IOC customers, who represent a large part of our business, could make it more difficult for us to grow our customer base, increase sales of our products and maintain adequate gross margin.
24
Our new products are early in their life cycles and subject to uncertain market demand. If our customers are unwilling to adopt our platforms, install our new products or deploy our new services, or we are unable to achieve market acceptance of our new products, our business and financial results will be harmed.
Our new products are early in their life cycles and subject to uncertain market demand. They also may face obstacles in manufacturing, deployment and competitive response. Adoption of our new products, such as our smart home and business systems, is dependent on the success of our customers in investing, deploying and selling advanced services to their subscribers. Our products support a variety of advanced broadband services, such as high-speed Internet, managed Wi-Fi, connected home, IPTV, mobile broadband, high-definition video and online gaming. If we are unable to ramp sales of our new products, or if subscriber demand for our services does not grow as expected or declines, or our customers are unable or unwilling to invest in our platforms to deploy and market these services, demand for our products may decrease or fail to grow at rates we anticipate.
If we fail to manage our supply chain effectively, or if the federal government increases the imposition of tariffs to goods imported from countries where we do business, our ability to conduct our business will be materially impaired, which would adversely impact our gross margins and results of operations.
Until recently, substantially all of our products were manufactured in China. We recently completed activities to realign our supply chain operations to move substantially all of our product manufacturing to locations outside of China. The transition of global supply chain operations is complex, requires significant resources and unanticipated costs, involves significant third-party dependencies and carries numerous risks of disruptions to the manufacture and supply of our products, including exacerbation of the risks associated with our reliance upon third-party manufacturing and supply partners. In particular, in the first quarter of 2019, we experienced product shortages due to production delays associated with the transition of our global supply chain operations that impaired our ability to fulfill customer orders and resulted in revenue below our plan. The manufacture of our products requires components and materials sourced from suppliers in China, including optical-electronic components and materials manufactured in China. We continue to face increasing competition for components and resources from third-party manufacturing and supply partners as more companies seek to transition manufacturing operations out of China due to the ongoing uncertainty of the escalating tariff wars. We may experience further disruptions, product unavailability, delays or unanticipated costs associated with the supply of our products which would adversely affect the demand for our products and have a material adverse effect on our business, gross margins and results of operations if we are unable to manage our supply chain effectively, secure our desired rates for the manufacture and supply of our products with new supply chain partners or if the federal government increases the imposition of tariffs to goods imported from additional countries where we produce some of our products. Additional risks associated with our reliance upon third-party manufacturing and supply partners are described in the below risk factors captioned “We utilize domestic and international third-party vendors to assist in the design, development and manufacture of certain of our products, and to provide logistics services in the distribution of our products. If these vendors fail to provide these services, we could incur additional costs and delays or lose revenue.” and “If we fail to forecast our manufacturing requirements accurately or fail to properly manage our inventory with our contract manufacturers, we could incur additional costs, experience manufacturing delays and lose revenue.”
Our business and results of operations may be negatively affected by the coronavirus outbreak that has severely impacted Wuhan, China, which is a primary producer of materials and components for the telecommunications industry.
Certain materials and components for the telecommunications industry, such as fiber optics and optical-electronic components, are produced primarily in Wuhan, China, which has been the center of the recent novel coronavirus outbreak reported to have infected more than 73,000 people with more than 1,800 deaths largely in Wuhan and the surrounding Hubei province. Wuhan and the Hubei province have been subject to containment measures implemented by local authorities, including travel restrictions, mandatory quarantine, shutdown of business activities and other measures that have impacted their economy and productivity. Furthermore, restrictions and shutdown of business activities throughout China, including of factories upon which we rely for materials and components, have been implemented in attempts to contain the transmission of the coronavirus. The continued impact of the novel coronavirus, including as to when these containment measures may be lifted, remains uncertain.
Although we have limited dependencies on suppliers in Wuhan, the containment measures that began in Wuhan have been expanded throughout China and have included factory shutdowns at some of our suppliers. If these containment measures continue for a prolonged period, we may experience a global shortage of such components and materials. Any such shortages may negatively impact our ability to supply products to meet customer requirements, which could materially adversely affect our business and results of operations. Shortages of fiber optics and other materials due to the decreased productivity in Wuhan may delay planned fiber network buildouts by CSPs, which in turn could delay or lower demand for our products.
We depend on sole-source, single-source and limited-source suppliers for some key components. If we and our business partners are unable to source these components on a timely or cost-effective basis, we will not be able to deliver our products to our customers.
25
We depend on sole-source, single-source and limited-source suppliers for some key components of our products. For example, certain of our application-specific integrated circuit processors and resistor networks are purchased from sole-source suppliers, including certain components sourced solely through suppliers located in China.
Any of the sole-source, single-source and limited-source suppliers upon whom we or our business partners rely could stop producing our components, be subject to tariffs, epidemics or other conditions that disrupt their operations, cease operations or enter into exclusive arrangements with our competitors. For example, we have encountered disruptions in our supply of certain components sourced from China as a result of the recent novel coronavirus outbreak and the continued uncertainty around trade and tariff policies between the U.S. and China. Disruptions of manufacturing activities in China business activities, particularly if prolonged, may adversely affect our ability to obtain components and materials needed to manufacture our products at acceptable prices or at all, which would in turn harm our business and results of operations. We may also experience shortages or delay of critical components as a result of growing demand in the industry or other sectors. For example, growth in electronic and IoT devices, wireless products, automotive electronics and artificial intelligence all drive increased demand for certain components, such as chipsets and memory products, which may result in lower availability and increased prices for such components. The cost of components may also be impacted by regulatory requirements.
In addition, purchase volumes of such components may be too low for Calix to be considered a priority customer by these suppliers, and we may not be able to negotiate commercially reasonable terms for our business needs. As a result, these suppliers could stop selling to us and our business partners at commercially reasonable prices, or at all. Any such interruption or delay may force us and our business partners to seek similar components from alternative sources, which may not be available, or result in higher than anticipated prices for such components. Switching suppliers could also require that we redesign our products to accommodate new components and could require us to re-qualify our products with our customers, which would be costly and time consuming. Any interruption in the supply of sole-source, single-source or limited-source components for our products would adversely affect our ability to meet scheduled product deliveries to our customers, could result in lost revenue or higher expenses and would harm our business.
We do not have manufacturing capabilities, and therefore we depend solely upon a small number of third-party manufacturing partners to manufacture and supply our products. Consequently, our operations are highly dependent upon our third-party manufacturing partners and our business could be disrupted if we encounter problems with any of these partners.
We do not have internal manufacturing capabilities and rely upon a small number of third-party manufacturing partners such as CMs and ODMs to supply our products to meet customer needs. Our reliance on a small number of manufacturing partners makes us vulnerable to possible supply and capacity constraints and reduced control over component availability, delivery schedules, quality, manufacturing yields and costs. Our business operations and ability to supply our products are highly dependent upon our manufacturing partners. Accordingly, if we encounter problems or other disruptions in our business with any of these manufacturing partners, our business could be disrupted.
In some cases, we do not have supply contracts with our manufacturing partners and these manufacturers are not contractually obligated to supply products to us for any specific period, in any specific quantity or at any certain price. In addition, we are dependent upon our manufacturing partners’ quality systems and controls and the adherence of such systems and controls to applicable standards. If our manufacturing partners fail to maintain levels of quality manufacture suitable for us or our customers, we may incur higher costs and our relationships with our customers may be harmed.
The revenue that our manufacturing partners generate from our orders represent a relatively small percentage of their overall revenue. As a result, fulfilling our orders may not be considered a priority if such manufacturers are constrained in their ability to fulfill all of their customer obligations in a timely manner. In addition, a substantial part of our manufacturing is done in our manufacturers’ facilities that are located outside of the United States. We believe that the location of these facilities outside of the United States increases supply risk, including the risk of supply interruptions or reductions in manufacturing quality or controls. Moreover, regulatory changes or government actions relating to export or import regulations, economic sanctions or related legislation, or the possibility of such changes or actions, may create uncertainty or result in changes to or disruption in our operations with our manufacturers.
Additional risks associated with our supply chain operations are described in the above risk factor captioned “If we fail to manage our supply chain effectively, or if the federal government increases the imposition of tariffs to goods imported from other countries where we do business, our ability to conduct our business will be materially impaired, which would adversely impact our gross margins and results of operations.”
If any of our manufacturing partners were unable or unwilling to continue manufacturing our products in required volumes and at high quality levels, we would have to identify, qualify and select acceptable alternative manufacturers which could disrupt our ability to maintain continuous supply of product to meet customer requirements. An alternative manufacturer may not be available to us when needed or may not be in a position to satisfy our production requirements at commercially reasonable prices and quality. Any significant interruption in manufacturing, including labor shortages or competition for components,
26
would require us to reduce our supply of products to our customers, which in turn would reduce our revenue and harm our relationships with our customers.
We utilize domestic and international third-party vendors to assist in the design, development and manufacture of certain of our products, and to provide logistics services in the distribution of our products. If these vendors fail to provide these services, we could incur additional costs and delays or lose revenue.
From time to time we enter into agreements for the design, development and/or manufacture of certain of our products in order to enable us to offer products on an accelerated basis. We also rely upon limited third-party vendors for logistics services to distribute our products. If any of these third-party vendors stop providing their services, for any reason, we would have to obtain similar services from alternative sources, which may not be available on commercially reasonable terms, if at all. We also have limited control over disruptions that may occur at the facilities of these third-party partners, such as supply interruptions, labor shortages or design and manufacturing quality failures, quality control issues, and strikes or systems failures that may interrupt transportation and logistics services. In addition, switching development firms or manufacturers could require us to extend our development timeline and/or re-qualify our products with our customers, which would also be costly and time-consuming.
Any interruption in the development, supply or distribution of our products would adversely affect our ability to meet scheduled product deliveries to our customers, or exacerbate delays in customer order fulfillment that have already resulted from recent product unavailability related to the supply chain transition efforts described above, and could result in lost revenue or higher costs, which would negatively impact our margins and operating results and harm our business.
If we fail to forecast our manufacturing requirements accurately or fail to properly manage our inventory with our third-party manufacturers, we could incur additional costs, experience manufacturing delays and lose revenue.
We bear inventory risk under our third-party manufacturing arrangements. Lead times for the materials and components that we order through our manufacturers vary significantly and depend on numerous factors, including the specific supplier and market demand for a component at a given time. Lead times for certain key materials and components incorporated into our products are currently lengthy, requiring our manufacturers to order materials and components several months in advance of manufacture, which impacts the lead time for our products.
If we overestimate our production requirements, our manufacturers may purchase excess components and build excess inventory, and we could be required to pay for these excess parts or products and their storage costs. We have in the past had to reimburse our primary CM for certain inventory purchases that have been rendered excess or obsolete. Examples of when inventory may be rendered excess or obsolete include manufacturing and engineering change orders resulting from design changes or in cases where inventory levels greatly exceed projected demand. If we incur payments to our manufacturers associated with excess or obsolete inventory, this may have an adverse effect on our gross margins, financial condition and results of operations.
We have experienced unanticipated increases in demand from customers, which resulted in delayed shipments and variable shipping patterns. If we underestimate our product requirements, our manufacturers may have inadequate component inventory, which could interrupt manufacturing of our products, increase our cost of product revenue associated with expedite fees and air freight and/or result in delays or cancellation of sales.
Furthermore, while we have largely transitioned our global supply chain operations to mitigate the impact of U.S. tariffs imposed on goods imported from China, we have experienced and may continue to experience production interruptions from our manufacturers. Additional risks associated with the transition of our supply chain operations to mitigate the impact of substantial tariffs are described in the above risk factor captioned “While we have substantially realigned our supply chain operations and transitioned manufacturing out of China to mitigate the impact of the federal government's imposition of tariffs on goods imported from China, if we fail to manage these changes to our supply chain effectively, or if the federal government increases the imposition of tariffs to goods imported from other countries where we do business, our ability to conduct our business will be materially impaired, which would adversely impact our gross margins and results of operations.”
Our business is dependent on the capital spending patterns of CSPs, and any decrease or delay in capital spending by CSPs in response to economic conditions, seasonality, uncertainties associated with the implementation of regulatory reform or otherwise would reduce our revenue and harm our business.
Demand for our products depends on the magnitude and timing of capital spending by CSPs as they construct, expand, upgrade and maintain their access networks. Any future economic downturn may cause a slowdown in telecommunications industry spending, including in the specific geographies and markets in which we operate. In response to reduced consumer spending, challenging capital markets or declining liquidity trends, capital spending for network infrastructure projects of CSPs could be delayed or canceled. In addition, capital spending is cyclical in our industry, sporadic among individual CSPs and can change on short notice. As a result, we may not have visibility into changes in spending behavior until nearly the end of a given quarter.
27
CSP spending on network construction, maintenance, expansion and upgrades is also affected by reductions in their budgets, delays in their purchasing cycles, access to external capital (such as government grants and loan programs or the capital markets) and seasonality and delays in capital allocation decisions. For example, our CSP customers tend to spend less in the first quarter as they are still finalizing their annual budgets and in certain regions customers are also challenged by winter weather conditions that inhibit outside fiber deployment, resulting in weaker demand for our products in the first quarter of our fiscal year. Also, softness in demand across any of our customer markets, including due to macro-economic conditions beyond our control or uncertainties associated with the implementation of regulatory reform, has in the past and could in the future lead to unexpected slowdown in capital expenditures by service providers.
Many factors affecting our results of operations are beyond our control, particularly in the case of large CSP orders and network infrastructure deployments involving multiple vendors and technologies where the achievement of certain thresholds for acceptance is subject to the readiness and performance of the CSP or other providers and changes in CSP requirements or installation plans. Further, CSPs may not pursue investment for our new platforms or infrastructure upgrades that require our access systems and software. Infrastructure improvements may be delayed or prevented by a variety of factors including cost, regulatory obstacles (including uncertainties associated with the implementation of regulatory reforms), mergers, lack of consumer demand for advanced communications services and alternative approaches to service delivery. Reductions in capital expenditures by CSPs, particularly CSPs that are significant customers, may have a material negative impact on our revenue and results of operations and slow our rate of revenue growth. As a consequence, our results for a particular period may be difficult to predict, and our prior results are not necessarily indicative of results in future periods.
Our markets are rapidly changing, which makes it difficult to predict our future revenue and plan our expenses appropriately.
We compete in markets characterized by rapid technological change, changing needs of CSPs, evolving industry standards and frequent introductions of new products and services. We invest significant amounts to pursue innovative technologies that we believe will be adopted by CSPs. For example, we have invested and continue to invest resources and funds in our cloud and software platforms. In addition, on an ongoing basis we expect to reposition our product and service offerings and introduce new products and services as we encounter rapidly changing CSP requirements and increasing competitive pressures. If we cannot increase sales of our new products and services, keep pace with rapid technological developments to meet our customers’ needs and compete with evolving industry standards or if the technologies we choose to invest in fail to meet customer needs or are not adopted by customers in the timeframes that we expect, it would be difficult to forecast our future revenue and plan our operating expenses.
Government-sponsored programs and U.S. federal government shutdowns could impact the timing and buying patterns of CSPs, which may cause fluctuations in our operating results.
We sell to CSPs, which include U.S.-based IOCs, which have revenue that is particularly dependent upon interstate and intrastate access charges and federal and state subsidies. The FCC and some states may consider changes to such payments and subsidies, and these changes could reduce IOC revenue. Furthermore, many IOCs use or expect to use government-supported loan programs or grants, such as Rural Utility Service loans and grants, to finance capital spending. These government-supported loan programs and grants generally include conditions such as deployment criteria, domestic preference provisions and other requirements that apply to the project and selected equipment as conditions for funding. Changes to the terms or administration of these programs, including uncertainty from government and administrative change, potential funding limitations that impact our ability to meet program requirements or funding delays due to U.S. federal government shutdowns could reduce the ability of IOCs to access capital or secure funding under government-funded programs to purchase our products and services and thus reduce our revenue opportunities.
Many of our customers were awarded grants or loans under government stimulus programs or funds distributed under the FCC’s CAF program, and have purchased and will continue to purchase products from us or other suppliers while such programs and funding are available. However, customers may substantially curtail purchases as funding winds down or as planned purchases are completed.
In addition to the impact of U.S. federal government shutdowns, any changes in government regulations and subsidies could also cause our customers to change their purchasing decisions, which could have an adverse effect on our operating results and financial condition.
We face intense competition that could reduce our revenue and adversely affect our financial results.
The market for our products is highly competitive, and we expect competition from both established and new companies to increase. Our competitors include companies such as ADTRAN, Inc.; Amazon; Casa Systems; Ciena Corporation; Cisco Systems Inc.; CommScope Inc.; DASAN Zhone Solutions, Inc.; Huawei Technologies Co. Ltd.; Juniper Networks Inc.; Nokia Corporation; Plume Design, Inc. and ZTE Corporation, among others.
Our ability to compete successfully depends on a number of factors, including:
28
• | the successful development of new products; |
• | our ability to anticipate CSP and market requirements and changes in technology and industry standards; |
• | our ability to differentiate our products from our competitors’ offerings based on performance, cost-effectiveness or other factors; |
• | our ability to meet increased customer demand for services and support for their network requirements; |
• | our ability to gain customer acceptance of our products; and |
• | our ability to market and sell our products. |
The broadband access equipment market has undergone and continues to undergo consolidation, as participants have merged, made acquisitions or entered into partnerships or other strategic relationships with one another to offer more comprehensive solutions than they individually had offered. Examples include Arris Group’s acquisition of Pace plc in January 2016; Nokia’s acquisition of Alcatel-Lucent in January 2016; the merger of DASAN Zhone Solutions with DASAN Network Solutions in September 2016; and CommScope’s acquisition of Arris in April 2019. We expect this trend to continue as companies attempt to strengthen or maintain their market positions in an evolving industry.
Many of our current or potential competitors have longer operating histories, greater name recognition, larger customer bases and significantly greater financial, technical, sales, marketing and other resources than we do and are better positioned to acquire and offer complementary products and services. Many of our competitors have broader product lines and can offer bundled solutions, which may appeal to certain customers. Our competitors may also invest additional resources in developing more compelling product offerings. Potential customers may also prefer to purchase from their existing suppliers rather than a new supplier, regardless of product performance or features, because the products that we and our competitors offer require a substantial investment of time and funds to qualify and install.
Some of our competitors may offer substantial discounts or rebates to win new customers or to retain existing customers. If we are forced to reduce prices in order to secure customers, we may be unable to sustain gross margin at desired levels or achieve profitability. Competitive pressures could result in increased pricing pressure, reduced profit margin, increased sales and marketing expenses and failure to increase, or the loss of, market share, any of which could reduce our revenue and adversely affect our financial results.
Product development is costly, and if we fail to develop new products or enhancements that meet changing CSP requirements, we could experience lower sales.
Our industry is characterized by rapid technological advances, frequent new product introductions, evolving industry standards and unanticipated changes in subscriber requirements. Our future success will depend significantly on our ability to anticipate and adapt to such changes, and to offer, on a timely and cost-effective basis, products and features that meet changing CSP demands and industry standards. We intend to continue to invest in developing new products and enhancing the functionality of our platforms, including to reach a broader set of customers. Developing our products is expensive and complex and involves uncertainties, including pricing risks from sourcing sufficient quantities of custom components from limited suppliers on terms which may not be commercially acceptable for us. We may not have sufficient resources to successfully manage lengthy product development cycles. Our research and development expenses were $81.2 million, or 19% of total revenue, in 2019, $90.0 million, or 20% of total revenue, in 2018 and $127.5 million, or 25% of total revenue, in 2017. We believe that we must continue to dedicate a significant amount of resources to our research and development efforts, including increased reliance on third-party partners to maintain our competitive position. As we continue to invest in third-party partners to develop additional features to our product and service platforms, we may experience increased challenges in design, integration and support of such third-party features in our product and service offerings. These investments may take several years to generate positive returns, if ever. Furthermore, certain of our engineering services arrangements impose future payment obligations, in the form of minimum revenue-share payments on the sale of the developed products, that are set based on our expectations of future customer demand associated with the developed products, and require us to make minimum payments whether or not we achieve the desired customer demand. If our forecasts for the developed products fall short of expectations, we may have an asset impairment related to said products, which could adversely affect our financial results. In addition, we may experience design, manufacturing, software development quality, support, marketing and other difficulties that could delay or prevent the development, introduction or marketing of new products and enhancements. If we fail to meet our development targets, demand for our products will decline.
In addition, the introduction of new or enhanced products also requires that we manage the transition from older products to these new or enhanced products in order to minimize disruption in customer ordering patterns, fulfill ongoing customer commitments and ensure that adequate supplies of new products are available for delivery to meet anticipated customer demand. If we fail to maintain compatibility with other software or equipment found in our customers’ existing and planned networks, or if our products cannot be effectively deployed in our customer networks to provide desired services, we may face
29
substantially reduced demand for our products, which would reduce our revenue opportunities and market share. Moreover, as customers complete infrastructure deployments, they may require greater levels of service and support than we have provided in the past. We may not be able to provide products, services and support to compete effectively for these market opportunities. If we are unable to anticipate and develop new products or enhancements to our existing products on a timely and cost-effective basis, our products may become technologically obsolete more rapidly than anticipated over time, resulting in lower sales which would harm our business.
Our sales cycles can be long and unpredictable, and our sales efforts require considerable time and expense. As a result, our sales are difficult to predict and may vary substantially from quarter to quarter, which may cause our operating results to fluctuate significantly.
The timing of our revenue is difficult to predict. Our sales efforts often involve educating CSPs about the use and benefits of our products. CSPs typically undertake a significant evaluation process, which frequently involves not only our products but also those of our competitors and results in a lengthy sales cycle. Sales cycles for larger customers are relatively longer and require considerably more time and expense. We spend substantial time, effort and money in our sales efforts without any assurance that our efforts will produce sales. In addition, product purchases are frequently subject to budget constraints, multiple approvals and unplanned administrative, processing and other delays. The timing of revenue related to sales of products and services that have installation requirements may be difficult to predict due to interdependencies that may be beyond our control, such as CSP testing and turn-up protocols or other vendors’ products, services or installations of equipment upon which our products and services rely. Such delays may result in fluctuations in our quarterly revenue. If sales expected from a specific customer for a particular quarter are not realized in that quarter or at all, we may not achieve our revenue forecasts and our financial results would be adversely affected.
Our focus on CSPs with relatively small networks limits our revenue from sales to any one customer and makes our future operating results difficult to predict.
A large portion of our sales efforts continue to be focused on CSPs with relatively small networks, cable MSOs and selected international CSPs. Our current and potential customers generally operate small networks with limited capital expenditure budgets. Accordingly, we believe the potential revenue from the sale of our products to any one of these customers is limited. As a result, we must identify and sell products to new customers each quarter to continue to increase our sales. In addition, the spending patterns of many of our customers are characterized by small and sporadic purchases. As a consequence, we have limited backlog and will likely continue to have limited visibility into future operating results.
We do not have long-term, committed-volume purchase contracts with our customers, and therefore have no guarantee of future revenue from any customer.
We typically have not entered into long-term, committed-volume purchase contracts with our customers, including our key customers which account for a material portion of our revenue. As a result, any of our customers may cease to purchase our products at any time. In addition, our customers may attempt to renegotiate terms of sale, including price and quantity. If any of our key customers stop purchasing our access platforms, systems and software for any reason, our business and results of operations would be harmed.
Our efforts to increase our sales to CSPs globally, including cable MSOs, may be unsuccessful.
Our sales and marketing efforts have been focused on CSPs in North America. Part of our long-term strategy is to increase sales to CSPs globally, including cable MSOs. We have devoted and continue to devote substantial technical, marketing and sales resources to these larger CSPs, who have lengthy equipment qualification and sales cycles, without any assurance of generating sales. In particular, sales to these larger CSPs may require us to upgrade our products to meet more stringent performance criteria and interoperability requirements, develop new customer-specific features or adapt our products to meet international standards. Implementing these requirements and features is costly and could negatively impact our operating results, financial condition and cash flows. Moreover, if we are unable to obtain materials at favorable costs, our margins and profitability could be adversely impacted. For example, we work with large CSPs in testing and laboratory trials for our NG-PON2 technology and cable MSO applications. We have invested and expect to continue to invest considerable time, effort and expenditures, including investment in product research and development, related to these opportunities without any assurance that our efforts will produce orders or revenue. If we are unable to successfully increase our sales to larger CSPs, our operating results, financial condition, cash flows and long-term growth may be negatively impacted.
We are exposed to the credit risks of our customers; if we have inadequately assessed their creditworthiness, we may have more exposure to accounts receivable risk than we anticipate. Failure to collect our accounts receivable in amounts that we anticipate could adversely affect our operating results and financial condition.
In the course of our sales to customers, we may encounter difficulty collecting accounts receivable and could be exposed to risks associated with uncollectible accounts receivable. We maintain an allowance for doubtful accounts for estimated losses
30
resulting from the inability or unwillingness of our customers to make required payments. However, these allowances are based on our judgment and a variety of factors and assumptions.
We perform credit evaluations of our customers’ financial condition. However, our evaluation of the creditworthiness of customers may not be accurate if they do not provide us with timely and accurate financial information, or if their situations change after we evaluate their credit. Furthermore, some of our international customers operate in countries with developing economies, which from time to time, experience financial crises and become unable to make payments in U.S. dollars. While we attempt to monitor these situations carefully, adjust our allowances for doubtful accounts as appropriate and take measures to collect accounts receivable balances, we have written down accounts receivable and written off doubtful accounts in prior periods and may be unable to avoid additional write-downs or write-offs of doubtful accounts in the future. Such write-downs or write-offs could negatively affect our operating results for the period in which they occur and could harm our cash flow or our financial condition.
Our products must interoperate with many software applications and hardware products found in our customers’ networks. If we are unable to ensure that our products interoperate properly, our business will be harmed.
Our products must interoperate with our customers’ existing and planned networks, which often have varied and complex specifications, utilize multiple protocol standards, include software applications and customizations and products from multiple vendors and contain multiple generations of products that have been added over time. As a result, we must continually ensure that our products interoperate properly with these existing and planned networks. To meet these requirements, we must undertake development efforts, including test protocols, that require substantial capital investment and employee resources. We may not accomplish these development goals quickly or cost-effectively, if at all. If we fail to maintain compatibility with other software or equipment found in our customers’ existing and planned networks, we may face substantially reduced demand for our products, which would reduce our revenue opportunities and market share.
We have entered into interoperability arrangements with a number of equipment and software vendors for the use or integration of their technology with our products. These arrangements give us access to and enable interoperability with various products that we do not otherwise offer. If these relationships fail, we may have to devote substantially more resources to the development of alternative products and processes and our efforts may not be as effective as the combined solutions under our current arrangements. In some cases, these other vendors are either companies that we compete with directly or companies that have extensive relationships with our existing and potential customers and may have influence over the purchasing decisions of those customers. Some of our competitors have stronger relationships with some of our existing and other potential interoperability partners, and as a result, our ability to have successful interoperability arrangements with these companies may be harmed. Our failure to establish or maintain key relationships with third-party equipment and software vendors may harm our ability to successfully sell and market our products.
The quality of our support and services offerings is important to our customers, and if we fail to continue to offer high quality support and services, we could lose customers, which would harm our business.
Once our products are deployed within our customers’ networks, they depend on our support organization to resolve any issues relating to those products. A high level of support is critical for the successful marketing and sale of our products. Furthermore, our services to customers have increasingly broadened to include network optimization, integration and development services and remote monitoring to help our customers deploy our products within their networks. If we do not effectively assist our customers in deploying our products, succeed in helping them quickly resolve post-deployment issues or provide effective ongoing support, it could adversely affect our ability to sell our products to existing customers and harm our reputation with potential new customers. As a result, our failure to maintain high quality support and services could result in the loss of customers, which would harm our business.
An increase in revenue mix towards deployment services may adversely affect our gross margin.
In response to greater customer demand for certain professional and support services for our products, we continue to invest and grow our services business while de-prioritizing lower gross margin deployment services. Our services include deployment services, product warranty and support services, customer success services, customer enablement services, managed services to help our customers manage and optimize their networks and education and certification services. Deployment services typically have a lower gross margin than product purchases or other service offerings. We also rely upon third-party subcontractors to assist with some of our professional and support services projects, which generally result in higher costs and increased risk of cost overruns, which can negatively impact our gross margin. Moreover, if we are unable to achieve desired efficiencies and scale as we ramp and develop our services business, we may incur higher than expected costs, which can further adversely impact our gross margin.
Our products are highly technical and may contain undetected hardware defects or software bugs, which could harm our reputation and adversely affect our business.
31
Our products, including our smart home and business systems and our cloud and software platforms, are highly technical and, when deployed, are critical to the operation of many networks. Our products have contained and may contain undetected defects, bugs or security vulnerabilities, which risks may be exacerbated as we continue to expand our cloud and software portfolio. Some defects in our products may only be discovered after a product has been installed and used by customers and may in some cases only be detected under certain circumstances or after extended use. Any errors, bugs, defects or security vulnerabilities discovered in our products after commercial release could result in loss of revenue or delay in revenue recognition, loss of customers and increased service and warranty and retrofit costs, any of which could adversely affect our business, operating results and financial condition. In addition, we could face claims for security and data breach, product liability, tort or breach of warranty. Our contracts with customers contain provisions relating to warranty disclaimers and liability limitations, which may not be upheld. Defending a lawsuit, regardless of its merit, is costly and may divert management’s attention and adversely affect the market’s perception of us and our products. In addition, if our business liability insurance coverage proves inadequate or future coverage is unavailable on acceptable terms or at all, our business, operating results and financial condition could be adversely impacted.
Increasing data privacy regulations could impact our business and expose us to increased liability.
Government and regulatory authorities in the United States and around the world have implemented and are continuing to implement broader and more stringent laws and regulations concerning data protection. For example, in July 2016, the European Commission adopted the EU-U.S. Privacy Shield to replace Safe Harbor as a compliance mechanism for the transfer of personal data from the European Union to the United States. In addition, the General Data Protection Regulation, or GDPR, adopted by the European Parliament became effective in May 2018 to harmonize data privacy laws across Europe. Among other requirements, the GDPR imposes specific duties and requirements upon companies that collect, process or control personal data of European Union residents. Although we currently do not have material operations or business in the European Union, the GDPR regulations could cause us to incur substantial costs in order to expand our business or deliver certain services in the European Union. Furthermore, the GDPR imposes penalties for noncompliance of up to the greater of €20 million or 4% of a company’s worldwide revenue; accordingly, any non-compliance with the GDPR could result in a material adverse effect on our business, financial condition and results of operations. In addition, the United Kingdom’s pending exit from the European Union creates uncertainty with respect to whether the United Kingdom will enact data protection laws or regulations designed to be consistent with the GDPR. Moreover, the California Consumer Privacy Act became effective in California in January 2020 and provides new data privacy rights for consumers and new operational requirements for companies. The interpretation and application of these data protection laws and regulations are often uncertain and in flux, and it is possible that they may be interpreted and applied in a manner that is inconsistent with our data practices. Complying with emerging and changing laws could cause us to incur substantial costs or require us to change our business practices in a manner adverse to our business.
Concerns about or regulatory actions involving our practices with regard to the collection, storage, processing, use or disclosure of customer information or other privacy related matters, even if unfounded, could damage our reputation and adversely affect operating results. While we strive to provide transparency about our collection, use, disclosure and security over any personal data and to comply with all applicable data protection laws and regulations, the failure or perceived failure to comply may result in inquiries and other proceedings or actions against us by government entities or others, or could cause us to lose customers, which could potentially have an adverse effect on our business.
Security breaches and data loss may expose us to liability, harm our reputation and adversely affect our business.
As part of our business operations, we collect, store, process, use and/or disclose sensitive data relating to our business, including in connection with the provision of our cloud services and in our information systems and data centers (including third-party data centers). In some cases, we use third-party service providers for services that may include the collection, handling, processing and/or storage of personal data on our behalf. In addition, we host our customers’ subscriber data in third-party data centers in the course of providing services and solutions to our customers through our cloud and smart home and business subscriptions. While we and our service providers apply multiple layers of security to control access to data and use encryption and authentication technologies to secure data from unauthorized access, use, alteration and disclosure, these security measures may be compromised. Malicious hackers may attempt to gain access to our network or data centers; steal proprietary information related to our business, products, employees, and customers; or interrupt our systems and services or those of our customers or others. Although we monitor our networks and continue to enhance our security protections, hackers are increasingly more sophisticated and aggressive, and our efforts may be inadequate to prevent all incidents of data breach or theft. The theft, loss, or misuse of personal data collected, stored or processed by us or our service providers to run our business could result in significantly increased security and remediation costs or costs related to defending legal claims. If we or our service providers do not allocate and effectively implement and manage the resources necessary to maintain adequate security measures, we could be subjected to data loss, unauthorized data disclosure or a compromise or breach of our systems or those of our third-party data centers. As we continue to grow our cloud and software portfolio, risks arising from or related to security breaches or data loss are likely to increase. Any loss of data or compromise of our systems or data centers could result
32
in a loss of confidence in the security of our offerings, damage our reputation, cause the loss of current or potential customers or partners, lead to legal and regulatory liability and adversely affect our business, financial condition, operating results and cash flows.
If we experience protracted disruption in functionality or processing capabilities of our newly migrated enterprise resource planning, or ERP, system, we may not be able to effectively transact our business or produce our financial statements on a timely basis and without incurrence of additional costs, which would adversely affect our business, results of operations and cash flows.
We recently migrated our Oracle ERP system to Oracle’s cloud platform. This migration involved significant complexity, requiring us to move and reconfigure all of our current system processes, transactions, data and controls to a new Oracle platform. We have also experienced substantial delays and higher than planned resource needs in our migration efforts due in part to the complexity, volume and scope of changes involved in the migration. Although we conducted design validations and user testing, we currently are and may continue to experience difficulties and delays in transacting our business due to system challenges, limitations in functionality, inadequate change management or process deficiencies in the production use of the system. We are highly dependent upon our ERP system for critical business functions, including order processing and management, supply chain and procurement operations, financial planning and accounting; accordingly, protracted disruption in functionality or processing capabilities of the ERP system could materially impair our ability to conduct our business, process transactions timely or to produce accurate financial statements on a timely basis. If our ability to conduct our business, process transactions or to produce accurate financial statements on a timely basis remains impaired, our business, results of operations and cash flows would be adversely affected.
Our estimates regarding future warranty or product obligations may change due to product failure rates, shipment volumes, field service obligations and rework costs incurred in correcting product failures. If our estimates change, the liability for warranty or product obligations may be increased, impacting future cost of revenue.
Our products are highly complex, and our product development, manufacturing and integration testing may not be adequate to detect all defects, errors, failures and quality issues. Quality or performance problems for products covered under warranty could adversely impact our reputation and negatively affect our operating results and financial position. The development and production of new products with high complexity often involves problems with software, components and manufacturing methods. If significant warranty or other product obligations arise due to reliability or quality issues arising from defects in software, faulty components or improper manufacturing methods, our operating results and financial position could be negatively impacted by:
• | cost associated with fixing software or hardware defects; |
• | high service and warranty expenses; |
• | high inventory obsolescence expense; |
• | delays in collecting accounts receivable; |
• | payment of liquidated damages for performance failures; and |
• | declining sales to existing customers. |
As the market for our products evolves, changing customer requirements may adversely affect the valuation of our inventory.
Customer demand for our products can change rapidly in response to market and technology developments. Demand can be affected not only by customer- or market-specific issues, but also by broader economic and/or geopolitical factors. We may, from time to time, adjust inventory valuations downward in response to our assessment of demand from our customers for specific products or product lines. The related excess inventory charges may have an adverse effect on our gross margin, financial condition and results of operations.
If we fail to comply with evolving industry standards, sales of our existing and future products would be adversely affected.
The markets for our products are characterized by a significant number of standards, both domestic and international, which are evolving as new technologies are developed and deployed. As we expand into adjacent markets and increase our international footprint, we are likely to encounter additional standards. Our products must comply with these standards in order to be widely marketable. In some cases, we are compelled to obtain certifications or authorizations before our products can be introduced, marketed or sold in new markets or to customers that we have not historically served. For example, our ability to maintain Operations System Modification for Intelligent Network Elements certification for our products will affect our ongoing ability to continue to sell our products to Tier 1 CSPs.
33
In addition, our ability to expand our international operations and create international market demand for our products may be limited by regulations or standards adopted by other countries that may require us to redesign our existing products or develop new products suitable for sale in those countries. Although we believe our products are currently in compliance with domestic and international standards and regulations in countries in which we currently sell, we may not be able to design our products to comply with evolving standards and regulations in the future. This ongoing evolution of standards and differing foreign regulations may directly affect our ability to market or sell our products, particularly with regards to our cloud and software platforms in international markets. Further, the cost of complying with the evolving standards and regulations or the failure to obtain timely domestic or foreign regulatory approvals or certification could prevent us from selling our products where these standards or regulations apply, which would result in lower revenue and lost market share.
We may be unable to successfully expand our international operations. In addition, we may be subject to a variety of international risks that could harm our business.
We currently generate most of our sales from customers in North America and have more limited experience marketing, selling and supporting our products and services outside North America or managing the administrative aspects of a worldwide operation. Our ability to expand our international operations is dependent on our ability to create or maintain international market demand for our products. In addition, as we expand our operations internationally, our support organization will face additional challenges including those associated with delivering support, training and documentation in languages other than English. If we invest substantial time and resources to expand our international operations and are unable to do so successfully and in a timely manner, our business, financial condition and results of operations may suffer.
In the course of expanding our international operations and operating overseas, we will be subject to a variety of risks, including:
• | differing regulatory requirements, including tax laws, trade laws, data privacy laws, labor regulations, tariffs, export quotas, custom duties or other trade restrictions; |
• | liability or damage to our reputation resulting from corruption or unethical business practices in some countries; |
• | exposure to effects of fluctuations in currency exchange rates if, over time, international customer contracts are increasingly denominated in local currencies; |
• | longer collection periods and difficulties in collecting accounts receivable; |
• | greater difficulty supporting and localizing our products; |
• | added costs of supporting cloud infrastructure outside of the United States; |
• | different or unique competitive pressures as a result of, among other things, the presence of local equipment suppliers; |
• | challenges inherent in efficiently managing an increased number of employees over large geographic distances, including the need to implement appropriate systems, policies and compensation, benefits and compliance programs; |
• | limited or unfavorable intellectual property protection; |
• | risk of change in international political or economic conditions, terrorist attacks or acts of war; and |
• | restrictions on the repatriation of earnings. |
We engage resellers to promote, sell, install and support our products to some customers in North America and internationally. Their failure to do so or our inability to recruit or retain appropriate resellers may reduce our sales and thus harm our business.
We engage some value-added resellers, or VARs, who provide sales and support services for our products. We compete with other telecommunications systems providers for our VARs’ business and many of our VARs are free to market competing products. Our use of VARs and other third-party support partners and the associated risks of doing so are likely to increase as we expand sales outside of North America. If a VAR promotes a competitor’s products to the detriment of our products or otherwise fails to market our products and services effectively, we could lose market share. In addition, the loss of a key VAR or the failure of VARs to provide adequate customer service could have a negative effect on customer satisfaction and could cause harm to our business. If we do not properly recruit and train VARs to sell, install and service our products, our business, financial condition and results of operations may suffer.
We may have difficulty evolving and scaling our business and operations to meet customer and market demand, which could result in lower profitability or cause us to fail to execute on our business strategies.
34
In order to grow our business, we will need to continually evolve and scale our business and operations to meet customer and market demand. Evolving and scaling our business and operations places increased demands on our management as well as our financial and operational resources to effectively:
• | manage organizational change; |
• | manage a larger organization; |
• | accelerate and/or refocus research and development activities; |
• | expand our manufacturing, supply chain and distribution capacity; |
• | increase our sales and marketing efforts; |
• | broaden our customer-support and services capabilities; |
• | maintain or increase operational efficiencies; |
• | scale support operations in a cost-effective manner; |
• | implement appropriate operational and financial systems; and |
• | maintain effective financial disclosure controls and procedures. |
If we cannot evolve and scale our business and operations effectively, we may not be able to execute our business strategies in a cost-effective manner and our business, financial condition, profitability and results of operations could be adversely affected.
We may not be able to protect our intellectual property, which could impair our ability to compete effectively.
We depend on certain proprietary technology for our success and ability to compete. We rely on intellectual property laws as well as nondisclosure agreements, licensing arrangements and confidentiality provisions to establish and protect our proprietary rights. U.S. patent, copyright and trade secret laws afford us only limited protection, and the laws of some foreign countries do not protect proprietary rights to the same extent. Our pending patent applications may not result in issued patents, and our issued patents may not be enforceable. Any infringement of our proprietary rights could result in significant litigation costs. Further, any failure by us to adequately protect our proprietary rights could result in our competitors offering similar products, resulting in the loss of our competitive advantage and decreased sales.
It may become more difficult to adequately protect our intellectual property as we expand our reliance on third parties for the design, development and/or manufacture of our products. While our contracts with such third parties contain provisions relating to intellectual property rights, indemnification and liability, they may not be adequately enforced. Our third-party providers may also be subject to unauthorized third-party copying or use of our proprietary rights.
Despite our efforts to protect our proprietary rights, attempts may be made to copy or reverse engineer aspects of our products or to obtain and use information that we regard as proprietary. Accordingly, we may be unable to protect our proprietary rights against unauthorized third-party copying or use. Furthermore, policing the unauthorized use of our intellectual property is difficult and costly. Litigation may be necessary in the future to enforce our intellectual property rights, to protect our trade secrets or to determine the validity and scope of the proprietary rights of others. Litigation could result in substantial costs, diversion of resources and harm to our business.
We could become subject to litigation regarding intellectual property rights that could harm our business.
We may be subject to intellectual property infringement claims that are costly to defend and could limit our ability to use some technologies in the future. The risk of such claims could increase as we expand our product portfolio and increasingly rely on more technologies. Third parties may assert patent, copyright, trademark or other intellectual property rights to technologies or rights that are important to our business. Such claims may originate from non-practicing entities, patent holding companies or other adverse patent owners who have no relevant product revenue, and therefore, our own issued and pending patents may provide little or no deterrence to suit from these entities.
We have received in the past and expect that in the future we may receive communications from competitors and other companies alleging that we may be infringing their patents, trade secrets or other intellectual property rights; offering licenses to such intellectual property; threatening litigation or requiring us to act as a third-party witness in litigation. In addition, we have agreed, and may in the future agree, to indemnify our customers for expenses or liabilities resulting from certain claimed infringements of patents, trademarks or copyrights of third parties. Such indemnification may require us to be financially responsible for claims made against our customers, including costs of litigation and damages awarded, which could negatively impact our results of operations. Any claims asserting that our products infringe the proprietary rights of third parties, with or without merit, could be time-consuming, result in costly litigation and divert the efforts of our engineering teams and management. These claims could also result in product shipment delays or require us to modify our products or enter into
35
royalty or licensing agreements. Such royalty or licensing agreements, if required, may not be available to us on acceptable terms, if at all.
Our use of open source software could impose limitations on our ability to commercialize our products.
We incorporate open source software into our products. Although we closely monitor our use of open source software, the terms of many open source software licenses have not been interpreted by the courts, and there is a risk that such licenses could be construed in a manner that could impose unanticipated conditions or restrictions on our ability to sell our products. In such event, we could be required to make our proprietary software generally available to third parties, including competitors, at no cost, to seek licenses from third parties in order to continue offering our products, to re-engineer our products or to discontinue the sale of our products in the event re-engineering cannot be accomplished on a timely basis or at all, any of which could adversely affect our revenue and operating expenses.
If we are unable to obtain necessary third-party technology licenses, our ability to develop new products or product enhancements may be impaired.
While our current licenses of third-party technology generally relate to commercially available off-the-shelf technology, we may from time to time be required to license additional technology from third parties to develop new products or product enhancements either directly or through an ODM partner. These third-party licenses may be unavailable to us or our ODMs on commercially reasonable terms, if at all. The inability to obtain necessary third-party licenses may force us to accept substitute technology of lower quality or performance standards or at greater cost or may increase the time-to-market of our products or product enhancements, any of which could harm the competitiveness of our products and result in lost revenue.
Our ability to incur debt and the use of our funds could be limited by borrowing base restrictions and restrictive covenants in our loan and security agreement for our revolving credit facility.
In January 2020 we entered into a Loan and Security Agreement with Bank of America, N.A., or the BofA Loan Agreement, which provides for a revolving credit facility up to a principal amount of $35.0 million, with the availability of borrowings subject to certain conditions and requirements, including the maintenance of Availability (as defined in the BofA Loan Agreement) of at least $5.0 million. We are dependent on our existing cash, cash equivalents and borrowings available under our BofA Loan Agreement to provide adequate funds for ongoing operations, planned capital expenditures and working capital requirements for at least the next twelve months. If our financial position deteriorates, our borrowing capacity under the credit facility may be reduced, which would adversely impact our business and growth. In addition, the BofA Loan Agreement includes covenants that place certain restrictions on our ability to, among other things, borrow secured debt or unsecured debt beyond a certain amount, create or suffer to exist any liens, sell or transfer any assets, make distributions, liquidate, dissolve, merge, amalgamate, combine or consolidate, or become a party to certain agreements restricting our ability to incur or repay debt, grant liens, make distributions or modify loan agreements, in each case subject to certain exceptions. Failure to maintain these covenants can limit the amount of borrowings that are available to us, increase the cost of borrowings under the facility, and/or require us to make immediate payments to reduce borrowings.
Given our current financial position and history of operating losses, it is possible that we may fail to meet the minimum levels required by the financial covenants, which would constitute an event of default under the BofA Loan Agreement. Events beyond our control could have a material adverse impact on our results of operations, financial condition or liquidity, in which case we may not be able to meet our financial covenants. For example, prior to the BofA Loan Agreement, we were party to a loan agreement with Silicon Valley Bank, or the SVB Loan Agreement, that provided us a revolving credit facility based on a customary accounts receivable borrowing base, subject to certain exceptions and conclusions. During the term of the SVB Loan Agreement, we were not able to meet the financial covenants in several of the quarters due to variability in our results of operations and financial position and had to request waivers and amendments to the SVB Loan Agreement to avoid an event of default. The BofA Loan Agreement covenants may also affect our ability to obtain future financing and to pursue attractive business opportunities and our flexibility in planning for, and reacting to, changes in business conditions. These covenants could place us at a disadvantage compared to some of our competitors, who may have fewer restrictive covenants and may not be required to operate under these restrictions.
The United Kingdom’s withdrawal from the European Union may have a negative effect on global economic conditions, financial markets and our business.
On January 31, 2020, the United Kingdom formally withdrew from the European Union as a result of a national referendum passed by a majority of voters in the United Kingdom in June 2016. The withdrawal creates significant uncertainty about the future relationship between the United Kingdom and the European Union, including with respect to the laws and regulations that will apply as the United Kingdom determines which European Union laws to replace or replicate. These developments have had and may continue to have a material adverse effect on global economic conditions and the stability of global financial markets and may significantly reduce global market liquidity and restrict the ability of key market participants to operate in certain financial markets. Any of these factors could depress economic activity and restrict our access to capital, or the access
36
to capital of our customers or partners, which could have a material adverse effect on our operations in the United Kingdom, and generally on our business, financial condition and results of operations and reduce the price of our securities.
Our failure or the failure of our manufacturers to comply with environmental and other legal regulations could adversely impact our results of operations.
The manufacture, assembly and testing of our products may require the use of hazardous materials that are subject to environmental, health and safety regulations, or materials subject to laws restricting the use of conflict minerals. Our failure or the failure of our third-party manufacturers to comply with any of these requirements could result in regulatory penalties, legal claims or disruption of production. In addition, our failure or the failure of our manufacturers to properly manage the use, transportation, emission, discharge, storage, recycling or disposal of hazardous materials could subject us to increased costs or liabilities. Existing and future environmental regulations and other legal requirements may restrict our use of certain materials to manufacture, assemble and test products. Any of these consequences could adversely impact our results of operations by increasing our expenses and/or requiring us to alter our manufacturing processes.
Regulatory and physical impacts of climate change and other natural events may affect our customers and our contract manufacturers, resulting in adverse effects on our operating results.
As emissions of greenhouse gases continue to alter the composition of the atmosphere, affecting large-scale weather patterns and the global climate, any new regulation of greenhouse gas emissions may result in additional costs to our customers and our contract manufacturers. In addition, the physical impacts of climate change and other natural events, including changes in weather patterns, drought, rising ocean and temperature levels, earthquakes and tsunamis may impact our customers, suppliers and contract manufacturers, and our operations. These potential physical effects may adversely affect our revenue, costs, production and delivery schedules, and cause harm to our results of operations and financial condition.
We have in the past pursued, and may in the future continue to pursue, acquisitions which involve a number of risks and uncertainties. If we are unable to address and resolve these risks and uncertainties successfully, such acquisitions could disrupt our business and result in higher costs than we anticipate.
We may in the future acquire businesses, products or technologies to expand our product offerings and capabilities, customer base and business. We have evaluated and expect to continue to evaluate a wide array of potential strategic transactions. We have limited experience making such acquisitions or integrating these businesses after such acquisitions. Any anticipated and unanticipated costs to us related to future transactions could exceed amounts that are covered by insurance and could have a material adverse impact on our financial condition and results of operations. In addition, the anticipated benefit of any acquisitions may never materialize or the process of integrating acquired businesses, products or technologies may create unforeseen operating difficulties and expenditures.
Some of the areas where we have experienced and may in the future experience acquisition-related risks include:
• | expenses and distractions, including diversion of management time related to litigation; |
• | expenses and distractions related to potential claims resulting from any possible future acquisitions, whether or not they are completed; |
• | retaining and integrating employees from acquired businesses; |
• | issuance of dilutive equity securities or incurrence of debt; |
• | integrating various accounting, management, information, human resource and other systems to permit effective management; |
• | incurring possible write-offs, impairment charges, contingent liabilities, amortization expense of intangible assets or impairment of goodwill and intangible assets with finite useful lives; |
• | difficulties integrating and supporting acquired products or technologies; |
• | unexpected capital expenditure requirements; |
• | insufficient revenue to offset increased expenses associated with acquisitions; and |
• | opportunity costs associated with committing capital to such acquisitions. |
If our goodwill becomes impaired, we may be required to record a significant charge to our results of operations. We review our goodwill for impairment annually or when events or changes in circumstances indicate the carrying value may not be recoverable, such as a sustained or significant decline in stock price and market capitalization. If the carrying value of goodwill was deemed to be impaired, an impairment loss equal to the amount by which the carrying amount exceeds the estimated fair value would be recognized. Any such impairment could materially and adversely affect our financial condition and results of operations.
37
Foreign acquisitions would involve risks in addition to those mentioned above, including those related to integration of operations across different cultures and languages, currency risks and the particular economic, political and regulatory risks associated with specific countries. We may not be able to address these risks and uncertainties successfully, or at all, without incurring significant costs, delays or other operating problems.
Our inability to address or anticipate any of these risks and uncertainties could disrupt our business and could have a material impact on our financial condition and results of operations.
Our use of and reliance upon development resources in China may expose us to unanticipated costs or liabilities.
We operate a wholly foreign owned enterprise in Nanjing, China, where a dedicated team of engineers performs product development, quality assurance, cost reduction and other engineering work. Our reliance upon development resources in China may not enable us to achieve meaningful product cost reductions or greater resource efficiency. Further, our development efforts and other operations in China involve significant risks, including:
• | difficulty hiring and retaining appropriate engineering resources due to intense competition for such resources and resulting wage inflation; |
• | the knowledge transfer related to our technology and exposure to misappropriation of intellectual property or confidential information, including information that is proprietary to us, our customers and third parties; |
• | heightened exposure to changes in the economic, security, political and pandemic conditions that may arise in China; |
• | fluctuation in currency exchange rates and tax risks associated with international operations; |
• | development efforts that do not meet our requirements because of language, cultural or other differences associated with international operations, resulting in errors or delays; and |
• | uncertainty with respect to tariffs imposed by the federal government on products imported from China and future actions the federal government may take with respect to international trade agreements and U.S. tax provisions related to international commerce that could adversely affect our international operations. |
Difficulties resulting from the factors above and other risks related to our operations in China could expose us to increased expense, impair our development efforts, harm our competitive position and damage our reputation. For example, in December 2019, an outbreak of a novel strain of coronavirus was reported in Wuhan, China, which has impacted our research and development operations in Nanjing and may continue to impact our operations, including our ability to meet our desired development timelines. The uncertainty over the coronavirus outbreak has resulted in government-imposed travel restrictions and closures of certain business operations in China, which may also disrupt and delay the supply of component parts sourced from China and our supply chain and our suppliers’ operations in and outside of China for the foreseeable future.
Our customers are subject to government regulation, and changes in current or future laws or regulations that negatively impact our customers could harm our business.
The FCC has jurisdiction over all of our U.S. customers. FCC regulatory policies that create disincentives for investment in access network infrastructure or impact the competitive environment in which our customers operate may harm our business. For example, future FCC regulation affecting providers of broadband Internet access services could impede the penetration of our customers into certain markets or affect the prices they may charge in such markets. Similarly, changes to regulatory tariff requirements or other regulations relating to pricing or terms of carriage on communication networks could slow the development or expansion of network infrastructures. Consequently, such changes could adversely affect the sale of our products and services. Furthermore, many of our customers are subject to FCC rate regulation of interstate telecommunications services and are recipients of CAF capital incentive payments, which are intended to subsidize broadband and telecommunications services in areas that are expensive to serve. Changes to these programs, rules and regulations that could affect the ability of IOCs to access capital, and which could in turn reduce our revenue opportunities, remain possible.
In addition, many of our customers are subject to state regulation of intrastate telecommunications services, including rates for such services, and may also receive funding from state universal service funds. Changes in rate regulations or universal service funding rules, either at the U.S. federal or state level, could adversely affect our customers’ revenue and capital spending plans. Moreover, various international regulatory bodies have jurisdiction over certain of our non-U.S. customers. Changes in these domestic and international standards, laws and regulations, or judgments in favor of plaintiffs in lawsuits against CSPs based on changed standards, laws and regulations could adversely affect the development of broadband networks and services. This, in turn, could directly or indirectly adversely impact the communications industry in which our customers operate.
Many jurisdictions, including international governments and regulators, are also evaluating, implementing and enforcing regulations relating to cyber security, privacy and data protection, which can affect the market and requirements for networking
38
and communications equipment. To the extent our customers are adversely affected by laws or regulations regarding their business, products or service offerings, our business, financial condition and results of operations would suffer.
We are subject to governmental export and import controls that could subject us to liability or impair our ability to compete in additional international markets.
Our products are subject to U.S. export and trade controls and restrictions. International shipments of certain of our products may require export licenses or are subject to additional requirements for export. In addition, the import laws of other countries may limit our ability to distribute our products, or our customers’ ability to buy and use our products, in those countries. Changes in our products or changes in export and import regulations or duties may create delays in the introduction of our products in international markets, prevent our customers with international operations from deploying our products or, in some cases, prevent the export or import of our products to certain countries altogether. Any change in export or import regulations, duties or related legislation, shift in approach to the enforcement or scope of existing regulations, or change in the countries, persons or technologies targeted by such regulations, could negatively impact our ability to sell, profitably or at all, our products to existing or potential international customers.
If we lose any of our key personnel, or are unable to attract, train and retain qualified personnel, our ability to manage our business and continue our growth would be negatively impacted.
Our success depends, in large part, on the continued contributions of our key personnel, many of whom are highly skilled and would be difficult to replace. None of our key personnel are bound by a written employment contract to remain with us for a specified period. In addition, we do not currently maintain key person life insurance covering our key personnel. If we lose the services of any key personnel, our business, financial condition and results of operations may suffer.
Competition for skilled personnel is intense. We cannot be certain that we will be successful in attracting and retaining qualified personnel, or that newly hired personnel will function effectively, both individually and as a group. If we are unable to effectively recruit, hire and utilize new employees to align with our company objectives, execution of our business strategy and our ability to react to changing market conditions may be impeded, and our business, financial condition and results of operations may suffer.
Volatility or lack of performance in our stock price may also affect our ability to attract and retain our key personnel. Our executive officers and employees hold a substantial number of shares of our common stock and vested stock options. Employees may be more likely to leave us if the shares they own or the shares underlying their equity awards decline in value, or if the exercise prices of stock options that they hold are significantly above the market price of our common stock. If we are unable to retain our employees, our business, operating results and financial condition will be harmed.
If we fail to maintain proper and effective internal controls, our ability to produce accurate financial statements on a timely basis could be impaired, which would adversely affect our operating results, our ability to operate our business and our stock price.
Ensuring that we have adequate internal financial and accounting controls and procedures in place to produce accurate financial statements on a timely basis is a costly and time-consuming effort that needs to be re-evaluated frequently. We have in the past discovered, and may in the future discover, areas of our internal financial and accounting controls and procedures that need improvement. The complexity and changes related to our ERP migration described above in the risk factor entitled “If we fail in our implementation of our new Enterprise Resource Planning, or ERP, system platform, we may not be able to effectively transact our business or produce our financial statements on a timely basis and without incurrence of additional costs, which would adversely affect our business, results of operations and cash flows” could exacerbate the risk of deficiencies in process and controls upon which we rely to produce accurate and timely financial statements.
Our management is responsible for establishing and maintaining adequate internal control over financial reporting to provide reasonable assurance regarding the reliability of our financial reporting and the preparation of financial statements for external purposes in accordance with U.S. generally accepted accounting principles. Our management does not expect that our internal control over financial reporting will prevent or detect all error and all fraud. A control system, no matter how well designed and operated, can provide only reasonable, not absolute, assurance that the control system’s objectives will be met. Because of the inherent limitations in all control systems, no evaluation of controls can provide absolute assurance that misstatements due to error or fraud will not occur or that all control issues and instances of fraud, if any, within our company will have been detected.
We are required to comply with Section 404 of the Sarbanes-Oxley Act, or SOX, which requires us to expend significant resources in developing the required documentation and testing procedures. We cannot be certain that the actions we have taken and are taking to improve our internal controls over financial reporting will be sufficient to maintain effective internal controls over financial reporting in subsequent reporting periods or that we will be able to implement our planned processes and procedures in a timely manner. In addition, new and revised accounting standards and financial reporting requirements may occur in the future and implementing changes required by new standards, requirements or laws may require a significant
39
expenditure of our management’s time, attention and resources which may adversely affect our reported financial results. If we are unable to produce accurate financial statements on a timely basis, investors could lose confidence in the reliability of our financial statements, which could cause the market price of our common stock to decline and make it more difficult for us to finance our operations and growth.
We incur significant costs as a result of operating as a public company, which may adversely affect our operating results and financial condition.
As a public company, we incur significant accounting, legal and other expenses, including costs associated with our public company reporting requirements. We also anticipate that we will continue to incur costs associated with corporate governance requirements, including requirements and rules under SOX and the Dodd-Frank Wall Street Reform and Consumer Protection Act, or Dodd-Frank, among other rules and regulations implemented by the SEC, as well as listing requirements of the New York Stock Exchange, or NYSE. Furthermore, these laws and regulations could make it difficult or costly for us to obtain certain types of insurance, including director and officer liability insurance, and we may be forced to accept reduced policy limits and coverage or incur substantially higher costs to obtain the same or similar coverage. The impact of these requirements could also make it difficult for us to attract and retain qualified persons to serve on our Board of Directors, our board committees or as executive officers.
New laws and regulations as well as changes to existing laws and regulations affecting public companies, including the provisions of SOX and the Dodd-Frank Act and rules adopted by the SEC and the NYSE, would likely result in increased costs to us as we respond to their requirements. We continue to invest resources to comply with evolving laws and regulations, and this investment may result in increased general and administrative expense.
Risks Related to Ownership of Our Common Stock
Our stock price may continue to be volatile, and the value of an investment in our common stock may decline.
The trading price of our common stock has been, and is likely to continue to be, volatile, which means that it could decline substantially within a short period of time and could fluctuate widely in response to various factors, some of which are beyond our control. These factors include those discussed above under “Risks Related to Our Business and Industry” and others such as:
• | quarterly variations in our results of operations or those of our competitors; |
• | failure to meet any guidance that we have previously provided regarding our anticipated results; |
• | changes in earnings estimates or recommendations by securities analysts; |
• | failure to meet securities analysts’ estimates; |
• | announcements by us or our competitors of new products, significant contracts, commercial relationships, acquisitions or capital commitments; |
• | developments with respect to intellectual property rights; |
• | our ability to develop and market new and enhanced products on a timely basis; |
• | our commencement of, or involvement in, litigation and developments relating to such litigation; |
• | changes in governmental regulations; and |
• | a slowdown in the communications industry or the general economy. |
In recent years, the stock market in general, and the market for technology companies in particular, has experienced extreme price and volume fluctuations that have often been unrelated or disproportionate to the operating performance of those companies. Broad market and industry factors may seriously affect the market price of our common stock, regardless of our actual operating performance. In addition, in the past, following periods of volatility in the overall market and the market price of a particular company’s securities, securities class action litigation has often been instituted against these companies. This litigation, if instituted against us, could result in substantial costs and a diversion of our management’s attention and resources.
If securities or industry analysts do not publish research or reports about our business or if they issue an adverse or misleading opinion regarding our stock, our stock price and trading volume could decline.
The trading market for our common stock will be influenced by the research and reports that industry or securities analysts publish about us or our business. If any of the analysts who cover us issue an adverse or misleading opinion regarding our stock, our stock price would likely decline. If several of these analysts cease coverage of our company or fail to publish reports on us regularly, we could lose visibility in the financial markets, which in turn could cause our stock price or trading volume to decline.
40
Provisions in our charter documents and under Delaware law could discourage a takeover that stockholders may consider favorable and may lead to entrenchment of our management and Board of Directors.
Our amended and restated certificate of incorporation and amended and restated bylaws contain provisions that could have the effect of delaying or preventing changes in control or changes in our management or our Board of Directors. These provisions include:
• | a classified Board of Directors with three-year staggered terms, which may delay the ability of stockholders to change the membership of a majority of our Board of Directors; |
• | no cumulative voting in the election of directors, which limits the ability of minority stockholders to elect director candidates; |
• | the exclusive right of our Board of Directors to elect a director to fill a vacancy created by the expansion of the Board of Directors or the resignation, death or removal of a director, which prevents stockholders from being able to fill vacancies on our Board of Directors; |
• | the ability of our Board of Directors to issue shares of preferred stock and to determine the price and other terms of those shares, including preferences and voting rights, without stockholder approval, which could be used to significantly dilute the ownership of a hostile acquirer; |
• | a prohibition on stockholder action by written consent, which forces stockholder action to be taken at an annual or special meeting of our stockholders; |
• | the requirement that a special meeting of stockholders may be called only by the chairman of the Board of Directors, the chief executive officer or the Board of Directors, which may delay the ability of our stockholders to force consideration of a proposal or to take action, including the removal of directors; and |
• | advance notice procedures that stockholders must comply with in order to nominate candidates to our Board of Directors or to propose matters to be acted upon at a stockholders’ meeting, which may discourage or deter a potential acquirer from conducting a solicitation of proxies to elect the acquirer’s own slate of directors or otherwise attempting to obtain control of us. |
We are also subject to certain anti-takeover provisions under Delaware law. Under Delaware law, a corporation may not, in general, engage in a business combination with any holder of 15% or more of its capital stock unless the holder has held the stock for three years or, among other things, the Board of Directors has approved the transaction.
We may need additional capital in the future to finance our business.
We may need to raise additional capital to fund operations in the future. Our working capital needs and cash use have continued to increase to support our growth initiatives, and we may need additional capital if our current plans and assumptions change. While we have transitioned our supply chain operations to mitigate the impact of U.S. tariffs on goods imported from China, failure to effectively manage the transition or unanticipated further expenditures associated with mitigation efforts could negatively impact our cash flows and result of operations. Failure to maintain certain restrictive covenants and requirements under the BofA Loan Agreement could result in limiting the amount of borrowings that are available to us, increase the cost of borrowings under the credit facility, and/or cause us to make immediate payments to reduce borrowings or result in an event of default. If future financings involve the issuance of equity securities, our then-existing stockholders would suffer dilution. If we raise additional debt financing, we may be subject to restrictive covenants that limit our ability to conduct our business. If we are unable to generate positive operating income and positive cash flows from operations, our liquidity, results of operations and financial condition will be adversely affected. Furthermore, if we are unable to generate sufficient cash flows to support our operational needs, we may need to seek additional sources of liquidity, including borrowings, to support our working capital needs. In addition, we may choose to seek other sources of liquidity even if we believe we have generated sufficient cash flows to support our operational needs. There is no assurance that any other sources of liquidity may be available to us on acceptable terms or at all. If we are unable to generate sufficient cash flows or obtain other sources of liquidity, we will be forced to limit our development activities, reduce our investment in growth initiatives and institute cost-cutting measures, all of which would adversely impact our business and growth.
We do not currently intend to pay dividends on our common stock and, consequently, our stockholders’ ability to achieve a return on their investment will depend on appreciation in the price of our common stock.
We do not currently intend to pay any cash dividends on our common stock for the foreseeable future. We currently intend to invest our future earnings, if any, to fund our growth. Additionally, the terms of our credit facility restrict our ability to pay dividends under certain circumstances. Therefore, our stockholders are not likely to receive any dividends on our common stock for the foreseeable future.
41
ITEM 1B. | Unresolved Staff Comments |
None.
ITEM 2. | Properties |
We currently lease our corporate headquarters in San Jose, California. In addition to our headquarters site, we lease additional office space in the United States and China.
We believe that our facilities are in good condition and are generally suitable to meet our needs for the foreseeable future. We believe that prior to expiration of our current office space leases that we can renew or obtain suitable lease space on commercially reasonable terms for our business needs. In addition, we may continue to seek additional space as needed, and we believe this space will be available on commercially reasonable terms.
ITEM 3. | Legal Proceedings |
From time to time, we are involved in various legal proceedings arising from the normal course of business. We are not currently a party to any legal proceedings that, if determined adversely to us, in our opinion, are currently expected to individually or in the aggregate have a material adverse effect on our business, operating results or financial condition taken as a whole.
ITEM 4. | Mine Safety Disclosures |
Not applicable.
42
PART II
ITEM 5. | Market for Registrant’s Common Equity, Related Stockholder Matters and Issuer Purchases of Equity Securities |
Comparative Stock Prices
Our common stock has been trading on the New York Stock Exchange, under the trading symbol “CALX” since our initial public offering on March 24, 2010. Prior to this time, there was no public market for our common stock.
Number of Common Stockholders
As of February 14, 2020, the approximate number of holders of our common stock was 459 (not including beneficial owners of stock held in street name).
Dividends
We have never declared or paid any cash dividends on our common stock, and we do not currently intend to pay any cash dividends on our common stock in the foreseeable future. In addition, our BofA Loan Agreement requires BofA's consent before dividends can be declared. See Note 5 “Credit Agreements” of Notes to Consolidated Financial Statements included in this Annual Report on Form 10-K.
Recent Sales of Unregistered Securities
None.
Performance Graph
The following graph shows a comparison of the cumulative total stockholder return on our common stock with the cumulative total returns of the Russell 2000 Index and the Morningstar Communication Equipment Index. The graph tracks the performance of a $100 investment in our common stock and in each of the indexes during the last five fiscal years ended December 31, 2019. Data for the Russell 2000 Index and the Morningstar Communication Equipment Index assume reinvestment of dividends. Stockholder returns over the indicated period are based on historical data and should not be considered indicative of future stockholder returns.
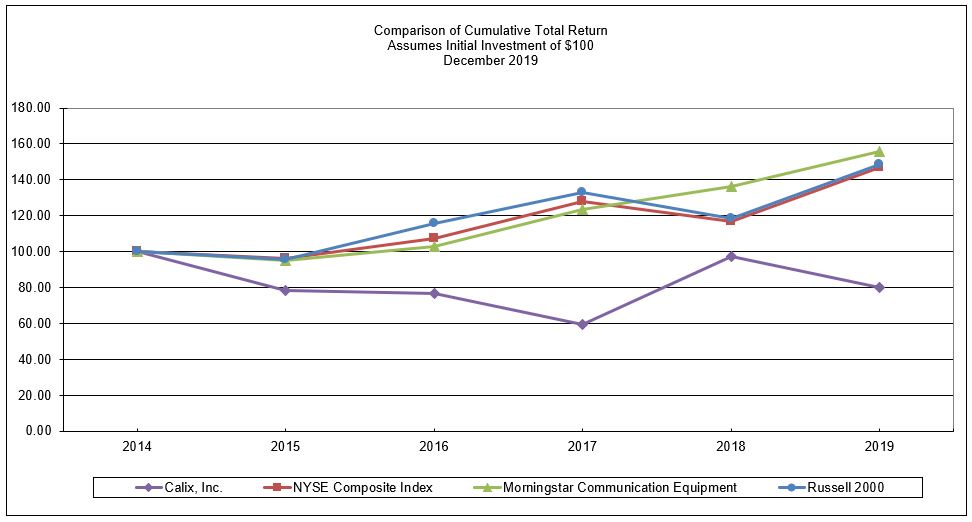
This performance graph shall not be deemed “soliciting material” or to be “filed” with the SEC for purposes of Section 18 of the Securities Exchange Act of 1934, as amended, or otherwise subject to the liabilities under that Section, and shall not be deemed to be incorporated by reference into any filing of Calix, Inc. under the Securities Act of 1933, as amended.
43
ITEM 6. | Selected Financial Data |
The following selected consolidated financial data should be read in conjunction with our consolidated financial statements and the related notes thereto, of this Annual Report on Form 10-K, the section titled “Management’s Discussion and Analysis of Financial Condition and Results of Operations” and the other financial information and data appearing elsewhere in this Annual Report on Form 10-K. The selected financial data included in this section is not intended to replace and is not a substitute for, the consolidated financial statements and related notes in this Annual Report on Form 10-K.
We derived the statements of operations data for the years ended December 31, 2019, 2018 and 2017 and the balance sheet data as of December 31, 2019 and 2018 from our audited consolidated financial statements and related notes thereto of this Annual Report on Form 10-K. We derived the statements of operations data for the years ended December 31, 2016 and 2015 and the balance sheet data as of December 31, 2017, 2016 and 2015 from our audited consolidated financial statements and related notes which are not included in this Annual Report on Form 10-K. Historical results for any prior period are not necessarily indicative of future results for any period.
Years Ended December 31, | ||||||||||||||||||||
2019 | 2018 | 2017 | 2016 | 2015 | ||||||||||||||||
(In thousands, except per share data) | ||||||||||||||||||||
Statement of Operations Data: | ||||||||||||||||||||
Revenue | $ | 424,330 | $ | 441,320 | $ | 510,367 | $ | 458,787 | $ | 407,163 | ||||||||||
Cost of revenue (1) | 236,405 | 243,938 | 337,477 | 257,569 | 217,034 | |||||||||||||||
Gross profit | 187,925 | 197,382 | 172,890 | 201,218 | 190,129 | |||||||||||||||
Operating expenses: | ||||||||||||||||||||
Research and development (1) | 81,184 | 89,963 | 127,541 | 106,869 | 89,714 | |||||||||||||||
Sales and marketing (1) | 82,553 | 86,432 | 82,781 | 83,675 | 78,563 | |||||||||||||||
General and administrative (1) | 37,115 | 40,500 | 39,875 | 41,592 | 38,454 | |||||||||||||||
Loss on asset retirement | 2,474 | — | — | — | — | |||||||||||||||
Restructuring charges | — | 5,705 | 4,249 | — | — | |||||||||||||||
Gain on sale of product line | — | (6,704 | ) | — | — | — | ||||||||||||||
Amortization of intangible assets | — | — | — | 1,701 | 10,208 | |||||||||||||||
Litigation settlement gain | — | — | — | (4,500 | ) | — | ||||||||||||||
Total operating expenses | 203,326 | 215,896 | 254,446 | 229,337 | 216,939 | |||||||||||||||
Loss from operations | (15,401 | ) | (18,514 | ) | (81,556 | ) | (28,119 | ) | (26,810 | ) | ||||||||||
Interest and other income (expense), net | (1,131 | ) | (254 | ) | (233 | ) | 1,064 | 712 | ||||||||||||
Loss before provision for income taxes | (16,532 | ) | (18,768 | ) | (81,789 | ) | (27,055 | ) | (26,098 | ) | ||||||||||
Provision for income taxes | 1,162 | 530 | 1,243 | 347 | 535 | |||||||||||||||
Net loss | $ | (17,694 | ) | $ | (19,298 | ) | $ | (83,032 | ) | $ | (27,402 | ) | $ | (26,633 | ) | |||||
Net loss per common share: | ||||||||||||||||||||
Basic and diluted | $ | (0.32 | ) | $ | (0.37 | ) | $ | (1.66 | ) | $ | (0.56 | ) | $ | (0.52 | ) | |||||
Weighted-average number of shares used to compute net loss per common share: | ||||||||||||||||||||
Basic and diluted | 54,993 | 52,609 | 50,155 | 48,730 | 51,489 | |||||||||||||||
(1) Includes stock-based compensation as follows: | ||||||||||||||||||||
Cost of revenue | $ | 896 | $ | 1,248 | $ | 749 | $ | 672 | $ | 709 | ||||||||||
Research and development | 3,913 | 5,969 | 4,869 | 5,125 | 4,797 | |||||||||||||||
Sales and marketing | 3,415 | 5,787 | 3,433 | 4,586 | 4,712 | |||||||||||||||
General and administrative | 2,957 | 4,469 | 3,317 | 3,902 | 3,587 | |||||||||||||||
$ | 11,181 | $ | 17,473 | $ | 12,368 | $ | 14,285 | $ | 13,805 | |||||||||||
44
December 31, | ||||||||||||||||||||
2019 | 2018 | 2017 | 2016 | 2015 | ||||||||||||||||
(In thousands) | ||||||||||||||||||||
Balance Sheet Data: | ||||||||||||||||||||
Cash, cash equivalents, restricted cash and marketable securities | $ | 47,457 | $ | 50,274 | $ | 39,775 | $ | 78,107 | $ | 73,590 | ||||||||||
Working capital | 28,324 | 31,079 | 34,123 | 97,926 | 115,561 | |||||||||||||||
Total assets | 316,823 | 317,080 | 295,070 | 355,475 | 323,886 | |||||||||||||||
Common stock and additional paid-in capital | 897,444 | 877,555 | 852,475 | 837,931 | 820,080 | |||||||||||||||
Total stockholders’ equity | 154,028 | 151,934 | 144,963 | 212,964 | 235,785 | |||||||||||||||
ITEM 7. | Management’s Discussion and Analysis of Financial Condition and Results of Operations |
The Management’s Discussion and Analysis of Financial Condition and Results of Operations contains forward-looking statements regarding future events and our future results that are subject to the safe harbors created under the Securities Act of 1933 (the “Securities Act”) and the Securities Exchange Act of 1934 (the “Exchange Act”). All statements other than statements of historical facts are statements that could be deemed forward-looking statements. These statements are based on current expectations, estimates, forecasts and projections about the industry in which we operate and the beliefs and assumptions of our management. In some cases, forward-looking statements can be identified by the use of words such as “believe,” “could,” “expect,” “may,” “estimate,” “continue,” “anticipate,” “intend,” “should,” “plan,” “predict,” “will,” “would,” “project,” “potential,” or the negative thereof or other comparable terminology. In addition, any statements that refer to projections of our future financial performance, our anticipated growth and trends in our business and industry and other characterizations of future events or circumstances are forward-looking statements. Readers are cautioned that these forward-looking statements are only predictions and are subject to risks, uncertainties and assumptions that are difficult to predict, including those identified in the Risk Factors discussed in Item 1A, in the discussion below, as well as in other sections of this Annual Report on Form 10-K. Therefore, actual results may differ materially and adversely from those expressed in any forward-looking statements. All forward-looking statements and reasons why results may differ included in this report are made as of the date hereof, and we assume no obligation to update these forward-looking statements or reasons why actual results might differ.
Overview
We are a leading global provider of cloud and software platforms, systems and services for fiber- and copper-based network architectures and a pioneer in software defined access and cloud products focused on access networks and the subscriber. Our portfolio allows for a broad range of subscriber services to be provisioned and delivered over a single unified network. Our access systems can deliver voice and data services, advanced broadband services, mobile broadband, as well as high-definition video and online gaming. Our most recent generation of premises systems enable CSPs to address the complexity of the smart home and business and offer new services to their device enabled subscribers. We have designed all of our current platforms and related systems so that they can be monitored, analyzed, managed and supported by Calix Cloud.
We market our cloud and software platforms, systems and services to CSPs globally through our direct sales force as well as select resellers. Our customers range from smaller, regional CSPs to some of the world’s largest CSPs. We have enabled approximately 1,600 customers to deploy passive optical, Active Ethernet and point-to-point Ethernet fiber access networks.
In the third quarter of 2018, the United States enacted 10% tariffs on certain goods manufactured in China and increased these tariffs to 25% in May 2019. In September 2019, the United States imposed a new 15% tariff covering a broader list of products manufactured in China. As a result of these tariffs, we incurred U.S. tariff and tariff-related costs of $3.2 million in 2018 and $6.2 million in 2019. In order to mitigate the impact of the tariffs enacted by the United States, we undertook a broad plan to realign our global supply chain by moving substantially all of our production outside of China in addition to other supply chain improvements in the first half of 2019. As a result of the tariffs imposed in September 2019 covering a broader list of products, we have expanded the scope of our global supply chain realignment plan, which is expected to take until mid-2020 to complete.
Our revenue decreased to $424.3 million in 2019 from $441.3 million in 2018 and $510.4 million in 2017. The decrease in revenue from 2018 to 2019 was primarily due to lower revenue from our legacy incumbent local exchange carrier, or ILEC, customers as well as CenturyLink as they continued to reduce capital investments in response to broadband subscriber losses. Our revenue and potential revenue growth will depend on our ability to sell and license our cloud and software platforms, systems and services to strategically aligned customers, including from market segments such as cable MSOs, WISPs, fiber overbuilders, municipalities and electric cooperatives, in the United States and internationally.
Revenue fluctuations result from many factors, including, but not limited to: increases or decreases in customer orders for our products and services, market, financial or other factors that may delay or materially impact customer purchasing decisions,
45
non-availability of products due to supply chain challenges, including disruptions from the recent coronavirus outbreak in China, contractual terms with customers that result in delayed revenue recognition and varying budget cycles and seasonal buying patterns of our customers. More specifically, our customers tend to spend less in the first quarter as they are finalizing their annual budgets, and in certain regions, customers are challenged by winter weather conditions that inhibit fiber deployment in outside infrastructure. Our revenue is also dependent upon our customers’ timing of purchases, capital expenditure plans and decisions to upgrade their network or adopt new technologies, including adoption of our software and cloud platform solutions, as well as our ability to grow our customer base.
Cost of revenue is strongly correlated to revenue and tends to fluctuate due to all of the above factors that may cause revenue fluctuations. Factors that impacted our cost of revenue for the year ended December 31, 2019, and that we expect will impact cost of revenue in future periods, also include: changes in the mix of products delivered, customer location and regional mix, changes in product warranty and incurrence of retrofit costs, changes in the cost of our inventory, including higher costs due to materials shortages including components, supply constraints or unfavorable changes in trade policies, investments to support expansion of cloud and customer support offerings, tariffs and associated costs to mitigate the impact of tariffs, amortization of intangibles, asset write-offs, silicon support fees and inventory write-downs. Cost of revenue also includes fixed expenses related to our internal operations, which could increase our cost of revenue as a percentage of revenue if there are declines in revenue.
Our gross profit and gross margin fluctuate based on timing of factors such as new product introductions or upgrades to existing products, changes in customer mix and changes in the mix of products demanded and sold (and any related write-downs of existing inventory) and have in the past been negatively impacted by increases in mix of revenue towards professional services, increases in mix of revenue from channel sales rather than direct sales or other unfavorable customer or product mix, shipment volumes and any related volume discounts, changes in our product and services costs, pricing decreases or discounts, customer rebates and incentive programs due to competitive pressure or materials shortages, supply constraints, investments to support expansion of cloud and customer support offerings, tariffs or unfavorable changes in trade policies.
Our operating expenses fluctuate based on the following factors among others: changes in headcount and personnel costs, which comprise a significant portion of our operating expenses; variable compensation due to fluctuations in shipment volumes or level of achievement against performance targets; timing of research and development expenses, including investments in innovative solutions and new customer segments, prototype builds and outsourced development resources; asset write-offs; investments in our business and information technology infrastructure; and fluctuations in stock-based compensation expenses due to timing of equity grants or other factors affecting vesting. For the year ended December 31, 2019 as compared to 2018, our total operating expenses for research and development, sales and marketing and general and administrative decreased by $16.0 million, largely due to restructuring actions we took in 2017 and early 2018. These restructuring actions were completed in the second quarter of 2018.
Our net loss was $17.7 million in 2019, $19.3 million in 2018 and $83.0 million in 2017. Since our inception, we have incurred significant losses, and as of December 31, 2019, we had an accumulated deficit of $702.6 million. Further, as a result of factors contributing to the fluctuations described above among other factors, many of which are outside our control, our operating results fluctuate from period to period. Comparing our operating results on a period-to-period basis may not be meaningful, and you should not rely on our past results as an indication of our future performance.
Critical Accounting Policies and Estimates
Our financial statements are prepared in accordance with U.S. GAAP. These accounting principles require us to make certain estimates and judgments that can affect the reported amounts of assets and liabilities as of the date of the financial statements, as well as the reported amounts of revenue and expenses during the periods presented. We base our estimates, assumptions and judgments on historical experience and on various other factors that are believed to be reasonable under the circumstances. To the extent there are material differences between these estimates and actual results, our financial statements may be affected. We evaluate our estimates, assumptions and judgments on an ongoing basis.
We believe the following critical accounting policies affect our significant judgments and estimates used in the preparation of our financial statements.
Revenue Recognition
We derive revenue from contracts with customers primarily from the following and categorize our revenue as follows:
• | Systems include revenue from the sale of access and premises systems, software platform licenses and cloud-based software subscriptions. |
• | Services include revenue from professional services, customer support, software- and cloud-based maintenance, extended warranty subscriptions, training and managed services. |
46
Revenue is recognized when a performance obligation is satisfied, which occurs when control of the promised goods or services is transferred to the customer, in an amount that reflects the consideration we expect to be entitled to in exchange for those goods or services. Specifically, revenue from software platform licenses, which provides the customer with a right to use the software as it exists, is generally recognized upfront when made available to the customer. Revenue from cloud-based software subscriptions, customer support, maintenance, extended warranty subscriptions and managed services is generally recognized ratably over the contract term. Revenue from professional services and training is recognized as the services are completed.
A performance obligation is a promise in a contract to transfer a distinct good or service to the customer and is the unit of account. A contract’s transaction price is allocated to each distinct performance obligation and recognized as revenue when, or as, the performance obligation is satisfied. Our hardware products contain both software and non-software components that function together to deliver the products’ essential functionality and therefore constitutes a single performance obligation as the promise to transfer the individual software and non-software components is not separately identifiable and, therefore, not distinct. Our contracts may include multiple performance obligations. For such arrangements, we allocate the contract’s transaction price to each performance obligation using the relative stand-alone selling price of each distinct good or service in the contract. We generally determine stand-alone selling prices based on the prices charged to customers or our best estimate of stand-alone selling price. Our estimate of stand-alone selling price is established considering multiple factors including, but not limited to, geographies, market conditions, competitive landscape, internal costs, gross margin objectives, characteristics of targeted customers and pricing practices. The determination of estimated stand-alone selling price is made through consultation with and formal approval by management, taking into consideration the go-to-market strategy.
For certain revenue arrangements involving delivery of both systems and professional services, each is considered a distinct performance obligation. Systems revenue is recognized at a point in time when management has determined that control over systems has transferred to the customer, which is generally when legal title has transferred to the customer. For the same revenue arrangements, management believes that the output of the associated professional services is transferred to the customer over time. As such, professional services revenue is recognized over the period in which the services are provided using a cost input measure. We recognize revenue when control of the systems and services has been transferred to the customer, which may be earlier than system installation or customer acceptance, in accordance with the agreed-upon specifications in the contract.
Inventory Valuation
Inventory, which primarily consists of finished goods purchased from CMs or ODMs, is stated at the lower of cost (determined by the first-in, first-out method) and net realizable value. Inbound shipping costs and tariffs are included in the cost of inventory. In addition, we, from time to time, procure component inventory primarily as a result of manufacturing discontinuation of critical components by suppliers. We regularly monitor inventory quantities on-hand and record write-downs for excess and obsolete inventory based on our estimate of demand for our products, potential obsolescence of technology, product life cycle and whether pricing trends or forecasts indicate that the carrying value of inventory exceeds our estimated selling price. These factors are impacted by market and economic conditions, technology changes and new product introductions and require estimates that may include elements that are uncertain. Actual demand may differ from forecasted demand and may have a material effect on gross profit. If inventory is written down, a new cost basis is established that cannot be increased in future periods. The sale of previously reserved inventory has not had a material impact on our gross margin.
Recent Accounting Pronouncements Not Yet Adopted
There have been no additional accounting pronouncements or changes in accounting pronouncements that are significant or potentially significant to us.
Results of Operations for Years Ended December 31, 2019, 2018 and 2017
Revenue
Our revenue is comprised of the following:
• | Systems – includes revenue from the sale of access and premises systems, software platform licenses and cloud-based software subscriptions. |
• | Services – includes revenue from professional services, customer support, software- and cloud-based maintenance, extended warranty subscriptions, training and managed services. |
47
The following table sets forth our revenue (dollars in thousands):
Years Ended December 31, | 2019 vs 2018 Change | 2018 vs 2017 Change | |||||||||||||||||||||||
2019 | 2018 | 2017 | $ | % | $ | % | |||||||||||||||||||
Revenue: | |||||||||||||||||||||||||
Systems | $ | 393,231 | $ | 405,923 | $ | 421,890 | $ | (12,692 | ) | (3 | )% | $ | (15,967 | ) | (4 | )% | |||||||||
Services | 31,099 | 35,397 | 88,477 | (4,298 | ) | (12 | )% | (53,080 | ) | (60 | )% | ||||||||||||||
$ | 424,330 | $ | 441,320 | $ | 510,367 | $ | (16,990 | ) | (4 | )% | $ | (69,047 | ) | (14 | )% | ||||||||||
Percent of total revenue: | |||||||||||||||||||||||||
Systems | 93 | % | 92 | % | 83 | % | |||||||||||||||||||
Services | 7 | % | 8 | % | 17 | % | |||||||||||||||||||
100 | % | 100 | % | 100 | % | ||||||||||||||||||||
Our revenue is principally derived in the United States. Revenue generated in the United States represented approximately 86% of our total revenue in 2019, 88% in 2018 and 89% in 2017.
The decrease in revenue during 2019 compared with 2018 was due to lower systems revenue of $12.7 million and lower services revenue of $4.3 million. The decline in systems revenue was primarily due to reduced demand from CenturyLink, Frontier and our medium-sized ILEC customer base partially offset by growth in our small-sized customers as we continued to see strong demand for our software and cloud platform offerings and the addition of new customers. The decrease in services revenue was primarily due to lower volume of deployment services associated with CAF-funded customer deployments.
CenturyLink accounted for more than 10% of our total revenue in 2019, 2018 and 2017. See Note 12 “Revenue from Contracts with Customers” to the Consolidated Financial Statements set forth in this report for more details on concentration of revenue for the periods presented.
Cost of Revenue, Gross Profit and Gross Margin
The following table sets forth our cost of revenue (dollars in thousands):
Years Ended December 31, | 2019 vs 2018 Change | 2018 vs 2017 Change | |||||||||||||||||||||||
2019 | 2018 | 2017 | $ | % | $ | % | |||||||||||||||||||
Cost of revenue: | |||||||||||||||||||||||||
Systems | $ | 211,309 | $ | 216,529 | $ | 236,137 | $ | (5,220 | ) | (2 | )% | $ | (19,608 | ) | (8 | )% | |||||||||
Services | 25,096 | 27,409 | 101,340 | (2,313 | ) | (8 | )% | (73,931 | ) | (73 | )% | ||||||||||||||
$ | 236,405 | $ | 243,938 | $ | 337,477 | $ | (7,533 | ) | (3 | )% | $ | (93,539 | ) | (28 | )% | ||||||||||
The decrease in cost of revenue of $7.5 million during 2019 as compared with 2018 was primarily attributable to lower revenue for 2019 as compared with 2018 mainly due to the reduced demand from CenturyLink as well as our medium-sized ILEC customer base. Partially offsetting the decrease in systems cost of revenue was an increase in U.S. tariff and tariff-related costs of $3.0 million in 2019.
The following table sets forth our gross profit and gross margin (dollars in thousands):
Years Ended December 31, | 2019 vs 2018 Change | 2018 vs 2017 Change | |||||||||||||||||||||||
2019 | 2018 | 2017 | $ | % | $ | % | |||||||||||||||||||
Gross profit: | |||||||||||||||||||||||||
Systems | $ | 181,922 | $ | 189,394 | $ | 185,753 | $ | (7,472 | ) | (4 | )% | $ | 3,641 | 2 | % | ||||||||||
Services | 6,003 | 7,988 | (12,863 | ) | (1,985 | ) | (25 | )% | 20,851 | (162 | )% | ||||||||||||||
$ | 187,925 | $ | 197,382 | $ | 172,890 | $ | (9,457 | ) | (5 | )% | $ | 24,492 | 14 | % | |||||||||||
Gross margin: | |||||||||||||||||||||||||
Systems | 46.3 | % | 46.7 | % | 44.0 | % | |||||||||||||||||||
Services | 19.3 | % | 22.6 | % | (14.5 | ) | % | ||||||||||||||||||
44.3 | % | 44.7 | % | 33.9 | % | ||||||||||||||||||||
Gross profit decreased by $9.5 million to $187.9 million during 2019 from $197.4 million during 2018. Gross margin decreased to 44.3% during 2019 from 44.7% during 2018. During 2019 and 2018, systems gross margin was negatively impacted by U.S. tariff and tariff-related costs of $6.2 million and $3.2 million, or 160 and 70 basis points, respectively. Excluding the impact of U.S. tariff and tariff-related costs, systems gross margin was 47.9% and 47.4% for 2019 and 2018, respectively. This 50 basis
48
point improvement was mainly due to an increasing mix of our all-platform offerings that have higher gross margin than some of our older traditional systems.
Services gross margin decreased in 2019 primarily due to higher investments in customer success and support personnel to support the expansion of our various services offerings.
Operating Expenses
Research and Development Expenses
Research and development expenses include personnel costs, outside contractor and consulting services, depreciation on lab equipment, costs of prototypes and overhead allocations. The following table sets forth our research and development expenses (dollars in thousands):
Years Ended December 31, | 2019 vs 2018 Change | 2018 vs 2017 Change | |||||||||||||||||||||||
2019 | 2018 | 2017 | $ | % | $ | % | |||||||||||||||||||
Research and development | $ | 81,184 | $ | 89,963 | $ | 127,541 | $ | (8,779 | ) | (10 | )% | $ | (37,578 | ) | (29 | )% | |||||||||
Percent of total revenue | 19 | % | 20 | % | 25 | % | |||||||||||||||||||
The decrease in research and development expenses during 2019 compared with 2018 was primarily due to lower compensation and employee benefits costs of $4.9 million, mainly due to restructuring activities during 2017 and the first quarter of 2018, lower stock-based compensation of $2.1 million and lower outside services of $1.8 million.
We expect our investments in research and development will be relatively consistent in absolute dollars from our current post-restructuring levels over the near term.
Sales and Marketing Expenses
Sales and marketing expenses consist of personnel costs, employee sales commissions, marketing programs and events, software tools and travel-related expenses. The following table sets forth our sales and marketing expenses (dollars in thousands):
Years Ended December 31, | 2019 vs 2018 Change | 2018 vs 2017 Change | |||||||||||||||||||||||
2019 | 2018 | 2017 | $ | % | $ | % | |||||||||||||||||||
Sales and marketing | $ | 82,553 | $ | 86,432 | $ | 82,781 | $ | (3,879 | ) | (4 | )% | $ | 3,651 | 4 | % | ||||||||||
Percent of total revenue | 19 | % | 20 | % | 16 | % | |||||||||||||||||||
Sales and marketing expenses decreased by $3.9 million during 2019 compared with 2018 primarily due to lower personnel costs of $2.2 million, including commissions which decreased as a result of lower sales, and lower stock-based compensation of $2.4 million. The decrease was also due to lower facility expenses of $0.5 million, offset by higher marketing costs of $1.5 million mainly due to increased investment in our smart, connected home and business marketing programs.
We expect to increase our investments in sales and marketing in absolute dollars in order to extend our market reach and grow our business in support of our key strategic initiatives.
General and Administrative Expenses
General and administrative expenses consist primarily of personnel costs related to our executive, finance, human resources, information technology and legal organizations, outside consulting services, insurance, allocated facilities and fees for professional services. Professional services consist of outside audit, legal, accounting and tax services. The following table sets forth our general and administrative expenses (dollars in thousands):
Years Ended December 31, | 2019 vs 2018 Change | 2018 vs 2017 Change | |||||||||||||||||||||||
2019 | 2018 | 2017 | $ | % | $ | % | |||||||||||||||||||
General and administrative | $ | 37,115 | $ | 40,500 | $ | 39,875 | $ | (3,385 | ) | (8 | )% | $ | 625 | 2 | % | ||||||||||
Percent of total revenue | 9 | % | 9 | % | 8 | % | |||||||||||||||||||
The decrease in general and administrative expenses of $3.4 million during 2019 compared with 2018 was primarily due to a decrease in consulting expenses of $3.3 million and stock compensation of $1.5 million. These decreases were partially offset by higher local taxes of $0.4 million, higher office expenses of $0.3 million and higher personnel costs of $0.2 million. This decrease in consulting expense was largely a result of our adoption of a new accounting standard in the fourth quarter of 2018, which requires capitalization of certain implementation costs, including consulting and internal personnel expenses, related to our project to migrate our on-premise ERP system to a cloud model. We capitalized internal personnel expenses of $1.8 million
49
in 2019 compared to $0.4 million in 2018 related to our new ERP implementation. In January 2020, we commenced using our cloud-based ERP system and began amortizing the capitalized implementation costs over a period of five years.
Our general and administrative expenses will initially increase in 2020 in absolute dollars as a result of our ERP system being placed in service but are expected to decrease as a percentage of revenue over time.
Loss on Asset Retirement
During 2019, we recognized a charge of $2.5 million relating to the retirement of an asset consisting of licensed software. Please refer to Note 4 “Balance Sheet Details” of the Notes to Consolidated Financial Statements included in this Annual Report on Form 10-K.
Restructuring Charges
We adopted a restructuring plan in March 2017. This restructuring plan realigned our business, increasing our focus towards investments in software platforms and cloud products, while reducing our expense structure in the traditional systems business. We began to take actions under this plan beginning in March 2017 and recognized $4.2 million of restructuring charges during 2017, consisting of severance and other one-time termination benefits. Actions pursuant to this restructuring plan were complete as of December 31, 2017.
In the first quarter of 2018, we established a new restructuring plan to further realign our business resources based on the production releases of our platform offerings. We incurred restructuring charges of $5.7 million during 2018, consisting primarily of severance and other termination related benefits. Actions pursuant to this restructuring plan were complete as of June 30, 2018.
Gain on Sale of Product Line
During 2018, we recognized a gain of $6.7 million relating to the sale of our outdoor cabinet product line to Clearfield, Inc. for $10.4 million.
Interest and Other Income (Expense), Net
The following table sets forth our interest and other income (expense), net (dollars in thousands):
Years Ended December 31, | 2019 vs 2018 Change | 2018 vs 2017 Change | |||||||||||||||||||||||
2019 | 2018 | 2017 | $ | % | $ | % | |||||||||||||||||||
Interest and other income (expense), net | $ | (1,131 | ) | $ | (254 | ) | $ | (233 | ) | $ | (877 | ) | 345 | % | $ | (21 | ) | 9 | % | ||||||
Interest and other income (expense) increased by $0.9 million in 2019, compared with 2018, mainly due to higher interest expense related to new financing agreements and reduced foreign currency transaction gains in 2019 as compared to 2018.
Provision for Income Taxes
The provision for income taxes primarily consist of state and foreign income taxes. The following table sets forth our provision for income taxes (dollars in thousands):
Years Ended December 31, | 2019 vs 2018 Change | 2018 vs 2017 Change | |||||||||||||||||||||||
2019 | 2018 | 2017 | $ | % | $ | % | |||||||||||||||||||
Provision for income taxes | $ | 1,162 | $ | 530 | $ | 1,243 | $ | 632 | 119 | % | $ | (713 | ) | (57 | )% | ||||||||||
Effective tax rate | (7.0 | )% | (2.8 | )% | (1.5 | )% | |||||||||||||||||||
The provision for income taxes increased by $0.6 million from $0.5 million in 2018 to $1.2 million in 2019. The increase was primarily due to a provision for foreign withholding taxes on the repatriation of cash from our foreign subsidiaries.
On December 22, 2017, the U.S. government enacted comprehensive tax legislation commonly referred to as the “Tax Cuts and Jobs Act”, or the Tax Act. The significant impacts from the Tax Act include a net, one-time transition tax of $1.1 million on unrepatriated earnings of foreign subsidiaries, which was offset by our current net operating loss, and a tax expense of $84.4 million related to the revaluation of our deferred tax assets and liabilities due to the reduction of the U.S. corporate tax rate from 34% to 21%, which was offset by a reduction in our valuation allowance.
As of December 31, 2019, we had unrecognized tax benefits of $22.3 million, none of which would affect our effective tax rate if recognized.
50
2018 Compared to 2017
For a comparison of our results of operations for the years ended December 31, 2018 and 2017, see Item 7 “Management’s Discussion and Analysis of Financial Condition and Results of Operations” of our Annual Report on Form 10-K for the year ended December 31, 2018, filed with the SEC on March 1, 2019.
Liquidity and Capital Resources
We have funded our operations and investing activities primarily through cash generated from operations, borrowings on our line of credit, financing arrangements for certain lab equipment and consulting services for our ERP migration and sales of our common stock. As of December 31, 2019, we had cash and cash equivalents of $46.8 million, which consisted of deposits held at banks and money market mutual funds held at major financial institutions. This includes $2.4 million of cash primarily held by our China subsidiary. As of December 31, 2019, our liability for taxes that would be payable as a result of repatriation of undistributed earnings of our foreign subsidiaries to the United States was not significant and limited to withholding taxes considering our existing net operating loss carryovers.
The following table presents the cash inflows and outflows by activity during 2019, 2018 and 2017 (in thousands):
Years Ended December 31, | ||||||||||||
2019 | 2018 | 2017 | ||||||||||
Net cash provided by (used in) operating activities | $ | 4,654 | $ | 3,560 | $ | (62,772 | ) | |||||
Net cash provided by (used in) investing activities | (13,353 | ) | (76 | ) | 19,734 | |||||||
Net cash provided by financing activities | 5,971 | 7,492 | 31,990 | |||||||||
Operating Activities
Our operating activities provided cash of $4.7 million in 2019, provided cash of $3.6 million in 2018 and used cash of $62.8 million in 2017. The increase in net cash provided by operating activities during 2019 as compared to 2018 was due primarily to a favorable change in our net operating results of $5.5 million after adjustment of non-cash charges partially offset by a $4.4 million net cash outflow resulting from changes in operating assets and liabilities.
In 2019, cash inflows from changes in operating assets and liabilities primarily consisted of a decrease in accounts receivable of $20.5 million, mainly due to increased linearity of shipments during 2019 resulting in higher collections during the year, a decrease in inventory of $10.0 million, primarily due to the consumption of transferred raw material inventory as we transitioned our supply chain, and an increase in deferred revenue of $2.4 million due to increased support contracts, software maintenance and Calix Cloud subscriptions. Cash outflows from changes in operating assets and liabilities primarily consisted of a decrease in accounts payable of $29.4 million, primarily due to timing of inventory purchases, a decrease in other long-term liabilities of $3.4 million, mainly due to operating lease liability amortization, and a decrease in accrued liabilities of $1.8 million, mainly related to incentive compensation payments to employees. Non-cash charges primarily consisted of stock-based compensation of $11.2 million, depreciation and amortization of $10.3 million and loss on asset retirements of $2.6 million.
Investing Activities
In 2019, net cash used in investing activities consisted of capital expenditures of $13.4 million for purchases of test equipment, computer equipment and furniture and fixtures.
Financing Activities
In 2019, net cash provided by financing activities of $6.0 million primarily consisted of proceeds from the issuance of common stock under our employee stock purchase plans of $8.4 million and from stock option exercises of $0.4 million. This was partially offset by payments related to financing arrangements of $2.7 million.
2018 Compared to 2017
For a discussion of our liquidity and capital resources and our cash flow activities for the years ended December 31, 2018 and 2017, see Item 7 “Management’s Discussion and Analysis of Financial Condition and Results of Operations”, of our Annual Report on Form 10-K for the year ended December 31, 2018, filed with the SEC on March 1, 2019.
Working Capital and Capital Expenditure Needs
Our material cash commitments include contractual obligations under our BofA Loan Agreement, obligations from financing arrangements, minimum revenue-share obligations, normal recurring trade payables, compensation-related and expense accruals, operating leases and non-cancelable firm purchase commitments. We believe that our outsourced approach to manufacturing provides us significant flexibility in both managing inventory levels and financing our inventory. In the event
51
that our revenue plan does not meet our expectations, we may be required to eliminate or curtail expenditures to mitigate the impact on our working capital.
In August 2017, we entered into the SVB Loan Agreement, which provides for a revolving credit facility of up to $30.0 million based on a customary accounts receivable borrowing base, subject to certain exceptions for accounts originating outside the United States and certain specific accounts, which could reduce the amount available to us under the credit facility. The SVB Loan Agreement includes affirmative and negative covenants and requires us to maintain a liquidity ratio at minimum levels specified in the SVB Loan Agreement. For the month ended November 30, 2017, we were not able to maintain the minimum Adjusted Quick Ratio, or AQR (as defined in the SVB Loan Agreement, as amended) at the level required in the SVB Loan Agreement, which constituted an event of default. Although SVB waived this event of default effective as of November 30, 2017 and, therefore, this default did not change our ability to borrow under the SVB Loan Agreement, we were required to amend certain covenants under the SVB Loan Agreement.
In February 2018, we entered into an amendment to the SVB Loan Agreement that, among other things, amended certain affirmative financial covenants, including reductions to the required minimum level of the AQR and the inclusion of an additional financial covenant related to the maintenance of Adjusted EBITDA (as defined in the SVB Loan Agreement, as amended). In August 2018, we entered into a second amendment to the SVB Loan Agreement that, among other things, extended the maturity date from August 7, 2019 to August 7, 2020, amended certain financial covenants, including covenants with respect to the AQR and Adjusted EBITDA, and changed the compliance requirements for the AQR covenant from a monthly basis to a quarterly basis. In February 2019, we entered into a third amendment to the SVB Loan Agreement to reduce the required minimum level of the AQR for the first half of 2019 and the required minimum Adjusted EBITDA for the first fiscal quarter of 2019 to accommodate the increased costs and use of cash that we anticipate for the first half of 2019 related to activities to mitigate the impact of the U.S. tariffs. As of September 28, 2019 and December 31, 2019, we were not able to maintain the minimum AQR at the level required in the SVB Loan Agreement, which constituted events of default. SVB waived these events of default effective as of September 28, 2019 and December 31, 2019, respectively, therefore, these defaults did not change our ability to borrow under the SVB Loan Agreement. In January 2020, we repaid outstanding borrowings and terminated the SVB Loan Agreement and entered into the BofA Loan Agreement. The BofA Loan Agreement requires us to maintain Availability (as defined in the BofA Loan Agreement) of at least $5.0 million among other requirements and borrowing base restrictions. The availability of borrowings under the BofA Loan Agreement is subject to certain conditions and requirements, including among others, if at any time our Availability (as defined in the BofA Loan Agreement) is less than $5.0 million, we must maintain a minimum fixed charge coverage ratio, or FCCR, (as defined in the BofA Loan Agreement) of 1.0 to 1.0. We believe the BofA Loan Agreement is structured to better support our business. Given our current financial position and history of operating losses, it is possible that we may fail the requirement to maintain Availability greater than $5.0 million in a future period.
As of December 31, 2019, we borrowed the full principal amount under the SVB line of credit of $30.0 million. Please refer to Note 5 “Credit Agreements” and Note 15 “Subsequent Event” of the Notes to Consolidated Financial Statements included in this Annual Report on Form 10-K for more details on the SVB Loan Agreement and the BofA Loan Agreement.
During 2018, we entered into financing arrangements to purchase lab equipment for approximately $5.1 million. Each agreement is to be paid over 36 months with a weighted average interest rate of 6.2%. As of December 31, 2019, we had $2.9 million outstanding under these financing arrangements.
During 2017, 2018 and 2019, in connection with our ERP implementation, we entered into financing arrangements for consulting services of $5.4 million. The current amounts due under this agreement are to be paid over a weighted average term of 2.4 years with a weighted average interest rate of 6.5%. As of December 31, 2019, there was $2.1 million outstanding under this arrangement.
In March 2018, we entered into an agreement with a vendor to develop a software product and related enhancements pursuant to which we will become obligated, if the delivered software product and related enhancements meet our technical requirements for commercial sale, to make minimum revenue-share payments of $15.8 million over the subsequent three years. The payments are based on a revenue-share rate applied to revenue from the developed product and corresponding hardware sales subject to a minimum and a maximum aggregate amount over the three-year sales period. We had our first sale in August 2019. Revenue-share payments are paid quarterly in arrears. See Note 4 “Balance Sheet Details” of the Notes to Consolidated Financial Statements included in this Annual Report on Form 10-K.
We believe, based on our current operating plan and expected operating cash flows, that our existing cash and cash equivalents, along with available borrowings under our BofA Loan Agreement, will be sufficient to meet our anticipated cash needs for at least the next twelve months. Our future capital requirements will depend on many factors including our rate of revenue growth; timing of customer payments and payment terms, particularly of larger customers; the timing and extent of spending to support development efforts, particularly research and development related to growth initiatives such as our software and cloud platforms, and our ability to partner with third parties to outsource our research and development projects; our ability to
52
manage product cost, including the cost impact of the U.S. tariffs as well as our ability to continue to mitigate the cost impact through supply chain re-engineering, the possibility of additional tariffs that may impact our product costs and higher component costs associated with new technologies; our ability to implement efficiencies and maintain product margin levels; the expansion of sales and marketing activities; the success of revenue share programs; the timing of introductions and timing and rate of customer adoption of new products and enhancements to existing products; the slowdowns or declines in customer purchases of traditional systems; acquisition of new capabilities or technologies; and the continued market acceptance of our products. If we are unable to execute on our current operating plan or generate positive operating income and positive cash flows, our liquidity, results of operations and financial condition will be adversely affected and we may fail to meet the borrowing base requirements or comply with the covenants in the BofA Loan Agreement, in which case we may not be able to borrow under the BofA line of credit. We may need to seek other sources of liquidity, including the sale of equity or incremental borrowings, to support our working capital needs. In addition, we may choose to seek other sources of liquidity even if we believe we have generated sufficient cash flows to support our operational needs. There is no assurance that any other sources of liquidity may be available to us on acceptable terms or at all. If we are unable to generate sufficient cash flows or obtain other sources of liquidity, we will be forced to limit our development activities, reduce our investment in growth initiatives and institute cost-cutting measures, all of which may adversely impact our business and potential growth.
Contractual Obligations and Commitments
Our principal commitments as of December 31, 2019 consisted of our contractual obligations under the SVB Loan Agreement, financing arrangements, operating leases for office space and non-cancelable outstanding purchase obligations. The following table summarizes our contractual obligations at December 31, 2019 (in thousands):
Payments Due by Period | ||||||||||||||||||||
Total | Less Than 1 Year | 1-3 Years | 3-5 Years | More Than 5 Years | ||||||||||||||||
Line of credit, including interest (1) | $ | 31,130 | $ | 31,130 | $ | — | $ | — | $ | — | ||||||||||
Financing arrangements (2) | 21,239 | 4,244 | 16,995 | — | — | |||||||||||||||
Operating lease obligations (3) | 20,681 | 3,770 | 7,065 | 6,965 | 2,881 | |||||||||||||||
Non-cancelable purchase commitments (4) | 52,511 | 52,511 | — | — | — | |||||||||||||||
$ | 125,561 | $ | 91,655 | $ | 24,060 | $ | 6,965 | $ | 2,881 | |||||||||||
(1) Line of credit contractual obligations include projected interest payments over the term of the SVB Loan Agreement, assuming the interest rate in effect for the outstanding borrowings as of December 31, 2019 of 6.25% and payment of the borrowings on August 7, 2020, the contractual maturity date of the credit facility. See Note 5, “Credit Agreements” of the Notes to Consolidated Financial Statements included in this Annual Report on Form 10-K for further discussion regarding our contractual obligations relating to our line of credit.
(2) Represents installment payments, including interest, related to financing arrangements and estimated total minimum revenue-share obligations under the program, including imputed interest, of $15.8 million associated with developed software product and related enhancements by an engineering service provider of which approximately $12.8 million has been incurred. The schedule reflects our expected revenue-share payments based on our revenue projections for the developed products over a three-year sales period. If the minimum revenue-share payments are not achieved by the end of the three-year sales period, a true-up payment will be due. See Note 4 “Balance Sheet Details” of the Notes to Consolidated Financial Statements included in this Annual Report on Form 10-K for further discussion regarding our outstanding liability.
(3) Future minimum operating lease obligations in the table above include primarily payments for our office locations, which expire at various dates through 2025. See Note 6 “Commitments and Contingencies” of the Notes to Consolidated Financial Statements included in this Annual Report on Form 10-K for further discussion regarding our operating leases.
(4) Represents outstanding purchase commitments for inventory to be delivered by our third-party manufacturers. See Note 6 “Commitments and Contingencies” of the Notes to Consolidated Financial Statements included in this Annual Report on Form 10-K for further discussion regarding our outstanding purchase commitments.
Off-Balance Sheet Arrangements
As of December 31, 2019 and 2018, we did not have any off-balance sheet arrangements.
53
ITEM 7A. | Quantitative and Qualitative Disclosures About Market Risk |
Interest Rate Risk
The primary objectives of our investment activity are to preserve principal, provide liquidity and maximize income without significantly increasing risk. By policy, we do not enter into investments for trading or speculative purposes. As of December 31, 2019, we had cash and cash equivalents of $46.8 million, which were held primarily in cash and money market funds. Due to the nature of these money market funds, we believe that we do not have any material exposure to changes in the fair value of our cash equivalents as a result of changes in interest rates.
Our exposure to interest rate risk also relates to the amount of interest we must pay on our borrowings under our revolving credit facility pursuant to our SVB Loan Agreement. Borrowings under the SVB Loan Agreement will bear interest through maturity at a variable annual rate based upon an annual rate of either a prime rate or a LIBOR rate, plus an applicable margin between 0.5% to 1.5% for prime rate advances and between 2.0% and 3.0% for LIBOR advances based on our maintenance of an applicable liquidity ratio. As of December 31, 2019, we had $30.0 million outstanding in borrowings under the SVB Loan Agreement.
In January 2020, we terminated the SVB Loan Agreement and entered into the BofA Loan Agreement. Borrowings under the BofA Loan Agreement will bear interest through maturity at a variable annual rate based upon an annual rate of either a prime rate or a LIBOR rate, plus an applicable margin between 0.5% to 1.25% for prime rate advances and between 1.5% and 2.25% for LIBOR advances based on our FCCR.
Foreign Currency Exchange Risk
Our primary foreign currency exposures are described below.
Economic Exposure
The direct effect of foreign currency fluctuations on our sales and expenses has not been material because our sales and expenses are primarily denominated in U.S. dollars, or USD. However, we are indirectly exposed to changes in foreign currency exchange rates related to our use of foreign contract manufacturers whom we pay in USD. Increases in the local currency rates of these vendors in relation to USD could cause an increase in the price of products that we purchase. Additionally, if the USD strengthens relative to other currencies, such strengthening could have an indirect effect on our sales to the extent it raises the cost of our products to non-U.S. customers and thereby reduces demand. A weaker USD could have the opposite effect. The precise indirect effect of currency fluctuations is difficult to measure or predict because our sales are influenced by many factors in addition to the impact of such currency fluctuations.
Translation Exposure
Our sales contracts are primarily denominated in USD and, therefore, the majority of our revenue is not subject to foreign currency risk. We are directly exposed to changes in foreign exchange rates to the extent such changes affect our expenses related to our foreign assets and liabilities with our active subsidiaries in China and the United Kingdom, whose functional currencies are the Chinese Renminbi, or RMB, and British Pounds Sterling, or GBP.
Our operating expenses are incurred primarily in the United States, in China associated with our research and development operations that are maintained there and in the United Kingdom for our international sales and marketing activities. Our operating expenses are generally denominated in the functional currencies of our subsidiaries in which the operations are located.
The percentages of our operating expenses denominated in the following currencies for the indicated fiscal years were as follows:
Years Ended December 31, | |||||||||
2019 | 2018 | 2017 | |||||||
USD | 90 | % | 89 | % | 89 | % | |||
RMB | 7 | 7 | 7 | ||||||
GBP | 3 | 4 | 3 | ||||||
Other | — | — | 1 | ||||||
100 | % | 100 | % | 100 | % | ||||
If the currency exchange rates in 2019 had been the same as in 2018, our 2019 operating expenses would have decreased by approximately $0.9 million. If the U.S. dollar had appreciated or depreciated by 10% relative to RMB and GBP, our operating expenses for 2019 would have decreased or increased by approximately $1.9 million, or approximately 1%. We do not currently enter into forward exchange contracts to hedge exposure denominated in foreign currencies or any derivative
54
financial instruments. In the future, we may consider entering into hedging transactions to help mitigate our foreign currency exchange risk.
Foreign exchange rate fluctuations may also adversely impact our financial position as the assets and liabilities of our foreign operations are translated into USD in preparing our Consolidated Balance Sheets. The effect of foreign exchange rate fluctuations on our consolidated financial position for the year ended December 31, 2019 was a net translation loss of approximately $0.1 million. This loss is recognized as an adjustment to stockholders’ equity through accumulated other comprehensive loss.
Transaction Exposure
We have certain assets and liabilities, primarily receivables and accounts payable (including inter-company transactions) that are denominated in currencies other than the relevant entity’s functional currency. In certain circumstances, changes in the functional currency value of these assets and liabilities create fluctuations in our reported consolidated financial position, cash flows and results of operations. Transaction gains and losses on these foreign currency denominated assets and liabilities are recognized each period within other income (expense), net in our Consolidated Statements of Comprehensive Loss. During the year ended December 31, 2019, we recognized a net gain related to these foreign exchange assets and liabilities of approximately $0.1 million.
55
ITEM 8. | Financial Statements and Supplementary Data |
56
Report of Independent Registered Public Accounting Firm
To the Stockholders and Board of Directors
Calix, Inc.:
Opinions on the Consolidated Financial Statements and Internal Control Over Financial Reporting
We have audited the accompanying consolidated balance sheets of Calix, Inc. and subsidiaries (the Company) as of December 31, 2019 and 2018, the related consolidated statements of comprehensive loss, stockholders’ equity, and cash flows for each of the years in the three-year period ended December 31, 2019, and the related notes (collectively, the consolidated financial statements). We also have audited the Company’s internal control over financial reporting as of December 31, 2019, based on criteria established in Internal Control - Integrated Framework (2013) issued by the Committee of Sponsoring Organizations of the Treadway Commission”.
In our opinion, the consolidated financial statements referred to above present fairly, in all material respects, the financial position of the Company as of December 31, 2019 and 2018, and the results of its operations and its cash flows for each of the years in the three-year period ended December 31, 2019, in conformity with U.S. generally accepted accounting principles. Also in our opinion, the Company maintained, in all material respects, effective internal control over financial reporting as of December 31, 2019 based on criteria established in Internal Control - Integrated Framework (2013) issued by the Committee of Sponsoring Organizations of the Treadway Commission”.
Change in Accounting Principle
As discussed in Note 1 to the consolidated financial statements, the Company has changed its method of accounting for leases as of January 1, 2019 due to the adoption of Financial Accounting Standard Board (FASB) Accounting Standard Codification No. 842, Leases.
Basis for Opinions
The Company’s management is responsible for these consolidated financial statements, for maintaining effective internal control over financial reporting, and for its assessment of the effectiveness of internal control over financial reporting, included in the accompanying Management’s Report on Internal Control Over Financial Reporting under Item 9A. Our responsibility is to express an opinion on the Company’s consolidated financial statements and an opinion on the Company’s internal control over financial reporting based on our audits. We are a public accounting firm registered with the Public Company Accounting Oversight Board (United States) (PCAOB) and are required to be independent with respect to the Company in accordance with the U.S. federal securities laws and the applicable rules and regulations of the Securities and Exchange Commission and the PCAOB.
We conducted our audits in accordance with the standards of the PCAOB. Those standards require that we plan and perform the audits to obtain reasonable assurance about whether the consolidated financial statements are free of material misstatement, whether due to error or fraud, and whether effective internal control over financial reporting was maintained in all material respects.
Our audits of the consolidated financial statements included performing procedures to assess the risks of material misstatement of the consolidated financial statements, whether due to error or fraud, and performing procedures that respond to those risks. Such procedures included examining, on a test basis, evidence regarding the amounts and disclosures in the consolidated financial statements. Our audits also included evaluating the accounting principles used and significant estimates made by management, as well as evaluating the overall presentation of the consolidated financial statements. Our audit of internal control over financial reporting included obtaining an understanding of internal control over financial reporting, assessing the risk that a material weakness exists, and testing and evaluating the design and operating effectiveness of internal control based on the assessed risk. Our audits also included performing such other procedures as we considered necessary in the circumstances. We believe that our audits provide a reasonable basis for our opinions.
Definition and Limitations of Internal Control Over Financial Reporting
A company’s internal control over financial reporting is a process designed to provide reasonable assurance regarding the reliability of financial reporting and the preparation of financial statements for external purposes in accordance with generally accepted accounting principles. A company’s internal control over financial reporting includes those policies and procedures that (1) pertain to the maintenance of records that, in reasonable detail, accurately and fairly reflect the transactions and dispositions of the assets of the company; (2) provide reasonable assurance that transactions are recorded as necessary to permit preparation of financial statements in accordance with generally accepted accounting principles, and that receipts and expenditures of the company are being made only in accordance with authorizations of management and directors of the company; and (3) provide reasonable assurance regarding prevention or timely detection of unauthorized acquisition, use, or disposition of the company’s assets that could have a material effect on the financial statements.
Because of its inherent limitations, internal control over financial reporting may not prevent or detect misstatements. Also, projections of any evaluation of effectiveness to future periods are subject to the risk that controls may become inadequate because of changes in conditions, or that the degree of compliance with the policies or procedures may deteriorate.
/s/ KPMG LLP
We have served as the Company’s auditor since 2016.
San Francisco, California
February 21, 2020
57
CALIX, INC.
CONSOLIDATED BALANCE SHEETS
(In thousands, except par value)
December 31, | ||||||||
2019 | 2018 | |||||||
ASSETS | ||||||||
Current assets: | ||||||||
Cash and cash equivalents | $ | 46,829 | $ | 49,646 | ||||
Restricted cash | 628 | 628 | ||||||
Accounts receivable, net | 46,509 | 67,026 | ||||||
Inventory | 40,153 | 50,151 | ||||||
Prepaid expenses and other current assets | 9,698 | 7,306 | ||||||
Total current assets | 143,817 | 174,757 | ||||||
Property and equipment, net | 21,527 | 24,945 | ||||||
Right-of-use operating leases | 15,864 | — | ||||||
Goodwill | 116,175 | 116,175 | ||||||
Other assets | 19,440 | 1,203 | ||||||
$ | 316,823 | $ | 317,080 | |||||
LIABILITIES AND STOCKHOLDERS’ EQUITY | ||||||||
Current liabilities: | ||||||||
Accounts payable | $ | 10,789 | $ | 40,209 | ||||
Accrued liabilities | 57,546 | 57,869 | ||||||
Deferred revenue | 17,158 | 15,600 | ||||||
Line of credit | 30,000 | 30,000 | ||||||
Total current liabilities | 115,493 | 143,678 | ||||||
Long-term portion of deferred revenue | 18,340 | 17,496 | ||||||
Operating leases | 14,337 | — | ||||||
Other long-term liabilities | 14,625 | 3,972 | ||||||
Total liabilities | 162,795 | 165,146 | ||||||
Commitments and contingencies (See Note 6) | ||||||||
Stockholders’ equity: | ||||||||
Preferred stock, $0.025 par value; 5,000 shares authorized; no shares issued and outstanding as of December 31, 2019 and 2018 | — | — | ||||||
Common stock, $0.025 par value; 100,000 shares authorized; 61,778 shares issued and 56,448 shares outstanding as of December 31, 2019, and 59,285 shares issued and 53,955 shares outstanding as of December 31, 2018 | 1,545 | 1,482 | ||||||
Additional paid-in capital | 895,899 | 876,073 | ||||||
Accumulated other comprehensive loss | (854 | ) | (753 | ) | ||||
Accumulated deficit | (702,576 | ) | (684,882 | ) | ||||
Treasury stock, 5,330 shares as of December 31, 2019 and 2018 | (39,986 | ) | (39,986 | ) | ||||
Total stockholders’ equity | 154,028 | 151,934 | ||||||
$ | 316,823 | $ | 317,080 | |||||
See accompanying notes to consolidated financial statements.
58
CALIX, INC.
CONSOLIDATED STATEMENTS OF COMPREHENSIVE LOSS
(In thousands, except per share data)
Years Ended December 31, | ||||||||||||
2019 | 2018 | 2017 | ||||||||||
Revenue: | ||||||||||||
Systems | $ | 393,231 | $ | 405,923 | $ | 421,890 | ||||||
Services | 31,099 | 35,397 | 88,477 | |||||||||
Total revenue | 424,330 | 441,320 | 510,367 | |||||||||
Cost of revenue: | ||||||||||||
Systems | 211,309 | 216,529 | 236,137 | |||||||||
Services | 25,096 | 27,409 | 101,340 | |||||||||
Total cost of revenue | 236,405 | 243,938 | 337,477 | |||||||||
Gross profit | 187,925 | 197,382 | 172,890 | |||||||||
Operating expenses: | ||||||||||||
Research and development | 81,184 | 89,963 | 127,541 | |||||||||
Sales and marketing | 82,553 | 86,432 | 82,781 | |||||||||
General and administrative | 37,115 | 40,500 | 39,875 | |||||||||
Loss on asset retirement | 2,474 | — | — | |||||||||
Restructuring charges | — | 5,705 | 4,249 | |||||||||
Gain on sale of product line | — | (6,704 | ) | — | ||||||||
Total operating expenses | 203,326 | 215,896 | 254,446 | |||||||||
Loss from operations | (15,401 | ) | (18,514 | ) | (81,556 | ) | ||||||
Interest and other income (expense), net: | ||||||||||||
Interest expense, net | (958 | ) | (632 | ) | (160 | ) | ||||||
Other income (expense), net | (173 | ) | 378 | (73 | ) | |||||||
Total interest and other income (expense), net | (1,131 | ) | (254 | ) | (233 | ) | ||||||
Loss before provision for income taxes | (16,532 | ) | (18,768 | ) | (81,789 | ) | ||||||
Provision for income taxes | 1,162 | 530 | 1,243 | |||||||||
Net loss | $ | (17,694 | ) | $ | (19,298 | ) | $ | (83,032 | ) | |||
Net loss per common share: | ||||||||||||
Basic and diluted | $ | (0.32 | ) | $ | (0.37 | ) | $ | (1.66 | ) | |||
Weighted-average number of shares used to compute net loss per common share: | ||||||||||||
Basic and diluted | 54,993 | 52,609 | 50,155 | |||||||||
Net loss | $ | (17,694 | ) | $ | (19,298 | ) | $ | (83,032 | ) | |||
Other comprehensive income (loss), net of tax: | ||||||||||||
Unrealized gain on available-for-sale marketable securities, net | — | — | 6 | |||||||||
Foreign currency translation adjustments, net | (101 | ) | (584 | ) | 481 | |||||||
Total other comprehensive income (loss), net of tax | (101 | ) | (584 | ) | 487 | |||||||
Comprehensive loss | $ | (17,795 | ) | $ | (19,882 | ) | $ | (82,545 | ) | |||
See accompanying notes to consolidated financial statements.
59
CALIX, INC.
CONSOLIDATED STATEMENTS OF STOCKHOLDERS’ EQUITY
(In thousands)
Accumulated | |||||||||||||||||||||||||||
Additional | Other | Total | |||||||||||||||||||||||||
Common Stock | Paid-in | Comprehensive | Accumulated | Treasury | Stockholders’ | ||||||||||||||||||||||
Shares | Amount | Capital | Loss | Deficit | Stock | Equity | |||||||||||||||||||||
Balance as of December 31, 2016 | 49,392 | $ | 1,368 | $ | 836,563 | $ | (656 | ) | $ | (584,325 | ) | $ | (39,986 | ) | $ | 212,964 | |||||||||||
Stock-based compensation | — | — | 12,368 | — | — | — | 12,368 | ||||||||||||||||||||
Exercise of stock options | 11 | — | 62 | — | — | — | 62 | ||||||||||||||||||||
Issuance of vested performance restricted stock units and restricted stock units, net of taxes withheld | 994 | 24 | (2,788 | ) | — | — | — | (2,764 | ) | ||||||||||||||||||
Stock issued under employee stock purchase plans | 1,112 | 29 | 4,849 | — | — | — | 4,878 | ||||||||||||||||||||
Net loss | — | — | — | — | (83,032 | ) | — | (83,032 | ) | ||||||||||||||||||
Other comprehensive income | — | — | — | 487 | — | — | 487 | ||||||||||||||||||||
Balance as of December 31, 2017 | 51,509 | 1,421 | 851,054 | (169 | ) | (667,357 | ) | (39,986 | ) | 144,963 | |||||||||||||||||
Stock-based compensation | — | — | 17,473 | — | — | — | 17,473 | ||||||||||||||||||||
Exercise of stock options | 57 | 1 | 383 | — | — | — | 384 | ||||||||||||||||||||
Issuance of vested performance restricted stock units and restricted stock units, net of taxes withheld | 913 | 22 | (96 | ) | — | — | — | (74 | ) | ||||||||||||||||||
Stock issued under employee stock purchase plans | 1,476 | 38 | 7,259 | — | — | — | 7,297 | ||||||||||||||||||||
Cumulative effect of accounting change | — | — | — | — | 1,773 | — | 1,773 | ||||||||||||||||||||
Net loss | — | — | — | — | (19,298 | ) | — | (19,298 | ) | ||||||||||||||||||
Other comprehensive loss | — | — | — | (584 | ) | — | — | (584 | ) | ||||||||||||||||||
Balance as of December 31, 2018 | 53,955 | 1,482 | 876,073 | (753 | ) | (684,882 | ) | (39,986 | ) | 151,934 | |||||||||||||||||
Stock-based compensation | — | — | 11,181 | — | — | — | 11,181 | ||||||||||||||||||||
Exercise of stock options | 75 | 2 | 440 | — | — | — | 442 | ||||||||||||||||||||
Issuance of vested performance restricted stock units and restricted stock units, net of taxes withheld | 611 | 15 | (182 | ) | — | — | — | (167 | ) | ||||||||||||||||||
Stock issued under employee stock purchase plans | 1,807 | 46 | 8,387 | — | — | — | 8,433 | ||||||||||||||||||||
Net loss | — | — | — | — | (17,694 | ) | — | (17,694 | ) | ||||||||||||||||||
Other comprehensive loss | — | — | — | (101 | ) | — | — | (101 | ) | ||||||||||||||||||
Balance as of December 31, 2019 | 56,448 | $ | 1,545 | $ | 895,899 | $ | (854 | ) | $ | (702,576 | ) | $ | (39,986 | ) | $ | 154,028 | |||||||||||
See accompanying notes to consolidated financial statements.
60
CALIX, INC.
CONSOLIDATED STATEMENTS OF CASH FLOWS
(In thousands)
Years Ended December 31, | ||||||||||||
2019 | 2018 | 2017 | ||||||||||
Operating activities: | ||||||||||||
Net loss | $ | (17,694 | ) | $ | (19,298 | ) | $ | (83,032 | ) | |||
Adjustments to reconcile net loss to net cash provided by (used in) operating activities: | ||||||||||||
Stock-based compensation | 11,181 | 17,473 | 12,368 | |||||||||
Depreciation and amortization | 10,316 | 9,187 | 10,991 | |||||||||
Loss on asset retirements | 2,636 | 326 | 280 | |||||||||
Gain on sale of product line | — | (6,704 | ) | — | ||||||||
Changes in operating assets and liabilities: | ||||||||||||
Accounts receivable, net | 20,517 | 13,858 | (29,056 | ) | ||||||||
Inventory | 9,998 | (20,639 | ) | 13,016 | ||||||||
Prepaid expenses and other assets | (63 | ) | 3,579 | 35,210 | ||||||||
Accounts payable | (29,440 | ) | 4,596 | 11,759 | ||||||||
Accrued liabilities | (1,836 | ) | 2,791 | (20,184 | ) | |||||||
Deferred revenue | 2,401 | (1,426 | ) | (14,370 | ) | |||||||
Other long-term liabilities | (3,362 | ) | (183 | ) | 246 | |||||||
Net cash provided by (used in) operating activities | 4,654 | 3,560 | (62,772 | ) | ||||||||
Investing activities: | ||||||||||||
Purchases of property and equipment | (13,353 | ) | (10,426 | ) | (8,026 | ) | ||||||
Purchases of marketable securities | — | — | (8,732 | ) | ||||||||
Sales of marketable securities | — | — | 5,051 | |||||||||
Maturities of marketable securities | — | — | 31,441 | |||||||||
Proceeds from sale of product line | — | 10,350 | — | |||||||||
Net cash provided by (used in) investing activities | (13,353 | ) | (76 | ) | 19,734 | |||||||
Financing activities: | ||||||||||||
Proceeds from exercise of stock options | 442 | 384 | 62 | |||||||||
Proceeds from employee stock purchase plans | 8,433 | 7,297 | 4,878 | |||||||||
Taxes paid for awards vested under equity incentive plan | (167 | ) | (74 | ) | (2,764 | ) | ||||||
Payments related to financing arrangements | (2,737 | ) | — | — | ||||||||
Proceeds from line of credit | 143,300 | 557,915 | 171,268 | |||||||||
Repayments of line of credit | (143,300 | ) | (557,915 | ) | (141,268 | ) | ||||||
Payments to originate the line of credit | — | (115 | ) | (186 | ) | |||||||
Net cash provided by financing activities | 5,971 | 7,492 | 31,990 | |||||||||
Effect of exchange rate changes on cash, cash equivalents and restricted cash | (89 | ) | (477 | ) | 464 | |||||||
Net increase (decrease) in cash, cash equivalents and restricted cash | (2,817 | ) | 10,499 | (10,584 | ) | |||||||
Cash, cash equivalents and restricted cash at beginning of year | 50,274 | 39,775 | 50,359 | |||||||||
Cash, cash equivalents and restricted cash at end of year | $ | 47,457 | $ | 50,274 | $ | 39,775 | ||||||
Supplemental disclosures of cash flow information: | ||||||||||||
Interest paid | $ | 1,123 | $ | 649 | $ | 313 | ||||||
Income taxes paid | $ | 403 | 561 | 915 | ||||||||
Non-cash investing activities: | ||||||||||||
Changes in accounts payable and accrued liabilities related to purchases of property and equipment | $ | (2,435 | ) | $ | 8,459 | $ | (55 | ) | ||||
See accompanying notes to consolidated financial statements.
61
CALIX, INC.
NOTES TO CONSOLIDATED FINANCIAL STATEMENTS
1. Description of Business and Significant Accounting Policies
Company
Calix, Inc. (together with its subsidiaries, “Calix” or the “Company”) was incorporated in August 1999 and is a Delaware corporation. The Company is a leading global provider of cloud and software platforms, systems and services required to deliver the unified access network and smart premises of tomorrow. The Company’s platforms and services help its customers build next generation networks by embracing a DevOps operating model, optimize the subscriber experience by leveraging big data analytics and turn the complexity of the smart home and business into new revenue streams. The Company's cloud and software platforms, systems and services enable communication service providers (“CSPs”) to provide a wide range of revenue-generating services, from basic voice and data to advanced broadband services, over legacy and next-generation access networks. The Company focuses on CSP access networks, the portion of the network that governs available bandwidth and determines the range and quality of services that can be offered to subscribers.
Basis of Presentation and Accounting Guidance
The accompanying consolidated financial statements have been prepared in accordance with the requirements of the U.S. Securities and Exchange Commission (“SEC”) and U.S. generally accepted accounting principles (“GAAP”). All significant intercompany balances and transactions have been eliminated in consolidation. Any reference in these notes to applicable accounting guidance (“guidance”) is meant to refer to the authoritative U.S. GAAP as found in the Financial Accounting Standards Board (“FASB”) Accounting Standards Codification (“ASC”).
Use of Estimates
The preparation of financial statements is in conformity with U.S. GAAP, which requires management to make estimates and assumptions that affect the amounts reported in the consolidated financial statements and accompanying notes. For the Company, these estimates include, but are not limited to: allowances for doubtful accounts and sales returns, excess and obsolete inventory, allowances for obligations to its contract manufacturers, valuation of stock-based compensation, useful lives assigned to long-lived assets, standard and extended warranty costs and contingencies. Actual results could differ from those estimates, and such differences could be material to the Company’s financial position and results of operations.
Revenue Recognition
The Company derives revenue from contracts with customers primarily from the following and categorizes its revenue as follows:
• | Systems include revenue from the sale of access and premises systems, software platform licenses and cloud-based software subscriptions. |
• | Services include revenue from professional services, customer support, software- and cloud-based maintenance, extended warranty subscriptions, training and managed services. |
Revenue is recognized when a performance obligation is satisfied, which occurs when control of the promised goods or services is transferred to the customer, in an amount that reflects the consideration the Company expects to be entitled to in exchange for those goods or services. Specifically, revenue from software platform licenses, which provides the customer with a right to use the software as it exists, is generally recognized upfront when made available to the customer. Revenue from cloud-based software subscriptions, customer support, maintenance, extended warranty subscriptions and managed services is generally recognized ratably over the contract term. Revenue from professional services and training is recognized as the services are completed.
A performance obligation is a promise in a contract to transfer a distinct good or service to the customer and is the unit of account. A contract’s transaction price is allocated to each distinct performance obligation and recognized as revenue when, or as, the performance obligation is satisfied. The Company’s hardware products contain both software and non-software components that function together to deliver the products’ essential functionality and therefore constitutes a single performance obligation as the promise to transfer the individual software and non-software components is not separately identifiable and, therefore, not distinct. The Company’s contracts may include multiple performance obligations. For such arrangements, the Company allocates the contract’s transaction price to each performance obligation using the relative stand-alone selling price of each distinct good or service in the contract. The Company generally determines stand-alone selling prices based on the prices charged to customers or its best estimate of stand-alone selling price. The Company’s estimate of stand-alone selling price is established considering multiple factors including, but not limited to, geographies, market conditions, competitive landscape, internal costs, gross margin objectives, characteristics of targeted customers and pricing practices. The determination of
62
estimated stand-alone selling price is made through consultation with and formal approval by management, taking into consideration the go-to-market strategy.
For certain revenue arrangements involving delivery of both systems and professional services, each is considered a distinct performance obligation. Systems revenue is recognized at a point in time when management has determined that control over systems has transferred to the customer, which is generally when legal title has transferred to the customer. For the same revenue arrangements, management believes that the output of the associated professional services is transferred to the customer over time. As such, professional services revenue is recognized over the period in which the services are provided using a cost input measure. The Company recognizes revenue when control of the systems and services has been transferred to the customer, which may be earlier than system installation or customer acceptance, in accordance with the agreed-upon specifications in the contract.
Cost of Revenue
Cost of revenue consists primarily of finished goods inventory purchased from the Company’s contract manufacturers, payroll and related expenses associated with managing the relationships with contract manufacturers, depreciation of manufacturing test equipment, warranty and retrofit costs, excess and obsolete inventory costs, shipping charges and amortization of certain intangible assets. It also includes contractor and other costs of services incurred directly related to the delivery of services to customers.
Warranty and Retrofit
The Company offers limited warranties for its hardware products for a period of one, three or five years, depending on the product type. The Company recognizes estimated costs related to warranty activities as a component of cost of revenue upon product shipment or upon identification of a specific product failure. Under certain circumstances, the Company also provides fixes on specifically identified performance failures for products that are outside of the standard warranty period and recognizes estimated costs related to retrofit activities as a component of cost of revenue upon identification of such product failures. The Company recognizes estimated warranty and retrofit costs when it is probable that a liability has been incurred and the amount of loss is reasonably estimable. The estimates are based upon historical and projected product failure and claim rates, historical costs incurred in correcting product failures and information available related to any specifically identified product failures. Judgment is required in estimating costs associated with warranty and retrofit activities, and the Company's estimates are limited to information available to the Company at the time of such estimates. In some cases, such as when a specific product failure is first identified or a new product is introduced, the Company may initially have limited information and limited historical failure and claim rates upon which to base its estimates, and such estimates may require revision in future periods. The recorded amount is adjusted from time to time for specifically identified warranty and retrofit exposure. Actual warranty and retrofit expenses are charged against the Company’s estimated warranty and retrofit liability when incurred. Factors that affect the Company’s warranty and retrofit liability include the number of active installed units and historical and anticipated rates of warranty and retrofit claims and cost per claim.
Stock-Based Compensation
Stock-based compensation expense associated with stock options, performance stock options (“PSOs”), restricted stock units (“RSUs”) and purchase rights under the Amended and Restated Employee Stock Purchase Plan (the “ESPP”) and the Amended and Restated 2017 Nonqualified Employee Stock Purchase Plan (the “NQ ESPP”) is measured at the grant date based on the fair value of the award, and is recognized, net of forfeitures, as expense over the remaining requisite service period (generally the vesting period) on a straight-line basis.
The fair value of stock option and employee stock purchase right under the ESPP is estimated at the grant date using the Black-Scholes option valuation model. The fair value of RSUs and employee stock purchase right under the Nonqualified ESPP is based on closing market price of the Company’s common stock on the date of grant.
Stock-based compensation expense associated with PSOs with graded vesting features and which contain both a performance and a service condition is measured based on fair value of stock options estimated at the grant date using the Black-Scholes option valuation model, and is recognized, net of forfeitures, as expense over the requisite service period using the graded vesting attribution method.
Compensation expense is only recognized if the Company has determined that it is probable that the performance condition will be met. The Company reassesses the probability of vesting at each reporting period and adjusts compensation expense based on its probability assessment.
Loss Contingencies
From time to time, the Company is involved in legal proceedings arising from the normal course of business activities. The Company evaluates the likelihood of an unfavorable outcome of legal proceedings to which it is a party and accrues a loss
63
contingency when the loss is probable and reasonably estimable. Assessing legal contingencies involves significant judgment and estimates, and the outcome of litigation is inherently uncertain and subject to numerous factors outside the Company’s control. Significant judgment is required when the Company assesses the likelihood of any adverse judgments or outcomes, including the potential range of possible losses, and whether losses are probable and reasonably estimable.
Because of uncertainties related to these matters, the Company bases its estimates of whether a loss contingency is probable or reasonably possible, as well as the reasonable range of possible losses associated with each loss contingency, only on the information available at the time. As additional information becomes available, and at least quarterly, the Company reassesses the potential liability on each significant matter and may revise its estimates. These revisions could have a material impact on the Company’s business, operating results or financial condition. The actual outcome of these legal proceedings may materially differ from the Company’s estimates of potential liability, which could have a material adverse effect on the Company’s business, operating results or financial condition.
Credit Risk and Inventory Supplier Concentrations
Financial instruments that potentially subject the Company to significant concentrations of credit risk consist primarily of cash and cash equivalents and accounts receivable. Cash equivalents consist of money market funds, which are invested through financial institutions in the United States. Deposits in these financial institutions may, at times, exceed federally insured limits. The Company has not experienced any losses in such accounts. The Company also has approximately $2.4 million of cash held by its foreign subsidiaries in Brazil, China and the United Kingdom. Management believes that the financial institutions that hold the Company’s cash and cash equivalents are financially sound and, accordingly, minimal credit risk exists with respect to these cash and cash equivalents.
The Company depends primarily on a small number of outside contract manufacturers ("CMs") and original design manufacturers ("ODMs") for the bulk of its finished goods inventory. The Company generally purchases its products through purchase orders with its suppliers. While the Company seeks to maintain a sufficient supply of its products, the Company’s business and results of operations could be adversely affected by a stoppage or delay in receiving such products, the receipt of defective parts, an increase in price of such products or the Company’s inability to obtain lower prices from its CMs, ODMs and other suppliers in response to competitive pressures.
Fair Value of Financial Instruments
The carrying amounts of cash and cash equivalents, marketable securities, trade receivables, accounts payable, line of credit and other accrued liabilities approximate their fair value due to their relatively short-term nature.
Cash, Cash Equivalents, Restricted Cash and Marketable Securities
Cash equivalents and marketable securities are stated at amounts that approximate fair value based on quoted market prices.
Restricted cash is cash that is legally restricted as to withdrawal or usage. As of December 31, 2019, the Company had $0.6 million in restricted cash related to a letter of credit in connection with its San Jose facility lease.
The Company has invested its excess cash primarily in money market funds and highly liquid marketable securities such as corporate debt instruments, commercial paper and U.S. government agency securities. The Company considers all investments with maturities of three months or less when purchased to be cash equivalents. Marketable securities represent highly liquid corporate debt instruments, commercial paper and U.S. government agency securities with maturities greater than 90 days at date of purchase. Marketable securities with maturities greater than one year are classified as current because management considers all marketable securities to be available for current operations.
The Company’s investments have been classified and accounted for as available-for-sale. Such investments are recorded at fair value and unrealized holding gains and losses are reported as a separate component of comprehensive loss in the stockholders’ equity until realized. Realized gains and losses on sales of marketable securities, if any, are determined on the specific identification method and are reclassified from accumulated other comprehensive loss to results of operations as “Other income (expense), net”. The Company had no investments as of December 31, 2019 and 2018.
Allowance for Doubtful Accounts
The Company maintains an allowance for doubtful accounts for estimated losses resulting from the inability of its customers to make required payments. The Company records a specific allowance based on an analysis of individual past-due balances. Additionally, based on historical write-offs and the Company’s collection experience, the Company records an additional allowance based on a percentage of outstanding receivables. The Company performs credit evaluations of its customers’ financial condition. These evaluations require judgment and are based on a variety of factors including, but not limited to, current economic trends, payment history and a financial review of the customer. Actual collection losses may differ from management’s estimates, and such differences could be material to the Company's financial position and results of operations.
64
Inventory Valuation
Inventory, which primarily consists of finished goods purchased from CMs or ODMs, is stated at the lower of cost (determined by the first-in, first-out method) or market value. Inbound shipping costs and U.S. tariffs are included in cost of inventory. In addition, the Company, from time to time, procures component inventory primarily as a result of manufacturing discontinuation of critical components by suppliers. The Company regularly monitors inventory quantities on hand and records write-downs for excess and obsolete inventories based on the Company’s estimate of demand for its products, potential obsolescence of technology, product life cycles and whether pricing trends or forecasts indicate that the carrying value of inventory exceeds its estimated selling price. These factors are impacted by market and economic conditions, technology changes and new product introductions and require significant estimates that may include elements that are uncertain. Actual demand may differ from forecasted demand and may have a material effect on gross profit. If inventory is written down, a new cost basis is established that cannot be increased in future periods. Shipments from suppliers before the Company receives them are recorded as in-transit inventory when title and the significant risks and rewards of ownership have passed to the Company.
Contract Costs
The Company capitalizes sales commissions primarily related to extended warranty and Calix Cloud contracts for which the expected amortization period is greater than one year.
Capitalized commissions are amortized as sales and marketing expenses over the period that the related revenue is recognized, which typically range from three to ten years for extended warranty and cloud offerings. The Company classifies the unamortized portion of deferred commissions as current or noncurrent based on the timing of when the Company expects to recognize the expense. The current and noncurrent portions of deferred commissions are included in prepaid expenses and other current assets and other assets, respectively, in the Company’s Consolidated Balance Sheets.
Property and Equipment
Property and equipment are stated at cost, less accumulated depreciation, and are depreciated using the straight-line method over the estimated useful life of each asset. Generally, computer equipment is depreciated over two years; purchased software is depreciated over three to five years; test equipment is depreciated over three years; furniture and fixtures are depreciated over seven years; and leasehold improvements are depreciated over the shorter of the respective lease term or the estimated useful life of the asset. Maintenance and repairs are charged to expense as incurred.
Goodwill
Goodwill was recorded as a result of the Company’s acquisitions of Occam Networks, Inc. in February 2011 and Optical Solutions, Inc. in February 2006. The Company records goodwill when consideration paid in a business acquisition exceeds the fair value of the net tangible assets and the identified intangible assets acquired. Goodwill is not amortized but instead is subject to an annual impairment test or more frequently if events or changes in circumstances indicate that it may be impaired. The Company evaluates goodwill on an annual basis as of the end of the second quarter of each fiscal year. Management has determined that it operates as a single reporting unit and, therefore, evaluates goodwill impairment at the enterprise level.
In an annual impairment test, the Company first assesses qualitative factors to determine whether it is necessary to perform the two-step quantitative goodwill impairment test. In assessing the qualitative factors, management considers the impact of these key factors: macro-economic conditions, industry and market environment, overall financial performance of the Company, cash flow from operating activities, market capitalization and stock price. If the Company determines as a result of the qualitative assessment that it is more likely than not (that is, a likelihood of more than 50 percent) that the fair value of a reporting unit is less than its carrying amount, then the quantitative test is required. Otherwise, no further testing is required.
In a quantitative test, the Company compares its fair value to its carrying value including goodwill. The Company determines its fair value using both an income approach and a market approach. Under the income approach, the Company determines fair value based on estimated future cash flows, discounted by an estimated weighted-average cost of capital, which reflects the overall level of inherent risk of the Company and the rate of return an outside investor would expect to earn. Under the market-based approach, the Company utilizes information regarding the Company as well as publicly available industry information to determine earnings multiples that are used to value the Company. If the carrying value of the Company exceeds its fair value, the Company will determine the amount of impairment loss by comparing the implied fair value of goodwill with the carrying value of goodwill. An impairment charge is recognized for the excess of the carrying value of goodwill over its implied fair value.
At the end of the second quarter of 2019, the Company completed its annual goodwill impairment test. Based on its assessment of the above qualitative factors, management concluded that the fair value of the Company was more likely than not greater than its carrying amount as of June 30, 2019. As such, it was not necessary to perform the two-step quantitative goodwill impairment test at the time.
65
There have been no significant events or changes in circumstances subsequent to the 2019 annual impairment test that would more likely than not indicate that the carrying value of goodwill may have been impaired as of December 31, 2019. Therefore, there was no impairment to the carrying value of the Company’s goodwill as of December 31, 2019. There were no impairment losses for goodwill for the years ended December 31, 2018 or 2017.
Deferred Revenue
Deferred revenue results from transactions where the Company billed the customer for products or services and when cash payments are received or due prior to transferring control of the promised goods or services to the customer.
Payment terms to customers typically range from net 30 to net 90 days and vary by the size and location of customer and the products or services offered. The period between the transfer of control of the promised good or service to a customer and when payment is due is not significant.
Income Taxes
The Company evaluates its tax positions and estimates its current tax exposure along with assessing temporary differences that result from different book to tax treatment of items not currently deductible for tax purposes. These differences result in deferred tax assets and liabilities on the Company’s Consolidated Balance Sheets, which are estimated based upon the difference between the financial statement and tax bases of assets and liabilities using the enacted tax rates that will be in effect when these differences reverse. In general, deferred tax assets represent future tax benefits to be received when certain expenses previously recognized in the Company’s Consolidated Statements of Comprehensive Loss become deductible expenses under applicable income tax laws or loss or credit carryforwards are utilized. Accordingly, realization of the Company’s deferred tax assets is dependent on future taxable income against which these deductions, losses and credits can be utilized.
The Company must assess the likelihood that the Company’s deferred tax assets will be recovered from future taxable income, and to the extent the Company believes that recovery is not more likely than not, the Company must establish a valuation allowance. Management judgment is required in determining the Company’s provision for income taxes, the Company’s deferred tax assets and liabilities and any valuation allowance recorded against the Company’s net deferred tax assets. Excluding foreign operations, the Company recorded a full valuation allowance at each balance sheet date presented because, based on the available evidence, the Company believes it is more likely than not that it will not be able to utilize all of its deferred tax assets in the future. The Company intends to maintain the full valuation allowance until sufficient evidence exists to support the reversal of the valuation allowance.
Newly Adopted Accounting Standards
Leases
In February 2016, the FASB issued Accounting Standards Update No. 2016-02, Leases (Topic 842), which requires recognition of an asset and liability for lease arrangements longer than twelve months. The Company adopted the new standard effective January 1, 2019 using the effective date approach which eliminates the need to restate amounts presented prior to that date. The Company also elected the package of practical expedients but not the hindsight practical expedient. The adoption had a material impact on the Company's Consolidated Balance Sheets but did not impact the Company's Consolidated Statements of Comprehensive Loss, Cash Flows or Stockholders' Equity. Upon adoption on January 1, 2019, the Company recognized an operating lease right-of-use asset of $15.8 million and a lease liability of $16.7 million.
Recent Accounting Pronouncements Not Yet Adopted
There have been no accounting pronouncements or changes in accounting pronouncements that are significant or potentially significant to the Company.
66
2. Cash, Cash Equivalents and Restricted Cash
Cash, cash equivalents and restricted cash consisted of the following (in thousands):
December 31, | ||||||||
2019 | 2018 | |||||||
Cash and cash equivalents: | ||||||||
Cash | $ | 46,815 | $ | 45,806 | ||||
Money market funds | 14 | 3,840 | ||||||
Total cash and cash equivalents | 46,829 | 49,646 | ||||||
Restricted cash | 628 | 628 | ||||||
$ | 47,457 | $ | 50,274 | |||||
The carrying amounts of the Company’s money market funds approximate their fair values due to their nature, duration and short maturities.
3. Fair Value Measurements
The Company measures its cash equivalents and marketable securities at fair value on a recurring basis. Fair value is an exit price, representing the amount that would be received to sell an asset or paid to transfer a liability in an orderly transaction between market participants. As such, fair value is a market-based measurement that should be determined based on assumptions that market participants would use in pricing an asset or liability. The Company utilizes the following three-tier value hierarchy which prioritizes the inputs used in measuring fair value:
Level 1 – Observable inputs that reflect quoted prices (unadjusted) for identical assets or liabilities in active markets.
Level 2 – Observable inputs other than quoted prices included in Level 1 for similar instruments in active markets, quoted prices for identical or similar instruments in markets that are not active, and model-driven valuations in which all significant inputs and significant value drivers are observable in active markets.
Level 3 – Unobservable inputs to the valuation derived from fair valuation techniques in which one or more significant inputs or significant value drivers are unobservable. The fair value hierarchy also requires the Company to maximize the use of observable inputs, when available, and to minimize the use of unobservable inputs when determining inputs and determining fair value.
As of December 31, 2019 and 2018, the Company had money market funds of $14,000 and $3.8 million, respectively, and each was classified as a Level 1 financial asset. The fair values of money market funds classified as Level 1 were derived from quoted market prices as active markets for these instruments exist. The Company had no Level 2 or Level 3 financial assets.
4. Balance Sheet Details
Accounts receivable, net consisted of the following (in thousands):
December 31, | ||||||||
2019 | 2018 | |||||||
Accounts receivable | $ | 46,883 | $ | 67,396 | ||||
Allowance for doubtful accounts | (374 | ) | (370 | ) | ||||
$ | 46,509 | $ | 67,026 | |||||
67
The table below summarizes the changes in allowance for doubtful accounts and product return liability for the periods indicated (in thousands):
Balance at Beginning of Year | Additions Charged to Costs or Expenses or Revenue | Deductions and Write Offs | Balance at End of Year | |||||||||||||
Year Ended December 31, 2019 | ||||||||||||||||
Allowance for doubtful accounts | $ | 370 | $ | 168 | $ | (164 | ) | $ | 374 | |||||||
Product return liability | 880 | 1,620 | (1,581 | ) | 919 | |||||||||||
Year Ended December 31, 2018 | ||||||||||||||||
Allowance for doubtful accounts | $ | 579 | $ | (5 | ) | $ | (204 | ) | $ | 370 | ||||||
Product return liability | 822 | 771 | (713 | ) | 880 | |||||||||||
Year Ended December 31, 2017 | ||||||||||||||||
Allowance for doubtful accounts | $ | 518 | $ | 103 | $ | (42 | ) | $ | 579 | |||||||
Product return liability | 938 | 3,682 | (3,798 | ) | 822 | |||||||||||
Inventory consisted of the following (in thousands):
December 31, | ||||||||
2019 | 2018 | |||||||
Raw materials | $ | 656 | $ | 10,815 | ||||
Finished goods | 39,497 | 39,336 | ||||||
$ | 40,153 | $ | 50,151 | |||||
Property and equipment, net consisted of the following (in thousands):
December 31, | ||||||||
2019 | 2018 | |||||||
Test equipment | $ | 37,001 | $ | 39,148 | ||||
Software | 20,646 | 24,355 | ||||||
Computer equipment | 10,835 | 10,342 | ||||||
Furniture and fixtures | 2,342 | 1,976 | ||||||
Leasehold improvements | 2,047 | 3,559 | ||||||
72,871 | 79,380 | |||||||
Accumulated depreciation and amortization | (51,344 | ) | (54,435 | ) | ||||
$ | 21,527 | $ | 24,945 | |||||
Depreciation and amortization expenses were $10.3 million, $9.2 million and $11.0 million for the years ended December 31, 2019, 2018 and 2017, respectively.
Loss on Asset Retirement
In July 2018, in connection with establishing a direct relationship with Verizon Communications, Inc. (“Verizon”), the Company licensed software from a former partner to support the Company's deployments at Verizon. During the third quarter of 2019, Verizon informed the Company that it no longer required this software. As a result, the Company wrote off the software in the third quarter of 2019, resulting in a $2.5 million charge in the Company's Consolidated Statements of Comprehensive Income (Loss).
Other long-term assets consisted of the following (in thousands):
December 31, | ||||||||
2019 | 2018 | |||||||
Intangible asset | $ | 12,148 | $ | — | ||||
Capitalized cloud implementation costs | 6,089 | — | ||||||
Other long-term assets | 1,203 | 1,203 | ||||||
$ | 19,440 | $ | 1,203 | |||||
68
Intangible Asset Acquisition
In March 2018, the Company entered into an agreement with a vendor to develop certain software product and related enhancements pursuant to which the Company may be obligated to make minimum revenue-share payments under the program of up to $15.8 million over the three years following availability for sale. The payments are based on a revenue-share rate applied to revenue from the developed-product and the corresponding hardware sales subject to a minimum and a maximum aggregate amount over the three-year sales period. The Company had its first sale in August 2019, and as a result, the Company capitalized an intangible asset with a value of $13.2 million in the third quarter of 2019 and also recognized a liability of $13.2 million (a non-cash investing activity). The balance of $13.5 million is included in accrued liabilities and other long-term liabilities in the accompanying Consolidated Balance Sheet as of December 31, 2019. The values of the intangible asset and liability were based on the net present value of the expected payments using a 6.5% discount rate. The intangible asset has a five-year useful life and will be amortized using the ratio of current gross revenue for the products to the total of current and anticipated future gross revenue for the products, or the straight-line method, whichever is greater.
Accrued liabilities consisted of the following (in thousands):
December 31, | ||||||||
2019 | 2018 | |||||||
Compensation and related benefits | $ | 19,010 | $ | 19,811 | ||||
Warranty and retrofit | 7,294 | 8,547 | ||||||
Customer advances or rebates | 7,252 | 6,103 | ||||||
Professional and consulting fees | 4,996 | 6,060 | ||||||
Current portion of financing arrangements | 4,044 | 2,359 | ||||||
Operating leases | 2,663 | — | ||||||
Taxes payable | 2,021 | 1,516 | ||||||
Component inventory held by suppliers | 1,925 | 2,667 | ||||||
Operations | 1,053 | 1,059 | ||||||
Product returns | 919 | 880 | ||||||
Insurance | 852 | 917 | ||||||
Freight | 808 | 1,187 | ||||||
Business events | — | 1,696 | ||||||
Other | 4,709 | 5,067 | ||||||
$ | 57,546 | $ | 57,869 | |||||
Changes in the Company’s accrued warranty and retrofit liability were as follows (in thousands):
Years Ended December 31, | ||||||||||||
2019 | 2018 | 2017 | ||||||||||
Balance at beginning of year | $ | 8,547 | $ | 8,708 | $ | 12,214 | ||||||
Provision for warranty and retrofit charged to cost of revenue | 4,425 | 5,215 | 8,720 | |||||||||
Utilization of reserve | (5,678 | ) | (5,376 | ) | (12,226 | ) | ||||||
Balance at end of year | $ | 7,294 | $ | 8,547 | $ | 8,708 | ||||||
Accrued Restructuring Charges
The Company adopted a restructuring plan in March 2017. This restructuring plan realigned the Company’s business, increasing its focus towards its investments in software defined access and cloud products, while reducing its expense structure in its traditional systems business. The Company began to take actions under this plan beginning in March 2017 and recognized $4.2 million of restructuring charges for the year ended December 31, 2017, consisting primarily of severance and other one-time termination benefits. Actions pursuant to this restructuring plan were complete as of December 31, 2017.
The Company established a new restructuring plan in February 2018 to further align its business resources based on the production releases of its platform offerings. The Company incurred restructuring charges of approximately $5.7 million for the year ended December 31, 2018, consisting primarily of severance and other termination related benefits.
69
The following table summarizes the activities pursuant to the above restructuring plans (in thousands):
Severance and Related Benefits | Facilities | Total | ||||||||||
Balance as of December 31, 2017 | $ | 975 | $ | 442 | $ | 1,417 | ||||||
Restructuring charges for the year | 5,203 | 502 | 5,705 | |||||||||
Cash payments | (6,178 | ) | (916 | ) | (7,094 | ) | ||||||
Balance as of December 31, 2018 | — | 28 | 28 | |||||||||
Cash payments | — | (28 | ) | (28 | ) | |||||||
Balance as of December 31, 2019 | $ | — | $ | — | $ | — | ||||||
5. Credit Agreements
Line of Credit
On August 7, 2017, the Company entered into a loan and security agreement with Silicon Valley Bank (the “SVB Loan Agreement”). The SVB Loan Agreement provides for a senior secured revolving credit facility, pursuant to which SVB agreed to make revolving advances available to the Company in a principal amount of up to $30.0 million based on a customary accounts receivable borrowing base, subject to certain exceptions for accounts originating outside the United States and certain specific accounts, which could reduce the amount available to the Company under the credit facility.
The credit facility includes affirmative and negative covenants applicable to the Company and its subsidiaries. Furthermore, the SVB Loan Agreement requires the Company to maintain a liquidity ratio at minimum levels set forth in more detail in the SVB Loan Agreement. The credit facility also includes events of default, the occurrence and continuation of which, would provide SVB with the right to demand immediate repayment of any principal and unpaid interest under the credit facility, and to exercise remedies against the Company and the collateral securing the loans under the credit facility. In February 2019, the Company entered into a third amendment to the SVB Loan Agreement to reduce the required minimum level of the Adjusted Quick Ratio (“AQR”) for the first half of 2019 and the required minimum Adjusted EBITDA for the first fiscal quarter of 2019 to accommodate the increased costs and use of cash that the Company anticipated for the first half of 2019 related to activities to mitigate the impact of the U.S. tariffs. As of September 28, 2019 and December 31, 2019, the Company was in compliance with all these requirements except for the minimum AQR covenant. The Company was not able to maintain the minimum AQR at the level required in the SVB Loan Agreement, which constituted events of default. SVB waived the events of default effective as of September 28, 2019 and December 31, 2019, respectively, and, therefore, these defaults did not change the Company’s ability to borrow under the SVB Loan Agreement.
As of December 31, 2019 and 2018, the Company had borrowings outstanding of $30.0 million under the line of credit, which represents the full capacity available under the facility. The Company's interest rate on the line of credit was 6.3% as of December 31, 2019 and 7.0% as of December 31, 2018.
In January 2020, the Company replaced the SVB Loan Agreement with a new asset-based credit facility with Bank of America (“BofA”). See Note 15 “Subsequent Event”.
Financing Arrangements
During 2018, the Company entered into financing arrangements to purchase lab and test equipment for approximately $5.1 million, which are non-cash investing activities. Each agreement is to be paid over 36 months with a weighted average interest rate of 6.2%. As of December 31, 2019, there was $2.9 million outstanding under these financing arrangements, which is included in accrued liabilities and other long-term liabilities in the accompanying Consolidated Balance Sheet.
During 2017, 2018 and 2019, the Company entered into financing arrangements for consulting services of $5.4 million in connection with the Company’s enterprise resource planning (“ERP”) implementation. These were non-cash investing activities of $2.0 million, $1.8 million and $1.6 million for years ended December 31, 2019, 2018 and 2017, respectively. The current amounts due under this agreement are to be paid over a weighted average term of 2.4 years with a weighted average interest rate of 6.5%. As of December 31, 2019, there was $2.1 million outstanding under these arrangements, which is included in accrued liabilities and other long-term liabilities in the accompanying Consolidated Balance Sheet.
70
6. Commitments and Contingencies
Lease Commitments
The Company leases office space under non-cancelable operating leases. Certain of the Company’s operating leases contain renewal options and rent acceleration clauses. Future minimum payments under the non-cancelable operating leases consisted of the following as of December 31, 2019 (in thousands):
Year Ending December 31, | Future Minimum Lease Payments | |||
2020 | $ | 3,769 | ||
2021 | 3,604 | |||
2022 | 3,461 | |||
2023 | 3,578 | |||
2024 | 3,388 | |||
Thereafter | 2,881 | |||
Total future minimum lease payments | 20,681 | |||
Less imputed interest | (3,681 | ) | ||
$ | 17,000 | |||
Operating lease liability consisted of the following (in thousands):
December 31, 2019 | ||||
Accrued liabilities - current portion of operating leases | $ | 2,663 | ||
Operating leases | 14,337 | |||
$ | 17,000 | |||
Prior to the adoption of Topic 842, future minimum lease payments under the non-cancelable operating leases as of December 31, 2018, which were undiscounted, were as follows (in thousands):
Year Ending December 31, | Future Minimum Lease Payments | |||
2019 | $ | 3,750 | ||
2020 | 3,817 | |||
2021 | 3,468 | |||
2022 | 3,300 | |||
2023 | 3,411 | |||
Thereafter | 6,053 | |||
$ | 23,799 | |||
The Company leases its headquarters office space in San Jose, California under a lease agreement that expires in December 2025. The future minimum lease payments under the lease are $14.0 million and are included in the table for the year ended December 31, 2019 above.
In August 2018, the Company entered into a new office lease agreement in Petaluma, California. The lease commenced in February 2019 for a term of 64 months. The future minimum lease payments of $2.5 million are included in the table for the year ended December 31, 2019 above. The Company recorded a right-of-use operating lease asset and operating lease liability of $2.2 million in the first quarter of 2019. The Company’s previous lease in Petaluma, California expired in March 2019.
The above tables also include future minimum lease payments for the Company's office facilities in Nanjing, China; Plymouth, Minnesota; Richardson, Texas; and West Jordan, Utah, which expire at various dates through 2025.
The weighted average discount rate for the Company's operating leases as of December 31, 2019 was 7.0%. The weighted average remaining lease term as of December 31, 2019 was 5.1 years.
For the years ended December 31, 2019, 2018 and 2017, total rent expense of the Company was $4.7 million, $3.4 million and $3.7 million, respectively. Cash paid within operating cash flows for operating leases was $3.7 million for year ended December 31, 2019.
71
Purchase Commitments
The Company’s CMs and ODMs place orders for certain component inventory in advance of the Company’s orders based upon the Company’s forecasts in order to reduce manufacturing lead times and ensure adequate component supply. The Company generally does not take ownership of the components held by CMs and ODMs. The Company places purchase orders with its CMs and ODMs in order to fulfill its monthly finished product inventory requirements. The Company incurs a liability when the CMs and ODMs convert the component inventory to a finished product subject to purchase orders and takes ownership of the finished goods inventory. In the event of termination of services with a manufacturing partner, the Company has purchased, and may be required to purchase in the future, certain of the remaining components inventory held by the CM or ODM as well as any outstanding orders pursuant to the contractual provisions with such CM or ODM. As of December 31, 2019, the Company had approximately $52.5 million of outstanding purchase commitments for inventory to be delivered by its suppliers, including CMs and ODMs, within one year.
The Company has, from time to time and subject to certain conditions, purchased from suppliers component inventory when this inventory has been rendered excess or obsolete due to manufacturing and engineering change orders resulting from design changes or manufacturing discontinuation of parts by its suppliers, or in cases where inventory levels greatly exceed projected demand. The estimated excess and obsolete inventory at suppliers was $1.9 million and $2.7 million as of December 31, 2019 and 2018, respectively, which is included in accrued liabilities in the accompanying Consolidated Balance Sheets. The Company records the related charges in cost of systems revenue in its Consolidated Statements of Comprehensive Loss.
Litigation
From time to time, the Company is involved in various legal proceedings arising from the normal course of business activities. The Company is not currently a party to any legal proceedings that, if determined adversely to the Company, in management’s opinion, are currently expected to individually or in the aggregate have a material adverse effect on the Company’s business, operating results or financial condition taken as a whole.
Indemnifications
The Company from time to time enters into contracts that require it to indemnify various parties against claims from third parties. These contracts primarily relate to (i) certain real estate leases, under which the Company may be required to indemnify property owners for environmental and other liabilities, and other claims arising from the Company’s use of the applicable premises, (ii) agreements with the Company’s officers, directors and certain employees, under which the Company may be required to indemnify such persons for liabilities arising out of their relationship with the Company, (iii) contracts under which the Company may be required to indemnify customers against third-party claims that a Company product infringes a patent, copyright or other intellectual property right and (iv) agreements under which the Company may be required to indemnify the counterparty for certain claims that may be brought against them arising from the Company’s acts or omissions with respect to the transactions contemplated by such agreements.
Because any potential obligation associated with these types of contractual provisions are not quantified or stated, the overall maximum amount of the obligation cannot be reasonably estimated. Historically, the Company has not been required to make payments under these obligations, and no liabilities have been recorded for these obligations in the accompanying Consolidated Balance Sheets.
7. Stockholders’ Equity
Preferred Stock
The Board of Directors has the authority, without action by stockholders with the exception of stockholders who hold board positions, to designate and issue up to 5.0 million shares of preferred stock in one or more series and to fix the rights, preferences, privileges and restrictions thereof. These rights, preferences and privileges could include dividend rights, conversion rights, voting rights, terms of redemption, liquidation preferences, sinking fund terms and the number of shares constituting any series or the designation of such series, any or all of which may be greater than the rights of common stock. The issuance of the Company’s preferred stock could adversely affect the voting power of holders of common stock and the likelihood that such holders will receive dividend payments and payments upon liquidation. In addition, the issuance of preferred stock could have the effect of delaying, deferring or preventing a change in control of the Company or other corporate action. Since the Company’s initial public offering, the Board of Directors has not designated any rights, preference or powers of any preferred stock and no shares of preferred stock have been issued.
Common Stock
Holders of the Company’s common stock are entitled to receive dividends, if any, as may be declared from time to time by the Board of Directors out of legally available funds. No dividends have been declared or paid as of December 31, 2019. In the
72
event of the Company’s liquidation, dissolution or winding up, holders of the Company’s common stock will be entitled to share ratably in the net assets legally available for distribution to stockholders after the payment of all of the Company’s debts and other liabilities and the satisfaction of any liquidation preference granted to the holders of any then outstanding shares of preferred stock.
Equity Incentive Plans
2019 Equity Incentive Award Plan
At the Company’s annual meeting of stockholders in May 2019, the stockholders approved the 2019 Equity Incentive Award Plan (the “2019 Plan”). The 2019 Plan supersedes and replaces the 2010 Equity Incentive Award Plan (the “2010 Plan”) and preceding plans. No further awards will be granted under the 2010 Plan; however, the terms and conditions of the 2010 Plan will continue to govern any outstanding awards granted under the 2010 Plan.
Employees and consultants of the Company, its subsidiaries and affiliates, as well as members of the Company's Board of Directors, are eligible to receive awards under the 2019 Plan. The 2019 Plan provides for the grant of stock options, stock appreciation rights, restricted stock, RSUs, other stock or cash-based awards and dividend equivalents to eligible individuals.
The number of shares available for issuance under the 2019 Plan includes an initial reserve of 1.7 million shares of common stock, any shares of common stock that are available for issuance under the 2010 Plan as of the effective date of the 2019 Plan and any shares of common stock subject to issued and outstanding awards under the 2010 Plan that expire, are cancelled or otherwise terminate following the effective date of the 2019 Plan. As of December 31, 2019, there were 2.0 million shares available for issuance under the 2019 Plan.
Stock options granted under the 2019 Plan are granted in general at a price not less than 100% of the fair market value of the common stock on the date of grant. Stock options issued under the 2019 Plan generally vest 25% on the first anniversary of the vesting commencement date and on a quarterly basis thereafter for a period of an additional three years. The options have a maximum term of ten years.
Each RSU granted under the 2019 Plan represents a right to receive one share of the Company’s common stock (subject to adjustment for certain specified changes in the capital structure of the Company) upon the completion of a specific period of continued service.
In October 2017, in connection with the hiring of its Chief Financial Offer, the Company made an “inducement” award of non-qualified stock options to purchase 0.3 million shares of the Company's common stock with an exercise price of $5.05 per share, equal to the grant date fair value based upon the closing price of the Company's common stock. The stock option was granted outside the terms of the Company's 2010 Equity Incentive Award Plan (under the employee inducement award exemption under the New York Stock Exchange Listed Company Manual Rule 303A.08). The stock option will vest and become exercisable over four years from the date of grant, with 25% of the shares vesting on the one-year anniversary of the grant date and the remaining shares vesting quarterly thereafter over the next three years, subject to continued employment with the Company.
In December 2017, the Company granted 1.6 million shares of performance-based stock option awards to its executives. These performance-based stock option awards contain a one-year performance period and a subsequent two-year service period. The performance target is based on the Company’s non-GAAP operating income during the performance period and accounted for as a performance condition. After the one-year performance period, if the performance target is met and subject to certification by the Compensation Committee of the Company’s Board of Directors, each performance-based stock option award shall vest with respect to 50% of the earned shares on January 1, 2019 and 6.25% of the earned shares quarterly thereafter, subject to the executive’s continuous service with the Company from the grant date through the respective vesting dates. If the performance target is not met, all such performance-based stock options shall be immediately forfeited and canceled. In November 2018, the Compensation Committee of the Company’s Board of Directors modified the performance target. Subsequently, in February 2019, the Compensation Committee of the Company’s Board of Directors concluded that the revised performance target was met based on the actual non-GAAP net income achieved for 2018. As such, each stock option was earned subject to the executive's continuous service with the Company from the grant date through the remaining vesting dates.
In February 2019, PSOs exercisable for up to an aggregate of 2.0 million shares of common stock were granted to Company executives with a grant date fair value of $8.03 per share. These PSOs contain a one-year performance period and a subsequent three-year service period. The actual number of shares earned is contingent upon achievement of both annual and quarterly corporate financial targets for revenue, non-GAAP gross margin and non-GAAP net income per share for 2019 (collectively, the “2019 Performance Targets”) during the one-year performance period. These PSOs would vest, subject to certification by the Compensation Committee of the Company’s Board of Directors, of the achievement of the 2019 Performance Targets, as to 25% of the shares of common stock earned on the date of such certification, and as to the remaining 75% of the shares of common stock earned, in substantially equal quarterly installments over the subsequent 3 years, subject to the executive’s continuous service with the Company through the respective vesting dates. If all of the 2019 Performance targets are met, each
73
executive receives 100% of their target shares. Furthermore, each executive may receive a number of shares above their target shares for achievement of at least 125% above the non-GAAP net income per share target, up to a maximum of 200% of the target shares for achievement above 125% of the net income per share target. In August 2019, the Compensation Committee of the Company’s Board of Directors amended the 2019 Performance Targets to provide for the award of up to 40% of the total number of shares subject to a stock option award in the event the annual corporate financial targets are not met but the quarterly corporate financial targets are met. As a result, the probability of meeting some of the performance conditions related to these PSOs was assessed to be probable, and $0.5 million of stock-based compensation expense was recognized in 2019.
Stock Options
The following table summarizes the activity of stock options under the Company’s equity incentive plans (in thousands, except per share data):
Weighted- | |||||||||||||
Average | |||||||||||||
Weighted- | Remaining | ||||||||||||
Average | Contractual | Aggregate | |||||||||||
Number of | Exercise Price | Life | Intrinsic | ||||||||||
Stock Options | Shares | Per Share | (in years) | Value (1) | |||||||||
Outstanding as of December 31, 2018 | 4,442 | $ | 7.40 | ||||||||||
Granted | 2,925 | 7.97 | |||||||||||
Exercised | (74 | ) | 5.94 | ||||||||||
Canceled | (416 | ) | 7.45 | ||||||||||
Outstanding as of December 31, 2019 | 6,877 | $ | 7.66 | 7.3 | $ | 5,303 | |||||||
Vested and expected to vest as of December 31, 2019 | 6,782 | $ | 7.66 | 7.3 | $ | 5,235 | |||||||
Options exercisable as of December 31, 2019 | 3,199 | $ | 7.82 | 5.3 | $ | 3,448 | |||||||
(1) Amounts represent the difference between the exercise price and the fair market value of common stock at December 31, 2019 of $8.00 per share for all in the money options outstanding. | |||||||||||||
During the years ended December 31, 2019, 2018 and 2017, total intrinsic value of stock options exercised was $0.2 million, $0.1 million and $10 thousand, respectively. Total cash received from employees as a result of stock option exercises in 2019, 2018 and 2017 was $0.4 million, $0.4 million and $0.1 million, respectively. Total fair values of stock options vested during 2019, 2018 and 2017 were $7.6 million, $2.7 million and $2.1 million, respectively.
Restricted Stock Units and Performance Restricted Stock Units (“PRSUs”)
The following table summarizes the activities of the Company’s RSUs and PRSUs under the Company’s equity incentive plans (in thousands, except per share data):
RSUs | PRSUs | |||||||||||||
Weighted- | Weighted- | |||||||||||||
Average | Average | |||||||||||||
Grant Date | Grant Date | |||||||||||||
Number of | Fair Value | Number of | Fair Value | |||||||||||
Shares | Per Share | Shares | Per Share | |||||||||||
Outstanding at December 31, 2018 | 788 | $ | 7.26 | 63 | $ | 7.42 | ||||||||
Granted | 190 | 6.62 | — | — | ||||||||||
Vested | (571 | ) | 7.39 | (63 | ) | 7.42 | ||||||||
Canceled | (73 | ) | 7.10 | — | — | |||||||||
Outstanding at December 31, 2019 | 334 | $ | 6.71 | — | $ | — | ||||||||
Upon vesting of certain RSUs and PRSUs, the Company withheld shares with value equivalent to the employees’ minimum statutory obligation for the applicable income and other employment taxes and remitted the cash to the appropriate taxing authorities. The number of shares withheld was based on the value of the RSUs or PRSUs on their vesting date as determined by the Company’s closing stock price. The withheld shares are reserved for future grant and issuance under the 2019 Plan.
Employee Stock Purchase Plans
The Company maintains two employee stock purchase plans - the ESPP and the NQ ESPP.
74
The ESPP allows eligible employees to purchase shares of the Company’s common stock through payroll deductions of up to 15% of their annual compensation subject to certain Internal Revenue Code limitations. In addition, no participant may purchase more than 2,000 shares of common stock in each offering period.
The offering periods under the ESPP are six-month periods commencing on May 15th and November 15th of each year. The price of common stock purchased under the ESPP is 85% of the lower of the fair market value of the common stock on the commencement date and the end date of each six-month offering period.
At the Company’s annual meeting of stockholders in May 2019, the stockholders approved an increase in the number of shares of common stock issuable under the ESPP by 2.5 million shares. The total shares authorized for issuance under the ESPP increased from 7.3 million shares to 9.8 million shares. For the year ended December 31, 2019, shares totaling 0.9 million were purchased and issued. As of December 31, 2019, there were 3.2 million shares available for future issuance.
The NQ ESPP allows eligible employees to purchase shares of the Company’s common stock through payroll deductions of up to 25% of their annual compensation. Eligible employees have the right to (a) purchase the maximum number of whole shares of common stock that can be purchased with the elected payroll deductions during each offering period for which the employee is enrolled at a purchase price equal to the closing price of the Company’s common stock on the last day of such offering period and (b) receive an equal number of shares of the Company’s common stock that are subject to a risk of forfeiture in the event the employee terminates employment within the one year period immediately following the purchase date. The NQ ESPP provides six-month offering periods commencing June 21st and December 21st of each year. At the Company’s annual meeting of stockholders in May 2018, the stockholders approved an amendment of certain terms and an increase in the number of shares of common stock issuable under the NQ ESPP by 2.5 million shares. The maximum number of shares of common stock currently authorized for issuance under the NQ ESPP as of December 31, 2019 is 3.5 million shares, with a maximum of 0.5 million shares allocated per purchase period. For the year ended December 31, 2019, 0.5 million shares were purchased and issued, with an additional equal number of shares issued subject to a risk of forfeiture. As of December 31, 2019, there were 2.0 million shares available for future issuance.
Stock-Based Compensation
During the years ended December 31, 2019, 2018 and 2017, the Company recorded stock-based compensation expense of $11.2 million, $17.5 million and $12.4 million, respectively.
The following table summarizes stock-based compensation expense (in thousands):
Years Ended December 31, | ||||||||||||
2019 | 2018 | 2017 | ||||||||||
Cost of revenue: | ||||||||||||
Products | $ | 507 | $ | 885 | $ | 473 | ||||||
Services | 389 | 363 | 276 | |||||||||
Research and development | 3,913 | 5,969 | 4,869 | |||||||||
Sales and marketing | 3,415 | 5,787 | 3,433 | |||||||||
General and administrative | 2,957 | 4,469 | 3,317 | |||||||||
$ | 11,181 | $ | 17,473 | $ | 12,368 | |||||||
The following table summarizes the weighted-average grant date fair values of the Company’s stock-based awards granted in the periods indicated:
Years Ended December 31, | ||||||||||||
2019 | 2018 | 2017 | ||||||||||
Stock options | $ | 3.66 | $ | 3.41 | $ | 3.19 | ||||||
RSUs | $ | 6.62 | $ | 6.66 | $ | 6.75 | ||||||
ESPP | $ | 2.04 | $ | 2.21 | $ | 1.76 | ||||||
Nonqualified ESPP | $ | 7.24 | $ | 7.34 | $ | 6.90 | ||||||
The Company values the RSUs and employee stock purchase rights under the Nonqualified ESPP at the closing market price of the Company’s common stock on the date of grant.
The probability of meeting the performance condition related to the PSOs granted in December 2017 was assessed as probable as of December 31, 2018. As a result, the Company recognized a stock-based compensation expense of $6.9 million in 2018 and $1.6 million in 2019, based on a fair value assessment as of the date of modification. The probability of meeting one of the performance conditions related to the PSOs granted in February 2019 was assessed as probable as of December 31, 2019. As a
75
result, the Company recognized a cumulative stock-based compensation expense of $0.5 million in 2019, based on a fair value assessment as of the date of modification.
The Company estimates the fair value of stock options and employee stock purchase right under the ESPP at the grant date using the Black-Scholes option-pricing model. This model requires the use of the following assumptions:
(i) | Expected volatility of the Company’s common stock – The Company computes its expected volatility assumption based on a blended volatility (50% historical volatility and 50% implied volatility from traded options on the Company’s common stock). The selection of a blended volatility assumption was based upon the Company’s assessment that a blended volatility is more representative of the Company’s future stock price trend as it weighs the historical volatility with the future implied volatility. |
(ii) | Expected life of the option award – Represents the weighted-average period that the stock options are expected to remain outstanding. The Company’s computation of expected life utilizes the simplified method in accordance with Staff Accounting Bulletin No. 110 (“SAB 110”) due to the lack of sufficient historical exercise data to provide a reasonable basis upon which to estimate expected term. The mid-point between the vesting date and the expiration date is used as the expected term under this method. |
(iii) | Expected dividend yield – Assumption is based on the Company’s history of not paying dividends and no future expectations of dividend payouts. |
(iv) | Risk-free interest rate – Based on the U.S. Treasury yield curve in effect at the time of grant with maturities approximating the grant’s expected life. |
The following table summarizes the weighted-average assumptions used in estimating the grant-date fair value of stock options and of each employee’s purchase right under the ESPP in the periods indicated:
Years Ended December 31, | |||||||||
Stock Options | 2019 | 2018 | 2017 | ||||||
Expected volatility | 47 | % | 50 | % | 52 | % | |||
Expected life (years) | 6.11 | 6.11 | 5.88 | ||||||
Expected dividend yield | — | — | — | ||||||
Risk-free interest rate | 1.67 | % | 2.83 | % | 2.10 | % | |||
Years Ended December 31, | |||||||||
ESPP | 2019 | 2018 | 2017 | ||||||
Expected volatility | 48 | % | 42 | % | 45 | % | |||
Expected life (years) | 0.49 | 0.50 | 0.49 | ||||||
Expected dividend yield | — | — | — | ||||||
Risk-free interest rate | 2.03 | % | 2.21 | % | 1.24 | % | |||
In addition, the Company applies an estimated forfeiture rate to awards granted and records stock-based compensation expense only for those awards that are expected to vest. Forfeiture rates are estimated at the time of grant based on the Company’s historical experience. Further, to the extent the Company’s actual forfeiture rate is different from management’s estimate, stock-based compensation is adjusted accordingly.
As of December 31, 2019, unrecognized stock-based compensation expenses by award type, net of estimated forfeitures, and their expected weighted-average recognition periods are summarized in the following table (in thousands).
December 31, 2019 | ||||||||||||
Stock Option | RSU | ESPPs | ||||||||||
Unrecognized stock-based compensation expense | $ | 5,327 | $ | 1,254 | $ | 4,208 | ||||||
Weighted-average amortization period (in years) | 2.9 | 0.6 | 1.1 | |||||||||
The Company expects to recognize stock-based compensation expense of $7.1 million in 2020, $2.0 million in 2021, $1.0 million in 2022 and $0.7 million in 2023.
76
Shares Reserved for Future Issuance
The Company had common shares reserved for future issuance as follows (in thousands):
December 31, | ||||||
2019 | 2018 | |||||
Stock options outstanding | 6,877 | 4,442 | ||||
Restricted stock units outstanding | 334 | 788 | ||||
Performance restricted stock units outstanding | — | 63 | ||||
Shares available for future grant under 2019 Plan | 2,034 | 2,306 | ||||
Shares available for future issuance under ESPP | 3,178 | 1,550 | ||||
Shares available for future issuance under Nonqualified ESPP | 2,021 | 2,764 | ||||
14,444 | 11,913 | |||||
8. Employee Benefit Plan
The Company sponsors a 401(k) tax-deferred savings plan for all employees who meet certain eligibility requirements. Participants may contribute, on a pre-tax basis, a percentage of their annual compensation, but not to exceed a maximum contribution amount pursuant to Section 401(k) of the Internal Revenue Code. The Company, at the discretion of the Board of Directors, may make additional matching contributions on behalf of the participants. The Company made matching contributions totaling $2.5 million, $2.5 million and $3.0 million in 2019, 2018 and 2017, respectively.
9. Accumulated Other Comprehensive Loss
The table below summarizes the changes in accumulated other comprehensive loss by component:
Foreign Currency Translation Adjustments | ||||
Balance at December 31, 2017 | $ | (169 | ) | |
Other comprehensive loss | (584 | ) | ||
Balance at December 31, 2018 | (753 | ) | ||
Other comprehensive loss | (101 | ) | ||
Balance at December 31, 2019 | $ | (854 | ) | |
Assets and liabilities of the Company’s wholly owned foreign subsidiaries are translated from their respective functional currencies at exchange rates in effect at the balance sheet date, and revenue and expenses are translated at the monthly average exchanges rates. These translations result in differences called foreign currency translation adjustments. Realized foreign currency transaction gains or losses were not significant during the years ended December 31, 2019, 2018 and 2017 and are recorded in “Other income (expense), net” in the Company's Consolidated Statements of Comprehensive Loss.
10. Income Taxes
The domestic and foreign components of loss before provision for incomes taxes were as follows (in thousands):
Years Ended December 31, | ||||||||||||
2019 | 2018 | 2017 | ||||||||||
Domestic | $ | (17,935 | ) | $ | (20,463 | ) | $ | (84,387 | ) | |||
Foreign | 1,403 | 1,695 | 2,598 | |||||||||
$ | (16,532 | ) | $ | (18,768 | ) | $ | (81,789 | ) | ||||
77
Provision for income taxes consisted of the following (in thousands):
Years Ended December 31, | ||||||||||||
2019 | 2018 | 2017 | ||||||||||
Current: | ||||||||||||
State | $ | 313 | $ | 105 | $ | 115 | ||||||
Foreign | 835 | 360 | 577 | |||||||||
Current income tax | 1,148 | 465 | 692 | |||||||||
Deferred foreign income tax | 14 | 65 | 551 | |||||||||
$ | 1,162 | $ | 530 | $ | 1,243 | |||||||
The differences between the statutory tax rate and the effective tax rate, expressed as a percentage of loss before income taxes, were as follows:
Years Ended December 31, | |||||||||
2019 | 2018 | 2017 | |||||||
Federal statutory rate | 21.0 | % | 21.0 | % | 34.0 | % | |||
State statutory rate | 5.6 | 5.7 | 4.5 | ||||||
Foreign operations | (2.8 | ) | 0.3 | 0.5 | |||||
R&D tax credits | 6.2 | 7.2 | 2.7 | ||||||
Foreign income inclusion | (1.3 | ) | (1.2 | ) | (0.1 | ) | |||
Non-deductible stock compensation | (5.1 | ) | (4.3 | ) | (3.7 | ) | |||
Other permanent items | (2.0 | ) | (1.6 | ) | (0.4 | ) | |||
Tax true-up | (11.8 | ) | (2.3 | ) | (1.7 | ) | |||
Valuation allowance | (16.9 | ) | (25.6 | ) | 67.3 | ||||
Tax reform | — | — | (104.6 | ) | |||||
ASC 606 adjustment | — | (2.0 | ) | — | |||||
Effective tax rate | (7.1 | )% | (2.8 | )% | (1.5 | )% | |||
The significant components of the Company’s deferred tax assets were as follows (in thousands):
December 31, | ||||||||
2019 | 2018 | |||||||
Deferred tax assets: | ||||||||
Net operating loss carryforwards | $ | 135,019 | $ | 132,420 | ||||
Tax credit carryforwards | 47,324 | 46,884 | ||||||
Depreciation and amortization | 1,541 | 1,924 | ||||||
Accruals and reserves | 9,316 | 10,021 | ||||||
Deferred revenue | 8,488 | 7,815 | ||||||
Stock-based compensation | 4,761 | 4,447 | ||||||
Intangible assets | (111 | ) | 37 | |||||
Other | (10 | ) | 5 | |||||
Gross deferred tax assets | 206,328 | 203,553 | ||||||
Valuation allowance | (206,339 | ) | (203,550 | ) | ||||
$ | (11 | ) | $ | 3 | ||||
All deferred tax assets, along with any related valuation allowance, are classified in the Consolidated Balance Sheet as long-term.
Management reviews the recognition of deferred tax assets to determine if realization of such assets is more likely than not. The realization of the Company’s deferred tax assets is dependent upon future earnings. The Company has been in a cumulative loss position since inception, which represents a significant piece of negative evidence. Using the more likely than not criteria specified in the applicable accounting guidance, this negative evidence cannot be overcome by positive evidence currently available to the Company. As a result, the Company has established a full valuation allowance against its deferred tax assets with the exception of certain foreign deferred tax assets. The Company’s valuation allowance increased by $2.8 million and $4.8 million for the years ended December 31, 2019 and 2018, respectively.
78
As of December 31, 2019, the Company had U.S. federal and state net operating losses of approximately $608.9 million and $216.4 million, respectively. The U.S. federal net operating loss carryforwards have begun to expire and will continue to expire at various dates through 2039 if not utilized. The state net operating loss carryforwards have begun to expire and will continue to expire at various dates through 2039, if not utilized. Additionally, the Company has U.S. federal, California and other U.S. states research and development credits of approximately $35.0 million, $36.2 million and $3.0 million, respectively, as of December 31, 2019. The U.S. federal research and development credits will begin to expire in 2020 and the California research and development credits have no expiration date. The credits related to other various U.S. states have begun to expire and will continue to expire at various dates through 2034.
In 2019, the Company reassessed its plan to continue to reinvest its foreign earnings overseas. The Company no longer asserts ASC 740-30 indefinite reinvestment of its historical non-U.S. earnings or future non-U.S. earnings. As such, the Company recorded a tax expense of $0.6 million for the estimated withholding, state income tax and foreign income tax associated with repatriating non-U.S. earnings back to the United States.
Uncertain Tax Positions
ASC 740, “Income Taxes,” prescribes a recognition threshold and measurement attribute to the financial statement recognition and measurement of a tax position taken or expected to be taken in a tax return. The guidance also provides guidance on derecognition, classification, accounting in interim periods and disclosure requirements for uncertain tax positions. The standard requires the Company to recognize the financial statement effects of an uncertain tax position when it is more likely than not that such position will be sustained upon audit. The Company recognizes accrued interest and penalties related to unrecognized tax benefits as interest expense and income tax expense, respectively, in statements of comprehensive loss.
The following table reconciles the Company’s unrecognized tax benefits (in thousands):
Years Ended December 31, | ||||||||
2019 | 2018 | |||||||
Balance at beginning of year | $ | 21,998 | $ | 20,289 | ||||
Addition (reduction) for tax positions related to prior year | (382 | ) | 516 | |||||
Additions for tax positions related to current year | 648 | 1,193 | ||||||
Balance at end of year | $ | 22,264 | $ | 21,998 | ||||
As of December 31, 2019 and 2018, the Company had unrecognized tax benefits of $22.3 million and $22.0 million, respectively, none of which would affect the Company’s effective tax rate if recognized. There were no accrued interest or penalties for uncertain income tax as of December 31, 2019.
The Company files tax returns in the United States and various state jurisdictions, the United Kingdom, China and Brazil. The tax years 2000 through 2019 remain open and subject to examination by the appropriate governmental agencies in the U.S. due to tax attribute carryforwards.
11. Net Loss Per Common Share
The following table sets forth the computation of basic and diluted net loss per common share for the periods indicated (in thousands, except per share data):
Years Ended December 31, | ||||||||||||
2019 | 2018 | 2017 | ||||||||||
Numerator: | ||||||||||||
Net loss | $ | (17,694 | ) | $ | (19,298 | ) | $ | (83,032 | ) | |||
Denominator: | ||||||||||||
Weighted-average common shares outstanding | 54,993 | 52,609 | 50,155 | |||||||||
Basic and diluted net loss per common share | $ | (0.32 | ) | $ | (0.37 | ) | $ | (1.66 | ) | |||
Potentially dilutive shares, weighted-average | 6,607 | 5,833 | 3,446 | |||||||||
Unvested restricted stock awards are included in the calculation of basic weighted-average shares because such shares are participating securities; however, the impact was immaterial.
Potentially dilutive shares have been excluded from the computation of diluted net loss per common share when their effect is antidilutive. These antidilutive shares were primarily from stock options and RSUs. For each of the periods presented where the Company reported a net loss, the effect of all potentially dilutive securities would be antidilutive, and as a result diluted net loss per common share is the same as basic net loss per common share.
79
12. Revenue from Contracts with Customers
The Company develops, markets and sells communications access systems and software, and there are no segment managers who are held accountable for operations, operating results and plans for levels or components below the Company unit level. Accordingly, the Company is considered to be in a single reporting segment and operating unit structure. The Company’s chief operating decision maker is the Company’s Chief Executive Officer, who reviews financial information presented on a Company-wide basis, for purposes of allocating resources and evaluating financial performance.
Geographic Information:
The following is a summary of revenue by geographic region based upon the location of the customers (in thousands):
Years Ended December 31, | ||||||||||||
2019 | 2018 | 2017 (1) | ||||||||||
United States | $ | 365,586 | $ | 386,341 | $ | 452,956 | ||||||
Middle East | 18,664 | 18,814 | 18,267 | |||||||||
Canada | 14,531 | 10,542 | 13,105 | |||||||||
Europe | 11,480 | 8,858 | 6,575 | |||||||||
Caribbean | 5,809 | 7,075 | 9,853 | |||||||||
Other | 8,260 | 9,690 | 9,611 | |||||||||
$ | 424,330 | $ | 441,320 | $ | 510,367 | |||||||
(1) | Revenue amounts are accounted for under ASC 605 for 2017. |
The Company’s property and equipment, net of accumulated depreciation, are located in the following geographical areas (in thousands):
December 31, | ||||||||
2019 | 2018 | |||||||
United States | $ | 20,510 | $ | 23,249 | ||||
China | 1,017 | 1,696 | ||||||
$ | 21,527 | $ | 24,945 | |||||
Contract Asset
The primary contract asset is revenue recognized on professional services contracts where the services are transferred to the customer over time, which has yet to be billed, and is classified within accounts receivable. Amounts are billed in accordance with the agreed-upon contractual terms. The balance at December 31, 2018 was $5.9 million of which $1.0 million remained in the Company's Consolidated Balance Sheet at December 31, 2019. The closing balance at December 31, 2019 was $5.0 million of which the Company expects to bill 82% of the balance during 2020. The decrease in the contract asset was driven by the timing and volume of professional services contracts with a major customer in fiscal 2019 partially offset by additional business from other customers.
Contract Liability
Deferred revenue consisted of the following (in thousands):
December 31, | ||||||||
2019 | 2018 | |||||||
Current: | ||||||||
Products and services | $ | 12,480 | $ | 11,600 | ||||
Extended warranty | 4,678 | 4,000 | ||||||
17,158 | 15,600 | |||||||
Long-term: | ||||||||
Products and services | 790 | 440 | ||||||
Extended warranty | 17,550 | 17,056 | ||||||
18,340 | 17,496 | |||||||
$ | 35,498 | $ | 33,096 | |||||
80
The increase in the deferred revenue balance for the year ended December 31, 2019 is primarily driven by cash payments received or due in advance of satisfying the Company's performance obligations, offset by $15.0 million of revenue recognized that was included in the deferred revenue balance at the beginning of the year.
Revenue allocated to remaining performance obligations represent contract revenue that has not yet been recognized for contracts greater than one year, which includes deferred revenue and amounts that will be invoiced and recognized as revenue in future periods. This amount was $57.7 million as of December 31, 2019, and the Company expects to recognize 40% of such revenue over the next 12 months and the remainder thereafter.
Contract Costs
The Company capitalizes certain sales commissions related primarily to extended warranty and Calix Cloud products for which the expected amortization period is greater than one year. As of December 31, 2019, the unamortized balance of deferred commissions was $0.7 million. For the year ended December 31, 2019, the amount of amortization was $0.2 million, and there was no impairment loss in relation to the costs capitalized.
Concentration of Customer Risk
Concentrations of credit risk in relation to customers with an accounts receivable balance of 10% or greater of total accounts receivable and customers with net revenue of 10% or greater of total revenue are presented below for the periods indicated.
Percentage of Accounts Receivable | Percentage of Revenue | |||||||||
December 31, | Years Ended December 31, | |||||||||
2019 | 2018 | 2019 | 2018 | 2017 | ||||||
CenturyLink | 17% | 16% | 15% | 18% | 31% | |||||
13. Product Line Divestiture
In February 2018, the Company sold its outdoor cabinet product line to Clearfield, Inc. (“Clearfield”) for $10.4 million in cash as well as the assumption by Clearfield of the related product warranty liabilities and open purchase order commitments with a CM. The Company transferred $2.1 million in net inventory and agreed to solicit orders on Clearfield’s behalf on the newly transferred outdoor cabinets product lines free of charge for 15 months. The Company established a liability of $1.6 million in deferred revenue for providing this service and amortized this amount to service revenue over the corresponding 15-month period. The Company also recognized a $6.7 million gain for the year ended December 31, 2018 within operating expenses in the accompanying Consolidated Statements of Comprehensive Loss.
14. Quarterly Financial Data—Unaudited
The Company’s fiscal year begins on January 1st and ends on December 31st. Quarterly periods are based on a 4-4-5 fiscal calendar with the first, second and third fiscal quarters ending on the 13th Saturday of each fiscal period. As a result, the Company had one fewer day in the first quarter of 2019 and one more day in the fourth quarter of 2019 than in the respective 2018 periods.
81
The following table presents selected unaudited quarterly financial data of the Company (in thousands, except per share data). The Company’s quarterly results of operations for these periods are not necessarily indicative of future results of operations.
Fiscal Year 2019 Quarter Ended | ||||||||||||||||
March 30 | June 29 | September 28 | December 31 | |||||||||||||
Revenue | $ | 89,350 | $ | 100,304 | $ | 114,485 | $ | 120,191 | ||||||||
Gross profit | 38,343 | 44,668 | 50,202 | 54,712 | ||||||||||||
Operating income (loss) | (9,113 | ) | (4,931 | ) | (2,851 | ) | 1,494 | |||||||||
Net income (loss) | (9,767 | ) | (5,045 | ) | (3,379 | ) | 497 | |||||||||
Net income (loss) per common share, basic and diluted | $ | (0.18 | ) | $ | (0.09 | ) | $ | (0.06 | ) | $ | 0.01 | |||||
Fiscal Year 2018 Quarter Ended | ||||||||||||||||
March 31 | June 30 | September 29 | December 31 | |||||||||||||
Revenue | $ | 99,403 | $ | 111,702 | $ | 114,699 | $ | 115,516 | ||||||||
Gross profit | 42,059 | 50,866 | 52,833 | 51,624 | ||||||||||||
Operating income (loss) | (11,109 | ) | (2,926 | ) | 676 | (5,155 | ) | |||||||||
Net income (loss) | (11,736 | ) | (2,793 | ) | 809 | (5,578 | ) | |||||||||
Net income (loss) per common share, basic and diluted | $ | (0.23 | ) | $ | (0.05 | ) | $ | 0.02 | $ | (0.10 | ) | |||||
15. Subsequent Event
In January 2020, the Company terminated the SVB Loan Agreement and entered into a new loan and security agreement with Bank of America, N.A. The new loan and security agreement (“BofA Loan Agreement”) provides for a revolving facility up to a principal amount of up to $35.0 million, including a $10.0 million sublimit for letters of credit. The BofA Loan Agreement matures, and all outstanding amounts become due and payable, in January 2023. The BofA Loan Agreement is secured by substantially all of the Company’s assets, including the Company’s intellectual property. Loans under the credit facility will bear interest at a rate per annum equal to LIBOR (customarily defined) plus an applicable margin between 1.50% to 2.25% and Prime Rate (customarily defined) plus an applicable margin between 0.50% to 1.25%, in each case largely based on a fixed charge coverage ratio measured at the end of each fiscal quarter. The Availability (as defined in the BofA Loan Agreement) of borrowings under the BofA Loan Agreement is subject to certain conditions and requirements, including among others, if at any time the Company’s Availability is less than $5.0 million, the Company must maintain a minimum fixed charge coverage ratio of 1.0 to 1.0.
82
ITEM 9. | Changes in and Disagreements with Accountants on Accounting and Financial Disclosure |
There were no changes in nor any disagreements with accountants on accounting principles or practices, financial statement disclosure, auditing scope or procedures, or other reportable events requiring disclosure pursuant to Item 304(b) of Regulation S-K.
ITEM 9A. | Controls and Procedures |
Evaluation of Disclosure Controls and Procedures
As of the end of the period covered by this report, which we refer to as the evaluation date, we carried out an evaluation under the supervision and with the participation of management, including our principle executive officer and principle financial officer, of our disclosure controls and procedures (as defined in Rules 13a-15(e) and 15d-15(e) under the Exchange Act).
The purpose of this evaluation was to determine whether as of the evaluation date our disclosure controls and procedures were effective to provide reasonable assurance that the information we are required to disclose in our filings with the SEC, (i) is recorded, processed, summarized and reported within the time periods specified in the SEC’s rules and forms and (ii) accumulated and communicated to our management, including our principal executive officer and our principal financial officer, as appropriate to allow timely decisions regarding required disclosure. Based upon this evaluation, our principal executive officer and our principal financial officer concluded that our disclosure controls and procedures were effective as of the end of the period covered by this report.
Management’s Report on Internal Control Over Financial Reporting
Management is responsible for establishing and maintaining adequate internal control over financial reporting. Our internal control over financial reporting is designed to provide reasonable assurance regarding the reliability of financial reporting and the preparation of financial statements for external purposes in accordance with generally accepted accounting principles. Because of its inherent limitations, internal control over financial reporting may not prevent or detect misstatements. Also, projections of any evaluation of effectiveness to future periods are subject to the risk that controls may become inadequate because of changes in conditions, or that the degree of compliance with the policies or procedures may deteriorate. Management has evaluated the effectiveness of our internal control over financial reporting as of December 31, 2019 using the criteria set forth in the Internal Control—Integrated Framework issued by the Committee of Sponsoring Organizations of the Treadway Commission, or COSO, (2013 framework). Based on our evaluation, management has concluded that we maintained effective control over financial reporting as of December 31, 2019 based on the COSO criteria. The effectiveness of our internal control over financial reporting as of December 31, 2019 has been audited by KPMG LLP, an independent registered public accounting firm, as stated in their report included in this Annual Report on Form 10-K.
Limitations on the Effectiveness of Controls
Our disclosure controls and procedures provide our principal executive officer and our principal financial officer reasonable assurances that our disclosure controls and procedures will achieve their objectives. However, our management, including our principal executive officer and our principal financial officer, does not expect that our disclosure controls and procedures or our internal control over financial reporting can or will prevent all human error. A control system, no matter how well designed and implemented, can provide only reasonable, not absolute, assurance that the objectives of the control system are met. Furthermore, the design of a control system must reflect the fact that there are internal resource constraints, and the benefit of controls must be weighed relative to their corresponding costs. Because of the limitations in all control systems, no evaluation of controls can provide complete assurance that all control issues and instances of error, if any, within our company are detected. These inherent limitations include the realities that judgments in decision-making can be faulty, and that breakdowns can occur due to human error or mistake. Additionally, controls, no matter how well designed, could be circumvented by the individual acts of specific persons within the organization. The design of any system of controls is also based in part upon certain assumptions about the likelihood of future events, and there can be no assurance that any design will succeed in achieving its stated objectives under all potential future conditions.
Changes in Internal Control over Financial Reporting
There was no change in our internal control over financial reporting identified in connection with the evaluation required by Rule 13a-15(d) and 15d-15(d) of the Exchange Act that occurred during the fourth quarter of 2019 that has materially affected, or is reasonably likely to materially affect, our internal control over financial reporting.
ITEM 9B. | Other Information |
None.
83
PART III
ITEM 10. | Directors, Executive Officers and Corporate Governance |
Information required by this Item 10 relating to our directors is incorporated by reference to the information set forth under the captions “Proposal No. 1—Election of Directors” and “Director Compensation” and in other applicable sections of the Proxy Statement for the 2020 Annual Meeting of Stockholders to be filed with the Securities and Exchange Commission pursuant to Regulation 14A of the Exchange Act, or the Proxy Statement, to be filed within 120 days of the end of the fiscal year covered by this Report. Information required by this Item 10 relating to our officers is incorporated by reference to the information set forth under the captions “Executive Officers” and “Executive Compensation” and in other applicable sections of the Proxy Statement. Information regarding our Section 16 reporting compliance is incorporated by reference to the information set forth under the captions “Security Ownership of Certain Beneficial Owners and Management” and “Section 16(a) Beneficial Ownership Reporting Compliance” of the Proxy Statement.
We have adopted a code of ethics, which applies to all employees, officers and directors of Calix. The Code of Business Conduct and Ethics meets the requirements of a “code of ethics” as defined by Item 406 of Regulation S-K, and applies to our Chief Executive Officer, Chief Financial Officer and all other employees, as indicated above. The Code of Business Conduct and Ethics also meets the requirements of a code of conduct under NYSE listing standards. The Code of Business Conduct and Ethics is posted on our website at www.calix.com under the links “About - Investor Relations - Governance - Code of Conduct.” We intend to disclose any amendments to the Code of Business Conduct and Ethics, as well as any waivers for executive officers or directors, on our website at www.calix.com.
ITEM 11. | Executive Compensation |
Information required by this Item 11 relating to executive compensation and other matters is incorporated by reference to the information set forth under the caption “Compensation Discussion and Analysis” and in other applicable sections of the Proxy Statement.
ITEM 12. | Security Ownership of Certain Beneficial Owners and Management and Related Stockholder Matters |
Information required by this Item 12 relating to security ownership of certain beneficial owners and management and related stockholder matters is incorporated by reference to the information set forth under the caption “Security Ownership of Certain Beneficial Owners and Management” and in other applicable sections of the Proxy Statement. Information regarding securities authorized for issuance under our equity compensation plans is incorporated by reference to the information set forth under the caption “Equity Compensation Plan Information” of the Proxy Statement.
ITEM 13. | Certain Relationships and Related Transactions, and Director Independence |
Information required by this Item 13 relating to certain relationships and related transactions and director independence is incorporated by reference to the information set forth under the caption “Certain Relationships and Related Transactions” and in other applicable sections of the Proxy Statement.
ITEM 14. | Principal Accountant Fees and Services |
Information required by this Item 14 relating to principal account fees and services is incorporated by reference to the information set forth under the caption “Principal Accountant Fees and Services” of the Proxy Statement.
84
PART IV
ITEM 15. | Exhibits, Financial Statement Schedules |
(a) The following documents are filed as part of this Report:
1. Consolidated Financial Statements
The consolidated financial statements of Calix and the report of independent registered public accounting firm thereon are set forth under Part II, Item 8 of this report.
2. Consolidated Financial Statement Schedules
All schedules have been omitted because they are not applicable, not required, not presently in amounts sufficient to require submission of the schedule, or the information required to be set forth therein is included in the consolidated financial statements or notes thereto.
3. Exhibits
The following exhibits are filed with or incorporated by reference in this report. Where such filing is made by incorporation by reference to a previously filed registration statement or report, such registration statement or report is identified in parentheses. We will furnish any exhibit upon request to: Calix Investor Relations, Thomas J. Dinges at Tom.Dinges@calix.com.
Exhibit | ||
Number | Description | |
3.1 | ||
3.2 | ||
4.1 | ||
4.2 | ||
10.1* | ||
10.2 | ||
10.3* | ||
10.4* | ||
10.5* | ||
10.6* | ||
85
Exhibit | ||
Number | Description | |
10.7* | ||
10.8* | ||
10.9* | ||
10.10* | ||
10.11* | ||
10.12* | ||
10.13* | ||
10.14 | ||
10.15 | ||
10.16* | ||
10.17* | ||
10.18* | ||
10.19* | ||
10.20* | ||
10.21* | ||
10.22† | ||
10.23 | ||
21.1 | ||
23.1 | ||
24.1 | ||
31.1 | ||
31.2 | ||
32.1 | ||
101.INS | XBRL Instance Document | |
101.SCH | XBRL Taxonomy Extension Schema Document | |
101.CAL | XBRL Taxonomy Extension Calculation Linkbase Document | |
101.DEF | XBRL Taxonomy Extension Definition Linkbase Document | |
101.LAB | XBRL Taxonomy Extension Label Linkbase Document | |
101.PRE | XBRL Taxonomy Extension Presentation Linkbase Document | |
* | Indicates management contract or compensatory plan or arrangement. | |
† | Information in this exhibit identified by [*] is confidential and has been excluded pursuant to Item 601(b)(10)(iv) of Regulation S-K because it (i) is not material or (ii) would likely cause competitive harm to Calix if publicly disclosed. | |
86
ITEM 16. | Form 10-K Summary |
None.
87
SIGNATURES
Pursuant to the requirements of the Securities Exchange Act of 1934, the Registrant has duly caused this report to be signed on its behalf by the undersigned thereunto duly authorized.
Calix, Inc. (Registrant) | ||||
Dated: | February 21, 2020 | By: | /s/ Carl Russo | |
Carl Russo | ||||
Chief Executive Officer (Principal Executive Officer) | ||||
Dated: | February 21, 2020 | By: | /s/ Cory Sindelar | |
Cory Sindelar | ||||
Chief Financial Officer (Principal Financial Officer) | ||||
88
POWER OF ATTORNEY
Each person whose individual signature appears below hereby authorizes and appoints Carl Russo and Cory Sindelar, and each of them, with full power of substitution and re-substitution and full power to act without the other, as his true and lawful attorney-in-fact and agent to act in his name, place and stead and to execute in the name and on behalf of each person, individually and in each capacity stated below, and to file any and all amendments to this Annual Report on Form 10-K, and to file the same, with all exhibits thereto, and other documents in connection therewith, with the Securities and Exchange Commission, granting unto said attorneys-in-fact and agents, and each of them, full power and authority to do and perform each and every act and thing, ratifying and confirming all that said attorneys-in-fact and agents or any of them or their or his substitute or substitutes may lawfully do or cause to be done by virtue thereof.
Pursuant to the requirements of the Securities Exchange Act of 1934, this report has been signed below by the following persons on behalf of the registrant and in the capacities indicated on February 21, 2020.
Signature | Title | Date | ||
/s/ Carl Russo | Chief Executive Officer and Director (Principal Executive Officer) | February 21, 2020 | ||
Carl Russo | ||||
/s/ Cory Sindelar | Chief Financial Officer (Principal Financial Officer) | February 21, 2020 | ||
Cory Sindelar | ||||
/s/ Don Listwin | Chairman of the Board of Directors | February 21, 2020 | ||
Don Listwin | ||||
/s/ Christopher Bowick | Director | February 21, 2020 | ||
Christopher Bowick | ||||
/s/ Kathy Crusco | Director | February 21, 2020 | ||
Kathy Crusco | ||||
/s/ Kevin DeNuccio | Director | February 21, 2020 | ||
Kevin DeNuccio | ||||
/s/ Michael Everett | Director | February 21, 2020 | ||
Michael Everett | ||||
/s/ Kira Makagon | Director | February 21, 2020 | ||
Kira Makagon | ||||
/s/ Michael Matthews | Director | February 21, 2020 | ||
Michael Matthews | ||||
/s/ Kevin Peters | Director | February 21, 2020 | ||
Kevin Peters | ||||
/s/ J. Daniel Plants | Director | February 21, 2020 | ||
J. Daniel Plants | ||||
89