Attached files
| file | filename |
|---|---|
| EX-32.2 - EXHIBIT 32.2 - HORNBECK OFFSHORE SERVICES INC /LA | ex32210k12312019.htm |
| EX-32.1 - EXHIBIT 32.1 - HORNBECK OFFSHORE SERVICES INC /LA | ex32110k12312019.htm |
| EX-31.2 - EXHIBIT 31.2 - HORNBECK OFFSHORE SERVICES INC /LA | ex31210k12312019.htm |
| EX-31.1 - EXHIBIT 31.1 - HORNBECK OFFSHORE SERVICES INC /LA | ex31110k12312019.htm |
| EX-21 - EXHIBIT 21 - HORNBECK OFFSHORE SERVICES INC /LA | ex2110k12312019.htm |
| EX-10.50 - EXHIBIT 10.50 - HORNBECK OFFSHORE SERVICES INC /LA | ex105010k12312019.htm |
| EX-4.26 - EXHIBIT 4.26 - HORNBECK OFFSHORE SERVICES INC /LA | ex42610k12312019.htm |
UNITED STATES
SECURITIES AND EXCHANGE COMMISSION
WASHINGTON, D.C. 20549
FORM 10-K
ý | ANNUAL REPORT PURSUANT TO SECTION 13 OR 15(d) OF THE SECURITIES EXCHANGE ACT OF 1934 |
For the Fiscal Year Ended December 31, 2019
OR
¨ | TRANSITION REPORT PURSUANT TO SECTION 13 OR 15(d) OF THE SECURITIES EXCHANGE ACT OF 1934 |
For the Transition Period from to
Commission File Number 001-32108
Hornbeck Offshore Services, Inc.
(Exact Name of Registrant as Specified in Its Charter)
Delaware | 72-1375844 | |
(State or other jurisdiction of incorporation or organization) | (I.R.S. Employer Identification Number) | |
103 NORTHPARK BOULEVARD, SUITE 300
COVINGTON, LA 70433
(Address of Principal Executive Offices) (Zip Code)
(985) 727-2000
(Registrant’s Telephone Number, Including Area Code)
Securities registered pursuant to Section 12(b) of the Act:
Class | Trading Symbol | Name of exchange on which registered | ||
None | None | None | ||
Securities registered pursuant to Section 12(g) of the Act: None
Indicate by check mark if the registrant is a well-known seasoned issuer, as defined in Rule 405 of the Securities Act. Yes o No x
Indicate by check mark if the registrant is not required to file reports pursuant to Section 13 or Section 15(d) of the Act. Yes o No x
Indicate by check mark whether the Registrant: (1) has filed all reports required to be filed by Section 13 or 15(d) of the Securities Exchange Act of 1934 during the preceding 12 months (or for such shorter period that the Registrant was required to file such reports), and (2) has been subject to such filing requirements for the past 90 days. Yes o No x
Indicate by check mark whether the registrant has submitted electronically every Interactive Data File required to be submitted pursuant to Rule 405 of Regulation S-T (§232.405 of this chapter) during the preceding 12 months (or for such shorter period that the registrant was required to submit such files). Yes x No o
Indicate by check mark whether the registrant is a large accelerated filer, an accelerated filer, a non-accelerated filer, a smaller reporting company, or an emerging growth company. See the definitions of “large accelerated filer,” “accelerated filer,” “smaller reporting company,” and "emerging growth company" in Rule 12b-2 of the Exchange Act.
Large accelerated filer ☐ | Accelerated filer ☐ | |
Non-accelerated filer x | Smaller reporting company x | |
Emerging growth company ☐ | ||
If an emerging growth company, indicate by check mark if the registrant has elected not to use the extended transition period for complying with any new or revised financial accounting standards provided pursuant to Section 13(a) of the Exchange Act. ☐
Indicate by check mark whether the registrant is a shell company (as defined in Rule 12b-2 of the Exchange Act). Yes ¨ No x
The aggregate market value of the Common Stock held by non-affiliates computed by reference to the price at which the Common Stock was last sold as of the last business day of registrant’s most recently completed second fiscal quarter is $43,514,494.
The number of outstanding shares of Common Stock as of June 30, 2020 is 39,638,729 shares.
DOCUMENTS INCORPORATED BY REFERENCE
None
HORNBECK OFFSHORE SERVICES, INC. AND SUBSIDIARIES
FORM 10-K
FOR THE FISCAL YEAR ENDED DECEMBER 31, 2019
TABLE OF CONTENTS
i
Forward Looking Statements
This Annual Report on Form 10-K contains “forward-looking statements,” as contemplated by the Private Securities Litigation Reform Act of 1995, in which the Company discusses factors it believes may affect its performance in the future. Forward-looking statements are all statements other than historical facts, such as statements regarding assumptions, expectations, beliefs and projections about future events or conditions. You can generally identify forward-looking statements by the appearance in such a statement of words like “anticipate,” “believe,” “continue,” “could,” “estimate,” “expect,” “forecast,” “intend,” “may,” “might,” “plan,” “potential,” “predict,” “project,” “remain,” “should,” “will,” “would," or other comparable words or the negative of such words. The accuracy of the Company’s assumptions, expectations, beliefs and projections depends on events or conditions that change over time and are thus susceptible to change based on actual experience, new developments and known and unknown risks. The Company gives no assurance that the forward-looking statements will prove to be correct and does not undertake any duty to update them. The Company’s actual future results might differ from the forward-looking statements made in this Annual Report on Form 10-K for a variety of reasons, including our ability to obtain the Bankruptcy Court’s approval with respect to post-confirmation motions or other requests made to the Bankruptcy Court in the Chapter 11 Cases; any delays in consummation of the Chapter 11 Cases; risks that our assumptions and analyses in the Plan are incorrect; our ability to comply with the covenants under our DIP Credit Agreement; the effects of the Chapter 11 Cases on our business and the interest of various constituents; the actions and decisions of creditors, regulators and other third parties that have an interest in the Chapter 11 Cases; restrictions imposed on us by the Bankruptcy Court; impacts from changes in oil and natural gas prices in the U.S. and worldwide; continued weakness in demand and/or pricing for the Company’s services; unplanned customer suspensions, cancellations, rate reductions or non-renewals of vessel charters, or vessel management contracts, or failures to finalize commitments to charter or manage vessels; continued weakness in capital spending by customers on offshore exploration and development; the inability to accurately predict vessel utilization levels and dayrates; sustained weakness in the number of deepwater and ultra-deepwater drilling units operating in the GoM or other regions where the Company operates; the impact on the foregoing as a result of the COVID-19 pandemic and the
recent oil price war initiated by Russia and Saudi Arabia; the Company’s inability to successfully complete the final two vessels of its current vessel newbuild program on-budget, including any failure or refusal by the issuer of performance bonds to honor the bond contract or to cover cost overruns that may result at a completion shipyard; the inability to successfully market the vessels that the Company owns, is constructing or might acquire; any cancellation or non-renewal by the government of the management, operations and maintenance contracts for non-owned vessels; an oil spill or other significant event in the United States or another offshore drilling region that could have a broad impact on deepwater and other offshore energy exploration and production activities, such as the suspension of activities or significant regulatory responses; the imposition of laws or regulations that result in reduced exploration and production activities or that increase the Company’s operating costs or operating requirements; environmental litigation that impacts customer plans or projects; disputes with customers; bureaucratic, administrative operating or court-imposed barriers that prevent or delay vessels in foreign markets from going or remaining on-hire; administrative, judicial or political barriers to exploration and production activities in Mexico, Brazil or other foreign locations; disruption in the timing and/or extent of Mexican offshore activities or changes in law or governmental policy in Mexico that restricts or slows the pace of further development of its offshore oilfields; changes in law or governmental policy or judicial action in Mexico affecting the Company's Mexican registration of vessels; administrative or other legal changes in Mexican cabotage laws; other legal or administrative changes in Mexico that adversely impact planned or expected offshore energy development; unanticipated difficulty in effectively competing in or operating in international markets; less than anticipated subsea infrastructure and field development demand in the Greater GoM Operating Region and other markets affecting the Company's MPSVs; sustained vessel over capacity for existing demand levels in the markets in which the Company competes; economic and geopolitical risks; weather-related risks; upon a return to improved operating conditions, the shortage of or the inability to attract and retain qualified personnel, when needed, including vessel personnel for active vessels or vessels the
ii
Company may reactivate or acquire; any success by others in unionizing any of the Company's U.S. fleet personnel; regulatory risks; the repeal or administrative weakening of the Jones Act or adverse changes in the interpretation of the Jones Act; drydocking delays and cost overruns and related risks; vessel accidents, pollution incidents or other events resulting in lost revenue, fines, penalties or other expenses that are unrecoverable from insurance policies or other third parties; unexpected litigation and insurance expenses; other industry risks; fluctuations in foreign currency valuations compared to the U.S. dollar and risks associated with expanded foreign operations, such as non-compliance with or the unanticipated effect of tax laws, customs laws, immigration laws, or other legislation that result in higher than anticipated tax rates or other costs; the inability to repatriate foreign sourced earnings and profits; the extent of the pending loss or material limitation of the Company's tax net operating loss carryforwards and other attributes due to a change in control, as defined in Section 382 of the Internal Revenue Code; our ability to successfully conclude negotiations of the new first-lien and second-lien exit credit facilities to be entered into in connection with consummation of the Plan; the potential for any impairment charges that could arise in the future and that would reduce the Company’s consolidated net tangible assets which, in turn, would further limit the Company’s ability to grant certain liens, make certain investments, and incur certain debt permitted under the Company’s senior notes indentures and term loan agreements; or the impact of “fresh-start” accounting, which will be applicable to the Company upon consummation of the Plan. In addition, the Company’s future results may be impacted by adverse economic conditions, such as inflation, deflation, lack of liquidity in the capital markets or an increase in interest rates, that may negatively affect it or parties with whom it does business resulting in their non-payment or inability to perform obligations if and when required. Should one or more of the foregoing risks or uncertainties materialize in a way that negatively impacts the Company, or should the Company’s underlying assumptions prove incorrect, the Company’s actual results may vary materially from those anticipated in its forward-looking statements, and its business, financial condition and results of operations could be materially and adversely affected and, if sufficiently severe, could result in noncompliance with certain covenants of the Company's existing indebtedness. Additional factors that you should consider are set forth in detail in the “Risk Factors” section of this Annual Report on Form 10-K as well as other filings the Company has made and will make with the Securities and Exchange Commission which, after their filing, can be found on the Company’s website, www.hornbeckoffshore.com.
The Company makes references to certain industry-related terms in this Annual Report on Form 10-K. A glossary and definitions of such terms can be found in "Item 9B—Other Information" on page 42.
iii
PART I
Item 1—Business
RECENT DEVELOPMENTS
Joint Prepackaged Chapter 11 Plan of Reorganization
As previously reported, effective April 13, 2020, the Company, on behalf of itself and certain of its subsidiaries, together with the Company, collectively, the Debtors, entered into a Restructuring Support Agreement, or the RSA, with secured lenders holding approximately 83% of the Company’s aggregate secured indebtedness and unsecured noteholders holding approximately 79% of the Company’s aggregate unsecured notes outstanding related to a balance sheet restructuring of the Company to be implemented through a voluntary prepackaged Chapter 11 case in the United States Bankruptcy Court for the Southern District of Texas, Houston Division, or the Bankruptcy Court.
On May 19, 2020, in accordance with the RSA, the Company sought voluntary relief under chapter 11 of the United States Bankruptcy Code, or the Chapter 11 Cases, in the Bankruptcy Court and filed a proposed joint prepackaged plan of reorganization, or the Plan.
On June 19, 2020, after a confirmation hearing, the Bankruptcy Court entered a confirmation order approving the Plan. The Plan will become effective after the conditions to its effectiveness have been satisfied. The effect of the Plan is to de-lever the Company’s balance sheet through a conversion into equity or warrants or both of 1) a portion of the $350 million in first-lien term loans that mature in June 2023; 2) $121 million in second-lien term loans that mature in February 2025; 3) $224 million outstanding under our 2020 senior notes indenture, and; 4) $450 million outstanding under our 2021 senior notes indenture. The holders of first lien term loans will also receive their pro rata portion of the second-lien term loans issued as part of the Exit Financings. All pre-petition equity interests in the Company will be cancelled, released, and extinguished on the effective date of the Plan, and will thereafter be of no further force or effect.
Holders of other claims will either receive payment in full in cash or otherwise have their rights reinstated under the Bankruptcy Code, or such claims will be cancelled, released, discharged, and extinguished or be given such other treatment as set forth in the Plan. In addition, upon emergence from the Chapter 11 Cases, pursuant to a rights offering of shares of the Company's new common stock, or the Rights Offering, the Company will receive from certain pre-petition secured and unsecured creditors an equity investment of $100 million. Additionally, the Company will enter into a new first-lien term loan in an aggregate principal amount determined in accordance with the Plan and a maturity date on the fourth anniversary of the Closing Date. The Company will also enter into a new second-lien term loan in an aggregate principal amount determined in accordance with the Plan and a maturity date of March 31, 2026.
The Company anticipates emerging from the Chapter 11 Cases upon receipt of certain governmental approvals from U.S. and other governmental authorities. The Company expects to receive the required approvals promptly following the completion by such governmental authorities of their reviews. In addition, the Company will be required to finalize the terms of the Exit Financings prior to emergence.
DIP Credit Agreement
In connection with the filing of the Plan, on May 22, 2020, the Debtors entered into a debtor-in-possession credit agreement on the terms set forth in a Superpriority Debtor-in-Possession Term Loan Agreement, or the DIP Credit Agreement, by and among the Company, as Parent Borrower, Hornbeck Offshore Services, LLC, as Co-Borrower, the lenders party thereto, or the DIP Lenders, and Wilmington Trust, National Association, as Administrative Agent and Collateral Agent, pursuant to which, the DIP Lenders agreed to provide us with loans in an aggregate principal amount not to exceed $75 million that, among other things, was used to repay in full $50 million in loans outstanding under our senior credit agreement, and to finance our ongoing general corporate needs during the course of the Chapter 11 Cases.
The maturity date of the DIP Credit Agreement is six months following the effective date of the DIP Credit Agreement. The DIP Credit Agreement contains customary events of default, including events related to the Chapter 11 Cases, the occurrence of which could result in the acceleration of our obligation to repay the outstanding indebtedness under the DIP Credit Agreement. Our obligations under the DIP Credit Agreement are secured by a first priority security
1
interest in, and lien on, substantially all of our present and after-acquired property (whether tangible, intangible, real, personal or mixed) and has been guaranteed by all of the Company’s material subsidiaries.
Delisting of our Common Stock from the New York Stock Exchange
Our common stock traded on the New York Stock Exchange, or NYSE under the symbol “HOS” until December 20, 2019, at which time it was suspended from trading on the NYSE due to our inability to satisfy the continued listing requirements of the NYSE. Our common stock subsequently traded on the OTCQB Market under the symbol “HOSS” until May 20, 2020, at which time, due to our voluntary filing of the Chapter 11 Cases, our common stock commenced trading on the OTC Pink Marketplace under the trading symbol “HOSSQ”. The Company anticipates deregistering its
common stock under the Securities Exchange Act of 1934 shortly after the filing of this Form 10-K and the Company is
scheduled to exit the Chapter 11 Cases as a private, non-reporting, company.
Going Concern and Financial Reporting in Reorganization
Until the Company emerges from the Chapter 11 Cases, there remains substantial doubt about our ability to continue as a going concern. The accompanying consolidated financial statements have been prepared in conformity with accounting principles generally accepted in the United States of America that contemplate the continuation of the Company as a going concern.
COMPANY OVERVIEW
Hornbeck Offshore Services, Inc. was incorporated under the laws of the State of Delaware in 1997. In this Annual Report on Form 10-K, references to “Company,” “we,” “us,” “our” or like terms refer to Hornbeck Offshore Services, Inc. and its subsidiaries, except as otherwise indicated. We are a leading provider of marine transportation, subsea oilfield installation and accommodation support services to exploration and production, oilfield service, offshore construction and U.S. military customers. Since our establishment, we have primarily focused on providing innovative technologically advanced marine solutions to meet the evolving needs of the deepwater and ultra-deepwater energy industry in domestic and select foreign locations. Throughout our history, we have expanded our fleet of vessels primarily through a series of new vessel construction programs, as well as through acquisitions of existing vessels. We maintain our headquarters at 103 Northpark Boulevard, Covington, Louisiana, 70433; our telephone number is (985) 727-2000. Our website is www.hornbeckoffshore.com.
We own and operate one of the youngest and largest fleets of U.S.-flagged, new generation OSVs and MPSVs. In late 2011, we commenced our fifth OSV newbuild program, which also includes the construction of MPSVs. Since that time, we have grown our new generation fleet from 51 OSVs and four MPSVs to 66 OSVs and eight MPSVs. Upon completion of the last two vessels to be delivered under this newbuild program, our expected fleet will be comprised of 66 OSVs and ten MPSVs. Together, these vessels support the deep-well, deepwater and ultra-deepwater activities of the offshore oil and gas industry. Such activities include oil and gas exploration, field development, production, construction, installation, IRM, well-stimulation and other enhanced oil recovery activities. We have also developed a specialized application of our new generation OSVs for use by the U.S. military. Our new generation OSVs and MPSVs have enhanced capabilities that allow us to more effectively support the premium drilling and installation equipment and facilities required for the offshore deep-well, deepwater and ultra-deepwater energy industry. We are one of the top two operators of domestic high-spec new generation OSVs and MPSVs and one of the top four operators of such equipment worldwide, based on DWT. Our fleet is among the youngest in the industry, with a weighted-average age, based on DWT, of eleven years.
While we have historically operated our vessels predominately in the U.S. GoM, we have diversified our market presence and now operate in three core geographic markets: the GoM, Mexico and Brazil. In addition to our core markets, we frequently operate in other foreign regions on a project or term charter basis. We have operated in the Middle East, the Mediterranean Sea, the Black Sea, the Bahamas and in other locations in Latin America, including Nicaragua, Guyana, Trinidad and Argentina. We have further diversified by providing specialized vessel solutions to non-oilfield customers, such as the United States military as well as oceanographic research and other customers that utilize sophisticated marine platforms in their operations. In addition, we have provided vessel management services for other vessel owners, such as crewing, daily operational management and maintenance activities. We also operate a shore-base support facility located in Port Fourchon, Louisiana. See "Item 2-Properties" for a listing of our shoreside support facilities.
2
Although all of our vessels are physically capable of operating in both domestic and international waters, approximately 72% are qualified under Section 27 of the Merchant Marine Act of 1920, as amended, or the Jones Act, to engage in the U.S. coastwise trade. The two remaining vessels being constructed under our fifth OSV newbuild program are also expected to be eligible for Jones Act coastwise trading privileges. Foreign owned, flagged, built or crewed vessels are restricted in their ability to conduct U.S. coastwise trade and are typically excluded from such trade in the GoM. Of the public company OSV peer group, we own the largest fleet of Jones Act-qualified, new generation OSVs and MPSVs, which we believe offers us a competitive advantage in the GoM. From time to time, we may elect to reflag certain of our vessels to the flag of another nation. We have reflagged 17 Jones Act-qualified OSVs and one Vanuatu-flagged MPSV to Mexican and other flags, including one OSV under Brazilian registry. We believe we currently own and operate one of the youngest and largest fleets of Mexican-flagged new generation OSVs and MPSVs. Once a Jones Act-qualified vessel is reflagged or a new vessel is foreign flagged, it permanently loses the right to engage in U.S. coastwise trade.
We intend to continue our efforts post-emergence from the Chapter 11 Cases through up cycles and down cycles to maximize stockholder value through our long-term return-oriented growth strategy. We will, as opportunities arise, acquire or construct additional vessels, as well as divest certain assets that we consider from time-to-time to be non-core or otherwise not in line with our long-term strategy or prevailing industry trends.
DESCRIPTION OF OUR BUSINESS
The Deepwater Offshore Energy Industry
The modern quest to explore for and produce energy resources located offshore began in the 1940s. While these offshore operations began in shallow waters, relatively close to shore, technological advances have permitted them to migrate to ever deeper waters and well depths. Until the late 1970s, most offshore activity was technologically and logistically restricted to that which was accessible on the continental shelf, or waters of up to about 500 feet of depth. Since that time, a number of advances have opened drilling regions in deepwater. The initial push into deeper waters was facilitated through the development of “floating” drilling units that could be positioned over a drilling site without being fixed to the seafloor. Petrobras pioneered these techniques in Brazil beginning in the late 1970s as it lacked an accessible “shallow water” continental shelf. The first deepwater project in the United States Gulf of Mexico was completed in 1993 in nearly 3,000 feet of water by Shell Oil Company. That Shell facility produced a then unheard of 46,000 barrels per day from a reservoir tapped at 25,000 feet well depth. Today, exploration and production activities have pushed into the ultra-deepwater, where wells are routinely drilled in water depths of more than 8,000 feet, the deepest having been drilled in approximately 10,000 feet of water.
In addition to the ability to operate in very deep water, technological advances have also allowed hydrocarbon resources to be detected, drilled for and produced at extreme well depths. “Pre-salt” discoveries in Brazil are being drilled and produced in waters exceeding 5,000 feet and at well depths of more than 35,000 feet. In 2014, Chevron announced first oil from its Jack/St. Malo facility in the GoM, which is currently producing previously undetectable lower tertiary hydrocarbons at a rate of over 100,000 barrels per day from deposits more than 20,000 feet below the seabed situated in 7,000 feet of water. In addition to contending with extreme deepwater and deep well depths, these projects present challenges involving high temperatures and pressures within reservoirs and the associated difficulties of safely bringing those resources to the surface and then transporting them to shoreside locations. Despite these challenges, today deepwater production accounts for approximately 90% of all offshore production in the United States. The GoM production is expected to account for 16% and 18% of total forecast U.S. crude oil production in 2020 and 2021, respectively.
Deepwater Regions
The energy industry has had success in many deepwater regions throughout the world. Deepwater drilling efforts are underway in the Mediterranean Sea, the Indian Ocean and Asia. However, the so-called “golden triangle” of deepwater activity is comprised of deposits found offshore West Africa, the Eastern coast of South America - dominated by Brazil and more recently, Guyana - and the GoM. Our core markets are the U.S. GoM, Mexico and Brazil.
As large international oil companies were pushed out of participating in many regions of the world by national oil companies intent upon retaining for themselves the economic benefits of national exploitation, the deepwater GoM grew in significance. The deepwater GoM is among the most abundant hydrocarbon regions in the world. Political stability in the United States and accessibility of deepwater lease blocks allows major oil companies to plan, execute and finance the significant long-term commitments that deepwater success requires. While the scale and complexity associated with
3
deepwater projects is considerable, the significant size of the resource discoveries allows companies to replenish reserves on a large scale from relatively few projects. Unlike most onshore exploration and production projects, deepwater projects require long-lead times to plan and execute, but also enjoy long production lives once online. For instance, the first exploratory wells at the Jack/St. Malo fields were drilled in 2003 and 2004 and first oil was not produced until 2014. Now online, Chevron projects that the Jack/St. Malo fields are expected to produce an estimated 500 million oil equivalent barrels over 30 years. Consequently, short term fluctuations in oil and gas prices typically do not have the same impact on sanctioned deepwater projects as such fluctuations may have on other onshore and continental shelf projects. As a result of the severity and length of current on-going commodity price declines, some previously sanctioned deepwater projects have, nevertheless, been deferred and the pace of newly sanctioned projects in the deepwater GoM has slowed considerably since 2015.
Emerging opportunities for the deepwater offshore energy industry are presented by recent changes in Mexico and Brazil, two of our core markets, which have both recently expanded access to their deepwater regions to foreign operators. In December 2013, the Mexican congress ended PEMEX's 75 year-old monopoly on drilling activities in Mexico and voted in favor of allowing the government to grant contracts and licenses for exploration and production of oil and gas to foreign firms, which previously had been prohibited under Mexico’s constitution. In December 2016, Mexico conducted its first ever deepwater auctions, which drew bids from several major integrated oil companies, as well as several independent oil companies on 10 deepwater opportunities. In January 2018, Mexico completed a second round of deepwater auctions, awarding 19 of 29 deepwater blocks and in 2018, companies began exploration activities on the deepwater blocks that were awarded.
Brazil, through its state-owned national oil company, Petrobras, has been a pioneer in deepwater drilling and remains a dominant player in the global deepwater energy industry. Petrobras claims approximately 12 billion barrels of proven deepwater and ultra-deepwater resources, the vast majority of which are located in pre-salt formations, which were the driving force behind an ambitious national plan to dramatically increase production by 2024 to 3.5 million barrels per day. These plans were sidelined by declines in the price of oil combined with a wide reaching corruption probe involving Petobras. In light of these difficulties being experienced by Petrobras, in 2016, the Brazilian Congress determined to re-open the vast Brazilian pre-salt regions to foreign operators.
The Subsea Oilfield
Deepwater successes have driven further innovation around the infrastructure required to produce and transport ashore the abundant resources that have been discovered. In shallower regions, once hydrocarbons are discovered, they are typically produced by installing a fixed platform over the well site onto which are installed all of the equipment and infrastructure necessary to produce the hydrocarbons and move them ashore through pipelines. Platforms also provide a locale from which well maintenance and similar activities can be performed. The size, pressures, temperatures and water depths of deepwater hydrocarbon deposits require enormous amounts of infrastructure to develop, produce and maintain their wells. These challenges have pushed the development of technologies to allow infrastructure to be placed directly onto the seafloor, as opposed to a fixed platform. The process of building out this subsea oilfield requires the use of vessels to transport infrastructure to location, install infrastructure to subsea points and inspect, repair and maintain it throughout the multi-decade life of the field. When hydrocarbons are brought to the surface, they are gathered from multiple subsea locations through pipelines to a single deepwater floating "top-side" production facility. These "top-side" production facilities take years to design, engineer, transport, install and, often, cost billions of dollars and represent a significant source of demand for vessel services during their installation and commissioning. More recently, deepwater producers have capitalized on their existing deepwater infrastructure to gain efficiencies through the use of so-called "tie-backs". A tie-back allows a deepwater well to be produced without having to install a new top-side facility by "tying the well back" to a near-by existing top-side facility accessible to the well location. Tie-backs require the installation of subsea infrastructure to connect the well to the remote "top-side" facility.
4
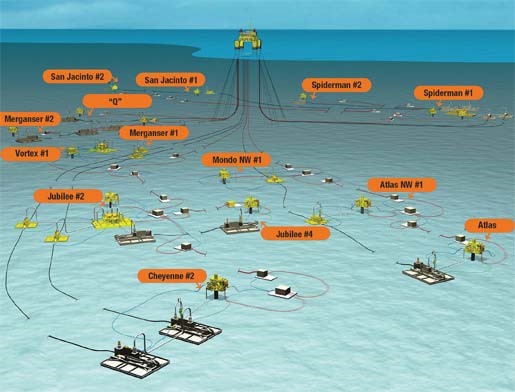
Depiction of a GoM Subsea Deepwater Oilfield
OSVs
OSVs primarily serve exploratory and developmental drilling rigs and production facilities and support offshore and subsea construction, installation, IRM and decommissioning activities. OSVs differ from other ships primarily due to their cargo-carrying flexibility and capacity. In addition to transporting deck cargo, such as pipe or drummed material and equipment, OSVs also transport liquid mud, potable and drilling water, diesel fuel, dry bulk cement and personnel between shore-bases and offshore rigs and production facilities. Deepwater environments require OSVs with capabilities that allow them to more effectively support drilling and related subsea construction projects that occur far from shore, in deepwater and increasingly at extreme well depths. In order to best serve these projects, we have designed our various classes of new generation vessels in a manner that seeks to maximize their liquid mud and dry bulk cement capacities, as well as their larger areas of open deck space. Deepwater operations also require vessels having dynamic positioning, or anchorless station-keeping capability, driven primarily by safety concerns that preclude vessels from physically mooring to floating deepwater installations. DP systems have experienced steady increases in technology over time with the highest DP rating currently being DP-3. The number following the DP notation generally indicates the degree of redundancy built into the vessel’s systems and the range of usefulness of the vessel in deepwater construction and subsea operations. Higher numbers represent greater DP capabilities. Today, deepwater drilling operations in the GoM overwhelmingly prefer a DP-2 notation and a vessel with 2,500 DWT capacity or greater. We consider these vessels to be high-spec new generation OSVs. Currently, 59 of our vessels are DP-2 and two are DP-3. The two remaining MPSVs contracted to be constructed under our fifth newbuild program are expected to be DP-2. Ultra-deepwater projects, which occur in waters of greater than 5,000 feet, are driving a need for DP-2 vessels with very large capacities. The distance of these projects from shore, together with their water and well depths dictate the use of massive volumes of bulk drilling materials and related supplies. The OSVs that have been delivered as part of our fifth OSV newbuild program are among the largest in the world. With DWT capacities of 5,500 DWT to 6,200 DWT, we believe these ultra high-spec vessels provide our ultra-deepwater drilling customers vessel solutions that help them to maximize efficiencies and improve the logistical challenges prevalent in their projects.
Vessels that do not carry at least a DP-2 notation or have less than 2,500 DWT capacity typically operate in more shallow U.S. waters or in foreign locations in which DP-2 has not yet emerged as the dominant standard. Currently, 18 of our vessels are low-spec, comprising 13% of our fleet by DWT. The remaining 87% of our fleet is considered high-spec, including roughly 60% of our overall fleet that is ultra high-spec.
5
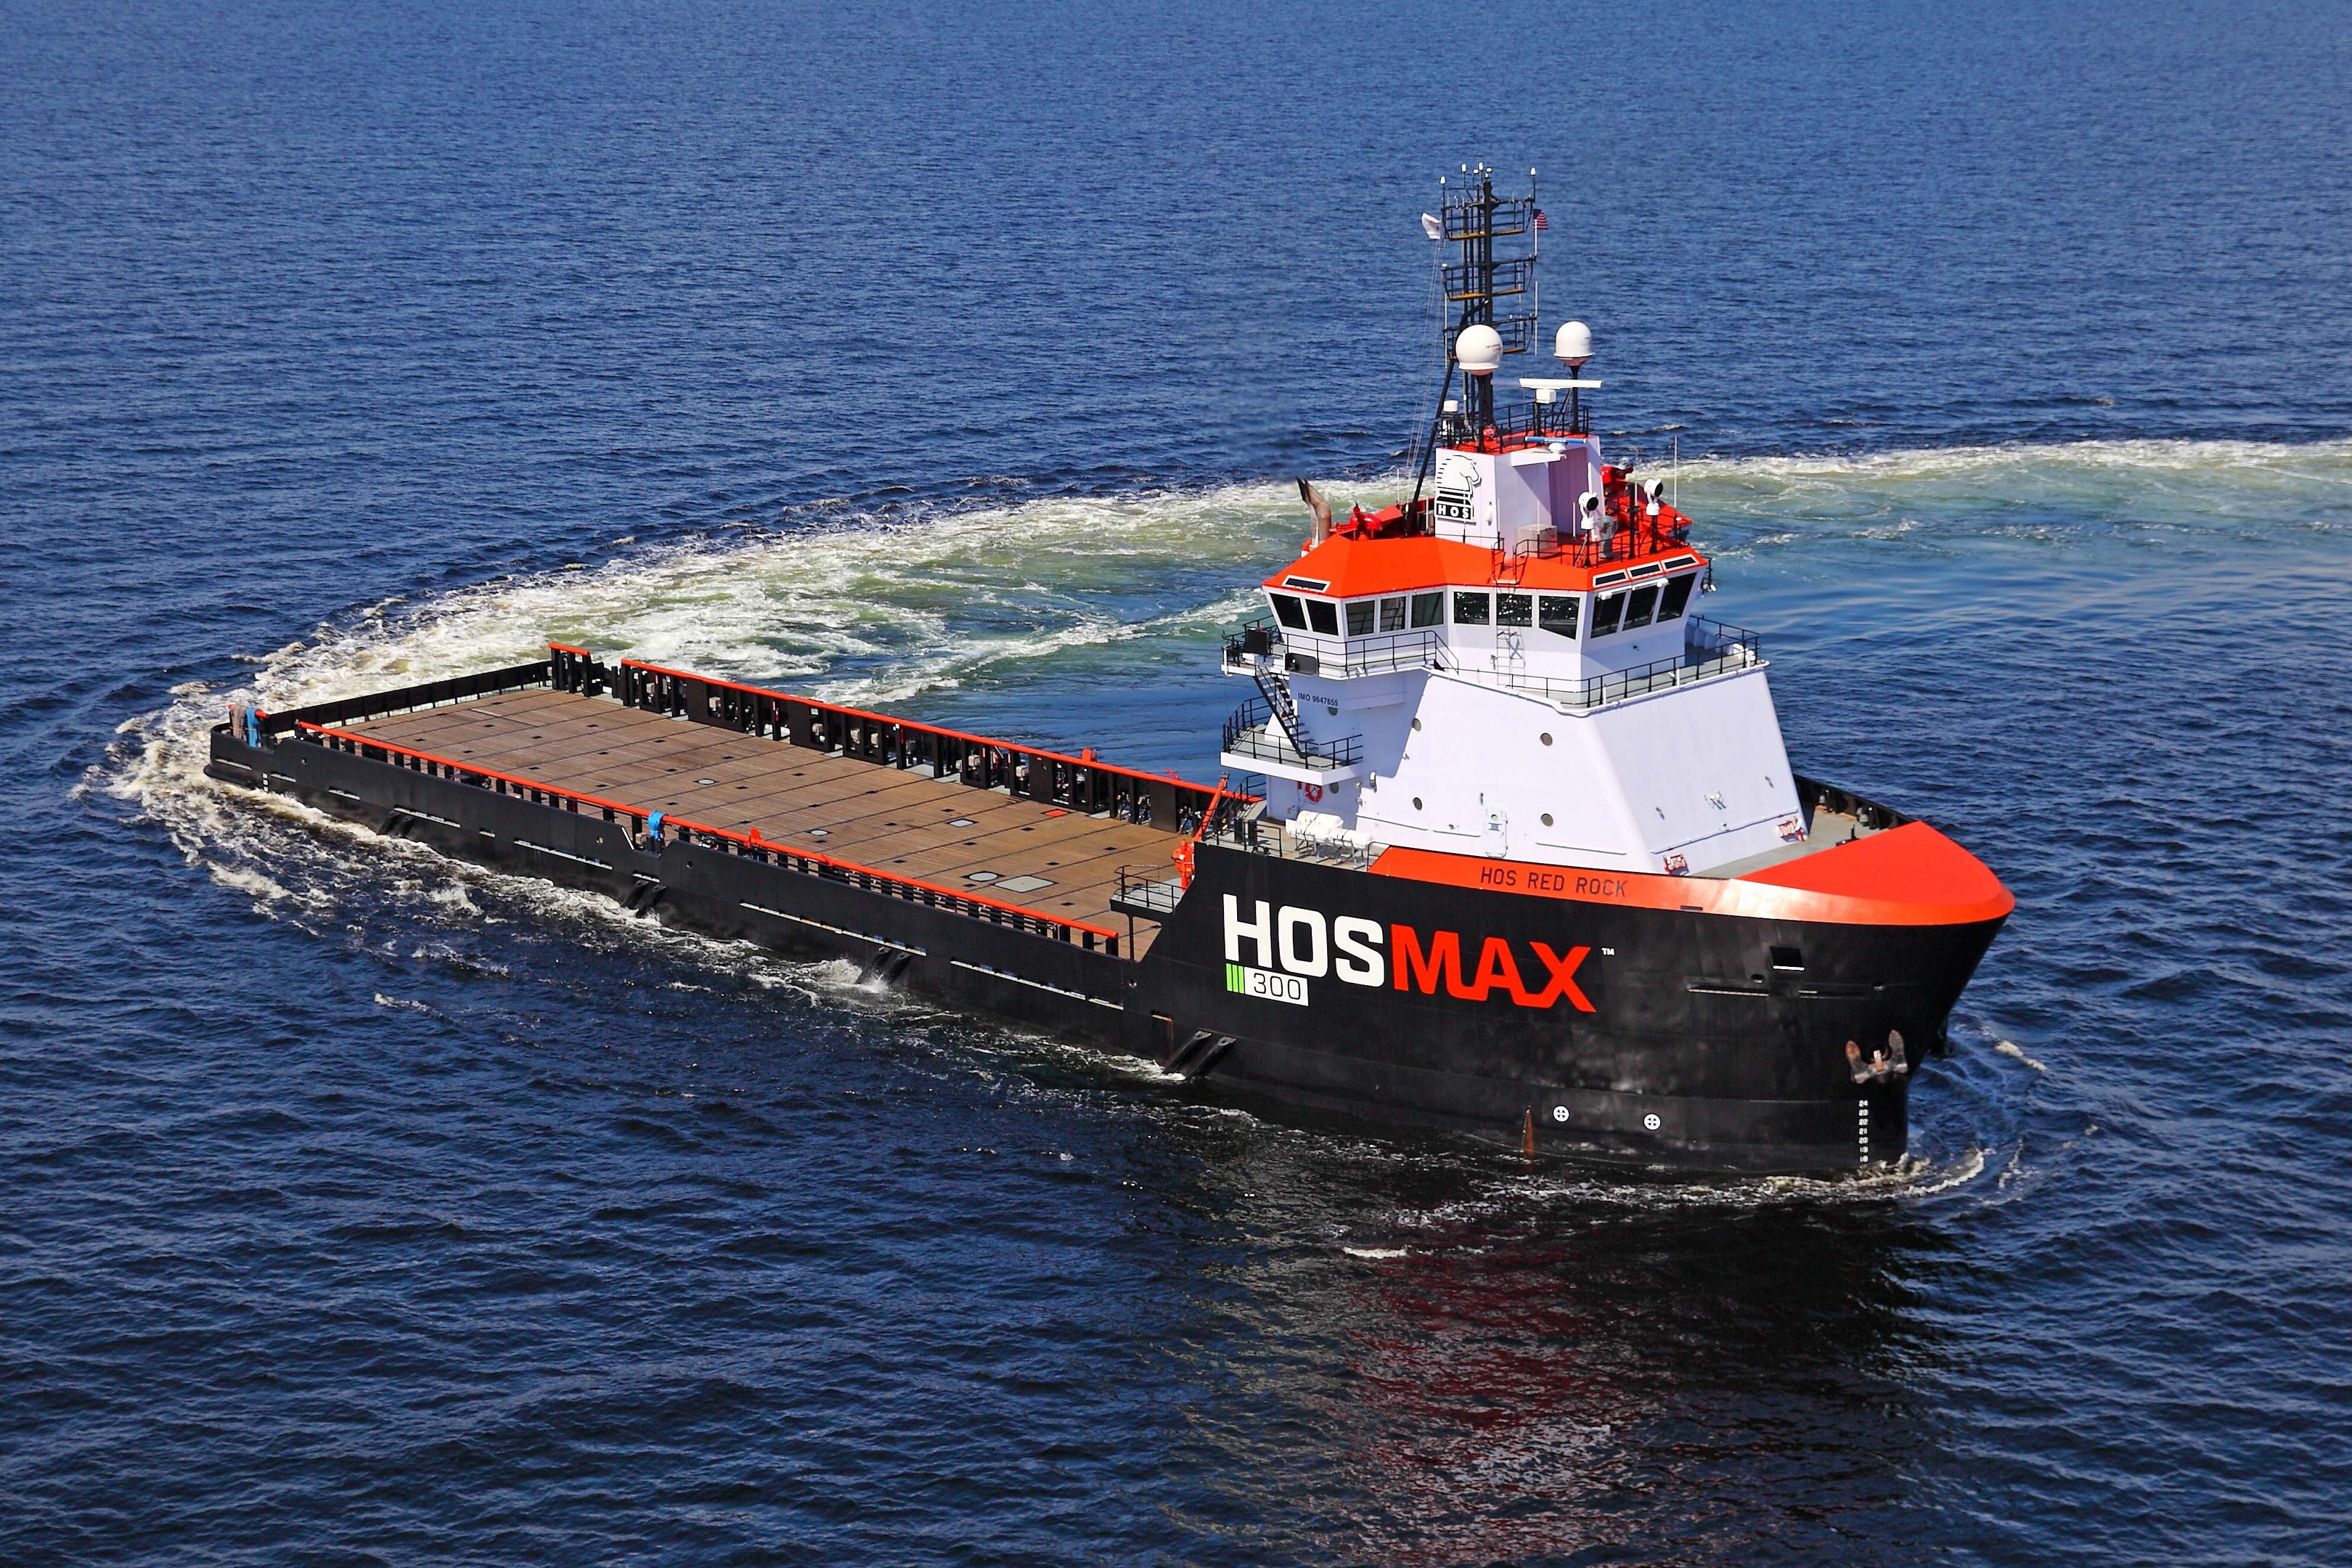

Two ultra high-spec HOSMAX OSVs
MPSVs
MPSVs also support the deepwater activities of the energy industry. MPSVs are distinguished from OSVs in that they are more specialized and often significantly larger vessels that are principally used for IRM activities, such as the subsea installation of well heads, risers, jumpers, umbilicals and other equipment placed on the seafloor. MPSVs are also utilized in connection with the setting of pipelines, the commissioning and de-commissioning of offshore facilities, the maintenance and/or repair of subsea equipment and the intervention of such wells, well testing and flow-back operations and other sophisticated deepwater operations. To perform these various functions, MPSVs are or can be equipped with a variety of lifting and deployment systems, including large capacity cranes, winches or reel systems, well intervention equipment, ROVs and accommodation facilities. The typical MPSV is outfitted with one or more deepwater cranes employing active heave compensation technology, one or more ROVs, a helideck and expansive accommodations for the offshore crew, including customer personnel. MPSVs can also be outfitted as a flotel to provide accommodations to large numbers of offshore construction and technical personnel involved in large-scale offshore projects, such as the commissioning of a floating offshore production facility. When in a flotel mode, the MPSV provides living quarters for third-party personnel, catering, laundry, medical services, recreational facilities, offices and as a helicopter heliport for the embarkation and disembarkation of offshore personnel. In addition, flotels coordinate and help to provide the facilities necessary for the offshore workers being accommodated to safely move from the vessel to other offshore structures being supported through the use of articulated gangways that allow personnel to "walk to work." Generally, MPSVs command higher dayrates than OSVs due to their significantly larger relative size and versatility, as well as higher construction and operating costs.
370 class MPSVs
We have devised MPSVs that, in addition to the array of services described above, are also capable of being utilized to transport deck or bulk cargoes in capacities exceeding most other new generation OSVs. We own and operate two proprietary 370 class DP-2 new generation MPSVs with such capabilities. These MPSVs have approximately double the deadweight and triple the liquid mud barrel-capacity of one of our 265 class new generation OSVs and more than four times the liquid mud barrel-capacity of one of our 240 class new generation OSVs. Moreover, with their large tanks, these MPSVs have assisted in large volume deepwater well testing and flow-back operations, as well as supporting large drilling operations in remote or harsh conditions. Both of our 370 class MPSVs uniquely have certifications by the USCG that permit Jones Act-qualified operations as a supply vessel, industrial/construction vessel and as a petroleum and chemical tanker under subchapters “L”, “I”, “D”, and “O”, respectively. We believe that these vessels are not only the largest supply vessels in the world, but are also the only vessels in the world to have received all four of these certifications.
400 class and 310 class MPSVs
Until recently, due to a lack of Jones Act-qualified MPSVs, many customers would charter an OSV to carry equipment to location, which was then installed by a foreign flag MPSV. By eliminating the need for two vessels, we believe our customers will improve efficiencies and mitigate operational risks. Our Jones Act-qualified MPSVs are equipped with a heave-compensated knuckle-boom crane, helideck, accommodations for approximately 90-100 persons and are suitable for two or more work-class ROVs. Moreover, our Jones Act-qualified MPSVs are also equipped with below-deck cargo tanks, allowing them to expand their mission utility to include services more typically provided by OSVs.
6
We currently expect to take delivery of two 400 class MPSVs in the second and third quarters of 2022. Because our 400 class and 310 class MPSVs are Jones Act-qualified, we expect that they will enable our customers to transport equipment from shore to the installation site to be installed by the MPSV without needing to use a second (domestic) vessel for transport like foreign-flagged MPSVs are required to do. We believe that, once delivered, the 400 class MPSVs will be the largest and most capable Jones Act-qualified MPSVs available in the market.
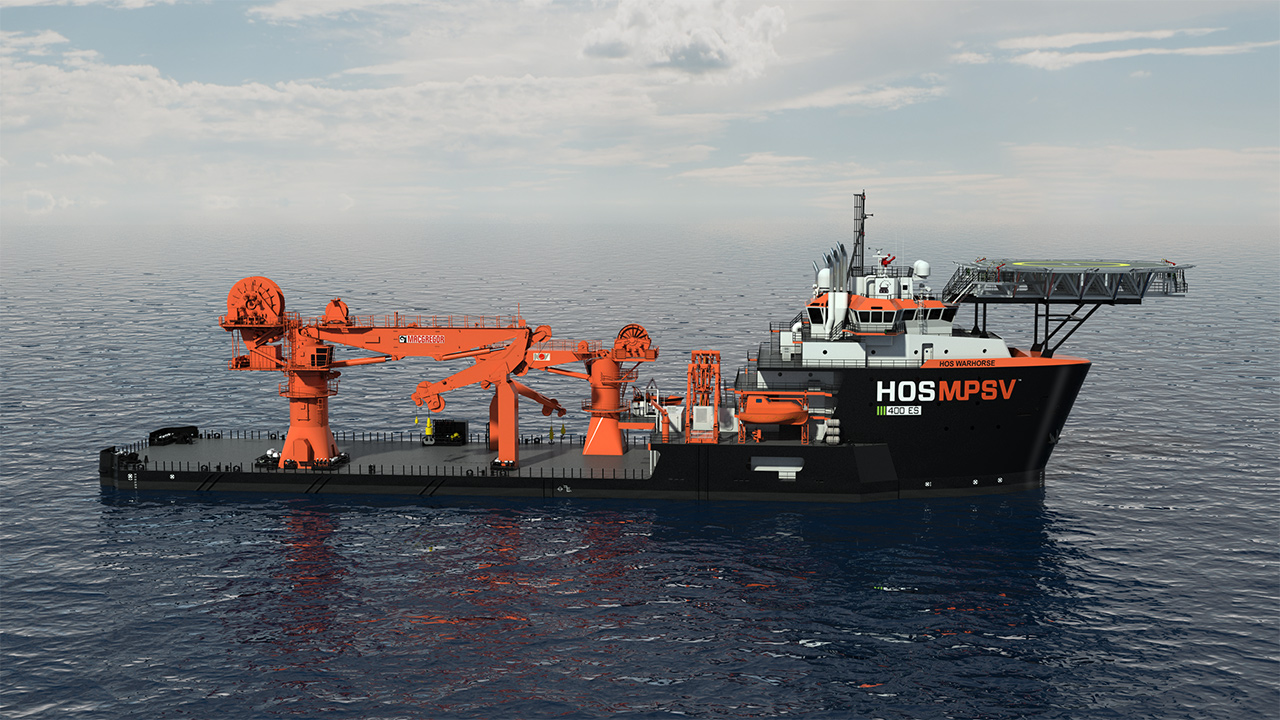
Rendering of Planned HOS 400' Class MPSV
In April 2015, we also outfitted one of our 310 class OSVs, that was placed in service under our ongoing newbuild program, as a 310 class MPSV in flotel configuration. This U.S.-flagged, Jones Act-qualified MPSV includes a 35-ton knuckle-boom crane, a motion-compensated articulating gangway and accommodations for 194 persons. Being Jones Act-qualified gives this vessel mission flexibility that foreign flag flotels lack in the GoM.
430 class
We also own and operate the HOS Iron Horse and HOS Achiever, which are 430 class DP-3 new generation MPSVs. A DP-3 notation requires greater vessel and ship-system redundancies. DP-3 systems also include separate vessel compartments with fire-retardant walls for generators, prime movers, switchboards and most other DP components. These 430 class MPSVs are designed to handle a variety of global offshore energy applications, many of which are not dependent on the exploratory rig count. They are excellent platforms for those specialty services described above for our 400 and 310 class MPSVs with the exception of handling liquid cargoes. The HOS Iron Horse and the HOS Achiever are not U.S.-flagged vessels, however, they can engage in certain legally permissible operations in the U.S. that do not constitute coastwise trade. The HOS Achiever is currently configured as a flotel with accommodations for up to 270 personnel onboard, including the vessel's marine crew, hotel and catering staff. These accommodations allow this vessel to support the commissioning of deepwater installations around the world. Because flotel services do not typically involve the coastwise transportation of passengers, foreign-flag vessels, such as our 430 class MPSVs, can provide this service in the U.S. In 2019, we placed the HOS Iron Horse into Mexican registry through our Mexican affiliate. We believe that the HOS Iron Horse is among the most sophisticated MPSVs in Mexican registry and will be a highly capable asset serving the growing Mexican market.
We believe that our reputation for safety and technologically superior vessels, combined with our size and scale in certain core markets relative to our public company OSV peer group, enhance our ability to compete for work awarded by
7
major oil companies, independent oil companies, national oil companies and the U.S. government, who are among our primary customers. These customers demand a high level of safety and technological advancements to meet the more stringent regulatory standards in the GoM. As our customers’ needs and requirements become more demanding, we expect that smaller vessel operators may struggle to meet these standards.
8
The following table provides information, as of June 30, 2020, regarding our owned fleet of 66 new generation OSVs, eight MPSVs and two MPSVs yet to be delivered under our fifth OSV newbuild program, as well as our managed fleet of four new generation OSVs that serve the U.S. Navy.
Our Vessels
Name | Design | Current Service Function | Current Location | In-Service Date | Deadweight (long tons) | Liquid Mud Capacity (barrels) | Total Horsepower | DP Class(1) | ||||||||
OWNED VESSELS: | ||||||||||||||||
MPSVs | ||||||||||||||||
HOS Iron Horse | 430 | Multi-Purpose (FF) | GoM | Nov 2009 | 5,889 | n/a | 8,050 | DP-3 | ||||||||
HOS Achiever | 430 | Multi-Purpose (FF) | GoM | Oct 2008 | 5,096 | n/a | 8,050 | DP-3 | ||||||||
HOS Warhorse | 400 ES | Multi-Purpose | TBD | 2Q2022 est.(2) | 6,200 est | 14,100 est. | 9,000 est. | DP-2 | ||||||||
HOS Wild Horse | 400 ES | Multi-Purpose | TBD | 3Q2022 est.(2) | 6,200 est. | 14,100 est. | 9,000 est. | DP-2 | ||||||||
HOS Centerline | 370 | Stacked | GoM | Mar 2009 | 7,903 | 30,962 | 6,000 | DP-2 | ||||||||
HOS Strongline | 370 | Multi-Purpose | GoM | Mar 2010 | 7,869 | 30,962 | 6,000 | DP-2 | ||||||||
HOS Bayou | 310 | Multi-Purpose | GoM | Dec 2014 | 5,189 | 20,981 | 6,700 | DP-2 | ||||||||
HOS Warland | 310 ES | Multi-Purpose | GoM | Aug 2016 | 4,977 | 19,120 | 9,000 | DP-2 | ||||||||
HOS Woodland | 310 ES | Multi-Purpose | GoM | Sep 2016 | 5,132 | 19,120 | 9,000 | DP-2 | ||||||||
HOS Riverbend | 300 | Stacked | GoM | Feb 2014 | 3,465 | 16,938 | 7,300 | DP-2 | ||||||||
OSVs | ||||||||||||||||
300 class (Over 5,000 DWT) | ||||||||||||||||
HOS Commander | 320 | Supply | Latin America | Nov 2013 | 6,046 | 20,911 | 6,008 | DP-2 | ||||||||
HOS Carolina | 320 | Stacked | GoM | Feb 2014 | 6,059 | 20,911 | 6,008 | DP-2 | ||||||||
HOS Claymore | 320 | Supply | Latin America | Mar 2014 | 6,042 | 20,911 | 6,008 | DP-2 | ||||||||
HOS Captain | 320 | Supply | GoM | Jul 2014 | 6,051 | 20,911 | 6,008 | DP-2 | ||||||||
HOS Clearview | 320 | Supply | GoM | Aug 2014 | 6,053 | 20,911 | 6,008 | DP-2 | ||||||||
HOS Crockett | 320 | Supply | GoM | Dec 2014 | 6,047 | 20,911 | 6,008 | DP-2 | ||||||||
HOS Caledonia | 320 | Supply | GoM | Jan 2015 | 6,066 | 20,911 | 6,008 | DP-2 | ||||||||
HOS Crestview | 320 | Supply (FF) | Mexico | Feb 2015 | 6,052 | 20,911 | 6,008 | DP-2 | ||||||||
HOS Cedar Ridge | 320 | Stacked | GoM | Nov 2015 | 6,046 | 20,911 | 6,008 | DP-2 | ||||||||
HOS Carousel | 320 | Stacked | GoM | Jun 2015 | 6,059 | 20,911 | 6,008 | DP-2 | ||||||||
HOS Black Foot | 310 | Supply | GoM | Jul 2014 | 6,055 | 21,417 | 7,300 | DP-2 | ||||||||
HOS Black Rock | 310 | Supply | GoM | Aug 2014 | 6,055 | 21,417 | 7,300 | DP-2 | ||||||||
HOS Black Watch | 310 | Supply | GoM | Oct 2014 | 6,055 | 21,417 | 7,300 | DP-2 | ||||||||
HOS Brass Ring | 310 | Supply (FF) | Brazil | Jan 2016 | 5,633 | 21,417 | 6,700 | DP-2 | ||||||||
HOS Briarwood | 310 | Supply | GoM | Jan 2016 | 4,837 | 21,417 | 6,700 | DP-2 | ||||||||
HOS Red Dawn | 300 | Stacked | GoM | Jun 2013 | 5,407 | 20,846 | 6,700 | DP-2 | ||||||||
HOS Red Rock | 300 | Military | GoM | Oct 2013 | 5,407 | 20,846 | 6,700 | DP-2 | ||||||||
HOS Renaissance | 300 | Supply (FF) | Mexico | Nov 2013 | 5,407 | 20,846 | 6,700 | DP-2 | ||||||||
HOS Browning | 300 | Supply (FF) | Mexico | May 2018 | 5,553 | 19,516 | 6,700 | DP-2 | ||||||||
HOS Winchester | 300 | Supply (FF) | Mexico | May 2018 | 5,553 | 19,516 | 6,700 | DP-2 | ||||||||
HOS Coral | 290 | Supply (FF) | GoM | Mar 2009 | 5,609 | 15,212 | 6,140 | DP-2 | ||||||||
280 class (3,500 to 5,000 DWT) | ||||||||||||||||
HOS Colt | 270 | Stacked (FF) | GoM | May 2018 | 3,792 | 12,591 | 6,700 | DP-2 | ||||||||
HOS Remington | 270 | Supply (FF) | Mexico | May 2018 | 3,780 | 12,569 | 6,700 | DP-2 | ||||||||
HOS Ridgewind | 265 | Supply (FF) | Mexico | Nov 2001 | 3,067 | 9,414 | 6,780 | DP-2 | ||||||||
HOS Brimstone | 265 | Stacked | GoM | Jun 2002 | 3,714 | 10,350 | 6,780 | DP-2 | ||||||||
HOS Stormridge | 265 | Stacked | GoM | Aug 2002 | 3,659 | 10,350 | 6,780 | DP-2 | ||||||||
HOS Sandstorm | 265 | Stacked | GoM | Oct 2002 | 3,659 | 10,336 | 6,780 | DP-2 | ||||||||
240 class (2,500 to 3,500 DWT) | ||||||||||||||||
HOS Saylor | 240 | Stacked (FF) | GoM | Oct 1999 | 2,774 | n/a | 7,844 | DP-1 | ||||||||
HOS Navegante | 240 | Stacked (FF) | GoM | Jan 2000 | 3,289 | 4,450 | 7,844 | DP-2 | ||||||||
HOS Resolution | 250 EDF | Stacked | GoM | Oct 2008 | 2,751 | 8,240 | 6,000 | DP-2 | ||||||||
HOS Mystique | 250 EDF | Stacked | GoM | Jan 2009 | 2,333 | 8,300 | 5,586 | DP-2 | ||||||||
HOS Pinnacle | 250 EDF | Stacked | GoM | Feb 2010 | 2,707 | 8,240 | 6,000 | DP-2 | ||||||||
HOS Windancer | 250 EDF | Stacked | GoM | May 2010 | 2,724 | 8,240 | 6,000 | DP-2 | ||||||||
HOS Wildwing | 250 EDF | Stacked | GoM | Sept 2010 | 2,707 | 8,240 | 6,000 | DP-2 | ||||||||
HOS Bluewater | 240 ED | Stacked | GoM | Mar 2003 | 2,754 | 8,270 | 4,000 | DP-2 | ||||||||
HOS Gemstone | 240 ED | Stacked | GoM | Jun 2003 | 2,758 | 8,270 | 4,000 | DP-2 | ||||||||
HOS Greystone | 240 ED | Stacked | GoM | Sep 2003 | 2,754 | 8,270 | 4,000 | DP-2 | ||||||||
HOS Silverstar | 240 ED | Stacked | GoM | Jan 2004 | 2,762 | 8,270 | 4,000 | DP-2 | ||||||||
HOS Polestar | 240 ED | Stacked | GoM | May 2008 | 2,752 | 8,270 | 4,000 | DP-2 | ||||||||
HOS Shooting Star | 240 ED | Stacked | GoM | Jul 2008 | 2,728 | 8,270 | 4,000 | DP-2 | ||||||||
HOS North Star | 240 ED | Stacked | GoM | Nov 2008 | 2,749 | 8,270 | 4,000 | DP-2 | ||||||||
HOS Lode Star | 240 ED | Stacked | GoM | Feb 2009 | 2,746 | 8,270 | 4,000 | DP-2 | ||||||||
HOS Silver Arrow | 240 ED | Stacked (FF) | GoM | Oct 2009 | 2,718 | 8,270 | 4,000 | DP-2 | ||||||||
HOS Sweet Water | 240 ED | Stacked (FF) | GoM | Dec 2009 | 2,701 | 8,270 | 4,000 | DP-2 | ||||||||
9
Name | Design | Current Service Function | Current Location | In-Service Date | Deadweight (long tons) | Liquid Mud Capacity (barrels) | Total Horsepower | DP Class(1) | ||||||||
HOS Beignet | S240 E | Stacked | GoM | May 2013 | 2,772 | 8,000 | 4,000 | DP-2 | ||||||||
HOS Boudin | S240 E | Stacked | GoM | May 2013 | 2,715 | 8,000 | 4,000 | DP-2 | ||||||||
HOS Bourre' | S240 E | Stacked | GoM | Sep 2013 | 2,772 | 8,000 | 4,000 | DP-2 | ||||||||
HOS Coquille | S240 E | Stacked | GoM | Sep 2013 | 2,742 | 8,000 | 4,000 | DP-2 | ||||||||
HOS Cayenne | S240 E | Stacked | GoM | Nov 2013 | 2,772 | 8,000 | 4,000 | DP-2 | ||||||||
HOS Chicory | S240 E | Stacked | GoM | Nov 2013 | 2,731 | 8,000 | 4,000 | DP-2 | ||||||||
200 class (1,500 to 2,500 DWT) | ||||||||||||||||
HOS Innovator | 240 E | Stacked | GoM | Apr 2001 | 2,036 | 6,290 | 4,520 | DP-2 | ||||||||
HOS Dominator | 240 E | Military | Other U.S. | Feb 2002 | 2,054 | 6,400 | 4,000 | DP-2 | ||||||||
HOS Deepwater | 240 | Stacked (FF) | GoM | Nov 1999 | 2,259 | 4,470 | 4,000 | DP-2 | ||||||||
HOS Cornerstone | 240 | Stacked | GoM | Mar 2000 | 2,259 | 6,280 | 4,000 | DP-2 | ||||||||
HOS Beaufort | S200 | Stacked | GoM | Mar 1999 | 2,246 | 4,120 | 4,000 | DP-1 | ||||||||
HOS Hawke | S200 | Stacked (FF) | GoM | Jul 1999 | 1,767 | 4,100 | 4,000 | DP-1 | ||||||||
HOS Douglas | S200 | Stacked | GoM | Apr 2000 | 2,246 | 4,120 | 4,000 | DP-1 | ||||||||
HOS Nome | S200 | Stacked | GoM | Aug 2000 | 2,246 | 4,120 | 4,000 | DP-1 | ||||||||
HOS Crossfire | 200 | Stacked (FF) | GoM | Nov 1998 | 1,780 | 2,714 | 4,000 | DP-1 | ||||||||
HOS Super H | 200 | Stacked | GoM | Jan 1999 | 1,764 | 3,590 | 4,000 | DP-1 | ||||||||
HOS Brigadoon | 200 | Supply (FF) | Mexico | Mar 1999 | 1,767 | 3,590 | 4,000 | DP-1 | ||||||||
HOS Thunderfoot | 200 | Supply (FF) | Mexico | May 1999 | 1,678 | 3,600 | 4,000 | DP-1 | ||||||||
HOS Dakota | 200 | Stacked (FF) | GoM | Jun 1999 | 1,780 | 2,714 | 4,000 | DP-1 | ||||||||
HOS Explorer | 220 | Stacked | GoM | Feb 1999 | 1,625 | 3,050 | 3,900 | DP-1 | ||||||||
HOS Voyager | 220 | Stacked | GoM | May 1998 | 1,625 | 3,050 | 3,900 | DP-1 | ||||||||
HOS Pioneer | 220 | Stacked | GoM | Jun 2000 | 1,630 | 3,050 | 4,000 | DP-1 | ||||||||
MANAGED VESSELS: | ||||||||||||||||
240 class (2,500 to 3,500 DWT) | ||||||||||||||||
USNS Black Powder | 250 EDF | Military | Other U.S. | Jun 2009 | 2,900 | 8,300 | 6,000 | DP-2 | ||||||||
USNS Westwind | 250 EDF | Military | Other U.S. | Jun 2009 | 2,900 | 8,300 | 6,000 | DP-2 | ||||||||
USNS Eagleview | 250 EDF | Military | Other U.S. | Oct 2009 | 2,900 | 8,300 | 6,000 | DP-2 | ||||||||
USNS Arrowhead | 250 EDF | Military | Other U.S. | Jan 2009 | 2,900 | 8,300 | 6,000 | DP-2 | ||||||||
FF—foreign-flagged
TBD—to be determined
(1) | “DP-1,” “DP-2” and “DP-3” mean various classifications, or equivalent, of dynamic positioning systems on new generation vessels to automatically maintain a vessel’s position and heading through anchor-less station keeping. |
(2) | These vessels are currently being constructed under our fifth OSV newbuild construction program with anticipated in-service dates during 2022. |
We own long-term lease rights to two adjacent shore-base facilities located in Port Fourchon, Louisiana, named HOS Port. Port Fourchon’s proximity to the deepwater U.S. GoM provides a strategic logistical advantage for servicing drilling rigs, production facilities and other offshore installations and sites. We also utilize HOS Port as a shoreside facility for performing vessel maintenance, outfitting and other in-the-water shipyard activities. Developed as a multi-use facility, Port Fourchon has historically been a land base for offshore oil support services and the Louisiana Offshore Oil Port, or LOOP. According to industry sources, Port Fourchon services nearly all deepwater rigs and almost half of all shallow water rigs in the GoM. The HOS Port facility has approximately four years remaining on its current lease and three additional five-year renewal options on each parcel. The combined acreage of HOS Port is approximately 60 acres with total waterfront bulkhead of nearly 3,000 linear feet. HOS Port not only supports our existing fleet and customers’ deepwater logistics requirements, but it underscores our long-term commitment to and our long-term outlook for the deepwater GoM.
Principal Markets
OSVs and MPSVs operate worldwide, but are generally concentrated in relatively few offshore regions with high levels of exploration and development activity, such as the GoM, the North Sea, Southeast Asia, West Africa, Latin America and the Middle East. Our core geographic markets are the GoM, Mexico and Brazil. In these markets, we provide services to several major integrated oil companies as well as mid-size and large independent oil companies with deepwater and ultra-deepwater activities and to national oil companies such as PEMEX and Petrobras. We also occasionally operate in select international markets, which have included the rest of Latin America, West Africa, the Mediterranean Sea, the Black Sea and the Caribbean basin. We are often subcontracted by other oilfield service companies, both in the GoM and internationally, to provide a new generation fleet that enables them to render offshore oilfield services, such as well stimulation or other enhanced oil recovery activities, seismic surveying, diving and ROV operations, subsea construction, installation, inspection, maintenance, repair and decommissioning services. We also provide a specialized application of our new generation OSVs for use by the United States military.
10
While there is some vessel migration between regions, key factors such as mobilization costs, vessel suitability and government statutes prohibiting non-indigenous-flagged vessels from operating in certain waters, or coastwise cabotage laws such as the Jones Act, can limit the migration of OSVs into certain markets. Because some MPSVs are generally utilized for non-cargo operations, they are less limited by cabotage laws. Demand for OSVs, as evidenced by dayrates and utilization rates, is primarily related to offshore oil and natural gas exploration, development and production activity. Such activity is influenced by a number of factors, including the actual and forecasted price of oil and natural gas, the level of drilling permit activity, capital budgets of offshore exploration and production companies, and repair and maintenance needs in the deepwater oilfield. The Company is monitoring the recent reductions in commodity prices driven by the impact of the COVID-19 virus, along with global supply and demand dynamics, including the recent oil price war initiated by Russia and Saudi Arabia.
Offshore exploration and production activities are increasingly focused on deep wells (as defined by total well depth rather than water depth), whether on the Outer Continental Shelf or in the deepwater or ultra-deepwater. These types of wells require high-specification equipment, which has driven the recent and nearly completed newbuild cycle for drilling rigs and for OSVs. There were 26 floating rigs under construction or on order on June 30, 2020 and, as of that date, there were options outstanding to build three additional floating rigs. In addition, on that date, there were 47 high-spec jack-up rigs under construction or on order worldwide, and there were options outstanding to build six additional high-spec jack-up rigs. Most, if not all, of these rigs were ordered prior to the downturn in oil prices that has persisted since late 2014. Consequently, the market for deepwater drilling rigs is expected to be over-supplied for the forseeable future. This oversupply of rigs may drive down the cost of contracting a drilling rig, with the result that more rigs may be employed, which could positively impact utilization of supply vessels. Each drilling rig working on deep-well projects typically requires more than one OSV to service it, and the number of OSVs required is dependent on many factors, including the type of activity being undertaken, the location of the rig and the size and capacity of the OSVs. During normal operating conditions, based on the historical data for the number of floating rigs and OSVs working, we believe that two to four OSVs per rig are required in the GoM and even more OSVs are necessary per rig in Brazil where greater logistical challenges result in longer vessel turnaround times to service drill sites. Typically, during the initial drilling stage, more OSVs are required to supply drilling mud, drill pipe and other materials than at later stages of the drilling cycle. In addition, generally more OSVs are required the farther a drilling rig is located from shore. Under normal weather conditions, the transit time to deepwater drilling rigs in the GoM and Brazil can typically range from six to 24 hours for a new generation vessel. In Brazil, transit time for a new generation vessel to some of the newer, more logistically remote deepwater drilling rig locations are more appropriately measured in days, not hours. In addition to drilling rig support, deepwater and ultra-deepwater exploration and production activities should result in the expansion of other specialty-service offerings for our vessels. These markets include subsea construction support, installation, IRM work, and life-of-field services, which include well-stimulation, workovers and decommissioning.
While Mexico has an active shallow water market, Mexico is at the dawn of its deepwater efforts, which were enabled by the legal changes made in Mexico that opened its offshore areas to foreign investment. Mexico shares a deepwater border with the United States. Deepwater exploratory success on the U.S. side of that border, particularly in the “Perdido Belt” region suggests a high probability of similar success to be achieved on the Mexican side of the border. The first deepwater wells were drilled in Mexico in 2019.
Our charters are the product of either direct negotiation or a competitive proposal process, which evaluates vessel capability, availability and price. Our primary method of chartering in the GoM is through direct vessel negotiations with our customers on either a long-term or spot basis. In the international market, we sometimes charter through local entities in order to comply with cabotage or other local requirements. Some charters are solicited by customers through international vessel brokerage firms, which earn a commission that is customarily paid by the vessel owner. Our operations and management agreement with the U.S. Navy's Military Sealift Command was a sole source selection based upon certain capabilities unique to the Company that were developed while the applicable vessels were chartered to the Navy. All of our charters, whether long-term or spot, are priced on a dayrate basis, whereby for each day that the vessel is under contract to the customer, we earn a fixed amount of charter-hire for making the vessel available for the customer’s use. Some of the long-term contracts for our vessels and all of our government, including national oil company, charters contain early termination options in favor of the customer; however, some have fees designed to discourage early termination. Long-term charters sometimes contain provisions that permit us to increase our dayrates in order to be compensated for certain increased operational expenses or regulatory changes.
11
Competition
The offshore support vessel industry is highly competitive. Competition primarily involves such factors as:
• | quality, capability and age of vessels; |
• | quality, capability and nationality of the crew members; |
• | ability to meet the customer’s schedule and specific logistical requirements; |
• | safety record, reputation, experience; |
• | price and; |
• | cabotage laws. |
Our three core markets, the U.S. GoM, Mexico and Brazil, all have strict cabotage laws that provide varying levels of insulation from foreign competition. While these laws vary in their provisions, generally they provide a barrier to entry to market participants that are short-term focused and unwilling to make a significant contribution of capital to the country being served.
Our high-spec OSVs are predominately U.S.-flagged vessels, which qualify them under the Jones Act to engage in domestic coastwise trade. The Jones Act restricts the ability of vessels that are foreign-built, foreign-owned, foreign-crewed or foreign-flagged from engaging in coastwise trade in the United States. The transportation services typically provided by OSVs constitute coastwise trade as defined by the Jones Act. See "Item 1A-Risk Factors" for a more detailed discussion of the Jones Act. Consequently, competition for our services in the GoM is largely restricted to other U.S. vessel owners and operators, both publicly and privately held. We believe that we operate the second largest fleet by DWT of new generation Jones Act-qualified OSVs in the United States. Internationally, our OSVs compete against other U.S. owners, as well as foreign owners and operators of OSVs. Some of our international competitors may benefit from a lower cost basis in their vessels, which are usually not constructed in U.S. shipyards, as well as from lower crewing costs and favorable tax regimes. While foreign vessel owners cannot engage in U.S. coastwise trade, some cabotage laws in other parts of the world permit temporary waivers for foreign vessels if domestic vessels are unavailable. We and other U.S. and foreign vessel owners have been able to obtain such waivers in the foreign jurisdictions in which we operate.
Many of the services provided by MPSVs do not involve the transportation of merchandise and therefore are generally not considered coastwise trade under U.S. and foreign cabotage laws. Consequently, our MPSVs being constructed under our fifth newbuild program face competition from both foreign-flagged vessels and U.S.-flagged vessels for non-coastwise trade activities. In addition, since 2009, owners and operators of Jones-Act qualified MPSVs, such as ourselves, have challenged interpretations of the Jones Act issued by Customs and Border Protection, or CBP, that we believe erroneously allowed foreign MPSVs to be used in U.S. coastwise trade. In 2009 and again in 2017, CBP announced proposed modifications to or revocations of these interpretations, but subsequently withdrew both of those proposals. In 2017, trade organizations representing the owners and operators of Jones-Act qualified MPSVs, as well as U.S. shipyards that build them, sued CBP on account of the continued existence of Jones Act interpretations that are inconsistent with the statute. That suit is pending in Federal District Court for the District of Columbia, Captain Paul Radtke, et. al. v. U.S. Bureau of Customs and Border Protection, et. al. Civil Action No. 17-2412. If successful, that litigation may reduce competition that our Jones-Act qualified MPSVs face from foreign MPSVs that are currently allowed by CBP to engage in coastwise trade. In December 2019, CBP issued new interpretations broadening the definition of vessel equipment and clarifying the applicability of the Jones Act to offshore lifting operations. These changes became effective in February 2020. Subsequent to the CBP's revised interpretations a legal challenge has been brought claiming that aspects of the new interpretations do not comply with the Jones Act.
Competition in the MPSV industry is significantly affected by the particular capabilities of a vessel to meet the requirements of a customer’s project as well as price. While operating in the GoM, our MPSVs are required to utilize U.S. crews while foreign-owned vessels have historically been allowed to employ non-U.S. mariners, often from low-wage nations. U.S. crews are often more expensive than foreign crews. Also, foreign MPSV owners may have more favorable tax regimes than ours. Consequently, prices for foreign-owned MPSVs in the GoM are often lower than prices we can charge. Finally, some potential MPSV customers are also owners of MPSVs that will compete with our vessels. During the recent downturn, many foreign MPSVs have departed the GoM and most MPSVs currently operating in the GoM are Jones-Act qualified. If market conditions improve and the CBP letter rulings continue to allow foreign vessels to engage in coastwise trade, we might face significant price competition from the owners of these foreign vessels that enjoy lower manning and tax burdens.
12
We continue to observe intense scrutiny by our customers on the safety and environmental management systems of vessel operators. As a consequence, we believe that deepwater customers are increasingly biased towards companies that have demonstrated a financial and operational commitment and capacity to employ such systems. We believe this trend will, over time, make it difficult for small enterprises to compete effectively in the deepwater OSV and MPSV markets. Additionally, we have observed less willingness by operators to utilize DP-1 vessels in deepwater operations in the GoM. This trend will likely result in the retirement of conventional non-DP vessels and a migration of DP-1 new generation vessels to non-deepwater regions, such as the shelf, and certain international regions.
Although some of our principal competitors are larger or have more extensive international operations than we do, we believe that our operating capabilities and reputation for quality and safety enable us to compete effectively with other fleets in the market areas in which we operate or intend to operate. In particular, we believe that the relatively young age and advanced features of our OSVs and MPSVs provide us with a competitive advantage. The ages of our high-spec new generation OSVs range from four years to 21 years with a weighted-average fleet age, based on DWT, of eight years. In fact, approximately 85% of our active new generation OSVs have been placed in-service since January 1, 2008, giving our active fleet of OSVs an average age of nine years. The average age of the industry’s conventional U.S.-flagged OSV fleet is over 35 years and the industry's domestic new generation OSV fleet is approximately eleven years. We believe that most of these older vessels are cold-stacked and many of them have been or will be permanently retired in the next few years due to physical and economic obsolescence. Worldwide competition for new generation vessels has been impacted in recent years by the increase in newbuild OSVs placed in-service to address greater customer interest in deep-well, deepwater and ultra-deepwater drilling activity and the decline in industry activity due to low oil prices since October 2014. Upon completion of our fifth OSV newbuild program, we expect to own a fleet of 76 Upstream vessels of which 83% will be DP-2 or DP-3 with a projected weighted-average fleet age, based on DWT, of 13 years in 2022.
Over the past five years, there have been several, and we expect further, formal and informal restructurings of owners and operators of OSVs and MPSVs that compete with us in the U.S. and globally. In addition to our chapter 11 proceedings initiated May 19, 2020, two of our publicly traded domestic competitors emerged from chapter 11 proceedings in 2017 and such competitors merged in late-2018. One of our privately held domestic competitors emerged from chapter 11 proceedings in 2018. Companies that have undergone restructurings may have less debt and obligations associated with servicing their debt than companies that have not undergone restructurings.
Our success depends in large part on our ability to attract and retain highly skilled and qualified personnel. Our inability to hire, train and retain a sufficient number of qualified employees could impact our ability to manage, maintain and grow our business. In crewing our vessels, we require skilled employees who can perform physically demanding work and operate complex vessel systems. As the result of our vessel stacking strategy, we have reduced our mariner headcount significantly. When these stacked vessels return to service, we will need to hire and train additional mariners to operate such vessels.
CUSTOMER DEPENDENCY
Our customers are generally comprised of large, independent, integrated or nationally-owned energy or oilfield service companies. These firms are relatively few in number. The percentage of revenues attributable to a customer in any particular year depends on the level of oil and natural gas exploration, development and production activities undertaken by such customer, the availability and suitability of our vessels for the customer’s projects or products and other factors, many of which are beyond our control. For the year ended December 31, 2019, Military Sealift Command and Royal Dutch Shell plc (including worldwide affiliates) each accounted for 10% or more of our consolidated revenues. For a discussion of significant customers in prior periods, see Note 17 to our consolidated financial statements.
GOVERNMENT REGULATION
Environmental Laws and Regulations
Our operations are subject to a variety of federal, state, local and international laws and regulations regarding the discharge of materials into the environment or otherwise relating to environmental protection. The requirements of these laws and regulations have become more complex and stringent in recent years and may, in certain circumstances, impose strict, joint and several liability, rendering a company liable for environmental damages and remediation costs without regard to negligence or fault on the part of such party. Aside from possible liability for damages and costs including natural resource damages associated with releases of oil or hazardous materials into the environment, such laws and regulations may expose us to liability for the conditions caused by others or even acts of ours that were in compliance with all applicable laws and regulations at the time such acts were performed. Failure to comply with applicable laws and
13
regulations may result in the imposition of administrative, civil and criminal penalties, revocation of permits, issuance of corrective action orders and suspension or termination of our operations. Moreover, it is possible that future changes in the environmental laws, regulations or enforcement policies that impose additional or more restrictive requirements or claims for damages to persons, property, natural resources or the environment could result in substantial costs and liabilities to us and could have a material adverse effect on our financial condition, results of operations or cash flows. We have performed what we consider to be appropriate environmental due diligence in connection with our operations and, where possible, we have taken all necessary steps to qualify for any applicable statutory defenses and limits of liability available under environmental regulations. We believe that we are in substantial compliance with currently applicable environmental laws and regulations.
OPA 90 and regulations promulgated pursuant thereto amend and augment the oil spill provisions of the Clean Water Act and impose a variety of duties and liabilities on “responsible parties” related to the prevention and/or reporting of oil spills and damages resulting from such spills in or threatening U.S. Waters, including the Outer Continental Shelf or adjoining shorelines. A “responsible party” includes the owner or operator of an onshore facility, pipeline or vessel or the lessee or permittee of the area in which an offshore facility is located. OPA 90 assigns liability to each responsible party for containment and oil removal costs, as well as a variety of public and private damages including the costs of responding to a release of oil, natural resource damages, damages for injury to, or economic losses resulting from, destruction of real or personal property of persons who own or lease such affected property. For any vessels, other than “tank vessels,” that are subject to OPA 90, the liability limits are the greater of $1,200 per gross ton or $997,100. A party cannot take advantage of liability limits if the spill was caused by gross negligence or willful misconduct or resulted from violation of a federal safety, construction or operating regulation. In addition, for an Outer Continental Shelf facility or a vessel carrying crude oil from a well situated on the Outer Continental Shelf, the limits apply only to liability for damages (e.g. natural resources, real or personal property, subsistence use, reserves, profits and earnings capacity, and public services damages). The owner or operator of such facility or vessel is liable for all removal costs resulting from a discharge or substantial threat of discharge without limits. If the party fails to report a spill or to cooperate fully in the cleanup, the liability limits likewise do not apply and certain defenses may not be available. Moreover, OPA 90 imposes on responsible parties the need for proof of financial responsibility to cover at least some costs in a potential spill. As required, we have provided satisfactory evidence of financial responsibility to the USCG for all of our vessels over 300 tons. OPA 90 does not preempt state law, and states may impose liability on responsible parties and requirements for removal beyond what is provided in OPA 90.
OPA 90 also imposes ongoing requirements on a responsible party, including preparedness and prevention of oil spills and preparation of an oil spill response plan. We have engaged the Marine Spill Response Corporation to serve as our Oil Spill Removal Organization for purposes of providing oil spill removal resources and services for our operations in U.S. waters as required by the USCG. In addition, our Tank Vessel Response Plan and Non-Tank Vessel Response Plan have been approved by the USCG.
The Clean Water Act imposes strict controls on the discharge of pollutants into the navigable waters of the United States. The Clean Water Act also provides for civil, criminal and administrative penalties for any unauthorized discharge of oil or other hazardous substances in reportable quantities and imposes liability for the costs of removal and remediation of an unauthorized discharge, including the costs of restoring damaged natural resources. Many states have laws that are analogous to the Clean Water Act and also require remediation of accidental releases of petroleum or other pollutants in reportable quantities. Our OSVs routinely transport diesel fuel to offshore rigs and platforms and also carry diesel fuel for their own use. Our OSVs also transport bulk chemical materials and liquid mud used in drilling activities, which contain oil and oil by-products. We maintain vessel response plans as required by the Clean Water Act to address potential oil and fuel spills.
The Comprehensive Environmental Response, Compensation, and Liability Act of 1980, also known as “CERCLA” or “Superfund,” and similar laws impose liability for releases of hazardous substances, pollutants and contaminants into the environment. CERCLA currently exempts crude oil from the definition of hazardous substances for purposes of the statute, but our operations may involve the use or handling of other materials that may be classified as hazardous substances, pollutants and contaminants. CERCLA assigns strict, joint and several liability to each responsible party for response costs, as well as natural resource damages. Under CERCLA, responsible parties include not only owners and operators of vessels but also any person who arranged for the disposal or treatment, or arranged with a transporter for transport for disposal or treatment of hazardous substances, and any person who accepted hazardous substances for transport to and selected the disposal or treatment facilities. Thus, we could be held liable for releases of hazardous substances that resulted from operations by third parties not under our control or for releases associated with practices
14
performed by us or others that were standard in the industry at the time and in compliance with existing laws and regulations.
The Resource Conservation and Recovery Act regulates the generation, transportation, storage, treatment and disposal of onshore hazardous and non-hazardous wastes and requires states to develop programs to ensure the safe treatment, storage and disposal of wastes. States having jurisdiction over our operations also have their own laws governing the generation and management of solid and hazardous waste. We generate non-hazardous wastes and small quantities of hazardous wastes in connection with routine operations. We believe that all of the wastes that we generate are handled in all material respects in compliance with the Resource Conservation and Recovery Act and analogous state statutes.
The USCG's final Ballast Rule became effective on June 21, 2012, and the EPA renewed the Vessel General Permit under the National Pollutant Discharge Elimination System effective on December 19, 2013. In addition, the International Maritime Organization's, or IMO, International Convention for the Control and Management of Ships’ Ballast Water and Sediments otherwise known as the Ballast Water Management Convention, or BWMC, became effective on September 8, 2017. The BWMC has similar standards to that of the USCG and EPA ballast water regulations. These regulations require all our existing vessels to meet certain standards pertaining to ballast water discharges. An exemption to certain compliance requirements in the U.S. is provided for vessels that operate within an isolated geographic region, as determined by the USCG and EPA, respectively. Most of our vessels operating in the GoM are exempt from the ballast water treatment requirements. However, for non-exempt vessels, ballast water treatment equipment may be required to be utilized on the vessel. Internationally, compliance with IMO’s BWMC will impact us starting in the first quarter of 2020, as implementation of these rules is based on the renewal of a vessel’s International Oil Pollution Prevention Certificate after September 8, 2017. We have currently estimated the cost of compliance with either the USCG's Ballast Rule or the BWMC to be approximately $325,000 per vessel that is required to be fitted with a treatment system.
The Clean Air Act, or CAA, passed by Congress in 1970 regulates all air pollutants resulting from industrial activities. The 1990 amendments to the CAA established jurisdiction of offshore regions. Proposed and existing facilities and vessels must prepare, as part of their development plans and reporting procedures, detailed emissions data to prove compliance with the CAA and obtain necessary permits. We believe that all of our facilities and vessels have obtained the necessary permits and are operating in all material respects in compliance with the CAA. The EPA also imposed emissions regulations affecting vessels that operate in the United States. The EPA’s decision to regulate “greenhouse gases” as a pollutant may result in further regulations and compliance costs.
IMO amendments to the International Convention for the Prevention of Pollution from Ships, 1973, or MARPOL, reduced the permitted sulfur content of any fuel oil used on board ships from 3.5% to 0.5% globally, effective January 1, 2020. While operating within designated Emission Control Areas, such as within 200 nautical miles of North America, the sulfur content limit is 0.1%. It is possible the new global requirement may affect the supply or cost of compliant fuel oil for our vessels while operating abroad.
Climate Change
Greenhouse gas emissions have increasingly become the subject of international, national, regional, state and local attention. The EPA has adopted regulations under the CAA that require new and existing industrial facilities to obtain permits for carbon dioxide equivalent emissions above emission thresholds. In addition, the EPA adopted rules that mandate reporting of greenhouse gas data and other information by i) industrial sources, ii) suppliers of certain products, and iii) facilities that inject carbon dioxide underground. To the extent that these regulations may apply, we could be responsible for costs associated with complying with such regulations. Cap and trade initiatives to limit greenhouse gas emissions have been introduced in the European Union. Future treaty obligations, statutory or regulatory changes or new climate change legislation in the jurisdictions in which we operate could affect our costs associated with compliance.
Restrictions on greenhouse gas emissions or other related legislative or regulatory enactments could have an effect in those industries that use significant amounts of petroleum products, which could potentially result in a reduction in demand for petroleum products and, consequently and indirectly, our offshore transportation and support services. We are currently unable to predict the manner or extent of any such effect. Furthermore, one of the asserted long-term physical effects of climate change may be an increase in the severity and frequency of adverse weather conditions, such as hurricanes, which may increase our insurance costs or risk retention, limit insurance availability or reduce the areas in which, or the number of days during which, our customers would contract for our vessels in general and in the GoM in particular. We are currently unable to predict the manner or extent of any such effect.
15
EMPLOYEES
On December 31, 2019, we had 1,157 employees, including 953 operating personnel and 204 corporate, administrative and management personnel. Excluded from these personnel totals are 41 third-country nationals that we contracted to serve on our vessels as of December 31, 2019. These non-U.S. mariners are typically provided by international crewing agencies. With the exception of 397 employees located in Brazil and Mexico as of December 31, 2019, none of our employees are represented by a union or employed pursuant to a collective bargaining agreement or similar arrangement. We have not experienced any strikes or work stoppages, and our management believes that we continue to experience good relations with our employees.
GEOGRAPHIC AREAS
The table below presents revenues by geographic region for the past two years (in thousands):
Year Ended December 31, | |||||||||||
2019 | % of total | 2018 | % of total | ||||||||
United States | $ | 145,509 | 64.5 | % | $ | 173,211 | 81.5 | % | |||
International | 80,153 | 35.5 | % | 39,193 | 18.5 | % | |||||
$ | 225,662 | 100.0 | % | $ | 212,404 | 100.0 | % | ||||
The table below presents net book value of property, plant and equipment by geographic region for the past two years (in thousands):
As of December 31, | |||||||||||
2019 | % of total | 2018 | % of total | ||||||||
United States | $ | 1,888,134 | 80.6 | % | $ | 2,181,878 | 89.6 | % | |||
International | 454,629 | 19.4 | % | 252,951 | 10.4 | % | |||||
$ | 2,342,763 | 100.0 | % | $ | 2,434,829 | 100.0 | % | ||||
Foreign Operations
Operating in foreign markets presents many political, social and economic challenges. Although we take measures to mitigate these risks, they cannot be completely eliminated. See "Item—1A Risk Factors" for a further discussion of the risks of operating in foreign markets.
SEASONALITY
Demand for our offshore support services is directly affected by the levels of offshore drilling and production activity. Budgets of many of our customers are based upon a calendar year, and demand for our services has historically been stronger in the second and third calendar quarters when allocated budgets are expended by our customers and seasonal weather conditions are more favorable for offshore activities. Many other factors, such as the expiration of drilling leases and the supply of and demand for oil and natural gas, may affect this general trend in any particular year. In addition, we typically have an increase in demand for our vessels to survey and repair offshore infrastructure immediately following major hurricanes or other named storms in the GoM.
WEBSITE AND OTHER ACCESS TO COMPANY REPORTS AND OTHER MATERIALS
Our website address is http://www.hornbeckoffshore.com. We make available on this website, free of charge, access to our Annual Reports on Form 10-K, Quarterly Reports on Form 10-Q, Current Reports on Form 8-K, Proxy Statements and amendments to those reports, as well as other documents that we file with, or furnish to, the Commission pursuant to Sections 13(a) or 15(d) of the Exchange Act, as soon as reasonably practicable after such documents are filed with, or furnished to, the Commission. We intend to use our website as a means of disclosing material non-public information and for complying with disclosure obligations under Regulation FD. Such disclosures will be included on our website under the heading “Investors—IR Home.” Accordingly, investors should monitor such portion of our website, in addition to following our press releases, Commission filings and public conference calls and webcasts. Periodically, we also update our investor presentations, which can be viewed on our website. You may read and copy any materials we file with the Commission at the Commission’s Public Reference Room at 100 F Street, N.E., Washington, DC 20549. You can obtain
16
information on the operation of the Public Reference Room by calling the Commission at 1-800-732-0330. The SEC maintains an Internet site that contains reports, proxy and information statements, and other information regarding issuers that file electronically with the Commission at http://www.sec.gov. Our Corporate Governance Guidelines, Code of Conduct, titled "Navigating with Integrity," (which applies to all employees, including our Chief Executive Officer and certain Financial and Accounting Officers), Code of Business Conduct and Ethics for Members of the Board of Directors, and the charters for our Audit, Nominating/Corporate Governance and Compensation Committees, can all be found on the Investor Relations page of our website under “Corporate Governance”. We intend to disclose any changes to or waivers from the Code of Conduct that would otherwise be required to be disclosed under Item 5.05 of Form 8-K on our website. We will also provide printed copies of these materials to any stockholder upon request to Hornbeck Offshore Services, Inc., Attn: General Counsel, 103 Northpark Boulevard, Suite 300, Covington, Louisiana 70433. The information on our website is not, and shall not be deemed to be, a part of this report or incorporated into any other filings we make with the Commission.
Item 1A—Risk Factors
Our results of operations and financial condition can be adversely affected by numerous risks. You should carefully consider the risks described below as well as the other information we have provided in this Annual Report on Form 10-K. The risks described below are not the only ones we face. You should also consider the factors contained in our “Forward Looking Statements” disclaimer found on page ii of this Annual Report on Form 10-K. Additional risks not presently known to us or that we currently deem immaterial may also impair our business operations.
Risks Related to the Chapter 11 Cases.
Continued Risk Upon Plan Confirmation and Effectiveness.
Despite the confirmation of our Plan by the Bankruptcy Court on June 19, 2020, there is no guarantee that any chapter 11 plan of reorganization, including the Plan, will achieve our stated goals. The COVID-19 pandemic has reduced global demand for oil. Moreover oil supply increased temporarily as a result of the inability of Saudi Arabia and Russia to reach agreement on production cuts. The consequence was a sharp drop in oil prices, which adversely affected the demand for our services. There is significant uncertainty surrounding when and by how much oil prices will recover, and whether that recovery will result in increased demand for our services. Thus, even if our debts are reduced and/or discharged through the Plan, we may need to raise additional funds through public or private debt or equity financing or other various means to fund our businesses after the completion of the proceedings related to the Chapter 11 Cases. Adequate funds may not be available when needed or may not be available on favorable terms.
Furthermore, even after the Plan is confirmed and implemented, our operating results may be adversely affected by the possible reluctance of prospective lenders and other counterparties to do business with a company that recently emerged from bankruptcy protection.
We Will Be Subject to the Risks and Uncertainties Associated with the Chapter 11 Cases.
For the duration of the Chapter 11 Cases, our ability to operate, develop, and execute a business plan, and continue as a going concern, will be subject to the risks and uncertainties associated with bankruptcy. These risks include the following: (a) ability to consummate the restructuring transactions specified in the Plan; (b) ability to obtain Bankruptcy Court approval with respect to motions filed in the Chapter 11 Cases from time to time; (c) ability to maintain relationships with suppliers, vendors, service providers, customers, employees, and other third parties; (d) ability to maintain contracts that are critical to our operations; and (e) ability of third parties to seek and obtain Bankruptcy Court approval to terminate contracts and other agreements with us.
These risks and uncertainties could affect our businesses and operations in various ways. For example, negative events associated with the Chapter 11 Cases could adversely affect our relationships with suppliers, service providers, customers, employees, and other third parties, which in turn could adversely affect our operations and financial condition. Also, we will need the prior approval of the Bankruptcy Court for transactions outside the ordinary course of business, which may limit our ability to respond timely to certain events or take advantage of certain opportunities. Because of the risks and uncertainties associated with the Chapter 11 Cases, we cannot accurately predict or quantify the ultimate impact of events that occur during the Chapter 11 Cases that may be inconsistent with our plans.
17
Operating in Bankruptcy for a Long Period of Time May Harm Our Businesses.
Despite the Bankruptcy Court having confirmed our Plan, our emergence is dependent upon certain governmental regulatory approvals over which we have little control as to the timing or outcome. Until these conditions are met, or waived our emergence will be delayed. Delay in emergence could itself have an adverse effect on our businesses. The longer the proceedings related to the Chapter 11 Cases continue, the more likely it is that customers, employees and suppliers may lose confidence in our ability to reorganize our businesses successfully and could seek to establish alternative commercial relationships. A lengthy bankruptcy proceeding also would involve additional expenses and divert the attention of management from the operation of our businesses.
So long as the proceedings related to the Chapter 11 Cases continue, we may be required to incur substantial costs for professional fees and other expenses associated with the administration of the Chapter 11 Cases. If the chapter 11 proceedings last longer than anticipated, we will require additional debtor‑in‑possession financing to fund our operations. If we are unable obtain such financing in those circumstances, the chances of successfully reorganizing our businesses may be seriously jeopardized, the likelihood that we will instead be required to liquidate or sell our assets may be increased, and, as a result, creditor recoveries under the Plan may be significantly impaired.
A Default Under the DIP Loan Could Adversely Impact the Confirmed Plan.
The DIP Loan contains various covenants and other obligations with which we must comply during the pendency of the Bankruptcy Cases. If we were to default under the DIP Loans, we would be deemed to be in default of the Plan, which could adversely impact our ability to proceed with the Plan.
Risks Related to Our Businesses.
We May Not Be Able to Generate Sufficient Cash to Service All of Our Indebtedness.
Our ability to make scheduled payments on, or refinance our debt obligations, including the DIP financing and the Exit Facilities depends on our financial condition and operating performance, which are subject to prevailing economic, industry, and competitive conditions and to certain financial, business, legislative, regulatory, and other factors beyond our control. We may be unable to maintain a level of cash flow from operating activities sufficient to permit us to pay the principal, premium, if any, and interest and/or fees on our indebtedness, including, without limitation, anticipated borrowings under the Exit Facilities upon emergence.
Financial Results May Be Volatile and May Not Reflect Historical Trends.
During the Chapter 11 Cases, we expect that our financial results will continue to be volatile as asset impairments, asset dispositions, restructuring activities and expenses, contract terminations and rejections, and/or claims assessments significantly impact our consolidated financial statements. As a result, our historical financial performance likely will not be indicative of or comparable to our financial performance after the Petition Date.
In addition, if we emerge from chapter 11, the amounts reported in subsequent consolidated financial statements may materially change relative to historical consolidated financial statements, including as a result of revisions to our operating plans pursuant to a plan of reorganization. We also may be required to adopt “fresh start” accounting in accordance with Accounting Standards Codification 852 (“Reorganizations”) in which case our assets and liabilities will be recorded at fair value as of the fresh start reporting date, which may differ materially from the recorded values of assets and liabilities on our consolidated balance sheets. Our financial results after the application of fresh start accounting also may be different from historical margin trends.
Our Substantial Liquidity Needs May Impact Revenue.
We operate in a capital‑intensive industry. Our liquidity, including the ability to meet ongoing operational obligations, will be dependent upon, among other things: (a) our ability to comply with the terms and condition of the DIP Loan and the Exit Financings; (b) our ability to maintain adequate cash on hand; (c) our ability to generate cash flow from operations; (d) our ability to consummate the Plan; and (e) the cost, duration, and outcome of the Chapter 11 Cases. Our ability to maintain adequate liquidity depends, in part, upon industry conditions and general economic, financial,
18
competitive, regulatory, and other factors beyond our control. In the event that cash on hand and cash flow from operations are not sufficient to meet our liquidity needs, we may be required to seek additional financing. We can provide no assurance that additional financing would be available or, if available, offered to us on acceptable terms. Our access to financing in addition to the Exit Financings is, and for the foreseeable future likely will continue to be, extremely limited if it is available at all. Our long‑term liquidity requirements and the adequacy of our capital resources are difficult to predict at this time.
We Derive Substantial Revenues from Companies in the Oil and Natural Gas Exploration and Production Industry, A Historically Cyclical Industry with Levels of Activity That Are Directly Affected by the Levels and Volatility of Oil and Natural Gas Prices.
The demand for our services from companies in various energy-related industries, particularly the oil and gas exploration and production industry, has traditionally been cyclical, depending primarily on the capital expenditures of oil and gas exploration and production companies. These capital expenditures are influenced by such factors as:
• | worldwide and regional economic conditions impacting the global supply and demand for oil and natural gas, including the economic impacts of the COVID-19 virus; |
• | the action of OPEC, its members and other state-controlled oil companies relating to oil price and production controls, including the anticipated increases in supply from Russia and OPEC, particularly Saudi Arabia; |
• | prevailing oil and natural gas prices, particularly with respect to prevailing prices on local price indexes in the areas in which we operate and expectations about future commodity prices; |
• | the cost of exploring for, producing and delivering hydrocarbons; |
• | the sale and expiration dates of available offshore leases; |
• | the discovery rate, size and location of new hydrocarbon reserves, including in offshore areas; |
• | the rate of decline of existing hydrocarbon reserves due to production; |
• | laws and regulations related to environmental matters, including those addressing alternative energy sources and the risks of global climate change; |
• | the development and exploitation of alternative fuels or energy sources and end-user conservation trends; |
• | domestic and international political, military, regulatory and economic conditions; |
• | domestic, local and foreign governmental regulation and taxes; |
• | technological advances, including technology related to the exploitation of shale oil; and |
• | the ability of oil & gas companies to generate funds for capital expenditures. |
Prices for oil and natural gas have historically been, and we anticipate it will continue to be, extremely volatile and reactive to changes in the supply of and demand for oil and natural gas (including changes resulting from the ability of the Organization of Petroleum Exporting Countries to establish and maintain production quotas), domestic and worldwide economic conditions and political instability in oil producing countries. Material declines in oil and natural gas prices have affected, and will likely continue to affect, the demand for and pricing of our services. In response to currently prevailing industry conditions, many oil and gas exploration and production companies and other energy companies have made significant reductions in their capital expenditure budgets over the past three years. In particular, some of our customers have reduced their spending on exploration, development and production programs, and have decreased their rig counts in the geographic areas in which we operate. Low oil prices have adversely affected demand for our services and further decreases, over a sustained period of time, could have a material adverse effect on our business, financial condition, results of operations and cash flows.
Our results of operations and operating cash flows depend on our obtaining significant contracts, primarily from companies in the oil and gas exploration and production industry. The timing of or failure to obtain contracts, delays in awards of contracts, cancellations of contracts, delays in completion of contracts, or failure to obtain timely payments from our customers, could result in significant periodic fluctuations in our results of operations and operating cash flows. If customers do not proceed with the completion of significant projects or if significant defaults on customer payment obligations to us arises, or if we encounter disputes with customers involving such payment obligations, we may face difficulties in collecting payment of amounts due to us, including for costs we previously incurred.
19
Impairment of Our Long-Term Assets May Adversely Impact Our Financial Position and Results of Operations.
We periodically evaluate our long-lived assets, including our property and equipment, and intangible assets. In performing these assessments, we project future cash flows on an undiscounted basis for long-lived assets and compare these cash flows to the carrying amount of the related assets. These cash flow projections are based on our current operating plans, estimates and judgmental assumptions. We perform the assessment of potential impairment for our property and equipment and intangibles whenever facts and circumstances indicate that the carrying value of those assets may not be recoverable due to various external or internal factors. In such event, if we determine that our estimates of future cash flows were inaccurate or our actual results are materially different from what we have predicted, we could record additional impairment charges in future periods, which could have a material adverse effect on our financial position and results of operations.
The Waiver or Repeal of the Jones Act Could Adversely Impact our Business.
Substantial portions of our operations are conducted in the U.S. coastwise trade and thus subject to the provisions of the Jones Act which, subject to limited exceptions, restricts maritime transportation between points in the United States (known as marine cabotage services or coastwise trade) to vessels that are: (a) built in the United States; (b) registered under the U.S. flag; (c) manned by predominantly U.S. crews; and (d) owned and operated by U.S. Citizens within the meaning of the Jones Act. For years, there have been attempts to repeal or amend such provisions, and such attempts are expected to continue in the future. In addition, the Secretary of the Department of Homeland Security may waive the requirement for using U.S.-flag vessels with coastwise endorsements in the U.S. coastwise trade in the interest of national defense. Furthermore, the Jones Act restrictions on the maritime cabotage services are subject to certain exceptions under certain international trade agreements, including the General Agreement on Trade in Services and the North American Free Trade Agreement. If maritime cabotage services were included in the General Agreement on Trade in Services, the North American Free Trade Agreement or other international trade agreements, the shipping of maritime cargo between covered U.S. ports could be opened to foreign-flag, foreign-built vessels or foreign-owned vessels. Repeal, substantial amendment or waiver of provisions of the Jones Act could significantly adversely affect us by, among other things, resulting in additional competition from competitors with lower operating costs, because of their ability to use vessels built in lower-cost foreign shipyards, owned and manned by foreign nationals with promotional foreign tax incentives and with lower wages and benefits than U.S. Citizens. Because foreign vessels may have lower construction costs and operate at significantly lower costs than companies operating in the U.S. coastwise trade, such a change could significantly increase competition in the U.S. coastwise trade, which could have a material adverse effect on our business, financial position, results of operations, cash flows and growth prospects.
We Must Continue to Comply With the Jones Act’s Citizenship Requirements.
Because we own and operate U.S.-flagged vessels in the U.S. coastwise trade, the Jones Act requires that at least 75% of the outstanding shares of each class or series of the capital stock of the Company must be owned and controlled by U.S. Citizens. We are responsible for monitoring the ownership of our equity securities and subsidiaries to ensure compliance with the citizenship requirements of the Jones Act. After the Effective Date, if we do not continue to comply with such requirements, we would be prohibited from operating our U.S.-flagged vessels in U.S. coastwise trade and may incur severe penalties, such as fines and/or forfeiture of such vessels and/or permanent loss of U.S. coastwise trading privileges for such vessels.
The Plan contemplates the holders of the first-lien term loans, second-lien term loans, the 2020 Senior Notes and the 2021 Senior Notes receiving equity in consideration of amounts due, as well as the purchase by certain of such holders of new common stock in the Rights Offering. Because certain holders of the first-lien term loans, second-lien term loans, 2020 Senior Notes and 2021 Senior Notes and such purchasers are not U.S. Citizens, the Company is requesting authorization from the United States Coast Guard and the U.S. Maritime Administration for approval prior to the Effective Date to issue Jones Act Warrants in lieu of common stock to the extent foreign ownership would otherwise exceed 24% of the Company’s new common stock in order to ensure compliance with the Jones Act citizenship requirement. New Jones Act Warrants may only be exercised by (i) U.S. Citizens, and (ii) Non-U.S. Citizens to the extent such exercise would not cause more than 24% foreign ownership of our new common stock. The New Jones Act Warrant Agreement will not grant the holder of a New Jones Act Warrant any voting or control rights or dividend rights, or contain any negative covenants
20
restricting the operation of our business. While the United States Coast Guard and the U.S. Maritime Administration have authorized similar arrangements previously, there is no guarantee that our proposal will be approved or that subsequently the ownership structure is deemed invalid. In addition, there is a risk that new common stock held could be sold to a non-U.S. Citizen inadvertently resulting in the 25% foreign ownership limitation being violated, which could jeopardize the Company’s ability to continue to engage in U.S. coastwise trade.
Our Operations May Be Impacted By Changing Macroeconomic Conditions and the Ongoing COVID-19 Pandemic.
The continued spread of COVID-19 could have a significant impact on our business by reducing demand for offshore support services. Sustained reductions in worldwide economic growth and economic activity could ultimately lead to a global recession. In a global recession, it is likely that the demand for oil and natural gas would decline and the number of planned offshore drilling projects would decrease. Such a scenario would negatively impact the demand for offshore support services, and in turn, our financial performance. In addition, mandatory quarantines or drill site shutdowns enacted by the government or self-imposed by our customers could limit or reduce offshore drilling production. Significant contractions in offshore drilling production could negatively affect our financial performance.
Our Business is Subject to Complex Laws and Regulations That Can Adversely Affect the Cost, Manner, or Feasibility of Doing Business.
Our operations are subject to extensive federal, state, and local laws and regulations, including complex environmental laws and occupational health and safety laws. We may be required to make large expenditures to comply with such regulations. Failure to comply with these laws and regulations or accidental spills or releases of oil and hazardous substances may result in the suspension or termination of operations and subject us to administrative, civil, and criminal penalties. In the event of environmental violations or accidental spills or releases, we may be charged with the costs of remediation and land owners may file claims for alternative water supplies, property damage, or bodily injury. Laws and regulations protecting the environment have become more stringent in recent years, and may, in some circumstances, result in liability for environmental damage regardless of negligence or fault. In addition, pollution and similar environmental risks generally are not fully insurable. These liabilities and costs could have a material adverse effect on our business, financial condition, results of operations, and cash flows.
Additionally, we operate our vessels in a number of international markets and are subject to various international treaties and the local laws and regulations in jurisdictions where our vessels operate and/or are registered. These conventions, laws and regulations govern matters of environmental protection, worker health and safety, vessel and port security, and the manning, construction, ownership and operation of vessels, including cabotage requirements similar to the Jones Act. Changes in such international treaties and such local laws and regulations can be unpredictable and may adversely affect our ability to carry out operations overseas.
We Operate in a Highly Competitive Industry.
The offshore drilling support industry is both highly competitive and capital-intensive, and requires substantial resources and investment to satisfy customers and maintain profitability. Our customers award contracts based on price, industry reputation, service quality, vessel offerings and capabilities, transit costs, and other similar factors. Though we operate a best-in-class fleet of OSVs and MPSVs and have a proven track record, increased competition for deepwater drilling contracts could depress day rates and utilization rates, adversely affecting our profitability. A sustained inability to win contracts in our key markets would put pressure on our ability to service our debt.
The Loss of Key Personnel Could Adversely Affect Our Relationship with the Military.
The ongoing viability and potential growth of our contractual relationship with the Military is dependent on our continued employment of certain key personnel. Any action taken by the Military in response to the loss of key personnel, or potential loss of key personnel, from our operations could adversely affect our current and future business with the military and, in turn, adversely affect our financials, as applicable.
21
We May Be Adversely Affected by Potential Litigation, Including Litigation Arising Out of the Chapter 11 Cases.
In the future, we may become parties to litigation. In general, litigation can be expensive and time consuming to bring or defend against. Such litigation could result in settlements or damages that could significantly affect our financial results. It is also possible that certain parties will commence litigation with respect to the treatment of their Claims under the Plan. It is not possible to predict the potential litigation that we may become party to nor the final resolution of such litigation. The impact of any such litigation on our businesses and financial stability, however, could be material.
Certain Claims Will Not Be Discharged and Could Have a Material Adverse Effect on Our Financial Condition and Results of Operations.
The Bankruptcy Code provides that the confirmation of a plan of reorganization discharges a debtor from substantially all debts arising prior to confirmation. With few exceptions, all Claims that arise prior to the filing of our Petitions or before confirmation of the plan of reorganization (a) would be subject to compromise and/or treatment under the plan of reorganization and/or (b) would be discharged in accordance with the terms of the plan of reorganization. In order to achieve its objective of a swift confirmation of the Plan, the Company determined to leave many classes of claims as unimpaired and thus such claims are not discharged under the Plan. Holders of such claims can still assert the claims against the reorganized entity and may have an adverse effect on our financial condition and results of operations.
The Loss of Key Personnel Could Adversely Affect Our Operations.
Our operations are dependent upon the efforts and continued employment of our executive officers and key management personnel. Our recent liquidity issues and the Chapter 11 Cases have created distractions and uncertainty for key management personnel and employees. Given the prolonged down-turn that has affected the offshore oil services sector, coupled with industry management turnover resulting from restructurings and other corporate changes, seasoned managers are in demand. The loss of services of one or more of our executive officers or key management personnel could have a negative impact on our financial condition and results of operations.
Unstacking of Vessels Could Adversely Impact the Market for OSVs.
As of June 30, 2020, we had stacked 35 U.S.-flagged OSVs and nine foreign-flagged OSVs. To the extent that we unstack any vessels in response to improvement or perceived improvement in market conditions faster than the market can absorb such additional vessels, the market for OSVs could become oversaturated and would adversely affect dayrates and utilization for our vessels.
As a Result of the Declines in Oil Prices that Began in Late 2014, Our Customers Have Reduced and May Further Reduce Spending on Exploration and Production Projects, Resulting in a Decrease in Demand for Our Services.
Oil and natural gas prices, and market expectations of potential changes in these prices, significantly impact the level of worldwide drilling and production services activities. Reduced demand for oil and natural gas or periods of surplus oil and natural gas generally result in lower prices for these commodities and often impact the economics of planned drilling projects and ongoing production projects, resulting in the curtailment, reduction, delay or postponement of such projects for an indeterminate period of time. When drilling and production activity and related spending declines, both vessel dayrates and utilization for our vessels historically decline as well. This has been the case, beginning in October 2014 and continuing into 2020.
Oil prices worldwide dropped significantly commencing in 2014. While prices have partially recovered, we cannot predict whether current prices are sustainable. Further we do not know whether current prices will result in increased offshore and/or deepwater capital spending by our customers.
A continuation of the prolonged reduction in the overall level of exploration and development activities, whether resulting from changes in oil and gas prices or otherwise, could materially and adversely affect us by negatively impacting:
• | our revenues, cash flows and profitability; |
• | the fair market value of our vessels; |
22
• | our ability to obtain capital to refinance our existing debt or expand our business through newbuilds, acquisitions, or otherwise; |
• | the collectability of our receivables; and |
• | our ability to retain or rehire skilled personnel whom we would need in the event of an upturn in the demand for our services. |
If any of the foregoing were to occur, it could have a material adverse effect on our business and financial results.
Increases in the Supply of Vessels Could Decrease Dayrates.
Both us, through our fifth OSV newbuild program, and certain of our competitors have announced plans to construct and deploy new vessels. An influx of U.S.-flagged vessels currently operating in other regions or in non-oilfield applications into the GoM would result in an increase in vessel capacity in the GoM, one of our core markets. Similarly, vessel capacity in foreign markets, including Mexico and Brazil (our other core markets), may also be impacted by U.S.-flagged or other vessels migrating to such foreign locations. Further, any modification to the Jones Act that would permit foreign-flagged, foreign-built, foreign-owned, foreign-controlled or foreign-operated vessels to engage in the U.S. coastwise trade would also increase vessel capacity in our core markets. Any increase in the supply of OSVs or MPSVs, whether through new construction, refurbishment, or conversion of vessels from other uses, remobilization, or changes in law or its application could increase competition for charters, lower utilization, or lower dayrates, any of which would adversely affect our revenues and profitability. Such an increase in vessel capacity could also exacerbate the impact of the current oil downturn, or any future downturn in the oil and gas industry, which would have an adverse impact on our business.
Additionally, because the Jones Act does not cover certain services provided by MPSVs, foreign competitors may deploy additional MPSVs to the GoM or build additional MPSVs that will compete with us in the GoM.
The Early Termination of Contracts for our Vessels Could Have an Adverse Effect on our Operations.
Certain contracts for our vessels, including contracts with the United States government, allow for early termination at the customer’s option. Many of our contracts that contain early termination provisions contain remedies or other provisions designed to discourage customers from exercising such options. Customers may choose to exercise their termination rights in spite of such remedies or provisions. Until we replace the terminated contracts with new contracts, our business could be temporarily disrupted or adversely affected. Further, we may not be able to replace the terminated contracts on economically equivalent terms due to market or industry conditions.
Additionally, in economic downturns, customers have requested that we adjust the terms of their contracts to be more customer-friendly, including by assuming greater risks. While we are not required to give such concessions, commercial considerations may dictate that we do so, given the relatively few deepwater customers operating in the GoM.
We May Not Be Able to Complete the Construction of Our Remaining Newbuild Program and May Experience Delays or Cost Overruns Related to the Newbuild Program if Construction is Resumed.
We previously began constructing the last two MPSVs under our pending newbuild program. These vessels are large and complex. We estimate that the cost to complete these vessels could exceed the $57.5 million budgeted for their completion. We are engaged in litigation with sureties regarding performance and payments bonds that, if honored, are expected to cover the full cost to completion. Additionally, ongoing litigation with the shipyard contracted to build the vessels and with the surety has halted construction and, to the extent we resume construction, unforeseen events could result in significant cost overruns for which, under certain circumstances, we might be responsible.
Failure to Successfully Complete Repairs, Maintenance and Routine Drydockings On-time and On-budget Could Adversely Affect Our Financial Condition and Operations.
We routinely engage shipyards to drydock vessels for regulatory compliance, repair, and maintenance. Equipment shortages, insufficient shipyard availability, unforeseen engineering issues, work stoppages, weather interference, unanticipated cost increases, inability to obtain necessary certifications and approvals, material shortages, labor issues, and other similar factors could lead to extended delays or additional costs. Significant delays could
23
adversely affect our ability to perform under our contracts, and significant cost overruns could adversely affect our operations and profitability.
Future Acquisitions by Us May Create Additional Risks.
We regularly consider possible acquisitions of single vessels, vessel fleets, and businesses. Acquisitions can involve a number of special risks and challenges, including, but not limited to:
• | diversion of management time and attention from existing business and other business opportunities; |
• | delays in closing the acquisition due to third-party consents, regulatory approvals, or other reasons; |
• | adverse effects from disclosed or undisclosed matters pertaining to the acquisition; |
• | loss or termination of employees and the costs associated with the termination or replacement of such employees; |
• | the assumption of debt, litigation, or other liabilities of the acquired business; |
• | the incurrence of additional debt related to the acquisition; |
• | costs, expenses, and working capital requirements associated with the acquisition; |
• | dilution of stock ownership of existing stockholders; |
• | regulatory costs associated with, among others, Section 404 of the Sarbanes-Oxley Act; and |
• | accounting charges for restructuring and related expenses, impairment of goodwill, amortization of intangible assets, and stock-based compensation expense. |
Even if we consummate an acquisition, the process of integrating the new acquisition into our operations may result in unforeseen operational difficulties and additional costs, and may adversely affect the effectiveness of internal controls over financial reporting. Newly acquired vessels may need to be immediately stacked due to market conditions, resulting in additional stacking and un-stacking costs that could act as a barrier to their deployment if our liquidity position deteriorates. The foregoing risks, and other similar risks, of an acquisition could affect our ability to achieve anticipated levels of utilization, profitability, or other benefits from the acquisitions. An inability to acquire additional vessels or businesses may adversely affect our growth.
Our Contracts with the United States Government Could Be Adversely Affected by Budget Cuts or Government “Shutdowns.”
Our contracts with the United States Government depend upon annual funding commitments authorized by Congress. In a period of government budget cuts or other political events, such as a prolonged government shutdown, such contracts might not be re-authorized or might be temporarily suspended, adversely affecting our financials.
Our Business Involves a Number of Operational Risks That May Disrupt Our Business, Adversely Affect Our Financials, and Insurance May Be Unavailable or Inadequate to Protect Against Such Risks.
Our vessels are subject to operating risks, including, but not limited to:
• | catastrophic marine disaster; |
• | adverse weather and sea conditions; |
• | mechanical failure; |
• | collisions or allisions; |
• | oil or other hazardous substance spills; |
• | navigational errors; |
• | acts of God; and |
• | war or terrorism. |
The occurrence of any of the enumerated events, or other similar events, may result in vessel damage, vessel loss, personnel injury or death, or environmental contamination. The occurrence of any such event could expose us to liability or costs that we would be required to pay before seeking repayment from our insurers.
Affected vessels may also be removed from service and thus be unavailable for income-generating activity. While we believe that our insurance coverage is adequate and insures against risks that are customary in the industry, we may
24
be unable to renew such coverage in the future at commercially reasonable rates. Moreover, existing or future coverage may not be sufficient to cover claims that may arise and we do not maintain insurance for loss of income resulting from a marine casualty.
Our Operations in International Markets and Shipyard Activities in Foreign Shipyards Subjects us to Risks Inherent in Conducting Business Internationally.
We derive a portion of our revenues from foreign sources. In addition, certain of our shipyard repair and procurement activities are being conducted with foreign vendors. We therefore face risks inherent in conducting business internationally, such as legal and governmental regulatory requirements, potential vessel detentions, seizures or nationalization of assets, import-export quotas or other trade barriers, difficulties in collecting accounts receivable and longer collection periods, political and economic instability, kidnapping of or assault on personnel, piracy, adverse tax consequences, difficulties and costs of staffing international operations and language and cultural differences. We do not hedge against foreign currency risk. While we endeavor to contract in U.S. Dollars when operating internationally, some contracts may be denominated in a foreign currency, which would result in a foreign currency exposure risk. All of these risks are beyond our control and difficult to insure against. We cannot predict the nature and the likelihood of any such events. If such an event should occur, however, it could have a material adverse effect on our financial condition and results of operations.
We May Be Unable To Attract And Retain Qualified, Skilled Employees Necessary To Operate Our Business.
Much of our success depends on our ability to attract and retain highly skilled and qualified personnel. Our inability to hire, train, and retain a sufficient number of qualified employees could impair our ability to manage, maintain, and grow our business.
In crewing our vessels, we require skilled employees who can perform physically demanding work. As a result of the recent volatility in the oil and gas industry, we have significantly reduced our crew headcount. Additionally, as a result of such volatility, vessel employees and potential employees may choose to pursue employment in fields that offer a more desirable work environment at wage rates that are competitive with those we offer. In normal market conditions, we face strong competition within the broader oilfield industry for employees and potential employees, including competition from drilling rig operators for fleet personnel. We may have difficulty hiring employees or finding suitable replacements as needed and, once normal market conditions return, should a reduced pool of workers arise, it is possible that we would have to raise wage rates or increase benefits offered to attract workers and to retain current employees. In such circumstances, if we are unable to increase our service rates to customers to compensate for wage increases or recruit qualified personnel to operate vessels at full utilization, our financial condition and results of operations may be adversely affected.
Our Employees Are Covered by Federal Laws That May Subject Us to Job-related Claims in Addition to Those Provided by State Laws.
Provisions of the Jones Act, the Death on the High Seas Act, and general maritime law cover certain of our employees. These laws preempt state workers’ compensation laws and permit employees and their representatives to pursue actions against employers for job-related tort claims in federal courts. Because we are generally not protected by the damage limits imposed by state workers’ compensation statutes for these types of claims, we may be exposed to higher damage awards for these types of claims.
We Are Susceptible to Unexpected Increases in Operating Expenses such as Crew Wages, Materials and Supplies, Maintenance and Repairs, and Insurance Costs.
Many of our operating costs, such as crew wages, materials and supplies, maintenance and repairs, and insurance costs are unpredictable and vary based on events beyond our control. Our profitability will vary based on fluctuations in operating costs. If our operating costs increase, we may not be able to recover such costs from customers. Such an increase in operating costs could adversely affect our financials.
25
Stacked Vessels May Introduce Additional Operational Issues.
Due to difficult market conditions, we elected to stack certain vessels in our fleet at various points in the last several years. We also reduced the number of crew and personnel that operate and maintain such vessels. Though vessel stacking reduces the costs of operating a vessel, it reduces the number of available vessels we can deploy to service our customers and limits potential revenues. If market conditions do not improve, we may be required to stack additional vessels.
When we elect to unstack the stacked vessels, we will incur regulatory recertification and remobilization costs and may incur additional costs to hire and train personnel to operate the vessels. Such costs could have an adverse effect on our financials and operations.
We May Be Unable to Collect Amounts Owed to Us by Customers.
We typically grant customers credit on a short-term basis. Because we do not typically collect collateralized receivables from customers, we are subject to credit risk on the credit we extend. We estimate uncollectible accounts in our financial statements based on historical losses, current economic conditions, and individual customer evaluations. However, our estimates may not be accurate and the receivables due from customers as reflected in our financial statements may not be collectible. In addition, the continued adverse effect of the combination of COVID-19 and the ongoing oil price war initiated by Russia and Saudi Arabia on the macro supply-demand equation for commodity prices is expected to result in a greater than usual number of oil and gas and oilfield service companies being at risk of bankruptcy, which could exacerbate our revenue collection efforts.
The Plan Will Result in the Cancellation of Our Common Stock and Satisfaction of Our Other Publicly Traded Securities.
Under the Plan, all of our existing equity interest will be extinguished and our other publicly traded securities will be satisfied. Amounts invested by the holders of our common stock will not be recoverable and our common stock will have no value.
Item 1B—Unresolved Staff Comments
None.
26
Item 2—Properties
Our principal executive offices are in Covington, Louisiana, where we lease approximately 65,000 square feet of office space under a lease with a current term expiring in September 2025 and three additional five-year renewal periods. Our primary domestic operating facility is located in Port Fourchon, Louisiana. We also maintain three international offices from which we manage, market and operate our fleet of vessels in Mexico and Brazil, as set forth below. For more information, see "Management’s Discussion and Analysis of Financial Condition and Results of Operations" included within this report. We believe that our facilities, including waterfront locations used for vessel dockage and certain vessel repair work, provide an adequate base of operations for the foreseeable future.
Our principal properties as of December 31, 2019 are as follows:
Location | Description | Area Using Property | Owned/Leased | |||
Covington, Louisiana, USA | Corporate Headquarters | Corporate | Leased | |||
Hammond, Louisiana, USA | Warehouse | GoM | Owned | |||
Port Fourchon, Louisiana, USA | Dock, Office, Warehouse, Yard | GoM | Leased | |||
Paraiso, Tabasco, Mexico | Office | Mexico | Leased | |||
Ciudad Del Carmen, Campeche, Mexico | Office | Mexico | Leased | |||
Barra da Tijuca, Rio de Janeiro, Brazil | Office | Brazil | Leased | |||
Houston, Texas, USA | Office | GoM | Leased | |||
In addition to the foregoing, our revenues are principally derived from our vessels described in "Item 1—Business" of this Annual Report on Form 10-K.
Item 3—Legal Proceedings
In December 2000, LEEVAC Marine Inc. (a predecessor entity to our current subsidiary Hornbeck Offshore Transportation, LLC, or HOT) was one of several companies that formed a limited liability company, SSIC Remediation, LLC, or SSIC, which conducted interim phase environmental remedial activities at the SBA Shipyards site in Jennings, Louisiana pursuant to a December 9, 2002 Order and Agreement with the EPA. In 2015, the EPA notified SSIC’s counsel of its renewed interest in the site and on September 9, 2016 published a final rule (effective October 11, 2016) adding the site to the General Superfund section of the CERCLA National Priorities List. In November 2016, HOT and nine other parties voluntarily entered into an Administrative Settlement Agreement and Order on Consent to conduct a Remedial Investigation/Feasibility Study, or RIFS, in connection with the site. Work commenced in 2018 following EPA approval of the RIFS work plan. HOT has accrued a liability of $0.1 million to cover expenses anticipated to be incurred with respect to conducting the RIFS. HOT’s anticipated percentage of liability for the RIFS cost is 3.4%. The Company has not made a judgment concerning the ultimate cost of clean up should it be required.
During the first quarter of 2018, the Company notified Gulf Island Shipyards, LLC, or Gulf Island, the shipyard that was constructing the remaining two vessels in the Company's fifth OSV newbuild program, that it was terminating the construction contracts for such vessels based on the shipyard's statements that it would be more than one year late in the delivery of the vessels, among other reasons. On October 2, 2018, Gulf Island filed suit against the Company in the 22nd Judicial District Court for the Parish of St. Tammany in the State of Louisiana. Gulf Island claims that it has the right to complete the vessels or, alternatively, the Company owes Gulf Island compensation for unpaid work. The Company disputes these claims and has asserted counter-claims against Gulf Island seeking to recover liquidated and other damages. The Company has also sued for conversion, claiming that Gulf Island has wrongfully detained the vessels in its possession, which has delayed the Company's ability to contract for their completion at a replacement shipyard. On November 5, 2019, the district court denied a preliminary motion for summary judgment to require the Gulf Island to release its possession of the vessels. The Company has also sued the sureties that issued performance bonds in respect of the shipbuilding contracts. The Company claims that the sureties wrongfully denied the Company's claims under the bonds and have refused to perform their obligations under the bonds. The Company has also claimed that the sureties' conduct has been in bad faith. In the Chapter 11 Cases, the Company has initiated an adversary proceeding seeking the Bankruptcy Court to order Gulf Island to turn over to the Company the vessels and associated equipment.
27
Item 4—Mine Safety Disclosures
None.
PART II
Item 5—Market for Registrant’s Common Equity, Related Stockholder Matters and Issuer Purchases of Equity Securities
Not required.
Item 6—Selected Financial Data
Not required.
Item 7—Management’s Discussion and Analysis of Financial Condition and Results of Operations
The following management’s discussion and analysis of financial condition and results of operations should be read in conjunction with our historical consolidated financial statements and their notes included elsewhere in this Annual Report on Form 10-K. This discussion contains forward-looking statements that reflect our current views with respect to future events and financial performance. Our actual results may differ materially from those anticipated in these forward-looking statements or as a result of certain factors such as those set forth in our Forward Looking Statements disclaimer on page ii of this Annual Report on Form 10-K.
General
During 2019, volatility in oil prices continued as WTI and Brent prices ranged from $45 to $75 per barrel throughout the year. While the Company expected generally improved market conditions to take hold during 2020, the outbreak and ensuing global pandemic related to COVID-19 silenced those expectations. A global decline in demand for oil resulting from COVID-19 economic closures combined with a temporary but significant increase in production by Saudi Arabia and Russia following the COVID-19 outbreak conspired to cause a collapse in oil prices during April 2020 that was unprecedented. While oil prices have recovered somewhat, there remains a significant overhang in supply and lingering weak demand on a global basis. The decrease in oil prices caused major, international and independent oil companies with deepwater operations to significantly reduce their offshore capital spending budgets for the worldwide exploration or production of oil and gas, prolonging the industry downturn that has prevailed since late 2014. Reduced spending by our customers combined with the already global oversupply of OSVs, including high-spec OSVs in our core markets, resulted in significant reductions in our dayrates and utilization. These factors ultimately resulted in the Company’s determination to seek bankruptcy protection on May 19, 2020. The principal question facing the offshore oilfield industry is the remaining duration of the current downturn in offshore activities. The continuation of the COVID-19 pandemic is expected to continue to depress demand and the timing of a global economic recovery is unclear. In addition, there can be no assurance regarding the production levels of oil and gas by Russia, Saudi Arabia, and other oil producing countries and, therefore, the price of oil.
On May 19, 2020, in accordance with the RSA, the Company initiated the Chapter 11 Cases with the Bankruptcy Court. On June 19, 2020, after a confirmation hearing, the Bankruptcy Court entered a confirmation order approving the Plan. The Plan will become effective after the conditions to its effectiveness have been satisfied. The effect of the Plan is to de-lever the Company’s balance sheet through a conversion into equity or warrants or both of 1) a portion of the $350 million in first-lien term loans that mature in June 2023; 2) $121 million in second-lien term loans that mature in February 2025; 3) $224 million outstanding under our 2020 senior notes indenture, and; 4) $450 million outstanding under our 2021 senior notes indenture. The holders of first-lien term loans will also receive their pro rata portion of the second-lien term loans issued as part of the Exit Financings. All pre-petition equity interests in the Company will be canceled, released, and extinguished on the effective date of the Plan, and will thereafter be of no further force or effect. See "Item 1 - Joint Prepackaged Chapter 11 Plan of Reorganization" and Note 2 of our consolidated financial statements included herein for further discussion.
In late 2019, we had observed leading indicators that signaled the potential for improved conditions - including larger offshore capital budget announcements by our customers, a growth in the number of final investment decisions,
28
or FIDs, made public by our customers for offshore projects, recently announced deepwater discoveries, a growing contract backlog announced by several drilling contractors and increased customer inquiries for our services, principally in the Greater GoM Operating Region. Most of these plans have not proceeded in 2020. We expect some to be cancelled altogether while others are being postponed. The duration of postponement is expected to be determined by the ability to operate during the COVID-19 pandemic and oil price recovery. We have experienced multiple charter cancellations and non-renewals.
During 2019, we did not observe any significant change in the anticipated supply of high-spec U.S.-flagged OSVs. In the U.S. GoM, two high-spec OSVs were delivered into the domestic market during the year and we currently expect two additional high-spec OSV to be delivered into domestic service during the remainder of 2020. There were three high-spec, Jones-Act qualified OSVs under construction by industry participants on June 30, 2020 and as of that date there were no options to build additional high-spec Jones-Act qualified OSVs. We do not anticipate significant growth in the supply of high-spec U.S.-flagged OSVs beyond the currently anticipated level of 178 of such vessels by the end of 2020. We continue to monitor the overhang of the dormant supply of stacked U.S.-flagged high-spec OSVs. There are approximately 95 stacked domestic vessels and all of these vessels will require intermediate or special surveys in order to return to service. We believe that the cost to industry participants to reactivate high-spec OSVs, including survey costs, crewing costs, training costs and unanticipated events, will range between $2 million and $5 million per vessel, on average. During the first half of 2020, we have observed an additional 23 high-spec OSVs go into stack, including six of our own.
During 2019, there was an average of 25.8 floating rigs working in the Greater GoM Operating Region. We believe that the number of active drilling units in the Greater GoM Operating Region will decline in 2020. As of June 30, 2020, there were 26 rigs available and 20 were working. During the second half of 2020, we expect that the active floating rig count could drop to as low as 10 to 15.
Unlike our OSVs, whose utilization is tied principally to drilling activities, demand for our MPSVs is also driven by other offshore activities. These vessels are used for a wide variety of oilfield applications that are not necessarily related to drilling. Because of the need to continuously inspect, repair and maintain offshore infrastructure, our MPSVs have, at times, partially counter-acted weakness in overall drilling activities. However, we have not yet seen a significant pick up in the expansion of offshore infrastructure, such as the installation of new floating and subsea infrastructure and field development that more meaningfully drive MPSV utilization. Project cancellations and delays have driven extremely weak utilization for our MPSVs during 2020. While peak activity normally occurrs in late spring through early fall, we see little evidence that MPSV utilization will improve seasonally during 2020.
Since October 1, 2014, we stacked OSVs and MPSVs on various dates. As of December 31, 2019, we had 34 OSVs and two MPSVs stacked. As of June 30, 2020, we had 44 OSVs and two MPSVs stacked and such stacked vessels represent 62% of our fleetwide vessel headcount, and 51% of our total OSV and MPSV deadweight tonnage. The Company reactivated one MPSV during the first quarter of 2020. We may consider stacking additional vessels or reactivating vessels as market conditions warrant. By stacking vessels, we have significantly reduced our on-going cash outlays and lowered our risk profile; however, we also have fewer revenue-producing units in service that can contribute to our results and produce cash flows to cover our fixed costs and commitments. While we may choose to stack additional vessels should market conditions warrant, our current expectation is to retain our active fleet in the market to accept contracts at the best available terms even if such contracts are below our breakeven cash cost of operations.
Mexico and Brazil continue to comprise our two core international markets. In order to support customer requirements in Mexico, and based on our long-term view that Mexico will continue to invest directly or allow foreign investment in its offshore energy sector, and increasingly in deepwater prospects, we elected to Mexican-flag five HOSMAX 300 class OSVs, three 280 class OSVs, two 240 class OSVs and one MPSV since January 1, 2018. At present, our Mexican-flagged fleet is comprised of ten high-spec OSVs, five low-spec OSVs and one MPSV, which is the second largest concentration of vessels we have committed to any single national market. Mexico has undergone significant transformation as a market for offshore energy over the last several years. IOCs appear to be proceeding with drilling plans in Mexico, despite current industry conditions. While we have experienced some cancellations from drilling customers in Mexico, most of our customers appear to be proceeding with their plans. A significant factor affecting the health of the Mexican offshore market is the weakening financial condition of Pemex. While we are not currently working for Pemex directly, like many contractors, we work for customers who are working for Pemex. Pemex recently announced a suspension of contracts and has disclosed a significant level of financial distress that is impacting its ability to pay offshore contractors, many of which are our customers. We are affected by slow- or non-payment by some of these customers and our unwillingness to work for customers that have significant Pemex credit
29
risk. Offshore activity driven by Pemex is likely to decline overall, and we are likely to see less work in Mexico due to this decline and are, thus, unlikely to work for customers that have extensive Pemex exposure.
In Brazil, we presently own and operate one Brazilian-flagged high-spec OSV. We have flexibility under Brazilian law to import and flag into Brazilian registry an additional vessel of similar DWT. In 2019, our Vanuatu-flagged MPSV worked as a flotel in Brazil on an IOC project that ended in the first quarter of 2020. Brazil is the single largest deepwater market in the world. Recent measures to expand the role of IOCs in its “pre-salt” prospects are taking hold and we believe Brazilian activity in the offshore energy space will be a significant contributor to the overall recovery in global offshore E&P activities.
Our Vessels
All of our current vessels are qualified under the Jones Act to engage in U.S. coastwise trade, except for 19 foreign-flagged new generation OSVs and two foreign-flagged MPSVs. As of December 31, 2019, our 32 active new generation OSVs, six MPSVs and four managed OSVs were operating in domestic and international areas as noted in the following table:
Operating Areas | ||
Domestic | ||
GoM | 24 | |
Other U.S. coastlines(1) | 5 | |
29 | ||
Foreign | ||
Brazil | 2 | |
Mexico | 9 | |
Caribbean | 2 | |
13 | ||
Total Active Vessels(2) | 42 | |
(1) | Comprised of one owned vessel and four managed vessels that are currently supporting the U.S. military. |
(2) | Excluded from this table are 34 OSVs and two MPSVs that were stacked as of December 31, 2019. |
During the first quarter of 2018, the Company notified Gulf Island, the shipyard that was constructing the remaining two vessels in the Company's fifth OSV newbuild program, that it was terminating the construction contracts for such vessels based on the shipyard's statements that it would be more than one year late in the delivery of the vessels, among other reasons. On October 2, 2018, Gulf Island filed suit against the Company in the 22nd Judicial District Court for the Parish of St. Tammany in the State of Louisiana. Gulf Island claims that it has the right to complete the vessels or, alternatively, the Company owes Gulf Island compensation for unpaid work. The Company disputes these claims and has asserted counter-claims against Gulf Island seeking to recover liquidated and other damages. The Company has also sued for conversion, claiming that Gulf Island has wrongfully detained the vessels in its possession, which has delayed the Company's ability to contract for their completion at a replacement shipyard. On November 5, 2019, the district court denied a preliminary motion for summary judgment to require the Gulf Island to release its possession of the vessels. The Company has also sued the sureties that issued the performance bonds in respect of the shipbuilding contracts. The Company claims that the sureties wrongfully denied the Company's claims under the bonds and have refused to perform their obligations under the bonds. The Company has also claimed that the sureties' conduct has been in bad faith.
As of the date of termination of the construction contracts, these two remaining vessels, both of which are domestic 400 class MPSVs, were projected to be delivered in the second and third quarters of 2019, respectively. These projected delivery dates were subsequently amended, for guidance purposes, to be the second and third quarters of 2020; and then later extended to be the second and third quarters of 2021. Due to the continued uncertainty of the timing and location of future construction activities, the Company is now updating its forward guidance for the delivery dates related to these vessels to be the second and third quarters of 2022, respectively. However, the timing of the remaining construction draws remains subject to change commensurate with any potential further delays in the delivery dates of such vessels. The cost of this nearly completed 24-vessel newbuild program, before construction period interest, is expected to be approximately $1,335.0 million, of which $22.9 million and $34.6 million are currently expected to be incurred in 2021 and 2022, respectively. The foregoing amounts do not reflect any potential additional payments to the shipyard in respect of the aforementioned claim. From the inception of this program through December 31, 2019, the Company had incurred $1,277.5 million, or 95.7%, of total expected project costs.
30
Operating Costs
Our operating costs are primarily a function of fleet size, areas of operations and utilization levels. The most significant direct operating costs are wages paid to vessel crews, maintenance and repairs, and marine insurance. Because most of these expenses are incurred regardless of vessel utilization, our direct operating costs as a percentage of revenues may fluctuate considerably with changes in dayrates and utilization. As of December 31, 2019, we had 36 stacked vessels. By removing these vessels from our active operating fleet, we have been able to significantly reduce our operating costs, including crew costs. If market conditions worsen, we may elect to stack additional vessels. Our fixed operating costs are now spread over 38 owned and operated vessels and four vessels managed for the U.S. Navy.
In certain foreign markets in which we operate, we are susceptible to higher operating costs, such as materials and supplies, crew wages, maintenance and repairs, taxes, importation duties, and insurance costs. Difficulties and costs of staffing international operations, including vessel crews, and language and cultural differences generally contribute to a higher cost structure in foreign locations compared to our domestic operations. We may not be able to recover higher international operating costs through higher dayrates charged to our customers. Therefore, when we increase our international complement of vessels, our gross margins may fluctuate depending on the foreign areas of operation and the complement of vessels operating domestically.
In addition to the operating costs described above, we incur fixed charges related to the depreciation of our fleet and amortization of costs for routine drydock inspections to ensure compliance with applicable regulations and to maintain certifications for our vessels with the USCG and various classification societies. The aggregate number of drydockings and other repairs undertaken in a given period determines the level of maintenance and repair expenses and marine inspection amortization charges. We capitalize costs incurred for drydock inspection and regulatory compliance and amortize such costs over the period between such drydockings, typically between 24 and 36 months. Applicable maritime regulations require us to drydock our vessels twice in a five-year period for inspection and routine maintenance and repair. If we undertake a disproportionately large number of drydockings in a particular year, comparability of results may be affected. While we can defer required drydockings of stacked vessels, we will be required to conduct such deferred drydockings prior to such vessels returning to service, which could delay their return to active service.
Critical Accounting Estimates
Our consolidated financial statements included in this Annual Report on Form 10-K have been prepared in accordance with accounting principles generally accepted in the United States. In many cases, the accounting treatment of a particular transaction is specifically dictated by GAAP. In other circumstances, we are required to make estimates, judgments and assumptions that we believe are reasonable based upon available information. We base our estimates and judgments on historical experience and various other factors that we believe are reasonable based upon the information available. Actual results may differ from these estimates under different assumptions and conditions. We believe that of our significant accounting policies discussed in Note 3 to our consolidated financial statements, the following may involve estimates that are inherently more subjective.
Carrying Value of Vessels. We depreciate our OSVs and MPSVs over estimated useful lives of 25 years each. Salvage value for our new generation marine equipment is estimated to be 25% of the originally recorded cost for these asset types. In assigning depreciable lives to these assets, we have considered the effects of both physical deterioration largely caused by wear and tear due to operating use and other economic and regulatory factors that could impact commercial viability. To date, our experience confirms that these policies are reasonable, although there may be events or changes in circumstances in the future that indicate that recovery of the carrying amount of our vessels might not be possible.
We presently review the carrying values of our vessels for impairment using the following asset groups: OSVs and MPSVs. We believe that these two vessel groups are appropriate because our vessels are highly mobile among disparate geographies and are directed centrally from our headquarters. Our OSVs share multiple forms of direct and indirect common costs and are marketed on a portfolio basis as an integrated (multi-vessel) marine solution to our customers primarily supporting drilling and exploration activities in various deepwater and ultra-deepwater markets worldwide to our customers. We manage, market, operate and maintain our vessels in a unified manner because we are performing the same services to the same client group across the same geographic regions - i.e., primarily the transportation of the same fungible types of cargo. We believe that our unified approach to operating the vessels within each group is among the most important factors and strategic advantages that drive our customers to utilize our vessels, irrespective of the type or size of vessel that the customer requires on a given engagement. Therefore,
31
management has concluded that the lowest level for which identifiable cash flows are largely independent of the cash flows of other assets and liabilities is at the OSV and MPSV groupings.
When analyzing asset groups for impairment, we consider both historical and projected operating cash flows, operating income, and EBITDA based on current operating environment and future conditions that we can reasonably anticipate, such as inflation or prospective wage costs. These projections are based on, but not limited to, job location, current and historical market dayrates included in recent sales proposals, utilization and contract coverage; along with anticipated market drivers, such as drilling rig movements, results of offshore lease sales and discussions with our customers regarding their ongoing drilling plans.
If events or changes in circumstances as set forth above were to indicate that the asset group’s carrying amount may not be recoverable over the vessels' useful lives for such groups, we would then be required to estimate the future undiscounted cash flows expected to result from the use of the asset group and its eventual disposition. If the sum of the expected future undiscounted cash flows was determined to be less than the carrying amount of the vessels, we would be required to reduce the carrying amount to fair value. Examples of events or changes in circumstances that could indicate that the recoverability of the carrying amount of our asset groups should be assessed might include a significant change in regulations such as OPA 90, a significant decrease in the market value of the asset group and current period operating or cash flow losses combined with a history of operating or cash flow losses or a projection or forecast that demonstrates continuing losses associated with the asset group.
During the second quarter of 2016, we identified indicators of impairment relating to our vessels as a result of operating losses occurring for the first time in our history due to the rapid decline in market conditions. In accordance with GAAP, we calculated the undiscounted cash flows using a probability weighted forecast for each of our asset groups over their respective remaining useful lives. Included in the cash flow projections were assumptions related to the current mix of active and stacked vessels, the estimated timing of stacked vessels returning to active status along with projected dayrates, operating expenses and overhead expenses related to each of the groupings. We view vessel stackings as a temporary status and a prudent business strategy. Stacking vessels does not imply that we have ceased marketing such vessels or intend to never reactivate such vessels when market conditions improve. In fact, we have unstacked vessels in recent quarters and will continue to do so as warranted. The total of the undiscounted cash flows was greater than the net book values of our asset groups and, therefore, we concluded that we did not have an impairment of our long-lived assets as of June 30, 2016, and in such analysis, noted a significant cushion for each of our asset groups as a result of the long remaining useful lives of our vessels.
While we have not observed any new impairment indicators since the second quarter of 2016, each quarterly period, we assess whether there are any new indicators present and whether there have been any events or developments that would indicate that our most recent undiscounted cash flow analysis warrants being updated to reflect a change in inputs or assumptions. During 2019, we reviewed and updated, as necessary, the assumptions used in determining our undiscounted cash flow projections for each asset group to reflect current and projected market conditions, and also prepared and updated our sensitivity analysis relating to such assumptions. After reviewing the result of our most recent undiscounted cash flow projections, which were prepared in mid-2019, we have determined that each of our asset groups continues to have sufficient projected undiscounted cash flows to recover the remaining book value of our long-lived assets within such group. In the development of the undiscounted cash flows, in addition to the previously discussed considerations above and in light of current market conditions, we estimate the length of time it will take for the market to absorb our stacked vessels such that we can return those vessels to active status. Any significant revisions to this estimate would have the greatest impact in the development of the undiscounted cash flows. However, as part of our most recent analysis, we determined that if we extended the downturn (and, thus, the unstacking of vessels) by two years from the most recent estimate, this would reduce our undiscounted cash flows by less than 15%, still providing us with substantial excess undiscounted cash flow coverage of the assets’ net book values given the length of remaining useful lives for the assets. Further, we also perform a look-back analysis each quarter to compare our actual performance to that of our most recently prepared undiscounted cash flow analysis. In each case since June 2016, we have noted that our actual quarterly performance has outperformed the applicable estimated undiscounted cash flow calculations used in completing the latest impairment analysis for such comparable period. See Note 3 to our consolidated financial statements included herein for further discussion. We will continue to closely monitor market conditions and potential impairment indicators as long as this market downturn persists.
Recertification Costs. Our vessels are required by regulation to be recertified after certain periods of time. These recertification costs are incurred while the vessel is in drydock where other routine repairs and maintenance are performed and, at times, major replacements and improvements are performed. We expense routine repairs and
32
maintenance as they are incurred. Recertification costs can be accounted for under GAAP in one of two ways: (1) defer and amortize or (2) expense as incurred. We defer and amortize recertification costs over the length of time that the recertification is expected to last, which is generally 30 months on average. Major replacements and improvements, which extend the vessel’s economic useful life or increase its functional operating capability, are capitalized and depreciated over the vessel’s remaining economic useful life. Inherent in this process are judgments we make regarding whether the specific cost incurred is capitalizable and the period that the incurred cost will benefit.
Revenue Recognition. The services that are provided by the Company represent a single performance obligation under its contracts that are satisfied at a point in time or over time. Revenues are earned primarily by (1) chartering the Company's vessels, including the operation of such vessels, (2) providing vessel management services to third party vessel owners, and (3) providing shore-based port facility services, including rental of land.
Allowance for Doubtful Accounts. Our customers are primarily national oil companies, major and independent, domestic and international, oil and gas and oilfield service companies. Our customers are granted credit on a short-term basis and related credit risks are considered minimal. We usually do not require collateral. We provide an estimate for uncollectible accounts based primarily on management’s judgment. Management uses the relative age of receivable balances, historical losses, current economic conditions and individual evaluations of each customer to make adjustments to the allowance for doubtful accounts. Our historical losses have not been significant. However, because amounts due from individual customers can be significant, future adjustments to the allowance can be material if one or more individual customer’s balances are deemed uncollectible.
Income Taxes. We follow accounting standards for income taxes that require the use of the liability method of computing deferred income taxes. Under this method, deferred income taxes are provided for the temporary differences between the financial reporting basis and the tax basis of our assets and liabilities. Deferred tax assets and liabilities are measured using enacted tax rates expected to apply to taxable income in the years in which those temporary differences are expected to be recovered or settled. The assessment of the realization of deferred tax assets, particularly those related to tax net operating loss, or NOL, carryforwards and foreign tax credit, or FTC, carryforwards, is based on the weight of all available evidence, both positive and negative, including future reversals of deferred tax liabilities. Due to a cumulative three-year book loss, ASC 740 precludes us from using projected operating results in determining the realization of deferred tax assets. We are using the existing taxable temporary differences that will reverse and create taxable income in the future to determine the realizability of these NOL and FTC carryforwards. We have valuation allowances of $33.3 million and $52.9 million as of December 31, 2019 and 2018, respectively. Such valuation allowances were established because we determined that it was more likely than not such NOL and FTC carryforwards may not be fully utilized prior to their expiration. In addition, each reporting period, we assess and adjust for any significant changes to our liability for unrecognized income tax benefits. We account for any interest and penalties relating to uncertain tax positions in general and administrative expenses.
Legal Contingencies. We are involved in a variety of claims, lawsuits, investigations and proceedings, as described in Notes 7 and 14 to our consolidated financial statements. We determine whether an estimated loss from a contingency should be accrued by assessing whether a loss is deemed probable and can be reasonably estimated. We assess our potential liability by analyzing our litigation and regulatory matters using available information. We develop our views on estimated losses in consultation with outside counsel handling our defense in these matters, which involves an analysis of potential results, assuming a combination of litigation and settlement strategies. Should developments in any of these matters cause a change in our determination such that we expect an unfavorable outcome and result in the need to recognize a material accrual, or should any of these matters result in a final adverse judgment or be settled for a significant amount, they could have a material adverse effect on our results of operations in the period or periods in which such change in determination, judgment or settlement occurs.
33
Results of Operations
The tables below set forth the average dayrates, utilization rates and effective dayrates for our owned new generation OSVs and the average number and size of such vessels owned during the periods indicated. These vessels generate a substantial portion of our revenues. Excluded from the OSV information below is the results of operations for our MPSVs, our shore-base facility, and vessel management services, including the four non-owned vessels managed for the U.S. Navy. The Company does not provide average or effective dayrates for its MPSVs. MPSV dayrates are impacted by highly variable customer-required cost-of-sales associated with ancillary equipment and services, such as ROVs, accommodation units and cranes, which are typically recovered through higher dayrates charged to the customer. Due to the fact that each of our MPSVs have a workload capacity and significantly higher income generating potential than each of the Company’s new generation OSVs, the utilization and dayrate levels of our MPSVs could have a very large impact on our results of operations. For this reason, our consolidated operating results, on a period-to-period basis, are disproportionately impacted by the level of dayrates and utilization achieved by our six active MPSVs.
Years Ended December 31, | |||||||
2019 | 2018 | ||||||
Offshore Supply Vessels: | |||||||
Average number of new generation OSVs(1) | 66.0 | 64.5 | |||||
Average number of active new generation OSVs(2) | 30.7 | 23.9 | |||||
Average new generation OSV fleet capacity (DWT) | 238,895 | 231,715 | |||||
Average new generation OSV capacity (DWT) | 3,620 | 3,593 | |||||
Average new generation OSV utilization rate(3) | 28.3 | % | 26.3 | % | |||
Effective new generation OSV utilization rate(4) | 61.0 | % | 70.9 | % | |||
Average new generation OSV dayrate(5) | $ | 18,679 | $ | 19,150 | |||
Effective dayrate(6) | $ | 5,286 | $ | 5,036 | |||
(1) | We owned 66 new generation OSVs as of December 31, 2019. Excluded from this data are eight MPSVs owned and operated by the Company as well as four non-owned vessels managed for the U.S. Navy. |
(2) | In response to weak market conditions, we elected to stack certain of our new generation OSVs on various dates since October 2014. Active new generation OSVs represent vessels that are immediately available for service during each respective period. |
(3) | Utilization rates are average rates based on a 365-day year. Vessels are considered utilized when they are generating revenues. |
(4) | Effective utilization rate is based on a denominator comprised only of vessel-days available for service by the active fleet, which excludes the impact of stacked vessel days. |
(5) | Average new generation OSV dayrates represent average revenue per day, which includes charter hire, crewing services and net brokerage revenues, based on the number of days during the period that the OSVs generated revenues. |
(6) | Effective dayrate represents the average dayrate multiplied by the average new generations utilization rate. |
34
YEAR ENDED DECEMBER 31, 2019 COMPARED TO YEAR ENDED DECEMBER 31, 2018
Summarized financial information for the years ended December 31, 2019 and 2018, respectively, is shown below in the following table (in thousands, except percentage changes):
Year Ended December 31, | Increase (Decrease) | ||||||||||||||
2019 | 2018 | $ Change | % Change | ||||||||||||
Revenues: | |||||||||||||||
Vessel revenues | |||||||||||||||
Domestic | $ | 108,166 | $ | 136,574 | $ | (28,408 | ) | (20.8 | ) | % | |||||
Foreign | 80,153 | 39,193 | 40,960 | >100 | % | ||||||||||
188,319 | 175,767 | 12,552 | 7.1 | % | |||||||||||
Non-vessel revenues | 37,343 | 36,637 | 706 | 1.9 | % | ||||||||||
225,662 | 212,404 | 13,258 | 6.2 | % | |||||||||||
Operating expenses | 164,630 | 147,642 | 16,988 | 11.5 | % | ||||||||||
Depreciation and amortization | 114,313 | 108,668 | 5,645 | 5.2 | % | ||||||||||
General and administrative expenses | 53,880 | 43,530 | 10,350 | 23.8 | % | ||||||||||
332,823 | 299,840 | 32,983 | 11.0 | % | |||||||||||
Gain on sale of assets | 62 | 59 | 3 | 5.1 | % | ||||||||||
Operating loss | (107,099 | ) | (87,377 | ) | (19,722 | ) | 22.6 | % | |||||||
Loss on early extinguishment of debt, net | (71 | ) | — | (71 | ) | (100.0 | ) | % | |||||||
Interest expense | 83,380 | 63,566 | 19,814 | 31.2 | % | ||||||||||
Interest income | 4,488 | 2,228 | 2,260 | >100 | % | ||||||||||
Other income (expense), net | 10,255 | (29 | ) | 10,284 | >(100.0) | % | |||||||||
Income tax benefit | (36,993 | ) | (29,621 | ) | (7,372 | ) | 24.9 | % | |||||||
Net loss | $ | (138,814 | ) | $ | (119,123 | ) | $ | (19,691 | ) | 16.5 | % | ||||
Revenues. Revenues for 2019 increased by $13.3 million, or 6.2%, to $225.7 million compared to $212.4 million for 2018. Our weighted-average active operating fleet for 2019 was approximately 36.6 vessels compared to 31.1 vessels for 2018.
Vessel revenues increased $12.6 million, or 7.1%, to $188.3 million for 2019 compared to $175.8 million for 2018. The increase in vessel revenues primarily resulted from the full-year contribution of four acquired OSVs added to our operating fleet during the second quarter of 2018 and the unstacking of one MPSV in early 2019. Revenues earned from our MPSV fleet increased $3.5 million, or 6.1%, for 2019 compared to 2018. For 2019, we had an average of 37.4 vessels stacked compared to an average of 41.4 vessels stacked in the prior year. Average new generation OSV dayrates were $18,679 for 2019 compared to $19,150 for 2018, a decrease of $471, or 2.5%. Our new generation OSV utilization was 28.3% for 2019 compared to 26.3% for 2018. Our new generation fleet of OSVs incurred 590 days of aggregate downtime for regulatory drydockings and certain vessels were stacked for an aggregate of 12,897 days during 2019. Excluding stacked vessel days, our new generation OSV effective utilization was 61.0% and 70.9% during 2019 and 2018, respectively. Domestic vessel revenues decreased $28.4 million during 2019 compared to 2018 primarily due to lower revenue earned by our MPSVs operating domestically during 2019. Foreign vessel revenues increased $41.0 million. The increase in foreign revenues is attributable to an average of 2.3 additional OSVs and an average of 1.2 additional MPSVs working in foreign locations during 2019. Foreign vessel revenues comprised 42.6% of our total vessel revenues for 2019 compared to 22.3% for 2018.
Non-vessel revenues increased $0.7 million, or 1.9%, to $37.3 million for 2019 compared to $36.6 million for 2018. The increase in non-vessel revenues is primarily attributable to higher revenues earned from vessel management services during 2019 compared to the year-ago period.
Operating expenses. Operating expenses were $164.6 million, an increase of $17.0 million, or 11.5%, for 2019 compared to $147.6 million for 2018. Operating expenses were primarily higher due to an increased number of active vessels in our fleet along with a full-year contribution by four vessels added to our active fleet in May 2018 compared to the year-ago period. This unfavorable variance was partially offset by $3.2 million related to the settlement of the VT Halter arbitration.
35
Depreciation and Amortization. Depreciation and amortization expense of $114.3 million was $5.6 million, or 5.2%, higher for 2019 compared to 2018. Amortization expense increased $6.2 million, which was driven higher mainly by recertifications for certain of our stacked OSVs that were reactivated, costs associated with the initial special surveys for vessels that were placed in service under the Company's fifth OSV newbuild program, costs associated with the drydocking of two vessels that were acquired in 2018 and the amortization of an intangible asset that was included with the acquisition of four OSVs during 2018. Depreciation expense is expected to increase from current levels when the two remaining vessels under our current newbuild program are placed in service. We expect amortization expense to increase temporarily whenever market conditions warrant reactivation of currently stacked vessels, which will then require us to drydock such vessels, and thereafter to revert back to historical levels.
General and Administrative Expenses. General and administrative expenses of $53.9 million were $10.4 million higher during 2019 compared to 2018. The increase in G&A expense was primarily attributable to higher short-term incentive compensation expense and higher bad debt reserves.
Operating Loss. Operating loss increased by $19.7 million to an operating loss of $107.1 million during 2019 compared to 2018 for the reasons discussed above. Operating loss as a percentage of revenues was 47.5% for 2019 compared to an operating loss margin of 41.1% for 2018.
Loss on Early Extinguishment of Debt, Net. During 2019, we exchanged $142.6 million in face value of 2020 senior notes for $121.2 million of second-lien term loans and we exchanged $21.0 million in face value of our 2019 convertible senior notes for $19.9 million of first-lien term loans. In accordance with applicable accounting guidance, these debt-for-debt exchanges were accounted for as debt modifications, requiring the Company to defer the gains on such exchanges and record a loss on early extinguishment of debt of $3.7 million related to deal costs for the exchanges. During 2019, we arranged for the repurchase of $52.9 million of our outstanding 2019 convertible senior notes for an aggregate total of $47.6 million of cash. We recorded a net gain on early extinguishment of debt of $3.6 million ($2.9 million or $0.08 per diluted share after-tax) related to these repurchases.
Interest Expense. Interest expense of $83.4 million increased $19.8 million during 2019 compared to 2018 primarily due to incremental interest expense associated with the issuance of additional first-lien and the second-lien term loans, as well as the senior credit facility since 2018. During 2019, we did not capitalize any construction period interest compared to capitalizing $2.3 million, or roughly 3.5%, of our total interest costs for 2018.
Interest Income. Interest income was $4.5 million for 2019, which was $2.3 million higher than 2018. Our average cash balance increased to $239.7 million for 2019 compared to $147.8 million for 2018. The average interest rate earned on our invested cash balances was approximately 1.9% and 1.5% during 2019 and 2018, respectively. The increase in average cash balance was primarily due to cash inflows associated with the $50 million expansion of the first-lien term loans, as well as the issuance of the senior credit facility, since December 31, 2018. These inflows were partially offset by the repurchase of our 2019 convertible senior notes for cash during 2019.
Other Income (Expense), Net. Other Income was $10.3 million for 2019, which was due primarily to damages awarded in the VT Halter arbitration matter. During the fourth quarter of 2019, the Company recognized $10.5 million of the total award as Other Income upon receipt of payment from VT Halter.
Income Tax Benefit. Our effective tax benefit rate was 21.0% and 19.9% for 2019 and 2018, respectively. Our income tax benefit for 2019 was higher than the benefit rate for 2018 due to a reduction of net operating loss carryforward valuation allowances due to state tax law changes enacted during the second quarter of 2019. Our income tax benefit primarily consists of deferred taxes. Our income tax rate differs from the federal statutory rate primarily due to expected state tax liabilities and items not deductible for federal income tax purposes.
Net Loss. Operating performance decreased year-over-year by $19.7 million for a reported net loss of $138.8 million for 2019 compared to a net loss of $119.1 million for 2018. This unfavorable variance in net loss was primarily driven by increased operating expenses for our vessels and interest expense, partially offset by increased revenue earned by such vessels and other income recognized from the VT Halter settlement during 2019.
Liquidity and Capital Resources
Despite volatility in commodity prices, we remain confident in the long-term viability of our business model upon improvement in market conditions. Since the fall of 2014, our liquidity has been indirectly impacted by low oil and natural gas prices, which together with oil and natural gas being produced in greater volumes onshore, has unfavorably impacted the extent of offshore exploration and development activities, resulting in lower than normal cash flow from operations. The COVID-19 pandemic is expected to continue to depress demand and the timing of a global economic
36
recovery is unclear. In addition, oil prices have been negatively impacted by the recent oil price war initiated by Russia and Saudi Arabia.
As of December 31, 2019 , we had total cash and cash equivalents of $121.5 million and restricted cash of $52.1 million. As of June 30, 2020, we had total cash and cash equivalents of $89.6 million and restricted cash of $0.2 million.
Our capital requirements have historically been financed with cash flows from operations, proceeds from issuances of our debt and common equity securities, borrowings under our revolving and term loan agreements and cash received from the sale of assets. We require capital to fund on-going operations, remaining obligations under our expanded fifth OSV newbuild program, vessel recertifications, discretionary capital expenditures and debt service and may require capital to fund potential future vessel construction, retrofit or conversion projects, acquisitions, stock repurchases or the retirement of debt.
In 2020, we experienced multiple events of defaults under the existing 2020 Senior Notes and 2021 Senior Notes, which included non-payment of principal and interest on the 2020 Senior Notes, nonpayment of interest on the 2021 Senior Notes and related cross-defaults. Cross-defaults were also triggered under our existing senior credit agreement, first lien term loan agreement and second lien term loan agreement. We, together with the administrative agents and certain of its lenders under its existing senior credit agreement, first lien term loan agreement and second lien term loan agreement, and certain holders of the Company’s 2020 Senior Notes and 2021 Senior Notes entered into separate forbearance agreements, which were subsequently extended to May 19, 2020 pursuant to which such lenders and noteholders agreed to forbear from exercising certain of their rights and remedies with respect to certain defaults by us.
Despite our extensive efforts to negotiate and launch an out-of-court debt-for-debt exchange transaction to address our outstanding 2020 Senior Notes and 2021 Senior Notes and such events of default, after the advent of the COVID-19 pandemic and the oil price war in March 2020, it became evident that an in-court process would be necessary to maximize value for us and our stakeholders while positioning us for long-term success. As a result of the commencement of the Chapter 11 Cases on May 19, 2020, we are operating as a debtor-in-possession pursuant to the authority granted under the Bankruptcy Code. On June 19, 2020, after a confirmation hearing, the Bankruptcy Court entered a confirmation order approving the Plan. As a debtor-in-possession, certain of our activities are subject to review and approval by the Bankruptcy Court. For additional information, see "Item 1 - Business - Recent Developments - Joint Prepackaged Chapter 11 Plan of Reorganization".
In connection with the filing of the Plan, on May 22, 2020, we entered into the DIP Credit Agreement, pursuant to which, certain lenders thereunder agreed to provide us with loans in an aggregate principal amount not to exceed $75 million that, among other things, was used to repay in full the $50 million in loans outstanding under our senior credit agreement, and to finance our ongoing general corporate needs during the course of the Chapter 11 Cases.
The maturity date of the DIP Credit Agreement is six months following the effective date of the DIP Credit Agreement. The DIP Credit Agreement contains customary events of default, including events related to the Chapter 11 Cases, the occurrence of which could result in the acceleration of our obligation to repay the outstanding indebtedness under the DIP Credit Agreement. Our obligations under the DIP Credit Agreement are secured by a first priority security interest in, and lien on, substantially all of our present and after acquired property (whether tangible, intangible, real, personal or mixed) and has been guaranteed by our material subsidiaries.
The Company has received subscriptions pursuant to the Rights Offering with respect to shares of the Company’s new common stock, including under the Backstop Commitment Agreement. It is contemplated that the Rights Offering of $100 million will be closed on the effective date of the Plan. The Plan also provides for the Company to enter into the Exit Financings upon emergence from the Chapter 11 Cases consisting of a first-lien senior secured term loan credit facility and a second-lien senior secured term loan credit facility, each in an aggregate principal amount to be determined.
Cash Flows
Operating Activities. We rely primarily on cash flows from operations to provide working capital for current and future operations. Net cash used in operating activities was $(88.0) million in 2019 and $(42.4) million in 2018. Operating cash flows in 2019 and 2018 continue to be unfavorably affected by weak market conditions for our vessels operating worldwide.
37
Investing Activities. Net cash used in investing activities was $7.6 million in 2019 and $52.5 million in 2018. Cash used in 2019 consisted primarily of capital improvements to our operating fleet, as well as construction costs paid for our fifth OSV newbuild program. Cash used in 2018 consisted primarily of the purchase of four high-spec Jones Act-qualified OSVs and related equipment from Aries Marine Corporation.
Financing Activities. Net cash provided by financing activities was $44.3 million in 2019 and $133.8 million in 2018. Net cash provided by financing activities in 2019 resulted from the senior credit facility and the incremental first-lien term loans, partially offset by the repurchase of the remainder of the 2019 convertible senior notes on their due date. Net cash provided by financing activities in 2018 resulted from net proceeds from the first-lien term loans.
Commitments and Contractual Obligations
The following table and notes set forth our aggregate contractual obligations as of December 31, 2019 (in thousands).
Contractual Obligations | Total | Less than 1 Year | 1-3 Years | 3-5 Years | Thereafter | |||||||||||||||
Vessel construction commitments(1) | $ | 57,521 | $ | 22,900 | $ | 34,621 | $ | — | $ | — | ||||||||||
5.000% senior notes due 2021(2)(3)(4) | 450,000 | — | 450,000 | — | — | |||||||||||||||
5.875% senior notes due 2020(4)(5) | 224,313 | 224,313 | — | — | — | |||||||||||||||
First-lien term loans(4)(6) | 350,000 | — | — | 350,000 | — | |||||||||||||||
Second-lien term loans(4)(7) | 121,235 | — | — | — | 121,235 | |||||||||||||||
Senior credit facility(4)(8) | 100,000 | — | 50,000 | — | 50,000 | |||||||||||||||
Interest payments(9) | 232,527 | 78,115 | 107,615 | 43,945 | 2,852 | |||||||||||||||
Total | $ | 1,535,596 | $ | 325,328 | $ | 642,236 | $ | 393,945 | $ | 174,087 | ||||||||||
(1) | Vessel construction commitments reflect our current projection of cash outlays for our fifth OSV newbuild program. The total project costs for the currently contracted 24-vessel program are expected to be $1,335 million, excluding capitalized construction period interest. From the inception of this program through December 31, 2019, we have incurred $1,277.5 million, or 95.7%, of total expected project costs. |
(2) | Our 2021 Senior Notes, with a fixed interest rate of 5.000% per year, mature on March 1, 2021 and currently include $1,203 of deferred financing costs. |
(3) | The Company did not make an interest payment on the 2021 Senior Notes in the amount of $11,250, which was due on March 2, 2020. |
(4) | See "Item 1 - Joint Prepackaged Chapter 11 Plan of Reorganization" for discussion of various defaults and cross-defaults under our credit documents and the proposed impact of the Chapter 11 Cases on the Company's commitments and contractual obligations. |
(5) | Our 2020 Senior Notes, with a fixed interest rate of 5.875% per year, mature on April 1, 2020 and currently include $262 of deferred financing costs. |
(6) | As of December 31, 2019, the first-lien term loans were fully drawn with a $350 million balance outstanding that matures on June 15, 2023 and currently includes $3,084 of non-cash original issue discount, $3,256 of deferred financing costs and $13,040 of deferred gain. |
(7) | Our second-lien term loans with a fixed interest rate of 9.500% per year, mature on February 7, 2025 and currently include $18,678 of deferred gain. |
(8) | On June 28, 2019, the Company entered into a new $100.0 million senior secured asset-based revolving credit facility, or the senior credit facility. The senior credit facility is comprised of two tranches that will rebalance each month based on a variable receivables-backed borrowing base. The unrestricted receivables-backed tranche will mature in 2022, and the restricted cash-backed tranche will mature in 2025. The senior credit facility currently includes $5,571 of deferred financing costs. |
(9) | Interest payments relate to our 2021 Senior Notes, our 2020 Senior Notes, and our second-lien term loans with semi-annual interest payments of $11,250 payable March 1 and September 1, $6,589 payable April 1 and October 1, and quarterly interest payments of $2,879 payable January 31st, April 30th, July 31st, and October 31st, respectively. Also, the interest rate on the first-lien term loans is variable based on our election and the interest payments reflected in this table are based on the outstanding amount as of December 31, 2019 using the applicable 30-day LIBOR interest rate that was elected and in effect on such date plus an applicable margin, which is currently 7.00%. The interest rate on the senior credit facility is variable based on the 30-day LIBOR interest rate plus a fixed margin of 5.00%, and the interest payments reflected in this table are based on the outstanding amount as of December 31, 2019. Non-cash interest expense has been excluded from the table above. The Company did not make an interest payment on the 2021 Senior Notes in the amount of $11,250, which was due on March 2, 2020. |
38
Debt
As of December 31, 2019, the Company had the following outstanding debt (in thousands, except effective interest rate):
Total Debt(4) | Effective Interest Rate | Cash Interest Payments | Payment Dates | |||||||||
5.875% senior notes due 2020, net of deferred financing costs of $262 (1) | $ | 224,051 | 6.08 | % | $ | 6,589 | April 1 and October 1 | |||||
5.000% senior notes due 2021, net of deferred financing costs of $1,203 (1) | 448,797 | 5.21 | % | 11,250 | March 1 and September 1 | |||||||
First-lien term loans due 2023, plus deferred gain of $13,040, net of original issue discount of $3,084 and deferred financing costs of $3,256 (2) | 356,700 | 9.16 | % | 2,652 | Variable Monthly | |||||||
Second-lien term loans due 2025, including deferred gain of $18,678 | 139,913 | 9.50 | % | 2,879 | January 31, April 30, July 31, and October 31 | |||||||
Senior credit facility, net of deferred financing costs of $5,571 (3) | 94,429 | 7.32 | % | 578 | Variable Monthly | |||||||
$ | 1,263,890 | |||||||||||
(1) | The senior notes do not require any payments of principal prior to their stated maturity dates, but pursuant to the indentures under which the 2020 and 2021 Senior Notes were issued, we would be required to make offers to purchase such senior notes upon the occurrence of specified events, such as certain asset sales or a change in control. |
(2) | The interest rate on the first-lien term loans is variable based on the Company's election. The amount reflected in this table is the monthly amount payable based on the 30-day LIBOR interest rate that was elected and in effect on December 31, 2019 plus an applicable margin, which is currently 7.00%. Please see Note 9 for further discussion of the variable interest rate applicable to the first-lien term loans. |
(3) | The interest rate on the senior credit facility is variable based on the 30-day LIBOR interest rate plus a 5.00% margin. The amount reflected in this table is the monthly amount payable based on the 30-day LIBOR interest rate that was in effect on December 31, 2019. Please see Note 9 for further discussion of the variable interest rate applicable to the senior credit facility. |
(4) | See "Item 1 - Joint Prepackaged Chapter 11 Plan of Reorganization" regarding the proposed impact of the Chapter 11 Cases on the Company’s long-term debt including current maturities. |
The credit agreements governing our senior credit facility, our first-lien term loans and second-lien term loans and the indentures governing our 2020 and 2021 Senior Notes impose certain operating and financial restrictions on us. Such restrictions affect, and in many cases limit or prohibit, among other things, our ability to incur additional indebtedness, make capital expenditures, redeem equity, create liens, sell assets and pay dividends or make other restricted payments. During 2019, we were in compliance with all applicable financial covenants.
Capital Expenditures and Related Commitments
During the first quarter of 2018, the Company notified the shipyard that was constructing the remaining two vessels in the Company's fifth OSV newbuild program that it was terminating the construction contracts for such vessels. See additional discussion in Note 7 of our consolidated financial statements included herein for further discussion and in Legal Proceedings. The cost of this nearly completed 24-vessel newbuild program, before construction period interest, is expected to be approximately $1,335.0 million, of which $22.9 million and $34.6 million are currently expected to be incurred in 2021 and 2022, respectively. As of the date of termination, these two remaining vessels, both of which are domestic 400 class MPSVs, were projected to be delivered in the second and third quarters of 2019, respectively. These projected delivery dates were subsequently amended, for guidance purposes, to be the second and third quarters of 2020; and then later extended to be the second and third quarters of 2021. Due to the continued uncertainty of the timing and location of future construction activities, the Company has now updated its forward guidance for the delivery dates related to these vessels to be the second and third quarters of 2022, respectively. The Company has not revised its estimate of the cost to complete the vessels to reflect the disputed claims asserted by the shipyard. In addition, the Company has not included any potential costs to complete the vessels in excess of the original contract price that may not be covered by surety bonds due to the sureties' denial of claims or for any other reasons. The timing of remaining construction draws remains subject to change commensurate with any potential further delays in the delivery dates of such vessels. From the inception of this program through December 31, 2019, the Company had incurred construction costs of approximately $1,277.5 million, or 95.7%, of total expected project costs. During 2019, the Company incurred $3.3 million related to the construction of these vessels.
39
The following table summarizes the costs incurred, prior to the allocation of construction period interest, for the purposes set forth below for the years ended December 31, 2019 and 2018, and a forecast for the year ending December 31, 2020 (in millions):
Year Ended December 31, | ||||||||
2019 | 2018 | |||||||
Actual | Actual | |||||||
Maintenance and Other Capital Expenditures: | ||||||||
Maintenance Capital Expenditures | ||||||||
Deferred drydocking charges | $ | 33.1 | $ | 10.9 | ||||
Other vessel capital improvements(1) | 1.1 | 6.4 | ||||||
34.2 | 17.3 | |||||||
Other Capital Expenditures | ||||||||
Commercial-related vessel improvements(2) | 2.8 | 5.5 | ||||||
Miscellaneous non-vessel additions(3) | 0.4 | 0.1 | ||||||
3.2 | 5.6 | |||||||
Total: | $ | 37.4 | $ | 22.9 | ||||
(1) | Other vessel capital improvements include costs for discretionary vessel enhancements, which are typically incurred during a planned drydocking event to meet customer specifications. |
(2) | Commercial-related vessel improvements include items, such as cranes, ROVs, helidecks, living quarters, and other specialized vessel equipment, which costs are typically included in and offset, in whole or in part, by higher dayrates charged to customers. |
(3) | Non-vessel capital expenditures are primarily related to information technology and shoreside support initiatives. |
Inflation
To date, general inflationary trends have not had a material effect on our operating revenues or expenses.
Item 7A—Quantitative and Qualitative Disclosures About Market Risk
Not required.
Item 8—Financial Statements and Supplementary Data
The financial statements and supplementary information required by this Item appear on pages F-1 through F-39 of this Annual Report on Form 10-K.
Item 9—Changes in and Disagreements with Accountants on Accounting and Financial Disclosures
None.
Item 9A—Controls and Procedures
Disclosure Controls and Procedures
Our management, with the participation of our Chief Executive Officer and Chief Financial Officer, has evaluated the effectiveness of our disclosure controls and procedures (as such term is defined in Rules 13a-15(e) and 15d-15(e) under the Securities Exchange Act of 1934, as amended (the “Exchange Act”)) as of the end of the period covered by this report. Based on that evaluation, our Chief Executive Officer and Chief Financial Officer have concluded that, as of the end of such period, our disclosure controls and procedures were effective to ensure that information required to be disclosed by us in reports that we file or submit under the Exchange Act is recorded, processed, summarized and reported within the time periods specified in the Securities and Exchange Commission’s rules and forms, and that such information is accumulated and communicated to our management, including our Chief Executive Officer and Chief Financial Officer, as appropriate, to allow timely decisions regarding required disclosures.
40
Management’s Report on Internal Control Over Financial Reporting
Management of the Company is responsible for establishing and maintaining adequate internal control over financial reporting, as such term is defined in Rule 13(a)-15(f) or Rule15d-15(f) under the Exchange Act. Internal control over financial reporting is a process to provide reasonable assurance regarding the reliability of our financial reporting for external purposes in accordance with U.S. generally accepted accounting principles. Internal control over financial reporting includes maintaining records that, in reasonable detail, accurately and fairly reflect our transactions; providing reasonable assurance that transactions are recorded as necessary for preparation of our financial statements in accordance with U.S. generally accepted accounting principles; providing reasonable assurance that receipts and expenditures of Company assets are made in accordance with authorizations of the Company’s management and board of directors; and providing reasonable assurance that unauthorized acquisition, use or disposition of Company assets that could have a material effect on our financial statements would be prevented or detected on a timely basis. Because of its inherent limitations, internal control over financial reporting is not intended to provide absolute assurance that a misstatement of our financial statements would be prevented or detected. In addition, projections of any evaluation of effectiveness to future periods are subject to the risk that controls may become inadequate because of changes in conditions, or that the degree of compliance with the policies or procedures may deteriorate.
Under the supervision and with the participation of our management, including our Chief Executive Officer and Chief Financial Officer, we conducted an evaluation of the effectiveness of our internal control over financial reporting as of December 31, 2019, utilizing the criteria set forth in the report entitled Internal Control—Integrated Framework issued in 2013 by the Committee of Sponsoring Organizations of the Treadway Commission (COSO). Based upon such assessment, our management concluded that our internal control over financial reporting was effective as of December 31, 2019.
There were no changes in our internal controls over financial reporting that occurred during the year ended December 31, 2019 that have materially affected, or are reasonably likely to materially affect, our internal control over financial reporting.
41
Item 9B—Other Information
Glossary of Terms
"2019 convertible senior notes" or "2019 notes" means 1.500% convertible senior notes due 2019;
"2020 senior notes", "2020 notes" or "2020 Senior Notes" means 5.875% senior notes due 2020;
"2021 senior notes", "2021 notes" or "2021 Senior Notes" means 5.000% senior notes due 2021;
“AHTS” means anchor-handling towing supply;
“ASC” means Financial Accounting Standards Board Accounting Standards Codification;
“average dayrate” means, when referring to OSVs or MPSVs, average revenue per day, which includes charter hire, crewing services and net brokerage revenues, based on the number of days during the period that the OSVs or MPSVs, as applicable, generated revenue. For purposes of vessel brokerage arrangements, this calculation excludes that portion of revenue that is equal to the cost of in-chartering third-party equipment paid by customers;
"BOEM" means the Bureau of Ocean Energy Management;
"BSEE" means the Bureau of Safety and Environmental Enforcement;
"cabotage laws" means laws pertaining to the privilege of operating vessels in the navigable waters of a nation;
“coastwise trade” means the transportation of merchandise or passengers by water, or by land and water, between points in the United States, either directly or via a foreign port;
“conventional” means, when referring to OSVs, vessels that are at least 30 years old, are generally less than 200’ in length or carry less than 1,500 deadweight tons of cargo when originally built and primarily operate, when active, on the continental shelf;
“deepwater” means offshore areas, generally 1,000’ to 5,000’ in depth;
“Deepwater Horizon incident” means the subsea blowout and resulting oil spill at the Macondo well site in the GoM in April 2010 and subsequent sinking of the Deepwater Horizon drilling rig;
“deep-well” means a well drilled to a true vertical depth of 15,000’ or greater, regardless of whether the well was drilled in the shallow water of the Outer Continental Shelf or in the deepwater or ultra-deepwater;
“DOI” means U.S. Department of the Interior and all its various sub-agencies, including effective October 1, 2011 the Bureau of Ocean Energy Management (“BOEM”), which handles offshore leasing, resource evaluation, review and administration of oil and gas exploration and development plans, renewable energy development, National Environmental Policy Act analysis and environmental studies, and the Bureau of Safety and Environmental Enforcement (“BSEE”) which is responsible for the safety and enforcement functions of offshore oil and gas operations, including the development and enforcement of safety and environmental regulations, permitting of offshore exploration, development and production activities, inspections, offshore regulatory programs, oil spill response and newly formed training and environmental compliance programs; BOEM and BSEE being successor entities to the Bureau of Ocean Energy Management, Regulation and Enforcement (“BOEMRE”), which effective June 2010 was the successor entity to the Minerals Management Service;
“domestic public company OSV peer group” includes SEACOR Holdings Inc. (NYSE:CKH) and Tidewater Inc. (NYSE:TDW);
“DP-1”, “DP-2” and “DP-3” mean various classifications of dynamic positioning systems on new generation vessels to automatically maintain a vessel’s position and heading through anchor-less station-keeping;
“DWT” means deadweight tons;
“effective dayrate” means the average dayrate multiplied by the average utilization rate;
42
“EIA” means the U.S. Energy Information Administration;
"EPA" means United States Environmental Protection Agency;
"first-lien term loans" means the first-priority senior secured term loans under that certain First Lien Term Loan Agreement dated June 15, 2017, as amended, by and among the Company, as Parent Borrower, Hornbeck Offshore Services, LLC as Co-Borrower, the lenders from time to time party thereto, and Wilmington Trust, National Association, as Administrative Agent and Collateral Agent for such lenders;
“flotel” means on-vessel accommodations services, such as lodging, meals and office space;
"GAAP" means United States generally accepted accounting principles;
“GoM” means the U.S. Gulf of Mexico;
“high-specification” or “high-spec” means, when referring to new generation OSVs, vessels with cargo-carrying capacity of greater than 2,500 DWT (i.e., 240 class OSV notations or higher), and dynamic-positioning systems with a DP-2 classification or higher; and, when referring to jack-up drilling rigs, rigs capable of working in 400-ft. of water depth or greater, with hook-load capacity of 2,000,000 lbs. or greater, with cantilever reach of 70-ft. or greater; and minimum quarters capacity of 150 berths or more and dynamic-positioning systems with a DP-2 classification or higher;
"IHS-CERA" means the division of IHS Inc. focused on providing knowledge and independent analysis on energy markets, geopolitics, industry trends and strategy;
"IHS-Petrodata" means the division of IHS Inc. focused on providing data, information, and market intelligence to the offshore energy industry;
“IRM” means inspection, repair and maintenance, also known as “IMR,” or inspection, maintenance and repair, depending on regional preference;
“Jones Act” means the U.S. cabotage law known as the Merchant Marine Act of 1920, as amended;
“Jones Act-qualified” means, when referring to a vessel, a U.S.-flagged vessel qualified to engage in domestic coastwise trade under the Jones Act;
“long-term contract” means a time charter of one year or longer in duration;
“low-specification” or “low-spec” means, when referring to new generation OSVs, vessels with cargo-carrying capacity of less than 2,500 DWT, and dynamic-positioning systems with a DP-1 classification or lower;
“Macondo” means the well site location in the deepwater GoM where the Deepwater Horizon incident occurred as well as such incident itself;
“MPSV” means a multi-purpose support vessel;
“MSRC” means the Marine Spill Response Corporation;
“new generation” means, when referring to OSVs, modern, deepwater-capable vessels subject to the regulations promulgated under the International Convention on Tonnage Measurement of Ships, 1969, which was adopted by the United States and made effective for all U.S.-flagged vessels in 1992 and foreign-flagged equivalent vessels;
“OPA 90” means the Oil Pollution Act of 1990;
“OSV” means an offshore supply vessel, also known as a “PSV,” or platform supply vessel, depending on regional preference;
“PEMEX” means Petroleos Mexicanos;
“Petrobras” means Petroleo Brasileiro S.A.;
43
“public company OSV peer group” means SEACOR Marine Holdings Inc. (NYSE:SMHI), Tidewater Inc. (NYSE:TDW), Solstad Offshore (NO:SOFF), DOF ASA (NO:DOF), Siem Offshore (NO:SIOFF), Havila Shipping ASA (NO:HAVI) and/or Eidesvik Offshore (NO:EIOF);
“ROV” means a remotely operated vehicle;
"second-lien term loans" means the second-priority senior secured term loans under that certain Second Lien Term Loan Agreement dated February 7, 2019 by and among the Company, as Parent Borrower, Hornbeck Offshore Services, LLC as Co-Borrower, the lenders from time to time party thereto, and Wilmington Trust, National Association, as Administrative Agent and Collateral Agent for such lenders;
"USCG" means United States Coast Guard;
“ultra-deepwater” means offshore areas, generally more than 5,000’ in depth; and
“ultra high-specification” or “ultra high-spec” means, when referring to new generation OSVs, vessels with cargo-carrying capacity of greater than 5,000 DWT (i.e., 300 class OSV notations or higher), and dynamic-positioning systems with a DP-2 classification or higher.
44
PART III
The following disclosures are based upon the Company’s documentation and practices as in effect prior to the Debtors in the Chapter 11 Cases seeking relief under the Bankruptcy Code as filed in the Bankruptcy Court on May 19, 2020 and are, therefore, subject to change upon emergence from the Chapter 11 Cases.
Item 10—Directors, Executive Officers and Corporate Governance
The following table provides information regarding our current executive officers and directors:
Name | Age | Position |
Todd M. Hornbeck | 52 | Chairman, President and Chief Executive Officer (CEO) |
Carl G. Annessa | 63 | Executive Vice President and Chief Operating Officer (COO) |
James O. Harp, Jr. | 59 | Executive Vice President and Chief Financial Officer (CFO) |
Samuel A. Giberga | 58 | Executive Vice President, General Counsel (GC) and Chief Compliance Officer (CCO) |
John S. Cook | 51 | Executive Vice President, Chief Commercial Officer (COO) and Chief Information Officer (CIO) |
Larry D. Hornbeck | 81 | Director |
Bruce W. Hunt | 62 | Director |
Steven W. Krablin | 70 | Director |
Patricia B. Melcher | 60 | Director |
Kevin O. Meyers | 66 | Director |
Bernie W. Stewart | 75 | Director |
Nicholas L. Swyka, Jr. | 76 | Director |
Todd M. Hornbeck, has served as our President and as a director since he founded the Company in June 1997. Until February 2002, he also served as Chief Operating Officer. In February 2002, Mr. Todd Hornbeck was appointed Chief Executive Officer and in May 2005, he was appointed Chairman of the Board of Directors. Mr. Todd Hornbeck was employed by the original Hornbeck Offshore Services, Inc., a NASDAQ-listed publicly traded offshore service vessel company with over 105 offshore supply vessels operating worldwide, from 1991 to 1996, serving in various positions relating to business strategy and development. Following its merger with Tidewater Inc. (NYSE:TDW) in March 1996, he accepted a position as Marketing Director-Gulf of Mexico with Tidewater, where his responsibilities included managing relationships and overall business development in the U.S. Gulf of Mexico region. He remained with Tidewater until our formation. Mr. Todd Hornbeck currently serves or has served on the board of directors of the International Support Vessel Owners Association, or ISOA, the Offshore Marine Service Association, or OMSA, and the National Ocean Industries Association, or NOIA. As our founder, Mr. Todd Hornbeck brings his vision and goals for the Company to the Board. Under his leadership, we have expanded from a small private company to a large, global provider of technologically advanced offshore service vessels. Todd Hornbeck is the son of Larry D. Hornbeck, one of our directors.
Carl G. Annessa has served as our Chief Operating Officer since February 2002. Mr. Annessa was appointed Executive Vice President in February 2005. Prior to that time, Mr. Annessa served as our Vice President of Operations beginning in September 1997. Mr. Annessa is responsible for executive oversight of our fleet operations and for oversight of design and implementation of our vessel construction programs. Prior to joining us, he was employed for 17 years by Tidewater Inc. (NYSE:TDW) in various technical and operational management positions, including management of large fleets of offshore supply vessels in the Arabian Gulf, Caribbean and West African markets, and was responsible for the design of several of Tidewater’s vessels. Mr. Annessa was employed for two years by Avondale Shipyards, Inc. as a naval architect before joining Tidewater. Mr. Annessa received a degree in naval architecture and marine engineering from the University of Michigan in 1979.
James O. Harp, Jr. has served as our Chief Financial Officer since January 2001. Mr. Harp was appointed Executive Vice President in February 2005. Prior to that time, Mr. Harp served as our Vice President beginning in January 2001. Before joining us, Mr. Harp served as Vice President in the Energy Group of RBC Dominion Securities Corporation, an
45
investment banking firm, from August 1999 to January 2001, and as Vice President in the Energy Group of Jefferies & Company, Inc., an investment banking firm, from June 1997 to August 1999. During his investment banking career, Mr. Harp worked extensively with marine-related oil service companies, including as our investment banker in connection with our private placement of common stock in November 2000. From July 1982 to June 1997, he held roles of increasing responsibility in the tax section of Arthur Andersen LLP, ultimately serving as a Tax Principal, and had a significant concentration of international clients in the oil service and maritime industries. Since April 1992, he has also served as Treasurer and Director of SEISCO, Inc., a privately held seismic brokerage company that he co-founded. Mr. Harp is an inactive certified public accountant in Louisiana.
Samuel A. Giberga has served as our General Counsel since January 2004. Mr. Giberga was appointed Executive Vice President and Chief Compliance Officer in June 2011. Prior to that time, Mr. Giberga served as our Senior Vice President beginning in February 2005. Prior to joining us, Mr. Giberga was engaged in the private practice of law for 14 years. Mr. Giberga was a partner in the New Orleans-based law firm of Correro, Fishman, Haygood, Phelps, Walmsley & Casteix from February 2000 to December 2003 and served as a partner at Rice, Fowler, Kingsmill, Vance & Flint, LLP from March 1996 to February 2000. During his legal career, Mr. Giberga has worked extensively with marine and energy service companies in a variety of contexts with a significant concentration in general business, international and intellectual property matters. He was also a co-founder of Maritime Claims Americas, L.L.C., which operates a network of correspondent offices for marine protection and indemnity associations throughout Latin America. From June 2005 through February 2007, Mr. Giberga served as a director of the American Steamship Owners Mutual Protection and Indemnity Association Inc. (the American Club), a mutual protection and indemnity association in which the Company’s principal operating subsidiaries were then entered as members. Mr. Giberga occasionally serves as an adjunct professor in intellectual property law matters at Loyola University Law School in New Orleans.
John S. Cook has served as our Chief Information Officer since May 2002. Mr. Cook was appointed Executive Vice President and Chief Commercial Officer in February 2013. Prior to that time, Mr. Cook served as our Senior Vice President beginning in May 2008. Mr. Cook was initially designated an executive officer and appointed a Vice President in February 2006. Before joining us, Mr. Cook held roles of increasing responsibility in the business consulting section of Arthur Andersen LLP from January 1992 to May 2002, ultimately serving as a Senior Manager. During his consulting career, Mr. Cook assisted numerous marine and energy service companies in various business process and information technology initiatives, including strategic planning and enterprise software implementations. Mr. Cook is an inactive certified public accountant in Louisiana and is a member of the American Institute of Certified Public Accountants and the Society of Louisiana Certified Public Accountants.
Larry D. Hornbeck has served as a director since August 2001. An executive with over 38 years of experience in the offshore supply vessel business worldwide, Mr. Larry Hornbeck was the sole founder of the original Hornbeck Offshore Services, Inc., a NASDAQ-listed publicly traded offshore service vessel company with over 105 state-of-the-art offshore supply vessels operating worldwide. From its inception in 1981 until its merger with Tidewater Inc. (NYSE:TDW) in March 1996, Mr. Larry Hornbeck served as its Chairman of the Board, President and Chief Executive Officer. Following the merger, Mr. Larry Hornbeck served as a director and a member of the audit committee of Tidewater Inc. from March 1996 until October 2000. From 1969 to 1980, Mr. Larry Hornbeck served as an officer in various capacities, culminating as Chairman, President and Chief Executive Officer of Sealcraft Operators, Inc., a NASDAQ-listed publicly traded offshore service vessel company operating 29 geophysical and specialty service vessels worldwide. He served on the board of directors and as chairman of the compensation committee of Coastal Towing, an inland marine tug and barge company, from 1992 through 2003. Mr. Larry Hornbeck assisted in orchestrating the founding of the current Company and is the father of Mr. Todd M. Hornbeck, our Chairman, President and Chief Executive Officer.
In addition to the leadership roles in which Mr. Larry Hornbeck has served or currently serves, he has extensive involvement in international and domestic marine industry associations. Mr. Larry Hornbeck helped form and served on the boards of several marine industry associations, including OMSA and NOIA. He also served on the board of directors of the American Bureau of Shipping, or ABS, and ISOA. The relationships Mr. Larry Hornbeck formed in these organizations and in his leadership roles in public companies continue to benefit the Company to this day.
Mr. Larry Hornbeck brings to the Board a deep understanding of the operations of a public company in the offshore service vessel industry. With his many years of experience as both Chief Executive Officer and Chairman of the Board of the original Hornbeck Offshore Services, Inc. and of Sealcraft Operators, Inc., Mr. Larry Hornbeck brings not only management expertise, but unique technical knowledge of offshore service vessels and their application, construction and
46
operation. This, combined with his years of experience as one of our directors and his continued active involvement in the Company, make him an invaluable contributor to our Board.
Bruce W. Hunt has served as one of our directors since August 1997 and was appointed lead independent director in May 2005. He has been President of Petrol Marine Corporation since 1988 and President and Director of Petro-Hunt, L.L.C. since 1997, each of which is an energy-related company. Mr. Hunt served as a director of the original Hornbeck Offshore Services, Inc., a NASDAQ-listed publicly traded offshore service vessel company, from November 1992 to March 1996, when it merged with Tidewater Inc. (NYSE:TDW). From April 2012 to November 2019, Mr. Hunt served as director of Legacy Texas Financial Group, Inc. (NASDAQ: LTXB), formerly, ViewPoint Financial Group, Inc. (NASDAQ: VPFG). On November 1, 2019, Mr. Hunt was named director of Prosperity Bank Shares, Inc. (NYSE: PB).
Mr. Hunt is an experienced business leader with the skills and attributes necessary to be our lead independent director. As a director of ours for more than 22 years and as a director of the original Hornbeck Offshore Services, Inc., he has gained a deep understanding of our direction and goals and the Board’s ability to oversee our success. His experience in the energy industry, including with offshore service vessels, further augments his range of knowledge and insight relevant to our operations. Mr. Hunt is affiliated with the William Herbert Hunt Trust Estate, which has been one of our largest stockholders since August 1997. As such, Mr. Hunt is uniquely familiar with the Company since its inception and provides the perspective of a long-term significant stockholder. Mr. Hunt serves as the chairman of our nominating/corporate governance committee.
Steven W. Krablin was appointed to our Board of Directors as a Class II Director in August 2005. Since January 2011, Mr. Krablin has been retired and a private investor. Mr. Krablin was the President, Chief Executive Officer and Chairman of the Board of T-3 Energy Services Inc. (NASDAQ:TTES), a publicly held company that designed, manufactured, repaired and serviced products used in the drilling and completion of new oil and gas wells, the workover of existing wells, and the production and transportation of oil and gas, from March 2009 until T-3 was acquired in January 2011. From April 2005 until joining T-3 Energy Services in March 2009, Mr. Krablin was a private investor. From January 1996 until April 2005, Mr. Krablin served as the Senior Vice President and Chief Financial Officer of National Oilwell, Inc. (NYSE:NOI), a major manufacturer and distributor of oil and gas drilling equipment and related services for land and offshore drilling rigs. Mr. Krablin currently serves on the board of directors of Chart Industries, Inc. (NASDAQ:GTLS) and Precision Drilling Corporation (NYSE: PDS). Mr. Krablin is a retired certified public accountant.
As an experienced financial and operational leader with a variety of public companies in the energy industry, Mr. Krablin brings a broad understanding of business globally, which is particularly important for our company, as we continue to expand our operations in foreign countries. Mr. Krablin brings management experience, leadership capabilities, financial knowledge and business acumen to our Board. Drawing from that experience, he brings a unique perspective to the Board and the committees on which he serves.
Patricia B. Melcher has served as one of our directors since October 2002. She currently serves as Managing Partner of EIV Capital, LLC which manages EIV Capital Fund II, LP, EIV Capital Fund III, LP, EIV Capital Fund III-A, LP, EIV Capital Fund IV, LP, EIV Capital IV To-Up Fund LP (together, EIV Funds II, III and IV), private equity funds focused on making investments in the energy industry. She assumed her duties with EIV Capital, LLC upon the formation of EIV Capital Fund II, LP in July 2013. In April, 2009 she joined the management of, and from August 2009 through December 2019 served as Chief Executive Officer of EIV Capital Management Co., LLC which managed EIV Capital Fund, LP, a private equity fund focused on making energy investments. Pursuant to her duties with respect to EIV Capital Fund, LP and EIV Capital Funds II, III and IV, Ms. Melcher, from time to time, serves as a director of certain of its portfolio investment companies. From November 2004 through August 2009, she co-founded and managed Go Appetit Foods, LLC, a privately-owned company that developed and distributed innovative all-natural foods and beverages. From 1997 to 2006, Ms. Melcher served as the President of Allegro Capital Management, Inc., a privately-owned investment company focused on private equity investments in, and consulting to, energy-related companies. From 1989 to 1994, she worked for SCF Partners, L.P., an investment fund sponsor specializing in private equity investments in oilfield service companies. From 1986 to 1989, Ms. Melcher worked for Simmons & Company International, or Simmons, one of the largest investment banks providing services exclusively to the energy industry.
With over 33 years of experience as a private equity investor, consultant and investment banker, Ms. Melcher brings to the Board significant experience in evaluating the financial and operating performance of companies and assessing risks in the energy industry. In addition, Ms. Melcher’s past and current experience serving on the boards of for-profit as well as not-for-profit companies gives her a broad understanding of the financial needs and strategic priorities of
47
companies in diverse industries, including oilfield services. Ms. Melcher’s management and energy finance experience make her particularly well-suited to be a member of our Board and a member and chairperson of our audit committee.
Kevin O. Meyers, Ph.D. was appointed to our Board of Directors as a Class I Director in June 2011. Dr. Meyers is a consultant with over 35 years of experience in the oil and gas industry. He served as the Senior Vice President, Exploration and Production—Americas of ConocoPhillips (NYSE:COP), a publicly traded oil and gas company, from May 2009 until his retirement in December 2010. Before assuming that role, Dr. Meyers had been President of ConocoPhillips Canada from December 2006 until May 2009. From October 2004 to November 2006, he served as President of ConocoPhillips’ Russian and Caspian Region, based in Moscow, where he was responsible for exploration and production activities in the former Soviet Union and was the lead executive in Russia for the COP LUKOIL strategic alliance. Prior to moving to Russia, Dr. Meyers was President of ConocoPhillips Alaska, a position he had held since Conoco Inc. and Phillips Petroleum Company merged in 2002. Prior to the merger, Dr. Meyers had held a similar position with Phillips Petroleum Company. He held that position following the acquisition by Phillips Petroleum Company of certain Alaskan assets of the Atlantic Richfield Company, or ARCO. Dr. Meyers was President of ARCO Alaska from 1998 to 2000 and served in various other positions with ARCO from 1980 through 1998. Dr. Meyers also currently serves on the board of directors of Precision Drilling Corporation (NYSE: PDS), Denbury Resources Inc. (NYSE: DNR) and Hess Corporation (NYSE: HES). Dr. Meyers holds a doctorate in chemical engineering from the Massachusetts Institute of Technology and bachelor’s degrees in chemistry and mathematics from Capital University in Ohio.
Dr. Meyers brings to the Board significant major oil company executive experience and critical insights into the issues facing the global oil and gas industry from the perspective of our customers. This experience and perspective allows Dr. Meyers to make significant contributions as a critical member of the Board and the committees on which he serves.
Bernie W. Stewart has served as one of our directors since November 2001 and served as the Chairman of our Board from February 2002 to May 2005. Mr. Stewart was Senior Vice President, Operations of R&B Falcon Corporation (NYSE:FLC), a contract drilling company, and President of R&B Falcon Drilling U.S., its domestic operating subsidiary, from May 1999 until R&B Falcon Corporation merged with Transocean Sedco Forex Inc. (NYSE:RIG) in January 2001. Between April 1996 and May 1999, he served as Chief Operating Officer of R&B Falcon Holdings, Inc. and as its President from January 1998 until May 1999. From 1993 until 1996, he was Senior Vice President and Chief Operating Officer of the original Hornbeck Offshore Services, Inc., a NASDAQ-listed publicly traded offshore service vessel company, where he was responsible for overall supervision of the company’s operations. From 1986 until 1993, he was President of Western Oceanics, Inc., an offshore drilling contractor. Since leaving R&B Falcon Corporation upon its merger with Transocean Sedco Forex, Mr. Stewart has been an independent business consultant.
Mr. Stewart’s more than 25 years of executive experience in the offshore energy industry brings to the Board critical insights into the operational requirements of a public offshore service vessel company. In addition, his experience as our former Chairman, one of our directors, and as an officer of the original Hornbeck Offshore Services, Inc., gives him a deep understanding of our operations and of the important role of the Board. Mr. Stewart serves as the chairman of our compensation committee.
Nicholas L. Swyka, Jr. was appointed to our Board of Directors as a Class III Director in February 2012. Mr. Swyka has over 30 years of energy related investment banking experience. From September 1999 until his retirement in June 2011, he served as Vice Chairman of Simmons. During this time, Mr. Swyka also served on Simmons’ Executive Management, Compensation and Underwriting Committees. From January 1987 until September 1999, he served as Managing Director and Co-Head of Investment Banking for Simmons. During that time, he functioned as senior team leader advising the Boards of Directors of both public and private energy companies on a significant number of energy industry transactions, including mergers, acquisitions and divestitures, as well as capital market transactions. Mr. Swyka served as an Advisory Director to Simmons until its acquisition by Piper Jaffray & Co. in February 2016. Mr. Swyka served on the Board of Directors and was chairman of the audit committee of Fairway Energy, LP until its acquisition by Converge Midstream, LLC in 2019. Mr. Swyka served as an Advisory Director to the University of Texas Marine Science Institute and NOIA. He is also past President and Chairman and currently serves on the Executive Committee of the Houston Ballet Foundation. Prior to joining Simmons, Mr. Swyka spent seven years with a major accounting firm, leaving as a senior manager, where he supervised the audits of private and public companies.
Mr. Swyka brings to our Board significant industry and capital markets experience, critical insights into the issues facing the global oil and gas industry, a proven track record of providing financial advisory services to the growing energy
48
service sector and a personal knowledge, from having served as our financial advisor, of the history and the accomplishments of the original Hornbeck Offshore Services, Inc. and of our Company since its inception.
Involvement in Legal Proceedings
During the last ten years, none of our officers, directors, promoters, or control persons have been involved in any legal proceedings as described in Item 401(f) of Regulation S-K.
Code of Ethics
The Company has adopted a code of ethics that applies to its principal executive officer, principal financial officer, principal accounting officer or controller, or persons performing similar functions. A copy of this code is available to any person upon request at no charge. Requests should be directed to the Secretary of the Company at its principal executive office at the address and phone number as shown on the cover of this report.
Director Independence
The Board has determined that Ms. Patricia B. Melcher and Messrs. Bruce W. Hunt, Kevin O. Meyers, Steven W. Krablin, Bernie W. Stewart and Nicholas L. Swyka, Jr. were “independent” for purposes of Section 303A of the NYSE Listed Company Manual at all times during which the Company was listed on the NYSE. The Board based its determinations of independence primarily on a review of the responses our directors provided to questions regarding employment and compensation history, affiliations and family and other relationships. No material relationships between the Company and any independent directors were discerned.
Board Structure, Risk Oversight, Committee Composition and Meetings
Our Board of Directors is comprised of eight members, including the Chairman, divided into three classes, Class I, Class II and Class III, with members of each class holding office for staggered three-year terms. Other than Mr. Todd Hornbeck, who serves as our President, Chief Executive Officer and Chairman, there are no other members of the Company’s management that serve on the Board. Six of the eight Board members are independent as contemplated under Commission and, at all times during which the Company was listed on the NYSE, NYSE requirements. We have three committees of the Board—audit, compensation and nominating/corporate governance—that are comprised solely of independent directors, including their chairs. The Board may also establish other committees from time to time as necessary to facilitate the management of the business and affairs of the Company and, at all times during which the Company was listed on the NYSE, to comply with the corporate governance rules of the NYSE. The Company has a lead independent director who chairs and oversees the executive sessions of the non-management directors (generally meeting at least quarterly) and independent directors (meeting at least annually). Of the seven non-management members of the Board, four have served as executive officers of public companies (two of whom have served in the combined positions of chairman and chief executive officer). All of our non-management directors, including the six independent directors, have significant experience with Board processes, and specifically their role and responsibilities in oversight on behalf of the Company’s stockholders. For additional information regarding our directors’ backgrounds, see “Directors, Executive Officers and Corporate Governance,” above. The existence and leadership of our lead independent director, the committee chairs and the committee members, all being independent directors, and the six to two independent majority of the Board provides for substantial independent oversight of the Company.
In May 2005, the Board unanimously elected Mr. Todd Hornbeck as Chairman of the Board of Directors. Mr. Todd Hornbeck was the principal catalyst and visionary behind the creation of the Company as primarily a new generation offshore service vessel business and has been instrumental in the growth and development of the Company. He has served the Company as President since its founding in June 1997 and as Chief Executive Officer since February 2002. As President and Chief Executive Officer, Mr. Todd Hornbeck is responsible for the operation of the Company and the execution of the Company’s strategy. Over the years, he has demonstrated excellent executive management skills and has led the Company from a “greenfield” start-up to its present status as a publicly held Company with 66 new generation OSVs and eight MPSVs with a net book value of $2.3 billion as of December 31, 2019. Under its fifth OSV newbuild program, the Company contracted for the delivery of 19 new generation OSVs and five MPSVs. As of the filing date, the Company has placed 22 of such vessels in service under this program. The remaining two are expected to be delivered in 2022. Given the growth of the Company, and the importance of the performance of the Company and the execution of corporate strategy in the Board’s considerations and duties, the Board believes that Mr. Todd Hornbeck is the person best qualified to serve as the Chairman of the Board. Additionally, it is the view of our Board that having Mr. Todd Hornbeck
49
serve in the combined positions of President, Chief Executive Officer and Chairman of the Board is in the best interests of the Company and its stockholders. It signals to our employees, suppliers, customers and the investment community that a single person is responsible for providing direction in the management of the Company’s operations and growth initiatives. Such a single leader helps avoid the potential for duplication of efforts, for confusing or conflicting senses of direction or for personality conflicts. Moreover, the structure of our Board and committees, the level of independence represented on each, the experience of our directors and our lead independent director balance and complement the combined offices of Chairman, President and Chief Executive Officer. The Board maintains the authority to modify this structure if and when the Board believes such modification would be in the best interests of the Company and its stockholders.
In addition to his leadership skills, the Company has benefited and continues to benefit from Mr. Todd Hornbeck’s experience with the original Hornbeck Offshore Services, Inc., a NASDAQ-listed company founded by his father, Mr. Larry Hornbeck, in 1981. The current Company carries the Hornbeck family name, uses the same horsehead logo and trademarks as the prior company and is able to benefit from long-standing working relationships with customers, vendors and Wall Street analysts, many of whom also had relationships with Messrs. Todd and Larry Hornbeck at the prior public company. Unlike other companies that are led by non-founding managers, the Company benefits to a substantial extent from the history, entrepreneurial spirit, industry expertise and leadership of its founder.
The Company’s leadership structure contributes to the manner in which the Board oversees risk by providing a high level of experience and independence to the process of risk oversight. The Board’s oversight of risk is centered principally on risks associated with the Company’s strategic plans, growth initiatives and financial results as well as risks attendant to the legal and regulatory environment in which the Company operates both domestically and abroad. The Board performs this oversight role by receiving and discussing reports each quarter from executive management, including major risks confronting the Company. A specific report concerning legal compliance is given each quarter in which the Board is advised of the approach to managing any known material legal risks being faced by the Company. While operational risk management is overseen by executive management, the Board also receives periodic reports, including discussions of the management of operating risks and the strategies employed by the Company in order to mitigate those risks, such as the placement of insurance and contracting strategies. The audit committee enhances the Board’s oversight of risk management by regularly assessing the overall corporate “tone” for quality financial reporting and ethical behavior. Each quarter, the audit committee discusses with executive management, the internal auditors and the independent auditor the adequacy and effectiveness of the Company’s accounting and financial controls and, where appropriate, the Company’s policies and procedures that impact business risks and certain of the Company’s compliance programs. After reviewing the compensation policies and practices of the Company, the Board concluded that such policies and practices do not create risks that are reasonably likely to have a material adverse effect on the Company.
During 2019, the Board held six meetings and took action by unanimous written consent eight times. All of the directors attended at least 89% of the aggregate number of meetings of the Board and each committee of the Board on which they served. All directors are expected to attend Annual Meetings, and all of our directors except Bruce Hunt and Bernie Stewart attended our last Annual Meeting of Stockholders.
The Company has established Corporate Governance Guidelines, which may be found on the Corporate Governance page of the Company’s website, www.hornbeckoffshore.com. The Corporate Governance Guidelines include the definition of independence used by the Company to determine whether its directors and nominees for directors are independent, which are the same qualifications prescribed under the NYSE Listing Standards. Pursuant to the Company’s Corporate Governance Guidelines, our non-management directors are required to meet in separate sessions without management on a regularly scheduled basis, but no less than four times a year. Generally, these meetings occur as an executive session without the management director in attendance in conjunction with regularly scheduled meetings of the Board throughout the year. If the non-management directors include directors that are not independent directors (as determined by our Board), the independent directors are required to meet in at least one separate session annually that includes only the independent directors. Because the Chairman of the Board is also a member of management, the non-management directors’ and independent directors’ separate sessions are presided over by the Lead Independent Director or, in his absence, by an independent director designated by the Lead Independent Director or elected by a majority of the independent directors.
50
Committees of the Board of Directors
The following disclosures are based on the Debtors’ Chapter 11 Cases and are, therefore, subject to change upon emergence from the Chapter 11 Cases.
Audit Committee
The Board of Directors has established an audit committee currently comprised of Ms. Melcher and Messrs. Hunt, Krablin, Stewart and Swyka with Ms. Melcher as Chair. The audit committee operates under a written charter adopted by the Board of Directors. The Board has determined that each director currently serving on the audit committee is independent for purposes of Section 10A(m)(3) of the Exchange Act, and, at all times during which the Company was listed on the NYSE, was independent for purposes of Section 303A.07 of the NYSE Listed Company Manual and satisfied the financial literacy requirements of the NYSE. The Board has also determined that each of Ms. Melcher and Messrs. Krablin and Swyka qualifies as an “audit committee financial expert” as defined in Item 407(d)(5)(ii) of Regulation S-K of the Exchange Act. Ms. Melcher and Messrs. Krablin and Swyka are financially literate and have accounting or related financial management expertise, as described in their biographical information, above. The audit committee met five times during 2019 and took action by unanimous written consent once in 2019.
In addition to certain duties prescribed by applicable law, the audit committee is charged, under its written charter, to select and engage the independent public accountants to audit our annual financial statements, subject to stockholder ratification. The audit committee also establishes the scope of, and oversees the annual audit and approves any other services provided by public accounting firms. Furthermore, the audit committee provides assistance to the Board in fulfilling its oversight responsibility to the stockholders, potential stockholders, the investment community and others relating to the integrity of our financial statements, our compliance with legal and regulatory requirements, the independent auditor’s qualifications and independence, the performance of our internal audit function and independent auditor, and overseeing our system of disclosure controls and procedures and system of internal controls regarding finance, accounting, legal compliance and ethics that management and the Board have established. In doing so, it is the responsibility of the audit committee to maintain free and open communication among the audit committee, our independent auditors, the internal audit function and management of the Company. See “Audit Committee Report” below for further information on the functions of the audit committee.
Compensation Committee
The Board of Directors has established a compensation committee currently comprised of Messrs. Meyers, Stewart and Swyka, with Mr. Stewart as Chair. The compensation committee operates under a written charter adopted by the Board of Directors. In addition to certain duties prescribed by applicable law, the compensation committee is charged, under its written charter, to address all forms of compensation of the Company’s executive officers and directors. The compensation committee approves and monitors annual executive and director compensation for each year and as part of the Company’s annual budget process. The compensation committee has sole authority to retain compensation consultants and may not form or delegate authority to subcommittees without Board approval. See “Item 11 - Executive Compansation” below for additional information on the Company’s procedures for consideration and determination of executive and director compensation.
Our Board has determined that each member of the compensation committee met the independence requirements of the NYSE at all times during which the Company was listed on the NYSE. The compensation committee met six times during 2019 and took action by unanimous written consent three times in 2019.
Nominating/Corporate Governance Committee
Our Board of Directors has also established a nominating/corporate governance committee, currently comprised of Messrs. Hunt, Krablin and Stewart, with Mr. Hunt as Chair. In addition to certain duties prescribed by NYSE listing requirements that were applicable at the time during which the Company was listed on the NYSE, the committee is charged, under its written charter, to develop, review and recommend to the Board a set of corporate governance principles for the Company, and to identify, review and recommend to the Board possible candidates for Board membership.
51
Our Board has determined that each member of the nominating/corporate governance committee met the independence requirements of the NYSE at all times during which the Company was listed on the NYSE. The nominating/corporate governance committee met twice during 2019 and did not act by unanimous written consent in 2019.
Availability of Certain Committee Charters and Other Information
The charters for our audit, compensation and nominating/corporate governance committees, as well as our Corporate Governance Guidelines, Procedures for Communication with Directors, Executive Officer Code of Conduct and Code of Business Conduct and Ethics for Members of the Board of Directors, can all be found, free of charge, on the Corporate Governance page of the Company’s website, www.hornbeckoffshore.com . The code of conduct, titled "Navigating with Integrity," is applicable to all employees, including Executive Officers and, accordingly, to our Chief Executive Officer and to our Chief Financial Officer, who is our principal financial and accounting officer. We intend to disclose any changes to or waivers from the provisions of "Navigating with Integrity" or our Executive Officer Code of Conduct that would otherwise be required to be disclosed under Item 5.05 of a Form 8-K on our website. We will also provide printed copies of these materials to any stockholder or other interested person upon request to Hornbeck Offshore Services, Inc., Attn: Samuel A. Giberga, General Counsel and Chief Compliance Officer, 103 Northpark Boulevard, Suite 300, Covington, Louisiana 70433. The information on our website is not, and shall not be deemed to be, a part of this report or incorporated into this or any other filings we make with the Securities and Exchange Commission, or the Commission.
We also make available on our website, free of charge, access to our Annual Reports on Form 10-K, Quarterly Reports on Form 10-Q, Current Reports on Form 8-K, Proxy Statements, and any amendments to those reports and statements, as well as other documents that we file with or furnish to the Commission pursuant to Sections 13(a) or 15(d) of the Exchange Act, as soon as reasonably practicable after such documents are filed with, or furnished to, the Commission.
Nominations for Directors
The nominating/corporate governance committee will consider candidates for director nominees that are recommended by stockholders of the Company in the same manner as Board recommended nominees, in accordance with the procedures set forth in the Bylaws. Any such nominations should be submitted to the Board of Directors, care of the Corporate Secretary, Hornbeck Offshore Services, Inc., 103 Northpark Boulevard, Suite 300, Covington, Louisiana 70433 and be accompanied by the following information:
• | appropriate biographical information, a statement as to the qualifications of the nominee and any other information relating to such nominee that is required to be disclosed pursuant to Regulation 14A under the Exchange Act (including such person’s written consent to being named in the proxy statement as a nominee and to serving as a director if elected); and |
• | the name(s) and address(es) of the stockholder(s) making the nomination and the number of shares of the Company’s common stock that are owned beneficially and of record by such stockholder(s). |
The written recommendation should be submitted within the time frame detailed in our Bylaws. There have been no material changes to the procedures by which security holders may recommend nominees to the Board, however, upon emergence from the Chapter 11 Cases there will be changes to both the Board compensation and nomination procedures.
52
Communications with the Board of Directors
The Board of Directors, of which a majority are independent, has unanimously approved a process for stockholders, or other interested persons, to communicate with the Board of Directors. This process is located on the Corporate Governance page of the Company’s website, www.hornbeckoffshore.com. The relevant document is titled “Procedures for Communication with Directors.”
In addition, stockholders, or other interested persons, wishing to communicate with our Board of Directors for anonymous complaints about accounting, internal controls and auditing issues may call the Company’s toll-free Ethics Helpline at 1-800-506-6374 as more particularly described on the Compliance link found on the Company’s website, www.hornbeckoffshore.com. Online reports may also be made anonymously by accessing our ethics reporting procedure available at www.hoscompliance.com. Our audit committee monitors these calls and online reports, if any. All calls are documented, and those reports that are deemed to be substantive will be passed on to the Board. Stockholders, or other interested persons, calling the hotline should provide a sufficiently detailed description of the nature of the matter that the person wishes to communicate with the Board, as well as a name, telephone number, email address, or other contact information so that the Company can either respond to the communication or obtain additional information about the matter.
Item 11—Executive Compensation
Summary Compensation Table.
The following table summarizes the compensation of our principal executive officer, as well as our two other most highly compensated executive officers, for the fiscal years ended December 31, 2019 and 2018. We refer to these individuals in this Form 10-K as the “named executive officers.”
2019 SUMMARY COMPENSATION TABLE | |||||||||||||||||||||||||||||||||
Name and Principal Position | Year | Salary ($) (1) | Bonus ($) (2) | Stock Awards ($) (3) | Option Awards ($) | Non-Equity Incentive Plan Compensation ($) (4) | Change in Pension Value and Nonqualified Deferred Compensation Earnings ($) | All Other Compensation ($) (5) | Total | ||||||||||||||||||||||||
(a) | (b) | (c) | (d) | (e) | (f) | (g) | (h) | (i) | (j) | ||||||||||||||||||||||||
Todd M. Hornbeck | 2019 | $ | 637,500 | $ | 637,500 | $ | 1,897,343 | $ | — | $ | 803,250 | $ | — | $ | 26,002 | $ | 4,001,595 | ||||||||||||||||
Chairman, President & CEO | 2018 | 637,500 | — | 3,442,499 | — | 478,125 | — | 36,326 | 4,594,450 | ||||||||||||||||||||||||
Carl G. Annessa | 2019 | $ | 360,000 | $ | 360,000 | $ | 688,783 | $ | — | $ | 453,600 | $ | — | $ | 28,914 | $ | 1,891,297 | ||||||||||||||||
Executive Vice President & COO | 2018 | 360,000 | — | 1,403,999 | — | 270,000 | — | 38,404 | 2,072,403 | ||||||||||||||||||||||||
James O. Harp, Jr. | 2019 | $ | 360,000 | $ | 360,000 | $ | 688,783 | $ | — | $ | 453,600 | $ | — | $ | 32,296 | $ | 1,894,679 | ||||||||||||||||
Executive Vice President & CFO | 2018 | 360,000 | — | 1,403,999 | — | 270,000 | — | 40,340 | 2,074,339 | ||||||||||||||||||||||||
(1) | As a result of weak market conditions, effective January 1, 2015, the named executive officers voluntarily offered to reduce their base salaries. Such reduction was subsequently ratified by the compensation committee. For the period of the industry downturn, the chief executive officer voluntarily agreed to reduce his base salary by 15%, whereas, each of the other executive officers voluntarily reduced his base salary by 10%. |
(2) | For fiscal year 2019, a retention bonus subject to claw back was awarded equal to 100% of the executive officer’s base salary. |
(3) | The grant date fair values of these RSU and PSU awards are computed in accordance with FASB ASC Topic 718. The amounts in this column reflect the grant date fair values of RSUs and PSUs granted to the named executive officers during 2018 and 2019. The grant date fair values for time-based and performance-based awards that do not contain market-based conditions are calculated by multiplying the number of shares granted by the closing stock price on the date of grant. The maximum number of shares that could be earned under the 2018 performance-based grant agreements is equivalent to 150% of the target shares granted, which is reflected in this table. For awards granted in 2018 and 2019, the target values for our chief executive officer and other named executive officers were reduced by 10%, commensurate with their voluntarily reduced base salaries. The LTI phantom share-based units granted in 2019 were determined based on the revised Target LTI Values divided by the closing price on February 11, 2019. Values for the Time-Vest PSUs are based on the closing price on grant date, while the Time-Vest SARs are based on an assumed Black-Scholes value on grant date. |
(4) | The amounts in this column reflect the cash incentive payments to the named executive officers under all components of annual cash incentive compensation pursuant to the incentive compensation plan and the employment agreements for Messrs. Todd Hornbeck, Annessa, and Harp. Each of the named executive officers received cash incentive compensation according to the interpolated, straight-line-basis formula allowed under the objective components of the program, where applicable, and the compensation committee awarded a discretionary amount under the subjective component. For |
53
fiscal 2018 and 2019, the targeted cash incentive pay, which is a multiple of base salary, was impacted by the voluntary reductions in base salary for each named executive officer.
(5) | The amounts in this column reflect the following for each named executive officer during 2019: |
• | Premiums paid by the Company for term life insurance policies for each named executive officer; |
• | Premiums paid under the supplemental health insurance policies for Messrs. Todd Hornbeck, Annessa, and Harp. |
• | Automobile, fuel and insurance expenses on Company-provided vehicles for Messrs. Todd Hornbeck, Annessa, and Harp in the amount of $12,154, $14,766, and $18,448, respectively. The automobiles of Messrs. Todd Hornbeck, Annessa, and Harp are owned by the Company and their respective amount includes the depreciation of the vehicles and their actual fuel and insurance costs. |
Benefits and Perquisites. The Company provides the executive officers and other employees with certain perquisites and other personal benefits as part of providing a competitive executive compensation program and for employee retention. The Company does not gross-up for taxes payable in respect of perquisites received. The following table generally identifies the Company’s benefit plans and identifies those employees who may be eligible to participate. The executive officers participate in the following benefit plans in the same manner that our employees do, except where noted as below:
Benefit Plan | Executive Officers | Certain Managers | Full-time Employees | Notes | ||||
Medical Insurance | X | X | X | (1) | ||||
Dental Insurance | X | X | X | (1) | ||||
Vision Insurance | X | X | X | (1) | ||||
Employee Assistance Plan | X | X | X | |||||
Life and Disability Insurance | X | X | X | (2) | ||||
Flexible Spending Accounts | X | X | X | |||||
Employee Stock Purchase Plan (ESPP) | X | X | X | (3) | ||||
401(k) Plan | X | X | X | (4) | ||||
(1) | In 2019, Messrs. Todd Hornbeck, Annessa, Harp, Giberga and Cook had a supplemental medical insurance policy that pays all eligible out-of-pocket medical, dental and vision expenses. |
(2) | The executive officers, the Company’s Vice Presidents, and certain other officers have Company-paid basic life and accidental death and dismemberment insurance of 1.5 times their salary, up to $300,000. All other employees have Company-paid basic life and accidental death and dismemberment insurance of 1.5 times their salary, up to $100,000. In addition, the executive officers, the Company’s Vice Presidents, and certain other officers are eligible to receive disability benefits as long as they are disabled from performing their own occupation. For all other employees, they are entitled to disability benefits up to 36 months if they are disabled from performing their own occupation, and after 36 months they must be unable to work in any occupation. |
(3) | The ESPP was intended to encourage an equity stake in the Company by offering shares at a discount to eligible employees, aligning employee interests with those of our stockholders. The ESPP plan was terminated on March 13, 2020. |
(4) | In January 2020, the Company reinstated a 401(k) Plan "matching contribution" to all eligible employees, which had previously been suspended since January 1, 2015 due to the industry downturn. |
The Company believes it should provide limited perquisites for executive officers. As a result, the Company has historically given nominal perquisites. The following table generally illustrates the perquisites we do and do not provide and identifies those employees who may be eligible to receive them:
Type of Perquisite | Executive Officers | Certain Managers | Certain Full Time Employees | |||
Company Vehicle | X | Not offered | X | |||
Vehicle Allowance | Not offered | X | X | |||
Supplemental Medical Insurance | X | Not offered | Not offered | |||
Country Club Memberships | Not offered | Not offered | Not offered | |||
Dwellings for Personal Use | Not offered | Not offered | Not offered | |||
Security Services | Not offered | Not offered | Not offered | |||
Supplemental Executive Retirement Program (SERP) | Not offered | Not offered | Not offered | |||
Deferred Compensation Plan | X(1) | Not offered | Not offered | |||
(1) | A Deferred Compensation Plan was adopted by the Board of Directors during 2007. However, no matching provision has been authorized under the plan and, to date, no executive has availed himself of plan participation. |
54
Employment Agreements
Todd M. Hornbeck serves as our President and Chief Executive Officer, Carl G. Annessa serves as our Executive Vice President and Chief Operating Officer and James O. Harp, Jr. serves as our Executive Vice President and Chief Financial Officer. Each of Messrs. Todd Hornbeck, Annessa and Harp serves under an employment agreement with a current term expiring December 31, 2022. The terms of each of their agreements automatically extend for an additional year every January 1st, unless terminated before any such date by the employee or us.
The employment agreements of Messrs. Todd Hornbeck, Annessa and Harp, in each case, as amended, provide for annual base salaries of $750,000, $400,000 and $400,000. As a result of weak market conditions, effective January 1, 2015, the named executive officers voluntarily offered to reduce their base salaries. Such reduction was subsequently ratified by the compensation committee. For the period of the industry downturn, the chief executive officer voluntarily agreed to reduce his base salary by 15%, whereas, each of the other executive officers voluntarily reduced his base salary by 10%. The annual base salaries for the fiscal year ended December 31, 2019 of Messrs. Todd Hornbeck, Annessa and Harp continue to be at the reduced levels of $637,500, $360,000 and $360,000, respectively. The voluntary base salary reductions during the period of the industry downturn do not affect the calculation of payments upon termination of employment or a change in control.
For fiscal 2019, the targeted cash incentive pay and other target awards granted to our chief executive officer and other name executive officers were reduced by 15% and 10%, respectively. These reductions are commensurate with their voluntarily reduced base salaries that were effective from January 1, 2015 and for the duration of the industry downturn.
Equity Compensation Plan Information
Our Board of Directors and stockholders previously adopted the Hornbeck Offshore Services, Inc. Incentive Compensation Plan (the “Incentive Compensation Plan” or the “Plan”) to make awards with the purpose of strengthening our Company by providing an incentive to our employees, officers, consultants, non-employee directors and advisors to devote their abilities and energies to our success. The Incentive Compensation Plan provides for the granting or awarding of incentive and nonqualified stock options, stock appreciation and dividend equivalent rights, restricted stock awards, restricted stock units (“RSUs”), phantom stock units (“PSUs”), performance-based awards and any other awards.
On May 3, 2005, our Board of Directors and stockholders adopted the Hornbeck Offshore Services, Inc. Employee Stock Purchase Plan (the “ESPP”), which is a separate plan from the Company’s incentive compensation plan. Under the ESPP, the Company was authorized to offer to sell at a discount up to 2,200,000 shares of common stock to eligible employees of the Company and its designated subsidiaries. As of December 31, 2019, the Company had available 477,000 shares for future issuance under the ESPP. The ESPP was terminated on March 13, 2020.
The Incentive Compensation Plan is administered by the compensation committee. Subject to the express provisions of the incentive compensation plan and directions from the Board, the compensation committee is authorized, among other things:
• | to select the persons to whom restricted stock, RSUs, PSUs, stock options, stock appreciation rights (“SARs”) and other awards will be granted; |
• | to determine the type, size and terms and conditions of restricted stock, RSUs, PSUs, stock options, stock appreciation rights and other awards; |
• | to establish the terms for treatment of restricted stock, RSUs, PSUs, stock options, stock appreciation rights and other awards upon a termination of employment; and |
• | to delegate to the Chief Executive Officer and to other senior officers of the Company its duties under the incentive compensation plan related to non-executive employee compensation pursuant to conditions or limitations as the compensation committee may establish, subject to certain limitations under the Incentive Compensation Plan. |
55
Outstanding Equity Awards at Fiscal Year-End Table. The following table shows the number of shares covered by exercisable and unexercisable options, RSUs, PSUs and performance units that have not vested for which transfer restrictions had not yet lapsed held by our named executive officers on December 31, 2019.
2019 OUTSTANDING EQUITY AWARDS AT FISCAL YEAR END
Option Awards | Stock Awards | ||||||||||||||||||||||||||||
Number of Securities Underlying Unexercised Options (#) (1) | Number of Securities Underlying Unexercised Options (#) | Equity Incentive Plan Awards: Number of Securities Underlying Unexercised Unearned Options | Option Exercise Price | Option Expiration | Number of Shares or Units of Stock That Have Not Vested | Market Value of Shares or Units of Stock That Have Not Vested | Equity Incentive Plan Awards: Number of Unearned Shares, Units or Other Rights That Have Not Vested | Equity Incentive Plan Awards: Market or Payout Value of Unearned Shares, Units or Other Rights That Have Not Vested | |||||||||||||||||||||
Name | Exercisable | Unexercisable | (#) | ($) | Date | (#) | ($) | (#) (2) | ($) (3) | ||||||||||||||||||||
(a) | (b) | (c) | (d) | (e) | (f) | (g) | (h) | (i) | (j) | ||||||||||||||||||||
Todd M. Hornbeck | 83,266 | — | — | $ | 24.86 | 2/23/2021 | — | — | 624,126 | $ | — | ||||||||||||||||||
Chairman, President & CEO | — | — | — | — | — | — | — | 936,189 | 102,981 | ||||||||||||||||||||
— | — | — | — | — | — | — | 340,505 | 37,456 | |||||||||||||||||||||
— | — | — | — | — | — | — | 340,504 | 37,455 | |||||||||||||||||||||
— | — | — | — | — | — | — | 41,218 | 4,534 | |||||||||||||||||||||
— | — | — | — | — | — | — | 164,871 | 18,136 | |||||||||||||||||||||
— | — | — | — | — | — | — | 41,218 | 4,534 | |||||||||||||||||||||
Carl G. Annessa | 36,605 | — | — | $ | 24.86 | 2/23/2021 | — | — | 226,573 | $ | — | ||||||||||||||||||
Executive Vice President & COO | — | — | — | — | — | — | — | 339,860 | 37,385 | ||||||||||||||||||||
— | — | — | — | — | — | — | 138,873 | 15,276 | |||||||||||||||||||||
— | — | — | — | — | — | — | 138,872 | 15,276 | |||||||||||||||||||||
— | — | — | — | — | — | — | 16,811 | 1,849 | |||||||||||||||||||||
— | — | — | — | — | — | — | 67,241 | 7,397 | |||||||||||||||||||||
— | — | — | — | — | — | — | 16,811 | 1,849 | |||||||||||||||||||||
James O. Harp, Jr. | 36,605 | — | — | $ | 24.86 | 2/23/2021 | — | — | 226,573 | $ | — | ||||||||||||||||||
Executive Vice President & CFO | — | — | — | — | — | — | — | 339,860 | 37,385 | ||||||||||||||||||||
— | — | — | — | — | — | — | 138,873 | 15,276 | |||||||||||||||||||||
— | — | — | — | — | — | — | 138,872 | 15,276 | |||||||||||||||||||||
— | — | — | — | — | — | — | 16,811 | 1,849 | |||||||||||||||||||||
— | — | — | — | — | — | — | 67,241 | 7,397 | |||||||||||||||||||||
16,811 | 1,849 | ||||||||||||||||||||||||||||
(1) | All options listed in this column vested in equal installments over the first three years starting on the first anniversary date of the ten-year option term. |
(2) | The shares/units summarized above and described below are delineated below in numbered tranches based on the order they appear in the table above and include SARs, performance-based RSUs, performance-based PSUs, time-based RSUs and time-based PSUs. |
• | Time-based: The first tranche for Messrs. Todd Hornbeck, Annessa and Harp represents time-based SARs that were granted on March 8, 2019 and vested one-third on March 8, 2020 and are scheduled to vest one-third each on March 8, 2021 and March 8, 2022. The rights have a strike price of 1.38 and expire on March 8, 2029. |
• | The second tranche for Messrs. Todd Hornbeck, Annessa and Harp represents time-based PSUs that were granted on March 8, 2019 and vested one-third on March 8, 2020 and are scheduled to vest one-third each on March 8, 2021 and March 8, 2022. |
• | The third tranche for Messrs. Todd Hornbeck, Annessa and Harp represents time-based PSUs that were granted on February 6, 2018 and vested one-third each on February 6, 2019 and February 6, 2020 and with one-third scheduled to vest on February 6, 2021. |
• | The fifth tranche for Messrs. Todd Hornbeck, Annessa and Harp represents time-based PSUs that were granted on February 14, 2017 and vested one-third each on February 14, 2018, February 14, 2019 and February 10, 2020. |
• | The seventh tranche for Messrs. Todd Hornbeck, Annessa and Harp represents time-based RSUs that were granted on February 14, 2017 and vested one-third each on February 14, 2018 and February 14, 2019 and February 10, 2020. |
• | Performance-based: The fourth tranche for Messrs. Todd Hornbeck, Annessa and Harp represents performance-based PSUs that are scheduled to vest, depending on the Company’s achievement of performance criteria defined in the agreement for the period starting at the 2018 grant date through February 6, 2021. It was the intention of the Company to settle each phantom stock unit in stock. The maximum amount of units that could be earned under the grant agreement is equivalent to 150% of the target units granted, which is not reflected in this table. The table below sets forth the excess of the maximum potential units over the target units for the February 6, 2018 grant date awards. |
56
February 6, 2018 | |
Todd M. Hornbeck | 170,252 |
Carl G. Annessa | 69,436 |
James O. Harp, Jr. | 69,436 |
• | The sixth tranche for Messrs. Todd Hornbeck, Annessa and Harp represents performance-based PSUs that vested, depending on the Company’s achievement of performance criteria defined in the agreement for the period starting at the 2017 grant date through February 10, 2020. The maximum amount of units that could be earned under the grant agreement was 150% of the target units granted, which is not reflected in this table. In June 2019, these awards were modified to settle in stock. These awards vested at 150% on February 10, 2020 and the table below sets forth the excess of the maximum potential units over the target units for such awards. |
February 14, 2017 | ||
Todd M. Hornbeck | 84,236 | |
Carl G. Annessa | 33,621 | |
James O. Harp, Jr. | 33,621 | |
(3) | The amounts in this column equal the number of RSUs and PSUs indicated in column (i) multiplied by the closing price of our common stock on December 31, 2019 of $0.11. |
Employment Benefits and Potential Benefits Upon Termination or Change in Control
The following disclosures are based on the Debtors' Chapter 11 Cases and are, therefore, subject to change upon emergence from the Chapter 11 Cases. It is currently anticipated that the Chapter 11 Cases will result in the termination of the existing employment agreements and the entrance into new employment agreements with the Company’s named executive officers.
Potential payments upon termination, including after change in control, as of December 31, 2019, to Messrs. Todd Hornbeck, Annessa and Harp were governed by the terms of their respective employment agreements.
Payments Made Upon Termination Without Good Cause
Under the employment agreements, in the event any of Messrs. Todd Hornbeck, Annessa or Harp, was terminated without “good cause” as defined in the employment agreements: (i) his unvested stock options, SARs, time-based RSUs and time-based PSUs would vest upon the termination event, (ii) his unvested performance-based RSUs and performance-based PSUs would vest at the end of the measurement period at the number of shares that would have vested had he been employed with the Company through the end of each measurement period (depending on satisfaction of the performance criteria); and (iii) he would be entitled to his base salary, cash incentive compensation, automobile, and medical and other benefits through the actual expiration date of his agreement provided that bonuses for each calendar year through the termination date that are (a) discretionary in nature, shall be paid based on the greater of (x) the amount equal to the total bonus paid for the last completed year for which bonuses have been paid or (y) the amount equal to the bonuses that would have been payable for the then current year, and bonuses that are (b) performance based, shall be based on the amount equal to the bonuses, which includes cash incentive compensation and discretionary bonuses, that would have been payable for the applicable year, had he been employed with the Company at the end of each such year and paid at the time bonuses for each such year are paid to those executives still employed by the Company, determined on a basis consistent with the last completed year for which bonuses have been paid but using the bonus amounts for the then current year.
Payments Made Upon a Change in Control
For purposes of the employment agreements of Messrs. Todd Hornbeck, Annessa and Harp, and the Incentive Compensation Plan, a “change in control” means:
1.the obtaining by any person or persons acting as a group of fifty percent (50%) or more of the voting shares of Parent pursuant to a “tender offer” for such shares as provided under Rule 14d-2 promulgated under the Securities Exchange Act of 1934, as amended, or any subsequent comparable federal rule or regulation governing tender offers; or
2.a majority of the members of the Parent’s board of directors is replaced during any twelve (12) month period by new directors whose appointment or election is not endorsed by a majority of the members of the Parent’s board of directors before the date of such new directors’ appointment or election; or
57
3.any person, or persons acting as a group, acquires (or has acquired during the twelve (12) month period ending on the date of the most recent acquisition by such person or persons) assets from the Parent that have a total gross fair market value equal to or more than seventy-five percent (75%) of the total gross fair market value of all of the assets of the Parent immediately before such acquisition or acquisitions (other than transfers to related persons as defined in Section 1.409A-3(i)(5)(vii)(B) of the Treasury Regulations).
Under the respective equity award agreements for the executive officers, upon a change in control (i) his unvested stock options, SARs, time-based RSUs and time-based PSUs would vest (or be payable in cash) upon the change in control event and (ii) his unvested performance-based RSUs and performance-based PSUs would vest at the higher of the number of shares that would have been earned if the performance criteria were applied on the date of the change in control or the target share amount.
The employment agreements provide that if any of Messrs. Todd Hornbeck, Annessa or Harp was either constructively or actually terminated under the conditions set forth in his agreement, then he would be entitled to receive three times his salary under his employment agreement for the year in which the termination would have occurred, three years of medical and other insurance benefits from the date of termination and, in general, three times the greater of (x) the amount equal to the total cash incentive compensation and bonus, if applicable, paid for the last completed year for which cash incentive compensation and/or bonuses had been paid or (y) the amount equal to the cash incentive compensation and/or bonuses that would have been payable for the then current year. To the extent that such medical benefits may be taxable to the employee or his dependents, the Company would gross up the employee for such taxes based on the employee’s actual tax rate, up to 35% (without a gross up on the initial gross up). In addition, upon an actual or constructive termination following a change in control (i) his unvested stock options, SARs, time-based RSUs and time-based PSUs would vest (or be payable in cash) upon the termination event and (ii) his unvested performance-based RSUs and PSUs would vest at the higher of the number of shares that would have otherwise been earned if the performance criteria were applied on the date of the change in control or the target share amount.
In the event that it shall be determined that any payment by the Company to or for the benefit of the named executive officers would be subject to the excise tax imposed by Section 4999 of the Code, or any successor provision thereto, by reason of being considered “contingent on a change in ownership or control” of the Company, within the meaning of Section 280G of the Code, or any successor provision thereto, or to any similar tax imposed by state or local law, or any interest or penalties with respect to such tax (such tax or taxes, together with any such interest and penalties, being hereafter collectively referred to as the “Excise Tax”), then the named executive officer shall be entitled to receive an additional payment or payments, or gross-up payment, under his employment agreement. The gross-up payment would be an amount such that after payment by such named executive officer of all taxes including any Excise Tax (and including any interest or penalties imposed with respect to such taxes and the Excise Tax, other than interest and penalties imposed by reason of such named executive officer’s failure to timely file a tax return or pay taxes shown due on such executive officer’s return) imposed upon the gross-up payment, the amount of the gross-up payment retained by such named executive officer is equal to the Excise Tax imposed upon the payment.
Payments Made Upon Voluntary Termination or Termination with Cause
If the employment of any of Messrs. Todd Hornbeck, Annessa or Harp, is terminated for good cause or if any of Messrs. Todd Hornbeck, Annessa or Harp, voluntarily terminates his employment with the Company, the Company will pay any compensation earned but not paid to him prior to the effective date of termination. Mr. Todd Hornbeck’s employment agreement provided that he could voluntarily terminate his employment by giving at least ninety days’ notice. Messrs. Annessa and Harp were required to give at least thirty days’ notice. At any time after such notice, the Company would have the right to relieve the employee of his duties; however, salary would continue during the notice period.
The Company granted a bonus in March 2019 to each of its named executive officers subject to clawback in the event the executives voluntarily resigned or were involuntarily terminated for cause before the one-year anniversary of the grant of such bonus. The Company also granted retention bonuses on January 17, 2020 and March 25, 2020 that are also subject to clawback provisions. The clawback provisions of the retention bonus paid on January 17, 2020 provide that 100% of the after-tax retention bonus is subject to clawback in the event the executives voluntarily resign or are involuntarily terminated for cause before the one-year anniversary of the grant of such bonus, and 50% is subject to clawback in such events after the one-year anniversary of such grant but prior to 18 months following such grant. The clawback provisions of the retention bonus paid on March 25, 2020 provide that 100% of the after-tax retention bonus is subject to clawback in the event the executives voluntarily resign or are involuntarily terminated for cause on or before
58
December 31, 2020, and 50% is subject to clawback if such termination occurs after December 31, 2020 but before June 30, 2021.
Payments Made Upon Death
Under the employment agreements, if Messrs. Todd Hornbeck, Annessa or Harp had died during the term of his employment: (i) his unvested stock options, SARs, time-based RSUs and time-based PSUs would vest upon the date of death, (ii) his performance-based RSUs and performance-based PSUs would vest at the higher of the number of shares that would otherwise be earned if the performance criteria were applied on the date of death or the target share amount; and (iii) the Company shall pay to his estate the compensation that such executive would have earned through the date of death, including any prior year bonus or cash incentive compensation earned but not yet paid and the pro-rated portion of any current year bonuses as and when determined in the ordinary course of the calculation of current year bonuses due to other executive officers of the Company, and his dependents would be entitled to benefits, including medical, and other benefits and use of a Company automobile for a period of one year following the date of death. Also, the estate of Messrs. Todd Hornbeck, Annessa and Harp, respectively, would receive life insurance proceeds from the Company-paid term life insurance policies that were in effect on the date of his death.
Payments Made Upon Permanent Disability
Under the employment agreements, if Messrs. Todd Hornbeck, Annessa or Harp had become permanently disabled, as defined in the employment agreements, during the term of his employment: (i) his unvested stock options, SARs, time-based RSUs and time-based PSUs would vest upon the termination event, (ii) his performance-based RSUs and performance-based PSUs would vest at the higher of the number of shares that would otherwise be earned if the performance criteria were applied on the date of termination or the target share amount; and (iii) he would be entitled to (x) salary continuation benefits under the Company’s disability plan, which allows disability payments for as long as the plan participant is disabled from performing the material duties of his own occupation (y) the compensation that such executive would have earned through the date of determination of permanent disability, including any prior year bonus or cash incentive compensation earned but not yet paid and the pro-rated portion of any current year bonus as and when determined in the ordinary course of the calculation of current year bonuses due to other executive officers of the Company, and (z) other benefits, including medical and use of a Company automobile for a period of one year following the date of determination of permanent disability.
Payments Made Upon Non-Renewal of an Employment Agreement
If an employment agreement is not renewed, Messrs. Todd Hornbeck, Annessa or Harp as applicable, would be entitled to receive an amount equal to one-half of his basic annualized salary for the year preceding such non-renewal.
Material Conditions and Obligations Under the Employment Agreements
Messrs. Todd Hornbeck, Annessa, Harp, Giberga and Cook each agreed that during the term of their respective agreements and for a period of two years after termination, they will not (1) be employed by or associated with or own more than 5% of the outstanding securities of any entity that competes with us in the locations in which we operate, (2) solicit any of our employees to terminate their employment or (3) accept employment with or payments from any of our clients or customers who did business with us while employed by us. We may elect to extend any of Messrs. Todd Hornbeck’s, Annessa’s or Harp’s, as applicable, noncompetition period for an additional year by paying his compensation and other benefits for an additional year.
59
Compensation to Directors
The table below summarizes the compensation paid by the Company to the non-employee directors who served during the fiscal year ended December 31, 2019 for such period.
2019 Director Compensation
Name | Fees Earned or Paid in Cash ($) | Stock Awards ($) (1) | Option Awards ($) (2) | Non-Equity Incentive Plan Compensation ($) | Change in Pension Value and Nonqualified Deferred Compensation Earnings ($) | All Other Compensation ($) | Total ($) | |||||||||||||||||||||
(a) | (b) | (c) | (d) | (e) | (f) | (g) | (h) | |||||||||||||||||||||
Larry D. Hornbeck | $ | 143,550 | $ | — | $ | — | $ | — | $ | — | $ | — | $ | 143,550 | ||||||||||||||
Bruce W. Hunt | 136,800 | — | — | — | — | — | 136,800 | |||||||||||||||||||||
Steven W. Krablin | 136,800 | — | — | — | — | — | 136,800 | |||||||||||||||||||||
Patricia B. Melcher | 141,300 | — | — | — | — | — | 141,300 | |||||||||||||||||||||
Kevin O. Meyers | 135,450 | — | — | — | — | — | 135,450 | |||||||||||||||||||||
Bernie W. Stewart | 152,100 | — | — | — | — | — | 152,100 | |||||||||||||||||||||
Nicholas L. Swyka, Jr. | 142,200 | — | — | — | — | — | 142,200 | |||||||||||||||||||||
(1) | The Directors were not issued any Stock Awards in 2019 |
(2) | At December 31, 2019, the Company’s non-employee directors had no options outstanding. |
The Company has historically used a combination of cash and stock-based incentive compensation to attract and retain qualified candidates to serve on the Board. In setting director compensation, the Company considers the significant amount of time that directors expend in fulfilling their duties to the Company as well as the skill-level required by the Company of members of its Board. Our Chairman, who is also our employee, receives no additional compensation for serving as a director.
Under the non-employee director compensation policy adopted in 2012, non-employee directors were entitled to receive quarterly grants of that number of shares of common stock equal for each quarter to $25,000 divided by the closing stock price on the applicable grant date. On February 10, 2015, in response to weak market conditions, the Board elected to reduce the amounts of their director retainer and meeting fees and their quarterly stock grants by 10% for the period of the industry downturn. On September 1, 2017, given the significant decline in the market price of the Company's common stock and the Company's reduced level of shares available to be granted, the compensation committee deemed it in the best interest of the Company to settle all director awards in cash for at least the following four fiscal quarters. On October 29, 2018, the Board formally amended the Director & Advisory Director Compensation Policy to allow for all future awards to be settled in cash or stock at the discretion of the compensation committee.
For the year ended December 31, 2019, the compensation committee settled all quarterly awards in cash and did not grant any stock awards. Historically, when stock awards were granted, the compensation committee granted fully vested stock awards. Should, in the future, the compensation committee determine to apply a vesting period to shares awarded under this policy; such grants may be made of RSUs. Any equity awards made under this policy are granted under the Incentive Compensation Plan. The awards are subject to annual review and may be adjusted at the discretion of the compensation committee.
As of December 31, 2019, the non-employee director compensation policy also provided for longevity service awards to non-employee directors. Upon completion of three years of service as a Non-employee Director, the Non-employee Director would be granted, or the Three-Year Grant, (i) an option to purchase the number of shares of common stock equaling 25% of the shares covered by options granted to such Director over the previous three years, (ii) shares of common stock or restricted stock units equal to 25% of the shares of common stock and restricted stock units granted to such Director over the previous three years and (iii) cash equal to 25% of the cash paid in lieu of the equity component to
60
such Non-employee Director over the previous three years. Upon completion of five years of service as a Non-employee Director, the Non-employee Director would be granted, or the Five-Year Grant, (i) an option to purchase the number of shares of common stock equaling 50% of the shares covered by options granted to such Director over the previous five years less the number of shares covered by options awarded in the Three-Year Grant, if any, (ii) shares of common stock or restricted stock units equal to 50% of the shares of common stock and restricted stock units granted to such Director over the previous five years less the number of shares of common stock and restricted stock units awarded in the Three-Year Grant, if any, and (iii) cash equal to 50% of the cash paid in lieu of the equity component to such Non-employee Director over the previous five years under the Equity Compensation Program detailed above, less the amount of cash paid in lieu of the equity component to such Director in the Three-Year Grant, if any. Thereafter, upon completion of each successive period of five years of service, a Non-employee Director would be granted (a “Successive Longevity Grant”) (i) an option to purchase the number of shares of common stock equaling 50% of the shares covered by options granted to such Director over the previous five years (exclusive of any prior Longevity Grants of options during such five years), (ii) shares of common stock or restricted stock units equal to 50% of the shares of common stock and restricted stock units granted to such Director over the previous five years (exclusive of any prior Longevity Grants of shares of common stock or restricted stock units during such five years) and (iii) cash equal to 50% of the cash paid in lieu of the equity component to such Non-employee Director over the previous five years under the Equity Compensation Program detailed above (exclusive of any prior Longevity Awards of cash paid in lieu of the equity component during such five years). The exercise price of any options granted under the Longevity Plan would have been the fair market value per share of the common stock on the date of grant. There were no longevity awards that vested in 2019.
Over the past five years, the Company found that the administration of the longevity program had become overly burdensome, and while the manner in which these awards were calculated was applied consistently to all directors, due to the volatile nature of our stock price and the different vesting dates for each director, both the number of shares awarded and the fair market value of these shares were vastly different from director to director. In an effort to simplify the administration of director compensation, and provide a more equitable result for all directors, on February 10, 2020, the Company eliminated the longevity award and, instead, increased each director’s quarterly equity compensation from an annual amount of $90,000 to $135,000 divided into four equal tranches. This represents a reduction of 10% from pre-2015 levels. Because each director was in a unique position with regard to their own longevity award, the directors’ received a pro-rata cash payout of his or her longevity award as of December 31, 2019 calculated using the closing price of HOSS, on the OTCQB Marketplace, on February 10, 2020.
After three years of service as a non-employee director, a non-employee director and his or her immediate family can elect to participate in the same health insurance benefit programs sponsored by the Company on the same monetary terms as our employees. All directors are entitled to be reimbursed for their out-of-pocket expenses incurred in connection with serving on our Board.
Effective as of October 30, 2007, the independent members of the Board of Directors approved a letter agreement between the Company and Mr. Larry Hornbeck. Under the terms of such agreement, Mr. Larry Hornbeck agreed, among other things, to make himself available to the Company, the Board of Directors or any committee of the Board of Directors or the Chief Executive Officer of the Company, as an extension of his duties as a director in exchange for consideration of $1,500 per month as additional board fees. Effective February 10, 2015, in response to weak market conditions, such additional board fees were reduced by 10% to $1,350 per month.
61
Item 12—Security Ownership of Certain Beneficial Owners and Management and Related Stockholder Matters
Principal Stockholders
The following table sets forth certain information regarding the beneficial ownership of our voting securities as of June 30, 2020:
• | each person who is known to us to be the beneficial owner of more than 5% of our voting securities; |
• | each of our directors; and |
• | each of our named executive officers and all of our executive officers and directors as a group. |
Unless otherwise indicated, each person named below has an address in care of our principal executive offices and has sole power to vote and dispose of the shares of voting securities beneficially owned by them, subject to community property laws where applicable.
Named Executive Officers and Directors: | Shares of Common Stock Beneficially Owned (†)(1) | Percentage of Common Stock Beneficially Owned (%) | |
Todd M. Hornbeck | 1,514,955 | (2) | 3.8 % |
James O. Harp, Jr. | 585,487 | (3) | 1.5 % |
Carl G. Annessa | 537,867 | (4) | 1.4 % |
Larry D. Hornbeck | 587,702 | (5) | 1.5 % |
Bruce W. Hunt | 161,738 | (6) | * |
Steven W. Krablin | 56,517 | * | |
Patricia B. Melcher | 133,691 | * | |
Kevin O. Meyers | 84,378 | * | |
Bernie W. Stewart | 112,107 | * | |
Nicholas L. Swyka, Jr | 71,535 | * | |
All directors and executive officers as a group (13 persons) | 4,866,005 | (7) | 12.3 % |
Other 5% Stockholders: | |||
Cyrus Capital Partners, L.P. | 3,704,019 | (8) | 9.4 % |
Fine Capital Partners, L.P. | 3,584,046 | (9) | 9.0 % |
Solus Alternative Asset Management LP | 3,170,077 | (10) | 8.0 % |
William Herbert Hunt Trust Estate | 2,058,391 | (11) | 5.2 % |
* | Indicates beneficial ownership of less than 1% of the total outstanding Common Stock. |
† | “Beneficial ownership” is a term broadly defined by the Commission in Rule 13d-3 under the Securities Exchange Act of 1934, as amended, and includes more than merely direct forms of stock ownership, that is, stock held in the person’s name. The term also includes what is referred to as “indirect ownership”, meaning ownership of shares as to which a person has or shares investment or voting power. For purposes of this table, a person or group of persons is deemed to have “beneficial ownership” of any shares as of June 30, 2020 that such person or group has the right to acquire within 60 days after such date. |
(1) | It is currently anticipated that if the Plan is implemented as contemplated and approved by the Bankruptcy Court, all of our existing common stock will be extinguished. |
(2) | Includes options to purchase an aggregate of 83,266 shares of Common Stock and 86,724 shares held by certain family trusts for which Todd M. Hornbeck serves as trustee and holds voting power pursuant to a power of attorney. |
(3) | Includes options to purchase an aggregate of 36,605 shares of Common Stock. |
(4) | Includes options to purchase an aggregate of 36,605 shares of Common Stock. |
(5) | Includes 305,086 shares held by certain family trusts for which Larry D. Hornbeck serves as trustee and holds voting power pursuant to a power of attorney. |
(6) | Mr. Hunt is a representative of the William Herbert Hunt Trust Estate. As such, Mr. Hunt may be deemed to have voting and dispositive power over the shares beneficially owned by the Trust Estate, as described in the table above and the related footnotes. Mr. Hunt disclaims beneficial ownership of the shares owned by the Trust Estate. |
(7) | Includes options to purchase an aggregate of 184,902 shares of Common Stock for our named executive officers and 3 executive officers who are not named. |
(8) | Based on a Stockholder Support Agreement dated February 10, 2020 reflecting shares beneficially owned at February 10, 2020. Cyrus Capital Partners, L.P.’s address is 65 E. 55th Street, 35th Floor, New York, New York 10022. |
(9) | Based on a Schedule 13G/A dated February 13, 2020 filed with the SEC to reflect shares beneficially owned by the reporting person at December 31, 2019. Fine Capital Partners L.P.’s address is 590 Madison Avenue, 27th Floor, New York, New York 10022. |
62
(10) | Based on a Schedule 13D/A dated February 18, 2020 filed with the SEC reflecting shares beneficially owned by the reporting person at February 14, 2020. Solus Alternative Asset Management LP’s address is 410 Park Avenue, 11th Floor, New York, New York 10022. |
(11) | Based on a Schedule 13G/A dated April 29, 2008 filed with the SEC reflecting shares beneficially owned by the reporting person at April 8, 2008. The William Herbert Hunt Trust Estate’s address is 2101 Cedar Springs Road, Suite 600, Dallas, Texas 75201. |
Securities Authorized for Issuance Under Equity Compensation Plans
The Second Amended and Restated Hornbeck Offshore Services, Inc. Incentive Compensation Plan, or the Incentive Compensation Plan, provided for the issuance of incentive compensation, including equity-based awards, to our eligible employees, non-employee directors, and consultants. In addition to the Incentive Compensation Plan, the Hornbeck Offshore Services, Inc. 2005 Employee Stock Purchase Plan, or the ESPP, was adopted in 2005 and terminated on March 13, 2020. The ESPP was a separate plan from the Company’s Incentive Compensation Plan, and shares available for issuance under the ESPP could not be issued under the Incentive Compensation Plan. The following table sets forth information regarding the Incentive Compensation Plan and ESPP as of December 31, 2019. Pursuant to the terms of the Plan and Confirmation Order, all of the Company’ equity compensation plans will be cancelled, and the obligations of the Company thereunder or in any way related thereto shall be discharged and deemed satisfied in full.
The following table summarizes information as of December 31, 2019, about our Incentive Compensation Plan and ESPP:
Plan Category | Number of Securities to be Issued Upon Exercise of Outstanding Options, Warrants and Rights (1) | Weighted Average Exercise Price of Outstanding Options, Warrants and Rights (2) | Weighted Average Remaining Term of Outstanding Options, Warrants and Rights (3) | Number of Securities Remaining Available for Future Issuance Under Equity Compensation Plans (Excluding Securities Reflected in Column (a)) (4) | ||||
(a) | (b) | (c) | (d) | |||||
Equity compensation and purchase plans approved by security holders | 7,699,484 | $3.81 | 8.4 | 445,608 | ||||
Equity compensation plans not approved by security holders | — | — | — | — | ||||
Total | 7,699,484 | 445,608 | ||||||
(1) | This amount includes: |
◦ | 184,902 shares issuable upon the exercise of outstanding stock options; |
◦ | 5,216,240 shares governed by RSUs, and PSUs granted in 2017, 2018 and 2019; and |
◦ | 1,601,223 shares issuable upon the exercise of outstanding stock appreciation rights granted in 2019. |
◦ | And includes the effect of 697,119 shares governed by performance-vest PSUs granted in 2017 and 2018 that are issuable if the maximum potential of 150% of target awards is realized. |
(2) | The weighted average exercise price of outstanding options, warrants and rights does not take into account RSUs and PSUs, since these awards have no exercise price. |
(3) | The weighted average remaining term of outstanding options, warrants and rights does not take into account RSUs and PSUs. |
(4) | This amount includes (31,393) and 477,001 shares of common stock available for future issuance under the Incentive Compensation Plan and the ESPP, respectively, as of December 31, 2019. |
The following table summarizes information as of May 31, 2020, about our Incentive Compensation Plan and ESPP:
Plan Category | Number of Securities to be Issued Upon Exercise of Outstanding Options, Warrants and Rights (1) | Weighted Average Exercise Price of Outstanding Options, Warrants and Rights (2) | Weighted Average Remaining Term of Outstanding Options, Warrants and Rights (3) | Number of Securities Remaining Available for Future Issuance Under Equity Compensation Plans (Excluding Securities Reflected in Column (a)) (4) (5) | ||||
(a) | (b) | (c) | (d) | |||||
Equity compensation and purchase plans approved by security holders | 5,434,181 | $3.81 | 7.9 | 1,167,990 | ||||
Equity compensation plans not approved by security holders | — | — | — | — | ||||
Total | 5,434,181 | 1,167,990 | ||||||
63
(1) | This amount includes: |
◦ | 184,902 shares issuable upon the exercise of outstanding stock options; |
◦ | 3,178,363 shares governed by PSUs granted in 2018 and 2019; and |
◦ | 1,601,223 shares issuable upon the exercise of outstanding stock appreciation rights granted in 2019. |
◦ | And includes the effect of 469,693 shares governed by performance-vest PSUs granted in 2018 that are issuable if the maximum potential of 150% of target awards is realized. |
(2) | The weighted average exercise price of outstanding options, warrants and rights does not take into account PSUs, since these awards have no exercise price. |
(3) | The weighted average remaining term of outstanding options, warrants and rights does not take into account PSUs. |
(4) | This amount includes 690,989 and 477,001 shares of common stock available for future issuance under the Incentive Compensation Plan and the ESPP, respectively, as of May 31, 2020. |
(5) | It is currently anticipated that if the Plan is implemented as contemplated and approved by the Bankruptcy Court, all of our existing equity interests will be extinguished and our other publicly traded securities will be satisfied. |
Change in Control
On May 19, 2020, the Debtors filed the Chapter 11 Cases in the Bankruptcy Court. Our Plan, having been approved by the requisite number of creditors and by the Bankruptcy Court on June 19, 2020, will result in a change in control of the Company on its effective date. See "Item 1 - Business - Recent Development - Joint Prepackaged Chapter 11 Plan of Reorganization".
Item 13—Certain Relationships and Related Transactions, and Director Independence
Certain Relationships and Related Transactions
The following is a discussion of transactions between our Company and its executive officers, directors and stockholders owning more than 5% of our common stock. We believe that the terms of each of these transactions were at least as favorable as could have been obtained in similar transactions with unaffiliated third parties.
Under the terms of certain agreements, various persons, including Todd M. Hornbeck, Troy A. Hornbeck, Larry D. Hornbeck, James O. Harp, Jr., Carl G. Annessa, Patricia B. Melcher, and the William Herbert Hunt Trust Estate, have the right to include some or all of their shares of common stock of the Company in any registration statement that we file involving our common stock, subject to certain limitations. Messrs. Todd and Troy Hornbeck, are entitled to require us to file a registration statement under the Securities Act of 1933 to sell some or all of the common stock held by them.
Todd M. Hornbeck and Troy A. Hornbeck have agreed to give us notice of, and an opportunity to make a competing offer regarding, a decision by either of them to sell or consider accepting an offer to sell to a single person or entity shares of common stock representing 5% or more of our common stock, other than in compliance with Rule 144 or to an affiliate or family member of the holder.
The Company has entered into a separate indemnity agreement with each of its executive officers and its directors that provide, among other things, that the Company will indemnify such officer or director, under the circumstances and to the extent provided in the agreement, for expenses, damages, judgments, fines and settlements he or she may be required to pay in actions or proceedings which he or she is or may be made a party by reason of his or her position as an executive officer or director of the Company, and otherwise to the fullest extent permitted under Delaware law and the Company’s Bylaws. These agreements are in addition to the indemnification provided to the Company’s officers and directors under its Bylaws and in accordance with Delaware law. The Company has agreed to indemnify Todd M. Hornbeck, the Company’s President and Chief Executive Officer, for any claims, demands, causes of action and damages that may arise from use of his personal watercraft for Company business purposes.
For the past twenty-two years, Larry D. Hornbeck’s family has personally supported the development of the Company by hosting numerous events at the Hornbeck Family Ranch, located in Houston County, Texas, including constructing at their own expense, a hunting lodge and related facilities and providing access to 4,700 acres adjoining the lodge and related facilities. The Hornbeck Family Ranch and related facilities have been used for functions intended to foster client and vendor relations, management retreats, Board meetings and special Company promotional events. The ranch also plays a vital role in the Company's business continuity plan in the event our corporate headquarters is impacted by a natural disaster. Until December 31, 2005, these facilities were used by the Company without charge. The Board determined that the use of the Hornbeck Family Ranch in the past and going forward has been and is beneficial to the Company’s business. As of February 14, 2006, the Company entered into a Facilities Use Agreement and implemented an amendment to an existing Indemnification Agreement with Larry D. Hornbeck, one of our directors. The Facilities Use Agreement and the amendment to such Indemnification Agreement became effective as of January 1, 2006,
64
and were approved by our audit committee and by the independent members of the Board of Directors on February 14, 2006. On May 7, 2015, the Company entered into an Amended and Restated Indemnification Agreement, or the Restated Indemnification Agreement, with Larry D. Hornbeck, one of our directors, Joan M. Hornbeck and Hornbeck Family Ranch, LP, which amended and restated the Indemnification Agreement. The Restated Indemnification Agreement provides for indemnification by the Company of such parties as well as certain other indemnitees, including the Company’s Chairman, President and Chief Executive Officer, Todd M. Hornbeck, for any claims, demands, causes of action and damages that may arise out of the Company’s current and expanded use of the Hornbeck Family Ranch and related facilities and premises for Company functions such as client and vendor events, management retreats, Board of Director meetings and special Company promotional events. The Restated Indemnification Agreement also provides that the Company shall secure and maintain insurance coverage of the types and amounts sufficient to provide adequate protection against the liabilities that may arise under the Restated Indemnification Agreement. The Restated Indemnification Agreement was approved by the independent members of the Board of Directors on April 28, 2015.
The agreements govern the Company’s use of the Hornbeck Family Ranch and related facilities. The Facilities Use Agreement will remain in effect until December 31, 2020 unless it is terminated or extended by its terms. The Facilities Use Agreement automatically renews on an annual basis unless either party provides the other party 30 days’ written notice of termination. The Facilities Use Agreement also provides that the Company will pay Mr. Larry Hornbeck an annual use fee of $150,000 for the Company’s use of the facilities and reimburse Mr. Larry Hornbeck for certain other variable costs related to the Company’s use of the ranch facilities. In addition to costs incurred directly by the Company for such activities, the Company replenishes expendable goods used by Company invitees to the facilities.
In 2006, Larry D. Hornbeck transferred ownership of the land on which the Hornbeck Family Ranch is located to a family limited partnership in which trusts on behalf of the children of Todd M. Hornbeck and Troy A. Hornbeck are the limited partners. The general partner of the family limited partnership is controlled by Todd M. Hornbeck and Troy A. Hornbeck. The family limited partnership has entered into a long-term lease of the property to Larry Hornbeck and acknowledged and agreed to the Company’s use of the Hornbeck Family Ranch and related facilities under the Facilities Use Agreement and the Indemnification Agreement. Due to the effect of COVID-19 on travel and current market conditions, on June 1, 2020, the Company placed the facilities on stand-by status. Larry D. Hornbeck voluntarily and unilaterally agreed, during the current term, to reduce the Use Fee by half during the stand-by period.
The Company has provided, and may, from time to time in the future at its own expense and with Mr. Larry Hornbeck’s prior approval, provide additional amenities for its representatives and invitees. Certain of these amenities may, by their nature, remain with the property should the Company ever cease to use the Ranch. In approving the Facilities Use Agreement and establishing the use fee amount, the audit committee and independent members of the Board considered the costs of comparable third party facilities and determined that the combined facilities use fee and anticipated reimbursement of variable costs was substantially lower than costs for the use of such comparable facilities.
In the first quarter of 2012, the independent members of the Board of Directors acknowledged the service that Mr. Larry Hornbeck has provided the Company and acknowledged that the commitment of time and energy associated with this service is substantial and is provided independently from his service as a director. In order to appropriately compensate Mr. Larry Hornbeck for these services, the independent members of the Board of Directors approved a consulting agreement between the Company and Mr. Larry Hornbeck effective January 1, 2012. Under the terms of such agreement, Mr. Larry Hornbeck agreed, among other things, to make himself available to the Company, the Chief Executive Officer of the Company, the Board of Directors or any committee of the Board of Directors to assist in the assessment of potential targets for acquisitions, to travel for Company projects, to attend industry meetings and to provide assistance in other ways, in exchange for consideration of $12,000 per month paid as consulting fees.
Review, Approval or Ratification of Transactions with Related Persons.
We review any transaction in which the Company, a subsidiary of the Company, and our directors, executive officers or their immediate family members or any nominee for director or a holder of more than 5% of any class of our voting security are a participant and the amount of the transaction exceeds $120,000. Our General Counsel is primarily responsible for the development and implementation of processes and controls to obtain information from directors and officers with respect to a related party transaction, including information provided to management in the annual director and officer questionnaires. In addition, the Company has adopted a written Code of Business Conduct and Ethics for members of the Board of Directors that is located on the Governance page of the Company’s website, www.hornbeckoffshore.com. This policy requires disclosure by directors of any situation that involves, or may reasonably
65
be inferred to involve, a conflict between a director’s personal interests and the interests of the Company. The Company’s practice when such matters have been disclosed has been to refer the matter for consideration and final determination by the audit committee or the independent directors of the Board, or both, which have considered the fairness of the transaction to the Company, as well as other factors bearing upon its appropriateness. In all such matters, any director having a conflicting interest abstains from voting on the matters.
Director Independence
See Item 10. “Directors, Executive Officers and Corporate Governance - Director Independence.”
66
Item 14—Principal Accounting Fees and Services
Independent Auditors and Fees
Ernst & Young LLP, certified public accountants, has served as our independent registered public accounting firm since 2002 and audited our consolidated financial statements included in this Form 10-K.
The following table presents fees for professional audit services rendered by Ernst & Young LLP for the audit of the Company’s annual financial statements for the years ended December 31, 2019 and 2018, and fees billed for other services rendered by Ernst & Young LLP during those periods.
Year Ended December 31, | |||||||
2019 | 2018 | ||||||
Audit fees (1) | $ | 595,059 | $ | 539,011 | |||
Audit related fees (2) | 16,700 | 16,700 | |||||
Tax fees (3) | 332,814 | 202,535 | |||||
Total | $ | 944,573 | $ | 758,246 | |||
(1) | Audit fees: Consists of fees billed for professional services rendered for the audit of the Company’s consolidated financial statements, for the review of the interim condensed consolidated financial statements included in quarterly reports, services that are normally provided by Ernst & Young LLP in connection with statutory and regulatory filings or engagements and attest services, except those not required by statute or regulation. |
(2) | Audit related fees: Consists of fees billed for assurance and related services that are reasonably related to the performance of the audit or review of the Company’s consolidated financial statements and are not reported under “Audit Fees.” These services include accounting consultations in connection with acquisitions, attest services that are not required by statute or regulation, and consultations concerning financial accounting and reporting standards. |
(3) | Tax fees: Consists of tax compliance and preparation and other tax services. Tax compliance and preparation consists of fees billed for professional services related to federal, state and international tax compliance, assistance with tax audits and appeals, assistance related to the impact of mergers and acquisitions, and tax return preparation. Other tax services consist of fees billed for other miscellaneous tax consulting and planning. |
Policy on Audit Committee Pre-Approval of Audit and Permissible Non-Audit Services of Independent Auditors.
The audit committee is responsible for appointing, setting compensation, and overseeing the work of the independent auditors. The audit committee’s policy is to pre-approve all audit and permissible non-audit services provided by the independent auditors. Requests for approval are generally submitted at a meeting of the audit committee. The audit committee may delegate pre-approval authority to a committee member, provided that any decisions made by such member shall be presented to the full committee at its next scheduled meeting.
PART IV
Item 15—Exhibits and Financial Statement Schedules
(a) The following items are filed as part of this report:
1. Financial Statements. The financial statements and information required by Item 8 appear on pages F-1 through F-39 of this report. The Index to Consolidated Financial Statements appears on page F-1.
2. Financial Statement Schedules. All schedules are omitted because they are not applicable or the required information is shown in the financial statements or the notes thereto.
3. Exhibits. The Exhibit Index is shown on page E-1 of this report.
67
INDEX TO CONSOLIDATED FINANCIAL STATEMENTS
Page | |
CONSOLIDATED FINANCIAL STATEMENTS OF HORNBECK OFFSHORE SERVICES, INC.: | |
F - 1
REPORT OF INDEPENDENT REGISTERED PUBLIC ACCOUNTING FIRM
The Board of Directors and Stockholders of
Hornbeck Offshore Services, Inc.
Opinion on the Financial Statements
We have audited the accompanying consolidated balance sheets of Hornbeck Offshore Services, Inc. (the “Company”) as of December 31, 2019 and 2018, the related consolidated statements of operations, comprehensive loss, changes in stockholders' equity and cash flows for each of the two years in the period ended December 31, 2019, and the related notes (collectively referred to as the “consolidated financial statements”). In our opinion, the consolidated financial statements present fairly, in all material respects, the financial position of the Company at December 31, 2019 and 2018, and the results of its operations and its cash flows for each of the two years in the period ended December 31, 2019, in conformity with U.S. generally accepted accounting principles.
The Company's Ability to Continue as a Going Concern
The accompanying consolidated financial statements have been prepared assuming that the Company will continue as a going concern. As discussed in Note 2 to the consolidated financial statements, the Company filed for relief under Chapter 11 of the United States Bankruptcy Code on May 19, 2020 and has stated that substantial doubt exists about the Company’s ability to continue as a going concern. Management’s evaluation of the events and conditions and management’s plans regarding these matters are also described in Note 2. The consolidated financial statements do not include any adjustments that might result from the outcome of this uncertainty.
Basis for Opinion
These financial statements are the responsibility of the Company's management. Our responsibility is to express an opinion on the Company’s financial statements based on our audits. We are a public accounting firm registered with the Public Company Accounting Oversight Board (United States) (PCAOB) and are required to be independent with respect to the Company in accordance with the U.S. federal securities laws and the applicable rules and regulations of the Securities and Exchange Commission and the PCAOB.
We conducted our audits in accordance with the standards of the PCAOB. Those standards require that we plan and perform the audit to obtain reasonable assurance about whether the financial statements are free of material misstatement, whether due to error or fraud. The Company is not required to have, nor were we engaged to perform, an audit of its internal control over financial reporting. As part of our audits we are required to obtain an understanding of internal control over financial reporting but not for the purpose of expressing an opinion on the effectiveness of the Company's internal control over financial reporting. Accordingly, we express no such opinion.
Our audits included performing procedures to assess the risks of material misstatement of the financial statements, whether due to error or fraud, and performing procedures that respond to those risks. Such procedures included examining, on a test basis, evidence regarding the amounts and disclosures in the financial statements. Our audits also included evaluating the accounting principles used and significant estimates made by management, as well as evaluating the overall presentation of the financial statements. We believe that our audits provide a reasonable basis for our opinion.
/s/ Ernst & Young LLP | ||||
We have served as the Company's auditor since 2002. | ||||
New Orleans, Louisiana | ||||
July 10, 2020 | ||||
F - 2
HORNBECK OFFSHORE SERVICES, INC. AND SUBSIDIARIES
CONSOLIDATED BALANCE SHEETS
(In thousands, except per share data)
Year Ended December 31, | |||||||
2019 | 2018 | ||||||
ASSETS | |||||||
Current assets: | |||||||
Cash and cash equivalents | $ | 121,490 | $ | 224,936 | |||
Accounts receivable, net of allowance for doubtful accounts of $3,987 and $1,123, respectively | 66,995 | 54,924 | |||||
Other current assets | 20,510 | 19,768 | |||||
Total current assets | 208,995 | 299,628 | |||||
Property, plant and equipment, net | 2,342,763 | 2,434,829 | |||||
Restricted cash | 52,136 | — | |||||
Deferred charges, net | 35,915 | 22,525 | |||||
Right of use assets | 23,492 | — | |||||
Other assets | 5,586 | 7,655 | |||||
Total assets | $ | 2,668,887 | $ | 2,764,637 | |||
LIABILITIES AND STOCKHOLDERS’ EQUITY | |||||||
Current liabilities: | |||||||
Accounts payable | $ | 30,093 | $ | 26,826 | |||
Accrued interest | 16,950 | 15,910 | |||||
Accrued payroll and benefits | 11,980 | 12,445 | |||||
Current portion of long-term debt, including deferred net gain of $31,718 and $0, net of original issue discount of $3,084 and $2,725 and deferred financing costs of $10,292 and $611, respectively | 1,263,890 | 96,311 | |||||
Lease liabilities | 2,953 | — | |||||
Other accrued liabilities | 11,618 | 9,750 | |||||
Total current liabilities | 1,337,484 | 161,242 | |||||
Long-term debt, including deferred net gain of $0 and $15,845, and net of original issue discount of $0 and $3,013 and deferred financing costs of $0 and $6,149, respectively | — | 1,123,625 | |||||
Deferred tax liabilities, net | 132,526 | 169,122 | |||||
Lease liabilities | 24,219 | — | |||||
Other liabilities | 2,213 | 2,722 | |||||
Total liabilities | 1,496,442 | 1,456,711 | |||||
Stockholders’ equity: | |||||||
Preferred stock: $0.01 par value; 5,000 shares authorized; no shares issued and outstanding | — | — | |||||
Common stock: $0.01 par value; 100,000 shares authorized; 38,096 and 37,701 shares issued and outstanding, respectively | 381 | 377 | |||||
Additional paid-in capital | 766,779 | 761,834 | |||||
Retained earnings | 408,789 | 549,475 | |||||
Accumulated other comprehensive loss | (3,504 | ) | (3,760 | ) | |||
Total stockholders’ equity | 1,172,445 | 1,307,926 | |||||
Total liabilities and stockholders’ equity | $ | 2,668,887 | $ | 2,764,637 | |||
The accompanying notes are an integral part of these consolidated statements
F - 3
HORNBECK OFFSHORE SERVICES, INC. AND SUBSIDIARIES
CONSOLIDATED STATEMENTS OF OPERATIONS
(In thousands, except per share data)
Year Ended December 31, | |||||||
2019 | 2018 | ||||||
Revenues: | |||||||
Vessel revenues | $ | 188,319 | $ | 175,767 | |||
Non-vessel revenues | 37,343 | 36,637 | |||||
225,662 | 212,404 | ||||||
Costs and expenses: | |||||||
Operating expenses | 164,630 | 147,642 | |||||
Depreciation | 98,339 | 98,927 | |||||
Amortization | 15,974 | 9,741 | |||||
General and administrative expenses | 53,880 | 43,530 | |||||
332,823 | 299,840 | ||||||
Gain on sale of assets | 62 | 59 | |||||
Operating loss | (107,099 | ) | (87,377 | ) | |||
Other income (expense): | |||||||
Loss on early extinguishment of debt, net | (71 | ) | — | ||||
Interest income | 4,488 | 2,228 | |||||
Interest expense | (83,380 | ) | (63,566 | ) | |||
Other income (expense), net | 10,255 | (29 | ) | ||||
(68,708 | ) | (61,367 | ) | ||||
Loss before income taxes | (175,807 | ) | (148,744 | ) | |||
Income tax benefit | (36,993 | ) | (29,621 | ) | |||
Net loss | $ | (138,814 | ) | $ | (119,123 | ) | |
Loss per share: | |||||||
Basic loss per common share | $ | (3.66 | ) | $ | (3.18 | ) | |
Diluted loss per common share | $ | (3.66 | ) | $ | (3.18 | ) | |
Weighted average basic shares outstanding | 37,914 | 37,508 | |||||
Weighted average diluted shares outstanding | 37,914 | 37,508 | |||||
The accompanying notes are an integral part of these consolidated statements
F - 4
HORNBECK OFFSHORE SERVICES, INC. AND SUBSIDIARIES
CONSOLIDATED STATEMENTS OF COMPREHENSIVE LOSS
(In thousands)
Year Ended December 31, | |||||||
2019 | 2018 | ||||||
Net loss | $ | (138,814 | ) | $ | (119,123 | ) | |
Other comprehensive loss: | |||||||
Foreign currency translation loss, net | (1,616 | ) | (12,437 | ) | |||
Total comprehensive loss | $ | (140,430 | ) | $ | (131,560 | ) | |
The accompanying notes are an integral part of these consolidated statements
F - 5
HORNBECK OFFSHORE SERVICES, INC. AND SUBSIDIARIES
CONSOLIDATED STATEMENTS OF CHANGES IN STOCKHOLDERS’ EQUITY
(In thousands)
Common Stock | Additional Paid-In Capital | Retained Earnings | Accumulated Other Comprehensive Income (loss) | Total Stockholders Equity | ||||||||||||||||||
Shares | Amount | |||||||||||||||||||||
Balance at December 31, 2017 | 37,144 | $ | 371 | $ | 760,278 | $ | 668,598 | $ | 8,677 | $ | 1,437,924 | |||||||||||
Shares issued under employee benefit programs | 556 | 6 | (142 | ) | — | — | (136 | ) | ||||||||||||||
Stock-based compensation expense | — | — | 1,698 | — | — | 1,698 | ||||||||||||||||
Net loss | — | — | — | (119,123 | ) | — | (119,123 | ) | ||||||||||||||
Foreign currency translation loss, net | — | — | — | — | (12,437 | ) | (12,437 | ) | ||||||||||||||
Balance at December 31, 2018 | 37,700 | $ | 377 | $ | 761,834 | $ | 549,475 | $ | (3,760 | ) | $ | 1,307,926 | ||||||||||
Shares issued under employee benefit programs | 396 | 4 | 9 | — | — | 13 | ||||||||||||||||
Adoption of ASU 2018-02 | — | — | — | (1,872 | ) | 1,872 | — | |||||||||||||||
Stock-based compensation expense | — | — | 4,936 | — | — | 4,936 | ||||||||||||||||
Net loss | — | — | — | (138,814 | ) | — | (138,814 | ) | ||||||||||||||
Foreign currency translation loss, net | — | — | — | — | (1,616 | ) | (1,616 | ) | ||||||||||||||
Balance at December 31, 2019 | 38,096 | $ | 381 | $ | 766,779 | $ | 408,789 | $ | (3,504 | ) | $ | 1,172,445 | ||||||||||
The accompanying notes are an integral part of these consolidated statements
F - 6
HORNBECK OFFSHORE SERVICES, INC. AND SUBSIDIARIES
CONSOLIDATED STATEMENTS OF CASH FLOWS
(In thousands)
Year Ended December 31, | |||||||
2019 | 2018 | ||||||
CASH FLOWS FROM OPERATING ACTIVITIES: | |||||||
Net loss | $ | (138,814 | ) | $ | (119,123 | ) | |
Adjustments to reconcile net loss to net cash used in operating activities: | |||||||
Depreciation | 98,339 | 98,927 | |||||
Amortization | 15,974 | 9,741 | |||||
Stock-based compensation expense | 3,590 | 3,692 | |||||
Loss on early extinguishment of debt, net | 71 | — | |||||
Provision for bad debts | 2,864 | (156 | ) | ||||
Deferred tax benefit | (36,127 | ) | (25,042 | ) | |||
Amortization of deferred financing costs | 6,016 | 7,487 | |||||
Amortization of deferred gain | (6,245 | ) | (3,066 | ) | |||
Gain on sale of assets | (62 | ) | (59 | ) | |||
Changes in operating assets and liabilities: | |||||||
Accounts receivable | (15,410 | ) | (10,285 | ) | |||
Other current and long-term assets | (2,417 | ) | (1,256 | ) | |||
Deferred drydocking charges | (33,094 | ) | (10,939 | ) | |||
Accounts payable | 6,544 | 4,621 | |||||
Accrued liabilities and other liabilities | 9,744 | 1,235 | |||||
Accrued interest | 1,041 | 1,871 | |||||
Net cash used in operating activities | (87,986 | ) | (42,352 | ) | |||
CASH FLOWS FROM INVESTING ACTIVITIES: | |||||||
Acquisition of offshore supply vessels | — | (40,868 | ) | ||||
Costs incurred for OSV newbuild program #5 | (3,344 | ) | (3,696 | ) | |||
Net proceeds from sale of assets | 68 | 86 | |||||
Vessel capital expenditures | (3,898 | ) | (7,915 | ) | |||
Non-vessel capital expenditures | (377 | ) | (131 | ) | |||
Net cash used in investing activities | (7,551 | ) | (52,524 | ) | |||
CASH FLOWS FROM FINANCING ACTIVITIES: | |||||||
Proceeds from first-lien term loans | 29,159 | 133,944 | |||||
Proceeds from senior credit facility | 100,000 | — | |||||
Repurchase of convertible notes | (73,076 | ) | — | ||||
Payment of deferred financing costs | (11,891 | ) | — | ||||
Shares withheld for payment of employee withholding taxes | — | (536 | ) | ||||
Net cash proceeds from other shares issued | 135 | 397 | |||||
Net cash provided by financing activities | 44,327 | 133,805 | |||||
Effects of exchange rate changes on cash | (100 | ) | (842 | ) | |||
Net increase (decrease) in cash, cash equivalents and restricted cash | (51,310 | ) | 38,087 | ||||
Cash, cash equivalents and restricted cash at beginning of period | 224,936 | 186,849 | |||||
Cash, cash equivalents and restricted cash at end of period | $ | 173,626 | $ | 224,936 | |||
SUPPLEMENTAL DISCLOSURES OF CASH FLOW ACTIVITIES: | |||||||
Cash paid for interest | $ | 82,415 | $ | 59,469 | |||
Cash paid for (refunds of) income taxes | $ | (3,589 | ) | $ | 942 | ||
SUPPLEMENTAL DISCLOSURES OF NON-CASH FINANCING ACTIVITIES: | |||||||
Exchange of convertible notes for first-lien term loans | $ | 20,951 | $ | — | |||
Exchange of senior notes for second-lien term loans | $ | 142,629 | $ | — | |||
The accompanying notes are an integral part of these consolidated statements
F - 7
HORNBECK OFFSHORE SERVICES, INC. AND SUBSIDIARIES
NOTES TO CONSOLIDATED FINANCIAL STATEMENTS
1. Organization
Nature of Operations and Basis of Presentation
Hornbeck Offshore Services, Inc., or the Company, was incorporated in the state of Delaware in 1997. The Company, through its subsidiaries, operates offshore supply vessels, or OSVs, multi-purpose support vessels, or MPSVs, and a shore-base facility to provide logistics support and specialty services to the offshore oil and gas exploration and production industry, primarily in the U.S. Gulf of Mexico, or the GoM, Latin America and select international markets, as well as specialty services for the U.S. military. The consolidated financial statements include the accounts of Hornbeck Offshore Services, Inc. and its subsidiaries. All significant intercompany accounts and transactions have been eliminated.
2. Recent Developments
Joint Prepackaged Chapter 11 Plan of Reorganization
Effective April 13, 2020, the Company, on behalf of itself and certain of its subsidiaries, together with the Company, collectively, the Debtors, entered into a Restructuring Support Agreement, or the RSA, with secured lenders holding approximately 83% of the Company’s aggregate secured indebtedness and unsecured noteholders holding approximately 79% of the Company’s aggregate unsecured notes outstanding related to a balance sheet restructuring of the Company to be implemented through a voluntary prepackaged Chapter 11 case in the United States Bankruptcy Court for the Southern District of Texas, Houston Division, or the Bankruptcy Court.
Despite the Company's extensive efforts to negotiate and launch an out-of-court debt-for-debt exchange transaction to address its outstanding 2020 senior notes and 2021 senior notes, it became evident in 2020 that an in-court process would be necessary to maximize value for the Company and its stakeholders while positioning it for long-term success. In March and April 2020, the Company experienced multiple events of defaults under the existing 2020 senior notes and 2021 senior notes, which included non-payment of principal and interest on the 2020 senior notes, nonpayment of interest on the 2021 senior notes and related cross-defaults. Cross-defaults were also triggered under the Company’s existing senior credit agreement, first lien term loan agreement and second lien term loan agreement. The Company, together with the administrative agents and certain of its lenders under its existing senior credit agreement, first lien term loan agreement and second lien term loan agreement, and certain holders of the Company’s 2020 senior notes and 2021 senior notes entered into separate forbearance agreements, which were subsequently extended to May 19, 2020 pursuant to which such lenders and noteholders agreed to forbear from exercising certain of their rights and remedies with respect to certain defaults by the Company.
On May 19, 2020, in accordance with the RSA, the Company sought voluntary relief under chapter 11 of the United States Bankruptcy Code, or the Chapter 11 Cases, in the Bankruptcy Court and filed a proposed joint prepackaged plan of reorganization, or the Plan.
On June 19, 2020, after a confirmation hearing, the Bankruptcy Court entered a confirmation order approving the Plan. The Plan will become effective after the conditions to its effectiveness have been satisfied. The effect of the Plan is to de-lever the Company’s balance sheet through a conversion into equity or warrants or both of 1) a portion of the $350 million in first-lien term loans that mature in June 2023; 2) $121 million in second-lien term loans that mature in February 2025; 3) $224 million outstanding under our 2020 senior notes indenture, and; 4) $450 million outstanding under our 2021 senior notes indenture. The holders of first-lien term loans will also receive their pro rata portion of the second-lien term loans issued as part of the Exit Financings. All pre-petition equity interests in the Company will be cancelled, released, and extinguished on the effective date of the Plan, and will thereafter be of no further force or effect.
Holders of other claims will either receive payment in full in cash or otherwise have their rights reinstated under the Bankruptcy Code, or such claims will be cancelled, released, discharged, and extinguished or be given such other treatment as set forth in the Plan. In addition, upon emergence from the Chapter 11 Cases, pursuant to a rights offering of shares of the Company’s new common stock, or the Rights Offering, the Company will receive from certain pre-petition secured and unsecured creditors an equity investment of $100 million. Additionally, the Company will enter into a new
F - 8
first-lien term loan in an aggregate principal amount to determined in accordance with the Plan and will have a maturity date on the fourth anniversary of the Closing date. The Company will also enter into a new second-lien term loan in an aggregate principal amount determined in accordance with the Plan and a maturity date of March 31, 2026.
The Company anticipates emerging from the Chapter 11 Cases upon receipt of certain governmental approvals from U.S. and other governmental authorities. The Company expects to receive the required approvals promptly following the completion by such governmental authorities of their reviews. In addition, the Company will be required to finalize the terms of the Exit Financings prior to emergence.
DIP Credit Agreement
In connection with the filing of the Plan, on May 22, 2020, the Debtors entered into a debtor-in-possession credit agreement on the terms set forth in a Superpriority Debtor-in-Possession Term Loan Agreement, or the DIP Credit Agreement, by and among the Company, as Parent Borrower, Hornbeck Offshore Services, LLC, as Co-Borrower, the lenders party thereto, or the DIP Lenders, and Wilmington Trust, National Association, as Administrative Agent and Collateral Agent, pursuant to which, the DIP Lenders agreed to provide us with loans in an aggregate principal amount not to exceed $75 million that, among other things, was used to repay in full $50 million in loans outstanding under our Senior Credit Agreement on May 22, 2020, and to finance our ongoing general corporate needs during the course of the Chapter 11 Cases.
The maturity date of the DIP Credit Agreement is six months following the effective date of the DIP Credit Agreement. The DIP Credit Agreement contains customary events of default, including events related to the Chapter 11 Cases, the occurrence of which could result in the acceleration of our obligation to repay the outstanding indebtedness under the DIP Credit Agreement. Our obligations under the DIP Credit Agreement are secured by a first priority security interest in, and lien on, substantially all of our present and after-acquired property (whether tangible, intangible, real, personal or mixed) and has been guaranteed by all of the Company’s material subsidiaries. As of June 30, 2020, the Company has $75 million outstanding under the DIP Credit Agreement.
Going Concern
Since the second half of 2014, the offshore oil service sector has experienced difficult operating conditions due to the reduced price of oil. This low oil price environment caused many of the Company's customers to reduce their budgets for the worldwide exploration or production of oil. This reduced spending has negatively impacted the Company's financial results. There is significant uncertainty surrounding when and by how much oil prices will recover, and whether that recovery will result in increased demand for the Company's services. As discussed in Note 9, the Company’s 2020 senior notes had scheduled maturities in April 2020 and the Company’s 2021 senior notes have scheduled maturities in March 2021. Despite our extensive efforts to negotiate and launch an out-of-court debt-for-debt exchange transaction, after the advent of the COVID-19 pandemic and the oil price war in March 2020, it became evident that an in-court process would be necessary to maximize value for us and our stakeholders while positioning us for long-term success.
On May 19, 2020, the Company sought voluntary relief under chapter 11 of the United States Bankruptcy Code in the Bankruptcy Court and filed a proposed joint prepackaged plan of reorganization. As a result of its financial condition, the defaults under our credit agreements and the uncertainties surrounding the Chapter 11 Cases, substantial doubt exists regarding our ability to continue as a going concern. On June 19, 2020, the Bankruptcy Court issued a confirmation order approving the Plan, which remains subject to consummation.
The accompanying consolidated financial statements have been prepared assuming the Company will continue as a going concern, which contemplates continuity of operations, realization of assets and the satisfaction of liabilities in the normal course of business for the twelve-month period following the date of these consolidated financial statements. As such, the accompanying consolidated financial statements do not include any adjustments relating to the recoverability and classification of assets and their carrying amounts, or the amount and classification of liabilities that may result should the Company be unable to continue as a going concern.
F - 9
HORNBECK OFFSHORE SERVICES, INC. AND SUBSIDIARIES
NOTES TO CONSOLIDATED FINANCIAL STATEMENTS—(Continued)
3. Summary of Significant Accounting Policies
Revenue Recognition
The services that are provided by the Company represent a single performance obligation under its contracts that are satisfied at a point in time or over time. Revenues are earned primarily by (1) chartering the Company's vessels, including the operation of such vessels, (2) providing vessel management services to third party vessel owners, and (3) providing shore-based port facility services.
Cash and Cash Equivalents
Cash and cash equivalents consist of all highly liquid investments in money market funds, deposits and investments available for current use with an initial maturity of three months or less.
Restricted Cash
The company considers cash as restricted when there are contractual agreements that govern the use or withdrawal of the funds.
Accounts Receivable
Accounts receivable consists of trade receivables, net of reserves and amounts to be rebilled to customers.
Property, Plant and Equipment
Property, plant and equipment is recorded at cost. Depreciation and amortization of equipment and leasehold improvements are computed using the straight-line method based on the estimated useful lives of the related assets. Major modifications and improvements, which extend the useful life or functional operating capability of the vessel, are capitalized and amortized over the remaining useful life of the vessel. Gains and losses from retirements or other dispositions are recognized as incurred. Salvage values for new generation marine equipment are estimated to be 25% of the originally recorded cost.
The estimated useful lives by classification are as follows:
Offshore supply vessels | 25 years | |
Multi-purpose support vessels | 25 years | |
Non-vessel related property, plant and equipment | 3-28 years | |
See Asset Impairment Assessment below for more information.
Deferred Charges
The Company’s vessels are required by regulation to be recertified after certain periods of time. The Company defers the drydocking expenditures incurred due to regulatory marine inspections and amortizes the costs on a straight-line basis over the period to be benefited from such expenditures (typically between 24 and 36 months). Financing charges are amortized over the term of the related debt.
Prior to the Adoption of ASC 842, Leases, on January 1, 2019, Deferred charges also included prepaid lease expenses related to the Company’s shore-base port facility. Such prepaid lease expenses were amortized on a straight-line basis over the effective remaining term of the lease.
Mobilization Costs
The Company incurs mobilization costs to transit its vessels to and from certain regions and/or for long-term contracts. These costs, which are typically expensed as incurred, include, but are not limited to, fuel, crew wages, vessel modification and pre-positioning expenses, materials and supplies and importation taxes.
F - 10
HORNBECK OFFSHORE SERVICES, INC. AND SUBSIDIARIES
NOTES TO CONSOLIDATED FINANCIAL STATEMENTS—(Continued)
Income Taxes
Deferred tax assets and liabilities are recognized for the future tax consequences attributable to differences between the financial statement carrying amounts of existing assets and liabilities and their respective tax bases. Deferred tax assets and liabilities are measured using currently enacted tax rates. The effect on deferred tax assets and liabilities of a change in tax rates is recognized in income in the period that includes the enactment date. The provision for income taxes includes provisions for federal, state and foreign income taxes. Interest and penalties relating to uncertain tax positions are recorded as general and administrative expenses. In addition, the Company provides a valuation allowance for deferred tax assets if it is more likely than not that such items will either expire before the Company is able to realize the benefit or the future deductibility is uncertain. For the three-year period ended December 31, 2019, the Company has a cumulative pre-tax loss, which limits its ability to consider other subjective evidence, such as the Company’s projections of future earnings. As of December 31, 2019, the Company determined it is more likely than not that a portion of deferred tax assets may not be utilized prior to their expiration and therefore has established a valuation allowance of $33.3 million recorded against its deferred tax assets.
Use of Estimates
The preparation of financial statements in conformity with United States generally accepted accounting principles requires management to make estimates and assumptions that affect the amounts reported in the financial statements and accompanying notes. Actual results could differ from those estimates.
Legal Liabilities
In the ordinary course of business, the Company may become party to lawsuits, administrative proceedings, or governmental investigations. These matters may involve large or unspecified damages or penalties that may be sought from the Company and may require years to resolve. The Company records a liability related to a loss contingency to such legal matters in accrued liabilities if the Company determines the loss to be both probable and estimable. The liability is recorded for an amount that is management’s best estimate of the loss, or when a best estimate cannot be made, the minimum loss amount of a range of possible outcomes. Significant judgment is required in estimating such liabilities, the results of which can vary significantly from the actual outcomes of lawsuits, administrative proceedings or governmental investigations.
Concentration of Credit Risk
Customers are primarily major and independent, domestic and international, oil and oil service companies, as well as national oil companies and the U.S. military. The Company’s customers are granted credit on a short-term basis and related credit risks are considered minimal. The Company usually does not require collateral. The Company provides an estimate for uncollectible accounts based primarily on management’s judgment using the relative age of customer balances, historical losses, current economic conditions and individual evaluations of each customer to make adjustments to the allowance for doubtful accounts.
The following table represents the allowance for doubtful accounts (in thousands):
December 31, | |||||||
2019 | 2018 | ||||||
Balance, beginning of year | $ | 1,123 | $ | 6,054 | |||
Changes to provision | 2,864 | (156 | ) | ||||
Write-offs | — | (4,775 | ) | ||||
Balance, end of year | $ | 3,987 | $ | 1,123 | |||
Foreign Currency Transaction Gains and Losses
Foreign currency transaction gains and losses are recorded in the period incurred except for advances to and investments in foreign subsidiaries. Foreign currency gains and losses related to advances to or investments in foreign
F - 11
HORNBECK OFFSHORE SERVICES, INC. AND SUBSIDIARIES
NOTES TO CONSOLIDATED FINANCIAL STATEMENTS—(Continued)
operations are accounted for as a foreign currency translation adjustment and recorded as other comprehensive income. Foreign currency transaction adjustments for 2019 and 2018 were not material to the financial statements. The balance in accumulated other comprehensive income (loss) as of December 31, 2019 and 2018 relates primarily to the Company’s long term investments in its foreign subsidiaries.
Asset Impairment Assessment
In accordance with ASC 360, the Company periodically reviews long-lived asset valuations when events or changes in circumstances indicate that an asset’s carrying value may not be recoverable. If indicators of impairment exist, the Company assesses the recoverability of its long-lived assets by comparing the projected future undiscounted cash flows associated with the related long-lived asset group over their remaining estimated useful lives. If the sum of the estimated undiscounted cash flows are less than the carrying amounts of the asset group, the assets are written down to their estimated fair values based on the expected discounted future cash flows or appraised values attributable to the assets. The future cash flows are subjective and are based on the Company’s current assumptions regarding future dayrates, utilization, operating expense, direct overhead, including G&A expense, and recertification costs that could differ from actual results.
During the second quarter of 2016, the Company determined that it observed indicators of impairment related to its vessels. This resulted from the rapid deterioration of its second quarter 2016 operating results, as well as the uncertainty regarding future market conditions and the related impact on the Company's projected operating results. For the purpose of calculating the undiscounted cash flows, the Company grouped its vessels into two groups, OSVs and MPSVs, and used a probability-weighted undiscounted cash flow projection to test for recoverability. If events or changes in circumstances as set forth above were to indicate that the asset group’s carrying amount may not be recoverable over the vessels' useful lives for such groups, we would then be required to estimate the future undiscounted cash flows expected to result from the use of the asset group and its eventual disposition. If the sum of the expected future undiscounted cash flows was determined to be less than the carrying amount of the vessels, we would be required to reduce the carrying amount to fair value. Included in the cash flow projections were assumptions related to the current mix of active and stacked vessels, the timing of stacked vessels returning to active status along with projected dayrates, operating expenses and overhead expenses related to each of the groupings.
While the Company has not observed any new impairment indicators since 2016, it has reviewed and updated, as necessary, the assumptions used in determining its undiscounted cash flow projections for each asset group to reflect prevailing market conditions. After reviewing the results of these projections, which were last updated in 2019, the Company determined that each of its asset groups continue to have sufficient projected undiscounted cash flows to recover the remaining book value of the Company's long-lived assets within such group.
F - 12
HORNBECK OFFSHORE SERVICES, INC. AND SUBSIDIARIES
NOTES TO CONSOLIDATED FINANCIAL STATEMENTS—(Continued)
Recent Accounting Pronouncements
The following table provides a brief description of recent accounting pronouncements that could have a material effect on the Company's financial statements:
Standard | Description | Date of Adoption | Effect on the financial statements and other significant matters | |||
Standards that have been adopted | ||||||
ASU No. 2016-02, "Leases" (Topic 842) | This standard requires lessees to recognize a lease liability and a right-of-use asset for all leases (with the exception of short-term leases) at the commencement date. ASU 2016-02 requires a modified retrospective application. Early adoption is permitted. | January 1, 2019 | The Company adopted this ASU effective January 1, 2019. See further discussion below and in footnote 13. | |||
ASU No. 2018-02, "Reclassification of Certain Tax Effects from Accumulated Other Comprehensive Income" | This standard allows companies to reclassify items in accumulated other comprehensive income to retained earnings for stranded tax effects resulting from The Tax Cuts and Jobs Act. | January 1, 2019 | The Company adopted ASU No. 2018-02 on January 1, 2019. This adoption had no material impact on its consolidated financial statements. | |||
ASU No. 2018-09, "Codification Improvements" | This standard provides clarification, corrects errors in and makes minor improvements to various ASC topics. Many of the amendments in this update have transition guidance with effective dates for annual periods beginning after December 15, 2018, and some amendments do not require transition guidance and are effective upon issuance of this update. | January 1, 2019 | The Company adopted ASU No. 2018-09 on January 1, 2019. This adoption had no material impact on its consolidated financial statements. | |||
ASU No. 2018-11, "Leases" (Topic 842): Targeted Improvements | This standard provides for the election of transition methods between the modified retrospective method and the optional transition relief method. The modified retrospective method is applied to all prior reporting periods presented with a cumulative-effect adjustment recorded in the earliest comparative period while the optional transition relief method is applied beginning in the period of adoption with a cumulative-effect adjustment recorded in such period. Also, this standard allows lessors to elect to not separate non-lease components from the associated lease components if certain criteria are met. | January 1, 2019 | The Company adopted ASU No. 2018-11 on January 1, 2019. See further discussion below. | |||
Standards that have not been adopted | ||||||
ASU No. 2016-13, "Financial Instruments - Credit Losses (Topic 326): Measurement of Credit Losses on Financial Instruments" | This standard requires measurement and recognition of expected credit losses for financial assets held. ASU No. 2016-13 requires modified retrospective application. Early adoption is permitted. | January 1, 2023 | The Company believes that the implementation of this new guidance will not have a material impact on it consolidated financial statements. | |||
F - 13
HORNBECK OFFSHORE SERVICES, INC. AND SUBSIDIARIES
NOTES TO CONSOLIDATED FINANCIAL STATEMENTS—(Continued)
ASC 842, Leases
Lessee Accounting
In February 2016, the Financial Accounting Standards Board, or the FASB, issued ASU 2016-02, Leases (Topic 842), which requires lessees to recognize a right-of-use, or ROU, asset and a lease obligation for all leases. In July 2018, the FASB issued ASU No. 2018-11, Leases (Topic 842): Targeted Improvements, which simplifies the implementation by allowing entities the option to instead apply the provisions of the new guidance at the effective date, without adjusting the comparative periods presented. The new lease guidance became effective for the Company for its annual reporting period beginning January 1, 2019, including interim periods within that reporting period. The Company adopted the standard using a modified retrospective approach with the effective date of the standard as the date of initial application.
The Company elected the package of practical expedients permitted under the transition guidance within the standard, which eliminates the reassessment of past leases, classification and initial direct costs. For leases with a term of twelve months or less, the Company has made a policy election in which the ROU asset and lease liability will not be recognized on its balance sheet.
As a result of the Company's adoption of this new standard, it recorded ROU assets of $24.7 million and lease liabilities of $27.7 million. The adoption of the standard did not have an impact on the Company's equity and will not have a material impact on the Company's results of operations and cash flows.
Lessor Accounting
Under ASU 2018-11, a lessor may elect to combine lease and non-lease components provided that the non-lease component(s) otherwise would be accounted for under the new revenue guidance in ASC 606 and both of the following conditions are met:
• | The timing and pattern of transfer for the lease component are the same as those for the non-lease components associated with that lease component. |
• | The lease component, if accounted for separately, would be classified as an operating lease. |
When the above conditions are met, the entity will need to assess predominance. If the non-lease components are predominant, the entity accounts for the combined component under ASC 606; otherwise, the entity accounts for the combined component under ASC 842.
After review of its revenue streams, the Company has concluded that the non-lease component of its revenue is predominant, and that both of the above criteria are met. Therefore, the Company has adopted the new transition options and combines lease and non-lease revenues. The Company recognizes revenue based on the non-lease component under ASC 606, as it has concluded that the non-lease component is the predominant component. The adoption of ASU 2018-11 on January 1, 2019 did not change the timing or amounts of revenues recognized by the Company.
4. Revenues from Contracts with Customers
Effective January 1, 2018, the Company adopted ASU 2014-09, Revenue from Contracts with Customers (Topic 606) using the modified retrospective method. The adoption of this standard did not have a material impact on the Company's financial position or results of operations. Accordingly, the Company did not make an adjustment to the opening balance of retained earnings in order to account for the implementation of the new requirements of this standard, and it did not restate prior period information for the effects of the new standard.
The services that are provided by the Company represent a single performance obligation under its contracts that are satisfied at a point in time or over time. Revenues are earned primarily by (1) chartering the Company's vessels, including the operation of such vessels, (2) providing vessel management services to third party vessel owners, and (3) providing
F - 14
HORNBECK OFFSHORE SERVICES, INC. AND SUBSIDIARIES
NOTES TO CONSOLIDATED FINANCIAL STATEMENTS—(Continued)
shore-based port facility services, including rental of land. The services generating these revenue streams are provided to customers based on contracts that include fixed or determinable prices and do not generally include right of return or other significant post-delivery obligations. The Company's vessel revenues, vessel management revenues and port facility revenues are recognized either at a point in time or over the passage of time when the customer has received or is receiving the benefit from the applicable service. Revenues are recognized when the performance obligations are satisfied in accordance with contractual terms and in an amount that reflects the consideration that the Company expects to be entitled to in exchange for the services rendered or rentals provided. Revenues are recognized net of any taxes collected from customers, which are subsequently remitted to governmental authorities. Invoices are typically billed to customers on a monthly basis and payment terms on customer invoices typically range 30 to 60 days.
A performance obligation under contracts with the Company's customers to render services is the unit of account under Topic 606. The Company accounts for services rendered separately if they are distinct and the service is separately identifiable from other items provided to a customer and if a customer can benefit from the services rendered provided on its own or with other resources that are readily available to the customer. A contract's transaction price is allocated to each distinct performance obligation and recognized as revenue when, or as, the performance obligation is satisfied.
As of December 31, 2019, the Company has certain remaining performance obligations representing contracted vessel revenues for which work has not been performed and such contracts have an original expected duration of more than one year. As of December 31, 2019, the aggregate amount of the transaction price allocated to remaining performance obligations for such contracts was $8.4 million, of which $5.8 million and $2.6 million are expected to be recognized in 2020 and 2021, respectively. The Company has elected to apply the optional exemption for the disclosure of the remaining performance obligations for any of its revenue streams that are expected to have a duration of one year or less and, therefore, such amounts have not been disclosed.
Disaggregation of Revenues
The Company recognized revenues as follows (in thousands):
Year Ended December 31, | |||||||
2019 | 2018 | ||||||
Vessel revenues | $ | 188,319 | $ | 175,767 | |||
Vessel management revenues | 35,390 | 33,065 | |||||
Shore-based facility revenues | 1,953 | 3,572 | |||||
$ | 225,662 | $ | 212,404 | ||||
F - 15
HORNBECK OFFSHORE SERVICES, INC. AND SUBSIDIARIES
NOTES TO CONSOLIDATED FINANCIAL STATEMENTS—(Continued)
5. Loss Per Share
Basic loss per common share was calculated by dividing net loss by the weighted average number of common shares outstanding during the period. Diluted loss per common share was calculated by dividing net loss by the weighted average number of common shares outstanding during the year plus the effect of dilutive stock options and restricted stock unit awards. Weighted average number of common shares outstanding was calculated by using the sum of the shares determined on a daily basis divided by the number of days in the period. The table below reconciles the Company’s earnings per share (in thousands, except for per share data):
Year Ended December 31, | |||||||
2019 | 2018 | ||||||
Net Loss | $ | (138,814 | ) | $ | (119,123 | ) | |
Weighted average number of shares of common stock outstanding | 37,914 | 37,508 | |||||
Add: Net effect of dilutive stock options and unvested restricted stock (1)(2)(3) | — | — | |||||
Weighted average number of dilutive shares of common stock outstanding | 37,914 | 37,508 | |||||
Loss per common share: | |||||||
Basic loss per common share | $ | (3.66 | ) | $ | (3.18 | ) | |
Diluted loss per common share | $ | (3.66 | ) | $ | (3.18 | ) | |
(1) | Due to a net loss, the Company excluded from the calculation of loss per share the effect of equity awards representing the rights to acquire 5,626 and 583 shares of common stock for the years ended December 31, 2019 and 2018, respectively. |
(2) | For the year ended December 31, 2018, the 2019 convertible senior notes issued in August 2012 were not dilutive, as the average price of the Company’s stock was less than the effective conversion price of such notes. In September 2019, the Company repaid the remaining balance of the 2019 convertible senior notes in full upon their maturity. See Note 9 for further discussion. It was the Company's stated intention to redeem the principal amount of its 2019 convertible senior notes in cash and the Company used the treasury method for determining potential dilution in the diluted earnings per share computation. |
(3) | Dilutive unvested restricted stock units are expected to fluctuate from quarter to quarter depending on the Company’s performance compared to a predetermined set of performance criteria. See Note 11 to these financial statements for further information regarding certain of the Company’s restricted stock grants. |
6. Defined Contribution Plan
The Company offers a 401(k) plan to all full-time employees. Employees must be at least eighteen years of age and have completed three months of service to be eligible for participation. Participants may elect to defer up to 60% of their compensation, subject to certain statutorily established limits. The Company may elect to make annual matching and profit sharing contributions to the 401(k) plan. In response to weak market conditions, the Company ceased matching contributions to the 401(k) plan and did not match any contributions between December 31, 2014 and December 31, 2019. In January 2020, the Company made a discretionary match of employee contributions to the 401(k) plan.
7. Property, Plant and Equipment
Property, plant and equipment consisted of the following (in thousands):
December 31, | |||||||
2019 | 2018 | ||||||
Offshore supply vessels and multi-purpose support vessels | $ | 2,851,290 | $ | 2,851,872 | |||
Non-vessel related property, plant and equipment | 133,647 | 133,564 | |||||
Less: Accumulated depreciation | (833,226 | ) | (735,063 | ) | |||
2,151,711 | 2,250,373 | ||||||
Construction in progress | 191,052 | 184,456 | |||||
$ | 2,342,763 | $ | 2,434,829 | ||||
F - 16
HORNBECK OFFSHORE SERVICES, INC. AND SUBSIDIARIES
NOTES TO CONSOLIDATED FINANCIAL STATEMENTS—(Continued)
Vessel Construction
During the first quarter of 2018, the Company notified the shipyard that was constructing the remaining two vessels in the Company's fifth OSV newbuild program that it was terminating the construction contracts for such vessels based on the shipyard's statements that it would be more than one year late in the delivery of the vessels, among other reasons. On October 2, 2018, the shipyard filed suit against the Company in the 22nd Judicial District Court for the Parish of St. Tammany in the State of Louisiana, or the Gulf Island Litigation. The shipyard claims that the Company's termination was improper and that the shipyard should be permitted to complete construction of the vessels. Alternatively, the shipyard asserts that if the termination was proper, the Company would owe the shipyard compensation for unpaid work. The Company has responded to the suit and has alleged counter-claims. The Company intends to vigorously defend against the shipyard’s claims and considers them to be without merit. The shipyard has frustrated the Company's ability to complete the vessels at a replacement shipyard by asserting that it has possessory rights over the vessels. The Company disputes these asserted possessory rights and believes that the detention of the vessels, over which the Company has title, is wrongful. On November 5, 2019, the district court denied a preliminary motion for summary judgment to require the shipyard to release its possession of the vessels, which may delay further the ability to complete the vessels at a completion shipyard. Because of the shipyard's detention of the vessels, the timeframe in which the vessels can be completed at a replacement shipyard is also uncertain. The Company received performance bonds from sureties with respect to the vessel construction contracts in dispute. The sureties have denied the Company's claim under the bonds, but did authorize the Company to select a completion yard and, subject to a reservation of rights, offered to fund the cost to complete the vessels in excess of their contract price of up to the full amount of the performance bond. The Company rejected the sureties' conditional and non-conforming offer.
As of the date of termination of the construction contracts, these two remaining vessels, both of which are domestic 400 class MPSVs, were projected to be delivered in the second and third quarters of 2019, respectively. These projected delivery dates were subsequently amended, for guidance purposes, to be the second and third quarters of 2020; and then later extended to be the second and third quarters of 2021. Due to the continued uncertainty of the timing and location of future construction activities, the Company has now updated its forward guidance for the delivery dates related to these vessels to be the second and third quarters of 2022, respectively. However, the timing of the remaining construction draws remains subject to change commensurate with any potential further delays in the delivery dates of such vessels. The cost of this nearly completed 24-vessel newbuild program, before construction period interest, is expected to be approximately $1,335.0 million, of which $22.9 million and $34.6 million is currently expected to be incurred in 2021 and 2022, respectively. The foregoing amounts do not reflect any potential additional payments to the shipyard in respect of the aforementioned claim. From the inception of this program through December 31, 2019, the Company had incurred construction costs of approximately $1,277.5 million, or 95.7%, of total expected project costs. During 2019, the Company incurred $3.3 million of project costs related to these vessels.
Shipyard Arbitration Settlement
On January 22, 2016, the Company initiated an arbitration demand in accordance with the vessel construction agreement dated November 14, 2011 with VT Halter Marine, Inc., or Halter, to construct ten 300 class OSVs as part of the Company’s fifth OSV newbuild program. In October 2019, the arbitration panel awarded damages in the amount of $18.0 million related to the Company’s claims, offset by $2.1 million awarded to Halter for its counterclaims. In December 2019, the Company collected a net award of $15.4 million, which was reduced as a result of negotiations between the parties for the execution of a timely payment.
8. Acquisition of Vessels
On May 18, 2018, the Company completed the acquisition of four high-spec Jones Act-qualified OSVs and related equipment from Aries Marine Corporation and certain of its affiliates for $40.9 million in cash, inclusive of $4.0 million related to a non-compete intangible asset that is being amortized over the life of such asset, or two years. Also included in this transaction was the cost of fuel and lube inventory and transactions fees. The acquired vessels were all U.S.-flagged and are comprised of two 300 class OSVs and two 280 class OSVs. Subsequent to the acquisition, these four vessels have been foreign-flagged. The Company determined that substantially all of the fair value of the assets acquired are concentrated in a group of similar identifiable assets and, therefore, has accounted for such transaction as an asset acquisition under ASU 2017-01.
F - 17
HORNBECK OFFSHORE SERVICES, INC. AND SUBSIDIARIES
NOTES TO CONSOLIDATED FINANCIAL STATEMENTS—(Continued)
9. Long-Term Debt Including Current Maturities
In 2020, the Company experienced multiple events of defaults under the existing 2020 senior notes and 2021 senior notes, which included non-payment of principal and interest on the 2020 senior notes, nonpayment of interest on the 2021 senior notes and related cross-defaults. Cross-defaults were also triggered under the Company’s existing senior credit agreement, first lien term loan agreement and second lien term loan agreement. The Company, together with the administrative agents and certain of its lenders under its existing senior credit agreement, first lien term loan agreement and second lien term loan agreement, and certain holders of the Company’s 2020 senior notes and 2021 senior notes entered into separate forbearance agreements, which were subsequently extended to May 19, 2020 pursuant to which such lenders and noteholders agreed to forbear from exercising certain of their rights and remedies with respect to certain defaults by the Company. On May 19, 2020, the Company sought voluntary relief under chapter 11 of the United States Bankruptcy Code, or the Chapter 11 Cases, in the Bankruptcy Court and filed a proposed joint prepackaged plan of reorganization, or the Plan. On June 19, 2020, after a confirmation hearing, the Bankruptcy Court entered a confirmation order approving the Plan.
As of the dates indicated below, the Company had the following outstanding long-term debt (in thousands):
December 31, | |||||||
2019 | 2018 | ||||||
5.875% senior notes due 2020, net of deferred financing costs of $262 and $1,162 | $ | 224,051 | $ | 365,780 | |||
5.000% senior notes due 2021, net of deferred financing costs of $1,203 and $2,173 | 448,797 | 447,827 | |||||
1.500% convertible senior notes due 2019, net of original issue discount of $0 and $2,725 and deferred financing costs of $0 and $611 | — | 96,311 | |||||
First-lien term loans due 2023, including deferred gain of $13,040 and $15,845, and net of original issue discount of $3,084 and $3,013, and deferred financing costs of $3,256 and $2,814 | 356,700 | 310,018 | |||||
Second-lien term loans due 2025, including deferred gain of $18,678 | 139,913 | — | |||||
Senior credit facility, net of deferred financing costs of $5,571 | 94,429 | — | |||||
1,263,890 | 1,219,936 | ||||||
Less current maturities1 | (1,263,890 | ) | (96,311 | ) | |||
$ | — | $ | 1,123,625 | ||||
(1) | On March 2, 2020, the Company did not make the interest payment on the 2021 senior notes that was due on such date. As a result of this and cross-default language in its remaining debt obligations, the Company has determined that all of its debt should be presented as current. |
The table below summarizes the Company's cash interest payments (in thousands):
Cash Interest Payments | Payment Dates | ||||
5.875% senior notes due 2020 | $ | 6,589 | April 1 and October 1 | ||
5.000% senior notes due 2021 | 11,250 | (1) | March 1 and September 1 | ||
First-lien term loans due 2023 | 2,652 | Variable Monthly (2) | |||
Second-lien term loans due 2025 | 2,879 | January 31, April 30, July 31, and October 31 | |||
Senior credit facility | 578 | Variable Monthly (3) | |||
(1) | An interest payment on the 2021 senior notes in the amount of $11,250 was due on March 2, 2020, but the Company did not make such interest payment. |
(2) | The interest rate on the first-lien term loans is variable based on the Company's election. The amount reflected in this table is the monthly amount payable based on the 30-day LIBOR interest rate that was elected and in effect on December 31, 2019 plus an applicable margin, which is currently 7.00%. Please see further discussion of the variable interest rate below. |
(3) | The interest rate on the senior credit facility is variable based on the 30-day LIBOR interest rate plus a 5.00% margin. The amount reflected in this table is the monthly amount payable based on the 30-day LIBOR interest rate that was in effect on December 31, 2019. Please see further discussion of the variable interest rate below. |
F - 18
HORNBECK OFFSHORE SERVICES, INC. AND SUBSIDIARIES
NOTES TO CONSOLIDATED FINANCIAL STATEMENTS—(Continued)
Senior Credit Facility
On June 28, 2019, the Company entered into a $100.0 million senior secured asset-based revolving credit facility, or the senior credit facility, under a Senior Credit Agreement by and among the Company, as Borrower, certain of the Company’s subsidiaries, as guarantors, certain lenders, and CIT Northbridge Credit LLC, or CIT, as Administrative Agent and Collateral Agent for the lenders (as amended or otherwise modified from time to time, the Senior Credit Agreement). The senior credit facility is guaranteed by certain of the Company's domestic and foreign subsidiaries and contains customary representations and warranties, covenants and events of default. The fully-funded senior credit facility was secured by first-priority liens on receivables, certain restricted and unrestricted cash accounts and related assets. The senior credit facility was comprised of two tranches that rebalanced each month based on the variable receivable-backed borrowing base. The unrestricted receivables-backed tranche was scheduled to mature in 2022, whereas the restricted cash-backed tranche was scheduled to mature in 2025. The receivables-backed tranche was available for use, subject to the completion of applicable eligibility review procedures, for working capital and general corporate purposes, including the refinancing or repayment of existing debt, subject to, among other things, compliance with certain requirements. The cash-backed tranche was permitted, over time, to rebalance to the receivables-backed tranche as eligible receivables increased. Borrowings under the senior credit facility accrued interest at a floating-rate LIBOR plus a fixed spread of 5.00% for the life of the facility.
On December 31, 2019, the Company's restricted cash balance under the senior credit facility was $52.1 million. The Company classifies cash as restricted when there are legal or contractual restrictions on its withdrawal or usage.
On February 29, 2020, the Company made a cash payment of $50 million out of its restricted cash to fully satisfy CIT’s share of the existing obligations under the Senior Credit Agreement. On May 22, 2020, with proceeds from the DIP Credit Agreement, the remaining $50 million in principal amount was paid in full.
First-Lien Term Loans
On June 15, 2017, the Company entered into the first-lien term loan agreement (as amended, amended and restated, supplemented or otherwise modified from time to time, the First Lien Term Loan Agreement), by and among the Company, as Parent Borrower, Hornbeck Offshore Services, LLC, or HOS, as Co-Borrower, certain holders of the Company’s then outstanding notes, or the First-Lien Initial Lenders, and Wilmington Trust, National Association, as Administrative Agent and Collateral Agent for the lenders that initially provided for $300 million of first-lien delayed-draw term loans, or the first-lien term loans. On March 1, 2019, the Company entered into Incremental First Lien Term Loan Joinder Agreements with such parties, including certain existing as well as additional lenders, to borrow an additional $50.0 million of first-lien term loans, or the incremental first-lien term loans, under the First Lien Term Loan Agreement, including approximately $30.1 million in cash of new financing. On March 1, 2019, the Company exchanged approximately $21.0 million in face value of its 2019 convertible senior notes in a privately negotiated debt-for-debt exchange for the remaining approximately $19.9 million of incremental first-lien term loans. In accordance with applicable accounting guidance, this debt-for-debt exchange was accounted for as a debt modification. As a result, the Company recorded a loss on early extinguishment of debt of $1.3 million ($1.1 million or $0.03 per diluted share after-tax) due to deal costs associated with the exchange. The incremental first-lien term loans have the same terms applicable to the first-lien term loans originally issued under the existing First Lien Term Loan Agreement.
The first-lien term loans are guaranteed by certain of the Company's domestic and foreign subsidiaries and are collateralized on a first-lien basis by certain deposit and securities accounts, 45 domestic high-spec OSVs and MPSVs and ten foreign high-spec OSVs, including a security interest in two pending MPSV newbuilds, and associated personalty, as well as by second-priority liens on receivables, certain unrestricted cash accounts and related assets that secure the senior credit facility on a first-lien basis.
Borrowings accrue interest, at the Company’s option, at either:
• | an adjusted London Interbank Offered Rate (subject to a 1.00% floor) plus (a) 6.00% during the first year of the first-lien term loans, (b) 6.50% during the second year of the first-lien term loans, (c) 7.00% during the third year of the first-lien term loans, (d) 7.25% during the fourth year of the first-lien term loans, and (e) 7.50% thereafter; or |
F - 19
HORNBECK OFFSHORE SERVICES, INC. AND SUBSIDIARIES
NOTES TO CONSOLIDATED FINANCIAL STATEMENTS—(Continued)
• | the greatest of (a) the prime rate announced by The Wall Street Journal, (b) the Federal Funds Effective Rate in effect on such day plus 1/2 of 1%, and (c) the London Interbank Offered Rate plus, 1%, plus, for either (a), (b), or (c), a margin of (i) 5.00% during the first year of the first-lien term loans, (ii) 5.50% during the second year of the first-lien term loans, (iii) 6.00% during the third year of the first-lien term loans, (iv) 6.25% during the fourth year of the first-lien term loans, and (v) 6.50% thereafter. |
Second-Lien Term Loans
In February and March 2019, the Company completed two private offers and exchanged an aggregate of $142.6 million in face value of its 2020 senior notes for $121.2 million of second-lien term loans due 2025, or second-lien term loans, of the Company and the Co-Borrower. In accordance with applicable accounting guidance, this debt-for-debt exchange was accounted for as a debt modification. As a result, the Company recorded a loss on early extinguishment of debt of $2.4 million ($1.9 million or $0.05 per diluted share after-tax) primarily related to deal costs associated with the exchange. As contemplated by and provided for under the agreement governing the first-lien term loans, the second-lien term loans were made pursuant to a Second Lien Term Loan Agreement entered into by the Company, the Co-Borrower, the lenders party thereto and the Administrative Agent and Collateral Agent. The second-lien term loans have a maturity date of February 7, 2025 and bear interest at a fixed rate per annum of 9.50%. The second-lien term loans are guaranteed by certain of the Company’s domestic and foreign subsidiaries and are collateralized on a second-lien basis, subject to certain permitted liens, by a second-priority interest in the same collateral securing the Company’s first-lien term loans on a first-lien basis and third priority liens on receivables, certain unrestricted cash accounts and related assets that secure the senior credit facility on a first-lien basis.
Convertible Note Repurchases and Repayment
During 2019, the Company completed a series of private transactions for the repurchase of $52.9 million in face value of its outstanding 2019 convertible senior notes for an aggregate total of $47.6 million of cash. The Company recorded a gain on early extinguishment of debt of $3.6 million ($2.9 million or $0.08 per diluted share after-tax), which was comprised of a $5.6 million gain on the repurchase, offset in part by the write-off of $2.0 million of original issue discount, deal costs and unamortized financing costs related to the notes repurchased.
On September 3, 2019, the Company repaid the remaining balance of $25.8 million in face value of its 2019 convertible senior notes in full upon their maturity, plus accrued and unpaid interest thereon, in accordance with the terms of the indenture governing such notes. The retirement of this debt was funded with cash on hand.
The agreements governing the first-lien term loans, second-lien term loans and the senior credit facility and the indentures governing the Company's 2020 senior notes and 2021 senior notes impose certain restrictions on the Company. Such restrictions affect, and in many cases limit or prohibit, among other things, the Company's ability to incur additional indebtedness, make capital expenditures, redeem equity, create liens, sell assets and make dividend or other restricted payments.
2020 Senior Notes
On March 2, 2012, the Company issued $375.0 million in aggregate principal amount of 2020 senior notes, governed by an indenture, or the 2012 indenture. The net proceeds to the Company from the offering were approximately $367.4 million, net of transaction costs. The 2020 senior notes have a maturity date of April 1, 2020 and the effective interest rate is 6.08%. No principal payments were scheduled prior to maturity. The 2020 senior notes were issued under and are entitled to the benefits of the 2012 indenture. Concurrently with the closing of the First Lien Term Loan Agreement in 2017, the Company arranged for the repurchase of $8.1 million in face value of its outstanding 2020 senior notes. In February and March 2019, the Company exchanged $142.6 million in face value of its 2020 senior notes for second-lien term loans.
2021 Senior Notes
On March 14, 2013, the Company issued $450.0 million in aggregate principal amount of 2021 senior notes, governed by an indenture, or the 2013 indenture. The net proceeds to the Company from the offering were approximately $442.4 million, net of transaction costs. The 2021 senior notes have a maturity date of March 1, 2021 and the effective interest rate is 5.21%. No principal payments are scheduled prior to maturity. The 2021 senior notes were issued under and are entitled to the benefits of the 2013 indenture.
F - 20
HORNBECK OFFSHORE SERVICES, INC. AND SUBSIDIARIES
NOTES TO CONSOLIDATED FINANCIAL STATEMENTS—(Continued)
The 2020 senior notes and 2021 senior notes are senior unsecured obligations and rank equally in right of payment with other existing and future senior indebtedness and senior in right of payment to any subordinated indebtedness that may be incurred by the Company in the future. Hornbeck Offshore Services, Inc., as the parent company issuer of the 2020 senior notes and the 2021 senior notes, has no independent assets or operations other than its ownership interest in its subsidiaries and affiliates. There are no significant restrictions on the Company’s ability, or the ability of any guarantor, to obtain funds from its subsidiaries by such means as a dividend or loan under the terms of the indenture. The Company may, at its option, redeem all or part of the 2020 senior notes or 2021 senior notes from time to time at specified redemption prices and subject to certain conditions required by the indentures. The Company is permitted under the terms of the indentures to incur additional indebtedness in the future, provided that certain financial conditions set forth in the indentures are satisfied by the Company.
2019 Convertible Senior Notes
On August 13, 2012, the Company issued $300.0 million of 2019 convertible senior notes, with a maturity date of September 1, 2019. Because the 2019 convertible senior notes were considered to be cash convertible debt, the Company separately accounted for the liability and equity components of the 2019 convertible senior notes by allocating the $300.0 million in proceeds from the issuance between the liability component and the embedded conversion option, or the equity component. The allocation was conducted by estimating an interest rate at the time of issuance of the 2019 convertible senior notes for similar debt instruments that did not include an embedded conversion feature. A non-convertible interest rate of 5.75% was used to compute the initial fair value of the liability component of $227.6 million. For purposes of the fair value measurement, the Company determined that the valuation of the 2019 convertible senior notes fell under Level 2 of the fair value hierarchy. The excess of the $300.0 million of proceeds from the issuance of the 2019 convertible senior notes over the $227.6 million initial amount allocated to the liability component, or $72.4 million, was allocated to the embedded conversion option, or equity component. This excess was treated as an imputed original issue discount and was amortized through interest expense, using the effective interest method, over the seven-year term of the 2019 convertible senior notes, which ran through September 1, 2019. The effective interest rate for these notes was 6.23%. See Convertible Note Repurchases and Repayment above for further discussion of repayment of the 2019 convertible senior notes.
The Company estimates the fair value of its 2020 senior notes, 2021 senior notes, the first-lien term loans and the second-lien term loans (and for 2018, the 2019 convertible senior notes) by primarily using quoted market prices. Given the observability of the inputs to these estimates, the Company has assigned a Level 2 of the three-level valuation hierarchy. The interest rate on the senior credit facility is variable and the Company has concluded that face value approximates fair value of such facility as of December 31, 2019. As of the dates indicated below, the Company had long-term debt including current maturities with the following face values, carrying values and fair values (in thousands):
December 31, 2019 (4) | December 31, 2018 | ||||||||||||||||||||||
Face Value | Carrying Value | Fair Value | Face Value | Carrying Value | Fair Value | ||||||||||||||||||
5.875% senior notes due 2020 | $ | 224,313 | $ | 224,051 | $ | 69,503 | $ | 366,942 | $ | 365,780 | $ | 191,727 | |||||||||||
5.000% senior notes due 2021 | 450,000 | 448,797 | 123,748 | 450,000 | 447,827 | 220,500 | |||||||||||||||||
1.500% convertible senior notes due 2019 | — | — | — | 99,647 | 96,311 | 88,125 | |||||||||||||||||
First-lien term loans due 2023 (1) | 350,000 | 356,700 | 341,906 | 300,000 | 310,018 | 295,875 | |||||||||||||||||
Second-lien term loans due 2025 (2) | 121,235 | 139,913 | 66,073 | — | — | — | |||||||||||||||||
Senior credit facility (3) | 100,000 | 94,429 | 100,000 | — | — | — | |||||||||||||||||
$ | 1,245,548 | $ | 1,263,890 | $ | 701,230 | $ | 1,216,589 | $ | 1,219,936 | $ | 796,227 | ||||||||||||
(1) | The carrying value of the first-lien term loans due 2023 includes a deferred gain of $13,040 less original issue discount and deferred financing costs of $6,340. |
(2) | The carrying value of the second-lien term loans due 2025 includes a deferred gain of $18,678. |
(3) | A portion of the senior credit facility was scheduled to mature in 2022 with the balance scheduled to mature in 2025. On February 29, 2020, $50 million of the principal of the senior credit facility was repaid and on May 22, 2020, the remaining $50 million of principal of the senior credit facility was repaid, the latter from the proceeds of the DIP Credit Agreement. |
F - 21
HORNBECK OFFSHORE SERVICES, INC. AND SUBSIDIARIES
NOTES TO CONSOLIDATED FINANCIAL STATEMENTS—(Continued)
(4) | See Note 2 regarding the proposed impact of the Chapter 11 Cases on the Company's long-term debt including current maturities. |
Superpriority Debtor-in-Possession Term Loan Agreement
For information concerning the Superpriority Debtor-in-Possession Term Loan Agreement, see Note 2.
Capitalized Interest
Interest expense excludes capitalized interest related to the construction or conversion of vessels in the approximate amount of $0.0 million, and $2.3 million, for the years ended December 31, 2019, and 2018, respectively.
10. Stockholders’ Equity
Preferred Stock
The Company’s certificate of incorporation authorizes 5.0 million shares of preferred stock. The Board of Directors has the authority to issue preferred stock in one or more series and to fix the rights, preferences, privileges and restrictions thereof, including dividend rights, conversion rights, voting rights, terms of redemption, redemption prices, liquidation preferences and the number of shares constituting any series or the designation of such series, without further vote or action by the Company’s stockholders.
Stockholder Rights Plan
On July 1, 2013, the Company’s Board of Directors implemented a stockholder rights plan establishing one right for each outstanding share of common stock. The rights become exercisable, and transferable apart from the Company’s common stock, 10 business days following a public announcement that a person or group has acquired beneficial ownership of, or has commenced a tender or exchange offer for, 10% or more of the Company’s common stock. This stockholder rights plan is substantially similar to the Company's prior stockholder rights plan that expired on June 17, 2013.
11. Stock-Based Compensation
Incentive Compensation Plan
On June 20, 2019, the Company received stockholder approval to increase the maximum number of shares available under its long-term incentive compensation plan by 7.0 million. The Company’s stock-based incentive compensation plan presently covers a maximum of 11.95 million shares of common stock that allows the Company to grant restricted stock, stock options, stock appreciation rights and fully-vested common stock, to officers, other employees and directors. As a result of the approval to increase the number of shares available under this plan, the Company, which has the sole discretion in determining the method of settlement for awards granted under the plan, now has the ability and intent to settle certain awards using available shares. Accordingly, the classification of and accounting for 5.1 million outstanding phantom stock units, or PSUs, and 1.6 million stock appreciation rights, or SARs, were modified from cash-settled to stock-settled during the second quarter of 2019. These outstanding awards were granted to Company executives in 2017, 2018 and 2019 and to non-executive employees in 2019. After these modifications were completed, the Company has only 0.2 million awards outstanding that will settle in cash on their respective vesting dates. The remaining vesting provisions of the modified awards were not impacted and, therefore, the Company determined the fair value of the awards on the date of the modification was the same as the date prior to the modification. There was no additional compensation expense recognized at the time of modification. As of December 31, 2019, there were 0.7 million shares available for future issuance to employees under the incentive compensation plan. The issuance of shares of common stock under the incentive compensation plan was registered on Form S-8 with the Securities and Exchange Commission. The registration was terminated by the Company on June 18, 2020.
Under the Plan, all of the outstanding awards under the Company's long-term incentive compensation plan will be extinguished on the effective date of the Plan.
F - 22
HORNBECK OFFSHORE SERVICES, INC. AND SUBSIDIARIES
NOTES TO CONSOLIDATED FINANCIAL STATEMENTS—(Continued)
The financial impact of stock-based compensation expense related to the Company’s incentive compensation plan on its operating results are reflected in the table below (in thousands, except for per share data):
Year Ended December 31, | |||||||
2019 | 2018 | ||||||
Income before taxes | $ | 3,590 | $ | 3,692 | |||
Net income | $ | 2,835 | $ | 2,957 | |||
Earnings per common share: | |||||||
Basic | $ | 0.07 | $ | 0.08 | |||
Diluted | $ | 0.07 | $ | 0.08 | |||
Stock Options
The Company is authorized to grant stock options under its incentive compensation plan in which the purchase price of the stock subject to each option is established as the closing price of the Company’s common stock on the date of grant and accordingly is not less than the fair market value of the stock on the date of grant. All options granted expire ten years after the date of grant, have an exercise price equal to or greater than the actual or estimated market price of the Company’s stock on the date of grant, and vest over a three-year period. The Company has not granted stock options to any directors, executive officers or employees since 2011. The Company did not receive any cash proceeds from the exercise of stock options for the years ended December 31, 2019 and 2018, respectively.
The following table represents the Company’s stock option activity for the year ended December 31, 2019 (in thousands, except per share data and years):
Number of Shares | Weighted Average Exercise Price | Weighted- Average Remaining Contractual Term (years) | Aggregate Intrinsic Value | ||||||||||
Options outstanding at January 1, 2019 | 185 | $ | 24.86 | 2.1 | $ | — | |||||||
Grants | — | — | 0 | — | |||||||||
Exercised | — | — | — | — | |||||||||
Forfeited or expired | — | — | n/a | n/a | |||||||||
Options outstanding at December 31, 2019 | 185 | $ | 24.86 | 1.1 | $ | — | |||||||
Exercisable options outstanding at December 31, 2019 | 185 | $ | 24.86 | 1.1 | $ | — | |||||||
The following table represents the Company’s stock option activity for the year ended December 31, 2018 (in thousands, except per share data and years):
Number of Shares | Weighted Average Exercise Price | Weighted- Average Remaining Contractual Term (years) | Aggregate Intrinsic Value | ||||||||||
Options outstanding at January 1, 2018 | 185 | $ | 24.86 | 3.1 | $ | — | |||||||
Grants | — | — | 0 | — | |||||||||
Exercised | — | — | — | — | |||||||||
Forfeited or expired | — | — | n/a | n/a | |||||||||
Options outstanding at December 31, 2018 | 185 | $ | 24.86 | 2.1 | $ | — | |||||||
Exercisable options outstanding at December 31, 2018 | 185 | $ | 24.86 | 2.1 | $ | — | |||||||
F - 23
HORNBECK OFFSHORE SERVICES, INC. AND SUBSIDIARIES
NOTES TO CONSOLIDATED FINANCIAL STATEMENTS—(Continued)
Stock Appreciation Rights
The Company is authorized to grant SARs under its incentive compensation plan. SARs represent the right to receive, upon exercise, a number of shares of Company common stock, cash, or a combination thereof, at the election of the Company, equal to the product of the aggregate number of shares of Company common stock with respect to which the SAR is exercised and the excess of the fair market value of a share of Company common stock as of the date of exercise over the grant price. All SARs granted expire ten years after the date of grant and have an exercise price equal to or greater than the actual or estimated market price of the Company’s stock on the date of grant.
During 2019, the Company granted 1.6 million SARs with an exercise price of $1.38. The SARs vest and become exercisable in three equal annual installments on each of the 1st, 2nd and 3rd anniversaries of the grant date and have a ten-year life. In accordance with ASC 718, the fair value of each SAR granted is estimated on the date granted using the Black-Scholes option-pricing model. As of the grant date, the Company did not have shares available to settle these SARs in shares and, therefore, they were initially accounted for as liability awards.
On June 20, 2019, the Company determined that it could and would settle its outstanding SARs in equity rather than cash and such awards are now accounted for as stock-settled SARs. All of the remaining vesting provisions of the SARs are unchanged. The Company estimated the fair value of each SAR on the modification date using the Black-Scholes option-pricing model. As of the modification date, the fair value for the outstanding SARs was $1.02 per share granted.
The following assumptions were used to value SARs on the modification date:
Expected volatility | 89.1 | % |
Expected life | 6.0 | years |
Risk-free interest rate | 1.9 | % |
Expected dividend yield | — | % |
The risk-free interest rate used to value SARs is based on the U.S. Treasury yield curve in effect at the time of grant with maturity dates that coincide with the expected life of the SARs. The Company used the simplified method under GAAP to determine the expected life, since this is the first time the Company issued SARs. The Company's assumption for volatility is based on its historical volatility calculated on the grant date.
The compensation expense related to SARs, which is amortized over a three-year vesting period, is determined based on the market price of the Company’s stock on the date of grant applied to the total shares that are expected to fully vest using the Black-Scholes model. As of December 31, 2019, the Company had unamortized stock-based compensation expense of $1.0 million, which will be recognized on a straight-line basis over the remaining vesting period, or 1.4 years. In addition, the Company has recorded approximately $0.6 million of compensation expense during the year ended December 31, 2019 associated with the awards.
The following table represents the Company’s SARs activity for the year ended December 31, 2019 (in thousands, except per share data and years):
Number of Shares | Weighted Average Exercise Price | Weighted- Average Remaining Contractual Term (years) | Aggregate Intrinsic Value | ||||||||||
SARs outstanding at January 1, 2019 | — | $ | — | 0 | $ | — | |||||||
Grants | 1,601 | 1.38 | 10.0 | — | |||||||||
Exercised | — | — | — | — | |||||||||
Forfeited or expired | — | — | n/a | n/a | |||||||||
SARs outstanding at December 31, 2019 | 1,601 | $ | 1.38 | 9.2 | $ | — | |||||||
Exercisable SARs outstanding at December 31, 2019 | — | $ | — | 0 | $ | — | |||||||
F - 24
HORNBECK OFFSHORE SERVICES, INC. AND SUBSIDIARIES
NOTES TO CONSOLIDATED FINANCIAL STATEMENTS—(Continued)
Restricted Stock
Equity-Settled Restricted Stock
The Company’s incentive compensation plan allows the Company to issue restricted stock units, with either performance-based or time-based vesting provisions. The Company has granted performance-based restricted stock unit awards, which calculates the shares to be received based on the Company’s achievement of certain internal performance criteria over a three-year period as defined by the restricted stock unit agreement governing such awards. Performance for these types of awards has historically been measured by a number of factors that may differ from year to year, including such examples as the Company achieving a targeted return on invested capital, operating profit margin compared to peers, and safety record. The actual number of shares that could be received by the award recipients for the years in question can range from 0% to 150% of the Company’s base share awards depending on the number and/or extent of performance goals attained by the Company. Compensation expense related to performance-based restricted stock unit awards is recognized over the period the restrictions lapse, from one to three years, based on the market price of the Company's stock on the date of grant applied to the shares that are expected to vest. The compensation expense related to time-based restricted stock unit awards, which is amortized over a one to three-year vesting period, is determined based on the market price of the Company’s stock on the date of grant applied to the total shares that are expected to fully vest. As of December 31, 2019, the Company had unamortized stock-based compensation expense of $3.2 million, which will be recognized on a straight-line basis over the remaining vesting period, or 1.3 years. In addition, the Company has recorded approximately $2.5 million and $1.6 million of compensation expense during the years ended December 31, 2019 and 2018, respectively, associated with restricted stock-based unit awards. As a result of the stockholder approval to increase the number of shares available under its long-term incentive compensation plan, the Company now has the ability to settle certain previously granted PSUs in shares. As such, the value of these awards was determined on the modification date as $1.28 and such expense will not vary in future periods.
The following table summarizes the equity-settled restricted stock unit awards activity during the year ended December 31, 2019 (in thousands, except per share data):
Number of Shares | Weighted Avg. Fair Value Per Share | |||||
Restricted stock unit awards: | ||||||
Restricted stock unit awards as of January 1, 2019 | 388 | $ | 6.73 | |||
Granted during the period | — | — | ||||
Modified from cash to equity-settled | 5,078 | 1.28 | ||||
Change in estimated payout of performance unit awards(1) | 227 | 1.28 | ||||
Cancellations during the period | — | — | ||||
Vested | (250 | ) | 6.52 | |||
Outstanding, as of December 31, 2019 | 5,443 | $ | 1.43 | |||
(1) | Annually the Company reviews the performance compared to pre-determined targets for outstanding performance unit awards. Based on current projections, the Company may increase or decrease the anticipated payout based on its historical operating results and near-term projections. |
F - 25
HORNBECK OFFSHORE SERVICES, INC. AND SUBSIDIARIES
NOTES TO CONSOLIDATED FINANCIAL STATEMENTS—(Continued)
The following table summarizes the equity-settled restricted stock unit awards activity during the year ended December 31, 2018 (in thousands, except per share data):
Number of Shares | Weighted Avg. Fair Value Per Share | |||||
Restricted stock unit awards: | ||||||
Restricted stock unit awards as of January 1, 2018 | 868 | $ | 10.76 | |||
Granted during the period | — | — | ||||
Change in estimated payout of performance unit awards(1) | (6 | ) | 21.84 | |||
Cancellations during the period | (1 | ) | 39.30 | |||
Vested | (473 | ) | 13.91 | |||
Outstanding, as of December 31, 2018 | 388 | $ | 6.73 | |||
(1) | Annually the Company reviews the performance compared to pre-determined targets for outstanding performance unit awards. Based on current projections, the Company may increase or decrease the anticipated payout based on its historical operating results and near-term projections. |
Cash-Settled Restricted Stock
The Company’s incentive compensation plan allows the Company to issue restricted stock units with cash-settled vesting provisions, with either performance-based or time-based vesting provisions. The Company has granted performance-based cash-settled restricted stock unit awards, which calculates the shares to be received based on the Company’s achievement of certain internal performance criteria over a three-year period as defined by the cash-settled restricted stock unit agreement governing such awards. Performance for these types of awards has historically been measured by a number of factors that may differ from year to year, including such examples as the Company achieving a targeted return on invested capital, operating profit margin compared to peers, and safety record. The actual number of shares that could be received by the award recipients for the years in question can range from 0% to 150% of the Company’s base share awards depending on the number and/or extent of performance goals attained by the Company. The compensation expense related to cash-settled restricted stock unit awards is amortized over a vesting period of up to three years, as applicable, and is determined based on the market price of the Company’s stock on the date of grant applied to the total shares that are expected to fully vest. The cash-settled restricted stock units are re-measured quarterly based on the 10-day trailing average stock price of the Company's common stock and are classified as a liability, due to the settlement of these awards in cash. As a result of the stockholder approval to increase the number of shares available under its long-term incentive compensation plan, the Company now has the ability to settle certain previously granted PSUs in shares. As of December 31, 2019, the Company had unamortized cash-settled restricted stock compensation expense of $0.1 million, which will be recognized on a straight-line basis over the remaining vesting period, or 0.9 years. In addition, the Company recorded approximately $0.4 million and $1.6 million of compensation expense during the years ended December 31, 2019 and 2018, respectively, associated with cash-settled restricted stock unit awards.
F - 26
HORNBECK OFFSHORE SERVICES, INC. AND SUBSIDIARIES
NOTES TO CONSOLIDATED FINANCIAL STATEMENTS—(Continued)
The following table summarizes the cash-settled restricted stock unit awards activity during the year ended December 31, 2019 (in thousands, except per share data):
Number of Shares | Weighted Avg. Fair Value Per Share(1) | |||||
Cash-Settled restricted stock unit awards: | ||||||
Cash-settled restricted stock unit awards as of January 1, 2019 | 4,006 | $ | 4.53 | |||
Granted during the period(2) | 2,631 | 1.38 | ||||
Modified from cash to equity-settled | (5,078 | ) | 1.28 | |||
Change in estimated payout of performance unit awards | — | — | ||||
Cancellations during the period | (6 | ) | 2.16 | |||
Vested | (1,392 | ) | 5.20 | |||
Outstanding, as of December 31, 2019 | 161 | $ | 3.81 | |||
(1) | The weighted-average fair value per share is determined by the stock price on the date of grant for time-based shares. |
(2) | Includes only the base shares awarded for both time-based and performance based awards. The performance-based awards have the potential to vest at up to 150% of the aggregate total of the base share awards. |
The following table summarizes the cash-settled restricted stock unit awards activity during the year ended December 31, 2018 (in thousands, except per share data):
Number of Shares | Weighted Avg. Fair Value Per Share(1) | |||||
Cash-Settled restricted stock unit awards: | ||||||
Cash-settled restricted stock unit awards as of January 1, 2018 | 1,788 | $ | 6.70 | |||
Granted during the period(2) | 2,466 | 3.37 | ||||
Change in estimated payout of performance unit awards | 68 | 6.06 | ||||
Cancellations during the period | (2 | ) | 5.85 | |||
Vested | (314 | ) | 8.09 | |||
Outstanding, as of December 31, 2018 | 4,006 | $ | 4.53 | |||
(1) | The weighted-average fair value per share is determined by the stock price on the date of grant for time-based shares. |
(2) | Includes only the base shares awarded for both time-based and performance based awards. The performance-based awards have the potential to vest at up to 150% of the aggregate total of the base share awards. |
Employee Stock Purchase Plan
On May 3, 2005, the Company established the Hornbeck Offshore Services, Inc. 2005 Employee Stock Purchase Plan, or ESPP, which was adopted by the Company’s Board of Directors and approved by the Company’s stockholders. Under the ESPP, the Company is presently authorized to issue up to 2.2 million shares of common stock to eligible employees of the Company and its designated subsidiaries. Employees have the opportunity to purchase shares of the Company’s common stock at semi-annual intervals through accumulated payroll deductions that will be applied to purchase shares of common stock at a discount from the market price as defined by the ESPP. The ESPP is designed to satisfy the requirements of Section 423 of the Internal Revenue Code of 1986, as amended, and thereby allows participating employees to defer recognition of taxes when purchasing the shares of common stock at a 15% discount under the ESPP. The Company had an effective Registration Statement on Form S-8 with the Commission registering the issuance of shares of common stock under the ESPP. The registration was terminated by the Company on June 18, 2020. As of December 31, 2019, there were 0.5 million shares available for future issuance to employees under the
F - 27
HORNBECK OFFSHORE SERVICES, INC. AND SUBSIDIARIES
NOTES TO CONSOLIDATED FINANCIAL STATEMENTS—(Continued)
ESPP. The Company recorded approximately $0.1 million and $0.2 million of compensation expense during the years ended December 31, 2019 and 2018, respectively, associated with the ESPP.
The fair value of the employees’ stock purchase rights granted under the ESPP was estimated using the Black-Scholes model with the following assumptions for the years ended December 31, 2019 and 2018:
2019 | 2018 | ||||||||
Dividend yield | — | % | — | % | |||||
Expected volatility | 112.2 | % | 87.1 | % | |||||
Risk-free interest rate | 1.8 | % | 2.3 | % | |||||
Expected term (months) | 6 | 6 | |||||||
Weighted-average grant-date fair value per share | $ | 0.25 | $ | 0.86 | |||||
F - 28
HORNBECK OFFSHORE SERVICES, INC. AND SUBSIDIARIES
NOTES TO CONSOLIDATED FINANCIAL STATEMENTS—(Continued)
12. Income Taxes
The net long-term deferred tax liabilities in the accompanying consolidated balance sheets include the following components (in thousands):
Year Ended December 31, | |||||||
2019 | 2018 | ||||||
Deferred tax liabilities: | |||||||
Fixed assets | $ | 311,081 | $ | 285,704 | |||
Deferred charges and other liabilities | 9,296 | 3,292 | |||||
Total deferred tax liabilities | 320,377 | 288,996 | |||||
Deferred tax assets: | |||||||
Net operating loss carryforwards | (158,577 | ) | (130,814 | ) | |||
Allowance for doubtful accounts | (897 | ) | (253 | ) | |||
Stock-based compensation expense | (1,068 | ) | (867 | ) | |||
Tax original issue discount and restructuring costs | (14,216 | ) | (6,941 | ) | |||
Right of use liability | (6,114 | ) | — | ||||
Alternative minimum tax credit carryforward | (2,207 | ) | (4,415 | ) | |||
Foreign tax credit carryforward | (15,932 | ) | (18,963 | ) | |||
Interest expense limitation | (16,761 | ) | (4,696 | ) | |||
Other | (5,366 | ) | (5,863 | ) | |||
Total deferred tax assets | (221,138 | ) | (172,812 | ) | |||
Valuation allowance | 33,287 | 52,938 | |||||
Total deferred tax liabilities, net | $ | 132,526 | $ | 169,122 | |||
The components of the income tax expense follow (in thousands):
Year Ended December 31, | |||||||
2019 | 2018 | ||||||
Current tax expense (benefit): | |||||||
U.S. and state | $ | (2,207 | ) | $ | (5,917 | ) | |
Foreign | 1,341 | 1,338 | |||||
Current tax benefit | (866 | ) | (4,579 | ) | |||
Deferred tax expense (benefit): | |||||||
U.S. and state | (36,362 | ) | (25,289 | ) | |||
Foreign | 235 | 247 | |||||
Deferred tax benefit | (36,127 | ) | (25,042 | ) | |||
Total tax benefit | $ | (36,993 | ) | $ | (29,621 | ) | |
F - 29
HORNBECK OFFSHORE SERVICES, INC. AND SUBSIDIARIES
NOTES TO CONSOLIDATED FINANCIAL STATEMENTS—(Continued)
Loss from operations before income taxes, based on jurisdiction earned, was as follows (in thousands):
Year Ended December 31, | |||||||
2019 | 2018 | ||||||
U.S. | $ | (135,310 | ) | $ | (124,879 | ) | |
Foreign | (40,497 | ) | (23,865 | ) | |||
Total loss from operations before income taxes | $ | (175,807 | ) | $ | (148,744 | ) | |
As of December 31, 2019, the Company has net operating loss carryforwards, or NOLs, which can only be utilized if the Company generates taxable income in the respective tax jurisdiction. The following table represents the Company's NOLs (in thousands):
Jurisdiction | December 31, 2019 | Expiration Years | ||
United States | $ | 470,411 | 2031-2037 | |
United States | 178,199 | None | ||
State taxes | 152,706 | 2030-2039 | ||
Mexico | 26,623 | 2026-2029 | ||
Brazil (1) | 15,670 | None | ||
(1) NOLs in Brazil can only be used to offset up to 30% of taxable income each year.
The Company also has foreign tax credit carryforwards of approximately $15.9 million, which if not utilized will expire in 2020 through 2029.
In recording a valuation allowance with respect to such NOLs and foreign tax credits, management assessed the favorable and unfavorable evidence to estimate whether sufficient future taxable income will be generated to permit use of the existing deferred tax assets. A significant piece of the unfavorable evidence evaluated during the fourth quarter of 2019 was the cumulative pre-tax loss that was incurred over the three-year period ended December 31, 2019. Such objective evidence limits the ability to consider other subjective evidence, such as the Company’s projections of future earnings. As of December 31, 2019 and 2018, the Company has valuation allowances of $33.3 million and $52.9 million, respectively, based upon management's conclusion that it is more likely than not that a portion of the Brazil and Mexico NOLs, foreign tax credits, and state NOLs described above may expire unused.
The Company is no longer subject to tax audits by federal, state or local taxing authorities for years prior to 2015. The Company has ongoing examinations by various foreign tax authorities but does not believe that the results of these examinations will have a material adverse effect on the Company’s financial position or results of operations.
The following table reconciles the difference between the Company’s income tax provision calculated at the federal statutory rate of 21% and the actual income tax provision (in thousands):
Year Ended December 31, | |||||||
2019 | 2018 | ||||||
U.S. federal statutory rate | $ | (36,920 | ) | $ | (31,236 | ) | |
State taxes, net | (2,637 | ) | (2,231 | ) | |||
Non-deductible expense | 1,548 | 1,563 | |||||
Change in valuation allowance | 764 | 1,586 | |||||
Foreign taxes and other | 252 | 697 | |||||
$ | (36,993 | ) | $ | (29,621 | ) | ||
F - 30
HORNBECK OFFSHORE SERVICES, INC. AND SUBSIDIARIES
NOTES TO CONSOLIDATED FINANCIAL STATEMENTS—(Continued)
On December 22, 2017, the Securities and Exchange Commission issued Staff Accounting Bulletin 118, or SAB 118, to address the accounting and reporting of the Tax Cuts and Jobs Act, or the Act. SAB 118 allows companies to take a reasonable period, which should not extend beyond one year from enactment of the Act, to measure and recognize the effects of the new tax law. In the fourth quarter of 2018, the Company completed its tax accounting for the Act, resulting in a credit to tax expense of $0.2 million. Additionally, the Company is making the accounting election to treat global intangible low-taxed income as a period cost.
13. Leases
The Company determines if an agreement is a lease or contains a lease at inception. The lease term may include options to extend or terminate the lease when it is reasonably certain that the Company will exercise the option. ROU assets and the corresponding lease liabilities are recorded at the commencement date based on the present value of lease payments over the expected lease term. The Company uses its incremental borrowing rate, which would be the rate incurred to borrow on a collateralized basis over a similar term in a similar economic environment, to calculate the present value of lease payments.
The Company is obligated under certain operating leases for shore-based facilities, office space and temporary housing. Such leases will often include options to extend the lease and the Company will include option periods that, on commencement date, it is reasonably likely that it will exercise. Some leases may require variable lease payments such as real estate taxes and maintenance expenses. These costs are expensed in the period in which they are incurred. None of the Company's leases contain any residual value guarantees. The Company recorded $4.2 million of expense related to leases in general and administrative and operating expenses during 2019. The expense recorded for short-term leases was $0.5 million during the 2019.
During 2019, the Company recorded operating cash outflows from operating leases of $3.6 million.
Annual maturities of operating lease liabilities under non-cancelable leases with terms in excess of one year, as of December 31, 2019, are as follows (in thousands):
Year Ended December 31, 2019 | |||
2020 | $ | 3,098 | |
2021 | 3,028 | ||
2022 | 3,083 | ||
2023 | 3,122 | ||
2024 | 2,744 | ||
Thereafter | 41,129 | ||
Total lease payments | 56,204 | ||
Less: imputed interest | 29,032 | ||
Total operating lease liabilities | $ | 27,172 | |
Weighted-average remaining lease term (in years) | 17.0 | ||
Weighted-average discount rate | 9.0 | % | |
14. Contingencies
In the normal course of its business, the Company becomes involved in various claims and legal proceedings in which monetary damages are sought. It is management’s opinion that the Company’s liability, if any, under such claims or proceedings would not materially affect the Company's financial position or results of operations. The Company insures against losses relating to its vessels, pollution and third party liabilities, including claims by employees under Section 33 of the Merchant Marine Act of 1920, or the Jones Act. Third party liabilities and pollution claims that relate to vessel operations are covered by the Company’s entry in a mutual protection and indemnity association, or P&I Club, as well as by marine liability policies in excess of the P&I Club’s coverage. The Company provides reserves for any individual claim
F - 31
HORNBECK OFFSHORE SERVICES, INC. AND SUBSIDIARIES
NOTES TO CONSOLIDATED FINANCIAL STATEMENTS—(Continued)
deductibles for which the Company remains responsible by using an estimation process that considers Company-specific and industry data, as well as management’s experience, assumptions and consultation with outside counsel. As additional information becomes available, the Company will assess the potential liability related to its pending claims and revise its estimates. Although historically revisions to such estimates have not been material, changes in estimates of the potential liability could materially impact the Company’s results of operations, financial position or cash flows.
15. Deferred Charges
Deferred charges include the following (in thousands):
Year Ended December 31, | |||||||
2019 | 2018 | ||||||
Deferred drydocking costs, net of accumulated amortization of $14,461 and $14,372, respectively | $ | 35,915 | $ | 20,153 | |||
Prepaid lease expense, net of amortization of $0 and $2,016, respectively | — | 2,372 | |||||
Total | $ | 35,915 | $ | 22,525 | |||
16. Other Accrued Liabilities
Other accrued liabilities include the following (in thousands):
Year Ended December 31, | |||||||
2019 | 2018 | ||||||
Accrued lease expense | $ | — | $ | 5,409 | |||
Deferred revenue | 2,558 | 162 | |||||
Value added tax payable | 4,707 | 1,779 | |||||
Other | 4,353 | 2,400 | |||||
Total | $ | 11,618 | $ | 9,750 | |||
17. Major Customers
In the years ended December 31, 2019, and 2018, revenues from the following customers represent 10% or more of consolidated revenues:
Year Ended December 31, | |||||||
2019 | 2018 | ||||||
Customer A | 26 | % | 24 | % | |||
Customer B | 15 | % | 18 | % | |||
18. Employment Agreements
The Company has employment agreements with certain members of its executive management team. These agreements include, among other things, contractually stated base level salaries and a structured cash incentive compensation program dependent upon the Company achieving certain targeted financial results. The agreements typically provide for certain targets such as a Revenue target, an EBITDA target and a Safety target, which may be varied from time to time by agreement between the Company and the management executive, as well as a discretionary component. In the event such a member of the executive management team is terminated due to certain events as defined in such officer’s agreement, the employee will continue to receive salary, bonus and other payments for the full remaining term of the agreement. The current term of these employment agreements expires on December 31, 2022 and automatically extends each year thereafter on January 1st, for an additional year.
F - 32
HORNBECK OFFSHORE SERVICES, INC. AND SUBSIDIARIES
NOTES TO CONSOLIDATED FINANCIAL STATEMENTS—(Continued)
19. Condensed Consolidating Financial Statements of Guarantors
The following tables present the condensed consolidating historical financial statements as of December 31, 2019 and 2018, and for each of the two years ended December 31, 2019, for the domestic subsidiaries of the Company that serve as guarantors of the Company's 2019 convertible senior notes, 2020 senior notes, 2021 senior notes, first-lien term loans due 2023, second-lien term loans due 2025 and senior credit facility, and the financial results for the Company's subsidiaries that do not serve as guarantors. The guarantees are full and unconditional and joint and several. Certain prior year amounts have been reclassified to conform with current year presentation.
F - 33
HORNBECK OFFSHORE SERVICES, INC. AND SUBSIDIARIES
NOTES TO CONSOLIDATED FINANCIAL STATEMENTS—(Continued)
Condensed Consolidating Balance Sheet
(In thousands, except per share data)
Year Ended December 31, 2019 | |||||||||||||||||||
Parent | Guarantor Subsidiaries | Non-Guarantor Subsidiaries | Consolidating | Consolidated | |||||||||||||||
ASSETS | |||||||||||||||||||
Current assets: | |||||||||||||||||||
Cash and cash equivalents | $ | 5 | $ | 119,924 | $ | 1,561 | $ | — | $ | 121,490 | |||||||||
Accounts receivable, net of allowance for doubtful accounts of $3,987 | — | 66,095 | 1,081 | (181 | ) | 66,995 | |||||||||||||
Other current assets | — | 20,482 | 28 | — | 20,510 | ||||||||||||||
Total current assets | 5 | 206,501 | 2,670 | (181 | ) | 208,995 | |||||||||||||
Property, plant and equipment, net | — | 2,066,350 | 276,413 | — | 2,342,763 | ||||||||||||||
Restricted cash | — | 52,136 | — | — | 52,136 | ||||||||||||||
Deferred charges, net | — | 24,613 | 11,302 | — | 35,915 | ||||||||||||||
Intercompany receivable | 1,970,503 | 8,602 | 100,043 | (2,079,148 | ) | — | |||||||||||||
Right of use assets | — | 23,286 | 206 | — | 23,492 | ||||||||||||||
Investment in subsidiaries | 498,452 | — | — | (498,452 | ) | — | |||||||||||||
Other assets | — | 5,561 | 25 | — | 5,586 | ||||||||||||||
Total assets | $ | 2,468,960 | $ | 2,387,049 | $ | 390,659 | $ | (2,577,781 | ) | $ | 2,668,887 | ||||||||
LIABILITIES AND STOCKHOLDERS’ EQUITY | |||||||||||||||||||
Current liabilities: | |||||||||||||||||||
Accounts payable | $ | 577 | $ | 27,584 | $ | 1,932 | $ | — | $ | 30,093 | |||||||||
Accrued interest | 16,950 | — | — | — | 16,950 | ||||||||||||||
Accrued payroll and benefits | — | 10,614 | 1,366 | — | 11,980 | ||||||||||||||
Current portion of long-term debt, including deferred gain of $31,718, net of original issue discount of $3,084 and deferred financing costs of $10,292 | 1,263,890 | — | — | — | 1,263,890 | ||||||||||||||
Lease liabilities | — | 2,814 | 139 | — | 2,953 | ||||||||||||||
Other accrued liabilities | — | 6,212 | 5,587 | (181 | ) | 11,618 | |||||||||||||
Total current liabilities | 1,281,417 | 47,224 | 9,024 | (181 | ) | 1,337,484 | |||||||||||||
Deferred tax liabilities, net | — | 132,526 | — | — | 132,526 | ||||||||||||||
Lease liabilities | — | 24,152 | 67 | — | 24,219 | ||||||||||||||
Intercompany payables | 15,098 | 1,650,223 | 413,800 | (2,079,121 | ) | — | |||||||||||||
Other liabilities | — | 2,240 | — | (27 | ) | 2,213 | |||||||||||||
Total liabilities | 1,296,515 | 1,856,365 | 422,891 | (2,079,329 | ) | 1,496,442 | |||||||||||||
Stockholders’ equity: | |||||||||||||||||||
Preferred stock: $0.01 par value; 5,000 shares authorized; no shares issued and outstanding | — | — | — | — | — | ||||||||||||||
Common stock: $0.01 par value; 100,000 shares authorized; 38,096 shares issued and outstanding | 381 | — | — | — | 381 | ||||||||||||||
Additional paid-in capital | 766,779 | 46,573 | 8 | (46,581 | ) | 766,779 | |||||||||||||
Retained earnings | 408,789 | 484,111 | (32,240 | ) | (451,871 | ) | 408,789 | ||||||||||||
Accumulated other comprehensive income (loss) | (3,504 | ) | — | — | — | (3,504 | ) | ||||||||||||
Total stockholders’ equity | 1,172,445 | 530,684 | (32,232 | ) | (498,452 | ) | 1,172,445 | ||||||||||||
Total liabilities and stockholders’ equity | $ | 2,468,960 | $ | 2,387,049 | $ | 390,659 | $ | (2,577,781 | ) | $ | 2,668,887 | ||||||||
F - 34
HORNBECK OFFSHORE SERVICES, INC. AND SUBSIDIARIES
NOTES TO CONSOLIDATED FINANCIAL STATEMENTS—(Continued)
Condensed Consolidating Balance Sheet
(In thousands, except per share data)
Year Ended December 31, 2018 | |||||||||||||||||||
Parent | Guarantor Subsidiaries | Non-Guarantor Subsidiaries | Consolidating | Consolidated | |||||||||||||||
ASSETS | |||||||||||||||||||
Current assets: | |||||||||||||||||||
Cash and cash equivalents | $ | 1 | $ | 219,217 | $ | 5,718 | $ | — | $ | 224,936 | |||||||||
Accounts receivable, net of allowance for doubtful accounts of $1,123 | — | 42,136 | 12,788 | — | 54,924 | ||||||||||||||
Other current assets | 30 | 18,740 | 998 | — | 19,768 | ||||||||||||||
Total current assets | 31 | 280,093 | 19,504 | — | 299,628 | ||||||||||||||
Property, plant and equipment, net | — | 2,193,797 | 241,032 | — | 2,434,829 | ||||||||||||||
Deferred charges, net | — | 19,721 | 2,804 | — | 22,525 | ||||||||||||||
Intercompany receivable | 1,920,557 | 914,060 | 483,128 | (3,317,745 | ) | — | |||||||||||||
Investment in subsidiaries | 699,325 | — | — | (699,325 | ) | — | |||||||||||||
Other assets | — | 7,118 | 537 | — | 7,655 | ||||||||||||||
Total assets | $ | 2,619,913 | $ | 3,414,789 | $ | 747,005 | $ | (4,017,070 | ) | $ | 2,764,637 | ||||||||
LIABILITIES AND STOCKHOLDERS’ EQUITY | |||||||||||||||||||
Current liabilities: | |||||||||||||||||||
Accounts payable | $ | — | $ | 25,345 | $ | 1,481 | $ | — | $ | 26,826 | |||||||||
Accrued interest | 15,910 | — | — | — | 15,910 | ||||||||||||||
Accrued payroll and benefits | — | 11,520 | 925 | — | 12,445 | ||||||||||||||
Current portion of long-term debt, net of original issue discount of $2,725 and deferred financing costs of $611 | 96,311 | — | — | — | 96,311 | ||||||||||||||
Other accrued liabilities | — | 7,491 | 2,259 | — | 9,750 | ||||||||||||||
Total current liabilities | 112,221 | 44,356 | 4,665 | — | 161,242 | ||||||||||||||
Long-term debt, including deferred net gain of $15,845, and net of original issue discount of $3,013 and deferred financing costs of $6,149 | 1,123,625 | — | — | — | 1,123,625 | ||||||||||||||
Deferred tax liabilities, net | — | 167,756 | 1,366 | — | 169,122 | ||||||||||||||
Intercompany payables | 76,141 | 2,452,258 | 789,342 | (3,317,741 | ) | — | |||||||||||||
Other liabilities | — | 2,720 | 2 | — | 2,722 | ||||||||||||||
Total liabilities | 1,311,987 | 2,667,090 | 795,375 | (3,317,741 | ) | 1,456,711 | |||||||||||||
Stockholders’ equity: | |||||||||||||||||||
Preferred stock: $0.01 par value; 5,000 shares authorized; no shares issued and outstanding | — | — | — | — | — | ||||||||||||||
Common stock: $0.01 par value; 100,000 shares authorized; 37,701 shares issued and outstanding | 377 | — | — | — | 377 | ||||||||||||||
Additional paid-in capital | 761,834 | 37,978 | 8,602 | (46,580 | ) | 761,834 | |||||||||||||
Retained earnings | 549,475 | 709,721 | (56,972 | ) | (652,749 | ) | 549,475 | ||||||||||||
Accumulated other comprehensive loss | (3,760 | ) | — | — | — | (3,760 | ) | ||||||||||||
Total stockholders’ equity | 1,307,926 | 747,699 | (48,370 | ) | (699,329 | ) | 1,307,926 | ||||||||||||
Total liabilities and stockholders’ equity | $ | 2,619,913 | $ | 3,414,789 | $ | 747,005 | $ | (4,017,070 | ) | $ | 2,764,637 | ||||||||
F - 35
HORNBECK OFFSHORE SERVICES, INC. AND SUBSIDIARIES
NOTES TO CONSOLIDATED FINANCIAL STATEMENTS—(Continued)
Condensed Consolidating Statement of Operations
(In thousands)
Year Ended December 31, 2019 | |||||||||||||||||||
Parent | Guarantor Subsidiaries | Non-Guarantor Subsidiaries | Consolidating | Consolidated | |||||||||||||||
Revenues | $ | — | $ | 212,098 | $ | 14,911 | $ | (1,347 | ) | $ | 225,662 | ||||||||
Costs and expenses: | |||||||||||||||||||
Operating expenses | — | 164,450 | 1,527 | (1,347 | ) | 164,630 | |||||||||||||
Depreciation | — | 86,309 | 12,030 | — | 98,339 | ||||||||||||||
Amortization | — | 12,047 | 3,927 | — | 15,974 | ||||||||||||||
General and administrative expenses | 3,792 | 49,816 | 272 | — | 53,880 | ||||||||||||||
3,792 | 312,622 | 17,756 | (1,347 | ) | 332,823 | ||||||||||||||
Gain on sale of assets | — | 62 | — | — | 62 | ||||||||||||||
Operating loss | (3,792 | ) | (100,462 | ) | (2,845 | ) | — | (107,099 | ) | ||||||||||
Other income (expense): | |||||||||||||||||||
Loss on early extinguishment of debt, net | (71 | ) | — | — | — | (71 | ) | ||||||||||||
Interest income | — | 4,469 | 19 | — | 4,488 | ||||||||||||||
Interest expense | (83,380 | ) | — | — | — | (83,380 | ) | ||||||||||||
Equity in earnings (losses) of consolidated subsidiaries | (51,571 | ) | — | — | 51,571 | — | |||||||||||||
Other income (expense), net | — | 11,297 | (1,042 | ) | — | 10,255 | |||||||||||||
(135,022 | ) | 15,766 | (1,023 | ) | 51,571 | (68,708 | ) | ||||||||||||
Income (loss) before income taxes | (138,814 | ) | (84,696 | ) | (3,868 | ) | 51,571 | (175,807 | ) | ||||||||||
Income tax expense (benefit) | — | (37,275 | ) | 282 | — | (36,993 | ) | ||||||||||||
Net income (loss) | $ | (138,814 | ) | $ | (47,421 | ) | $ | (4,150 | ) | $ | 51,571 | $ | (138,814 | ) | |||||
Condensed Consolidating Statements of Comprehensive Income (Loss)
(In thousands)
Year Ended December 31, 2019 | |||||||||||||||||||
Parent | Guarantor Subsidiaries | Non-Guarantor Subsidiaries | Consolidating | Consolidated | |||||||||||||||
Net income (loss) | $ | (138,814 | ) | $ | (47,421 | ) | $ | (4,150 | ) | $ | 51,571 | $ | (138,814 | ) | |||||
Other comprehensive income: | |||||||||||||||||||
Foreign currency translation loss, net | (1,616 | ) | — | — | — | (1,616 | ) | ||||||||||||
Total comprehensive income (loss) | $ | (140,430 | ) | $ | (47,421 | ) | $ | (4,150 | ) | $ | 51,571 | $ | (140,430 | ) | |||||
F - 36
HORNBECK OFFSHORE SERVICES, INC. AND SUBSIDIARIES
NOTES TO CONSOLIDATED FINANCIAL STATEMENTS—(Continued)
Condensed Consolidating Statement of Operations
(In thousands)
Year Ended December 31, 2018 | |||||||||||||||||||
Parent | Guarantor Subsidiaries | Non-Guarantor Subsidiaries | Consolidating | Consolidated | |||||||||||||||
Revenues | $ | — | $ | 201,684 | $ | 11,593 | $ | (873 | ) | $ | 212,404 | ||||||||
Costs and expenses: | |||||||||||||||||||
Operating expenses | — | 129,110 | 19,363 | (831 | ) | 147,642 | |||||||||||||
Depreciation | — | 91,376 | 7,551 | — | 98,927 | ||||||||||||||
Amortization | — | 8,354 | 1,387 | — | 9,741 | ||||||||||||||
General and administrative expenses | 218 | 40,931 | 2,423 | (42 | ) | 43,530 | |||||||||||||
218 | 269,771 | 30,724 | (873 | ) | 299,840 | ||||||||||||||
Gain on sale of assets | — | 52 | 7 | — | 59 | ||||||||||||||
Operating loss | (218 | ) | (68,035 | ) | (19,124 | ) | — | (87,377 | ) | ||||||||||
Other income (expense): | |||||||||||||||||||
Interest income | — | 1,974 | 254 | — | 2,228 | ||||||||||||||
Interest expense | (63,566 | ) | — | — | — | (63,566 | ) | ||||||||||||
Equity in earnings (losses) of consolidated subsidiaries | (55,339 | ) | — | — | 55,339 | — | |||||||||||||
Other income (expense), net | — | 3 | (32 | ) | — | (29 | ) | ||||||||||||
(118,905 | ) | 1,977 | 222 | 55,339 | (61,367 | ) | |||||||||||||
Income (loss) before income taxes | (119,123 | ) | (66,058 | ) | (18,902 | ) | 55,339 | (148,744 | ) | ||||||||||
Income tax expense (benefit) | — | (30,263 | ) | 642 | — | (29,621 | ) | ||||||||||||
Net income (loss) | $ | (119,123 | ) | $ | (35,795 | ) | $ | (19,544 | ) | $ | 55,339 | $ | (119,123 | ) | |||||
Condensed Consolidating Statements of Comprehensive Income (Loss)
(In thousands)
Year Ended December 31, 2018 | |||||||||||||||||||
Parent | Guarantor Subsidiaries | Non-Guarantor Subsidiaries | Consolidating | Consolidated | |||||||||||||||
Net income (loss) | $ | (119,123 | ) | $ | (35,795 | ) | $ | (19,544 | ) | $ | 55,339 | $ | (119,123 | ) | |||||
Other comprehensive income: | |||||||||||||||||||
Foreign currency translation gain (loss) | (12,437 | ) | — | — | — | (12,437 | ) | ||||||||||||
Total comprehensive income (loss) | $ | (131,560 | ) | $ | (35,795 | ) | $ | (19,544 | ) | $ | 55,339 | $ | (131,560 | ) | |||||
F - 37
HORNBECK OFFSHORE SERVICES, INC. AND SUBSIDIARIES
NOTES TO CONSOLIDATED FINANCIAL STATEMENTS—(Continued)
Condensed Consolidating Statements of Cash Flows
(In thousands)
Year Ended December 31, 2019 | |||||||||||||||||||
Parent | Guarantor Subsidiaries | Non-Guarantor Subsidiaries | Consolidating | Consolidated | |||||||||||||||
CASH FLOWS FROM OPERATING ACTIVITIES: | |||||||||||||||||||
Net cash provided by (used in) operating activities | $ | 6,222 | $ | (90,117 | ) | $ | (4,091 | ) | $ | — | $ | (87,986 | ) | ||||||
CASH FLOWS FROM INVESTING ACTIVITIES: | |||||||||||||||||||
Costs incurred for OSV newbuild program #5 | — | (3,344 | ) | — | — | (3,344 | ) | ||||||||||||
Net proceeds from sale of assets | — | 26 | 42 | — | 68 | ||||||||||||||
Vessel capital expenditures | — | (4,147 | ) | 249 | — | (3,898 | ) | ||||||||||||
Non-vessel capital expenditures | — | (20 | ) | (357 | ) | — | (377 | ) | |||||||||||
Net cash used in investing activities | — | (7,485 | ) | (66 | ) | — | (7,551 | ) | |||||||||||
CASH FLOWS FROM FINANCING ACTIVITIES: | |||||||||||||||||||
Proceeds from first-lien term loans | 29,159 | — | — | — | 29,159 | ||||||||||||||
Proceeds from senior credit facility | 100,000 | — | — | — | 100,000 | ||||||||||||||
Repurchase of convertible notes | (73,076 | ) | — | — | — | (73,076 | ) | ||||||||||||
Payment of deferred financing costs | (11,891 | ) | — | — | — | (11,891 | ) | ||||||||||||
Net cash proceeds from other shares issued | 135 | — | — | — | 135 | ||||||||||||||
Intercompany | (50,545 | ) | 50,545 | — | — | — | |||||||||||||
Net cash provided by (used in) financing activities | (6,218 | ) | 50,545 | — | — | 44,327 | |||||||||||||
Effects of exchange rate changes on cash | — | (100 | ) | — | — | (100 | ) | ||||||||||||
Net increase (decrease) in cash, cash equivalents and restricted cash | 4 | (47,157 | ) | (4,157 | ) | — | (51,310 | ) | |||||||||||
Cash, cash equivalents and restricted cash at beginning of period | 1 | 219,217 | 5,718 | — | 224,936 | ||||||||||||||
Cash, cash equivalents and restricted cash at end of period | $ | 5 | $ | 172,060 | $ | 1,561 | $ | — | $ | 173,626 | |||||||||
SUPPLEMENTAL DISCLOSURES OF CASH FLOW ACTIVITIES: | |||||||||||||||||||
Cash paid for interest | $ | 82,415 | $ | — | $ | — | $ | — | $ | 82,415 | |||||||||
Cash paid for (refunds of) income taxes | $ | — | $ | (5,160 | ) | $ | 1,571 | $ | — | $ | (3,589 | ) | |||||||
SUPPLEMENTAL DISCLOSURES OF NON-CASH FINANCING ACTIVITIES | |||||||||||||||||||
Exchange of convertible notes for first-lien term loans | $ | 20,951 | $ | — | $ | — | $ | — | $ | 20,951 | |||||||||
Exchange of senior notes for second-lien term loans | $ | 142,629 | $ | — | $ | — | $ | — | $ | 142,629 | |||||||||
F - 38
HORNBECK OFFSHORE SERVICES, INC. AND SUBSIDIARIES
NOTES TO CONSOLIDATED FINANCIAL STATEMENTS—(Continued)
Condensed Consolidating Statements of Cash Flows
(In thousands)
Year Ended December 31, 2018 | |||||||||||||||||||
Parent | Guarantor Subsidiaries | Non-Guarantor Subsidiaries | Consolidating | Consolidated | |||||||||||||||
CASH FLOWS FROM OPERATING ACTIVITIES: | |||||||||||||||||||
Net cash provided by (used in) operating activities | $ | (133,808 | ) | $ | 91,142 | $ | 314 | $ | — | $ | (42,352 | ) | |||||||
CASH FLOWS FROM INVESTING ACTIVITIES: | |||||||||||||||||||
Acquisition of offshore supply vessels | — | (40,868 | ) | — | — | (40,868 | ) | ||||||||||||
Costs incurred for OSV newbuild program #5 | — | (3,696 | ) | — | — | (3,696 | ) | ||||||||||||
Net proceeds from sale of assets | — | 79 | 7 | — | 86 | ||||||||||||||
Vessel capital expenditures | — | (6,050 | ) | (1,865 | ) | — | (7,915 | ) | |||||||||||
Non-vessel capital expenditures | — | (136 | ) | 5 | — | (131 | ) | ||||||||||||
Net cash used in investing activities | — | (50,671 | ) | (1,853 | ) | — | (52,524 | ) | |||||||||||
CASH FLOWS FROM FINANCING ACTIVITIES: | |||||||||||||||||||
Proceeds from first-lien term loans | 133,944 | — | — | — | 133,944 | ||||||||||||||
Shares withheld for payment of employee withholding taxes | (536 | ) | — | — | — | (536 | ) | ||||||||||||
Net cash proceeds from other shares issued | 397 | — | — | — | 397 | ||||||||||||||
Net cash provided by financing activities | 133,805 | — | — | — | 133,805 | ||||||||||||||
Effects of exchange rate changes on cash | — | — | (842 | ) | — | (842 | ) | ||||||||||||
Net increase (decrease) in cash, cash equivalents and restricted cash | (3 | ) | 40,471 | (2,381 | ) | — | 38,087 | ||||||||||||
Cash, cash equivalents and restricted cash at beginning of period | 4 | 178,746 | 8,099 | — | 186,849 | ||||||||||||||
Cash, cash equivalents and restricted cash at end of period | $ | 1 | $ | 219,217 | $ | 5,718 | $ | — | $ | 224,936 | |||||||||
SUPPLEMENTAL DISCLOSURES OF CASH FLOW ACTIVITIES: | |||||||||||||||||||
Cash paid for interest | $ | 59,469 | $ | — | $ | — | $ | — | $ | 59,469 | |||||||||
Cash paid for income taxes | $ | — | $ | 723 | $ | 219 | $ | — | $ | 942 | |||||||||
F - 39
SIGNATURES
Pursuant to the requirements of Section 13 or 15(d) of the Securities Exchange Act of 1934, the Registrant has duly caused this Report to be signed on its behalf by the undersigned, thereunto duly authorized, in the City of Covington, the State of Louisiana, on July 10, 2020.
HORNBECK OFFSHORE SERVICES, INC. | |||
By: | /s/ TODD M. HORNBECK | ||
Todd M. Hornbeck President and Chief Executive Officer | |||
Pursuant to the requirements of the Securities Exchange Act of 1934, this Report has been signed below by the following persons on behalf of the Registrant and in the capacities and on the dates indicated.
Signature | Title | Date | ||
/S/ TODD M. HORNBECK | Chairman of the Board, President, and Chief Executive Officer (Principal Executive Officer) | July 10, 2020 | ||
(Todd M. Hornbeck) | ||||
/S/ JAMES O. HARP, JR. | Executive Vice President and Chief Financial Officer (Principal Financial and Accounting Officer) | July 10, 2020 | ||
(James O. Harp, Jr.) | ||||
/S/ LARRY D. HORNBECK | Director | July 10, 2020 | ||
(Larry D. Hornbeck) | ||||
/S/ BRUCE W. HUNT | Director | July 10, 2020 | ||
(Bruce W. Hunt) | ||||
/S/ STEVEN W. KRABLIN | Director | July 10, 2020 | ||
(Steven W. Krablin) | ||||
/S/ PATRICIA B. MELCHER | Director | July 10, 2020 | ||
(Patricia B. Melcher) | ||||
/S/ KEVIN O. MEYERS | Director | July 10, 2020 | ||
(Kevin O. Meyers) | ||||
/S/ BERNIE W. STEWART | Director | July 10, 2020 | ||
(Bernie W. Stewart) | ||||
/S/ NICHOLAS L. SWYKA JR. | Director | July 10, 2020 | ||
(Nicholas L. Swyka, Jr.) | ||||
S - 1
Exhibit Index
Exhibit Number | Description of Exhibit | |
2.1 | — | |
3.1 | — | |
3.2 | — | |
3.3 | — | |
3.4 | — | |
4.1 | — | |
4.2 | — | |
4.3 | — | |
4.4 | — | |
4.5 | — | |
4.6 | — | |
4.7 | — | |
4.8 | — | |
4.9 | — | |
4.10 | — | |
4.11 | — | |
4.12 | — | |
4.13 | — | |
E - 1
Exhibit Number | Description of Exhibit | |
4.14 | — | |
4.15 | — | |
4.16 | — | |
4.17 | — | |
4.18 | — | |
4.19 | — | |
4.20 | — | |
4.21 | — | |
4.22 | — | |
4.23 | — | |
4.24 | — | |
4.25 | — | |
*4.26 | — | |
10.1 | — | |
10.2† | — | |
10.3† | — | |
10.4† | — | |
E - 2
Exhibit Number | Description of Exhibit | |
10.5† | — | |
10.6† | — | |
10.7† | — | |
10.8† | — | |
10.9† | — | |
10.10† | — | |
10.11† | — | |
10.12† | — | |
10.13† | — | |
10.14† | — | |
10.15† | — | |
10.16† | — | |
10.17† | — | |
10.18† | — | |
10.19† | — | |
10.20† | — | |
10.21† | — | |
10.22† | — | |
E - 3
Exhibit Number | Description of Exhibit | |
10.23 | — | |
10.24† | — | |
10.25† | — | |
10.26† | — | |
10.27† | — | |
10.28† | — | |
10.29† | — | |
10.30 | — | |
10.31 | — | |
10.32 | — | |
10.33 | — | |
10.34 | — | |
10.35 | — | |
10.36† | — | |
10.37† | — | |
10.38 | — | |
10.39 | — | |
10.40 | — | |
E - 4
Exhibit Index | Description of Exhibit | |
10.41 | — | |
10.42 | — | |
10.43 | — | |
10.44 | — | |
10.45 | — | |
10.46 | — | |
10.47 | — | |
10.48 | — | |
10.49 | — | |
*10.50 | — | |
*21 | — | |
*31.1 | — | |
*31.2 | — | |
*32.1 | — | |
*32.2 | — | |
*101 | — | Interactive Data File |
* | Filed herewith. | |
† | Compensatory plan or arrangement under which executive officers or directors of the Company may participate. | |
E - 5