Attached files
| file | filename |
|---|---|
| EX-99.12 - EX-99.12 - Canopy Growth Corp | d69232dex9912.htm |
| EX-99.11 - EX-99.11 - Canopy Growth Corp | d69232dex9911.htm |
| EX-99.10 - EX-99.10 - Canopy Growth Corp | d69232dex9910.htm |
| EX-99.9 - EX-99.9 - Canopy Growth Corp | d69232dex999.htm |
| EX-99.8 - EX-99.8 - Canopy Growth Corp | d69232dex998.htm |
| EX-99.7 - EX-99.7 - Canopy Growth Corp | d69232dex997.htm |
| EX-99.5 - EX-99.5 - Canopy Growth Corp | d69232dex995.htm |
| EX-99.4 - EX-99.4 - Canopy Growth Corp | d69232dex994.htm |
| EX-99.3 - EX-99.3 - Canopy Growth Corp | d69232dex993.htm |
| EX-99.2 - EX-99.2 - Canopy Growth Corp | d69232dex992.htm |
| EX-99.1 - EX-99.1 - Canopy Growth Corp | d69232dex991.htm |
| 8-K - 8-K - Canopy Growth Corp | d69232d8k.htm |
Exhibit 99.6
NOTICE TO READER
As of September 30, 2019, Canopy Growth Corporation (the “Company”) determined that it no longer qualified as a “foreign private issuer” as such term is defined in Rule 405 under the Securities Act of 1933. This means that as of April 1, 2020, the Company has been required to comply with all of the periodic disclosure requirements of the Securities Exchange Act of 1934 applicable to U.S. domestic issues, such as Forms 10-K, 10-Q and 8-K, rather than the forms the Company has filed with the Securities and Exchange Commission (“SEC”) in the past as a foreign private issuer, such as Forms 40-F and 6-K.
Accordingly, the Company is now required to prepare its financial statements filed with the SEC in accordance with generally accepted accounting principles in the United States (“U.S. GAAP”). As required pursuant to section 4.3(4) of National Instrument 51-102 – Continuous Disclosure Obligations, the Company must restate its interim financial reports for the fiscal year ended March 31, 2020 in accordance with U.S. GAAP, such interim financial reports having previously been prepared in accordance with International Financial Reporting Standards as issued by the International Accounting Standards Board.
The attached amended and restated management’s discussion and analysis (the “MD&A”) for the three and six months ended September 30, 2019 and 2018, is current as of November 14, 2019 and provides financial information for the three and six months ended September 30, 2019, as amended and restated on July 10, 2020, solely to reflect the filing of the amended and restated unaudited condensed interim consolidated financial statements for the three and six months ended September 30, 2019 and 2018 in accordance with U.S. GAAP. Other than as expressly set forth above, the revised MD&A does not, and does not purport to, update or restate the information in the original MD&A or reflect any events that occurred after the date of the filing of the original MD&A.
The Company’s Annual Report on Form 10-K (the “Annual Report”) dated June 1, 2020 is available under the Company’s profile on SEDAR at www.sedar.com and on EDGAR at www.sec.gov. Readers are cautioned that this MD&A should be read in conjunction with the Annual Report, including the consolidated financial statements and the related notes thereto included in Item 8 thereof.
CANOPY GROWTH CORPORATION
MANAGEMENT’S DISCUSSION AND ANALYSIS OF FINANCIAL CONDITION AND RESULTS OF OPERATIONS
FOR THE THREE AND SIX MONTHS ENDED SEPTEMBER 30, 2019
NOVEMBER 14, 2019
MANAGEMENT’S DISCUSSION AND ANALYSIS FOR THE THREE AND SIX MONTHS ENDED SEPTEMBER 30, 2019
This amended and restated management’s discussion and analysis (the “MD&A”) for the three and six months ended September 30, 2019 is provided as of November 14, 2019 and provides financial information for the three and six months ended September 30, 2019, as amended and restated on July 10, 2020, solely to reflect the filing of the amended and restated unaudited condensed interim consolidated financial statements for the three and six months ended September 30, 2019 and 2018 prepared in accordance with U.S. generally accepted accounting principles (“U.S. GAAP”). Other than as expressly set forth above, the amended and restated MD&A does not, and does not purport to, update or restate the information in the original MD&A or reflect any events that occurred after the date of the filing of the original MD&A.
Unless the context indicates or requires otherwise, the terms “Canopy Growth”, “the Company”, “we”, “us” and “our” refers to Canopy Growth Corporation and its controlled entities. Canopy Growth is a publicly traded corporation, incorporated in Canada, with its head office located at 1 Hershey Drive, Smiths Falls, Ontario K7A 0A8. The common shares of Canopy Growth trade on the Toronto Stock Exchange (“TSX”) under the ticker symbol “WEED” and on the New York Stock Exchange (“NYSE”) under the ticker symbol “CGC”.
This MD&A was prepared with reference to National Instrument 51-102 – Continuous Disclosure Obligations of the Canadian Securities Administrators. Under the United States/Canada Multijurisdictional Disclosure System, we are permitted to prepare this MD&A in accordance with Canadian disclosure requirements which may differ from United States disclosure requirements. This MD&A provides information as at, and for the three and six months ended September 30, 2019 and up to and including November 14, 2019.
This amended and restated MD&A should be read in conjunction with Canopy Growth’s amended and restated unaudited condensed interim consolidated financial statements and the notes thereto for the three and six months ended September 30, 2019 (the “Interim Financial Statements”), which have been prepared in accordance with U.S. GAAP. The Interim Financial Statements include the accounts of Canopy Growth and its subsidiaries and its interests in affiliated companies, and all intercompany balances and transactions have been eliminated on consolidation. The Interim Financial Statements and this MD&A have been reviewed by Canopy Growth’s Audit Committee and were approved by Canopy Growth’s Board of Directors on July 10, 2020.
Financial information contained herein is expressed in thousands of Canadian dollars, except share and per share amounts, or as otherwise stated.
This MD&A contains forward-looking information within the meaning of Canadian securities laws, and the use of non-U.S. GAAP measures. Refer to “Cautionary Note Regarding Forward-Looking Statements” for cautionary statements regarding forward-looking statements.
Additional information filed by us with the Canadian Securities Administrators, including this MD&A, the Interim Financial Statements, audited annual consolidated financial statements, interim reports, annual reports and annual information forms have been filed electronically through the System for Electronic Document Analysis and Retrieval (“SEDAR”) and are available under the Company’s profile at www.sedar.com, on the Securities and Exchange Commission (“SEC”) website (www.sec.gov/edgar) and also on our website at www.canopygrowth.com.
This MD&A provides additional information on our performance in the last three and six month periods, and our financial condition and future prospects. It is organized as follows:
| • | Part 1 – Business Overview |
| • | Part 2 – Strategy |
| • | Part 3 – Results of Operations |
| • | Part 4 – Financial Liquidity and Capital Resources |
| • | Part 5 – Critical Accounting Estimates and Judgments |
| • | Part 6 – Controls and Procedures |
2
| • | Part 7 – Risks and Uncertainties |
Canopy Growth is not considered a U.S. Marijuana Issuer (as defined in the Canadian Securities Administrators Staff Notice 51-352 – Issuers with U.S. Marijuana-Related Activities (the “Staff Notice”)) nor does the Company have material ancillary involvement in the United States cannabis industry in accordance with the Staff Notice. While the Company has several partnerships with United States-based companies that may themselves participate in the United States cannabis market, these relationships are licensing relationships that see intellectual property developed in the United States brought into Canada, and in no manner involve Canopy Growth in any unlawful United States activities respecting cannabis. Where a non-controlled affiliate has expressed an intent to enter the United States cannabis market, we have taken steps to insulate the Company from all economic and voting interests until such time that United States federal permissibility changes in favour of cannabis related activities.
3
CAUTIONARY NOTE REGARDING FORWARD-LOOKING STATEMENTS
This MD&A contains certain “forward-looking statements” within the meaning of section 27A of the United States Securities Act of 1933, section 21E of the United States Securities Exchange Act of 1934, the United States Private Securities Litigation Reform Act of 1995 or in releases made by the United States Securities and Exchange Commission (“SEC”) all as may be amended from time to time, and “forward looking information” within the meaning of Canadian securities legislation, including but not limited to statements relating to:
| • | assumptions and expectations described in the Company’s critical accounting policies and estimates; |
| • | the adoption and impact of certain accounting pronouncements; |
| • | the legislation, regulations and licensing related to the cultivation, production and sale of cannabis and hemp products by the Company’s subsidiaries and other business interests; |
| • | the potential time frame for the implementation of regulations with respect to the second phase of recreational cannabis products in Canada, including the regulatory framework for ingestible cannabis, cannabis extracts and cannabis topical products; |
| • | the number of users of cannabis or the size of the legal cannabis market in Canada and internationally; |
| • | the number of users of hemp or the size of the legal hemp market in Canada and internationally; |
| • | the potential time frame for the implementation of legislation to legalize and regulate medical or recreational cannabis or hemp (and the consumer products derived from each of the foregoing) in Canada and internationally, and the potential form the legislation and regulations will take, including the method of delivery and framework adopted or to be adopted by Canada and various international jurisdictions; |
| • | the ability to enter and participate in international market opportunities; |
| • | the Company’s future financial and operating performance; |
| • | future performance, results and terms of strategic initiatives, strategic agreements and supply agreements; |
| • | the success of the entities the Company acquires and the Company’s collaborations; |
| • | the market for the Company’s current and proposed product offerings, as well as the Company’s ability to capture market share; |
| • | the benefits and applications of the Company’s product offerings and expected sales thereof; |
| • | development of affiliated brands, product diversification and future corporate development; |
| • | anticipated investment in and results of research and development; |
| • | inventory and production capacity, including discussions of plans or potential for expansion of capacity at existing or new facilities; |
| • | the Company’s exercise of its option to acquire Acreage (as defined below) and the eventual closing of the acquisition of Acreage upon the occurrence or waiver of the Triggering Event (as defined below); |
| • | future expenditures, strategic investments and capital activities; |
| • | statements about expected use of proceeds from fund raising activities; |
| • | the competitive landscape in which the Company operates and the Company’s market expertise; |
| • | the Company’s ability to achieve profitability; and |
| • | the Company’s ability to secure further equity or debt financing. |
The words “plans”, “expects”, “is expected”, “budget”, “scheduled”, “estimates” “forecasts”, “intends”, “anticipates”, or “believes” or variations (including negative variations) of such words and phrases, or statements that certain actions, events, or results “may”, “could”, “would”, “might”, or “will” be taken, occur or to achieve are all forward-looking statements. Forward-looking statements are based on the reasonable assumptions, estimates, internal and external analysis and opinions of management made considering its experience and perception of trends, current conditions and expected developments, as well as other factors that management believes to be relevant and reasonable at the date that such statements are made. Forward-looking statements involve known and unknown risks, uncertainties, assumptions and
4
other factors that may cause actual results, performance or achievements of the Company to be materially different from any future results, performance or achievements expressed or implied by the forward-looking statements. Some of the risks and other factors which could cause actual results to differ materially from those expressed in the forward-looking statements contained in this MD&A include, but are not limited to, the factors included under “Part 7 – Risks and Uncertainties” in this MD&A, the factors included under “Part 7 – Risks and Uncertainties” in the Company’s MD&A for the three months and year ended March 31, 2019 and in the Company’s annual information form dated June 24, 2019 (the “AIF”). Although the Company has attempted to identify important factors that could cause actions, events or results to differ materially from those described in the forward-looking statements, there may be other factors that cause actions, events, or results to differ from those anticipated, estimated or intended. Forward-looking statements contained herein are made as at the date of this MD&A. There can be no assurance that forward-looking statements will prove to be accurate, as actual results and future events could differ materially from those anticipated in such statements. Accordingly, readers should not place undue reliance on the forward-looking statements. The Company does not undertake to update any forward-looking statements except as required by applicable securities laws.
5
PART 1 – BUSINESS OVERVIEW
Canopy Growth is a world-leading diversified cannabis and hemp company offering distinct brands and curated cannabis varieties in dried flower, oil and softgel formats for sale in Canada pursuant to the Cannabis Act, and around the world pursuant to applicable international and domestic legislation and permits. On October 17, 2018 the Cannabis Act came into effect in Canada, which regulates the medical and recreational cannabis markets in Canada and which provides provincial, territorial and municipal governments the authority to prescribe regulations regarding the distribution and sale of recreational cannabis. In the period leading up to the legalization of recreational cannabis in Canada we transitioned our business model to a largely “business-to-business” wholesale model for the recreational channel and a “business-to-consumer” model in the context of the existing medical cannabis market. We also entered into supply agreements with the responsible government agencies in 10 Canadian provinces and territories, pursuant to which large quantities of cannabis are ordered by the agencies for distribution to brick-and-mortar and online retail stores, as applicable. Further, we opened Tweed and Tokyo Smoke cannabis retail stores across Canada, where permitted, to create brand awareness and consumer demand. By executing effectively on the transition of our business model, we believe that we have established a leadership position at the onset of the Canadian recreational cannabis market.
On October 17, 2019, the government of Canada announced the legalization of the second phase of recreational cannabis products, and in late October we unveiled a portfolio of new cannabis-infused beverage and edible products. We plan to have these products available for sale beginning in mid-December 2019 at locations where legal cannabis products are currently sold, including our Tweed and Tokyo Smoke retail stores. Our cannabis-infused beverages will be produced in our new 160,000 square foot beverage facility in Smiths Falls, and we have developed a proprietary process that distills whole flower cannabis into a clear liquid that will be used as an active ingredient in our beverages. Our beverages will come in a variety of flavours and sizes under several brands, and we believe they will offer consumers a new alternative to traditional drinks. We are also producing our cannabis-infused craft chocolates in a variety of flavours in our advanced manufacturing facility in Smiths Falls, in the same factory where Hershey Canada made chocolates for over 50 years. Our products will contain tetrahydrocannabinol (“THC”), cannabidiol (“CBD”), or a combination of the two cannabinoids up to the limit of 10 milligrams of THC per package set by the government of Canada. Further information about our vaping products will be released in late November 2019.
Our investments in research and development, with a focus on product innovation related to these value-added, high-margin consumer products and the optimization of our cultivation, extraction, and advanced manufacturing capability, position us well for meeting the expected demand for these products and establishing market leadership when they become available for sale.
Our Spectrum Therapeutics medical division is a global leader in medical cannabis with approximately 75,600 patients in Canada and an established footprint in 15 other countries across 5 continents. Through Spectrum Therapeutics’ research and development initiatives, we continue to build a robust portfolio of intellectual property and pre-clinical and clinical evidence to support cannabinoid-based medicines, including clinically-proven drug formulations and dosage formats, that deliver therapeutic value in areas of unmet medical needs. In addition to producing and distributing a diverse portfolio of medically-validated cannabinoid products and therapies to healthcare practitioners and our patients in countries where it is federally permissible to do so, Spectrum Therapeutics offers industry-leading education, resource, and support programs for patients and healthcare practitioners.
Subsequent to the passage of the Farm Bill (as defined below), we entered the United States hemp and CBD market and our objective is to introduce CBD products to the United States market. Accordingly, we have built our hemp supply chain through investing in hemp cultivation, processing, extraction and production facilities, or through partnering with contract growers and manufacturers across several states. We have also executed a plan of arrangement agreement with Acreage Holdings, Inc. (“Acreage”), a leading United States multi-state cannabis operator, that provides us the right and the requirement to acquire Acreage when changes in United States federal law to permit the general cultivation, distribution, and possession of marijuana.
We have approximately 5.4 million square feet of licensed capacity in operation in Canada, including indoor and greenhouse cultivation, post-harvest processing, oil extraction, encapsulation, and advanced manufacturing capability for vapes, edibles, beverages, and pre-rolled joints. We recently expanded and diversified our Canadian footprint when we received a licence to cultivate cannabis at a 160 acre (approximately 7 million square feet) outdoor site in Saskatchewan, adding to our existing 5,500 acre outdoor hemp production platform. These infrastructure investments will allow us to supply domestic and international cannabis markets with a complimentary balance of sophisticated, in-demand flower products and low-cost raw material input for value-added products. This will support our market leadership at the onset of the second phase of recreational cannabis products in Canada. Internationally, we hold licences for over
6
35 million square feet of cultivation and production space in Denmark, Colombia and Lesotho, with other expansion projects currently underway to continue building-out our global infrastructure footprint.
In November 2018, we closed the $5 billion strategic investment from global beverage leader Constellation Brands Inc. (“Constellation”). In addition to Constellation providing us with their expertise in the areas of operations, product distribution and marketing, the funds will allow us to accelerate our global expansion strategy, including entering the United States market when federally permissible to do so; investing in the recently-legalized hemp market in the United States; building-out infrastructure in new markets; investing in intellectual property development; advancing clinical research programs; and completing strategic acquisitions to continue establishing long-term competitive advantages.
Overview of Financial Results for the Second Quarter of Fiscal 2020
Total net revenue in the second quarter of fiscal 2020 was $76,613, as compared to $90,482 in the first quarter of fiscal 2020.
Our medical cannabis gross revenue increased 37% from the first quarter of fiscal 2020 to $32,239, with 72% growth and 8% growth in our international and Canadian medical cannabis businesses, respectively. Revenue for our international medical cannabis business was $18,090 in the second quarter of fiscal 2020, with the growth driven by the acquisition of C3 Cannabinoid Compound Company (“C3”), which contributed a full quarter to our results in the second quarter of fiscal 2020, and the return to growth of our German medical business as a result of the resolution of supply constraints experienced in previous quarters. Gross revenue for our Canadian medical cannabis business was $14,149 in the second quarter of fiscal 2020, as our larger harvests in recent months, the broadening of our brand and product offerings for our medical customers, and an increase in the number of patients registered with Spectrum Therapeutics to 75,600 have resulted in sequential improvements over the previous quarter in the number of orders placed by our customers and growth in our gross revenues.
Gross revenue from our recreational cannabis business was $29,777 in the second quarter of fiscal 2020. This included $13,100 of gross revenue from the business-to-consumer channel, which represented growth of 23% from the previous quarter as we continue to build-out our retail store platform in Canada. Gross revenue from the business-to-business channel was $16,677, which reflects our determination of returns and pricing adjustments as discussed below. Approximately one year after the opening of the Canadian recreational cannabis market we, along with our provincial and territorial agency partners, are continuing to monitor our sales of recreational cannabis products, including the format (dry bud, oils, softgels); the type, strain and potency profile; and the quantity and package size of products. We also monitor and evaluate, on an ongoing basis, inventory levels at our own facilities and those held by our provincial and territorial agency partners against both the recent consumer demand and sales trends that are being observed in the recreational market, and the anticipated longer-term growth in the market.
In the second quarter of fiscal 2020, this evaluation indicated that the risk of over-supply of certain oil and softgel formats existed in certain markets due, in part, to underdeveloped retail markets in several provinces. Since identifying the oversupply risk, we have implemented new pricing and retail customer education strategies in order to improve the sell-through velocity of oils and softgel products and we expect these activities to lead to an appreciable reduction in provincial and territorial inventories. However, based on this assessment, we have determined returns and pricing adjustments related primarily to the risk of over-supply of certain oil and softgel products in the amount of $32,727, and this amount has been reflected in revenue.
As overall demand for oils and softgels in the recreational cannabis market has not met our initial forecasts and expectations at the time of launch, in an effort to balance supply and demand in the recreational cannabis retail channel we have reduced the production of certain of our recreational cannabis oil and softgel products in the second quarter of fiscal 2020.
Our reported gross margin was 5% of net revenue in the second quarter of fiscal 2020, and was impacted by the following items: (1) operating costs of $10,536 relating to non-operating or under-utilized production facilities, (2) the impact on gross margin of $9,157 related to returns and pricing adjustments, as described above, (3) charges for excess finished recreational cannabis inventory of $17,000 recorded primarily in conjunction with our evaluation of the estimated on-hand provincial and territorial inventory levels. We have assessed current and forecasted “sell-in” rates of certain oils and softgel products and concluded a risk exists that a portion of our inventory of certain recreational oil and softgel products may not be sold within a reasonable timeframe. While the product will continue to be stored and is well within its expiry date, we believe this is a prudent step at this time, and (4) other adjustments related to the net realizable value of inventory.
7
We continue to build high-quality, dried flower inventory that we believe will be necessary to meet the increased demand that will be generated by growth in the recreational cannabis retail platform across the country over the next 6 to 18 months, particularly in the province of Ontario. Ontario, with 24 retail stores currently open, is underserved on a per capita basis and we believe Ontario can support over 1,000 retail stores. We expect the government of Ontario to soon announce a new and expanded recreational cannabis retail program in that province. Adopting a pace of store openings similar to that accomplished in Alberta, which saw the number of retail stores increase over a 5-month period from approximately 65 to approximately 290 at the end of September 2019, the number of stores serving Ontario consumers could approach 600 within 12 to 18 months. The larger retail store count in Ontario can be expected to focus on the greater Toronto area and southwestern Ontario, which has a significantly higher population density than that of Alberta. In light of this anticipated growth, we believe that our current inventory of dried flower and production output levels are appropriate.
As we continue to scale-up production and increase our product offerings, we are applying the lessons learned from the first year of legal recreational cannabis and planning for more conservative production and finished goods inventory levels for the second phase of recreational cannabis products, with the ability to ramp up production as demand increases while ensuring a consistent and reliable supply for provincial and territorial customers, retailers, and Canadian consumers.
Our Adjusted EBITDA1 loss for the second quarter of fiscal 2020 was $150,380, as compared to an Adjusted EBITDA loss of $92,060 for the previous quarter. The Adjusted EBITDA loss attributed to strategic investments and business development was $36,208 in the second quarter, compared to a loss of $18,005 for the previous quarter, as we continue to invest in (1) the build-out of our administrative infrastructure in support of our global expansion strategy, (2) marketing initiatives in advance of our planned launch of CBD products in the United States and other international markets in the coming months, and (3) research and development initiatives related to new product innovation for the recreational markets, and conducting clinical trials to support new cannabis-based human and animal medicines. The Adjusted EBITDA loss attributed to operations in Canada and Europe and corporate overhead was $103,636, compared to $57,819 for the previous quarter. The increase in the loss is largely reflective of our gross margin results, as described above, and other investments made including brand awareness and product marketing initiatives in support of the launch of the second phase of recreational cannabis products in Canada.
The results of our operations in comparison to the second quarter of fiscal 2019 are discussed below under “Part 3—Results of Operations”.
| 1 | Adjusted EBITDA is a non-GAAP measure, and is calculated as earnings before interest, tax, depreciation and amortization, share-based compensation expense, fair value changes and other non-cash items, and further adjusted to remove acquisition-related costs. The Company attributes Adjusted EBITDA to its operations and corporate overhead, strategic investments and business development, and non-operating or underutilized facilities. See “Adjusted EBITDA (Non-GAAP Measure)”. |
8
PART 2 – STRATEGY
Our strategy is to position Canopy Growth as the dominant, global leader in cannabis- and hemp-based products and to establish long-term competitive advantages in order to generate industry-leading growth and shareholder returns. We are consistently evolving to balance our path to profitability, top-line revenue growth, and our foundational investments to ensure long-term success. To achieve this, we will focus on (1) completing our infrastructure build-out and executing on our path to profitability at our operating businesses in Canada and Europe; and (2) strategically investing in expanding into new geographies and developing intellectual property.
Operating Businesses
| • | Canadian Recreational and Medical Markets – Canada, with its federally-regulated recreational and medical markets, continues to represent the majority of our revenue. Our investment phase in Canada is nearly complete. These investments included the build-out of our cultivation and post-harvesting facilities and the construction of purpose-built, highly-scalable and automated advanced manufacturing and beverage production facilities required to support a diversified and differentiated portfolio of consumer products across multiple formats, including dried flower products, oils and softgels, and high-margin products such as beverages, edibles, vaping concentrates and vape pens. We have also built our supply chain to include a balanced portfolio of outdoor, greenhouse, and indoor production facilities to meet the diverse needs of the cannabis market, from cost-effective input material to high-quality, finished product cannabis flowers across both the recreational and medical markets. We believe our investments in infrastructure, cannabis and hemp supply, market research, and product marketing will allow us to meet anticipated demand and position us for market leadership when the second phase of recreational consumer products are made available for sale, which we expect to begin in mid-December 2019. |
| • | European Medical Market – Through Spectrum Therapeutics, we are advancing clinical research programs and advancing best-in-class patient and healthcare practitioner programs in order to position ourselves as a trusted market leader in countries where medical cannabis is permissible. With the acquisition of C3 we have recently expanded our cannabis product offerings by adding dronabinol, a registered active pharmaceutical ingredient in certain European countries, to our cannabinoid portfolio. This allows Spectrum Therapeutics to present a full, medically-validated suite of cannabinoid therapies to the benefit of healthcare professionals and patients. Through Storz & Bickel, we are offering consumers advanced, medically-approved vaporizers and other delivery devices. With the recent acquisition of This Works, we plan to introduce new CBD-infused products and brands to the global beauty, wellness, and sleep solution spaces. We have acquired or constructed the infrastructure and obtained the necessary regulatory approvals to expand our cannabis growing and cultivation capacity and strengthen our European supply chain, which will support our strategy of increasing medical cannabis access for patients in countries where it is federally legal and/or permissible to do so. |
| • | Our Brands – Strengthening and differentiating our brand portfolio starts with building awareness and consideration across distinct need states, occasions, price points and age cohorts. This, along with our commitment to develop innovation that expands the market through new formats, inviting new consumers, and |
9
| converting more occasions from the illicit market are key areas of focus. Our diverse portfolio of brands allows us to effectively target specific customer demographics, use occasions and product form factors. |
Strategic Investments and Business Development
| • | United States Market Development – Executing on our United States market development strategy by (1) immediately entering the United States hemp and CBD market subsequent to the passage of the Farm Bill (as defined below), including conducting research and development into hemp cultivation, and investing in hemp cultivation, processing, extraction and production facilities with an objective of bringing consumer CBD products, which may include skincare and cosmetics, topical creams, vape products, beverages, edibles, oils and softgels, to market in the United States. We have invested in large-scale hemp extraction, processing and production facilities in New York and Illinois. In addition, we have built our hemp supply chain in the United States through partnering with a diverse group of contract farmers and manufacturers across several states for the cultivation, extraction, processing and production of hemp-derived products; and (2) entering into the arrangement agreement with Acreage, a leading United States multi-state cannabis operator, in April 2019 (the “Acreage Arrangement Agreement”). This provides Canopy Growth with the option (“Call Option”) and the requirement to acquire all of the issued and outstanding securities of Acreage, contingent on the occurrence (or waiver) of changes in United States federal law to permit the general cultivation, distribution, and possession of marijuana or to remove the regulation of such activities from the federal laws of the United States (the “Triggering Event”). We anticipate that if the acquisition of Acreage is completed, it will accelerate our pathway into cannabis markets in the United States, once federally-permissible. Finally, Canopy Growth and Acreage executed a licensing agreement granting Acreage access to Canopy Growth’s brands, including Tweed and Tokyo Smoke, along with other intellectual property. We, together with Acreage, are evaluating opportunities to begin deploying these brands in the United States. |
| • | Global Expansion – Expanding globally and increasing our total addressable market by pursuing business opportunities in countries where it is federally legal and/or permissible to do so, including (1) building, acquiring, or entering into partnerships with third parties to expand our cannabis growing and cultivation capacity, value-added cannabis- and hemp-based production capability, and sales operations; (2) advancing clinical research and best-in-class healthcare practitioner and patient education programs through Spectrum Therapeutics; and (3) the introduction, and export of cannabis, cannabis-based medicines, and consumer CBD products to countries outside of Canada. Further, we believe we have an opportunity to leverage and deploy the business model we developed in Canada over the past 5 years that has resulted in significant growth, and which has been highly successful in both the Canadian medical and recreational markets, to establish ourselves as the early leader in countries where forms of cannabis are already legal and permissible or where governments are actively |
10
| moving towards legalization. Having established the necessary local teams and partnerships, we are now squarely focused on execution of commercial sales. |
| • | Innovation and Product Development – Conducting research and development and acquiring businesses focused on developing intellectual property related to (1) new product development and introduction, including value-added, high-margin cannabis and hemp-based consumer products that are being developed in preparation for the second phase of recreational cannabis and hemp in Canada. These products include beverages that span multiple categories and occasions, including recreational and athletic drinks; pain and anxiety relief therapies; sleep aids; other health and wellness products; animal health products; and advanced consumer products such as vapes and other medically-approved cannabis-delivery devices. With the acquisition of a majority interest in BioSteel Sports Nutrition Inc. (“BioSteel”) in October 2019, we entered the sports nutrition and hydration market with a strong and growing brand and laid the groundwork for infusing CBD in future product offerings in accordance with global regulations. We believe these investments will increase our total addressable market, allow us to position our products as premium offerings at the onset of the second phase of recreational consumer products in Canada, and capture higher gross margins through the sale of value-added products; (2) creating research-driven, protectable medical product formulations and driving these products through robust clinical studies to create new cannabis-based medicines; and (3) innovation focused on optimizing our cannabis growing and manufacturing capability, including developing higher-yielding plant genetics and continuing to scale and enhance our extraction capability. |
| • | Production Capability and Capacity – Expanding our licensed production, processing, oil extraction, advanced manufacturing and beverage production infrastructure in order to establish the commercial scale required to supply the domestic Canadian recreational and medical markets, including preparing for the second phase of recreational consumer products in Canada and permissible international markets. We are diversifying our licensed production capacity in Canada by investing in indoor, greenhouse and outdoor cannabis cultivation capacity, as well as outdoor hemp production capacity. Additionally, we continue to invest in developing intellectual property in the areas of the manufacturing of device and delivery technologies, large-scale cannabis processing, production and packaging, and cannabis plant genetics. Internationally, we hold licences for large-scale cultivation and production space in 3 continents and the expertise we have gained in developing our production capability in Canada will be leveraged as we continue building-out our international supply chains. |
United States Market Development
Conducting Business in the United States
Canopy Growth will only conduct business activities related to growing or processing cannabis in jurisdictions where it is federally permissible to do so. Canopy Growth is not considered a U.S. Marijuana Issuer nor does the Company have material ancillary involvement in the United States cannabis industry in accordance with the Staff Notice.
While we have several partnerships with United States-based companies that may themselves participate in the United States cannabis market, these relationships are licensing relationships that see intellectual property developed in the United States brought into Canada, and in no manner involve Canopy Growth in any activities in the United States respecting cannabis. As discussed below, certain entities in which the Company holds securities may operate in the United States cannabis industry, however, our investment in such entities has been structured such that we hold non-participating, non-voting securities that are only exercisable or exchangeable upon cannabis becoming legal or permissible in the United States under federal law. Further, we have developed specific plans related to establishing business operations in the United States in the event cannabis becomes federally permissible which are discussed below.
Passage of the Farm Bill, Potential Future Permissibility of Cannabis in the United States and Our Related Investments in Hemp and CBD
On December 20, 2018, the Agricultural Improvement Act of 2018 (the “Farm Bill”) was signed into law in the United States. The Farm Bill, among other things, defines industrial hemp, removes industrial hemp and its cannabidiols, including CBD derived from industrial hemp but excluding THC, from the United States Controlled Substances Act (the “CSA”) and allows for industrial hemp production and sale in the United States. On October 29, 2019 the United States Department of Agriculture (“USDA”) announced the establishment of the U.S. Domestic Hemp Production Program, providing a consistent regulatory framework around hemp production through the United States. An interim final rule formalizing the program was released in early November, and will allow hemp to be grown under federally-approved
11
plans and make hemp producers eligible for a number of agricultural programs. The rule will also include provisions for the USDA to approve hemp production plans developed by states, including testing the levels of THC and licensing requirements. The United States Food and Drug Administration (the “FDA”) has retained authority over the addition of CBD to products that fall within the Food, Drug, and Cosmetic Act (the “FDCA”). There can be no assurance that the FDA will approve CBD as an additive to products under the FDCA. Additionally, the 2018 Farm Bill does not legalize CBD derived from “marihuana” (as such term is defined in the CSA), which is and will remain a Schedule I controlled substance under the CSA. The FDA has expressed a willingness to take a flexible regulatory approach to foster the development of hemp-derived products such as CBD; however, the FDA has indicated that those actions will have to fit under the confines of current law and further legislation will likely be required. Furthermore, multiple legislative reforms related to cannabis are currently being considered by the federal government in the United States. Examples include the Strengthening the Tenth Amendment Through Entrusting States Act and the Secure and Fair Enforcement Banking Act. There can be no assurance that any of these pieces of legislation will become law in the United States.
Leading up to and following passage of the Farm Bill, we have positioned ourselves to advance our hemp interests in the United States. We have built our hemp supply chain in the United States through partnering with a diverse group of contract cultivators and growers across several states. In 2019, we secured a 308,000 square foot facility in Kirkwood, New York. The renovation of the facility in Kirkwood recently commenced, and once fully renovated it will support our large-scale hemp-derived cannabinoid extraction and related product manufacturing capability in the United States.
Additionally, we own an industrial-scale facility in Batavia, Illinois through our recent acquisition of bio-product extractor KeyLeaf Life Sciences (“KeyLeaf”) (see “Hemp and CBD Products” below for further details). This facility has been certified by the FDA and licensed by the state of Illinois for hemp processing and specializes in ensuring that extraction output is free of impurities in products intended for consumption. Furthermore, we have identified proven contract extraction and manufacturing partners to strengthen our supply chain for the extraction, processing and production of hemp-derived products. Our facilities in Kirkwood, New York and Batavia, Illinois, together with our partnerships with third-party contract manufacturers, will be critical in processing the extract required to supply and sustain our program in which we plan to bring a broad portfolio of CBD products to the United States market, which may include skincare and cosmetics, topical creams, vape products, beverages, edibles, oils and softgels, as permissible by regulations or law.
We have also entered into strategic partnerships in order to build our brand awareness around hemp and CBD-based products, including engaging Martha Stewart in an advisory role to assist with developing and positioning a new line of CBD-based product offerings across multiple categories such as animal health and wellness.
Acreage Transaction
In late June 2019, subsequent to receiving all necessary approvals from the shareholders of Acreage and Canopy Growth and obtaining the final order from the Supreme Court of British Columbia, Canopy Growth and Acreage implemented the previously-announced plan of arrangement (the “Acreage Plan of Arrangement”) which grants Canopy Growth the Call Option and the requirement to acquire all of the issued and outstanding securities of Acreage upon the occurrence (or waiver) of the Triggering Event. Upon the implementation of the Acreage Plan of Arrangement, shareholders of Acreage and certain other holders of securities convertible into shares of Acreage received an upfront payment of US$300 million. Following the occurrence (or waiver) of the Triggering Event and completion of the acquisition of Acreage, shareholders of Acreage will receive 0.5818 of a Canopy Growth common share for each Acreage share held at the effective time, subject to adjustment in certain circumstances in accordance with the terms of the Acreage Arrangement Agreement (the “Exchange Ratio”). The value of the consideration to Acreage shareholders may change up until the Call Option is exercised as the value is based on the Exchange Ratio. Canopy Growth is permitted to waive the Triggering Event.
Acreage is headquartered in New York City and is a leading vertically-integrated, multi-state operator in United States cannabis. Acreage owns licences to operate (or has management services agreements with licence holders to assist with operating) approximately 90 dispensaries and over 20 cultivation and processing sites in 20 U.S. states. Canopy Growth and Acreage will operate as independent companies until Canopy Growth exercises its Call Option, at which time the combined operations of Canopy Growth and Acreage are expected to create a leader in the United States cannabis market. In connection with the Acreage Arrangement Agreement, Canopy Growth and Acreage executed a licensing agreement granting Acreage access to Canopy Growth’s award-winning line-up of brands such as Tweed and Tokyo Smoke, along with other intellectual property. We, together with Acreage, are in the process of evaluating opportunities to begin deploying these brands in the United States.
Pursuant to the Acreage Arrangement Agreement, Acreage may issue up to 58 million additional subordinate voting shares of Acreage in respect of potential acquisitions. Further information regarding the Acreage Plan of Arrangement is
12
described in Canopy Growth’s Management Information Circular dated May 17, 2019, which is available under Canopy Growth’s profile on SEDAR at www.sedar.com.
Other United States Holdings
While TerrAscend Corp. (“TerrAscend”) and Slang Worldwide Inc. (“Slang”) have interests in cannabis-related business in the United States, we have undertaken steps to structure our security holdings in these entities to insulate Canopy Growth from engaging in any unlawful United States cannabis-related activities. Canopy Growth has no voting rights nor economic interests in these entities.
Canopy Growth holds conditionally exchangeable shares in the capital of TerrAscend. These shares are not entitled to voting rights, dividends or other rights upon dissolution of TerrAscend but are convertible into common shares of TerrAscend upon receipt of the approval of the stock exchanges upon which Canopy Growth’s securities are listed and following either changes in United States federal laws regarding the cultivation, distribution or possession of cannabis or changes in the policies of the stock exchanges upon which Canopy Growth’s securities are listed with respect to such activities. The exchangeable shares do not provide (and there are no related contractual rights that would otherwise provide) us with any right to dividends, entitlements upon dissolution of TerrAscend, cash flow or other current economic entitlements, voting rights or any form of control over the business, affairs, operation or financial condition of TerrAscend.
Similarly, Canopy Growth holds conditionally exercisable warrants in the capital of Slang. Canopy Growth is not permitted to exercise the warrants without, among other things, receipt of the approval of the stock exchanges upon which Canopy Growth’s securities are listed and following the date that the growth, cultivation, production, sale, use and consumption of cannabis and cannabis-related products are permitted in the United States for any and all purposes (including medical, therapeutic and recreational) under all applicable federal laws of the United States, including the CSA.
We monitor the activities of TerrAscend, Slang and other entities in which we are invested for compliance with United States cannabis laws, and would make similar arrangements, if necessary, to ensure our ongoing compliance with United States federal laws.
See “Risk and Uncertainties – Stock Exchange Restrictions, Cannabis is a Controlled Substance in the United States, 2018 Farm Bill Risks, Entry Bans into the United States, Banking Risks and Enforceability of Contracts” below.
Global Expansion
Canada has designed and implemented federal regulatory models for both medical and recreational cannabis. Since the legalization of recreational cannabis on October 17, 2018, Canopy Growth has established itself as a leader in both markets in Canada and achieved significant growth by successfully executing on our business model, which includes our investments in cannabis production capability and distribution, developing intellectual property, industry and regulatory knowledge and expertise, and industry-leading physician, pharmacist and patient education in order to build market share and customer loyalty at the outset. Accordingly, we believe that a significant opportunity exists today to leverage and deploy our Canadian “playbook” and our financial strength to establish ourselves as the first-mover and market leader in countries which have legalized or are exploring the legalization of medical cannabis.
In recent years, the actions of governments around the world have signaled a significant change in attitudes towards cannabis, and federal governments in over 40 countries have either formally legalized medical cannabis access or established government efforts to explore the legalization of medical cannabis access. Therefore, future opportunities are likely to exist for Canopy Growth in jurisdictions where governments are actively moving towards a legal framework.
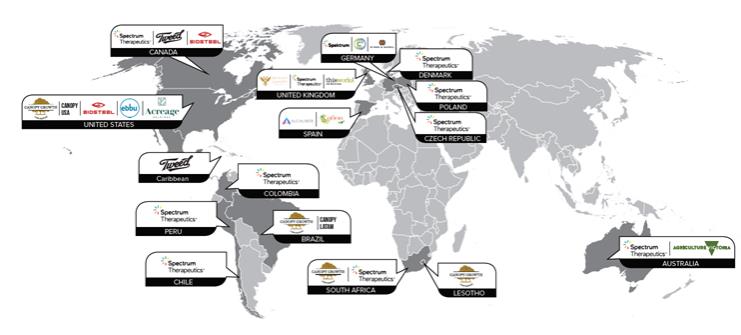
To date, Canopy Growth has secured the necessary regulatory approvals to export cannabis or cannabis materials (such as clones or tissue cultures) to Australia, Brazil, Chile, Colombia, Czech Republic, Denmark, Germany, Jamaica, Lesotho, Poland, Spain, South Africa, the United Kingdom, and the United States.
To date, we have announced subsidiaries, partnerships or business activities in several countries as described below.
Figure 1: International subsidiaries, partnerships or business activities
13
Europe
In the second quarter of fiscal 2020 we continued our progress on the integration of the recent acquisition of C3 and are offering a full portfolio of medically-validated cannabinoid therapies and products to our healthcare practitioners and patients in Europe, and advanced, medically-approved Storz & Bickel vaporizers and other delivery devices. In addition, with the acquisition of This Works we plan to introduce new CBD-infused products and brands to the global beauty, wellness, and sleep solution spaces.
We have continued to invest in our infrastructure in Europe. Our state-of-the-art greenhouse facility in Denmark is expected to supply the growing demand for Spectrum Therapeutics products across the continent and support our ultimate goal of increasing access for patients across Europe, offering a greater range of products, and allowing for an early-mover advantage as new countries open their doors to medical cannabis. In October 2019, Spectrum Therapeutics was awarded the exclusive contract to supply medical cannabis to Luxembourg.
Germany – Spectrum Therapeutics operates as a pharmaceutical distributor with the necessary approvals in Canada and Germany to export/import medical cannabis for sale to German patients. In May 2019 we acquired Germany’s C3, Europe’s largest cannabinoid-based pharmaceuticals company and a leading manufacturer and distributor of dronabinol, a registered active pharmaceutical ingredient in Germany, Austria, Switzerland and Denmark. C3 operates two state-of-the-art manufacturing facilities specializing in natural extraction and synthetic cannabinoid production, which are scheduled for further expansion this year to accommodate forecasted rapid growth in the business. The acquisition of C3 enhances our European infrastructure and provides a robust sales and marketing organization which already serves pharmacies and healthcare practitioners. In addition, C3 holds several patents related to cannabis including extraction technology and the synthetic production process and has several clinical trials underway.
Additionally, we acquired Storz & Bickel GmbH & Co., KG (“Storz & Bickel”) in December 2018. Storz & Bickel is widely recognized as a global leader in the design and manufacture of medically-approved vaporizers and other delivery devices at its certified, automated factory, and exports its devices to 50 markets around the world.
Denmark – We retrofitted a building in Odense, Denmark which now includes approximately 300,000 square feet of licensed greenhouse cultivation and post-harvest processing capability, and Spectrum Therapeutics received the necessary licensing which allows us to cultivate, harvest, export and sell medical cannabis in dried flower form. To our knowledge, Spectrum Therapeutics is the first Canadian company to receive a federal production licence in Denmark. The Danish greenhouse has completed pilot harvests, and commercial-scale cultivation has begun. The necessary
14
regulatory approvals were received from the Danish government in October 2019, and we expect the cannabis harvested and processed by the Danish facility to begin serving European markets in late calendar 2019.
Poland – After completing a rigorous regulatory approval process, we completed our first import of medical cannabis into Poland in the fourth quarter of fiscal 2019. According to the Polish Pharmaceutical Chamber, which represents about 15,000 pharmacies in Poland, it is estimated that up to 300,000 patients could qualify for medical cannabis treatment and as the only producer that imports product in this country, we expect that our first-mover advantage will allow us to maintain dominant market share.
Spain – We completed the all-cash acquisition of Cáñamo y Fibras Naturales, S.L. (“Cafina”) in March 2019, with Cafina being one of three companies in Spain authorized to cultivate, distribute and export cannabis containing more than 0.2% THC for medical and research purposes. Cafina is also licensed to cultivate hemp. This acquisition allows us to expand our European production footprint and improve our long-term positioning to address demand across Europe for medical cannabis and CBD products. Additionally, we entered into a supply licence agreement with Spain’s Alcaliber S.A. (“Alcaliber”) in fiscal 2018 pursuant to which we will grant Alcaliber a licence to use certain strains and seeds to be grown and cultivated at Alcaliber’s facilities for sale worldwide. We completed a transfer of 1,500 cannabis clones to Alcaliber, and in early fiscal 2019 Alcaliber shipped the first group of clones to Denmark.
United Kingdom – We began operating in the United Kingdom in early 2019 with a focus on providing patients with reliable access to cannabis-based medical products. In October 2019, Spectrum Therapeutics received the necessary government licenses to store and distribute medical cannabis products, reducing prescription delivery times and allowing the importation of medical cannabis into the United Kingdom from our European and global networks. Our focus in the United Kingdom so far has been in educating pharmacists and patients. Further, we recently completed two acquisitions:
| • | TWP UK Holdings Limited (“This Works”) in May 2019, a global leader in natural skincare and sleep solutions with a customer base spanning 35 countries; and |
| • | The outstanding, unowned shares in Beckley Canopy Therapeutics (“BCT”) in October 2019, including the joint commercial venture Spectrum Biomedical UK. BCT was formed as a joint venture in January 2018 to research and develop clinically-validated cannabis-based medicines, with a strong focus on intellectual property protection, and will be integrated into the broader Spectrum Therapeutics organization to increase the breadth of the clinical research being pursued under the Spectrum banner and to combine the continental European and United Kingdom commercial teams. |
Czech Republic – We acquired Annabis Medical s.r.o., a leader in the Czech Republic’s medical cannabis industry, in the first quarter of fiscal 2019. We currently import and distribute cannabis products pursuant to federal Czech licences, with products sold through pharmacy channels across the Czech Republic.
Latin America and the Caribbean
Our Latin America and Caribbean business continues to advance medical cannabis in this region, home to more than 650 million people and host to more than 70 million tourist visitors per year. Several individual nations have recently modernized, or are in the process of exploring, legislation for medical and recreational cannabis and CBD products. In alignment with Canopy Growth’s global expansion strategy, our initiatives have been focused on low-cost cannabis production in Colombia and early commercialization efforts for medical cannabis and CBD products in Peru. We will continue to pursue opportunities in Brazil, Chile, and other countries as their regulatory environments evolve, and advance our Spectrum Therapeutics brand in Latin America through the education of physicians and pharmacists.
Colombia – We continue to establish Colombia as our production and processing hub for Latin America and have begun positioning our operations in Colombia as a potential low-cost supplier for markets beyond Latin America in the future. Operations at our fully licensed 126 hectares (13.6 million square feet) growing site continue to move forward, with a harvest expected to be completed in November that will be used to register our cannabis with the Colombia government. Once registered, we will begin our first commercial grow, with the harvest expected in early-to-mid 2020. In addition, we signed a multi-year agreement with Procaps S.A.S. (“Procaps”), a global company that develops, manufactures and markets over-the-counter medications and nutritional supplements for a number of international pharmaceutical companies. Procaps exports to more than 50 international markets, including the United States, and Canopy Growth will leverage Procaps’ industry-leading formulation and encapsulation capacity, which is especially critical in Latin American markets where there is a regulatory preference for oil-based products, such as softgels. The first batch of Procaps products is expected to be sold in Latin America, where legal and permissible, by the summer of 2020.
15
Peru – We launched our operations in Peru in fiscal 2019 and we will actively pursue the Peruvian medical and CBD markets, once open, by leveraging our global expertise in patient and physician education, as well as in medical cannabis production. We have secured an exclusive distribution agreement with Peru’s largest pharmaceutical distributors, thus creating access to approximately 80% of pharmaceutical shelves in the country.
Brazil and Chile – Our core activities in these countries include serving patients through the compassionate patient stream and educating and training physicians through cooperation agreements with leading universities in each country. Further, we remain focused on productive engagement with government and regulators to advance the conversation on access to medical cannabis and CBD-based products in each country.
Caribbean – Across the Caribbean, we are currently focused on medical cannabis sales to the Cayman Islands and setting the stage for future regional sales through marketing activates. Considerable progress has been made towards serving this region with distributor channels in place covering several of the island nations. We also own 49% of Tweed Limited JA, a Jamaican company that holds a cultivation licence and greenhouse.
Asia/Pacific
Australia – Canopy Growth and the Victoria state government launched our Australian operations early in fiscal 2019. The first shipment of medical cannabis oil was received in Australia in April 2019, and Spectrum Therapeutics began selling to medical cannabis patients in May 2019. Construction of a Victoria-based greenhouse and processing facility is currently underway, with completion expected in March 2020. This will enable domestic cultivation and production of high-quality medical cannabis for patients while serving as a planned distribution hub for other jurisdictions in Asia/Pacific. Spectrum Therapeutics will continue supporting Australian patients through imports until the facility is operational. The Victoria-based facility will also operate as our Asia/Pacific research and development center, supporting the ongoing research collaboration between Canopy Growth and the Victoria state government on furthering innovations in medical cannabis.
Additionally, in October 2019 Spectrum Therapeutics announced a partnership with Emerald Clinics Australia which allows the collection of real-world, clinical outcome data for up to 500 patients who had been prescribed Spectrum Therapeutics products throughout the course of their treatment. This data will produce regulatory grade evidence for our medical cannabis products and enable us to better understand the safety and efficacy of our products, with a specific focus on the therapeutic areas of pain, mood and sleep.
Africa
Canopy Growth Africa is headquartered in Cape Town, South Africa and has built a team with expertise across various fields to lead our African expansion strategy. We were accredited in October 2019 with the first and only cannabinoid based medical educational program for Health Care Professionals in Africa. This will enable doctors and allied medical professionals to gain crucial insights into the potential of medical cannabis across a range of conditions.
Lesotho – We hold a licence to cultivate, manufacture, supply, hold, import, export and transport cannabis and its resin in the Kingdom of Lesotho. We have recently been granted a medical hemp production license for 200 hectares (21.5 million square feet) of outdoor grow space, with our first commercial hemp harvest expected in the first quarter of fiscal 2021. We have also commenced cultivation at our 322,000 square foot facility which includes an indoor propagation room, vegetation greenhouse, and an outdoor growing area. High THC and CBD-THC balanced varieties can both be cultivated at this facility. This facility was Africa’s first Good Agricultural Practices (GAP) certified medical cannabis growing facility.
South Africa—We completed our first import and sale of medical cannabis in South Africa during September 2019 and plan to launch a range of CBD products in the coming months. This product launch will be underpinned by a customer education program aimed at assisting the public to make the most informed decisions around quality, standards and usage.
Our Brands
Our diverse platform of brands “under the Canopy” allows us to effectively target specific customer demographics, use occasions and product form factors.
16
Core Brands
Tweed – Tweed’s high-quality, highly-curated cannabis products, places and spaces are tailored to help people reconnect with one another. Our authentic local presence and desire for shared prosperity help us to be a good neighbor to those communities that invite us in.
Tokyo Smoke – Tokyo Smoke is an award-winning cannabis brand delivering immersive, innovative experiences to consumers through cannabis products, accessories, and best-in-class retail stores. From our thoughtfully-crafted intent-based classification system to our iconic red lantern logo, Tokyo Smoke pushes creative boundaries, unlocking new ways to explore cannabis.
Van der Pop – With a focus on education, empowerment and community building, Van der Pop is Canopy Growth’s female-focused cannabis brand. Van der Pop provides products and platforms for women to explore using cannabinoids for self-care in a way that is nuanced and respects stigma-free living.
Spectrum Therapeutics – Our international medical brand that serves as our physician and patient-facing identity across all federally-permissible jurisdictions where Canopy Growth operates. “Spectrum” in the name refers to the trademarked colour-coded cannabis strain classification system. Spectrum Therapeutics is positioned as the rational voice in the medical cannabis space with a focus on industry-leading, high-quality research, healthcare professional education, and quality products for patients with pain, mood and sleep conditions.
DOJA – DOJA is based in British Columbia’s Okanagan Valley, where DOJA grows premium, hand-crafted flower. DOJA represents celebrating the freedom from convention and a respect for the West Coast community and land from which it came.
TWD – TWD is our basic line of safe and affordable cannabis products from Tweed.
This Works – Founded in 2004, London, England-based This Works offers a range of high-quality natural skincare and sleep solution products that have rewarded the company with a loyal following of customers spanning 35 countries. Through their unique approach of formulating solutions that work in harmony with the 24-hour body clock, This Works has evolved its product lines beyond a traditional viewpoint to a more complete regiment. This Works plans to introduce a CBD-based line of offerings in federally permissible markets.
BioSteel – BioSteel is a leading sports nutrition brand that was built on the mandate of providing the safest, healthiest and most effective line of nutritional products. Originally formulated for the best athletes in the world, BioSteel’s line of nutritional products have become adopted by the masses through authentic partnerships with our #TEAMBIOSTEEL athletes. BioSteel plans to introduce CBD-based products in federally permissible markets.
17
Beverage Brands
Quatreau – Quatreau is a line of deliciously refreshing cannabis-infused, naturally flavoured sparkling water beverages available in CBD-only and THC/CBD balanced varieties. Quatreau believes in making daily situations a little more simple, enabling consumers to reset and recharge before tackling what’s next.
Deep Space – Deep Space is a mysterious and full flavoured cannabis-infused spiced cola beverage with a higher dose of THC than other offerings across Canopy Growth’s portfolio. With 10 milligrams of THC per serving offered in an easy-travel 222 milliliter mini can, Deep Space aims to unlock a collective journey of possibility and discovery.
Edibles Brands
Bean & Bud Craft Cannabis Company – Bean & Bud is a line of premium, bean to bar cannabis-infused dark chocolate with 5 milligrams of THC per serving. Hand-crafted by the award-winning chocolate makers at Hummingbird Chocolates and made in small batches – the attention to detail and meticulous process adds a special touch for consumers to savour life’s moments.
Technology Brands
Storz & Bickel – Based in Tuttlingen, Germany, Storz & Bickel are designers and manufacturers of medically approved vaporizers, most notably the Volcano Medic and the Mighty Medic. Exported to 50 markets around the world and with a 23-year track record of breakthrough innovations, Storz & Bickel is widely recognized as a global leader in vaporizer design and manufacturing.
Affiliated Brands
Houseplant – An elevated Canadian cannabis company founded by Seth Rogen and Evan Goldberg and launched in 2019, Houseplant is rooted in commitment, authenticity and education. Their love affair with cannabis has spanned a lifetime, and they believe it should be treated with the reverence it deserves. Each element of their suite of products, and every part of their identity have been thoughtfully designed and considered.
More Life Growth Company – A wellness-based cannabis company and joint venture between two Canadian trailblazers. Owner/Founder Aubrey “Drake” Graham – a cultural leader, entrepreneur and entertainment icon – joined forces with Canopy Growth to commercialize a premium, licensed product lineup in Canada and future global markets.
DNA Genetics – DNA Genetics has won awards in every category in the Cannabis Cup, the world’s preeminent cannabis competition. Working with DNA Genetics, Canopy Growth breeds new strains for customers that are simply not available anywhere else in the world, bringing the best of existing DNA Genetics to Canopy Growth customers, bred and grown to DNA standards.
LBS – LBS is a premier cannabis brand by entertainment icon Snoop Dogg available in the United States and licensed by Canopy Growth in Canada. LBS embodies the “California Vibe”.
Green House Brands – Green House Brands are globally recognized award-winning cannabis brands that will be introduced into Canada market. Established in 1985, the Green House Brands portfolio includes Green House Seed Co. and Strain Hunters, both of which market exclusive cannabis strains. Green House Brands are expected to launch in 2020.
Organa Brands – Organa Brands is home to some of the world’s largest consumer cannabis brands, including O.penVAPE, Bakked, Magic Buzz and District Edibles. Organa Brands is expected to launch in the Canadian recreational market in 2020.
Retail Strategy and Brands
18
The Cannabis Act provides provincial, territorial and municipal governments with the authority to prescribe regulations regarding retail and distribution of recreational cannabis. As such, the distribution model for recreational cannabis is prescribed by provincial regulations and differs from province to province. Some provinces have government-run retailers, while others have government-licensed retailers, and some have a combination of the two. All of our recreational sales are conducted according to the applicable provincial and territorial legislation and through applicable local agencies. We continue to monitor the developing legislation to identify opportunities for our brands.
We are pursuing a cannabis retail presence in provinces, where permitted, to capture retail gross margin, higher market share, educate consumers, build recognition for our Tweed and Tokyo Smoke brands, and establish direct connections with customers. Offering two distinct customer experiences will allow us to appeal to various consumer demographics without saturating any single segment.
In the second quarter of fiscal 2020, we opened 2 additional cannabis retail stores operating under the Tweed or Tokyo Smoke banner, of which 1 is corporate owned and 1 is operated by partners.
As of November 14, 2019, we have 27 cannabis retail stores operating under the Tweed or Tokyo Smoke banner, of which 22 are corporate-owned stores and the balance are operated by our partners. Tweed has 16 corporate-owned locations selling cannabis across Newfoundland & Labrador, Manitoba and Saskatchewan and has a branded e-commerce presence in Newfoundland & Labrador, Manitoba, Saskatchewan and Nunavut. Tokyo Smoke operates 6 corporate-owned retail cannabis stores and an e-commerce platform in Manitoba.
Further, we have received licences, rights to licences or permits to apply for licences to operate cannabis retail stores in 4 provinces:
| – | Newfoundland & Labrador—licences for up to 7 stores; |
| – | Manitoba—licences for up to 15 stores; |
| – | Saskatchewan—licences for up to 5 stores; and |
| – | Alberta – development permits for 18 cannabis retail store locations. |
In Ontario, we have entered into multi-year licensing agreements to enable our partners to open 2 Tokyo Smoke-branded stores and 1 Tweed-branded cannabis store. We are continuing to explore additional opportunities to expand the Tokyo Smoke and Tweed retail banners across the province. We are also pursuing cannabis retail licences in British Columbia through the provincial retail licensing processes.
Positioning of Canopy Growth’s Brands in the United States
As part of the implementation of the Acreage Plan of Arrangement, Canopy Growth and Acreage executed a licensing agreement granting Acreage access to Canopy Growth’s diversified portfolio of brands, including Tweed, Spectrum Therapeutics, CraftGrow and Tokyo Smoke, across the United States. See “United States Market Development – Conducting Business in the United States” above.
Innovation and Product Development
Our intellectual property portfolio has increased to an industry-leading 130 issued patents and over 300 patent applications as of November 14, 2019, with more applications under development. Our patents cover cannabis-based beverage production and medical treatments, device and delivery technologies, large-scale cannabis processing, and plant genetics. We believe significant opportunity exists to improve our profit margins by vertically integrating up the value chain towards products that treat cannabis and cannabinoids as ingredients, a view which applies to both the medical and regulated recreational cannabis/cannabinoid markets. Therefore, we are investing in research and development and acquiring businesses focused on developing intellectual property related to new product innovation, including the development of cannabis-based consumer recreational products and cannabis-based medical therapies, CBD products, and device and delivery technology.
Product Innovation
Consumer Recreational Products
19
Based on the legalization and regulation of the second phase of recreational cannabis and hemp products in Canada, which was announced by the federal government on October 17, 2019, we plan on having our value-added, cannabis-based consumer recreational products available for sale in Canada beginning in mid-December 2019 and will include:
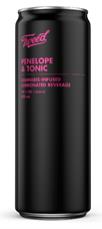
| • | Cannabis-infused beverages, which are being produced in our new 160,000 square foot beverage facility in Smiths Falls. Through our extensive research and development efforts we have developed a proprietary process that distills whole flower cannabis into a clear liquid that will be used as an active ingredient in our beverages. Our beverages will include a portfolio of 10 ready-to-drink products and 3 distilled cannabis products that can be combined with non-alcoholic mixers and that will be offered in a variety of flavours and sizes under the Tweed, Quatreau, Houseplant and Deep Space brands. We believe that high-quality cannabis-based beverages that offer sophisticated taste and dose control with a rapid on-set and shorter duration can be tailored to meet specific outcomes across a variety of consumption occasions, while avoiding such things as weight gain, “hangover” effects, and interactions with traditional pharmaceutical medications. Given this, we believe cannabis-infused beverages could serve as a disruptive alternative to traditional alcohol beverages while also expanding the total addressable market for all cannabis-based products. While our products will contain THC, CBD, or a combination of the two cannabinoids up to the limit of 10 milligrams of THC per package set by Health Canada, we believe a standard serving of 2 milligrams of THC is ideal for consumers and allows for more control for the user, and therefore most of our beverages will be available at this potency. Images of our Tweed brand Penelope + Tonic, and Quatreau brand Ginger + Lime products are below: |
| • | Cannabis-infused craft chocolates, which are being produced in the same factory in Smiths Falls where Hershey Canada made chocolates for over 50 years. We have partnered with award-winning chocolate makers Hummingbird Chocolate to build and refine our chocolate manufacturing process and will be selling 3 distinct products under the Tweed, Tokyo Smoke and Bean & Bud brands. We have taken a “bean-to-bar” approach to our chocolates, sourcing our beans from Peru, the Dominican Republic and Colombia and then roasting them onsite in Smiths Falls to achieve optimal flavour. Similar to our beverages, our chocolates will contain specific amounts of specifically-formulated cannabis up to a limit of 10 milligrams of THC per package. We will launch more edible products in the months and years ahead. |

20
In preparation for this launch, we invested in the construction of extraction facilities and advanced manufacturing, edible and beverage production facilities in Smiths Falls, Ontario. We continue to invest in new product development through research and development and the acquisition of new technologies, while ensuring the protection of our intellectual property.
BioSteel
On October 2, 2019 we completed the purchase of a majority interest in BioSteel, a leading producer of sports nutrition products. BioSteel provides us with a platform to enter the sports nutrition and hydration market, and lays the foundation for the infusion of CBD in future product offerings in accordance with global regulations. BioSteel has achieved a reputation for being the hydration provider of choice for high performance athletes, and its products have been purchased by over 70% of the teams in North America’s four major sports. Additionally, BioSteel has over 10,000 distribution points in Canada and the United States and continues to expand in both markets and into Europe.
Devices and Delivery Technology
We are focused on expanding our product development, manufacturing capacity and sales capability in the cannabis consumer products market. Our research and development group has been actively developing safety-approved smart vaporizer devices for use with cannabis concentrates. These devices, powered by Canopy Growth-owned intellectual property, are Bluetooth-enabled and communicate with a proprietary application to give users much more payload transparency while enabling safe and responsible usage. Further information about our vaping products will be released in late November 2019, and they will be available for sale when laws and licenses permit.
In addition, through Storz & Bickel we have entered the market for the manufacture and sale of medical cannabis delivery devices. Storz & Bickel has developed an automated factory that is certified internationally for the production of medical devices, and exports medically-approved vaporizers and other similar devices to 50 markets around the world. We plan to build out the capacity of Storz & Bickel’s manufacturing facilities to support its continued growth through new product development and market expansion, while at the same continuing to integrate the product development expertise and capability of Storz & Bickel’s research and development and engineering teams with that of Canopy Growth.
Medical Therapies – Spectrum Therapeutics
Our Spectrum Therapeutics medical division acts as a cannabis research incubator focusing on researching and developing clinically-ready cannabis drug formulations and dose delivery systems. This division serves as our pre-clinical and clinical research arm, which includes elements of product design and ingredient selection, formulation, safety and efficacy testing for a range of products, which we will continue to develop as the regulatory framework and market evolve. We are also testing and developing cannabis-derived products for applications in veterinary medicine, such as treating anxiety in animals.
To date, we have filed 84 United States provisional patent applications (which are included in the 300 total patent applications described above), across a range of cannabis and CBD uses, compositions, formulations, indications, methods of delivery, and dosing regimens.
Human health clinical trials are currently being planned, are ongoing, or have been completed in the areas of sleep, pain and anxiety treatment (Phase IIB), and spasticity/multiple sclerosis (Phase III). Additionally, affiliate and partner research programs are underway in the areas of opioid-sparing, smoking cessation and concussion treatment, and clinical trials are currently in the planning phase, ongoing or completed for companion animal anxiety, and pharmacokinetics, dosage and safety.
Hemp and CBD Products
We have taken steps to diversify our cannabis-related business into the development, production and sale of hemp-based medical, regulated recreational and industrial products. Hemp and cannabis come from the Cannabis sativa L specie but are genetically distinct and are further distinguished by use, chemical makeup and cultivation methods. Hemp, which refers to the non-psychoactive (less than 0.3% THC) varieties of Cannabis sativa L, is a renewable raw material used in thousands of products including health foods, body care, clothing, construction materials, biofuels and plastic composites. We believe that entry into the regulated hemp market, whose regulations allow for more robust consumer-facing brand marketing, advertising and retail channels, will serve to strengthen our consumer facing brands in the future.
21
We believe that we are positioned as a leader in low-cost, high-yield CBD production. We have expertise in large-scale cannabinoid extraction processes with our unique whole-plant hemp harvesting knowledge, and we continue investing in extraction capability to support our innovation in the value-added, consumer recreational products market. We first established a relationship with KeyLeaf, the owner of a bio-processing and large-scale extraction facility in Saskatchewan, in fiscal 2019 and controlled and consolidated KeyLeaf from that point and subsequently acquired the entity in June 2019. KeyLeaf adds over 45 years of experience in bio-product industries and significant intellectual property in the area of plant-based extraction to our capabilities. Also, KeyLeaf has been partnering with Canopy Growth over the past year to retrofit their facility in Saskatchewan in order to scale-up their ability to process hemp and cannabis biomass and refine their pre- and post-extraction processes, and the facility was recently licensed by Health Canada. The KeyLeaf facility is located in close proximity to our large-scale outdoor hemp and cannabis growing operations. This facility, along with our other licensed extraction facilities in Smiths Falls and Aldergrove, British Columbia and partner extraction capability, will be leveraged to process our outdoor hemp and cannabis output, as well as other raw materials from our indoor and greenhouse cultivation facilities.
Further, we have integrated the intellectual property of ebbu, Inc. (“ebbu”), a Colorado-based hemp research leader with over 40 cannabis-related patent applications representing over 1,500 inventions, into our broader portfolio of capabilities. Research and development and intellectual property advancements achieved by ebbu’s team apply directly to our hemp and THC-rich cannabis genetic breeding program and its cannabis-infused beverage capabilities, with the potential to reduce the cost of CBD production. In addition, ebbu’s intellectual property portfolio will contribute to the clinical formulations program being executed by Spectrum Therapeutics.
Our investments in CBD production capability, extraction processes and genetic breeding will allow us to produce a complimentary balance of low-cost, high-yield raw material input for the higher-margin, value-added products which will be launched as part of the second phase of recreational cannabis in Canada, as well as input for the CBD applications and products being developed by Spectrum Therapeutics.
Production Capability and Capacity
Domestic Cannabis Production and Manufacturing Capability
We operate numerous state-of-the-art production facilities and have approximately 5.4 million square feet of licensed capacity in Canada for greenhouse and indoor cultivation, post-harvest processing, oil extraction, encapsulation, advanced manufacturing for pre-rolled joints and chocolates, vape manufacturing and beverage production capability. We have invested in the readiness of our facilities to establish a leadership position at the onset of the second phase of recreational consumer products in Canada in mid-December 2019, including the expansion of our Smiths Falls facilities:
| • | We have completed construction of our 160,000 square foot beverage manufacturing facility, for which we expect to receive licensing and begin operations in November; |
| • | New facilities designed for vape filling and packaging have received licensing from Health Canada, and automated vape production and packaging systems have been tested and will be placed into operation in November; and |
| • | Advanced manufacturing equipment related to chocolate manufacturing are onsite and tested, and the associated facilities have received licensing. |
In addition, we recently expanded our Canadian outdoor footprint with a licence to cultivate cannabis at a 160 acre (approximately 7 million square feet) outdoor site in Saskatchewan, adding to our existing 5,500 acre outdoor hemp production platform.
Partner Capacity Offtake
We have established several programs designed to help partners, including licence applicants and licensed producers, establish and/or grow their licensed operations and achieve greater success faster. Through these programs, additional cannabis production capacity will be secured for sale to our customers.
CraftGrow – Recognizing that every patient is different and every condition requires a unique approach, CraftGrow provides customers options when it comes to finding medical cannabis products that best address their needs. By building a program that gathers passionate and skilled producers together in one place, Spectrum Therapeutics is able to bring its patients the best variety cannabis from some of the most innovative producers in the country. While medical patients
22
benefit from additional innovation and variety, partner producers gain access to a vast market for their product lines. Our three partners can be found at www.spectrumtherapeutics.com.
Agripharm Corporation (“Agripharm”) – 40% owned by Canopy Growth, we have the right to purchase all the cannabis products produced by Agripharm, subject to the right of Agripharm to sell up to 25% of its products directly in its own bricks-and-mortar retail locations.
PharmHouse Inc. (“PharmHouse”) – In May 2019 we signed a second offtake agreement with PharmHouse, a 49%-owned joint venture of Canopy Rivers Inc. (“Canopy Rivers”). In July 2019 PharmHouse received a cultivation licence from Health Canada. Under the terms of the agreement, PharmHouse has agreed to allocate to Canopy Growth high-quality cannabis flower from an additional 20% of the flowering space available at its Leamington, Ontario facility over the next three years, bringing the total flowering space committed to Canopy Growth to 30%. Under the terms of the offtake agreement PharmHouse is committed to complying with Good Manufacturing Practices-certified flower within 18 months of receiving its cultivation licence, allowing us to export flower produced by PharmHouse internationally.
Canopy Rivers
Canopy Rivers (TSXV:RIV) works collaboratively with Canopy Growth to identify strategic counterparties seeking financial and/or operating support and affiliation. The result is an ecosystem of complementary companies operating throughout the cannabis value chain. As the portfolio continues to develop, each constituent benefits from opportunities to collaborate with Canopy Growth and amongst themselves, which we believe results in an ideal environment for innovation, synergy, and value creation for Canopy Rivers, Canopy Growth, and across the entire Canopy Rivers ecosystem. As a result of a dual-class share structure, Canopy Growth owns approximately 27.5% of the issued and outstanding shares in the capital of Canopy Rivers and approximately 84.5% of the voting power attached to all of the outstanding shares.
To date, in collaboration with Canopy Growth, Canopy Rivers has established a diversified portfolio of cannabis industry investments that includes large-scale greenhouse cannabis cultivators, small-scale premium cannabis cultivators, licence applicants, international hemp processors, pharmaceutical formulators, brand developers and distributors, retail distribution licence operators, technology and media platforms, beverage companies, beauty brands, and agriculture-technology companies.
Other Matters
As part of our United States financial reporting requirements, Canopy Growth is required by the SEC to test whether it continues to qualify as a foreign private issuer at the end of every second fiscal quarter. Canopy Growth confirmed that, as of September 30, 2019, it no longer met the criteria for qualification as a foreign private issuer because (1) more than 50% of the outstanding voting securities are held by residents of the United States, and (2) the majority of Canopy Growth’s directors are United States citizens.
Therefore, as of April 1, 2020 Canopy Growth will be considered a United States domestic issuer and a large accelerated filer. As a result of this change, Canopy Growth will be required to issue its consolidated financial statements in conformity with accounting principles generally accepted in the United States, and provide an auditor attestation report under Section 404(b) of the Sarbanes-Oxley Act.
Subsequent Events
Acquisition of BioSteel
On October 1, 2019, we completed an all-cash transaction to purchase a controlling interest in BioSteel, a North America-based producer of sports nutrition products. Initial cash consideration was $50,535, subject to certain adjustments and holdbacks. The purchase price will be subject to a further adjustment based on a multiple of BioSteel’s 2019 net revenue. Immediately following the closing we subscribed for additional shares of BioSteel for consideration of $14,000. After completing the investment, Canopy Growth’s ownership interest in BioSteel is 76.7%.
The shares not purchased by Canopy Growth will be retained by current shareholders and management for a period of up to 5 years (the “rollover shareholders”). On the third anniversary of the closing Canopy Growth will have a right to purchase, and rollover shareholders will have a right to sell one half of the remaining interest held by the rollover shareholders to Canopy Growth at a specified valuation based on a multiple of BioSteel’s net revenue. On the fifth anniversary of the closing Canopy Growth will have a right to purchase, and rollover shareholders will have a right to sell the balance of the remaining interest held by the rollover shareholders to Canopy Growth at a valuation to be mutually agreed upon by the parties.
23
Acquisition of Beckley Canopy Therapeutics
On October 11, 2019, we closed the previously announced acquisition of all of the unowned shares in BCT, a global cannabinoid-based medical researcher for cash consideration of $58,000 of which $44,000 was advanced on closing. Through this acquisition Canopy Growth will also acquire BCT’s 33% equity interest in Spectrum Biomedical UK, which was formed as a joint venture between Canopy Growth and BCT and is to be the exclusive UK distributor of cannabis-based medicinal products made by Canopy Growth.
Sale of interest in AusCann
On October 15, 2019, Canopy Growth sold its shares in AusCann Group Holdings for gross proceeds of $5,616.
More Life Growth Company
On November 7, 2019, Canopy Growth announced that it had entered into agreements with certain entities that are controlled by Aubrey “Drake” Graham to launch the More Life Growth Company (“More Life”).
Under the agreements Canopy Growth will sell 100% of the shares of 1955625 Ontario Inc., a wholly-owned subsidiary of Canopy Growth that holds the Health Canada license for a facility located in Scarborough, Ontario to More Life in exchange for a 40% interest in More Life. Drake will hold a 60% ownership interest. As consideration for Drake’s interest, Drake has granted More Life the right to exclusively exploit certain intellectual property and brands in association with the growth, manufacture, production, marketing and sale of cannabis and cannabis-related products, accessories, merchandise and paraphernalia in Canada and internationally. The maintenance of the non-Canada rights after 18 months is contingent upon certain performance criteria of More Life. More Life has sublicensed such rights in Canada to Canopy Growth in exchange for royalty payments.
Canopy Growth and Drake have entered into a shareholders agreement, investor rights agreements, and various other ancillary agreements to govern the operations of More Life. Canopy Growth will continue to provide all of the day-to-day operations and maintenance of the More Life Facility and will retain all of the rights to distribute the product that is cultivated at the More Life Facility.
24
PART 3 – RESULTS OF OPERATIONS
Operational and Financial Highlights – Second Quarter of Fiscal 2020
The following table presents selected operational and financial information for the three months ended September 30, 2019 and 2018:
| Three months ended | ||||||||||||||||
| September 30, | September 30, | |||||||||||||||
| 2019 | 2018 | Change | % Change | |||||||||||||
| Operational information |
||||||||||||||||
| Kilogram and kilogram equivalents sold1 |
10,913 | 2,197 | 8,716 | 397 | % | |||||||||||
| Average selling price per gram - Recreational |
$ | 5.69 | $ | — | — | — | ||||||||||
| Average selling price per gram - Canadian Medical |
$ | 8.20 | $ | 9.57 | $ | (1.37 | ) | (14 | %) | |||||||
| Average selling price per gram - International medical |
$ | 43.70 | $ | 13.58 | $ | 30.12 | 222 | % | ||||||||
| Average selling price per gram - Total |
$ | 7.50 | $ | 9.87 | $ | (2.37 | ) | (24 | %) | |||||||
| Kilograms harvested |
40,570 | 15,217 | 25,353 | 167 | % | |||||||||||
| (CDN $000’s, except share amounts and where otherwise indicated) |
|
|||||||||||||||
| Selected financial information |
||||||||||||||||
| Net revenue ` |
$ | 76,613 | $ | 23,327 | $ | 53,286 | 228 | % | ||||||||
| Gross margin percentage |
5 | % | (83 | %) | $ | — | 88 | % | ||||||||
| Adjusted EBITDA2 |
$ | (150,380 | ) | $ | (88,879 | ) | $ | (61,501 | ) | (69 | %) | |||||
| Attributed as follows: |
||||||||||||||||
| - Operations and corporate overhead |
$ | (103,636 | ) | $ | (77,551 | ) | $ | (26,085 | ) | (34 | %) | |||||
| - Strategic investments and business development |
$ | (36,208 | ) | $ | (4,302 | ) | $ | (31,906 | ) | (742 | %) | |||||
| - Non-operating or under-utilized facilities |
$ | (10,536 | ) | $ | (7,026 | ) | $ | (3,510 | ) | (50 | %) | |||||
| Net income (loss) |
$ | 242,650 | $ | (310,428 | ) | $ | 553,078 | 178 | % | |||||||
| Net income (loss) attributable to Canopy Growth Corporation |
$ | 258,918 | $ | (317,830 | ) | $ | 576,748 | 181 | % | |||||||
| Earnings (loss) per share - basic3 |
$ | 0.75 | $ | (1.43 | ) | $ | 2.18 | 152 | % | |||||||
| Earnings (loss) per share - diluted3 |
$ | 0.25 | $ | (1.43 | ) | $ | 1.68 | 117 | % | |||||||
| 1 | Kilogram equivalents refers to cannabis oils, where 8 ml is the equivalent of approximately 1 gram of dried cannabis, and softgels, where one bottle is the equivalent of approximately 5 grams of dried cannabis. |
| 2 | Adjusted EBITDA is a non-GAAP measure, and is calculated as earnings before interest, tax, depreciation and amortization, share-based compensation expense, fair value changes and other non-cash items, and further adjusted to remove acquisition-related costs. The Company attributes Adjusted EBITDA to its operations and corporate overhead, strategic investments and business development, and non-operating or under-utilized facilities. See “Adjusted EBITDA (Non-GAAP Measure)”. |
| 3 | For the three months ended September 30, 2019, the weighted average number of outstanding common shares, basic and diluted, totaled 347,226,921 and 380,323,118, respectively (three months ended September 30, 2018—221,725,511). |
The total quantity of cannabis sold during the second quarter of fiscal 2020 was 10,913 kilogram and kilogram equivalents, an increase from 2,197 kilograms and kilogram equivalents in the second quarter of fiscal 2019 due to the launch of the recreational cannabis market in October 2018.
Recreational cannabis accounted for 8,918 kilogram and kilogram equivalents sold in the second quarter of fiscal 2020 (82% of total cannabis sold), of which 56% was sold directly to the Canadian provinces and the remainder through our direct retail and on-line consumer channels. Medical cannabis accounted for 1,995 kilogram and kilogram equivalents sold in the second quarter of fiscal 2020 (18% of total cannabis sold), representing a decrease of 9% from the 2,197 kilogram and kilogram equivalents sold in the second quarter of fiscal 2019, due primarily to a repositioning to more medical-focused Spectrum brand offerings and product availability for the on-line store in advance of the opening of the recreational market on October 17, 2018. Medical customers who had been loyal to our Tweed, LBS and DNA Genetics products and brands were able to purchase these products in the recreational market after legalization, which impacted our medical sales.
The average selling price per gram, net of excise tax, was $7.50 in the second quarter of fiscal 2020, a decrease from $9.87 in the second quarter of fiscal 2019 due primarily to the wholesale pricing which we realized when selling to the provincial and territorial crown corporations in the recreational market, and a shift in the product mix in the second quarter of fiscal 2020 towards a higher percentage of lower-margin dried flower products. The average selling price per gram, net of excise taxes, reflects the shipments made during the second quarter of fiscal 2020, which we believe provides the most meaningful and relevant metric regarding the pricing we achieved on our sales during the quarter. The increase in
25
the average selling price per gram for our international medical business is attributable to our acquisition of C3 in May 2019, which generated revenue of $14,018 in the second quarter of fiscal 2020.
We harvested 40,570 kilograms of cannabis in the second quarter of fiscal 2020, as compared to 15,217 kilograms in the second quarter of fiscal 2019, reflecting the year-over-year growth of our production capacity.
Discussion of the Second Quarter of Fiscal 2020 Results of Operations
Revenue
The following tables present revenue for the three months ended September 30, 2019 and 2018:
Revenue by Channel
| Three months ended | ||||||||||||||||
| September 30 | September 30, | |||||||||||||||
| (CDN $000’s) |
2019 | 2018 | $ Change | % Change | ||||||||||||
| Recreational revenue |
||||||||||||||||
|
Business-to-business1 |
$ | 49,404 | $ | — | $ | 49,404 | — | |||||||||
|
Business-to-consumer |
13,100 | — | 13,100 | — | ||||||||||||
| Other revenue adjustments2 |
(32,727 | ) | — | (32,727 | ) | — | ||||||||||
|
|
|
|
|
|
|
|
|
|||||||||
| 29,777 | — | 29,777 | — | |||||||||||||
| Medical revenue |
||||||||||||||||
| Canadian |
14,149 | 19,903 | (5,754 | ) | (29 | %) | ||||||||||
| International |
18,090 | 2,222 | 15,868 | 714 | % | |||||||||||
|
|
|
|
|
|
|
|
|
|||||||||
| 32,239 | 22,125 | 10,114 | 46 | % | ||||||||||||
| Other revenue |
23,605 | 1,202 | 22,403 | 1864 | % | |||||||||||
|
|
|
|
|
|
|
|
|
|||||||||
| Gross revenue |
85,621 | 23,327 | 62,294 | 267 | % | |||||||||||
| Excise taxes3 |
9,008 | — | 9,008 | — | ||||||||||||
|
|
|
|
|
|
|
|
|
|||||||||
| Net revenue |
$ | 76,613 | $ | 23,327 | $ | 53,286 | 228 | % | ||||||||
|
|
|
|
|
|
|
|
|
|||||||||
| 1 | Excludes the impact of other revenue adjustments. |
| 2 | Other revenue adjustments represent the Company’s determination of returns and pricing adjustments, and which primarily relate to oils and softgels. |
| 3 | Excise taxes is presented net of the impact from other revenue adjustments. |
Revenue by Form
| Three months ended | ||||||||||||||||||||||||
| Kilograms | Kilograms | |||||||||||||||||||||||
| and | and | |||||||||||||||||||||||
| As a % of | kilogram | As a % of | kilogram | |||||||||||||||||||||
| September 30, | gross | equivalents | September 30, | gross | equivalents | |||||||||||||||||||
| 2019 | revenue | sold | 2018 | revenue | sold | |||||||||||||||||||
| (CDN $000’s) | (CDN $000’s) | |||||||||||||||||||||||
| Recreational revenue by form |
||||||||||||||||||||||||
| Dry bud |
$ | 59,040 | 69 | % | 8,561 | $ | — | — | — | |||||||||||||||
| Oil (Includes oils and softgels) |
3,464 | 4 | % | 357 | — | — | — | |||||||||||||||||
| Other revenue adjustments1 |
(32,727 | ) | (38 | %) | — | — | — | — | ||||||||||||||||
|
|
|
|
|
|
|
|
|
|
|
|
|
|||||||||||||
| 29,777 | 35 | % | 8,918 | — | — | — | ||||||||||||||||||
| Medical revenue by form |
||||||||||||||||||||||||
| Dry bud |
9,576 | 11 | % | 998 | 14,755 | 63 | % | 1,698 | ||||||||||||||||
| Oil (Includes oils and softgels)2 |
22,663 | 27 | % | 997 | 7,370 | 32 | % | 499 | ||||||||||||||||
|
|
|
|
|
|
|
|
|
|
|
|
|
|||||||||||||
| 32,239 | 38 | % | 1,995 | 22,125 | 95 | % | 2,197 | |||||||||||||||||
| Other revenue |
23,605 | 27 | % | — | 1,202 | 5 | % | — | ||||||||||||||||
|
|
|
|
|
|
|
|
|
|
|
|
|
|||||||||||||
| Gross revenue |
85,621 | 100 | % | 10,913 | 23,327 | 100 | % | 2,197 | ||||||||||||||||
| Excise taxes3 |
9,008 | — | ||||||||||||||||||||||
|
|
|
|
|
|||||||||||||||||||||
| Net revenue |
$ | 76,613 | $ | 23,327 | ||||||||||||||||||||
|
|
|
|
|
|||||||||||||||||||||
| 1 | Other revenue adjustments represent the Company’s determination of returns and pricing adjustments, and which primarily relate to oils and softgels. |
| 2 | Includes $14,018 of revenue related to C3 for the three months ended September 30, 2019. |
| 3 | Excise taxes is presented net of the impact from other revenue adjustments. |
Net revenue in the second quarter of fiscal 2020 was $76,613, as compared to $23,327 in the second quarter of fiscal 2019. The year-over-year increase is primarily attributable to the launch of the Canadian recreational cannabis market in
26
October 2018, and our acquisitions of Storz & Bickel in the third quarter of fiscal 2019 and C3 and This Works in May 2019.
Recreational
Recreational revenue in the second quarter of fiscal 2020 was $29,777, with the increase from the second quarter of fiscal 2019 entirely due to the launch of the Canadian recreational cannabis market in October 2018. Revenue from the business-to-consumer channel was $13,100, which represented growth of 23% from the first quarter of fiscal 2020 as we continue to build-out our retail store platform in Canada. Revenue from the business-to-business channel was $16,677, net of the impact of other revenue adjustments described below. As noted under “Part I – Business Overview” above we, and the provincial and territorial agencies, continue to monitor the inventory levels, demand, and “sell-through” of recreational cannabis products. During the second quarter of fiscal 2020, we evaluated the estimated on-hand provincial and territorial inventory levels against the recent demand and sales trends that have been observed in the recreational market. As a result of this evaluation we believe that the risk of over-supply of certain oil and softgel formats may exist in certain markets due, in part, to underdeveloped retail platforms in most provinces. Based on this assessment, we have determined returns and pricing adjustments primarily related to certain oil and softgel products in the amount of $32,727, and this amount has been reflected in revenue.
In the second quarter of fiscal 2020, we generated revenue of $59,040 from the sale of our dry bud format products, of which $7,780 related to sales of 1.2 million higher-margin pre-rolled cannabis products.
Medical
Medical cannabis revenue for the second quarter of fiscal 2020 was $32,239, as compared to $22,125 in the second quarter of fiscal 2019.
Canadian medical revenue in the second quarter of fiscal 2020 was $14,149, a decrease of $5,754 from the second quarter of fiscal 2019. The decrease is largely attributable to the transition of our medical customers to our Spectrum Therapeutics online store prior to the launch of the recreational market, as several of our established brands and product offerings were moved to the recreational channel and our Canadian medical patients were offered a more medical-focused range of cannabis products. Medical customers who had been loyal to our Tweed, LBS and DNA Genetics products and brands before recreational legalization were able to purchase these products in the recreational market after October 17, 2018, which impacted our medical revenues. In recent months, we broadened the brand and product offerings available on the Spectrum Therapeutics online store in response to patient demand, and our larger harvests in the first six months of fiscal 2020 have allowed us to address recent supply constraints in making certain high-demand products available to our medical patients. These actions, along with an increase in the number of medical patients registered with Spectrum Therapeutics from approximately 70,900 patients at June 30, 2019 to 75,600 patients at September 30, 2019, have led to sequential improvements in the number of medical cannabis orders placed by our customers and in our medical revenues in the second quarter of fiscal 2020. In the second quarter of fiscal 2020, sales of our higher-margin oils and softgels represented approximately 59% of our Canadian medical sales, an increase from 49% in the first quarter of fiscal 2020.
International medical revenue in the second quarter of fiscal 2020 was $18,090, an increase of $15,868 from the second quarter of fiscal 2019 which was primarily attributable to the acquisition of C3. Additionally, the resolution of previous supply constraints and the notable increase in the amount of product shipped to Germany in July and early August 2019, which we highlighted in our MD&A for the previous quarter, resulted in strong year-over-year growth in our German medical revenues.
Other
Other revenue for the second quarter of fiscal 2020 was $23,605, as compared to $1,202 in the second quarter of fiscal 2019. The year-over-year increase is primarily attributable to the acquisitions of Storz & Bickel and This Works. The remainder of the increase is attributable to revenue from other strategic sources including extraction services and clinic partners. Other revenue for the second quarter of fiscal 2019 consisted predominantly of revenue from our clinic partners.
Net revenue is determined by deducting excise taxes which are included in gross revenue and subsequently remitted to the tax authorities.
27
Cost of goods sold and gross margin
The following table presents cost of goods sold and gross margin for the three months ended September 30, 2019 and 2018:
Cost of Goods Sold
| Three months ended | ||||||||||||||||
| September 30, | September 30, | |||||||||||||||
| (CDN $000’s) |
2019 | 2018 | $ Change | % Change | ||||||||||||
| Net revenue |
$ | 76,613 | $ | 23,327 | $ | 53,286 | 228 | % | ||||||||
| Cost of goods sold |
72,970 | 42,663 | 30,307 | 71 | % | |||||||||||
| Gross margin |
3,643 | (19,336 | ) | 22,979 | 119 | % | ||||||||||
| Gross margin percentage |
5 | % | (83 | %) | — | 88 | % | |||||||||
Cost of goods sold for the second quarter of fiscal 2020 was, $72,970 as compared to $42,663 in the second quarter of fiscal 2019. These costs were primarily comprised of the costs of the inventory sold in the period, distribution charges, and the operating costs relating to facilities that were not yet cultivating or processing cannabis, not yet producing cannabis-related products, or having under-utilized capacity.
Gross margin in the second quarter of fiscal 2020 was $3,643, or 5% of net revenue. The gross margin percentage in the second quarter of fiscal 2020 was impacted by (i) charges for excess finished recreational cannabis inventory of $17,000 recorded primarily in conjunction with our evaluation of the estimated on-hand provincial and territorial inventory levels; (ii) the impact on gross margin of $9,157 reflecting the returns and pricing adjustments relating primarily to the over-supply of certain oil and softgel products; and (iii) other adjustments related to the net realizable value of inventory. These charges are described under “Part 1 – Business Overview” above. Further, we incurred operating costs of $10,536 relating to facilities not yet cultivating or processing cannabis, not yet producing cannabis-related products or having under-utilized capacity, primarily related to start-up costs associated with our advanced manufacturing and beverage facilities in Smiths Falls, and our greenhouse in Denmark.
Comparatively, in the second quarter of fiscal 2019 gross margin was $(19,336) or negative 83% of net revenue. The gross margin percentage in the second quarter of fiscal 2019 was impacted by the destruction of plants largely resulting from delays in obtaining post-harvest processing licenses and approvals for our greenhouses in British Columbia. Additionally, we recorded other adjustments related to the net realizable value of inventory and collectively, the impact on our gross margin was $23,083. We also incurred operating costs of $7,026 related to start-up costs associated with our greenhouses in Aldergrove and Delta, British Columbia; Mirabel, Quebec; Edmonton, Alberta; and Fredericton, New Brunswick.
We continued to invest in the second quarter of fiscal 2020 in the expansion of our Canadian cultivation facilities, our hemp-based CBD business, and our advanced manufacturing and beverage capabilities in Smiths Falls, Ontario in preparation for the second phase of Canadian recreational cannabis. Accordingly, as several of our production facilities were not yet cultivating cannabis, had under-utilized capacity, or were not yet producing consumer products, we incurred higher inventory production costs as we increased our cannabis harvest to over 40,000 kilograms over the past two quarters. At our greenhouse facilities in Aldergrove and Delta, British Columbia and Mirabel, Quebec, we have the ability to plant in a manner that allows for ongoing harvests, rather than one large harvest; this will allow for the increased utilization of assets for post-harvest processes and provide for a steady supply of product going forward. Accordingly, we expect our gross margins to improve in the coming quarters when all of our cultivation, advanced manufacturing and beverage facilities reach, and are utilized at, full production capacity.
28
Operating expenses
The following table presents operating expenses for the three months ended September 30, 2019 and 2018:
Operating Expenses
| Three months ended | ||||||||||||||||
| September 30, | September 30, | |||||||||||||||
| (CDN $000’s) |
2019 | 2018 | $ Change | % Change | ||||||||||||
| Operating expenses |
||||||||||||||||
| Sales and marketing |
$ | 62,089 | $ | 40,182 | $ | 21,907 | 55 | % | ||||||||
| Research and development |
11,935 | 1,944 | 9,991 | 514 | % | |||||||||||
| General and administration |
94,228 | 37,101 | 57,127 | 154 | % | |||||||||||
| Acquisition-related costs |
2,562 | 3,202 | (640 | ) | (20 | %) | ||||||||||
| Share-based compensation expense |
83,767 | 35,825 | 47,942 | 134 | % | |||||||||||
| Share-based compensation expense related to acquisition milestones |
9,114 | 50,730 | (41,616 | ) | (82 | %) | ||||||||||
| Depreciation and amortization |
10,787 | 3,595 | 7,192 | 200 | % | |||||||||||
|
|
|
|
|
|
|
|
|
|||||||||
| Total operating expenses |
$ | 274,482 | $ | 172,579 | $ | 101,903 | 59 | % | ||||||||
|
|
|
|
|
|
|
|
|
|||||||||
Sales and marketing
Sales and marketing expense in the second quarter of fiscal 2020 was $62,089, as compared to $40,182 in the second quarter of fiscal 2019. The increase of $21,907 is attributable to the following areas:
| • | Driving brand awareness and educating consumers through advertising and media campaigns, including the placement of advertising at key venues and events and in key media channels in support of our brands. In the second quarter of fiscal 2020, these initiatives focused on product marketing and brand awareness campaigns in preparation for the launch of the second phase of recreational consumer products in Canada, and the launch of CBD products in the United States and certain international markets in the coming months; |
| • | Increased staffing costs as we continue to enhance our marketing and sales capabilities servicing our Canadian market, particularly in the areas of creative design and advertising, brand insights and launch support, and brand management, and the United States and certain other international markets, where we plan to launch CBD products in the coming months; and |
| • | The growth in our business through the recent acquisitions of Storz & Bickel, C3 and This Works, which has resulted in a year-over-year increase in sales and marketing expense. |
Included in sales and marketing expense for the second quarter of fiscal 2020 are strategic investments of $3,919 related to sales and marketing staff, product marketing campaigns, and brand awareness and consumer education initiatives related to our continued commercial expansion into new markets, most notably the planned launch of CBD products in the United States (for the second quarter of fiscal 2019—$140).
Research and development
Research and development expense in the second quarter of fiscal 2020 was $11,935, as compared to $1,944 in the second quarter of fiscal 2019. The increase of $9,991 is attributable to increased compensation costs associated with an increase in the number of employees conducting research into several intellectual property opportunities, costs associated with conducting external laboratory testing and clinical trials for CBD-based human and animal health products, and other strategic investments including developing patent-pending technology in the following areas:
| • | New cannabis-based product form factors, including beverage products and edibles, that will be launched as part of the second phase of recreational cannabis in Canada; |
| • | Device and delivery technology, including vaporizers and vapes; and |
| • | Growth patterns under different environmental scenarios and the genetics of various strains. |
29
General and administration
General and administration expense in the second quarter of fiscal 2020 was $94,228, as compared to $37,101 in the second quarter of fiscal 2019. The increase of $57,127 is attributable to:
| • | Costs associated with enhancing our finance and information technology capabilities, including both increased compensation costs for our employees and increased professional service costs; |
| • | Increased costs associated with public company compliance and regulatory requirements; |
| • | Pre-revenue business development and administrative costs related to expanding our operations into the United States, and internationally; |
| • | Losses of $10,798 incurred related to legal disputes with a third-party supplier; |
| • | Losses in the amount of $8,828 associated with the additional reserves on onerous retail lease obligations, driven by an overall softening of the retail real estate market throughout Canada; and |
| • | Compliance costs related to meeting Health Canada requirements. |
Included in general and administration expense for the second quarter of fiscal 2020 are strategic investments and business development costs of $20,354 attributable to administrative staffing and facilities, insurance, information technology, regulatory, and other administrative and start-up costs incurred as we execute on our strategy of global expansion (for the second quarter of fiscal 2019—$2,218).
Acquisition-related costs
Acquisition-related costs were $2,562 in the second quarter of fiscal 2020, as compared to $3,202 in the second quarter of fiscal 2019. The decrease of $640 is attributable to less mergers and acquisitions activity as compared to the prior year. In the second quarter of fiscal 2019, acquisition costs were incurred in relation to the acquisitions of Hiku Brands Company Ltd., the remaining non-controlling interest in BC Tweed (a large-scale greenhouse operator in Aldergrove and Delta, British Columbia), and the remaining unowned shares in Canopy Health Innovations Inc. (“CHI”) and evaluating other opportunities. Comparatively, in the second quarter of fiscal 2020, acquisition costs were incurred primarily in relation to evaluating acquisition opportunities.
Share-based compensation expense
Share-based compensation expense was $83,767 in the second quarter of fiscal 2020, as compared to $35,825 in the second quarter of fiscal 2019. The increase of $47,942 is primarily attributable to the continued increase in the number of stock options granted to employees, which is primarily related to the increase in the number of employees of the Company from approximately 2,000 at September 30, 2018 to approximately 4,550 at September 30, 2019. The number of outstanding stock options increased from 22.2 million at September 30, 2018 to 32.9 million at September 30, 2019.
Share-based compensation expense related to acquisition milestones was $9,114 in the second quarter of fiscal 2020, as compared to $50,730 in the second quarter of fiscal 2019. Consideration for certain acquisitions in previous fiscal years, most notably those of Spectrum Cannabis Colombia S.A.S. (“Spectrum Colombia”) and Spectrum Cannabis Denmark Aps (“Spectrum Denmark”), included the issuance of share-based compensation upon the achievement of specified cultivation and sales milestones. The year-over-year decrease of $41,616 is primarily attributable to the achievement, in earlier quarters, of the major milestones associated with these acquisitions, which had resulted in the recognition of share-based compensation expense at that time. Additionally, in the second quarter of fiscal 2019 we acquired the outstanding shares of Canindica Capital Ltd. (“Canindica”) in exchange for Canopy Growth common shares, and the consideration paid of $23,004 was recognized as share-based compensation expense as Canindica did not meet the definition of a business. The remaining share-based compensation expense which is being recognized currently relates largely to the final specific milestones for these acquisitions.
Depreciation and amortization expense
Depreciation and amortization expense was $10,787 in the second quarter of fiscal 2020, as compared to $3,595 in the second quarter of fiscal 2019. The increase of $7,192 is attributable to property, plant and equipment being put into operation during the second half of fiscal 2019 and the first six months of fiscal 2020 as we continue to build our infrastructure across Canada and internationally.
Adjusted EBITDA (Non-GAAP Measure)
The Company’s “Adjusted EBITDA” is a non-GAAP measure used by management that does not have any standardized meaning prescribed by U.S. GAAP and may not be comparable to similar measures presented by other companies.
30
Management defines Adjusted EBITDA as the income (loss) from operations, as reported, before interest and tax, adjusted for removing share-based compensation expense, depreciation and amortization, and further adjusted to remove acquisition related costs.
The Company has provided further disclosure around Adjusted EBITDA by attributing Adjusted EBITDA to its (1) operations and corporate overhead, (2) strategic investments and business development, and (3) non-operating or under-utilized facilities. As discussed under “Part 2 – Strategy” above, the Company has made, and will continue to make, significant strategic investments and incur significant business development costs to expand our business into attractive new geographies in the United States, Latin America and the Caribbean, Asia / Pacific, and Africa. These investments include developing our administrative infrastructure, along with early sales and marketing initiatives focused on patient and healthcare professional education, and brand and product awareness initiatives associated with the launch of CBD products, where permissible. As part of its business development, the Company has also invested in research and development, particularly in relation to new product innovation, conducting clinical trials supporting new cannabis-based medicines, and optimizing our operations. The expenses associated with the aforementioned strategic investments have been included in General and administration, Sales and marketing, and Research and development in our condensed interim consolidated statements of operations. These investments are not consistent with the financial results from our businesses in Canada and Europe, for which our infrastructure build-out is nearly complete and revenue-generating operations have commenced. In addition, we have incurred significant costs related to facilities which are not yet cultivating or processing cannabis, not yet producing cannabis-related products, or had under-utilized capacity. These costs have been included in Inventory production costs expensed to cost of goods sold in our condensed interim consolidated statements of operations.
Accordingly, management believes that Adjusted EBITDA, and the attribution of Adjusted EBITDA in the manner described above, provides meaningful and useful financial information as these measures demonstrate the performance of our operating businesses, and the level of investment that we continue to incur in research and development and the expansion of our global business.
The following table presents Adjusted EBITDA for the three months ended September 30, 2019 and 2018:
| Three months ended | ||||||||
| (In CDN$000’s) |
September 30, 2019 |
September 30, 2018 |
||||||
| Adjusted EBITDA1 Reconciliation |
||||||||
| Loss from operations - as reported |
$ | (270,839 | ) | $ | (191,915 | ) | ||
|
|
|
|
|
|||||
| Share-based compensation expense (per statements of cash flows) |
92,881 | 90,445 | ||||||
| Acquisition-related costs |
2,562 | 3,202 | ||||||
| Depreciation and amortization (per statements of cash flows) |
25,016 | 9,389 | ||||||
|
|
|
|
|
|||||
| 120,459 | 103,036 | |||||||
|
|
|
|
|
|||||
| Adjusted EBITDA |
$ | (150,380 | ) | $ | (88,879 | ) | ||
|
|
|
|
|
|||||
| 1 | Adjusted EBITDA is earnings before interest, tax, depreciation and amortization, share-based compensation expense, fair value changes and other non-cash items, and further adjusted to remove acquisition-related costs. |
The Adjusted EBITDA loss for the second quarter of fiscal 2020 was $150,380, as compared to an Adjusted EBITDA loss of $88,879 for the second quarter of fiscal 2019. Of the Adjusted EBITDA loss for the current quarter, $103,636 is attributed to our operations and corporate overhead, and is reflective of:
| • | Sales and marketing costs related to brand awareness and product marketing in preparation for the launch of the second phase of recreational cannabis consumer products, which we plan on beginning in mid-December 2019; |
| • | Brand awareness and consumer education initiatives for our recreational cannabis brands, and employee compensation costs related to the build-out of our Tweed and Tokyo Smoke retail store network and sales and marketing functions; |
| • | General and administrative costs associated with enhancing our finance and information technology capabilities; |
| • | Losses associated with additional reserves on onerous retail lease obligations; and |
| • | Costs associated with public company and Health Canada compliance and regulatory requirements. |
31
The Adjusted EBITDA loss attributed to strategic investments and business development of $36,208 has increased from a loss of $4,302 for the second quarter of fiscal 2019, and is primarily attributable to:
| • | General and administrative costs associated with the build-out of our administrative infrastructure in support of our global expansion strategy; |
| • | Strategic marketing initiatives including product marketing, branding and educational campaigns in advance of our planned launch of CBD products in the United States and other international markets in the coming months; |
| • | Research and development initiatives related to new product innovation for the recreational markets, conducting clinical trials to support new cannabis-based human and animal medicines, and innovation focused on optimizing our growing and manufacturing capability; and |
| • | Other start-up costs, including the losses incurred related to legal disputes with a third-party supplier. |
The Adjusted EBITDA loss attributed to non-operating or under-utilized facilities of $10,536 relates to inventory production costs expensed to cost of goods sold and is discussed further above under “Cost of goods sold and gross margin”.
Total other income (expense), net
Total other income, net was $509,893 in the second quarter of fiscal 2020, as compared to other expense, net of $113,147 in the second quarter of fiscal 2019. The change of $623,040 in is primarily attributable to the following year-over-year variances:
| • | An income amount of $641,854 related to fair value changes on the warrant derivative liability associated with the Tranche B warrants held by Constellation Brands. The decrease in the fair value of the warrant derivative liability is primarily attributable to the decline in our share price from March 31, 2019 to September 30, 2019; |
| • | Change of $387,768, from an expense amount of $223,374 to an income amount of $164,394, in the non-cash fair value changes related to our senior convertible notes. This change is primarily due to the decrease in Canopy Growth’s stock price from June 30, 2019 to September 30, 2019; |
| • | Incremental interest income of $13,917 attributable to the higher cash and cash equivalents and short-term investments balances in the second quarter of fiscal 2020 resulting from the investment by Constellation Brands; |
| • | Change of $349,698, from an income amount of $44,773 to an expense amount of $304,925, related to the non-cash fair value changes on our other financial assets. This change was driven by a fair value decrease of $235,190 in the Acreage Call Option attributable to an overall decline in both Canopy Growth’s and Acreage’s share prices, as well as share prices across the United States multi-state operator sector; and |
| • | Decrease of $62,682 related to the gain on the acquisition of CHI recorded in the second quarter of fiscal 2019; |
Further information is disclosed in Notes 23 and 26 of the Interim Financial Statements.
Income tax recovery (expense)
Income tax recovery was $5,767 in the second quarter of fiscal 2020, consisting of a deferred income tax recovery of $11,851 (compared to a deferred tax expense of $1,003 in the second quarter of fiscal 2019) and current income tax expense of $6,084 ($nil in the second quarter of fiscal 2019). The increase of $12,854 in the deferred income tax recovery amount is primarily a result of recording a reduction in deferred tax liabilities, in excess of applicable deferred tax assets, that arose in connection with the required revaluation of the accounting carrying value, but not the tax basis, of other financial assets and other assets net of the use of losses carried forward from prior year’s, for which a deferred tax asset had been recorded. In connection with certain deferred tax assets, mainly in respect to losses for tax purposes, where the accounting criteria for recognition as an asset have yet to be satisfied and it is not probable that they will be used, the deferred tax asset has not been recognized. The increase of $6,084 in the amount of current income tax expense arose primarily in connection with acquired legal entities that generated taxable income, where income could not be offset against the group’s tax attributes, and legal entities which have fully utilized their loss carry forward balances and have current period taxable income.
Net income (loss)
Net income was $242,650 in the second quarter of fiscal 2020, as compared to a net loss of $310,428 in the second quarter of fiscal 2019. The change is reflective of the variances described above.
32
Segmented Analysis
The Company operates in two segments: 1) Cannabis operations, which encompasses the production, distribution and sale of both medical and recreational cannabis; and 2) Canopy Rivers, through which the Company provides growth capital and strategic support in the global cannabis sector, where federally lawful.
In the second quarters of both fiscal 2020 and fiscal 2019, all of the Company’s revenue was earned by the Cannabis operations segment. Canopy Rivers contributed a net loss of $2,689 in the second quarter of 2020, of which $738 was attributable to Canopy Growth. In the second quarter of fiscal 2019, Canopy Rivers contributed net income of $11,808, of which $3,476 was attributable to Canopy Growth. The change from net income in the second quarter of fiscal 2019 to a net loss in the second quarter of fiscal 2020 reflects the year-over-year decrease in the fair value changes on Canopy Rivers’ strategic equity investments, along with an increase in share-based compensation expense due to the stock options which have been granted in fiscal 2019. Refer to Note 20 of the Interim Financial Statements for further information on the non-controlling interests in Canopy Rivers and Note 18 for further information on share-based compensation expense.
Summary of quarterly financial information
The following table presents a summary of unaudited quarterly financial information for the last eight consecutive quarters:
SELECTED QUARTERLY INFORMATION
| (CDN $000’s, except share amounts) | Q2 2020 | Q1 2020 | Q4 2019 | Q3 2019 | ||||||||||||
| Net revenue - Recreational |
$ | 21,954 | $ | 49,519 | $ | 58,087 | $ | 57,686 | ||||||||
| Net revenue - Medical & Other |
$ | 54,659 | $ | 40,963 | $ | 35,963 | $ | 25,362 | ||||||||
| Net income (loss) attributable to Canopy Growth Corporation |
$ | 258,918 | $ | (185,869 | ) | $ | (379,516 | ) | $ | 50,736 | ||||||
| Income (loss) per share - basic |
$ | 0.75 | $ | (0.54 | ) | $ | (1.10 | ) | $ | 0.17 | ||||||
| Weighted average shares - basic |
347,226,921 | 346,779,156 | 343,877,591 | 303,281,549 | ||||||||||||
| Income (loss) per share - diluted |
$ | 0.25 | $ | (0.54 | ) | $ | (1.10 | ) | $ | (0.44 | ) | |||||
| Weighted average shares - diluted |
380,323,118 | 346,779,156 | 343,877,591 | 315,974,639 | ||||||||||||
| Q2 2019 | Q1 2019 | Q4 2018 | Q3 2018 | |||||||||||||
| Net revenue - Recreational |
$ | — | $ | — | $ | — | $ | — | ||||||||
| Net revenue - Medical and other |
$ | 23,327 | $ | 25,916 | $ | 22,806 | $ | 21,700 | ||||||||
| Net loss attributable to Canopy Growth Corporation |
$ | (317,830 | ) | $ | (89,671 | ) | $ | (20,259 | ) | $ | (14,929 | ) | ||||
| Loss per share - basic and diluted |
$ | (1.43 | ) | $ | (0.45 | ) | $ | (0.10 | ) | $ | (0.08 | ) | ||||
| Weighted average shares - basic and diluted |
221,725,511 | 200,160,740 | 196,571,715 | 182,029,481 | ||||||||||||
Additional U.S. GAAP Measure
The Company uses “Loss from operations” as an additional U.S. GAAP financial measure within the Interim Financial Statements and this MD&A, but it is not a defined term under U.S. GAAP to assess performance. Management believes that this measure provides useful supplemental information to investors and is computed on a consistent basis for each reporting period. Loss from operations is calculated as net revenue less cost of goods sold, and less total operating expenses, all of which are derived from the consolidated statements of operations. It is used by management to analyze operating performance, but it is not intended to represent an alternative to net loss or other measures of financial performance in accordance with U.S. GAAP.
33
Operational and Financial Highlights – Six Months Ended September 30, 2019
The following table presents selected operational and financial information for the six months ended September 30, 2019 and 2018:
| Six months ended | ||||||||||||||||
| September 30, | September 30, | |||||||||||||||
| 2019 | 2018 | Change | % Change | |||||||||||||
| Operational information |
||||||||||||||||
| Kilogram and kilogram equivalents sold1 |
21,462 | 4,892 | 16,570 | 339 | % | |||||||||||
| Average selling price per gram - Recreational |
$ | 6.02 | $ | — | — | — | ||||||||||
| Average selling price per gram - Canadian Medical |
$ | 8.50 | $ | 8.97 | $ | (0.47 | ) | (5 | %) | |||||||
| Average selling price per gram - International medical |
$ | 48.86 | $ | 13.60 | $ | 35.26 | 259 | % | ||||||||
| Average selling price per gram - Total |
$ | 7.53 | $ | 9.36 | $ | (1.83 | ) | (20 | %) | |||||||
| Kilograms harvested |
81,530 | 24,902 | 56,628 | 227 | % | |||||||||||
| (CDN $000’s, except share amounts and where otherwise indicated) |
|
|||||||||||||||
| Selected financial information |
||||||||||||||||
| Revenue |
$ | 167,095 | $ | 49,243 | $ | 117,852 | 239 | % | ||||||||
| Gross margin percentage |
13 | % | (24 | %) | $ | — | 37 | % | ||||||||
| Adjusted EBITDA2 |
$ | (243,803 | ) | $ | (116,405 | ) | $ | (127,398 | ) | (109 | %) | |||||
| Attributed as follows: |
||||||||||||||||
| - Operations and corporate overhead |
$ | (162,818 | ) | $ | (94,196 | ) | $ | (68,622 | ) | (73 | %) | |||||
| - Strategic investments and business development |
$ | (54,213 | ) | $ | (6,207 | ) | $ | (48,006 | ) | (773 | %) | |||||
| - Non-operating or under-utilized facilities |
$ | (26,772 | ) | $ | (16,002 | ) | $ | (10,770 | ) | (67 | %) | |||||
| Net income (loss) |
$ | 48,599 | $ | (403,727 | ) | $ | 452,326 | 112 | % | |||||||
| Net income (loss) attributable to Canopy Growth Corporation |
$ | 73,049 | $ | (407,501 | ) | $ | 480,550 | 118 | % | |||||||
| Earnings (loss) per share - basic3 |
$ | 0.21 | $ | (1.93 | ) | $ | 2.14 | 111 | % | |||||||
| Earnings (loss) per share - diluted3 |
$ | 0.19 | $ | (1.93 | ) | $ | 2.12 | 110 | % | |||||||
| 1 | Kilogram equivalents refers to cannabis oils, where 8 ml is the equivalent of approximately 1 gram of dried cannabis, and softgels, where one bottle is the equivalent of approximately 5 grams of dried cannabis. |
| 2 | Adjusted EBITDA is a non-GAAP measure, and is calculated as earnings before interest, tax, depreciation and amortization, share-based compensation expense, fair value changes and other non-cash items, and further adjusted to remove acquisition-related costs. The Company attributes Adjusted EBITDA to its operations and corporate overhead, strategic investments and business development, and non-operating or under-utilized facilities. See “Adjusted EBITDA (Non-GAAP Measure)”. |
| 3 | For the six months ended September 30, 2019, the weighted average number of outstanding common shares, basic and diluted, totaled 346,028,903, and 382,765,533, respectively (six months ended September 30, 2018 – 210,972,889) |
The total quantity of cannabis sold during the six months ended September 30, 2019 was 21,462 kilogram and kilogram equivalents, up from 4,892 kilograms and kilogram equivalents in the six months ended September 30, 2018 due to the launch of the recreational cannabis market in October 2018.
Recreational cannabis accounted for 17,978 kilogram and kilogram equivalents sold in the six months ended September 30, 2019 (84% of total cannabis sold), of which 74% was sold directly to the Canadian provinces and the remainder through our direct retail and on-line consumer channels. Medical cannabis accounted for 3,484 kilogram and kilogram equivalents in the six months ended September 30, 2019 (16% of total cannabis sold), representing a decrease of 29% from the 4,892 kilograms and kilogram equivalents sold in the six months ended September 30, 2018, due primarily to the repositioning to more medical-focused Spectrum brand offerings and product availability for the on-line store in advance of the opening of the recreational market on October 17, 2018. Medical customers who had been loyal to our Tweed, LBS and DNA Genetics products and brands were able to purchase these products in the recreational market after legalization, which impacted our medical sales.
The average selling price per gram, net of excise tax, was $7.53 in the six months ended September 30, 2019, a decrease from $9.36 in the six months ended September 30, 2018 due primarily to the wholesale pricing which we realized when selling to the provincial and territorial crown corporations in the recreational market, and a shift in the product mix, particularly in the second quarter of fiscal 2020, towards a higher percentage of certain lower-margin dried flower products. The average selling price per gram, net of excise taxes, reflects the shipments made during the six months ended September 30, 2019, which we believe provides the most meaningful and relevant metric regarding the pricing we achieved on our sales during the period. The increase in the average selling price per gram for our international medical business is attributable to our acquisition of C3 in May 2019, which generated revenue of $22,801 in the six months ended September 30, 2019.
34
We harvested 81,530 kilograms of cannabis in the six months ended September 30, 2019, as compared to 24,902 kilograms in the six months ended September 30, 2018, reflecting the growth of our production capacity over the past year.
Discussion of the Results of Operations for the Six Months Ended September 30, 2019
Revenue
The following tables present revenue for the six months ended September 30, 2019 and 2018:
Revenue by Channel
| Six months ended | ||||||||||||||||
| September 30, | September 30, | |||||||||||||||
| (CDN $000’s) |
2019 | 2018 | $ Change | % Change | ||||||||||||
| Recreational revenue |
||||||||||||||||
|
Business-to-business1 |
$ | 107,829 | $ | — | $ | 107,829 | — | |||||||||
|
Business-to-consumer |
23,738 | — | 23,738 | — | ||||||||||||
| Other revenue adjustments2 |
(40,727 | ) | — | (40,727 | ) | — | ||||||||||
|
|
|
|
|
|
|
|
|
|||||||||
| 90,840 | — | 90,840 | — | |||||||||||||
| Medical revenue |
||||||||||||||||
| Canadian |
27,200 | 41,267 | (14,067 | ) | (34 | %) | ||||||||||
| International |
28,586 | 5,592 | 22,994 | 411 | % | |||||||||||
|
|
|
|
|
|
|
|
|
|||||||||
| 55,786 | 46,859 | 8,927 | 19 | % | ||||||||||||
| Other revenue |
42,386 | 2,384 | 40,002 | 1678 | % | |||||||||||
|
|
|
|
|
|
|
|
|
|||||||||
| Gross revenue |
189,012 | 49,243 | 139,769 | 284 | % | |||||||||||
| Excise taxes3 |
21,917 | — | 21,917 | — | ||||||||||||
|
|
|
|
|
|
|
|
|
|||||||||
| Net revenue |
$ | 167,095 | $ | 49,243 | $ | 117,852 | 239 | % | ||||||||
|
|
|
|
|
|
|
|
|
|||||||||
| 1 | Excludes the impact of other revenue adjustments. |
| 2 | Other revenue adjustments represent the Company’s determination of returns and pricing adjustments, and which primarily relate to oils and softgels. |
| 3 | Excise taxes is presented net of the impact from other revenue adjustments. |
Revenue by Form
| Six months ended | ||||||||||||||||||||||||
| Kilograms | Kilograms | |||||||||||||||||||||||
| and | and | |||||||||||||||||||||||
| As a % of | kilogram | As a % of | kilogram | |||||||||||||||||||||
| September 30, | gross | equivalents | September 30, | gross | equivalents | |||||||||||||||||||
| 2019 | revenue | sold | 2018 | revenue | sold | |||||||||||||||||||
| (CDN $000’s) | (CDN $000’s) | |||||||||||||||||||||||
| Recreational revenue by form |
||||||||||||||||||||||||
| Dry bud |
$ | 119,894 | 63 | % | 16,234 | $ | — | — | — | |||||||||||||||
| Oil (Includes oils and softgels) |
11,673 | 6 | % | 1,744 | — | — | — | |||||||||||||||||
| Other revenue adjustments1 |
(40,727 | ) | (21 | %) | — | — | — | — | ||||||||||||||||
|
|
|
|
|
|
|
|
|
|
|
|
|
|||||||||||||
| 90,840 | 48 | % | 17,978 | — | — | — | ||||||||||||||||||
| Medical revenue by form |
||||||||||||||||||||||||
| Dry bud |
16,786 | 9 | % | 1,805 | 33,181 | 67 | % | 3,942 | ||||||||||||||||
| Oil (Includes oils and softgels)2 |
39,000 | 21 | % | 1,679 | 13,678 | 28 | % | 950 | ||||||||||||||||
|
|
|
|
|
|
|
|
|
|
|
|
|
|||||||||||||
| 55,786 | 30 | % | 3,484 | 46,859 | 95 | % | 4,892 | |||||||||||||||||
| Other revenue |
42,386 | 22 | % | — | 2,384 | 5 | % | — | ||||||||||||||||
|
|
|
|
|
|
|
|
|
|
|
|
|
|||||||||||||
| Gross revenue |
189,012 | 100 | % | 21,462 | 49,243 | 100 | % | 4,892 | ||||||||||||||||
| Excise taxes3 |
21,917 | — | ||||||||||||||||||||||
|
|
|
|
|
|||||||||||||||||||||
| Net revenue |
$ | 167,095 | $ | 49,243 | ||||||||||||||||||||
|
|
|
|
|
|||||||||||||||||||||
| 1 | Other revenue adjustments represent the Company’s determination of returns and pricing adjustments, and which primarily relate to oils and softgels. |
| 2 | Includes $22,801 of revenue related to C3 for the six months ended September 30, 2019. |
| 3 | Excise taxes is presented net of the impact from other revenue adjustments. |
Net revenue in the six months ended September 30, 2019 was $167,095, as compared to $49,243 in the six months ended September 30, 2018. The year-over-year increase is primarily attributable to the launch of the Canadian
35
recreational cannabis market in October 2018, and our acquisitions of Storz & Bickel in the third quarter of fiscal 2019 and C3 and This Works in May 2019.
Recreational
Recreational revenue in the six months ended September 30, 2019 was $90,840, with the increase from the six months ended September 30, 2018 entirely due to the launch of the Canadian recreational cannabis market in October 2018. Revenue from the business-to-consumer channel was $23,738 in the six months ended September 30, 2019, as we continue to build-out our retail store platform in Canada. Revenue from the business-to-business channel was $67,102, net of the impact of other revenue adjustments described below. As noted above under “Part I – Business Overview”, we conducted an assessment in both the first and second quarters of fiscal 2020 of estimated on-hand provincial and territorial inventory levels against recent demand and sales trends that have been observed in the recreational market. As a result of this evaluation we believe that the risk of over-supply of certain oil and softgel formats may exist in certain markets due, in part, to underdeveloped retail platforms in most provinces. Based on this assessment, we have determined returns and pricing adjustments primarily related to certain oil and softgel products in the amount of $40,727, and this amount has been reflected in revenue.
Medical
Medical cannabis revenue in the six months ended September 30, 2019 was $55,786, as compared to $46,859 in the six months ended September 30, 2018.
Canadian medical revenue in the six months ended September 30, 2019 was $27,200, a decrease of $14,067 from the six months ended September 30, 2018. The decrease is largely attributable to the transition of our medical customers to our Spectrum Therapeutics online store prior to the launch of the recreational market in October 2018, as several of our established brands and product offerings were transitioned to the recreational channel and our Canadian medical patients were offered a more medical-focused range of cannabis products. Medical patients who had been loyal to our Tweed, LBS and DNA Genetics products and brands before recreational legalization were able to purchase these products in the recreational market after October 17, 2018, which impacted our medical revenues.
International medical revenue in the six months ended September 30, 2019 was $28,586, an increase of $22,994 from the six months ended September 30, 2018 due to the acquisition of C3.
Other
Other revenue in the six months ended September 30, 2019 was $42,386, as compared to $2,384 in the six months ended September 30, 2018. The year-over-year increase is primarily attributable to the acquisitions of Storz & Bickel and This Works. The remainder of the increase is attributable to revenue from other strategic sources including extraction services, and clinic partners. Other revenue for the six months ended September 30, 2018 consisted predominantly of revenue from our clinic partners.
Net revenue is determined by deducting excise taxes which are included in gross revenue and subsequently remitted to the tax authorities.
36
Cost of goods sold and gross margin
The following table presents cost of goods sold and gross margin for the six months ended September 30, 2019 and 2018:
Cost of Goods Sold
| Six months ended | ||||||||||||||||
| September 30, | September 30, | |||||||||||||||
| (CDN $000’s) |
2019 | 2018 | $ Change | % Change | ||||||||||||
| Net revenue |
$ | 167,095 | $ | 49,243 | $ | 117,852 | 239 | % | ||||||||
| Cost of goods sold |
145,162 | 61,115 | 84,047 | 138 | % | |||||||||||
| Gross margin |
21,933 | (11,872 | ) | 33,805 | 285 | % | ||||||||||
| Gross margin percentage |
13 | % | (24 | %) | — | 37 | % | |||||||||
Cost of goods sold in the six months ended September 30, 2019 was $145,162, as compared to $61,115 in the six months ended September 30, 2018. These costs were primarily comprised of the costs of the inventory sold in the period, distribution charges, and the operating costs relating to facilities that were not yet cultivating or processing cannabis, not yet producing cannabis-related products, or having under-utilized capacity.
Gross margin in the six months ended September 30, 2019 was $21,933, or 13% of net revenue. Our gross margin was impacted by the charges described above, in our analysis of cost of goods sold and gross margin for the three months ended September 30, 2019, that related to (i) excess finished recreational cannabis inventory of $17,000 recorded primarily in conjunction with our evaluation of the estimated on-hand provincial and territorial inventory levels; (ii) the impact on gross margin of reflecting the returns and pricing adjustments relating primarily to the over-supply of certain oil and softgel products; (iii) other adjustments related to the net realizable value of inventory. Additionally, our gross margin was impacted by a shift in the product mix towards a lower percentage of higher-margin, advanced manufactured products as compared to the comparable period, and operating costs of $26,772 relating to facilities not yet cultivating or processing cannabis, not yet producing cannabis-related products or having under-utilized capacity, primarily related to start-up costs associated with our advanced manufacturing and beverage facilities in Smiths Falls, and our greenhouse in Denmark.
Comparatively, in the six months ended September 30, 2018 gross margin was $(11,872) or negative 24% of net revenue. Our gross margin was impacted by the destruction of plants largely resulting from delays in obtaining post-harvest processing licenses and approvals for our greenhouses in British Columbia, other adjustments related to the net realizable value of inventory, and operating costs of $16,002 relating to non-producing and under-utilized facilities.
Operating expenses
The following table presents operating expenses for the six months ended September 30, 2019 and 2018:
Operating Expenses
| Six months ended | ||||||||||||||||
| September 30, | September 30, | |||||||||||||||
| (CDN $000’s) |
2019 | 2018 | $ Change | % Change | ||||||||||||
| Operating expenses |
||||||||||||||||
| Sales and marketing |
$ | 112,636 | $ | 58,875 | $ | 53,761 | 91 | % | ||||||||
| Research and development |
20,425 | 2,700 | 17,725 | 656 | % | |||||||||||
| General and administration |
157,516 | 56,689 | 100,827 | 178 | % | |||||||||||
| Acquisition-related costs |
15,744 | 5,086 | 10,658 | 210 | % | |||||||||||
| Share-based compensation expense |
160,848 | 54,297 | 106,551 | 196 | % | |||||||||||
| Share-based compensation expense related to acquisition milestones |
19,395 | 57,825 | (38,430 | ) | (66 | %) | ||||||||||
| Depreciation and amortization |
20,927 | 6,625 | 14,302 | 216 | % | |||||||||||
|
|
|
|
|
|
|
|
|
|||||||||
| Total operating expenses |
$ | 507,491 | $ | 242,097 | $ | 265,394 | 110 | % | ||||||||
|
|
|
|
|
|
|
|
|
|||||||||
37
Sales and marketing
Sales and marketing expense in the six months ended September 30, 2019 was $112,636, as compared to $58,875 in the six months ended September 30, 2018. The increase of $53,761 is attributable to the following areas:
| • | Driving brand awareness and educating consumers through advertising and media campaigns, including concept creation and placing advertising at key venues and events and in key media channels in support of our brands. In particular, our initiatives focused on product marketing and brand awareness campaigns in preparation for the launch of the second phase of recreational consumer products in Canada, and continuing to establish our Tweed and Tokyo Smoke brands; |
| • | Increased staffing costs as we continue to (1) enhance our marketing and sales capabilities servicing our Canadian market and brands, and the United States market, as we plan to launch CBD products in the coming months; and (2) build-out our network of Tweed- and Tokyo Smoke-branded retail stores in Canada; |
| • | Our medical outreach program, including costs associated with our Apollo and Bodystream clinics; and |
| • | The growth in our business through the recent acquisitions of Storz & Bickel, C3 and This Works, which has resulted in a year-over-year increase in sales and marketing expense. |
Included in sales and marketing expense for the six months ended September 30, 2019 are strategic investments of $6,125 related to sales and marketing staff, product marketing campaigns, and brand awareness and consumer education initiatives related to our continued commercial expansion into new markets, most notably the planned launch of CBD products in the United States (for the six months ended September 30, 2018 – $217).
Research and development
Research and development expense in the six months ended September 30, 2019 was $20,425, as compared to $2,700 in the six months ended September 30, 2018. The increase of $17,725 is attributable to increased compensation costs associated with an increase in the number of employees conducting research into several intellectual property opportunities, costs associated with conducting external laboratory testing and clinical trials for CBD-based human and animal health products, and other strategic investments including developing patent-pending technology in the following areas:
| • | New cannabis-based product form factors, including beverage products and edibles, that will be launched as part of the second phase of recreational cannabis in Canada; |
| • | Device and delivery technology, including vaporizers and vapes; and |
| • | Growth patterns under different environmental scenarios and the genetics of various strains. |
General and administration
General and administration expense in the six months ended September 30, 2019 was $157,516, as compared to $56,689 in the six months ended September 30, 2018. The increase of $100,827 is attributable to:
| • | Costs associated with enhancing our finance and information technology capabilities, including both increased compensation costs for our employees and increased professional service costs; |
| • | Increased costs associated with public company compliance and regulatory requirements; |
| • | Pre-revenue business development and administrative costs related to expanding our operations into the United States, and internationally; |
| • | Losses of $10,798 incurred related to legal disputes with a third-party supplier; |
| • | Losses in the amount of $8,828 associated with the additional reserves on onerous retail lease obligations, driven by an overall softening of the retail real estate market throughout Canada; and |
| • | Compliance costs related to meeting Health Canada requirements. |
Included in general and administration expense in the six months ended September 30, 2019 are strategic investments of $27,679 attributable to administrative staffing and facilities, insurance, information technology, regulatory, and other administrative and start-up costs incurred as we execute on our strategy of global expansion (in the six months ended September 30, 2018 – $3,290).
Acquisition-related costs
Acquisition-related costs were $15,744 in the six months ended September 30, 2019, as compared to $5,086 in the six months ended September 30, 2018. The year-over-year increase of $10,658 is attributable to increased mergers and acquisitions activity so far in fiscal 2020, as in the first quarter we implemented the plan of arrangement with Acreage
38
and closed the acquisitions of C3 and This Works. We also incurred acquisition costs in relation to evaluating other acquisition opportunities.
Share-based compensation expense
Share-based compensation expense was $160,848 in the six months ended September 30, 2019, as compared to $54,297 in the six months ended September 30, 2018. The increase of $106,551 is primarily attributable to the continued increase in the number of stock options granted to employees, which is primarily related to the increase in the number of employees of the Company from approximately 2,000 at September 30, 2018 to approximately 4,550 at September 30, 2019. The number of outstanding stock options increased from 22.2 million at September 30, 2018 to 32.9 million at September 30, 2019.
Share-based compensation expense related to acquisition milestones was $19,395 in the six months ended September 30, 2019, as compared to $57,825 in the six months ended September 30, 2018. The decrease of $38,430 is primarily attributable to the achievement, in earlier quarters, of the major milestones associated with the acquisitions of Spectrum Colombia and Spectrum Denmark, and the recognition of share-based compensation expense at that time. Additionally, in the second quarter of fiscal 2019 we acquired the outstanding shares of Canindica in exchange for Canopy Growth common shares, and the consideration paid of $23,004 was recognized as share-based compensation expense as Canindica did not meet the definition of a business.
Depreciation and amortization expense
Depreciation and amortization expense was $20,927 in the six months ended September 30, 2019, as compared to $6,625 in six months ended September 30, 2018. The increase of $14,302 is attributable to property, plant and equipment being put into operation during the latter half of fiscal 2019 and the first six months of fiscal 2020 as we continue to build our infrastructure across Canada and internationally.
39
Adjusted EBITDA (Non-GAAP Measure)
The following table presents Adjusted EBITDA for the six months ended September 30, 2019 and 2018:
| Six months ended | ||||||||
| (In CDN$000’s) |
September 30, 2019 |
September 30, 2018 |
||||||
| Adjusted EBITDA1 Reconciliation |
||||||||
| Loss from operations - as reported |
$ | (485,558 | ) | $ | (253,969 | ) | ||
|
|
|
|
|
|||||
| Share-based compensation expense (per statements of cash flows) |
180,243 | 116,796 | ||||||
| Acquisition-related costs |
15,744 | 5,086 | ||||||
| Depreciation and amortization (per statements of cash flows) |
45,768 | 15,682 | ||||||
|
|
|
|
|
|||||
| 241,755 | 137,564 | |||||||
|
|
|
|
|
|||||
| Adjusted EBITDA |
$ | (243,803 | ) | $ | (116,405 | ) | ||
|
|
|
|
|
|||||
| 1 | Adjusted EBITDA is earnings before interest, tax, depreciation and amortization, share-based compensation expense, fair value changes and other non-cash items, and further adjusted to remove acquisition-related costs. |
The Adjusted EBITDA loss for the six months ended September 30, 2019 was $243,803, as compared to an Adjusted EBITDA loss of $116,405 for the six months ended September 30, 2018. Of the Adjusted EBITDA loss for the current period, $162,818 is attributed to our operations and corporate overhead, and is reflective of:
| • | Sales and marketing costs related to product marketing in preparation for the planned launch of the second phase of recreational cannabis consumer products beginning in mid-December 2019; |
| • | Brand awareness and consumer education initiatives for our recreational cannabis brands, and employee compensation costs related to the build-out of our Tweed and Tokyo Smoke retail store network and sales and marketing functions; |
| • | General and administrative costs associated with enhancing our finance and information technology capabilities; Losses associated with additional reserves on onerous retail lease obligations; and |
| • | Costs associated with public company and Health Canada compliance and regulatory requirements. |
The Adjusted EBITDA loss attributed to strategic investments and business development of $54,213 has increased from a loss of $6,207, and is primarily attributable to:
| • | General and administrative costs associated with the build-out of our administrative infrastructure in support of our global expansion strategy; |
| • | Strategic marketing initiatives including the commencement of product marketing, branding and educational campaigns in advance of our planned launch of CBD products in the United States and other international markets in the coming months; |
| • | Research and development initiatives related to new product innovation for the recreational markets, conducting clinical trials to support new cannabis-based human and animal medicines, and innovation focused on optimizing our growing and manufacturing capability; and |
| • | Other start-up costs, including the losses incurred related to legal disputes with a third-party supplier. |
The Adjusted EBITDA loss attributed to non-operating or under-utilized facilities of $26,772 relates to inventory production costs expensed to cost of goods sold and is discussed further above under “Cost of goods sold and gross margin”.
Total other income (expense), net
Total other income, net was $542,661 in the six months ended September 30, 2019, as compared to other expense, net of $144,316 in the six months ended September 30, 2018. The change of $686,977 is primarily attributable to the following year-over-year variances:
| • | An income amount of $666,746 related to fair value changes on the warrant derivative liability associated with the Tranche B warrants held by Constellation Brands. The decrease in the fair value of the warrant derivative liability is primarily attributable to the decline in our share price from March 31, 2019 to September 30, 2019; |
| • | Change of $422,034, from an expense amount of $226,194 to an income amount of $195,840, related to the non-cash fair value changes in our senior convertible notes, which is largely due to the decrease in Canopy Growth’s stock price from March 31, 2019 to September 30, 2019; |
| • | Incremental interest income of $35,629 attributable to the higher cash and cash equivalents and short-term investments balances in fiscal 2020 resulting from the investment by Constellation Brands; |
40
| • | Convertible debt issuance costs of $16,380 that were incurred in the first quarter of fiscal 2019; |
| • | Change of $382,595, from an income amount of $36,583 to an expense amount of $346,012 related to the non-cash fair value changes on our other financial assets, driven by a fair value decrease of $235,190 in the Acreage Call Option which was attributable to an overall decline in both Canopy Growth’s and Acreage’s share prices, as well as share prices across the United States multi-state operator sector; and |
| • | Decrease of $62,682 related to the gain recorded in the second quarter of fiscal 2019 on the acquisition of CHI |
Further information is disclosed in Notes 23 and 26 of the Interim Financial Statements.
Income tax (expense) recovery
Income tax expense was $4,500 in the six months ended September 30, 2019, consisting of deferred income tax recovery of $3,614 (compared to a deferred income tax recovery of $1,490 in the six months ended September 30, 2018) and current income tax expense of $8,114 ($nil in the six months ended September 30, 2018). The increase of $2,124 in the deferred income tax recovery is primarily a result of the reduction of deferred tax liabilities, in excess of applicable deferred tax assets, that arose in connection with the required revaluation of the accounting carrying value, but not the tax basis, of other financial assets and other assets net of the use of losses carried forward from prior years’, for which a deferred tax asset had been recorded. In connection with certain deferred tax assets, mainly in respect to losses for tax purposes, where the accounting criteria for recognition of an asset has yet to be satisfied and it is not probable that they will be used, the deferred tax asset has not been recognized. The increase of $8,114 in the balance of current income tax expense arose primarily in connection with acquired legal entities that generated taxable income, where income could not be offset against the group’s tax attributes, and legal entities which have fully utilized their loss carry forward balances and have current period taxable income.
Net income (loss)
Net income was $48,599 in the six months ended September 30, 2019, as compared to a net loss of $403,727 in the six months ended September 30, 2018. The change in net income (loss) reflects the variances described above.
Segmented Analysis
The Company operates in two segments: 1) Cannabis operations, which encompasses the production, distribution and sale of both medical and recreational cannabis; and 2) Canopy Rivers, through which the Company provides growth capital and strategic support in the global cannabis sector, where federally lawful.
In the six months ended September 30, 2019 and 2018, all of the Company’s revenue was earned by the Cannabis operations segment. Canopy Rivers contributed a net loss of $5,950 in the six months ended September 30, 2019, of which $1,637 was attributable to Canopy Growth. In the six months ended September 30, 2018, Canopy Rivers contributed a net loss of $1,606, of which $561 was attributable to Canopy Growth. The increase in the net loss reflects the year-over-year decrease in the fair value changes on Canopy Rivers’ strategic equity investments, along with an increase in share-based compensation expense due to the stock options which have been granted in fiscal 2020.
PART 4 – FINANCIAL LIQUIDITY AND CAPITAL RESOURCES
The following table presents selected balance sheet information as at September 30, 2019, March 31, 2019 and March 31, 2018:
| (CDN $000’s) |
September 30, 2019 |
March 31, 2019 |
March 31, 2018 |
|||||||||
| Cash and cash equivalents |
$ | 1,102,464 | $ | 2,480,830 | $ | 322,560 | ||||||
| Short-term investments |
1,633,692 | 2,034,133 | — | |||||||||
| Total assets |
7,974,580 | 8,565,115 | 1,317,698 | |||||||||
| Current and long-term debt |
604,488 | 945,975 | 8,422 | |||||||||
| Deferred income tax liabilities |
101,984 | 105,081 | 27,304 | |||||||||
| Other long-term liabilities |
633,847 | 134,004 | — | |||||||||
| Canopy Growth shareholders’ equity |
5,932,588 | 6,780,223 | 1,044,619 | |||||||||
Available liquidity and liquidity risk
As at September 30, 2019 the Company had cash and cash equivalents of $1,102,464 and short-term investments of $1,633,692 which, when combined, represent a decrease of $1,778,807 from March 31, 2019. This decrease was due primarily to cash used in the six months ended September 30, 2019 to fund operations of $372,085, cash used totaling
41
$935,468 for investments in facility enhancements, the acquisition of subsidiaries, and strategic investments including the Acreage Call Option, and the repayment of debt in the amount of $104,282. The Company’s excess cash resources are predominantly invested in liquid securities issued by the United States and Canadian governments.
The Company manages liquidity risk by reviewing, on an ongoing basis, its capital requirements. As at September 30, 2019 the Company believes it has adequate available liquidity, in the form of cash and cash equivalents, and short-term investments, to enable it to meet working capital and other operating requirements, fund growth initiatives and capital expenditures, settle its liabilities, and repay scheduled principal and interest payments on debt. The Company’s objective is to generate sufficient cash to fund the Company’s operating requirements and expansion plans. While the Company has incurred losses to date, with an accumulated deficit of $2,928,861 at September 30, 2019 (March 31, 2019 – $835,118), management anticipates the success and eventual profitability of the business. The Company also ensures that it has access to public capital markets through its public stock exchange listings. However, there can be no assurance that the Company will gain adequate market acceptance for its products or be able to generate sufficient positive cash flow to achieve its business plans. Therefore, the Company is subject to risks including, but not limited to, its inability to raise additional funds through debt and/or equity financing to support the Company’s continued development and operations and to meet the Company’s liabilities and commitments as they come due. See “Part 7—Risks and Uncertainties”.
Statements of cash flows
The table below presents the Company’s cash flows for the six months ended September 30, 2019 and 2018:
| (CDN $000’s) | Six months ended | |||||||
| Net cash provided by (used in) |
September 30, 2019 |
September 30, 2018 |
||||||
| Operating activities |
$ | (372,085 | ) | $ | (198,136 | ) | ||
| Investing activities |
(935,468 | ) | (376,054 | ) | ||||
| Financing activities |
(62,508 | ) | 681,031 | |||||
| Effect of exchange rate changes on cash and cash equivalents |
(8,305 | ) | — | |||||
| Cash and cash equivalents, beginning of year |
2,480,830 | 322,560 | ||||||
|
|
|
|
|
|||||
| Cash and cash equivalents, end of period |
$ | 1,102,464 | $ | 429,401 | ||||
|
|
|
|
|
|||||
Operating activities
Cash used in operating activities in the six months ended September 30, 2019 totaled $372,085, as compared to cash used of $198,136 in the six months ended September 30, 2018. The increase in the cash used during the six months ended September 30, 2019 was primarily due to the year-over-year increases in the net loss and our investments in working capital, partially offset by an overall increase in non-cash expense items impacting the net loss including the non-cash loss on the extinguishment of warrants, depreciation and amortization and share-based compensation expense.
Investing activities
The cash used in investing activities totaled $935,468 in the six months ended September 30, 2019, as compared to cash used of $376,054 in the six months ended September 30, 2018. In the six months ended September 30, 2019, we invested $440,150 in expanding our growing capacity, and the construction of advanced manufacturing capability and a beverage facility at our Smiths Falls location. The cash used for acquisitions was $421,952, with the most notable cash outflows relating to our acquisitions of C3 and This Works. We also completed strategic investments totaling $431,613 in the equity instruments of certain entities, most notably the Acreage Call Option. Partially offsetting these outflows of cash was the net redemption of short-term investments in the amount of $388,027, with the cash proceeds primarily used for the purposes described above.
Financing activities
The cash used in financing activities totaled $62,508 in the six months ended September 30, 2019, as compared to cash provided of $681,031 in the six months ended September 30, 2018. The outflow in the six months ended September 30, 2019 related primarily to the repayment of the Alberta Treasury Board financing in the amount of $95,180 and other scheduled debt repayments. In the six months ended September 30, 2018 we issued convertible senior notes with an aggregate principal amount of $600,000, leading to the year-over-year change.
42
Debt
The Company manages its capital with the objective of maximizing shareholder value and ensuring future development of the business. The Company defines capital as the Company’s equity and any debt it may issue. The Company manages its capital structure and adjusts it, based on the funds available to the Company, in order to support the Company’s activities. The Company, upon approval from its Board of Directors, will undertake to balance its overall capital structure through new share issuances, the issue of debt or by undertaking other activities as deemed appropriate under the specific circumstances.
The Company’s principal capital needs are for funds to execute its strategy, as described in “Part 2 – Strategy” above, and general working capital requirements to fund ongoing operations. Since its formation, the Company has financed its cash requirements primarily through the issuance of capital stock, including the $5,072,500 investment by Constellation in the third quarter of fiscal 2019, with the following exceptions:
Convertible senior notes
In June 2018, we issued convertible senior notes (“the notes”) with an aggregate principal amount of $600,000. The notes bear interest at a rate of 4.25% per annum, payable semi-annually on January 15th and July 15th of each year commencing from January 15, 2019. The notes mature on July 15, 2023. Holders of the notes may convert the notes at their option at any time from January 15, 2023 to the maturity date. The notes will be convertible, at the holder’s option, at a conversion rate of 20.7577 common shares for every $1 principal amount of notes, subject to adjustments in certain events. In addition, the holder has the right to exercise the conversion option from September 30, 2018 to January 15, 2023, if (i) the market price of the Company’s common shares for at least 20 trading days during a period of 30 consecutive trading days ending on the last trading day of the preceding calendar quarter is greater than or equal to 130% of the conversion price on each applicable trading day, (ii) during the 5 business day period after any consecutive 5 trading day period (the “measurement period”) in which the trading price per $1 principal amount of the notes for each trading day in the measurement period was less than 98% of the product of the last reported sales price of the Company’s common shares and the conversion rate on each such trading day, (iii) the notes are called for redemption or (iv) upon occurrence of certain corporate events (a “fundamental change”). The Company may, upon conversion by the holder, elect to settle in either cash, common shares, or a combination of cash and common shares, subject to certain circumstances.
Additional information regarding the conversion rights of the notes is included in Note 14 of the Interim Financial Statements.
Other
On June 14, 2019 we repaid the outstanding loan amount with Alberta Treasury Board, along with accrued interest, with a cash payment of $95,180.
On August 13, 2019 we entered into a $40,000 revolving debt facility with Farm Credit Canada (“FCC”). The new facility replaces all previous loans with FCC and is secured by our property on Niagara-on-the-Lake, Ontario. The outstanding balance at September 30, 2019 is $5,268, and the facility bears interest of 4.95%, or the FCC prime rate plus 1.0%, and matures on September 1, 2024.
Contractual obligations and commitments
The Company leases production and retail space under operating leases which range in expiration from October 2019 to December 2038 and which include minimum lease payments. The Company also has royalty, capital equipment, and other purchase commitments with varying terms. All production and retail operating leases have optional renewal terms that the Company may exercise at its option.
Discussion of market risk and credit risk
The Company’s activities expose it to a variety of financial risks, including market risk (i.e., foreign currency risk and interest rate risk) and credit risk.
Market risk
Market risk is defined as the risk that the fair value or future cash flows of a financial instrument held by the Company will fluctuate because of changes in market prices. The Company faces market risk from the impact of changes in foreign
43
currency exchange rates, changes in interest rates, and changes in market prices due to other factors including changes in equity prices. Financial instruments held by the Company that are subject to market risk include cash and cash equivalents and short-term investments denominated in currencies other than the Canadian dollar, investments in other financial assets, and variable-rate debt. The categories of financial instruments that can give rise to significant variability are described below:
Foreign currency risk
Foreign currency risk is defined for these purposes as the risk that the fair value of a financial instrument held by the Company will fluctuate because of changes in foreign currency rates. The Company has exposure to the U.S. dollar, Euro, Danish Krone, British Pound and certain other currencies through its investments in foreign operations. Consequently, fluctuations in the Canadian dollar exchange rate against these currencies increase the volatility of net income (loss) and other comprehensive income (loss). At September 30, 2019, the Company has not entered into any hedging agreements or purchased any financial instruments to hedge its foreign currency risk.
Interest rate risk
Interest rate risk is defined for these purposes as the risk that the fair value or future cash flows of a financial instrument held by the Company will fluctuate because of changes in interest rates. The Company’s financial liabilities consist primarily of long-term fixed-rate debt or floating-rate debt. Fluctuations in interest rates could impact the Company’s cash flows, primarily with respect to the interest payable on the Company’s variable-rate debt, which consists of certain borrowings with a total principal value of $8,192 at September 30, 2019 (March 31, 2019 – $97,471). The Company may invest surplus cash in highly liquid investments with short terms to maturity that would accumulate interest at prevailing rates for such investments. As at September 30, 2019, the Company’s cash and cash equivalents, and short-term investments, consist of $2,243,352 (March 31, 2019 – $2,821,512) in interest rate sensitive instruments.
Other market risk
The Company holds other financial assets and liabilities in the form of investments in shares, warrants, options and put liabilities that are measured at fair value and recorded through either net income (loss) or other comprehensive income (loss). The Company is exposed to price risk on these financial assets, which is the risk of variability in fair value due to movements in equity or market prices. Information regarding the fair value of financial instrument assets and liabilities that are measured at fair value on a recurring basis, and the relationship between the unobservable inputs used in the valuation of these financial assets and their fair value is presented in Note 31 of the annual consolidated financial statements.
Credit risk
Credit risk is the risk of financial loss to the Company if a customer or counterparty to a financial instrument fails to meet its contractual obligations and arises principally from the Company’s accounts receivable. The Company is exposed to credit-related losses in the event of non-performance by the counterparties.
The Company provides credit to its customers in the normal course of business and has established credit evaluation and monitoring processes to mitigate credit risk. The Company has limited risk due to the fact that the majority of recreational cannabis sales are transacted with Canadian provincial/territorial agencies, and the majority of medical cannabis and other sales are transacted with credit cards.
The carrying amount of cash and cash equivalents, short-term investments, short-term restricted investments and amounts receivable represent the maximum exposure to credit risk and as at September 30, 2019, this amounted to $2,861,895 (March 31, 2019 – $4,643,369). Since the inception of the Company, no losses have been suffered in relation to cash held by its banking institutions.
As at September 30, 2019, 75% of the Company’s accounts receivable are considered current (March 31, 2019 – 89%). The Company’s accounts receivable are primarily driven by sales to government agencies which represented 65% of trade accounts receivable as at September 30, 2019 (March 31, 2019 – 72%)
Shareholders’ equity
The Company’s authorized share capital is an unlimited number of common shares of which 348,566,575 common shares were issued and outstanding as at November 14, 2019 (August 14, 2019 – 347,865,673 common shares after including 6,940,531 escrowed shares to be released after meeting certain conditions).
44
The Company has 32,293,870 stock options outstanding at November 14, 2019 under the Company’s Omnibus Incentive Plan at prices between $0.06 and $67.64 per share (August 14, 2019 – 29,099,010 stock options outstanding at prices between $1.32 and $67.64 per share.
At November 14, 2019, the Company had 159,117,591 outstanding warrants for common shares, after including 12,818,148 warrants for common shares treated as a derivative liability with a nominal value, at prices between $12.98 and $76.68, which expire between January 31, 2020 and November 1, 2026 (August 14, 2019 – 159,108,391 outstanding warrants).
At November 14, 2019, there were up to 5,156,456 shares to be issued on the completion of acquisition and asset purchase milestones (August 14, 2019 – 5,175,843 shares). In certain cases, the number of shares to be issued is based on the volume-weighted average share price at the time the milestones are met. The number of shares has been estimated assuming the milestones were met at November 14, 2019. The number of shares excludes shares to be issued on July 4, 2023 to the previous shareholders of Spectrum Colombia and Canindica based on the fair market value of the Company’s Latin American business on that date.
At November 14, 2019, there were up to 12,454,620 shares issuable on the conversion of the senior convertible notes.
Off-balance sheet arrangements
The Company has no off-balance sheet arrangements that have, or are reasonably likely to have, a material current or future effect on the Company’s financial condition, changes in financial condition, revenues or expenses, results of operations, liquidity, capital expenditures or capital resources that are material to investors other than those as stated below in the section titled “Transactions with related parties”.
Transactions with related parties
The Company has entered into cannabis offtake agreements with certain of its equity method investees and entities in which it holds equity or other financial instruments. These agreements are in the normal course of operations and will be measured at the exchange amounts agreed to by the parties.
PART 5 – CRITICAL ESTIMATES, CRITICAL JUDGMENTS AND SIGNIFICANT ACCOUNTING POLICIES
Critical judgments in applying accounting policies
The following are the critical judgments, apart from those involving estimations (refer to discussion below), that have the most significant effect on the amounts recognized in the Interim Financial Statements.
Business combinations
Judgment is used in determining whether an acquisition is a business combination or an asset acquisition. Judgement is also required to assess whether the amounts paid on achievement of milestones represents contingent consideration or compensation for post-acquisition services. Judgment is also required to assess whether contingent consideration should be classified as equity or a liability. Contingent consideration that is classified as equity is not remeasured at subsequent reporting dates and its subsequent settlement is accounted for within equity. Contingent consideration that is classified as a liability is remeasured at fair value at each reporting date and subsequent changes in the fair value of the contingent consideration are recognized in net income (loss).
Control, joint control or level of influence
When determining the appropriate basis of accounting for the Company’s interests in affiliates, the Company makes judgments about the degree of influence that it exerts directly or through an arrangement over the investees’ relevant activities. Information about these judgments is included in Notes 8, 9 and 25 of the Interim Financial Statements.
Critical accounting estimates
The preparation of the Interim Financial Statements in conformity with U.S. GAAP requires management to make estimates and assumptions that affect the reported amounts of assets, liabilities, income and expenses. Actual results may differ from these estimates. Estimates and underlying assumptions are reviewed on an ongoing basis. Revisions to accounting estimates are recognized in the year in which the estimates are revised and in any future years affected.
45
Inventory
Inventory is valued at the lower of cost and net realizable value. A component of our analysis involves determining whether there is excess, slow-moving or obsolete inventory on hand. In making this determination, management makes assumptions around future demand and production forecasts, which are then compared to current inventory levels. Management also makes assumptions around future pricing, and considers historical experience and the application of the specific identification method for identifying obsolete inventory.
Estimated useful lives and depreciation and amortization of property, plant and equipment and intangible assets
Depreciation and amortization of property, plant and equipment and intangible assets are dependent upon estimates of useful lives, which are determined through the exercise of judgment. The assessment of any impairment of these assets is dependent upon estimates of recoverable amounts that take into account factors such as economic and market conditions and the useful lives of assets.
Share-based compensation
In calculating the share-based compensation expense, key estimates such as the rate of forfeiture of options granted, the expected life of the option, the volatility of the Company’s stock price and the risk-free interest rate are used. To calculate the share-based compensation expense related to key employee performance milestones associated with the terms of an acquisition, the Company must estimate the number of shares that will be earned if and when they will be issued based on estimated discounted probabilities.
Fair value measurements
Certain of the Company’s assets and liabilities are measured at fair value. In estimating fair value, the Company uses market-observable data to the extent it is available. In certain cases where Level 1 inputs are not available, the Company will engage third party qualified valuers to perform the valuation.
Information about the valuation techniques and inputs used in determining the fair value is disclosed in the notes to our Interim Financial Statements: acquired intangible assets in Note 25; and financial instruments in Note 21.
46
Adoption of ASC 842, Leases (“ASC 842”) and resulting changes to lease accounting policy
In February 2016, the Financial Accounting Standards Board (“FASB”) issued new guidance on the recognition and measurement of leases, ASC 842 - Leases. Under this guidance, a lessee recognizes assets and liabilities on its balance sheet for most leases. Lease expense continues to be consistent with previous guidance. Additionally, this guidance requires enhanced disclosures regarding the amount, timing, and uncertainty of cash flows arising from leasing arrangements.
The Company adopted the guidance on April 1, 2019, using the modified retrospective approach and, accordingly, prior period balances and disclosures have not been restated. The Company elected the package of transition practical expedients for expired or existing contracts, which retains prior conclusions reached on lease identification, classification, and initial direct costs incurred.
The Company primarily leases office and production facilities, warehouses, production equipment and vehicles. The Company assesses service arrangements to determine if an asset is explicitly or implicitly specified in the agreement and if we have the right to control the use of the identified asset.
The right-of-use asset is initially measured at cost, which is primarily comprised of the initial amount of the lease liability, plus initial direct costs and lease payments at or before the lease commencement date, less any lease incentives received, and is amortized on a straight-line basis over the remaining lease term. All right-of-use assets are reviewed periodically for impairment. The lease liability is initially measured at the present value of lease payments, discounted using the interest rate implicit in the lease or, if that rate cannot be readily determined, the incremental borrowing rate. We elected to recognize expenses for leases with a term of 12 months or less on a straight-line basis over the lease term and not to recognize these short-term leases on the balance sheet. Leases have varying terms with remaining lease terms of up to approximately 30 years. Certain of our lease arrangements provide us with the option to extend or to terminate the lease early.
Lease payments included in the measurement of the lease liability comprise (a) fixed payments, including in-substance fixed payments; (b) variable lease payments that depend on an index or a rate, initially measured using the index or rate as at the commencement date; (c) amounts expected to be payable under a residual value guarantee; and (d) the exercise price under a purchase option that the Company is reasonably certain to exercise, lease payments in an optional renewal period if the Company is reasonably certain to exercise an extension option, and penalties for early termination of a lease unless the Company is reasonably certain not to terminate early.
At inception or reassessment of a contract that contains lease and non-lease components, the Company allocates the consideration in the contract to each lease component on the basis of their relative stand-alone prices.
The adoption of this guidance resulted in the recognition of operating lease right-of-use assets of $99,880, net of lease provisions of $10,703 and $110,583 of lease liabilities, with a $nil impact on deficit. The transition to ASC 842 did not have a material impact on the Company’s results of operations or liquidity. When measuring lease liabilities, the Company used its incremental borrowing rate of April 1, 2019 of 4.5%.
47
PART 6 – CONTROLS AND PROCEDURES
Disclosure Controls and Procedures
The Company maintains a set of disclosure controls and procedures designed to provide reasonable assurance that information required to be publicly disclosed is recorded, processed, summarized and reported on a timely basis. An evaluation of the design of disclosure controls was done under the supervision and with the participation of management, including our Chief Executive Officer (“CEO”) and Chief Financial Officer (“CFO”). Based upon this evaluation, our CEO and CFO concluded that, because of the material weakness in our internal control over financial reporting described below, our disclosure controls were not effective as at September 30, 2019.
Internal Control Over Financial Reporting
National Instrument 52-109 – Certification of Disclosure in Issuers’ Annual and Interim Filings requires the CEO and CFO to certify that they are responsible for establishing and maintaining internal control over financial reporting (“ICFR”) for the Company and that those internal controls have been designed and are effective in providing reasonable assurance regarding the reliability of financial reporting and the preparation of financial statements in accordance with U.S. GAAP. The CEO and CFO are also responsible for disclosing any changes to the Company’s internal controls during the most recent period that have materially affected, or are reasonably likely to materially affect, its internal control over financial reporting.
The Company’s management, under the supervision and with the participation of its CEO and CFO, conducted an evaluation of the effectiveness of the Company´s internal control over financial reporting as of March 31, 2019, using the criteria set forth by the Committee of Sponsoring Organizations of the Treadway Commission (“COSO”) in Internal Control - Integrated Framework (2013 (the “COSO 2013 Framework”). Based on this evaluation management concluded that a material weakness existed as of March 31, 2019, as described below.
Previously Identified Material Weakness Not Fully Remediated – End User Computer (“EUC”)
As of March 31, 2019, management concluded that the internal controls over Company-wide EUC spreadsheets are not fully remediated and constituted a material weakness. This material weakness was initially identified as of March 31, 2017. The accounting complexities encountered in financial reporting rely on complex spreadsheets, and spreadsheets are inherently prone to error due to their manual nature. The Company’s controls related to spreadsheets did not address all risks associated with access security, data entry and evidence of review of completed spreadsheets.
Management is making progress on the implementation of EUC spreadsheet controls. However, management has determined that the material weakness related to EUC was not fully remediated as of September 30, 2019 and further progress in strengthening controls is necessary. Material weaknesses cannot be considered remediated until the applicable remedial controls operate for a sufficient period of time and management is able to conclude, through testing, that these controls are operating effectively.
Remediation Plan and Activities
Management continues to strengthen and improve controls related to the remaining material weaknesses related to EUC in the following ways:
| • | Additional resources, including the continued engagement of third party resources as needed, have been added to support and assist in implementing applicable EUC spreadsheet control infrastructure for expected ongoing reliance to a degree on EUC spreadsheets; |
| • | Continue to reduce the use of EUC spreadsheets where possible through relevant systems. For example, the ERP implementation in process is reducing the use and reliance on EUC spreadsheets. |
Remediation is expected to be completed within fiscal 2020.
There have been no changes in the Company’s ICFR during the three months ended September 30, 2019 that have materially affected, or are likely to materially affect, the Company’s ICFR.
48
No assurance can be provided at this time that the actions and remediation efforts will effectively remediate the material weakness described above or prevent the incidence of other material weaknesses in the Company’s ICFR in the future. Management, including the CEO and CFO, does not expect that disclosure controls and procedures or ICFR will prevent all errors, even as the remediation measures are implemented and further improved to address the material weaknesses. A control system is subject to inherent limitations and even those systems determined to be effective can provide only reasonable, but not absolute, assurance that control objectives will be met with respect to financial statement preparation and presentation.
The Company’s management, with the participation of its CEO and CFO, has limited the scope of the design of the Company’s disclosure controls and procedures and internal controls over financial reporting to exclude controls, policies and procedures and internal controls over financial reporting of the recently acquired operations of:
| • | ebbu (acquired 100% interest on November 23, 2018); |
| • | POS Holdings Inc. (“POS”, and now referred to as KeyLeaf) (acquired 100% control on November 23, 2018); |
| • | Storz & Bickel (acquired 100% interest on December 6, 2018); |
| • | Cafina (acquired on March 25, 2019); |
| • | C3 (acquired on April 30, 2019); and |
| • | This Works (acquired on May 21, 2019). |
The operations of ebbu, POS, Storz & Bickel, Cafina, C3 and This Works, combined, represent approximately 16% of the Company’s assets (approximately 2% of current assets and 31% of non-current assets); they also represent approximately 26% of current liabilities and 4% of long-term liabilities, 36% of the Company’s gross revenues and 12% of operating expenses for the three months ended September 30, 2019.
49
PART 7 – RISKS AND UNCERTAINTIES
There are a number of risk factors that could cause future results to differ materially from those described herein or implied by forward-looking statements and forward-looking information, including without limitation, the following risk factors, which are discussed in greater detail under the heading “Risk Factors” in the AIF, which is available under the Company’s profile on SEDAR at www.sedar.com. The risks and uncertainties in the AIF and described below are not the only ones that the Company faces. Such risk factors include, but are not limited to, risks related to changes in laws, regulations and guidelines; compliance with laws; international laws; operational, regulatory and other risks; Constellation as a significant shareholder; limited operating history; execution of business strategy; management of growth; difficulty to forecast; conflicts of interest; litigation; competition; reputational risks; stock exchange restrictions; risks associated with divestment and restructuring; operational structure; reliance on licences; reliance on facilities; dependence upon key personnel; reliance on key inputs; vulnerability to rising energy costs; dependence on suppliers and skilled labour; risks inherent in an agricultural business; transportation risks; wholesale price volatility; insurance risks; environmental and employee health and safety regulations; product liability; product recalls; customer acquisitions; contracts with provincial and territorial governments; constraints on marketing products; risks inherent in acquisitions and investments; unknown defects and impairments; expansion into foreign jurisdictions; governmental regulations; cannabis is a controlled substance in the united states; Farm Bill risks; entry bans into the United States; banking risks; enforceability of contracts; operations in emerging markets; corruption and fraud; inflation; restrictions on the acquisition or use of properties by foreign investors; reliance on international advisors and consultants; anti-money laundering laws and regulation risks; anti-bribery law violations; future sales or issuances of securities; liquidity and additional financing; market price of securities; increased volatility for dual listed common shares; liquidity of the common shares; market for securities; sales of common shares by Constellation; dividend policy; TSX and NYSE listings; foreign private issuer status; obligations as a public company; cybersecurity and privacy risks; intellectual property; challenging global financial conditions; credit and liquidity risk; and hedging risk. Additional risks and uncertainties, including those that the Company does not know about now or that it currently deems immaterial, may also adversely affect the Company’s business. If any of these risks actually occur, the Company’s business may be harmed, and its financial condition and results of operations may suffer significantly.
50