Attached files
| file | filename |
|---|---|
| 8-K - FORM 8-K - BROADWAY FINANCIAL CORP \DE\ | tm2023468d2_8k.htm |
Exhibit 99.1
June 24, 2020 Annual Meeting Presentation
1 Broadway Financial Corporation ▪ Leading community bank serving the low - to - moderate (“LMI”) income communities in Southern California » Bank holding company with 100% - owned sub, Broadway Federal Bank, f.s.b. » $500 mm in assets with three branches; two in Los Angeles and one in Inglewood ▪ Formed in 1946 to provide financial services to African - Americans » Originally focused on communities in the South Los Angeles area ▪ Publicly traded on the NASDAQ Capital Market: symbol “BYFC”
2 Mission Statement The Bank’s mission is to serve the real estate, business and financial needs of customers in underserved urban communities within Southern California with a commitment to excellent service, profitability and sustained growth. Broadway also has a broader commitment to employ, train and mentor community residents, to contract for services with community businesses, and to encourage its management and staff to serve as volunteers in civic, community and religious organizations.
3 Application of the Mission ▪ Serving a large, growing market across ethnic groups » Major banks find low - to - moderate communities difficult to serve profitably » Broadway addresses almost 50% of the 22 million people in Southern California ▪ Certified Community Development Financial Institution » Recipient of multiple grants from the U.S. Treasury’s CDFI Fund ▪ Longstanding record of “Outstanding” CRA rating » CRA rating reaffirmed as “Outstanding” in 2019 for 24th consecutive year
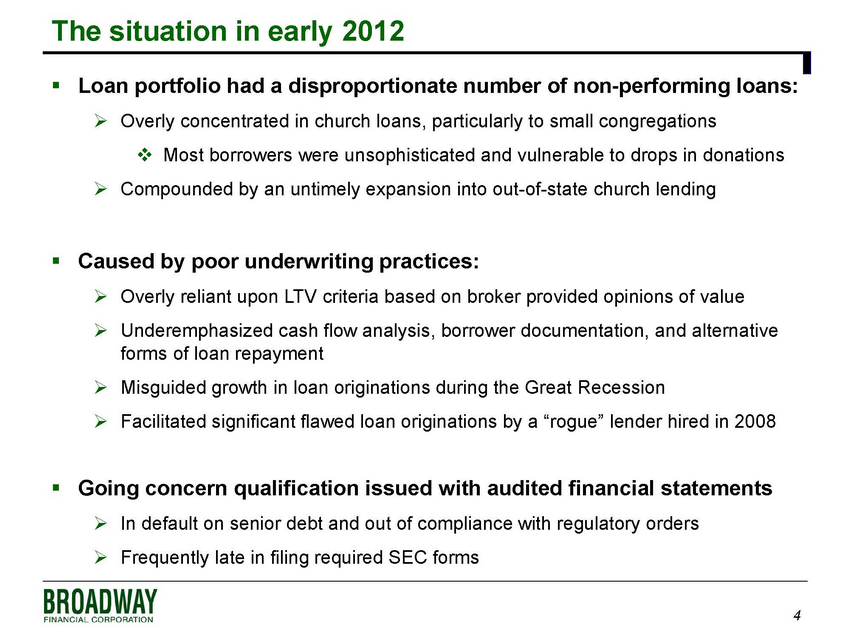
4 The situation in early 2012 ▪ Loan portfolio had a disproportionate number of non - performing loans: » Overly concentrated in church loans, particularly to small congregations □ Most borrowers were unsophisticated and vulnerable to drops in donations » Compounded by an untimely expansion into out - of - state church lending ▪ Caused by poor underwriting practices: » Overly reliant upon LTV criteria based on broker provided opinions of value » Underemphasized cash flow analysis, borrower documentation, and alternative forms of loan repayment » Misguided growth in loan originations during the Great Recession » Facilitated significant flawed loan originations by a “rogue” lender hired in 2008 ▪ Going concern qualification issued with audited financial statements » In default on senior debt and out of compliance with regulatory orders » Frequently late in filing required SEC forms
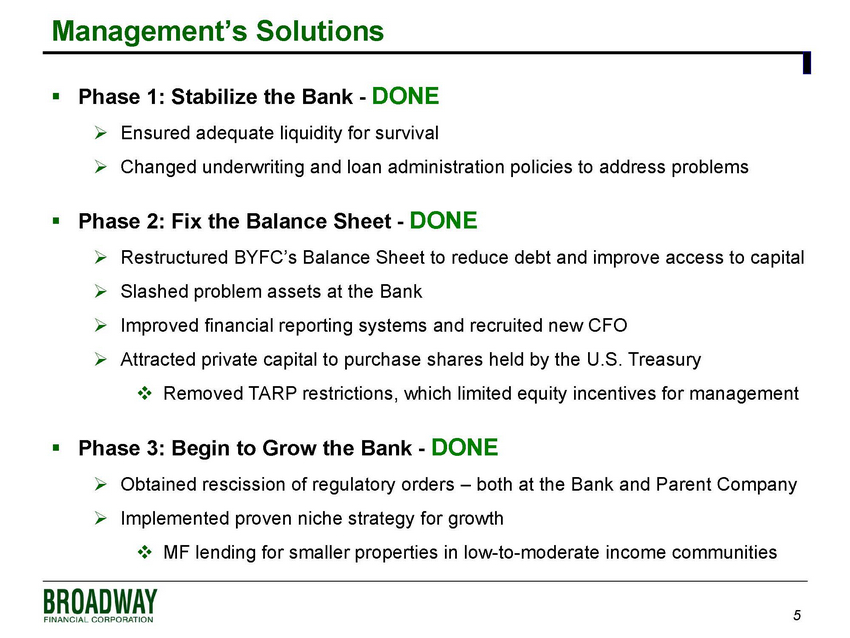
5 Management’s Solutions ▪ Phase 1: Stabilize the Bank - DONE » Ensured adequate liquidity for survival » Changed underwriting and loan administration policies to address problems ▪ Phase 2: Fix the Balance Sheet - DONE » Restructured BYFC’s Balance Sheet to reduce debt and improve access to capital » Slashed problem assets at the Bank » Improved financial reporting systems and recruited new CFO » Attracted private capital to purchase shares held by the U.S. Treasury □ Removed TARP restrictions, which limited equity incentives for management ▪ Phase 3: Begin to Grow the Bank - DONE » Obtained rescission of regulatory orders – both at the Bank and Parent Company » Implemented proven niche strategy for growth □ MF lending for smaller properties in low - to - moderate income communities
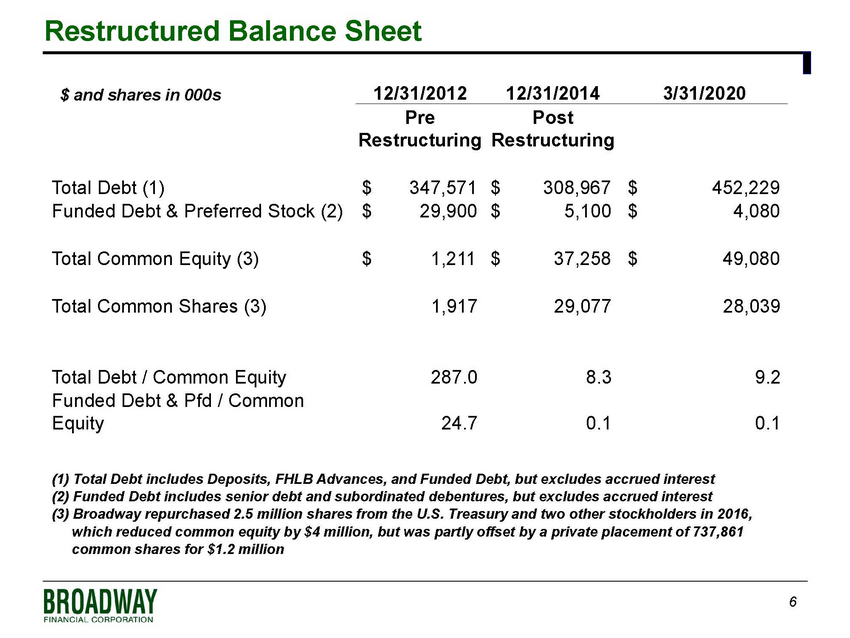
6 Restructured Balance Sheet (1) Total Debt includes Deposits, FHLB Advances, and Funded Debt, but excludes accrued interest (2) Funded Debt includes senior debt and subordinated debentures, but excludes accrued interest (3) Broadway repurchased 2.5 million shares from the U.S. Treasury and two other stockholders in 2016, which reduced common equity by $4 million, but was partly offset by a private placement of 737,861 common shares for $1.2 million 12/31/2012 12/31/2014 3/31/2020 Pre Restructuring Post Restructuring Total Debt (1) $ 347,571 $ 308,967 $ 452,229 Funded Debt & Preferred Stock (2) $ 29,900 $ 5,100 $ 4,080 Total Common Equity (3) $ 1,211 $ 37,258 $ 49,080 Total Common Shares (3) 1,917 29,077 28,039 Total Debt / Common Equity 287.0 8.3 9.2 Funded Debt & Pfd / Common Equity 24.7 0.1 0.1 $ and shares in 000s
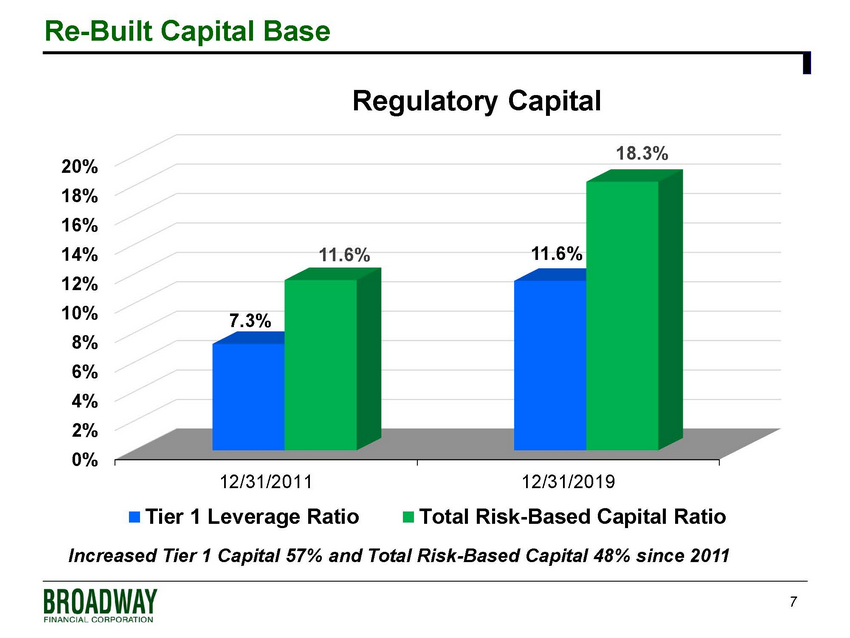
7 Re - Built Capital Base 0% 2% 4% 6% 8% 10% 12% 14% 16% 18% 20% 12/31/2011 12/31/2019 7.3% 11.6% 11.6% 18.3% Regulatory Capital Tier 1 Leverage Ratio Total Risk-Based Capital Ratio Increased Tier 1 Capital 57% and Total Risk - Based Capital 48% since 2011
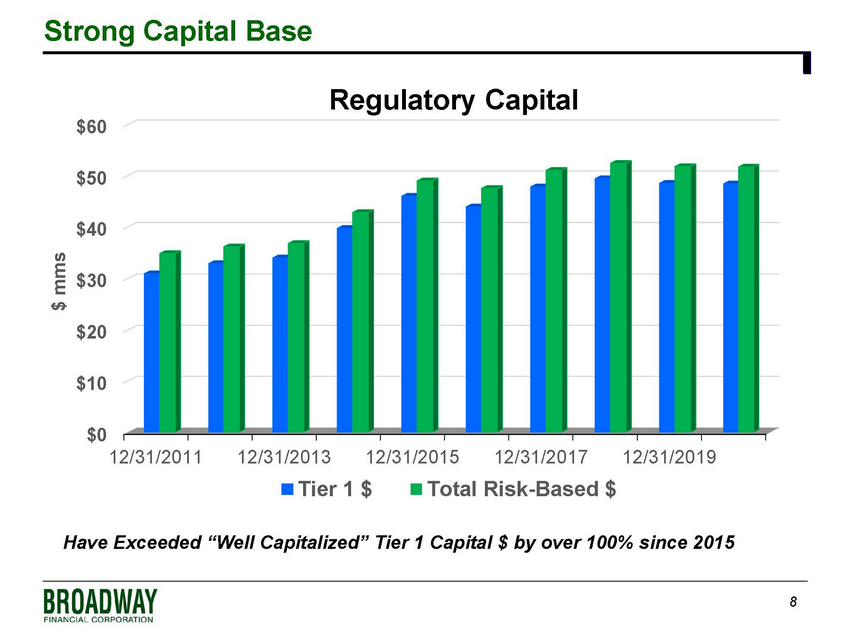
8 Strong Capital Base $0 $10 $20 $30 $40 $50 $60 12/31/2011 12/31/2013 12/31/2015 12/31/2017 12/31/2019 $ mms Regulatory Capital Tier 1 $ Total Risk-Based $ Have Exceeded “Well Capitalized” Tier 1 Capital $ by over 100% since 2015
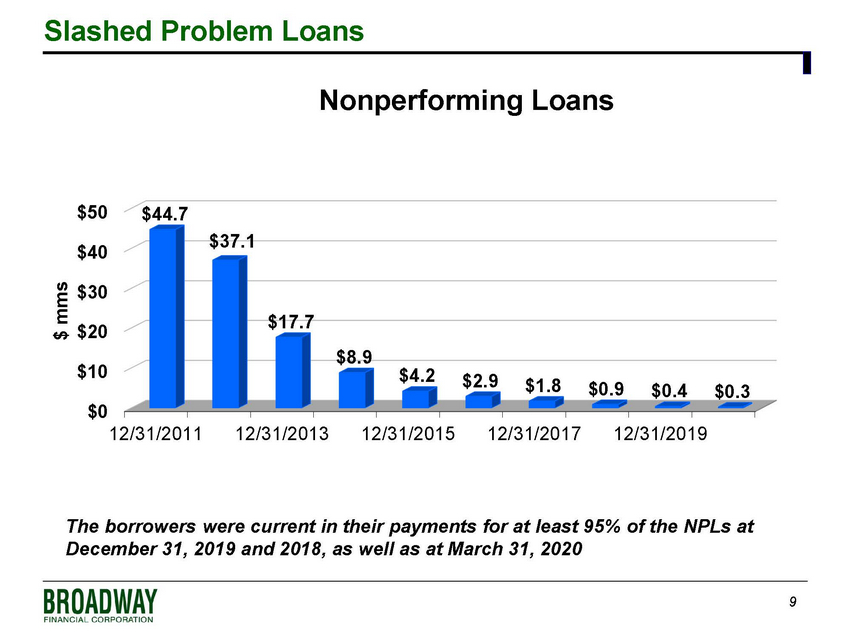
9 Slashed Problem Loans $0 $10 $20 $30 $40 $50 12/31/2011 12/31/2013 12/31/2015 12/31/2017 12/31/2019 $44.7 $37.1 $17.7 $8.9 $4.2 $2.9 $1.8 $0.9 $0.4 $0.3 $ mms Nonperforming Loans The borrowers were current in their payments for at least 95% of the NPLs at December 31, 2019 and 2018, as well as at March 31, 2020
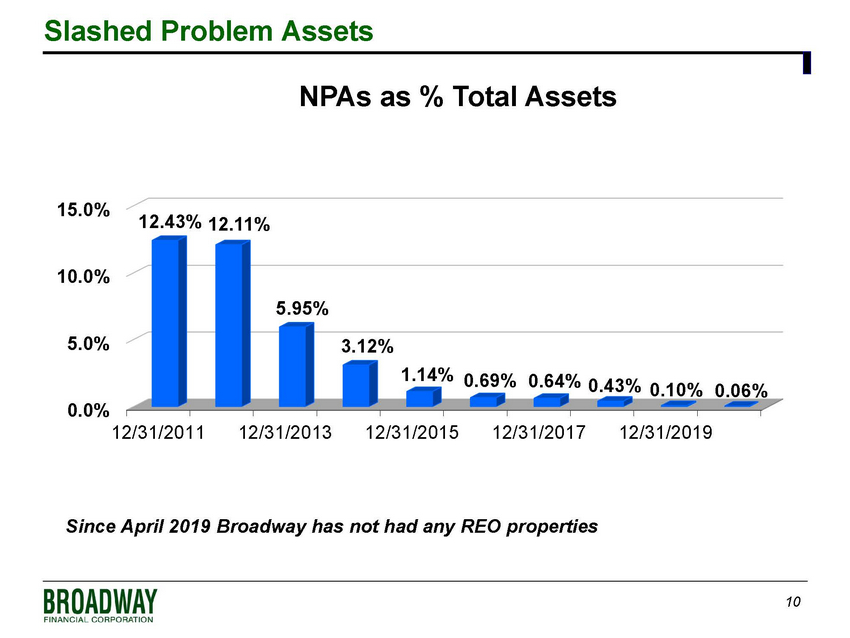
10 Slashed Problem Assets 0.0% 5.0% 10.0% 15.0% 12/31/2011 12/31/2013 12/31/2015 12/31/2017 12/31/2019 12.43% 12.11% 5.95% 3.12% 1.14% 0.69% 0.64% 0.43% 0.10% 0.06% NPAs as % Total Assets Since April 2019 Broadway has not had any REO properties
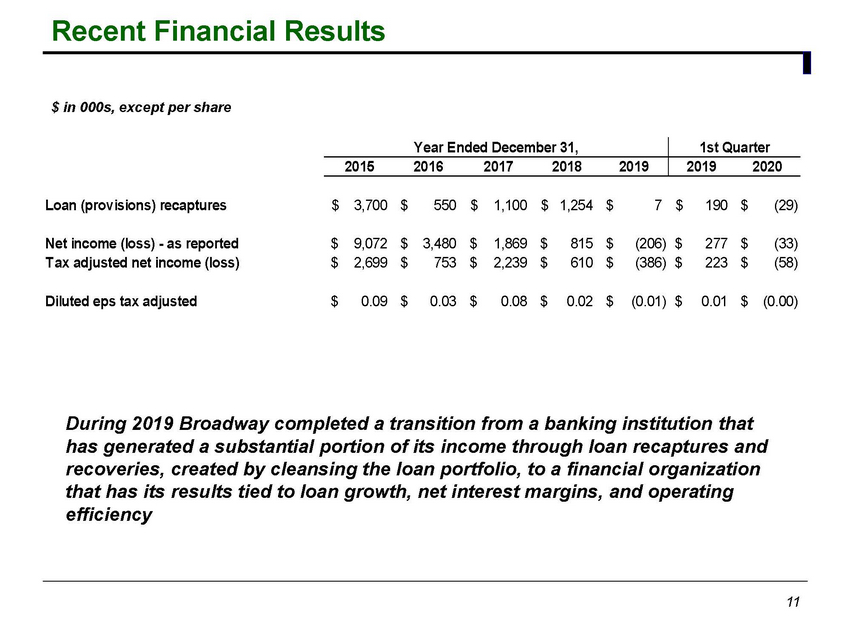
Recent Financial Results 11 During 2019 Broadway completed a transition from a banking institution that has generated a substantial portion of its income through loan recaptures and recoveries, created by cleansing the loan portfolio, to a financial organization that has its results tied to loan growth, net interest margins, and operating efficiency $ in 000s, except per share Year Ended December 31, 1st Quarter 2015 2016 2017 2018 2019 2019 2020 Loan (provisions) recaptures 3,700$ 550$ 1,100$ 1,254$ 7$ 190$ (29)$ Net income (loss) - as reported 9,072$ 3,480$ 1,869$ 815$ (206)$ 277$ (33)$ Tax adjusted net income (loss) 2,699$ 753$ 2,239$ 610$ (386)$ 223$ (58)$ Diluted eps tax adjusted 0.09$ 0.03$ 0.08$ 0.02$ (0.01)$ 0.01$ (0.00)$
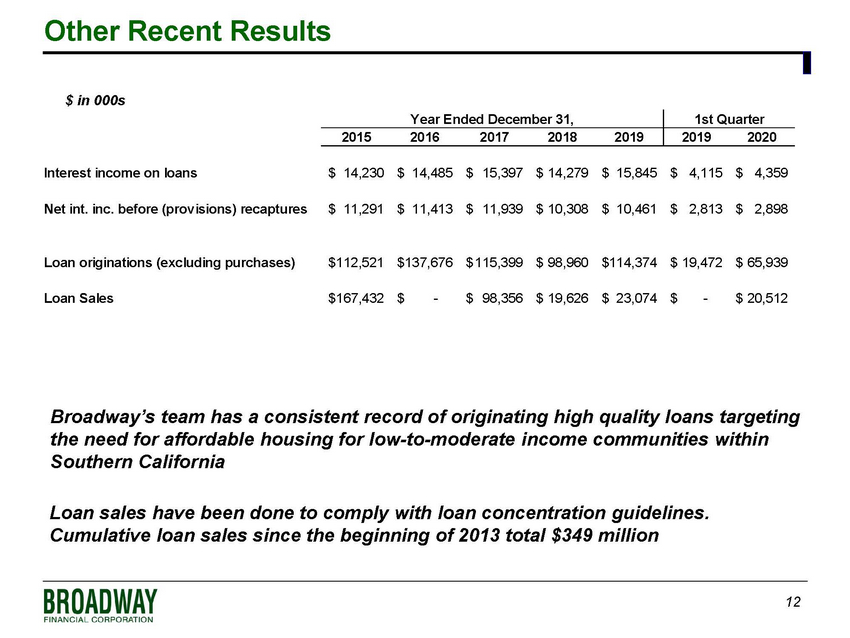
12 Other Recent Results Year Ended December 31, 1st Quarter 2015 2016 2017 2018 2019 2019 2020 Interest income on loans 14,230$ 14,485$ 15,397$ 14,279$ 15,845$ 4,115$ 4,359$ Net int. inc. before (provisions) recaptures 11,291$ 11,413$ 11,939$ 10,308$ 10,461$ 2,813$ 2,898$ Loan originations (excluding purchases) 112,521$ 137,676$ 115,399$ 98,960$ 114,374$ 19,472$ 65,939$ Loan Sales 167,432$ -$ 98,356$ 19,626$ 23,074$ -$ 20,512$ $ in 000s Broadway’s team has a consistent record of originating high quality loans targeting the need for affordable housing for low - to - moderate income communities within Southern California Loan sales have been done to comply with loan concentration guidelines. Cumulative loan sales since the beginning of 2013 total $349 million
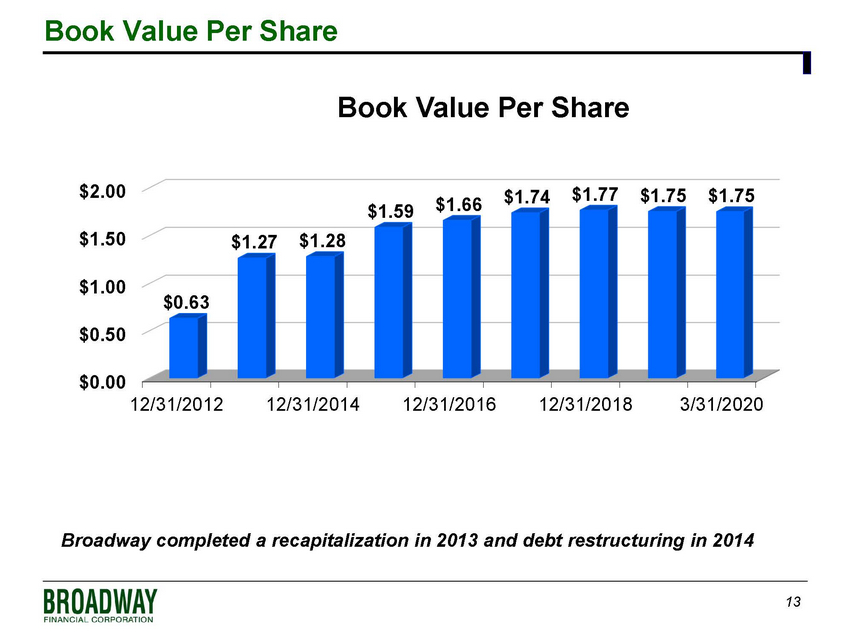
13 Book Value Per Share Broadway completed a recapitalization in 2013 and debt restructuring in 2014 $0.00 $0.50 $1.00 $1.50 $2.00 12/31/2012 12/31/2014 12/31/2016 12/31/2018 3/31/2020 $0.63 $1.27 $1.28 $1.59 $1.66 $1.74 $1.77 $1.75 $1.75 Book Value Per Share
14 The Challenges Ahead ▪ Impact of COVID - 19 ▪ Difficult interest rate environment ▪ Funding costs ▪ Cost structure / operating efficiency ▪ Loan concentration guidelines still require periodic loan sales ▪ Overall scale of operations
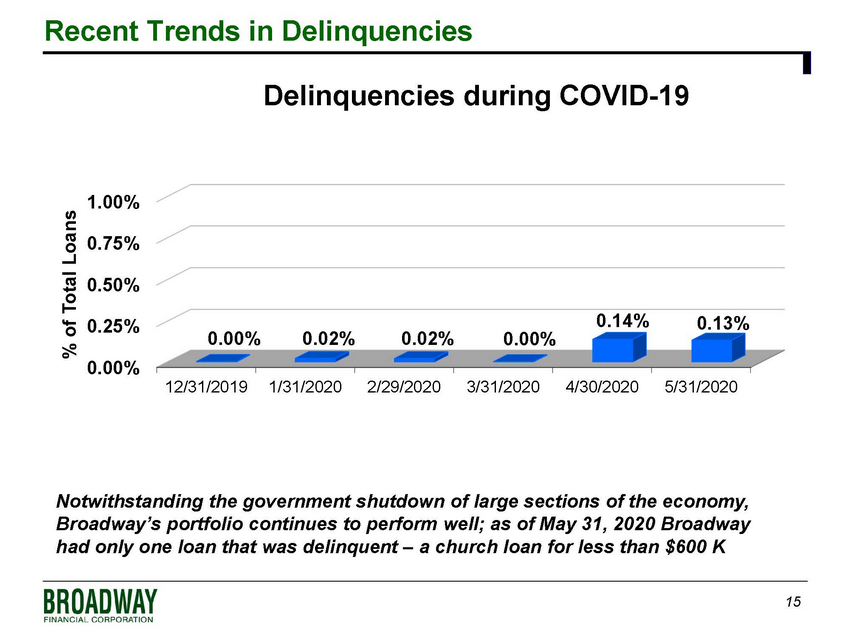
15 Recent Trends in Delinquencies Notwithstanding the government shutdown of large sections of the economy, Broadway’s portfolio continues to perform well; as of May 31, 2020 Broadway had only one loan that was delinquent – a church loan for less than $600 K 0.00% 0.25% 0.50% 0.75% 1.00% 12/31/2019 1/31/2020 2/29/2020 3/31/2020 4/30/2020 5/31/2020 0.00% 0.02% 0.02% 0.00% 0.14% 0.13% % of Total Loans Delinquencies during COVID - 19
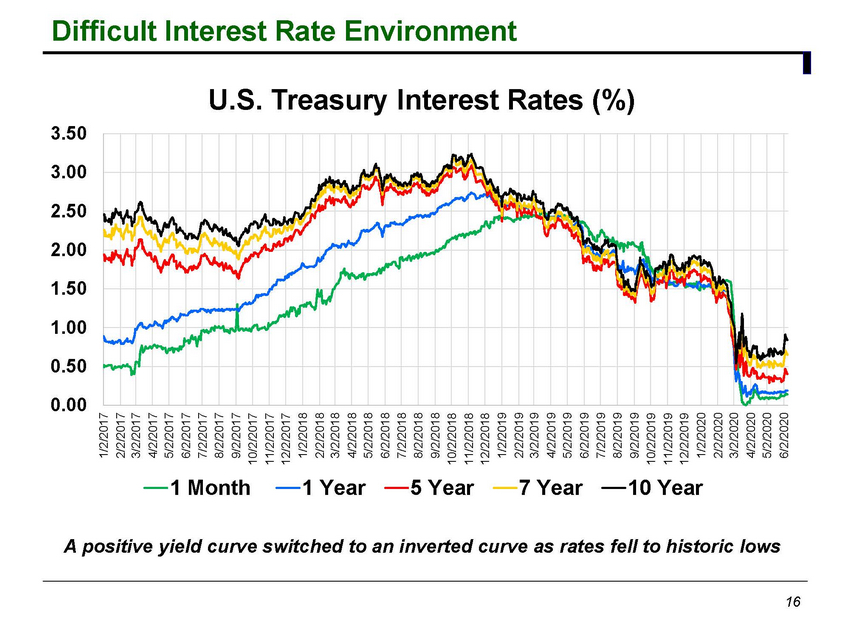
Difficult Interest Rate Environment 16 0.00 0.50 1.00 1.50 2.00 2.50 3.00 3.50 1/2/2017 2/2/2017 3/2/2017 4/2/2017 5/2/2017 6/2/2017 7/2/2017 8/2/2017 9/2/2017 10/2/2017 11/2/2017 12/2/2017 1/2/2018 2/2/2018 3/2/2018 4/2/2018 5/2/2018 6/2/2018 7/2/2018 8/2/2018 9/2/2018 10/2/2018 11/2/2018 12/2/2018 1/2/2019 2/2/2019 3/2/2019 4/2/2019 5/2/2019 6/2/2019 7/2/2019 8/2/2019 9/2/2019 10/2/2019 11/2/2019 12/2/2019 1/2/2020 2/2/2020 3/2/2020 4/2/2020 5/2/2020 6/2/2020 U.S. Treasury Interest Rates (%) 1 Month 1 Year 5 Year 7 Year 10 Year A positive yield curve switched to an inverted curve as rates fell to historic lows
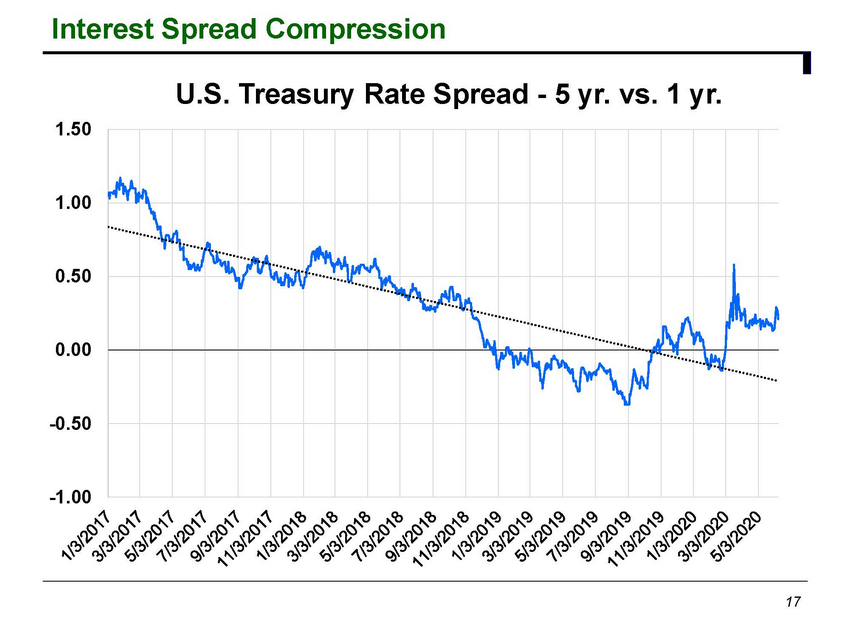
Interest Spread Compression 17 -1.00 -0.50 0.00 0.50 1.00 1.50 U.S. Treasury Rate Spread - 5 yr. vs. 1 yr.
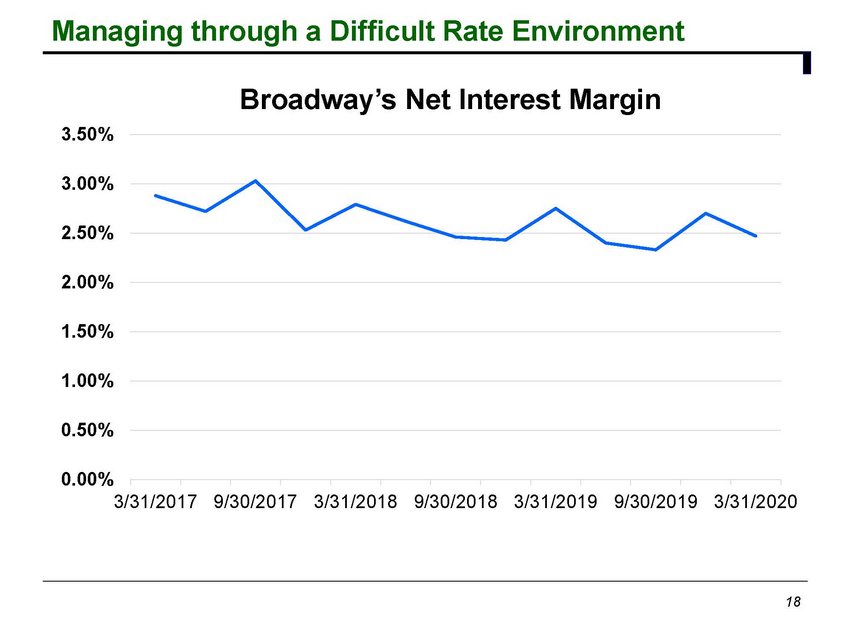
Managing through a Difficult Rate Environment 18 0.00% 0.50% 1.00% 1.50% 2.00% 2.50% 3.00% 3.50% 3/31/2017 9/30/2017 3/31/2018 9/30/2018 3/31/2019 9/30/2019 3/31/2020 Broadway’s Net Interest Margin
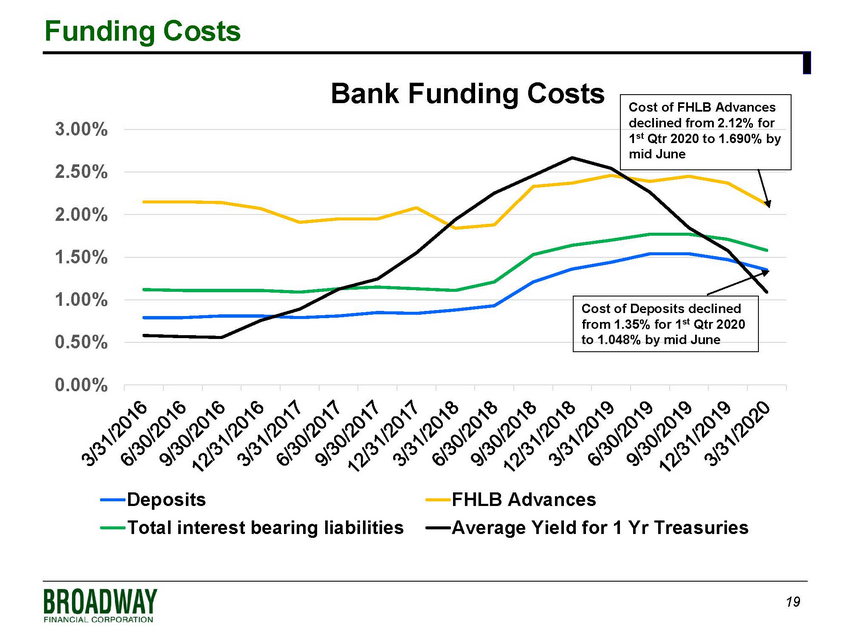
19 Funding Costs 0.00% 0.50% 1.00% 1.50% 2.00% 2.50% 3.00% Bank Funding Costs Deposits FHLB Advances Total interest bearing liabilities Average Yield for 1 Yr Treasuries Cost of FHLB Advances declined from 2.12% for 1 st Qtr 2020 to 1.690% by mid June Cost of Deposits declined from 1.35% for 1 st Qtr 2020 to 1.048% by mid June
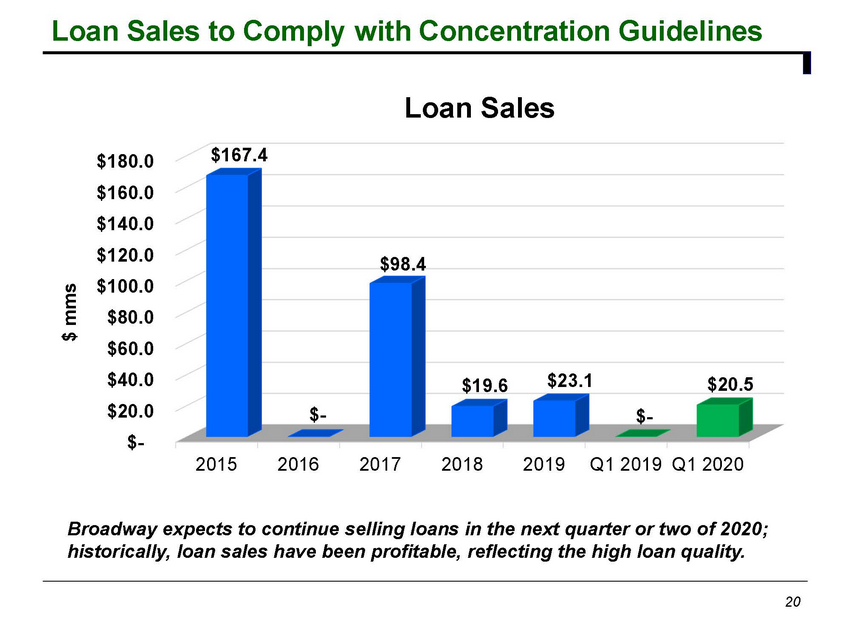
Loan Sales to Comply with Concentration Guidelines 20 $- $20.0 $40.0 $60.0 $80.0 $100.0 $120.0 $140.0 $160.0 $180.0 2015 2016 2017 2018 2019 Q1 2019 Q1 2020 $167.4 $ - $98.4 $19.6 $23.1 $ - $20.5 $ mms Loan Sales Broadway expects to continue selling loans in the next quarter or two of 2020; historically, loan sales have been profitable, reflecting the high loan quality.
21 The Path Ahead - Fulfilling Broadway’s Mission ▪ Maintain commitment to best - in - class service and processes ▪ Expand product line ▪ Reduce cost structure to improve efficiency ▪ Improve the Bank’s scale
22 Committed to Best - in - Class Service and Processes ▪ Best path for strong, positive relationships with key constituents » Regulators and customers ▪ Key component for Broadway’s success » Broadway has received two increases in concentration guidelines since 09/18 □ Has allowed management to grow the asset base by $75 million » Allows Broadway to be a consistent, reliable supplier of financial services □ Loyal network of customers and referring brokers drives loan growth □ Enhances Broadway’s ability to address need for affordable housing ▪ Supports “Outstanding” CRA rating » Rating reaffirmed in 2019 for 24th consecutive year
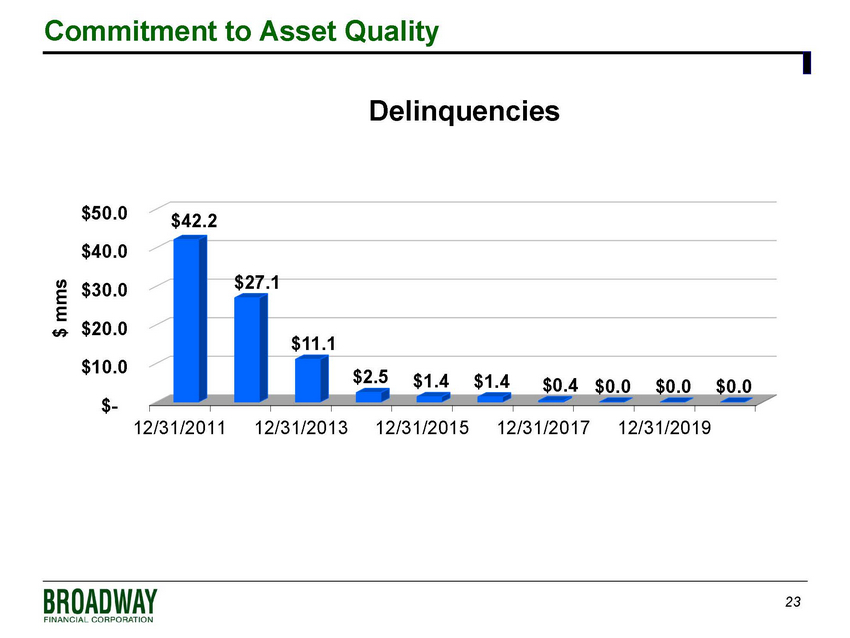
23 Commitment to Asset Quality $- $10.0 $20.0 $30.0 $40.0 $50.0 12/31/2011 12/31/2013 12/31/2015 12/31/2017 12/31/2019 $42.2 $27.1 $11.1 $2.5 $1.4 $1.4 $0.4 $0.0 $0.0 $0.0 $ mms Delinquencies
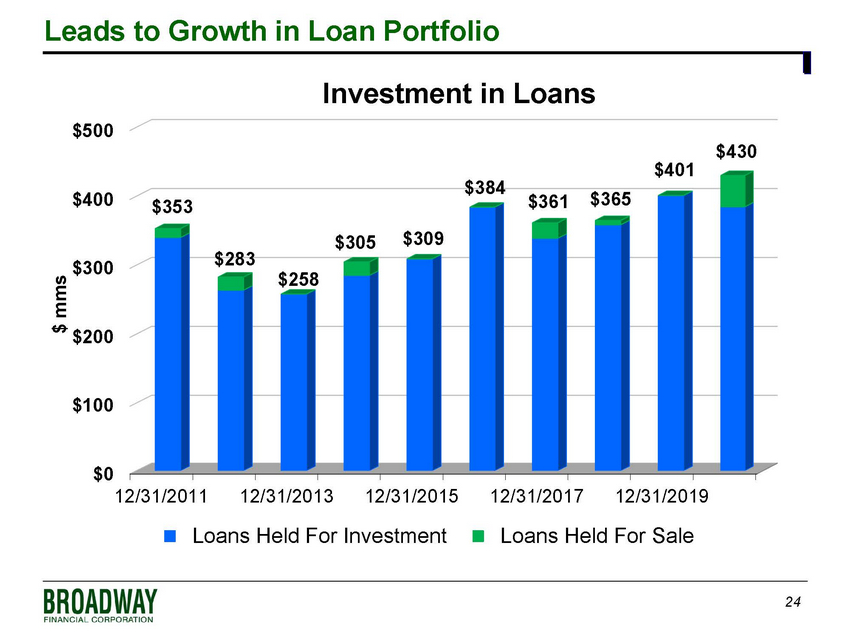
24 Leads to Growth in Loan Portfolio $0 $100 $200 $300 $400 $500 12/31/2011 12/31/2013 12/31/2015 12/31/2017 12/31/2019 $ mms Investment in Loans Loans Held For Investment Loans Held For Sale $353 $283 $258 $305 $309 $384 $361 $365 $401 $430
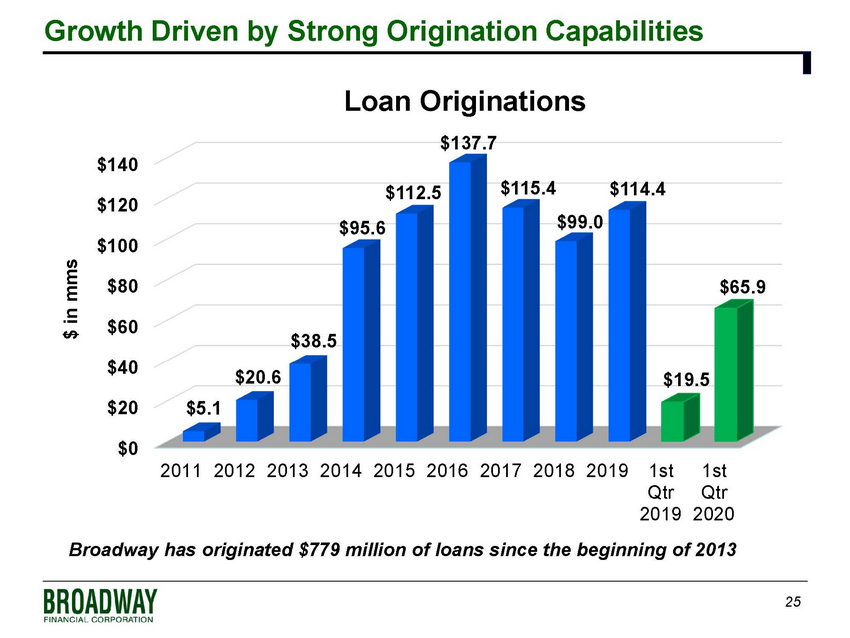
25 Growth Driven by Strong Origination Capabilities $0 $20 $40 $60 $80 $100 $120 $140 2011 2012 2013 2014 2015 2016 2017 2018 2019 1st Qtr 2019 1st Qtr 2020 $5.1 $20.6 $38.5 $95.6 $112.5 $137.7 $115.4 $99.0 $114.4 $19.5 $65.9 $ in mms Loan Originations Broadway has originated $779 million of loans since the beginning of 2013
26 Expanding Product Line ▪ Originating CRE and construction loans » Leverages existing customer relationships and expertise of lending staff » Improves net interest margin for the Bank » Enhances commitment to LMI communities in Southern California » Originated $14.2 million of CRE and construction loans since the start of 2018
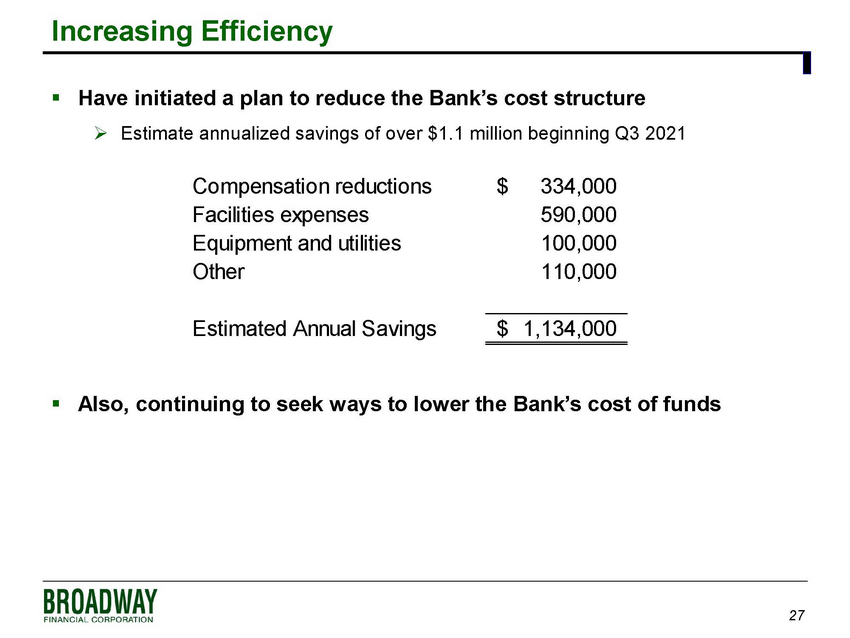
27 Increasing Efficiency ▪ Have initiated a plan to reduce the Bank’s cost structure » Estimate annualized savings of over $1.1 million beginning Q3 2021 ▪ Also, continuing to seek ways to lower the Bank’s cost of funds Compensation reductions 334,000$ Facilities expenses 590,000 Equipment and utilities 100,000 Other 110,000 Estimated Annual Savings 1,134,000$
28 Improving Broadway’s Scale ▪ The Company is implementing steps to improve the Bank’s scale » Designed to enhance long - term viability by spreading fixed costs over greater volume and a larger base of interest earning assets » Will allow the Bank to retain more recurring income from loan originations » Loan sales made to comply with loan concentration guidelines since the beginning of 2015 have cost $12.7 million in cumulative forgone net income » Those cumulative loan sales currently represent $4.8 million in forgone annualized net income
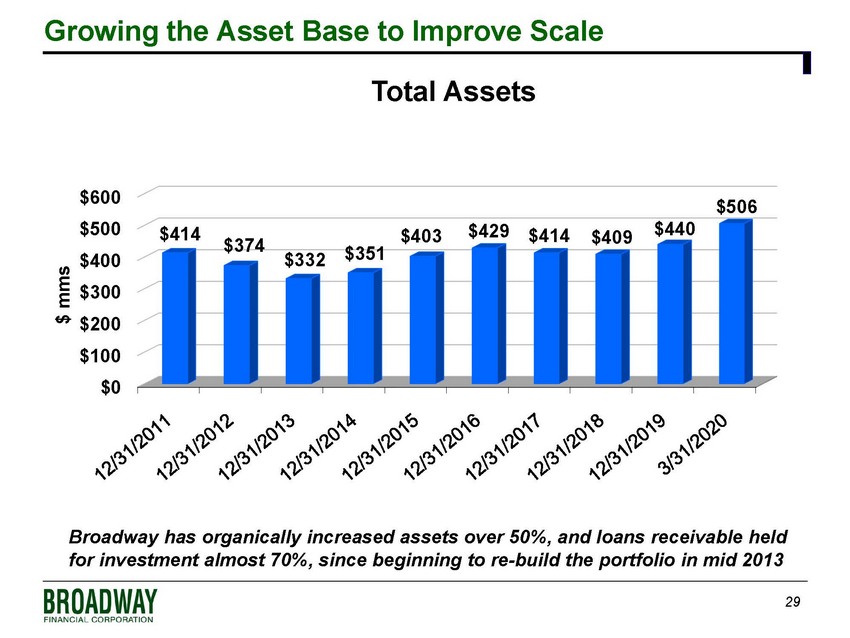
29 Growing the Asset Base to Improve Scale $0 $100 $200 $300 $400 $500 $600 $414 $374 $332 $351 $403 $429 $414 $409 $440 $506 $ mms Total Assets Broadway has organically increased assets over 50%, and loans receivable held for investment almost 70%, since beginning to re - build the portfolio in mid 2013