Attached files
| file | filename |
|---|---|
| EX-32 - EXHIBIT 32 - RIVERVIEW BANCORP INC | riv10k33120exh32.htm |
| EX-31.2 - EXHIBIT 31.2 - RIVERVIEW BANCORP INC | riv10k33120exh312.htm |
| EX-31.1 - EXHIBIT 31.1 - RIVERVIEW BANCORP INC | riv10k33120exh311.htm |
| EX-23 - EXHIBIT 23 - RIVERVIEW BANCORP INC | riv10k33120exh23.htm |
| EX-21 - EXHIBIT 21 - RIVERVIEW BANCORP INC | riv10k33120exh21.htm |
| EX-4.2 - EXHIBIT 4.2 - RIVERVIEW BANCORP INC | riv10k33120exh42.htm |
UNITED STATES
SECURITIES AND EXCHANGE COMMISSION
Washington, D.C. 20549
FORM 10-K
| [X] |
ANNUAL REPORT PURSUANT TO SECTION 13 OR 15(d) OF THE SECURITIES EXCHANGE ACT OF 1934
|
For the Fiscal Year Ended March 31, 2020 OR
| [ ] |
TRANSITION REPORT PURSUANT TO SECTION 13 OR 15(d) OF THE SECURITIES EXCHANGE ACT OF 1934
|
Commission File Number: 000-22957
RIVERVIEW BANCORP, INC.
(Exact name of registrant as specified in its charter)
|
Washington
|
|
91-1838969
|
|
(State or other jurisdiction of incorporation or organization)
|
|
(I.R.S. Employer I.D. Number)
|
|
|
|
|
|
900 Washington St., Ste. 900, Vancouver, Washington
|
|
98660
|
|
(Address of principal executive offices)
|
|
(Zip Code)
|
|
|
|
|
|
Registrant's telephone number, including area code:
|
|
(360) 693-6650
|
|
|
|
|
|
Securities registered pursuant to Section 12(b) of the Act:
|
|
|
| Title of each class | Trading Symbol(s) | Name of each exchange on which registered | ||
|
Common Stock, Par Value $0.01 per share
|
|
RVSB |
The NASDAQ Stock Market LLC
|
| Securities registered pursuant to Section 12(g) of the Act: | None |
Indicate by check mark if the registrant is not required to file reports pursuant to Section 13 or Section 15(d) of the Act.
Yes [ ] No [X]
Indicate by check mark whether the registrant (1) filed all reports required to be filed by Section 13 or 15(d) of the Securities Exchange Act of 1934 during the preceding 12 months (or for such
shorter period that the Registrant was required to file such reports), and (2) has been subject to such filing requirements for the past 90 days. Yes [X] No [ ]
Indicate by check mark whether the registrant has submitted electronically every Interactive Data File required to be submitted pursuant to Rule 405 of Regulation S-T (§232.405 of this chapter)
during the preceding 12 months (or for such shorter period that the registrant was required to submit such files). Yes [X] No [ ]
Indicate by check mark whether the registrant is a large accelerated filer, an accelerated filer, a non-accelerated filer, a smaller reporting company or an emerging growth
company. See definitions of “large accelerated filer,” “accelerated filer”, “smaller reporting company” and “emerging growth company” in Rule 12b-2 of the Exchange Act
|
Large accelerated filer [ ]
|
Accelerated filer [ ]
|
Non-accelerated filer [X]
|
|
Smaller reporting company [X]
|
Emerging growth company [ ]
|
|
Indicate by check mark whether the registrant has filed a report on and attestation to its management’s assessment of the effectiveness of its internal control over financial reporting under
Section 404(b) of the Sarbanes-Oxley Act (15 U.S.C. 7262(b)) by the registered public accounting firm that prepared or issued its audit report. [ ]
If an emerging growth company, indicate by check mark if the registrant has elected not to use the extended transition period for complying with any new or revised financial accounting standards
provided pursuant to Section 13(a) of the Exchange Act. [ ]
Indicate by check mark whether the registrant is a shell company (as defined in Rule 12b-2 of the Act). Yes [ ] No [X]
The aggregate market value of the voting stock held by non-affiliates of the registrant, based on the closing sales price of the registrant's Common Stock as quoted on the Nasdaq Global Select
Market System under the symbol "RVSB" on September 30, 2019 was $167,883,081 (22,748,385 shares at $7.38 per share). As of June 17, 2020, there were issued and outstanding 22,753,385 and 22,253,385 shares, respectively, of the registrant’s common
stock.
DOCUMENTS INCORPORATED BY REFERENCE
Portions of registrant's Definitive Proxy Statement for the 2020 Annual Meeting of Stockholders (Part III).
1
|
Table of Contents
|
||
|
PART I
|
PAGE
|
|
|
Item 1.
|
Business
|
4
|
|
Item 1A.
|
Risk Factors
|
31
|
|
Item 1B.
|
Unresolved Staff Comments
|
45
|
|
Item 2.
|
Properties
|
45
|
|
Item 3.
|
Legal Proceedings
|
45
|
|
Item 4.
|
Mine Safety Disclosures
|
45
|
|
PART II
|
||
|
Item 5.
|
Market for Registrant’s Common Equity, Related Stockholder Matters and Issuer Purchases of
Equity Securities
|
46
|
|
Item 6.
|
Selected Financial Data
|
48
|
|
Item 7.
|
Management’s Discussion and Analysis of Financial Condition and Results of Operations
|
50
|
|
Item 7A.
|
Quantitative and Qualitative Disclosures about Market Risk
|
64
|
|
Item 8.
|
Financial Statements and Supplementary Data
|
66
|
|
Item 9.
|
Changes in and Disagreements with Accountants on Accounting and Financial Disclosure
|
107
|
|
Item 9A.
|
Controls and Procedures
|
107
|
|
Item 9B.
|
Other Information
|
108
|
|
PART III
|
||
|
Item 10.
|
Directors, Executive Officers and Corporate Governance
|
109
|
|
Item 11.
|
Executive Compensation
|
109
|
|
Item 12.
|
Security Ownership of Certain Beneficial Owners and Management and Related Stockholder
Matters
|
110
|
|
Item 13.
|
Certain Relationships and Related Transactions, and Director Independence
|
110
|
|
Item 14.
|
Principal Accounting Fees and Services
|
110
|
|
PART IV
|
||
|
Item 15.
|
Exhibits and Financial Statement Schedules
|
111
|
|
Item 16.
|
Form 10-K Summary
|
112
|
|
Signatures
|
113
|
|
2
Forward-Looking Statements
As used in this Form 10-K, the terms “we,” “our,” “us,” “Riverview” and “Company” refer to Riverview Bancorp, Inc. and its consolidated subsidiaries, including its wholly-owned subsidiary,
Riverview Community Bank, unless the context indicates otherwise.
“Safe Harbor” statement under the Private Securities Litigation Reform Act of 1995: When used in this Form 10-K, the words “believes,” “expects,” “anticipates,” “estimates,” “forecasts,”
“intends,” “plans,” “targets,” “potentially,” “probably,” “projects,” “outlook,” or similar expressions or future or conditional verbs such as “may,” “will,” “should,” “would,” and “could,” or similar expressions are intended to identify
“forward-looking statements” within the meaning of the Private Securities Litigation Reform Act of 1995. Forward-looking statements include statements with respect to our beliefs, plans, objectives, goals, expectations, assumptions, statements about
future economic performance and projections of financial items. These forward-looking statements are subject to known and unknown risks, uncertainties and other factors that could cause actual results to differ materially from the results anticipated
or implied by our forward-looking statements, including, but not limited to: the effect of the novel coronavirus of 2019 (“COVID-19”) pandemic, including on Riverview’s credit quality and business operations, as well as its impact on general economic
and financial market conditions and other uncertainties resulting from the COVID-19 pandemic, such as the extent and duration of the impact on public health, the U.S. and global economies, and consumer and corporate customers, including economic
activity, employment levels and market liquidity; the credit risks of lending activities, including changes in the level and trend of loan delinquencies and write-offs and changes in the Company’s allowance for loan losses and provision for loan
losses that may be impacted by deterioration in the housing and commercial real estate markets; changes in general economic conditions, either nationally or in the Company’s market areas; changes in the levels of general interest rates, and the
relative differences between short and long-term interest rates, deposit interest rates, the Company’s net interest margin and funding sources; fluctuations in the demand for loans, the number of unsold homes, land and other properties and
fluctuations in real estate values in the Company’s market areas; secondary market conditions for loans and the Company’s ability to originate loans for sale and sell loans in the secondary market; results of examinations of our bank subsidiary,
Riverview Community Bank, by the Office of the Comptroller of the Currency and of the Company by the Board of Governors of the Federal Reserve System, or other regulatory authorities, including the possibility that any such regulatory authority may,
among other things, require the Company to increase its allowance for loan losses, write-down assets, reclassify its assets, change Riverview Community Bank’s regulatory capital position or affect the Company’s ability to borrow funds or maintain or
increase deposits, which could adversely affect its liquidity and earnings; legislative or regulatory changes that adversely affect the Company’s business including changes in regulatory policies and principles, or the interpretation of regulatory
capital or other rules, including as a result of Basel III; the Company’s ability to attract and retain deposits; the Company’s ability to control operating costs and expenses; the use of estimates in determining fair value of certain of the
Company’s assets, which estimates may prove to be incorrect and result in significant declines in valuation; difficulties in reducing risks associated with the loans on the Company’s consolidated balance sheet; staffing fluctuations in response to
product demand or the implementation of corporate strategies that affect the Company’s workforce and potential associated charges; disruptions, security breaches, or other adverse events, failures or interruptions in, or attacks on, our information
technology systems or on the third-party vendors who perform several of our critical processing functions; the Company’s ability to retain key members of its senior management team; costs and effects of litigation, including settlements and
judgments; the Company’s ability to implement its business strategies; the Company's ability to successfully integrate any assets, liabilities, customers, systems, and management personnel it may acquire into its operations and the Company's ability
to realize related revenue synergies and cost savings within expected time frames and any goodwill charges related thereto; increased competitive pressures among financial services companies; changes in consumer spending, borrowing and savings
habits; the availability of resources to address changes in laws, rules, or regulations or to respond to regulatory actions; the Company’s ability to pay dividends on its common stock; adverse changes in the securities markets; inability of key
third-party providers to perform their obligations to us; changes in accounting policies and practices, as may be adopted by the financial institution regulatory agencies or the Financial Accounting Standards Board, including additional guidance and
interpretation on accounting issues and details of the implementation of new accounting standards; including the Coronavirus Aid, Relief, and Economic Security Act of 2020 ("CARES Act"), other economic, competitive, governmental, regulatory, and
technological factors affecting the Company’s operations, pricing, products and services; and the other risks described from time to time in our filings with the Securities and Exchange Commission.
The Company cautions readers not to place undue reliance on any forward-looking statements. Moreover, you should treat these statements as speaking only as of the date they are made and based only
on information then actually known to the Company. The Company does not undertake and specifically disclaims any obligation to revise any forward-looking statements included in this report or the reasons why actual results could differ from those
contained in such statements, whether as a result of new information or to reflect the occurrence of anticipated or unanticipated events or circumstances after the date of such statements. These risks could cause our actual results for fiscal 2021
and beyond to differ materially from those expressed in any forward-looking statements by, or on behalf of, us and could negatively affect the Company’s consolidated financial condition and consolidated results of operations as well as its stock
price performance.
3
PART I
Item 1. Business
General
Riverview Bancorp, Inc., a Washington corporation, is the savings and loan holding company of Riverview Community Bank (the “Bank”). At March 31, 2020, the Company had total assets of $1.2
billion, total deposits of $990.4 million and shareholders' equity of $148.8 million. The Company’s executive offices are located in Vancouver, Washington. The Bank's subsidiary, Riverview Trust Company (the “Trust Company”), is a trust and financial
services company located in downtown Vancouver, Washington, and provides full-service brokerage activities, trust and asset management services.
The Company is subject to regulation by the Board of Governors of the Federal Reserve Systems (“Federal Reserve”). Substantially all of the Company’s business is conducted through the Bank which
is regulated by the Office of the Comptroller of the Currency ("OCC"), its primary regulator, and by the Federal Deposit Insurance Corporation ("FDIC"), the insurer of its deposits. The Bank's deposits are insured by the FDIC up to applicable legal
limits under the Deposit Insurance Fund ("DIF"). The Bank is a member of the Federal Home Loan Bank of Des Moines ("FHLB") which is one of the 11 regional banks in the Federal Home Loan Bank System (“FHLB System”).
As a progressive, community-oriented financial services company, the Company emphasizes local, personal service to residents of its primary market area. The Company considers Clark, Klickitat and
Skamania counties of Washington, and Multnomah, Washington and Marion counties of Oregon as its primary market area. The Company is engaged predominantly in the business of attracting deposits from the general public and using such funds in its
primary market area to originate commercial business, commercial real estate, multi-family real estate, land, real estate construction, residential real estate and other consumer loans. The Company’s loans receivable, net, totaled $898.9 million at
March 31, 2020 compared to $864.7 million at March 31, 2019.
The Company’s strategic plan includes targeting the commercial banking customer base in its primary market area for loan originations and deposit growth, specifically small and medium size
businesses, professionals and wealth building individuals. In pursuit of these goals, the Company will seek to increase the loan portfolio consistent with its strategic plan and asset/liability and regulatory capital objectives, which includes
maintaining a significant amount of commercial business and commercial real estate loans in its loan portfolio. Significant portions of our new loan originations – which are mainly concentrated in commercial business and commercial real estate loans
– carry adjustable rates, higher yields or shorter terms and higher credit risk than traditional fixed-rate consumer real estate one-to-four family mortgages.
Our strategic plan also stresses increased emphasis on non-interest income, including increased fees for asset management through the Trust Company and deposit service charges. The strategic plan
is designed to enhance earnings, reduce interest rate risk and provide a more complete range of financial services to customers and the local communities the Company serves. We believe we are well positioned to attract new customers and to increase
our market share through our 18 branches, including, among others, ten in Clark County, four in the Portland metropolitan area and three lending centers.
Market Area
The Company conducts operations from its home office in Vancouver, Washington and 18 branch offices located in Camas, Washougal, Stevenson, White Salmon, Battle Ground, Goldendale, and Vancouver,
Washington (seven branch offices) and Portland (two branch offices), Gresham, Tualatin and Aumsville, Oregon. The Trust Company has two locations, one in downtown Vancouver, Washington and one in Lake Oswego, Oregon, and provides full-service
brokerage activities, trust and asset management services. Riverview Mortgage, a mortgage broker division of the Bank, originates mortgage loans for various mortgage companies predominantly in the Vancouver/Portland metropolitan areas, as well as for
the Bank. The Bank’s Business and Professional Banking Division, with two lending offices located in Vancouver and one in Portland, offers commercial and business banking services.
Vancouver is located in Clark County, Washington, which is just north of Portland, Oregon. Many businesses are located in the Vancouver area because of the favorable tax structure and lower energy
costs in Washington as compared to Oregon. Companies located in the Vancouver area include: Sharp Microelectronics, Hewlett Packard, Georgia Pacific, Underwriters Laboratory, WaferTech, Nautilus, Barrett Business Services, PeaceHealth and Banfield
Pet Hospitals, as well as several support industries. In addition to this industry base, the Columbia River Gorge Scenic Area and the Portland metropolitan area are sources of tourism, which has helped to transform the area from its past dependence
on the timber industry.
4
Economic conditions in the Company’s market areas have generally been positive until the recent COVID-19 pandemic. According to the Washington State Employment Security Department, unemployment in
Clark County decreased to 4.3% at March 31, 2020 compared to 5.3% at March 31, 2019. According to the Oregon Employment Department, unemployment in Portland decreased to 3.4% at March 31, 2020 compared to 3.9% at March 31, 2019. Unemployment levels
have increased since March 31, 2020 due to the COVID-19 pandemic, as the governors of both Washington and Oregon have instituted stay-at-home orders and closed non-essential businesses and schools. Once these stay-at-home orders are modified,
unemployment levels may begin to reverse the upward trend resulting from COVID-19. According to the Regional Multiple Listing Services (“RMLS”), residential home inventory levels in Portland, Oregon have decreased to 1.8 months at March 31, 2020
compared to 2.2 months at March 31, 2019. Residential home inventory levels in Clark County have decreased to 2.1 months at March 31, 2020 compared to 2.4 months March 31, 2019. According to the RMLS, closed home sales in March 2020 in Clark County
decreased 3.0% compared to March 2019. Closed home sales during March 2020 in Portland increased 7.9% compared to March 2019.
Lending Activities
General. At March 31, 2020, the Company's net loans receivable totaled $898.9 million, or 76.1% of total assets at that date. The principal lending
activity of the Company is the origination of loans collateralized by commercial properties and commercial business loans. A substantial portion of the Company's loan portfolio is secured by real estate, either as primary or secondary collateral,
located in its primary market area. The Company’s lending activities are subject to the written, non-discriminatory, underwriting standards and loan origination procedures established by the Bank’s Board of Directors (“Board”) and management. The
customary sources of loan originations are realtors, walk-in customers, referrals and existing customers. The Bank also uses commissioned loan brokers and print advertising to market its products and services. Loans
are approved at various levels of management, depending upon the amount of the loan.
5
Loan Portfolio Analysis. The following table sets forth the composition of the Company's loan portfolio, excluding loans held for sale, by type of loan at the dates indicated
(dollars in thousands):
|
At March 31,
|
||||||||||||||||||||||||||||||||||||||||
|
2020
|
2019
|
2018
|
2017
|
2016
|
||||||||||||||||||||||||||||||||||||
|
Amount
|
Percent
|
Amount
|
Percent
|
Amount
|
Percent
|
Amount
|
Percent
|
Amount
|
Percent
|
|||||||||||||||||||||||||||||||
|
Commercial and construction:
|
||||||||||||||||||||||||||||||||||||||||
|
Commercial business
|
$
|
179,029
|
19.64
|
%
|
$
|
162,796
|
18.58
|
%
|
$
|
137,672
|
16.97
|
%
|
$
|
107,371
|
13.78
|
%
|
$
|
69,397
|
11.11
|
%
|
||||||||||||||||||||
|
Other real estate mortgage (1)
|
580,271
|
63.66
|
530,029
|
60.50
|
529,014
|
65.20
|
506,661
|
65.00
|
399,527
|
63.94
|
||||||||||||||||||||||||||||||
|
Real estate construction
|
64,843
|
7.12
|
90,882
|
10.37
|
39,584
|
4.88
|
46,157
|
5.92
|
26,731
|
4.28
|
||||||||||||||||||||||||||||||
|
Total commercial and construction
|
824,143
|
90.42
|
783,707
|
89.45
|
706,270
|
87.05
|
660,189
|
84.70
|
495,655
|
79.33
|
||||||||||||||||||||||||||||||
|
Consumer:
|
||||||||||||||||||||||||||||||||||||||||
|
Real estate one-to-four family
|
83,150
|
9.12
|
84,053
|
9.60
|
90,109
|
11.10
|
92,865
|
11.91
|
88,780
|
14.21
|
||||||||||||||||||||||||||||||
|
Other installment
|
4,216
|
0.46
|
8,356
|
0.95
|
14,997
|
1.85
|
26,378
|
3.39
|
40,384
|
6.46
|
||||||||||||||||||||||||||||||
|
Total consumer
|
87,366
|
9.58
|
92,409
|
10.55
|
105,106
|
12.95
|
119,243
|
15.30
|
129,164
|
20.67
|
||||||||||||||||||||||||||||||
|
Total loans
|
911,509
|
100.00
|
%
|
876,116
|
100.00
|
%
|
811,376
|
100.00
|
%
|
779,432
|
100.00
|
%
|
624,819
|
100.00
|
%
|
|||||||||||||||||||||||||
|
Less:
|
||||||||||||||||||||||||||||||||||||||||
|
Allowance for loan losses
|
12,624
|
11,457
|
10,766
|
10,528
|
9,885
|
|||||||||||||||||||||||||||||||||||
|
Total loans receivable, net
|
$
|
898,885
|
$
|
864,659
|
$
|
800,610
|
$
|
768,904
|
$
|
614,934
|
||||||||||||||||||||||||||||||
|
(1) Other real estate mortgage consists of commercial real estate, land and multi-family loans.
|
||||||||||||||||||||||||||||||||||||||||
6
Loan Portfolio Composition. The following tables set forth the composition of the Company's commercial and construction loan portfolio based on loan purpose
at the dates indicated (in thousands):
|
Commercial
Business
|
Other
Real Estate
Mortgage
|
Real Estate Construction
|
Commercial &
Construction
Total
|
|||||||||||||
|
March 31, 2020
|
||||||||||||||||
|
Commercial business
|
$
|
179,029
|
$
|
-
|
$
|
-
|
$
|
179,029
|
||||||||
|
Commercial construction
|
-
|
-
|
52,608
|
52,608
|
||||||||||||
|
Office buildings
|
-
|
113,433
|
-
|
113,433
|
||||||||||||
|
Warehouse/industrial
|
-
|
91,764
|
-
|
91,764
|
||||||||||||
|
Retail/shopping centers/strip malls
|
-
|
76,802
|
-
|
76,802
|
||||||||||||
|
Assisted living facilities
|
-
|
1,033
|
-
|
1,033
|
||||||||||||
|
Single purpose facilities
|
-
|
224,839
|
-
|
224,839
|
||||||||||||
|
Land acquisition and development
|
-
|
14,026
|
-
|
14,026
|
||||||||||||
|
Multi-family
|
-
|
58,374
|
-
|
58,374
|
||||||||||||
|
One-to-four family construction
|
-
|
-
|
12,235
|
12,235
|
||||||||||||
|
Total
|
$
|
179,029
|
$
|
580,271
|
$
|
64,843
|
$
|
824,143
|
||||||||
|
March 31, 2019
|
||||||||||||||||
|
Commercial business
|
$
|
162,796
|
$
|
-
|
$
|
-
|
$
|
162,796
|
||||||||
|
Commercial construction
|
-
|
-
|
70,533
|
70,533
|
||||||||||||
|
Office buildings
|
-
|
118,722
|
-
|
118,722
|
||||||||||||
|
Warehouse/industrial
|
-
|
91,787
|
-
|
91,787
|
||||||||||||
|
Retail/shopping centers/strip malls
|
-
|
64,934
|
-
|
64,934
|
||||||||||||
|
Assisted living facilities
|
-
|
2,740
|
-
|
2,740
|
||||||||||||
|
Single purpose facilities
|
-
|
183,249
|
-
|
183,249
|
||||||||||||
|
Land acquisition and development
|
-
|
17,027
|
-
|
17,027
|
||||||||||||
|
Multi-family
|
-
|
51,570
|
-
|
51,570
|
||||||||||||
|
One-to-four family construction
|
-
|
-
|
20,349
|
20,349
|
||||||||||||
|
Total
|
$
|
162,796
|
$
|
530,029
|
$
|
90,882
|
$
|
783,707
|
||||||||
Commercial Business Lending. At March 31, 2020, the commercial business loan portfolio totaled $179.0 million, or 19.6% of total loans. Commercial business
loans are typically secured by business equipment, accounts receivable, inventory or other property. The Company’s commercial business loans may be structured as term loans or as lines of credit. Commercial term loans are generally made to finance
the purchase of assets and usually have maturities of five years or less. Commercial lines of credit are typically made for the purpose of providing working capital and usually have a term of one year or less. Lines of credit are made at variable
rates of interest equal to a negotiated margin above an index rate and term loans are at either a variable or fixed rate. The Company also generally obtains personal guarantees from financially capable parties based on a review of personal financial
statements.
Commercial business lending involves risks that are different from those associated with residential and commercial real estate lending. Although commercial business loans are often collateralized
by equipment, inventory, accounts receivable or other business assets, the liquidation of collateral in the event of default is often an insufficient source of repayment because accounts receivable may be uncollectible and inventories may be obsolete
or of limited use, among other things. Accordingly, the repayment of commercial business loans depends primarily on the cash flow and credit-worthiness of the borrower and secondarily on the underlying collateral provided by the borrower.
Additionally, the borrower’s cash flow may be unpredictable and collateral securing these loans may fluctuate in value.
Other Real Estate Mortgage Lending. At March 31, 2020, the other real estate mortgage loan portfolio totaled $580.3 million, or 63.7% of total loans. The
Company originates other real estate mortgage loans secured by office buildings, warehouse/industrial, retail, assisted living facilities and single-purpose facilities (collectively “commercial real estate loans” or “CRE”); as well as land and
multi-family loans primarily located in its market area. At March 31, 2020, owner occupied properties accounted for 29.9% and non-owner occupied properties accounted for 70.1% of the Company’s commercial real estate loan portfolio.
7
Commercial real estate and multi-family loans typically have higher loan balances, are more difficult to evaluate and monitor, and involve a higher degree of risk than one-to-four family
residential loans. As a result, commercial real estate and multi-family loans are generally priced at a higher rate of interest than residential one-to-four family loans. Often payments on loans secured by commercial properties are dependent on the
successful operation and management of the property securing the loan or business conducted on the property securing the loan; therefore, repayment of these loans may be affected by adverse conditions in the real estate market or the economy. Real
estate lending is generally considered to be collateral based lending with loan amounts based on predetermined loan to collateral values and liquidation of the underlying real estate collateral being viewed as the primary source of repayment in the
event of borrower default. The Company seeks to minimize these risks by generally limiting the maximum loan-to-value ratio to 80% and strictly scrutinizing the financial condition of the borrower, the quality of the collateral and the management of
the property securing the loan. Loans are secured by first mortgages and often require specified debt service coverage (“DSC”) ratios depending on the characteristics of the collateral. The Company generally imposes a minimum DSC ratio of 1.20 for
loans secured by income producing properties. Rates and other terms on such loans generally depend on our assessment of credit risk after considering such factors as the borrower’s financial condition and credit history, loan-to-value ratio, DSC
ratio and other factors.
The Company actively pursues commercial real estate loans. Loan demand within the Company’s market area was competitive in fiscal year 2020 as economic conditions and competition for strong
credit-worthy borrowers remained high. At March 31, 2020 and 2019, the Company had the same two commercial real estate loans totaling $1.0 million and $1.1 million, respectively, on non-accrual status. For more information concerning risks related to
commercial real estate loans, see Item 1A. “Risk Factors – Our emphasis on commercial real estate lending may expose us to increased lending risks.”
Land acquisition and development loans are included in the other real estate mortgage loan portfolio balance and represent loans made to developers for the purpose of acquiring raw land and/or for
the subsequent development and sale of residential lots. Such loans typically finance land purchases and infrastructure development of properties (e.g. roads, utilities, etc.) with the aim of making improved lots ready for subsequent sales to
consumers or builders for ultimate construction of residential units. The primary source of repayment is generally the cash flow from developer sale of lots or improved parcels of land, secondary sources and personal guarantees, which may provide an
additional measure of security for such loans. At March 31, 2020, land acquisition and development loans totaled $14.0 million, or 1.54% of total loans compared to $17.0 million, or 1.94% of total loans at March 31, 2019. The largest land acquisition
and development loan had an outstanding balance at March 31, 2020 of $2.0 million and was performing according to its original payment terms. At March 31, 2020, all of the land acquisition and development loans were secured by properties located in
Washington and Oregon. At March 31, 2020 and 2019, the Company had no land acquisition and development loans on non-accrual status.
Real Estate Construction. The Company originates three types of residential construction loans: (i) speculative construction loans, (ii) custom/presold
construction loans and (iii) construction/permanent loans. The Company also originates construction loans for the development of business properties and multi-family dwellings. All of the Company’s real estate construction loans were made on
properties located in Washington and Oregon.
The composition of the Company’s construction loan portfolio, including undisbursed funds, was as follows at the dates indicated (dollars in thousands):
|
At March 31,
|
||||||||||||||||
|
2020
|
2019
|
|||||||||||||||
|
Amount (1)
|
Percent
|
Amount (1)
|
Percent
|
|||||||||||||
|
Speculative construction
|
$
|
5,016
|
5.65
|
%
|
$
|
12,315
|
8.01
|
%
|
||||||||
|
Commercial/multi-family construction
|
62,929
|
70.85
|
116,815
|
76.01
|
||||||||||||
|
Custom/presold construction
|
19,117
|
21.52
|
19,643
|
12.78
|
||||||||||||
|
Construction/permanent
|
1,759
|
1.98
|
4,923
|
3.20
|
||||||||||||
|
Total
|
$
|
88,821
|
100.00
|
%
|
$
|
153,696
|
100.00
|
%
|
||||||||
(1) Includes undisbursed funds of $24.0 million and $62.8 million at March 31, 2020 and 2019, respectively.
At March 31, 2020, the balance of the Company’s construction loan portfolio, including undisbursed funds, was $88.8 million compared to $153.7 million at March 31, 2019. The $64.9 million decrease
was primarily due to a $53.9 million decrease in commercial/multi-family construction loans along with a decrease of $7.3 million in speculative construction loans. The Company plans to continue to proactively manage and control the growth in its
construction loan portfolio in fiscal year 2021 while continuing to originate new construction loans to selected customers.
8
Speculative construction loans are made to home builders and are termed “speculative” because the home builder does not have, at the time of loan origination, a signed contract with a home buyer
who has a commitment for permanent financing with either the Company or another lender for the finished home. The home buyer may be identified either during or after the construction period, with the risk that the builder will have to service the
speculative construction loan and finance real estate taxes and other carrying costs of the completed home for a significant period of time after the completion of construction until a home buyer is identified. The largest speculative construction
loan at March 31, 2020 was a loan to finance the construction of a single family home totaling $458,000. This loan is to a single borrower that is secured by a property located in the Company’s market area. The average balance of loans in the
speculative construction loan portfolio at March 31, 2020 was $260,000. At March 31, 2020 and 2019, the Company had no speculative construction loans on non-accrual status.
The composition of land acquisition and development and speculative construction loans by geographical area is as follows at the dates indicated (in thousands):
|
Northwest
Oregon
|
Other
Oregon
|
Southwest Washington
|
Total
|
|||||||||||||
|
March 31, 2020
|
||||||||||||||||
|
Land acquisition and development
|
$
|
2,124
|
$
|
1,834
|
$
|
10,068
|
$
|
14,026
|
||||||||
|
Speculative construction
|
282
|
-
|
11,745
|
12,027
|
||||||||||||
|
Total
|
$
|
2,406
|
$
|
1,834
|
$
|
21,813
|
$
|
26,053
|
||||||||
|
March 31, 2019
|
||||||||||||||||
|
Land acquisition and development
|
$
|
2,184
|
$
|
1,908
|
$
|
12,935
|
$
|
17,027
|
||||||||
|
Speculative construction
|
1,680
|
104
|
15,284
|
17,068
|
||||||||||||
|
Total
|
$
|
3,864
|
$
|
2,012
|
$
|
28,219
|
$
|
34,095
|
||||||||
Unlike speculative construction loans, presold construction loans are made for homes that have buyers. Presold construction loans are made to homebuilders who, at the time of construction, have a
signed contract with a home buyer who has a commitment for permanent financing for the finished home from the Company or another lender. Presold construction loans are generally originated for a term of 12 months. At March 31, 2020 and 2019, presold
construction loans totaled $8.4 million and $8.5 million, respectively and are included in the speculative construction loan category.
Unlike speculative and presold construction loans, custom construction loans are made directly to the homeowner. At March 31, 2020 and 2019, the Company had no custom construction loans.
Construction/permanent loans are originated to the homeowner rather than the homebuilder along with a commitment by the Company to originate a permanent loan to the homeowner to repay the construction loan at the completion of construction. The
construction phase of a construction/permanent loan generally lasts six to nine months. At the completion of construction, the Company may either originate a fixed-rate mortgage loan or an adjustable rate mortgage (“ARM”) loan or use its mortgage
brokerage capabilities to obtain permanent financing for the customer with another lender. For adjustable rate loans, the interest rates adjust on their first adjustment date. See “Mortgage Brokerage” and “Mortgage Loan Servicing” below for more
information. At March 31, 2020, construction/permanent loans totaled $207,000, had a total commitment balance of $1.8 million and all were performing according to their original repayment terms. The average balance of loans in the
construction/permanent loan portfolio excluding undisbursed funds at March 31, 2020 was $69,000.
The Company provides construction financing for non-residential business properties and multi-family dwellings. At March 31, 2020 commercial construction loans totaled $52.6 million, or 81.1% of
total real estate construction loans and 5.8% of total loans. Borrowers may be the business owner/occupier of the building who intends to operate their business from the property upon construction, or non-owner developers. The expected source of
repayment of these loans is typically the sale or refinancing of the project upon completion of the construction phase. In certain circumstances, the Company may provide or commit to take-out financing upon construction. Take-out financing is subject
to the project meeting specific underwriting guidelines. No assurance can be given that such take-out financing will be available upon project completion. These loans are secured by office buildings, retail rental space, mini storage facilities,
assisted living facilities and multi-family dwellings located in the Company’s market area. At March 31, 2020, the largest commercial construction loan had a balance of $9.5 million and was performing according to its original repayment terms. The
average balance of loans in the commercial construction loan portfolio at March 31, 2020 was $3.8 million. At March 31, 2020 and 2019, the Company had no commercial construction loans on non-accrual status.
9
The Company has originated construction and land acquisition and development loans where a component of the cost of the project was the interest required to service the debt during the
construction period of the loan, sometimes known as interest reserves. The Company allows disbursements of this interest component as long as the project is progressing as originally projected and if there has been no deterioration in the financial
standing of the borrower or the underlying project. If the Company makes a determination that there is such deterioration, or if the loan becomes nonperforming, the Company halts any disbursement of those funds identified for use in paying interest.
In some cases, additional interest reserves may be taken by use of deposited funds or through credit lines secured by separate and additional collateral. For additional information concerning the risks related to construction lending, see Item 1A.
"Risk Factors – Our real estate construction and land acquisition and development loans expose us to risk."
Consumer Lending. Consumer loans totaled $87.4 million at March 31, 2020 and were comprised of $65.9 million of one-to-four family mortgage loans, $15.5
million of home equity lines of credit, $1.8 million of land loans to consumers for the future construction of one-to-four family homes and $4.2 million of other secured and unsecured consumer loans, which included $1.8 million of purchased
automobile loans.
One-to-four family residences located in the Company’s primary market area secure the majority of the residential loans. Underwriting standards require that one-to-four family portfolio loans
generally be owner occupied and that loan amounts not exceed 80% (95% with private mortgage insurance) of the lesser of current appraised value or cost of the underlying collateral. Terms typically range from 15 to 30 years. The Company also offers
balloon mortgage loans with terms of either five or seven years and originates both fixed-rate mortgages and ARMs with repricing based on the one-year constant maturity U.S. Treasury index or other index. At March 31, 2020, the Company had three
residential real estate loans totaling $152,000 on non-accrual status compared to three residential real estate loans totaling $169,000 at March 31, 2019. All of these loans were secured by properties located in Oregon and Washington.
The Company had previously purchased pools of automobile loans from another financial institution as a way to further diversify its loan portfolio and to earn a higher yield than on its cash or
short-term investments. These indirect automobile loans are originated through a single dealership group located outside the Company’s primary market area. Unlike a direct loan where the borrower makes an application directly to the lender, in these
loans the dealer, who has a direct financial interest in the loan transaction, assists the borrower in preparing the loan application. Indirect automobile loans we purchased are underwritten by us using substantially similar guidelines to our
internal guidelines. However, because these loans are originated through a third-party and not directly by us, we do not have direct contact with the borrower and therefore these loans may be more susceptible to a material misstatement on the loan
application and present greater risks than other types of lending activities. The collateral for these loans is comprised of a mix of used automobiles. These loans are purchased with servicing retained by the seller. The Company did not purchase any
automobile loans during fiscal years 2020 and 2019 and does not have plans to purchase any additional automobile loan pools. At March 31, 2020, six of the purchased automobile loans were on non-accrual status totaling $28,000. At March 31, 2019,
twelve of the purchased automobile loans were on non-accrual status totaling $41,000. The Company originates a variety of installment loans, including loans for debt consolidation and other purposes, automobile loans, boat loans and savings account
loans. At March 31, 2020 and 2019, excluding the purchased automobile loans noted above, the Company had no installment loans on non-accrual status.
Installment consumer loans generally entail greater risk than do residential mortgage loans, particularly in the case of consumer loans that are unsecured or secured by assets that depreciate
rapidly, such as mobile homes, automobiles, boats and recreational vehicles. In these cases, we face the risk that any collateral for a defaulted loan may not provide an adequate source of repayment of the outstanding loan balance. Thus, the recovery
and sale of such property could be insufficient to compensate us for the principal outstanding on these loans as a result of the greater likelihood of damage, loss or depreciation. The remaining deficiency often does not warrant further collection
efforts against the borrower beyond obtaining a deficiency judgment. In addition, consumer loan collections are dependent on the borrower’s continuing financial stability and are more likely to be adversely affected by job loss (especially now as a
result of the COVID-19 pandemic), divorce, illness or personal bankruptcy. Furthermore, the application of various federal and state laws, including bankruptcy and insolvency laws, may limit our ability to recover on such loans.
10
Loan Maturity. The following table sets forth certain information at March 31, 2020 regarding the dollar amount of loans maturing in the Company’s total
loan portfolio based on their contractual terms to maturity but does not include potential prepayments. Demand loans, loans having no stated schedule of repayments or stated maturity and overdrafts are reported as due in one year or less. Loan
balances are reported net of deferred fees (in thousands):
|
Within 1
Year
|
1 – 3 Years
|
After 3 – 5
Years
|
After 5 – 10
Years
|
Beyond 10
Years
|
Total
|
|||||||||||||||||||
|
Commercial and construction:
|
||||||||||||||||||||||||
|
Commercial business
|
$
|
22,035
|
$
|
11,591
|
$
|
16,388
|
$
|
48,733
|
$
|
80,282
|
$
|
179,029
|
||||||||||||
|
Other real estate mortgage
|
19,952
|
40,054
|
54,559
|
397,165
|
68,541
|
580,271
|
||||||||||||||||||
|
Real estate construction
|
11,923
|
1,689
|
-
|
44,668
|
6,563
|
64,843
|
||||||||||||||||||
|
Total commercial and construction
|
53,910
|
53,334
|
70,947
|
490,566
|
155,386
|
824,143
|
||||||||||||||||||
|
Consumer:
|
||||||||||||||||||||||||
|
Real estate one-to-four family
|
127
|
365
|
594
|
4,262
|
77,802
|
83,150
|
||||||||||||||||||
|
Other installment
|
1,031
|
1,480
|
1,172
|
233
|
300
|
4,216
|
||||||||||||||||||
|
Total consumer
|
1,158
|
1,845
|
1,766
|
4,495
|
78,102
|
87,366
|
||||||||||||||||||
|
Total loans
|
$
|
55,068
|
$
|
55,179
|
$
|
72,713
|
$
|
495,061
|
$
|
233,488
|
$
|
911,509
|
||||||||||||
The following table sets forth the dollar amount of loans due after one year from March 31, 2020, which have fixed and adjustable interest rates (in thousands):
|
Fixed
Rate
|
Adjustable
Rate
|
Total
|
||||||||||
|
Commercial and construction:
|
||||||||||||
|
Commercial business
|
$
|
95,081
|
$
|
61,913
|
$
|
156,994
|
||||||
|
Other real estate mortgage
|
224,767
|
335,552
|
560,319
|
|||||||||
|
Real estate construction
|
16,346
|
36,574
|
52,920
|
|||||||||
|
Total commercial and construction
|
336,194
|
434,039
|
770,233
|
|||||||||
|
Consumer:
|
||||||||||||
|
Real estate one-to-four family
|
64,522
|
18,501
|
83,023
|
|||||||||
|
Other installment
|
2,638
|
547
|
3,185
|
|||||||||
|
Total consumer
|
67,160
|
19,048
|
86,208
|
|||||||||
|
Total loans
|
$
|
403,354
|
$
|
453,087
|
$
|
856,441
|
||||||
Loan Commitments. The Company issues commitments to originate commercial loans, other real estate mortgage loans, construction loans, residential mortgage
loans and other installment loans conditioned upon the occurrence of certain events. The Company uses the same credit policies in making commitments as it does for on-balance sheet instruments. Commitments to originate loans are conditional and are
honored for up to 45 days subject to the Company’s usual terms and conditions. Collateral is not required to support commitments. At March 31, 2020, the Company had outstanding commitments to originate loans of $35.8 million compared to $40.7 million
at March 31, 2019.
Mortgage Brokerage. The Company employs commissioned brokers who originate mortgage loans (including construction loans) for various mortgage companies, as
well as for the Company. The loans brokered to mortgage companies are closed in the name of, and funded by, the purchasing mortgage company and are not originated as an asset of the Company. In return, the Company receives a fee ranging from 1.5% to
2.0% of the loan amount that it shares with the commissioned broker. Loans brokered to the Company are closed on the Company's books and the commissioned broker receives a portion of the origination fee. During the year ended March 31, 2020, brokered
loans totaled $45.5 million (including $11.1 million brokered to the Company) compared to $35.0 million (including $10.4 million brokered to the Company) of brokered loans in fiscal year 2019. Beginning in fiscal year 2022, the Company is planning to
transition to a model where all future mortgage loan originations will be brokered to various third-party mortgage companies. Gross fees of $666,000 and $504,000, which includes brokered loan fees and fees for loans sold to the Federal Home Loan
Mortgage Company (“FHLMC”), were earned for the years ended March 31, 2020 and 2019, respectively. The interest rate environment has a strong influence on the loan volume and amount of fees generated from the mortgage broker activity. In general,
during periods of rising interest rates, the volume of loans and the amount of loan fees generally decrease as a result of slower mortgage loan demand. Conversely, during periods of falling interest rates, the volume of loans and the amount of loan
fees generally increase as a result of the increased mortgage loan demand.
11
Mortgage Loan Servicing. The Company is a qualified servicer for the FHLMC. The Company generally sells fixed-rate residential one-to-four family mortgage
loans that it originates with maturities of 15 years or more and balloon mortgages to the FHLMC as part of its asset/liability strategy. Mortgage loans are sold to the FHLMC on a non-recourse basis whereby foreclosure losses are the responsibility of
the FHLMC and not the Company. The Company's general policy is to close its residential loans on FHLMC modified loan documents to facilitate future sales to the FHLMC. Upon sale, the Company continues to collect payments on the loans, supervise
foreclosure proceedings, and otherwise service the loans. At March 31, 2020, total loans serviced for others were $146.8 million, of which $99.5 million were serviced for the FHLMC. Beginning in fiscal year 2021, the Company does not intend to
originate and sell mortgages loans to FHLMC; however, the Company will continue to service its existing FHLMC portfolio.
Nonperforming Assets. Nonperforming assets were $1.4 million or 0.12% of total assets at March 31, 2020 compared with $1.5 million or 0.13% of total assets
at March 31, 2019. The Company had net loan charge-offs totaling $83,000 during fiscal 2020 compared to net recoveries of $641,000 during fiscal 2019. Credit quality metrics continued to improve in the past fiscal year and the real estate market in
our primary market area has improved steadily. Economic conditions have been stable and even continued to improve throughout a majority of the fiscal year; however, the current economic downturn in our market area related to the COVID-19 pandemic
could result in future increases in nonperforming assets, in the provision for loan losses and in loan charge-offs that may materially adversely affect our results of operations and financial condition.
Loans are reviewed regularly and it is the Company’s general policy that when a loan is 90 days delinquent or when collection of principal or interest appears doubtful, it is placed on non-accrual
status, at which time the accrual of interest ceases and a reserve for any unrecoverable accrued interest is established and charged against operations. In general, payments received on non-accrual loans are applied to reduce the outstanding
principal balance on a cash-basis method.
The Company continues to proactively manage its residential construction and land acquisition and development loan portfolios. At March 31, 2020, the Company’s residential construction and land
acquisition and development loan portfolios were $12.2 million and $14.0 million, respectively, as compared to $20.3 million and $17.0 million, respectively, at March 31, 2019. At March 31, 2020 and 2019, there were no nonperforming loans in the
residential construction loan portfolio or the land acquisition and development portfolio. For the years ended March 31, 2020 and 2019, there were no charge-offs or recoveries in the residential construction and land acquisition and development loan
portfolios.
The following table sets forth information regarding the Company’s nonperforming loans at the dates indicated (dollars in thousands):
|
March 31, 2020
|
March 31, 2019
|
|||||||||||||||
|
Number
of Loans
|
Balance
|
Number
of Loans
|
Balance
|
|||||||||||||
|
Commercial business
|
2
|
$
|
201
|
2
|
$
|
225
|
||||||||||
|
Commercial real estate
|
2
|
1,014
|
2
|
1,081
|
||||||||||||
|
Consumer
|
9
|
180
|
16
|
213
|
||||||||||||
|
Total
|
13
|
$
|
1,395
|
20
|
$
|
1,519
|
||||||||||
Nonperforming loans decreased compared to the prior fiscal year as the Company continues its efforts to work out problem loans, seek full repayment or pursue foreclosure proceedings. All of these
loans are to borrowers with properties located in Oregon and Washington, with the exception of six automobile loans totaling $28,000. At March 31, 2020, 82.67% of the Company’s nonperforming loans, totaling $1.2 million, were measured for impairment.
These loans have been charged down to the estimated fair market value of the collateral less selling costs or carry a specific reserve to reduce the net carrying value. There were no reserves associated with these nonperforming loans that were
measured for impairment at March 31, 2020. At March 31, 2020, the largest single nonperforming loan was a commercial real estate loan totaling $851,000. This loan was measured for impairment during fiscal year 2020 and management determined that a
specific reserve was not required.
12
The following table sets forth information regarding the Company’s nonperforming assets at the dates indicated (in thousands):
|
At March 31,
|
||||||||||||||||||||
|
2020
|
2019
|
2018
|
2017
|
2016
|
||||||||||||||||
|
Loans accounted for on a non-accrual basis:
|
||||||||||||||||||||
|
Commercial business
|
$
|
201
|
$
|
225
|
$
|
178
|
$
|
294
|
$
|
-
|
||||||||||
|
Other real estate mortgage
|
1,014
|
1,081
|
1,963
|
2,143
|
2,360
|
|||||||||||||||
|
Consumer
|
180
|
210
|
277
|
278
|
334
|
|||||||||||||||
|
Total
|
1,395
|
1,516
|
2,418
|
2,715
|
2,694
|
|||||||||||||||
|
Accruing loans which are contractually
past due 90 days or more
|
-
|
3
|
-
|
34
|
20
|
|||||||||||||||
|
Total nonperforming loans
|
1,395
|
1,519
|
2,418
|
2,749
|
2,714
|
|||||||||||||||
|
Real estate owned (“REO”)
|
-
|
-
|
298
|
298
|
595
|
|||||||||||||||
|
Total nonperforming assets
|
$
|
1,395
|
$
|
1,519
|
$
|
2,716
|
$
|
3,047
|
$
|
3,309
|
||||||||||
|
Foregone interest on non-accrual loans
|
$
|
75
|
$
|
94
|
$
|
102
|
$
|
81
|
$
|
112
|
||||||||||
The following tables set forth information regarding the Company’s nonperforming assets by loan type and geographical area at the dates indicated (in thousands):
|
Northwest
Oregon
|
Other
Oregon
|
Southwest Washington
|
Other
|
Total
|
||||||||||||||||
|
March 31, 2020
|
||||||||||||||||||||
|
Commercial business
|
$
|
-
|
$
|
-
|
$
|
201
|
$
|
-
|
$
|
201
|
||||||||||
|
Commercial real estate
|
-
|
851
|
163
|
-
|
1,014
|
|||||||||||||||
|
Consumer
|
-
|
-
|
152
|
28
|
180
|
|||||||||||||||
|
Total nonperforming assets
|
$
|
-
|
$
|
851
|
$
|
516
|
$
|
28
|
$
|
1,395
|
||||||||||
|
March 31, 2019
|
||||||||||||||||||||
|
Commercial business
|
$
|
65
|
$
|
-
|
$
|
160
|
$
|
-
|
$
|
225
|
||||||||||
|
Commercial real estate
|
-
|
896
|
185
|
-
|
1,081
|
|||||||||||||||
|
Consumer
|
-
|
-
|
169
|
44
|
213
|
|||||||||||||||
|
Total nonperforming assets
|
$
|
65
|
$
|
896
|
$
|
514
|
$
|
44
|
$
|
1,519
|
||||||||||
Other loans of concern, which are classified as substandard loans and are not presently included in the non-accrual category, consist of loans where the borrowers have cash flow problems, or the
collateral securing the respective loans may be inadequate. In either or both of these situations, the borrowers may be unable to comply with the present loan repayment terms, and the loans may subsequently be included in the non-accrual category.
Management considers the allowance for loan losses to be adequate at March 31, 2020, to cover the probable losses inherent in these and other loans.
The following table sets forth information regarding the Company’s other loans of concern at the dates indicated (dollars in thousands):
|
March 31, 2020
|
March 31, 2019
|
|||||||||||||||
|
Number
of Loans
|
Balance
|
Number
of Loans
|
Balance
|
|||||||||||||
|
Commercial business
|
3
|
$
|
147
|
9
|
$
|
1,734
|
||||||||||
|
Commercial real estate
|
-
|
-
|
3
|
2,308
|
||||||||||||
|
Land
|
-
|
-
|
1
|
728
|
||||||||||||
|
Multi-family
|
3
|
34
|
2
|
20
|
||||||||||||
|
Total
|
6
|
$
|
181
|
15
|
$
|
4,790
|
||||||||||
At March 31, 2020, loans delinquent 30 – 89 days were 0.03% of total loans compared to 0.04% at March 31, 2019 and were comprised of consumer loans. There were no loans 30-89 days past due in our
commercial real estate (“CRE”) or commercial business portfolio at March 31, 2020 or March 31, 2019. CRE loans represent the largest portion of our loan portfolio at 55.72% of total loans and commercial business loans represent 19.64% of total loans.
13
Troubled debt restructurings (“TDRs”) are loans for which the Company, for economic or legal reasons related to the borrower's financial condition, has granted a concession to the borrower that it
would otherwise not consider. A TDR typically involves a modification of terms such as a reduction of the stated interest rate or face amount of the loan, a reduction of accrued interest, and/or an extension of the maturity date(s) at a stated
interest rate lower than the current market rate for a new loan with similar risk.
TDRs are considered impaired loans and as such, when a loan is deemed to be impaired, the amount of the impairment is measured using discounted cash flows and the original note rate, except when
the loan is collateral dependent. In these cases, the estimated fair value of the collateral (less any selling costs, if applicable) is used. Impairment is recognized as a specific component within the allowance for loan losses if the estimated value
of the impaired loan is less than the recorded investment in the loan. When the amount of the impairment represents a confirmed loss, it is charged off against the allowance for loan losses. At March 31, 2020, the Company had TDRs totaling $5.2
million, of which $4.0 million were on accrual status. The $1.2 million of TDRs accounted for on a non-accrual basis at March 31, 2020 are included as nonperforming loans in the nonperforming asset table above. All of the Company’s TDRs were paying
as agreed at March 31, 2020 except for one commercial real estate loan totaling $851,000. The related amount of interest income recognized on these TDR loans was $221,000 for the year ended March 31, 2020.
The Company has determined that, in certain circumstances, it is appropriate to split a loan into multiple notes. This typically includes a nonperforming charged-off loan that is not supported by
the cash flow of the relationship and a performing loan that is supported by the cash flow. These may also be split into multiple notes to align portions of the loan balance with the various sources of repayment when more than one exists. Generally,
the new loans are restructured based on customary underwriting standards. In situations where they are not, the policy exception qualifies as a concession, and if the borrower is experiencing financial difficulties, the loans are accounted for as
TDRs.
The CARES Act, signed into law on March 27, 2020, amended accounting principles generally accepted in the United States of America (“GAAP”) with respect to the modification of loans to borrowers
affected by the COVID-19 pandemic. Among other criteria, this guidance provided that short-term loan modifications made on a good faith basis to borrowers who were current as defined under the CARES Act prior to any relief, are not TDRs. This
includes short-term (e.g. six months) modifications such as payment deferrals, fee waivers, extensions of repayment terms, or other delays in payment that are insignificant. To qualify as an eligible loan under the CARES Act, a loan modification must
be 1) related to COVID-19; 2) executed on a loan that was not more than 30 days past due as of December 31, 2019; and 3) executed between March 1, 2020, and the earlier of A) 60 days after the date of termination of the national emergency by the
President or B) December 31, 2020. As of March 31, 2020 the Company had approved ten loan modifications related to the COVID-19 pandemic totaling $36.2 million which consisted of deferral of regularly scheduled principal and interest payments for
three months. Loan modifications in accordance with the CARES Act are still subject to an evaluation in regards to determining whether or not a loan is deemed to be impaired. For additional information related to loan modifications as a result of
the COVID-19 pandemic, see “Item 7. “Management’s Discussion and Analysis of Financial Condition and Results of Operations – Recent Developments Related to COVID-19.
The accrual status of a loan may change after it has been classified as a TDR. The Company’s general policy related to TDRs is to perform a credit evaluation of the borrower’s financial condition
and prospects for repayment under the revised terms. This evaluation includes consideration of the borrower’s sustained historical repayment performance for a reasonable period of time. A sustained period of repayment performance generally would be a
minimum of six months and may include repayments made prior to the restructuring date. If repayment of principal and interest appears doubtful, it is placed on non-accrual status.
In accordance with the Company’s policy guidelines, unsecured loans are generally charged-off when no payments have been received for three consecutive months unless an alternative action plan is
in effect. Consumer installment loans delinquent six months or more that have not received at least 75% of their required monthly payment in the last 90 days are charged-off. In addition, loans discharged in bankruptcy proceedings are charged-off.
Loans under bankruptcy protection with no payments received for four consecutive months are charged-off. The outstanding balance of a secured loan that is in excess of the net realizable value is generally charged-off if no payments are received for
four to five consecutive months. However, charge-offs are postponed if alternative proposals to restructure, obtain additional guarantors, obtain additional assets as collateral or a potential sale of the underlying collateral would result in full
repayment of the outstanding loan balance. Once any other potential sources of repayment are exhausted, the impaired portion of the loan is charged-off. Regardless of whether a loan is unsecured or collateralized, once an amount is determined to be a
confirmed loan loss it is promptly charged off.
14
Asset Classification. The OCC has adopted various regulations regarding problem assets of savings institutions. The regulations require that each insured
institution review and classify its assets on a regular basis. In addition, in connection with examinations of insured institutions, OCC examiners have authority to identify problem assets and, if appropriate, require them to be classified as such.
There are three classifications for problem assets: substandard, doubtful and loss (collectively “classified loans”). Substandard assets have one or more defined weaknesses and are characterized by the distinct possibility that the insured
institution will sustain some loss if the deficiencies are not corrected. Doubtful assets have the weaknesses of substandard assets with the additional characteristic that the weaknesses make collection or liquidation in full on the basis of
currently existing facts, conditions and values questionable, and there is a high possibility of loss. An asset classified as loss is considered uncollectible and of such little value that continuance as an asset of the institution is not warranted.
When the Company classifies problem assets as either substandard or doubtful, we may determine that the loan is impaired and establish a specific allowance in an amount we deem prudent to address
the risk specifically or we may allow the loss to be addressed in the general allowance. General allowances represent loss allowances which have been established to recognize the inherent risk associated with lending activities, but which, unlike
specific allowances, have not been specifically allocated to particular problem assets. When a problem asset is classified by us as a loss, we are required to charge off the asset in the period in which it is deemed uncollectible.
The aggregate amount of the Company's classified loans (comprised entirely of substandard loans), general loss allowances, specific loss allowances and net recoveries were as follows at the dates
indicated (in thousands):
|
At or For the Year
|
||||||||
|
Ended March 31,
|
||||||||
|
2020
|
2019
|
|||||||
|
Classified loans
|
$
|
1,576
|
$
|
6,306
|
||||
|
General loss allowances
|
12,612
|
11,435
|
||||||
|
Specific loss allowances
|
12
|
22
|
||||||
|
Net charge-offs (recoveries)
|
83
|
(641
|
)
|
|||||
All of the loans on non-accrual status as of March 31, 2020 were categorized as classified loans. Classified loans at March 31, 2020 were comprised of five commercial business loans totaling
$348,000, two commercial real estate loans totaling $1.0 million (the largest of which was $851,000), three multi-family loans totaling $34,000, three one-to-four family real estate loans totaling $152,000 and six purchased automobile loans totaling
$28,000.
Allowance for Loan Losses. The Company maintains an allowance for loan losses to provide for probable losses inherent in the loan portfolio consistent with
GAAP guidelines. The adequacy of the allowance is evaluated monthly to maintain the allowance at levels sufficient to provide for inherent losses existing at the balance sheet date. The key components to the evaluation are the Company’s internal loan
review function by its credit administration, which reviews and monitors the risk and quality of the loan portfolio; as well as the Company’s external loan reviews and its loan classification systems. Credit officers are expected to monitor their
loan portfolios and make recommendations to change loan grades whenever changes are warranted. Credit administration approves any changes to loan grades and monitors loan grades. For additional discussion of the Company’s methodology for assessing
the appropriate level of the allowance for loan losses see Item 7. “Management’s Discussion and Analysis of Financial Condition and Results of Operations – Critical Accounting Policies."
In accordance with GAAP, loans acquired from MBank during the fiscal year ended March 31, 2017 were recorded at their estimated fair value, which resulted in a net discount to the loans’
contractual amounts, of which a portion reflects a discount for possible credit losses. Credit discounts are included in the determination of fair value, and, as a result, no allowance for loan losses is recorded for acquired loans at the acquisition
date. The discount recorded on the acquired loans is not reflected in the allowance for loan losses or related allowance coverage ratios. However, we believe it should be considered when comparing certain financial ratios of the Company calculated in
periods after the MBank transaction, compared to the same financial ratios of the Company in periods prior to the MBank transaction. The net discount on these acquired loans was $1.1 million and $1.5 million at March 31, 2020 and 2019, respectively.
The Company recorded a provision for loan losses of $1.3 million and $50,000 for the years ended March 31, 2020 and 2019, respectively. At March 31, 2020, the Company had an allowance for loan
losses of $12.6 million, or 1.38% of total loans, compared to $11.5 million, or 1.31% at March 31, 2019. The increase in the balance of the allowance for loan losses at March 31, 2020 reflects the consideration of the weakening economic conditions as
a result of the COVID-19 pandemic and to a lesser extent, the $35.4 million increase in loan balances from March 31, 2019 compared to March 31, 2020. During fiscal year 2020, the Company experienced improvement in the level of delinquent,
nonperforming and classified loans. Net
15
charge-offs totaled $83,000 for the fiscal year ended March 31, 2020 compared to net recoveries of $641,000 in the prior fiscal year. Nonperforming loans decreased $124,000 and 30-89 day
delinquent loans decreased $74,000 during the fiscal year ended March 31, 2020. Classified loans were $1.6 million at March 31, 2020 compared to $6.3 million at March 31, 2019. The $4.7 million decrease is primarily attributed to the payoff of six
commercial business loans with an unpaid principal balance of $1.1 million during fiscal year 2020 along with risk rating upgrades totaling $3.3 million, including two commercial real estate loans totaling $2.2 million. The coverage ratio of
allowance for loan losses to nonperforming loans was 904.95% at March 31, 2020 compared to 754.25% at March 31, 2019. The Company’s general valuation allowance to non-impaired loans was 1.39% and 1.31% at March 31, 2020 and 2019, respectively.
Management considers the allowance for loan losses to be adequate at March 31, 2020 to cover probable losses inherent in the loan portfolio based on the assessment of various factors affecting the
loan portfolio, and the Company believes it has established its existing allowance for loan losses in accordance with GAAP. However, a further decline in national and local economic conditions (including declines as a result of the COVID-19
pandemic), results of examinations by the Company’s banking regulators, or other factors could result in a material increase in the allowance for loan losses and may adversely affect the Company’s future financial condition and results of operations.
In addition, because future events affecting borrowers and collateral cannot be predicted with certainty, there can be no assurance that the existing allowance for loan losses will be adequate or that substantial increases will not be necessary
should the quality of any loans deteriorate or should collateral values decline as a result of the factors discussed elsewhere in this document.
The following table sets forth an analysis of the Company's allowance for loan losses for the periods indicated (dollars in thousands):
|
Year Ended March 31,
|
||||||||||||||||||||
|
2020
|
2019
|
2018
|
2017
|
2016
|
||||||||||||||||
|
Balance at beginning of year
|
$
|
11,457
|
$
|
10,766
|
$
|
10,528
|
$
|
9,885
|
$
|
10,762
|
||||||||||
|
Provision for (recapture of) loan losses
|
1,250
|
50
|
-
|
-
|
(1,150
|
)
|
||||||||||||||
|
Recoveries:
|
||||||||||||||||||||
|
Commercial and construction
|
||||||||||||||||||||
|
Commercial business
|
-
|
1
|
240
|
492
|
30
|
|||||||||||||||
|
Other real estate mortgage
|
-
|
824
|
347
|
463
|
331
|
|||||||||||||||
|
Real estate construction
|
-
|
-
|
-
|
-
|
6
|
|||||||||||||||
|
Total commercial and construction
|
-
|
825
|
587
|
955
|
367
|
|||||||||||||||
|
Consumer
|
||||||||||||||||||||
|
Real estate one-to-four family
|
30
|
80
|
11
|
89
|
153
|
|||||||||||||||
|
Other installment
|
33
|
27
|
48
|
57
|
27
|
|||||||||||||||
|
Total consumer
|
63
|
107
|
59
|
146
|
180
|
|||||||||||||||
|
Total recoveries
|
63
|
932
|
646
|
1,101
|
547
|
|||||||||||||||
|
Charge-offs:
|
||||||||||||||||||||
|
Commercial and construction
|
||||||||||||||||||||
|
Commercial business
|
64
|
-
|
-
|
1
|
-
|
|||||||||||||||
|
Other real estate mortgage
|
-
|
-
|
68
|
117
|
-
|
|||||||||||||||
|
Real estate construction
|
-
|
-
|
-
|
-
|
-
|
|||||||||||||||
|
Total commercial and construction
|
64
|
-
|
68
|
118
|
-
|
|||||||||||||||
|
Consumer
|
||||||||||||||||||||
|
Real estate one-to-four family
|
-
|
30
|
12
|
-
|
8
|
|||||||||||||||
|
Other installment
|
82
|
261
|
328
|
340
|
266
|
|||||||||||||||
|
Total consumer
|
82
|
291
|
340
|
340
|
274
|
|||||||||||||||
|
Total charge-offs
|
146
|
291
|
408
|
458
|
274
|
|||||||||||||||
|
Net charge-offs (recoveries)
|
83
|
(641
|
)
|
(238
|
)
|
(643
|
)
|
(273
|
)
|
|||||||||||
|
Balance at end of year
|
$
|
12,624
|
$
|
11,457
|
$
|
10,766
|
$
|
10,528
|
$
|
9,885
|
||||||||||
|
Ratio of allowance to total loans
outstanding at end of year
|
1.38
|
%
|
1.31
|
%
|
1.33
|
%
|
1.35
|
%
|
1.58
|
%
|
||||||||||
|
Ratio of net (recoveries) charge-offs to average net
loans outstanding during year
|
0.01
|
(0.08
|
)
|
(0.03
|
)
|
(0.10
|
)
|
(0.05
|
)
|
|||||||||||
|
Ratio of allowance to total nonperforming loans
|
904.95
|
754.25
|
445.24
|
382.98
|
364.22
|
|||||||||||||||
16
|
At March 31,
|
||||||||||||||||||||||||||||||||||||||||
|
2020
|
2019
|
2018
|
2017
|
2016
|
||||||||||||||||||||||||||||||||||||
|
Amount
|
Loan Category
as a
Percent
of Total Loans
|
Amount
|
Loan Category
as a
Percent
of Total Loans
|
Amount
|
Loan Category
as a
Percent
of Total Loans
|
Amount
|
Loan Category
as a
Percent
of Total Loans
|
Amount
|
Loan Category
as a
Percent
of Total Loans
|
|||||||||||||||||||||||||||||||
|
Commercial and construction:
|
||||||||||||||||||||||||||||||||||||||||
|
Commercial business
|
$
|
2,008
|
19.64
|
%
|
$
|
1,808
|
18.58
|
%
|
$
|
1,668
|
16.97
|
%
|
$
|
1,418
|
13.78
|
%
|
$
|
1,048
|
11.11
|
%
|
||||||||||||||||||||
|
Other real estate mortgage
|
7,505
|
63.66
|
6,035
|
60.50
|
5,956
|
65.20
|
5,609
|
65.00
|
5,310
|
63.94
|
||||||||||||||||||||||||||||||
|
Real estate construction
|
1,149
|
7.12
|
1,457
|
10.37
|
618
|
4.88
|
714
|
5.92
|
416
|
4.28
|
||||||||||||||||||||||||||||||
|
Consumer:
|
||||||||||||||||||||||||||||||||||||||||
|
Real estate one-to-four family
|
1,237
|
9.12
|
1,208
|
9.60
|
1,400
|
11.10
|
1,525
|
11.91
|
1,652
|
14.21
|
||||||||||||||||||||||||||||||
|
Other installment
|
126
|
0.46
|
239
|
0.95
|
409
|
1.85
|
574
|
3.39
|
751
|
6.46
|
||||||||||||||||||||||||||||||
|
Unallocated
|
599
|
-
|
710
|
-
|
715
|
-
|
688
|
-
|
708
|
-
|
||||||||||||||||||||||||||||||
|
Total allowance for loan losses
|
$
|
12,624
|
100.00
|
%
|
$
|
11,457
|
100.00
|
%
|
$
|
10,766
|
100.00
|
%
|
$
|
10,528
|
100.00
|
%
|
$
|
9,885
|
100.00
|
%
|
||||||||||||||||||||
17
Investment Activities
The Board sets the investment policy of the Company. The Company's investment objectives are: to provide and maintain liquidity within regulatory guidelines; to maintain a balance of high quality,
diversified investments to minimize risk; to provide collateral for pledging requirements; to serve as a balance to earnings; and to optimize returns. The policy permits investment in various types of liquid assets (generally debt and asset-backed
securities) permissible under OCC regulation, which includes U.S. Treasury obligations, securities of various federal agencies, "bank qualified" municipal bonds, certain certificates of deposit of insured banks, repurchase agreements, federal funds,
real estate mortgage investment conduits (“REMICS”) and mortgage-backed securities (“MBS”), but does not permit investment in non-investment grade bonds. The policy also dictates the criteria for classifying investment securities into one of three
categories: held to maturity, available for sale or trading. At March 31, 2020, no investment securities were held for trading purposes. At March 31, 2020, the Company’s investment portfolio consists of debt securities and does not include any
equity securities. See Item 7. “Management’s Discussion and Analysis of Financial Condition and Results of Operations – Critical Accounting Policies."
The Company primarily purchases agency securities with maturities of five years or less and purchases a combination of MBS backed by government agencies (FHLMC, Fannie Mae (“FNMA”), U.S. Small
Business Administration (“SBA”) or Ginnie Mae (“GNMA”)). FHLMC and FNMA securities are not backed by the full faith and credit of the U.S. government, while SBA and GNMA securities are backed by the full faith and credit of the U.S. government. At
March 31, 2020, the Company owned no privately issued MBS. Our REMICS are MBS issued by FHLMC, FNMA and GNMA and our CRE MBS are issued by FNMA. The Company does not believe that it has any exposure to sub-prime lending in its investment securities
portfolio. See Note 3 of the Notes to the Consolidated Financial Statements contained in Item 8 of this Form 10-K for additional information.
The following table sets forth the investment securities portfolio and carrying values at the dates indicated (dollars in thousands):
|
At March 31,
|
||||||||||||||||||||||||
|
2020
|
2019
|
2018
|
||||||||||||||||||||||
|
Carrying
Value
|
Percent of
Portfolio
|
Carrying
Value
|
Percent of
Portfolio
|
Carrying
Value
|
Percent of
Portfolio
|
|||||||||||||||||||
|
Available for sale (at estimated fair value):
|
||||||||||||||||||||||||
|
Municipal securities
|
$
|
4,877
|
3.29
|
%
|
$
|
8,881
|
4.98
|
%
|
$
|
8,732
|
4.09
|
%
|
||||||||||||
|
Agency securities
|
6,016
|
4.06
|
12,341
|
6.92
|
22,102
|
10.36
|
||||||||||||||||||
|
REMICs
|
43,791
|
29.52
|
40,162
|
22.53
|
46,955
|
22.02
|
||||||||||||||||||
|
Residential MBS
|
60,085
|
40.51
|
75,821
|
42.54
|
89,074
|
41.77
|
||||||||||||||||||
|
Other MBS
|
33,522
|
22.60
|
41,021
|
23.01
|
46,358
|
21.74
|
||||||||||||||||||
|
148,291
|
99.98
|
178,226
|
99.98
|
213,221
|
99.98
|
|||||||||||||||||||
|
Held to maturity (at amortized cost):
|
||||||||||||||||||||||||
|
Residential MBS
|
28
|
0.02
|
35
|
0.02
|
42
|
0.02
|
||||||||||||||||||
|
Total investment securities
|
$
|
148,319
|
100.00
|
%
|
$
|
178,261
|
100.00
|
%
|
$
|
213,263
|
100.00
|
%
|
||||||||||||
The following table sets forth the maturities and weighted average yields in the securities portfolio at March 31, 2020 (dollars in thousands):
|
Less Than One Year
|
One to Five Years
|
More Than Five to
Ten Years
|
More Than
Ten Years
|
|||||||||||||||||||||||||||||
|
Amount
|
Weighted
Average
Yield (1)
|
Amount
|
Weighted
Average
Yield (1)
|
Amount
|
Weighted
Average
Yield (1)
|
Amount
|
Weighted
Average
Yield (1)
|
|||||||||||||||||||||||||
|
Municipal securities
|
$
|
-
|
-
|
%
|
$
|
51
|
2.66
|
%
|
$
|
2,333
|
5.03
|
%
|
$
|
2,493
|
3.00
|
%
|
||||||||||||||||
|
Agency securities
|
1,015
|
2.47
|
1,998
|
1.95
|
3,003
|
1.75
|
-
|
-
|
||||||||||||||||||||||||
|
REMICS
|
-
|
-
|
748
|
1.52
|
12,492
|
1.44
|
30,551
|
1.82
|
||||||||||||||||||||||||
|
Residential MBS
|
-
|
-
|
25
|
3.58
|
8,462
|
2.08
|
51,626
|
1.95
|
||||||||||||||||||||||||
|
Other MBS
|
-
|
-
|
1,523
|
1.76
|
7,696
|
2.33
|
24,303
|
2.23
|
||||||||||||||||||||||||
|
Total
|
$
|
1,015
|
2.47
|
%
|
$
|
4,345
|
1.82
|
%
|
$
|
33,986
|
2.08
|
%
|
$
|
108,973
|
2.00
|
%
|
||||||||||||||||
(1) For available for sale securities carried at estimated fair value, the weighted average yield is computed using amortized cost without a tax equivalent
adjustment for tax-exempt obligations.
18
Management reviews investment securities quarterly for the presence of other than temporary impairment (“OTTI”), taking into consideration current market conditions, the extent and nature of
changes in estimated fair value, issuer rating changes and trends, financial condition of the underlying issuers, current analysts’ evaluations, the Company’s ability and intent to hold investments until a recovery of estimated fair value, which may
be maturity, as well as other factors. There was no OTTI charge for investment securities for the years ended March 31, 2020, 2019 or 2018. However, additional deterioration in market and economic conditions related to the COVID-19 pandemic may have
an adverse impact on credit quality in the future and result in OTTI charges.
Deposit Activities and Other Sources of Funds
General. Deposits, loan repayments and loan sales are the major sources of the Company's funds for lending and other investment purposes. Loan repayments
are a relatively stable source of funds, while deposit inflows and outflows and loan prepayments are significantly influenced by general interest rates and money market conditions. Borrowings may be used on a short-term basis to compensate for
reductions in the availability of funds from other sources. They may also be used on a longer-term basis for general business purposes.
Deposit Accounts. The Company attracts deposits from within its primary market area by offering a broad selection of deposit instruments, including demand
deposits, negotiable order of withdrawal ("NOW") accounts, money market accounts, savings accounts, certificates of deposit and retirement savings plans. The Company has focused on building customer relationship deposits which include both business
and consumer depositors. Deposit account terms vary according to, among other factors, the minimum balance required, the time periods the funds must remain on deposit and the interest rate. In determining the terms of its deposit accounts, the
Company considers the rates offered by its competition, profitability to the Company, matching deposit and loan products and customer preferences and concerns.
The following table sets forth the average balances of deposit accounts held by the Company at the dates indicated (dollars in thousands):
|
Year Ended March 31,
|
||||||||||||||||||||||||
|
2020
|
2019
|
2018
|
||||||||||||||||||||||
|
Average
Balance
|
Average
Rate
|
Average
Balance
|
Average
Rate
|
Average
Balance
|
Average
Rate
|
|||||||||||||||||||
|
Non-interest-bearing demand
|
$
|
284,748
|
0.00
|
%
|
$
|
289,707
|
0.00
|
%
|
$
|
264,128
|
0.00
|
%
|
||||||||||||
|
Interest-bearing checking
|
180,969
|
0.06
|
180,256
|
0.06
|
170,124
|
0.06
|
||||||||||||||||||
|
Savings accounts
|
189,207
|
0.56
|
136,720
|
0.11
|
132,376
|
0.10
|
||||||||||||||||||
|
Money market accounts
|
194,061
|
0.12
|
252,202
|
0.12
|
275,092
|
0.12
|
||||||||||||||||||
|
Certificates of deposit
|
112,282
|
1.34
|
105,049
|
0.43
|
136,370
|
0.47
|
||||||||||||||||||
|
Total
|
$
|
961,267
|
0.30
|
%
|
$
|
963,934
|
0.10
|
%
|
$
|
978,090
|
0.12
|
%
|
||||||||||||
Deposit accounts totaled $990.4 million at March 31, 2020 compared to $925.1 million at March 31, 2019. The Company did not have any wholesale-brokered deposits at March 31, 2020 and 2019. The
Company continues to focus on core deposits and growth generated by customer relationships as opposed to obtaining deposits through the wholesale markets, although the Company continued to experience increased competition for customer deposits within
its market area during fiscal year 2020. Core branch deposits (comprised of all demand, savings, interest checking accounts and all time deposits excluding wholesale-brokered deposits, trust account deposits, Interest on Lawyer Trust Accounts
(“IOLTA”), public funds, and internet based deposits) increased $58.7 million since March 31, 2019. At March 31, 2020, the Company had $5.3 million, or 0.01% of total deposits, in Certificate of Deposit Account Registry Service (“CDARS”) and Insured
Cash Sweep (“ICS”) deposits, which were gathered from customers within the Company’s primary market-area. CDARS and ICS deposits allow customers access to FDIC insurance on deposits exceeding the $250,000 FDIC insurance limit.
At March 31, 2020 and 2019, the Company also had $12.2 million and $3.2 million, respectively, in deposits from public entities located in the States of Washington and Oregon, all of which were
fully covered by FDIC insurance or secured by pledged collateral.
19
The Company is enrolled in an internet deposit listing service. Under this listing service, the Company may post certificates of deposit rates on an internet site where institutional investors
have the ability to deposit funds with the Company. At March 31, 2020 and 2019, the Company did not have any deposits through this listing service as the Company chose not to utilize these internet based deposits. Although the Company did not
originate any internet based deposits during the year ended March 31, 2020, the Company may do so in the future consistent with its asset/liability objectives.
Deposit growth remains a key strategic focus for the Company and our ability to achieve deposit growth, particularly growth in core deposits, is subject to many risk factors including the effects
of competitive pricing pressures, changing customer deposit behavior, and increasing or decreasing interest rate environments. Adverse developments with respect to any of these risk factors could limit the Company’s ability to attract and retain
deposits and could have a material negative impact on the Company’s future financial condition, results of operations and cash flows.
The following table presents the maturity period, amount and weighted average rate of certificates of deposit equal to or greater than $100,000 at March 31, 2020 (dollars in thousands):
|
Maturity Period
|
Amount
|
Weighted
Average Rate
|
||||||
|
Three months or less
|
$
|
7,959
|
1.07
|
%
|
||||
|
Over three through six months
|
14,065
|
1.76
|
||||||
|
Over six through 12 months
|
24,365
|
1.71
|
||||||
|
Over 12 months
|
45,345
|
2.32
|
||||||
|
Total
|
$
|
91,734
|
1.96
|
%
|
||||
Borrowings. The Company relies upon advances from the FHLB and borrowings from the Federal Reserve Bank of San Francisco (“FRB”) to supplement its supply of
lendable funds and to meet deposit withdrawal requirements. Advances from the FHLB and borrowings from the FRB are typically secured by the Bank's commercial business loans, commercial real estate loans and first mortgage residential loans. At March
31, 2020, the Bank did not have any FHLB advances or FRB borrowings. At March 31, 2019, the Bank had FHLB advances totaling $56.6 million and no FRB borrowings.
The FHLB functions as a central reserve bank providing credit for member financial institutions. As a member, the Bank is required to own capital stock in the FHLB and is authorized to apply for
advances on the security of such stock and certain of its mortgage loans and other assets (primarily securities which are obligations of, or guaranteed by, the U.S.) provided certain standards related to credit-worthiness have been met. The FHLB
determines specific lines of credit for each member institution and the Bank has a line of credit with the FHLB equal to 45% of its total assets to the extent the Bank provides qualifying collateral and holds sufficient FHLB stock. At March 31, 2020,
the Bank had an available credit capacity of $532.5 million, subject to sufficient collateral and stock investment.
The Bank also has a borrowing arrangement with the FRB with an available credit facility of $67.3 million, subject to pledged collateral, as of March 31, 2020. The following table sets forth
certain information concerning the Company's borrowings for the periods indicated (dollars in thousands):
|
Year Ended March 31,
|
||||||||||||
|
2020
|
2019
|
2018
|
||||||||||
|
Maximum amounts of FHLB advances outstanding at any month end
|
$
|
77,241
|
$
|
62,638
|
$
|
14,050
|
||||||
|
Average FHLB advances outstanding
|
20,532
|
15,400
|
787
|
|||||||||
|
Weighted average rate on FHLB advances
|
2.54
|
%
|
2.58
|
%
|
1.60
|
%
|
||||||
|
Maximum amounts of FRB borrowings outstanding at any month end
|
$
|
-
|
$
|
-
|
$
|
-
|
||||||
|
Average FRB borrowings outstanding
|
33
|
3
|
1
|
|||||||||
|
Weighted average rate on FRB borrowings
|
1.92
|
%
|
3.00
|
%
|
1.50
|
%
|
||||||
The CARES Act authorized the SBA to temporarily guarantee loans under a new federal loan program called the Paycheck Protection Program (“PPP”) pursuant to which we have originated COVID-19
related loans. We may utilize the FRB's Paycheck Protection Program Liquidity Facility pursuant to which the Company will pledge its PPP loans as collateral at face value to obtain FRB non-recourse borrowings. For additional information, see “Item 7.
“Management’s Discussion and Analysis of Financial Condition and Results of Operations – Recent Developments Related to COVID-19.”
20
At March 31, 2020, the Company had three wholly-owned subsidiary grantor trusts totaling $26.7 million that were established for the purpose of issuing trust preferred securities and common
securities. The trust preferred securities accrue and pay distributions periodically at specified annual rates as provided in each trust agreement. The trusts used the net proceeds from each of the offerings to purchase a like amount of junior
subordinated debentures (the “Debentures”) of the Company. The Debentures are the sole assets of the trusts. The Company’s obligations under the Debentures and related documents, taken together, constitute a full and unconditional guarantee by the
Company of the obligations of the trusts. The trust preferred securities are mandatorily redeemable upon maturity of the Debentures or upon earlier redemption as provided in the indentures. The Company has the right to redeem the Debentures in whole
or in part on or after specific dates, at a redemption price specified in the indentures governing the Debentures plus any accrued but unpaid interest to the redemption date. The Company also has the right to defer the payment of interest on each of
the Debentures for a period not to exceed 20 consecutive quarters, provided that the deferral period does not extend beyond the stated maturity. During such deferral period, distributions on the corresponding trust preferred securities will also be
deferred and the Company may not pay cash dividends to the holders of shares of the Company’s common stock. The common securities issued by the grantor trusts are held by the Company, and the Company’s investment in the common securities of $836,000
at both March 31, 2020 and 2019 is included in prepaid expenses and other assets in the Consolidated Balance Sheets included in the Consolidated Financial Statements contained in Item 8 of this Form 10-K. For more information, see also Note 10 of the
Notes to the Consolidated Financial Statements contained in Item 8 of this Form 10-K.
Taxation
For details regarding the Company’s taxes, see Note 11 of the Notes to the Consolidated Financial Statements contained in Item 8 of this Form 10-K.
Personnel
As of March 31, 2020, the Company had 252 full‑time equivalent employees, none of whom are represented by a collective bargaining unit. The Company believes its relationship with its employees is
good.
Corporate Information
The Company’s principal executive offices are located at 900 Washington Street, Vancouver, Washington 98660. Its telephone number is (360) 693-6650. The Company maintains a website with the
address www.riverviewbank.com. The information contained on the Company’s website is not included as a part of, or incorporated by reference into, this Annual Report on Form 10-K. Other than an investor’s own internet access charges, the Company
makes available free of charge through its website the Annual Report on Form 10-K, quarterly reports on Form 10-Q and current reports on Form 8-K, and amendments to these reports, as soon as reasonably practicable after it has electronically filed
such material with, or furnished such material to, the Securities and Exchange Commission (“SEC”).
Subsidiary Activities
Under OCC regulations, the Bank is authorized to invest up to 3% of its assets in subsidiary corporations classified as service corporations, with amounts in excess of 2% only if primarily for
community purposes, and unlimited amounts in operating subsidiaries. At March 31, 2020, the Bank’s investments in its wholly-owned subsidiary of $1.3 million in Riverview Services, Inc. (“Riverview Services”) and majority-owned subsidiary of $6.4
million in the Trust Company were within these limitations.
Riverview Services acts as a trustee for deeds of trust on mortgage loans granted by the Bank and receives a reconveyance fee for each deed of trust. Riverview Services had net income of $23,000
for the fiscal year ended March 31, 2020 and total assets of $1.3 million at March 31, 2020. Riverview Services’ operations are included in the Consolidated Financial Statements of the Company contained in Item 8 of this Form 10-K.
The Trust Company is an asset management company providing trust, estate planning and investment management services. The Trust Company had net income of $991,000 for the fiscal year ended March
31, 2020 and total assets of $6.9 million at that date. The Trust Company earns fees on the management of assets held in fiduciary or agency capacity. At March 31, 2020, total assets under management were $1.2 billion. The Trust Company’s operations
are included in the Consolidated Financial Statements of the Company contained in Item 8 of this Form 10-K.
21
Information about our Executive Officers. The following table sets forth certain information regarding the executive officers of the Company and its subsidiaries:
|
Name
|
Age (1)
|
Position
|
|
Kevin J. Lycklama
|
42
|
President and Chief Executive Officer
|
|
David Lam
|
43
|
Executive Vice President and Chief Financial Officer
|
|
Daniel D. Cox
|
42
|
Executive Vice President and Chief Credit Officer
|
|
Kim J. Capeloto
|
58
|
Executive Vice President and Chief Banking Officer
|
|
Steven P. Plambeck
|
60
|
Executive Vice President and Chief Lending Officer
|
|
Christopher P. Cline
|
59
|
President and Chief Executive Officer of Riverview Trust Company
|
(1) At March 31, 2020
Kevin J. Lycklama is President and Chief Executive Officer of the Company, positions he has held since April 2, 2018. Prior to assuming the role of
President and Chief Executive Officer, Mr. Lycklama served as Executive Vice President and Chief Operating Officer of the Company, positions he had held since July 2017. Prior to July 2017, Mr. Lycklama served as Executive Vice President and Chief
Financial Officer of the Company since 2008 and Vice President and Controller of the Bank since 2006. Prior to joining Riverview, Mr. Lycklama spent five years with a local public accounting firm advancing to the level of audit manager. He holds a
Bachelor of Arts degree from Washington State University, is a graduate of the Pacific Coast Banking School and is a certified public accountant (CPA). Mr. Lycklama is a member of the Washington State University Vancouver Advisory Council.
David Lam is Executive Vice President and Chief Financial Officer of the Company, positions he has held since July 2017. Prior to July 2017, Mr. Lam served
as Senior Vice President and Controller of the Bank since 2008. He is responsible for accounting, SEC reporting and treasury functions for the Bank and the Company. Prior to joining Riverview, Mr. Lam spent ten years working in the public accounting
sector advancing to the level of audit manager. Mr. Lam holds a Bachelor of Arts degree in business administration with an emphasis in accounting from Oregon State University. Mr. Lam is a CPA, holds a chartered global management accountant
designation and is a member of both the American Institute of CPAs and Oregon Society of CPAs.
Daniel D. Cox is Executive Vice President and Chief Credit Officer and is responsible for credit administration related to the Bank’s commercial, mortgage
and consumer loan activities. Mr. Cox joined Riverview in August 2002 and spent five years as a commercial lender and progressed through the credit administration function, most recently serving as Senior Vice President of Credit Administration. He
holds a Bachelor of Arts degree from Washington State University and was an Honor Roll graduate of the Pacific Coast Banking School. Mr. Cox is an active mentor in the local schools and was the Past Treasurer and Endowment Chair for the Washougal
Schools Foundation and Past Board Member of Camas-Washougal Chamber of Commerce.
Kim J. Capeloto is Executive Vice President and Chief Banking Officer. Mr. Capeloto has been employed by the Bank since September 2010. Mr. Capeloto has
over 30 years of banking experience serving as regional manager for Union Bank of California and Wells Fargo Bank directing small business and personal banking activities. Prior to joining the Bank, Mr. Capeloto held the position of President and
Chief Executive Officer of the Greater Vancouver Chamber of Commerce. Mr. Capeloto is active in numerous professional and civic organizations.
Steven P. Plambeck is Executive Vice President and Chief Lending Officer, a position he has held since March 1, 2018.
Mr. Plambeck is responsible for all loan production including commercial, consumer, mortgage and builder/developer construction loans. Mr. Plambeck joined Riverview in January 2011 as Director of Medical Banking. For the past two years Mr. Plambeck
served as Senior Vice President and Team Leader for the Portland Commercial Team. Mr. Plambeck holds a Bachelor of Science degree in Accounting from the University of Wyoming and is also a graduate of the Pacific Coast Banking School. Mr. Plambeck is
a board member for the Providence St. Vincent Council of Trustees, Providence Heart and Vascular Institute and the Providence Brain and Spine Institute. Mr. Plambeck is also a member of the Medical and Dental Advisory Team.
Christopher P. Cline is President and Chief Executive Officer of the Trust Company, a wholly-owned subsidiary of the Bank. Mr. Cline joined the Trust
Company in 2016, after having spent eight years managing the trust department of Wells Fargo’s Private Bank in Oregon and Southwest Washington. Prior to that, Mr. Cline was an estate planning attorney for 17 years, most recently as a partner at
Holland & Knight. Mr. Cline manages all aspects of the trust business, is a Fellow of the American College of Trust and Estate Counsel and is a nationally recognized speaker and author, having written books on estate planning and trust
administration. Mr. Cline holds a Bachelor of Arts degree from San Francisco State University and a Juris Doctor degree from Hastings College of the Law in San Francisco.
22
REGULATION
The following is a brief description of certain laws and regulations which are applicable to the Company and the Bank. The description of these laws and regulations, as well as descriptions of
laws and regulations contained elsewhere herein, does not purport to be complete and is qualified in its entirety by reference to the applicable laws and regulations.
Legislation is introduced from time to time in the United States Congress (“Congress”) that may affect the Company’s and Bank’s operations. In addition, the regulations governing the Company and
the Bank may be amended from time to time by the OCC, the FDIC, the Federal Reserve Board or the SEC, as appropriate. Any such legislation or regulatory changes in the future could have an adverse effect on our
operations and financial condition. We cannot predict whether any such changes may occur.
General
As a federally chartered savings bank, the Bank is subject to extensive regulation, examination and supervision by the OCC, as its primary federal regulator, and the FDIC, as the insurer of its
deposits. As used herein, the terms “savings institution” and “savings association” refer to federally chartered savings banks. Additionally, the Company is subject to extensive regulation, examination and
supervision by the Federal Reserve as its primary federal regulator. The Bank is a member of the FHLB System and its deposits are insured up to applicable limits by the DIF, which is administered by the FDIC. The Bank must file reports with the OCC
concerning its activities and financial condition in addition to obtaining regulatory approvals prior to entering into certain transactions such as mergers with, or acquisitions of, other financial institutions. There are periodic examinations of the
Bank by the OCC and of the Company by the Federal Reserve to evaluate safety and soundness and compliance with various regulatory requirements. This regulatory structure establishes a comprehensive framework of activities in which the Bank may engage
and is intended primarily for the protection of the DIF and depositors. The regulatory structure also gives the regulatory authorities extensive discretion in connection with their supervisory and enforcement activities and examination policies,
including policies with respect to the classification of assets and the establishment of adequate loan loss reserves for regulatory purposes. Any change in such policies, whether by the OCC, the Federal Reserve, the FDIC or Congress, could have a
material adverse impact on the Company and the Bank and their operations.
In connection with the enactment of the Dodd-Frank Wall Street Reform and Consumer Protection Act of 2010 (the “Dodd-Frank Act”), the laws and regulations affecting depository institutions and
their holding companies have changed particularly affecting the bank regulatory structure and the lending, investment, trading and operating activities of depository institutions and their holding companies. Among other changes, the Dodd-Frank Act
established the Consumer Financial Protection Bureau (“CFPB”) as an independent bureau of the Federal Reserve Board. The CFPB assumed responsibility for the implementation of the federal financial consumer protection and fair lending laws and
regulations and has authority to impose new requirements. The Bank is subject to regulations issued by the CFPB, but as a smaller financial institution, the Bank is generally subject to supervision and enforcement by the OCC with respect to its
compliance with consumer financial protection laws and CFPB regulations.
On May 23, 2018, the President signed into law the Economic Growth, Regulatory Relief, and Consumer Protection Act passed by Congress (the “Act”). The Act contains a number of provisions extending
regulatory relief to banks and savings institutions and their holding companies. Some of these provisions may benefit the Company and the Bank, such as (1) a simplified capital ratio, called the Community Bank Leverage Ratio, computed as the ratio of
tangible equity capital to average consolidated total assets to be set by the federal banking regulators at not less than 8% and not more than 10%, which for most institutions with less than $10 billion in consolidated assets will replace the
leverage and risk-based capital ratios under current regulations; (2) an option for federal savings institutions to operate as national banks with respect to limits on lending, investments, and subsidiaries, without changing their charters to
national bank charters; and (3) a lower risk weight on certain loans classified as high volatility commercial real estate exposures. Effective January 1, 2020, the Community Bank Leverage Ratio is 9.0%.
23
Federal Regulation of Savings Institutions
Office of the Comptroller of the Currency. The OCC has extensive authority over the operations of federal savings institutions. As part of this authority,
the Bank is required to file periodic reports with the OCC and is subject to periodic examinations by the OCC. The OCC also has extensive enforcement authority over federal savings institutions, including the Bank. This enforcement authority
includes, among other things, the ability to assess civil money penalties, issue cease-and-desist or removal orders and initiate prompt corrective action orders. In general, these enforcement actions may be initiated for violations of laws and
regulations and unsafe or unsound practices. Other actions or inactions may provide the basis for enforcement action, including misleading or untimely reports filed with the OCC. Except under certain circumstances, public disclosure of final
enforcement actions by the OCC is required by law.
All federal savings institutions are required to pay assessments to the OCC to fund the agency's operations. The general assessments, paid on a semi-annual basis, are determined based on the
savings institution's total assets, including consolidated subsidiaries. The Bank's OCC assessment for the fiscal year ended March 31, 2020 was $244,000.
The Bank's general permissible lending limit for loans to one borrower is equal to the greater of $500,000 or 15% of unimpaired capital and surplus (except for loans fully secured by certain
readily marketable collateral, in which case this limit is increased to 25% of unimpaired capital and surplus). At March 31, 2020, the Bank's lending limit under this restriction was $22.2 million and, at that date, the Bank’s largest lending
relationship with one borrower was $16.9 million, which consisted of one commercial real estate loan of $14.4 million and one commercial construction loan with a contractual amount of $2.5 million. The commercial construction loan has an outstanding
balance of $1.6 million and undisbursed funds of $900,000 at March 31, 2020. Both loans are performing in accordance to their original terms.
The OCC’s oversight of the Bank includes reviewing its compliance with the customer privacy requirements imposed by the Gramm-Leach-Bliley Act of 1999 (“GLBA”) and the anti-money laundering
provisions of the USA Patriot Act. The GLBA privacy requirements place limitations on the sharing of consumer financial information with unaffiliated third parties. They also require each financial institution offering financial products or services
to retail customers to provide such customers with its privacy policy and with the opportunity to opt out of the sharing of their personal information with unaffiliated third parties. The USA Patriot Act imposes significant responsibilities on
financial institutions to prevent the use of the U.S. financial system to fund terrorist activities. Its anti-money laundering provisions require financial institutions operating in the U.S. to develop anti-money laundering compliance programs and
due diligence policies and controls to ensure the detection and reporting of money laundering. These compliance programs are intended to supplement requirements under the Bank Secrecy Act and the regulations of the Office of Foreign Assets Control.
The OCC, as well as the other federal banking agencies, has adopted guidelines establishing safety and soundness standards on such matters as loan underwriting and documentation, asset quality,
earnings standards, internal controls and audit systems, interest rate risk exposure and compensation and other employee benefits. Any institution that fails to comply with these standards must submit a compliance plan.
Capital Requirements. Federally insured savings institutions, such as the Bank, are required by the OCC to maintain minimum levels of regulatory capital,
including a common equity Tier 1 (“CET1”) capital to risk-based assets ratio, a Tier 1 capital to risk-based assets ratio, a total capital to risk-based assets ratio and a Tier 1 capital to total assets leverage ratio. The capital standards require
the maintenance of the following minimum capital ratios: (i) a CET1 capital ratio of 4.5%; (ii) a Tier 1 capital ratio of 6%; (iii) a total capital ratio of 8%; and (iv) a Tier 1 leverage ratio of 4%.
Certain changes in what constitutes regulatory capital, including the phasing-out of certain instruments as qualifying capital, are subject to transition periods, most of which have expired. The
Bank does not have any such instruments. Because of the Bank’s asset size, the Bank elected to take a one-time option to permanently opt-out of the inclusion of unrealized gains and losses on available for sale debt and equity securities in its
capital calculations.
The Bank also must maintain a capital conservation buffer consisting of additional CET1 capital greater than 2.5% of risk-weighted assets above the required minimum risk-based capital levels in
order to avoid limitations on paying dividends, engaging in share repurchases, and paying discretionary bonuses.
In order to be considered well-capitalized under the prompt corrective action regulations, the Bank must maintain a CET1 risk-based ratio of 6.5%, a Tier 1 risk-based ratio of 8%, a total
risk-based capital ratio of 10% and a leverage ratio of 5%, and the Bank must not be subject to any of certain mandates by the OCC requiring it as an individual institution to meet any specified capital level. Effective January 1, 2020, a bank or
savings institution that elects to use the Community Bank Leverage Ratio will generally be considered well-capitalized and to have met the risk-based and leverage capital requirements of the capital regulations if it has a leverage ratio greater than
9.0%. In order to qualify for the Community
24
Bank Leverage Ratio framework, in addition to maintaining a leverage ratio greater than 9%, the bank or institution also must have total consolidated assets of less than $10 billion, off-balance
sheet exposures of 25% or less of its total consolidated assets, and trading assets and trading liabilities of 5.0% or less of its total consolidated assets, all as of the end of the most recent quarter.
As of March 31, 2020, the most recent notification from the OCC categorized the Bank as “well capitalized” under the regulatory framework for prompt corrective action. For additional information,
see Note 13 of the Notes to Consolidated Financial Statements contained in Item 8 of this Form 10-K.
Prompt Corrective Action. An institution is considered adequately capitalized if it meets the minimum capital ratios described above. The OCC is required
to take certain supervisory actions against undercapitalized savings institutions, the severity of which depends upon the institution's degree of undercapitalization. Subject to a narrow exception, the OCC is required to appoint a receiver or
conservator for a savings institution that is critically undercapitalized. OCC regulations also require that a capital restoration plan be filed with the OCC within 45 days of the date a savings institution receives notice that it is
undercapitalized, significantly undercapitalized or critically undercapitalized. In addition, numerous mandatory supervisory actions become immediately applicable to an undercapitalized institution, including, but not limited to, increased monitoring
by regulators and restrictions on growth, capital distributions and expansion. Significantly undercapitalized and critically undercapitalized institutions are subject to more extensive mandatory regulatory actions. The OCC also can take a number of
discretionary supervisory actions, including the issuance of a capital directive and the replacement of senior executive officers and directors. An institution that is not well-capitalized is subject to certain restrictions on deposit rates and
brokered deposits.
Federal Home Loan Bank System. The Bank is a member of the FHLB, which is one of 11 regional Federal Home Loan Banks that administer the home financing
credit function of savings institutions, each of which serves as a reserve or central bank for its members within its assigned region. It is funded primarily from proceeds derived from the sale of consolidated obligations of the FHLB System. It makes
loans or advances to members in accordance with policies and procedures established by the Board of Directors of the FHLB, which are subject to the oversight of the Federal Housing Finance Agency. All advances from the FHLB are required to be fully
secured by sufficient collateral as determined by the FHLB. In addition, all long-term advances are required to provide funds for residential home financing. See Business – “Deposit Activities and Other Sources of Funds – Borrowings.” As a member,
the Bank is required to purchase and maintain stock in the FHLB. At March 31, 2020, the Bank held $1.4 million in FHLB stock, which was in compliance with this requirement. During the year ended March 31, 2020, the Bank purchased $40,000 of FHLB
membership stock at par and redeemed $2.3 million of FHLB activity stock at par with the payoff of borrowed funds.
The FHLB continues to contribute to low- and moderately-priced housing programs through direct loans or interest subsidies on advances targeted for community investment and low- and
moderate-income housing projects. These contributions have adversely affected the level of FHLB dividends paid and could continue to do so in the future. These contributions could also have an adverse effect on the value of FHLB stock in the future.
A reduction in value of the Bank's FHLB stock may result in a decrease in net income and possibly capital.
Federal Deposit Insurance Corporation. The DIF of the FDIC insures deposits in the Bank up to $250,000 per separately insured depositor ownership rights or
category. As insurer, the FDIC imposes deposit insurance premiums and is authorized to conduct examinations of and to require reporting by FDIC-insured institutions. The Bank’s deposit insurance premiums for the fiscal year ended March 31, 2020 were
$81,000. The Bank received full credit for the premiums for the first three quarters of fiscal year 2020 from the FDIC since the DIF reserve ratio exceeded 1.35% for these quarters. The Bank has $44,000 of remaining small bank assessment credits as
of March 31, 2020.
Under its regulations, the FDIC sets assessment rates for established small institutions (generally, those with total assets of less than $10 billion) based on an institution’s weighted average
CAMELS component ratings and certain financial ratios. Total base assessment rates currently range from 3 to 30 basis points subject to certain adjustments. Assessment rates are expected to decrease in the future as the reserve ratio increases in
specified increments. The FDIC may increase or decrease its rates up to two basis points without further rule-making. In an emergency, the FDIC may also impose a special assessment.
The Dodd-Frank Act increased the minimum FDIC deposit insurance reserve ratio from 1.15 percent to 1.35 percent. The FDIC surpassed the 1.35% as of September 30, 2018. The Dodd-Frank Act directed
the FDIC to offset the effects of higher assessments due to the increase in the reserve ratio on established small institutions by charging higher assessments to large institutions. To implement this mandate, large and highly complex institutions
paid a surcharge on their base since
25
established small institutions automatically receive credits from the FDIC for the portion of their assessments that contribute to the increase.
The FDIC may prohibit any insured institution from engaging in any activity determined by regulation or order to pose a serious risk to the DIF. The FDIC may terminate the deposit insurance of any
insured depository institution, including the Bank, if it determines after a hearing that the institution has engaged or is engaging in unsafe or unsound practices, is in an unsafe or unsound condition to continue operations, or has violated any
applicable law, regulation, order or any condition imposed by an agreement with the FDIC. It also may suspend deposit insurance temporarily during the hearing process for the permanent termination of insurance, if the institution has no tangible
capital. If insurance of accounts is terminated, the accounts at the institution at the time of the termination, less subsequent withdrawals, shall continue to be insured for a period of six months to two years, as determined by the FDIC. Management
is not aware of any existing circumstances which would result in termination of the deposit insurance of the Bank.
Qualified Thrift Lender Test. All federal savings institutions, including the Bank, are required to meet a qualified thrift lender ("QTL") test to avoid
certain restrictions on their operations. This test requires a savings institution to have at least 65% of its total assets, as defined by regulation, in qualified thrift investments on a monthly average for nine out of every 12 months on a rolling
basis. As an alternative, the savings institution may maintain 60% of its assets in those assets specified in Section 7701(a) (19) of the Internal Revenue Code ("Code"). Under either test, such assets primarily consist of residential housing related
loans and investments.
Any institution that fails to meet the QTL test is subject to certain operating restrictions and may be required to convert to a national bank charter, and a savings and loan holding company of
such an institution may become regulated as a bank holding company. As of March 31, 2020, the Bank maintained 89.83% of its portfolio assets in qualified thrift investments and therefore met the QTL test.
Limitations on Capital Distributions. OCC regulations impose various restrictions on savings institutions with respect to their ability to make
distributions of capital, which include dividends, stock redemptions or repurchases, cash-out mergers and other transactions charged to the capital account. Generally, savings institutions, such as the Bank, that before and after the proposed
distribution are well-capitalized, may make capital distributions during any calendar year equal to up to 100% of net income for the year-to-date plus retained net income for the two preceding years. However, an institution deemed to be in need of
more than normal supervision by the OCC may have its dividend authority restricted by the OCC. If the Bank, however, proposes to make a capital distribution when it does not meet its capital requirements (or will not following the proposed capital
distribution) or that will exceed these net income-based limitations, it must obtain the OCC's approval prior to making such distribution. In addition, the Bank must file a prior written notice of a dividend with the Federal Reserve. The Federal
Reserve or the OCC may object to a capital distribution based on safety and soundness concerns. Additional restrictions on Bank dividends may apply if the Bank fails the QTL test. In addition, as noted above, if the Bank does not have the required
capital conservation buffer, its ability to pay dividends to the Company will be limited, which may limit the ability of the Company to pay dividends to its stockholders.
Activities of Savings Associations and their Subsidiaries. When a savings institution establishes or acquires a subsidiary or elects to conduct any new
activity through a subsidiary that the savings institution controls, the savings institution must file a notice or application with the OCC and, in certain circumstances with the FDIC, and receive regulatory approval or non-objection. Savings
institutions also must conduct the activities of subsidiaries in accordance with existing regulations and orders. With respect to subsidiaries generally, the OCC may determine that investment by a savings institution in, or the activities of, a
subsidiary must be restricted or eliminated based on safety and soundness or legal reasons.
Transactions with Affiliates. The Bank’s authority to engage in transactions with affiliates is limited by Sections 23A and 23B of the Federal Reserve Act
as implemented by the Federal Reserve’s Regulation W. The term affiliates for these purposes generally mean any company that controls or is under common control with an institution except subsidiaries of the institution. The Company and its
non-savings institution subsidiaries are affiliates of the Bank. In general, transactions with affiliates must be on terms that are as favorable to the institution as comparable transactions with non-affiliates. In addition, certain types of
transactions are restricted to an aggregate percentage of the institution’s capital. In addition, savings institutions are prohibited from lending to any affiliate that is engaged in activities that are not permissible for bank holding companies and
no savings institution may purchase the securities of any affiliate other than a subsidiary. FDIC-insured institutions are subject, with certain exceptions, to certain restrictions on extensions of credit to their parent holding companies or other
affiliates, on investments in the stock or other securities of affiliates and on the taking of such stock or securities as collateral from any borrower. Collateral in specified amounts must be provided by affiliates in order to receive loans from an
institution. In addition, these institutions are prohibited from engaging in certain tying arrangements in connection with any extension of credit or the providing of any property or service.
26
The Sarbanes-Oxley Act of 2002 (“Sarbanes-Oxley Act”) generally prohibits a company that makes filings with the SEC from making loans to its executive officers and directors. That act, however,
contains a specific exception for loans by a depository institution to its executive officers and directors, if the lending is in compliance with federal banking laws. Under such laws, the Bank’s authority to extend credit to executive officers,
directors and 10% stockholders (“insiders”), as well as entities which such persons control, is limited. The law restricts both the individual and aggregate amount of loans the Bank may make to insiders based, in part, on the Bank’s capital position
and requires certain Board approval procedures to be followed. Such loans must be made on terms substantially the same as those offered to unaffiliated individuals and not involve more than the normal risk of repayment. There is an exception for
loans made pursuant to a benefit or compensation program that is widely available to all employees of the institution and does not give preference to insiders over other employees. There are additional restrictions applicable to loans to executive
officers.
Community Reinvestment Act and Consumer Protection Laws. Under the Community Reinvestment Act of 1977 (“CRA”), every FDIC-insured institution has a
continuing and affirmative obligation consistent with safe and sound banking practices to help meet the credit needs of its entire community, including low and moderate income neighborhoods. The CRA does not establish specific lending requirements or
programs for financial institutions nor does it limit an institution's discretion to develop the types of products and services that it believes are best suited to its particular community, consistent with the CRA. The CRA requires the OCC, in
connection with the examination of the Bank, to assess the institution’s record of meeting the credit needs of its community and to take such record into account in its evaluation of certain applications, such as a merger or the establishment of a
branch, by the Bank. The OCC may use an unsatisfactory rating as the basis for the denial of an application. Similarly, the Federal Reserve is required to take into account the performance of an insured institution under the CRA when considering
whether to approve an acquisition by the institution’s holding company. Due to the heightened attention being given to the CRA in the past few years, the Bank may be required to devote additional funds for investment and lending in its local
community.
In connection with its deposit-taking, lending and other activities, the Bank is subject to a number of federal laws designed to protect consumers and promote lending to various sectors of the
economy and population. Some state laws can apply to these activities as well. The CFPB issues regulations and standards under these federal laws, which include, among others, the Equal Credit Opportunity Act, the Truth-in-Lending Act, the Home
Mortgage Disclosure Act and the Real Estate Settlement Procedures Act. Through its rulemaking authority, the CFPB has promulgated a number of regulations under these laws that affect our consumer businesses. Among these are regulations setting
“ability to repay” and “qualified mortgage” standards for residential mortgage loans and establishing new mortgage loan servicing and loan originator compensation standards. The Bank devotes substantial compliance, legal and operational business
resources to ensure compliance with applicable consumer protection standards. In addition, the OCC has enacted customer privacy regulations that limit the ability of the Bank to disclose nonpublic consumer information to non-affiliated third parties.
The regulations require disclosure of privacy policies and allow consumers to prevent certain personal information from being shared with non-affiliated parties.
Enforcement. The OCC has primary enforcement responsibility over federally-chartered savings institutions and has the authority to bring action against all
"institution-affiliated parties," including shareholders, and any attorneys, appraisers and accountants who knowingly or recklessly participate in a wrongful action likely to have an adverse effect on an insured institution. Formal enforcement action
may range from the issuance of a capital directive or cease and desist order to removal of officers or directors, receivership, conservatorship or termination of deposit insurance. Civil penalties cover a wide range of violations. The FDIC has the
authority to recommend to the OCC that enforcement action be taken with respect to a particular savings institution. If action is not taken by the OCC, the FDIC has authority to take such action under certain circumstances. Federal law also
establishes criminal penalties for certain violations.
Standards for Safety and Soundness. As required by statute, the federal banking agencies have adopted interagency guidelines prescribing standards for
safety and soundness. The guidelines set forth the safety and soundness standards that the federal banking agencies use to identify and address problems at insured depository institutions before capital becomes impaired. If the OCC determines that a
savings institution fails to meet any standard prescribed by the guidelines, the OCC may require the institution to submit an acceptable plan to achieve compliance with the standard.
Federal Reserve System. The Federal Reserve requires that all depository institutions maintain reserves on transaction accounts or non-personal time
deposits. These reserves may be in the form of cash or non-interest-bearing deposits with the regional Federal Reserve Bank. Interest-bearing checking accounts and other types of accounts that permit payments or transfers to third parties fall within
the definition of transaction accounts and are subject to Regulation D reserve requirements, as are any non-personal time deposits at a bank. At March 31, 2020, the Bank was in compliance with these
27
reserve requirements. The balances maintained to meet the reserve requirements imposed by the Federal Reserve Board may be used to satisfy any liquidity requirements that may be imposed by the
OCC.
Commercial Real Estate Lending Concentrations. The federal banking agencies have issued guidance on sound risk management practices for concentrations in
commercial real estate lending. The particular focus is on exposure to commercial real estate loans that are dependent on the cash flow from the real estate held as collateral and that are likely to be sensitive to conditions in the commercial real
estate market (as opposed to real estate collateral held as a secondary source of repayment or as an abundance of caution). The purpose of the guidance is not to limit a bank’s commercial real estate lending but to guide banks in developing risk
management practices and capital levels commensurate with the level and nature of real estate concentrations. The guidance directs the OCC and other federal bank regulatory agencies to focus their supervisory resources on institutions that may have
significant commercial real estate loan concentration risk. A federal savings bank that has experienced rapid growth in commercial real estate lending, has notable exposure to a specific type of commercial real estate loan, or is approaching or
exceeding the following supervisory criteria may be identified for further supervisory analysis with respect to real estate concentration risk:
|
•
|
Total reported loans for construction, land development and other land represent 100% or more of the bank’s capital; or
|
|
•
|
Total commercial real estate loans (as defined in the guidance) represent 300% or more of the bank’s total capital or the outstanding balance of the bank’s commercial real estate loan
portfolio has increased 50% or more during the prior 36 months.
|
The guidance provides that the strength of an institution’s lending and risk management practices with respect to such concentrations will be taken into account in supervisory guidance on
evaluation of capital adequacy.
Environmental Issues Associated with Real Estate Lending. The Comprehensive Environmental Response, Compensation and Liability Act (“CERCLA”), is a federal
statute that generally imposes strict liability on all prior and present "owners and operators" of sites containing hazardous waste. However, Congress acted to protect secured creditors by providing that the term “owner and operator” excludes a
person whose ownership is limited to protecting its security interest in the site. Since the enactment of the CERCLA, this “secured creditor exemption” has been the subject of judicial interpretations which have left open the possibility that lenders
could be liable for cleanup costs on contaminated property that they hold as collateral for a loan. To the extent that legal uncertainty exists in this area, all creditors, including the Bank, that have made loans secured by properties with potential
hazardous waste contamination (such as petroleum contamination) could be subject to liability for cleanup costs, which could substantially exceed the value of the collateral property.
Bank Secrecy Act/Anti-Money Laundering Laws. The Bank is subject to the Bank Secrecy Act and other anti-money laundering laws and regulations, including the
USA Patriot Act of 2001. These laws and regulations require the Bank to implement policies, procedures, and controls to detect, prevent, and report money laundering and terrorist financing and to verify the identity of their customers. Violations of
these requirements can result in substantial civil and criminal sanctions. In addition, provisions of the USA Patriot Act require the federal financial institution regulatory agencies to consider the effectiveness of a financial institution's
anti-money laundering activities when reviewing mergers and acquisitions.
Other Consumer Protection Laws and Regulations. The Dodd-Frank Act established the CFPB and empowered it to exercise broad regulatory, supervisory and
enforcement authority with respect to both new and existing consumer financial protection laws. The Bank is subject to consumer protection regulations issued by the CFPB, but as a financial institution with assets of less than $10 billion, the Bank
is generally subject to supervision and enforcement by the OCC with respect to compliance with consumer financial protection laws and CFPB regulations.
The Bank is subject to a broad array of federal and state consumer protection laws and regulations that govern almost every aspect of its business relationships with consumers. While the following
list is not exhaustive, these include the Truth-in-Lending Act, the Truth in Savings Act, the Electronic Fund Transfers Act, the Expedited Funds Availability Act, the Equal Credit Opportunity Act, the Fair Housing Act, the Real Estate Settlement
Procedures Act, the Home Mortgage Disclosure Act, the Fair Credit Reporting Act, the Right to Financial Privacy Act, the Home Ownership and Equity Protection Act, the Fair Credit Billing Act, the Homeowners Protection Act, the Check Clearing for the
21st Century Act, laws governing flood insurance, laws governing consumer protections in connection with the sale of insurance, federal and state laws prohibiting unfair and deceptive business practices, and various regulations that implement some or
all of the foregoing. These laws and regulations mandate certain disclosure requirements and regulate the manner in which financial institutions must deal with customers when taking deposits, making loans, collecting loans, and providing other
services. Failure to comply with these laws and regulations can subject the Bank to various penalties, including but not limited to, enforcement actions, injunctions, fines, civil liability, criminal penalties, punitive damages, and the loss of
certain contractual rights.
28
Savings and Loan Holding Company Regulation
General. The Company is a unitary savings and loan holding company subject to regulatory oversight of the Federal Reserve. Accordingly, the Company is
required to register and file reports with the Federal Reserve and is subject to regulation and examination by the Federal Reserve. In addition, the Federal Reserve has enforcement authority over the Company and its non-savings institution
subsidiaries, which also permits the Federal Reserve to restrict or prohibit activities that are determined to present a serious risk to the subsidiary savings institution. In accordance with the Dodd-Frank Act, the Federal Reserve must require any
company that controls an FDIC-insured depository institution to serve as a source of financial strength for the institution. These and other Federal Reserve policies, as well as the capital conservatism buffer requirement, may restrict the Company’s
ability to pay dividends.
Capital Requirements. For a savings and loan holding company that qualifies as a small bank
holding company under the Federal Reserve’s Small Bank Holding Company Policy Statement, such as the Company, the capital regulations apply to its savings institution subsidiaries, but not the Company. The Federal Reserve expects the holding
company’s savings institution subsidiaries to be well capitalized under the prompt corrective action regulations. At March 31, 2020, the Company exceeded all regulatory capital requirements. See “Federal Regulation of Savings Institutions- Capital
Requirements” above.
Activities Restrictions. The GLBA provides that no company may acquire control of a savings association after May 4, 1999 unless it engages only in the
financial activities permitted for financial holding companies under the law or for multiple savings and loan holding companies. Further, the GLBA specifies that, subject to a grandfather provision, existing savings and loan holding companies may
only engage in such activities. The Company qualifies for grandfathering and is therefore not restricted in terms of its activities. Upon any non-supervisory acquisition by the Company of another savings association as a separate subsidiary, the
Company would become a multiple savings and loan holding company and would be limited to activities permitted by Federal Reserve regulation.
Mergers and Acquisitions. The Company must obtain approval from the Federal Reserve before acquiring more than 5% of the voting stock of another savings
institution or savings and loan holding company or acquiring such an institution or holding company by merger, consolidation or purchase of its assets. In evaluating an application for the Company to acquire control of a savings institution, the
Federal Reserve would consider the financial and managerial resources and future prospects of the Company and the target institution, the effect of the acquisition on the risk to the DIF, the convenience and the needs of the community, including
performance under the CRA and competitive factors.
The Federal Reserve may not approve any acquisition that would result in a multiple savings and loan holding company controlling savings institutions in more than one state,
subject to two exceptions; (i) supervisory acquisitions and (ii) the acquisition of a savings institution in another state if the laws of the state of the target savings institution specifically permit such acquisitions. The states vary in the extent
to which they permit interstate savings and loan holding company acquisitions.
Acquisition of the Company. Any company, except a bank holding company, that acquires control of
a savings association or savings and loan holding company becomes a “savings and loan holding company” subject to registration, examination and regulation by the Federal Reserve and must obtain the prior approval of the Federal Reserve under the
Savings and Loan Holding Company Act before obtaining control of a savings association or savings and loan holding company. A bank holding company must obtain the prior approval of the Federal Reserve under the Bank Holding Company Act before
obtaining control of, or more than 5% of a class of voting stock of, a savings association or savings and loan holding company and remains subject to regulation under the Bank Holding Company Act. The term “company” includes corporations,
partnerships, associations, and certain trusts and other entities. “Control” of a savings association or savings and loan holding company is deemed to exist if a company has voting control, directly or indirectly, of more than 25% of any class of the
savings association’s voting stock or controls in any manner the election of a majority of the directors of the savings association or savings and loan holding company, and may be presumed under other circumstances, including, but not limited to,
holding in certain cases 10% or more of a class of voting securities. In addition, a savings and loan holding company must obtain Federal Reserve approval prior to acquiring voting control of more than 5% of any class of voting stock of another
savings association or another savings association holding company. A similar provision limiting the acquisition by a bank holding company of 5% or more of a class of voting stock of any company is included in the Bank Holding Company Act.
29
Accordingly, the prior approval of the Federal Reserve would be required:
|
•
|
before any savings and loan holding company or bank holding company could acquire 5% or more of the common stock of the Company; and
|
|
•
|
before any other company could acquire 25% or more of the common stock of the Company and may be required for an acquisition of as little as 10% of such stock.
|
In addition, persons that are not companies are subject to the same or similar definitions of control with respect to savings and loan holding companies and savings associations and requirements
for prior regulatory approval by the Federal Reserve in the case of control of a savings and loan holding company or by the OCC in the case of control of a savings association not obtained through control of a holding company of such savings
association.
Dividends and Stock Repurchases. The Federal Reserve’s policy statement on the payment of cash dividends applicable to savings and loan holding companies
expresses its view that a savings and loan holding company must maintain an adequate capital position and generally should not pay cash dividends unless the company’s net income for the past year is sufficient to fully fund the cash dividends and
that the prospective rate of earnings appears consistent with the company’s capital needs, asset quality, and overall financial condition. The Federal Reserve policy statement also indicates that it would be inappropriate for a company experiencing
serious financial problems to borrow funds to pay dividends. In addition, a savings and loan holding company is required to give the Federal Reserve prior written notice of any purchase or redemption of its outstanding equity securities if the gross
consideration for the purchase or redemption, when combined with the net consideration paid for all such purchases or redemptions during the preceding twelve months, is equal to 10% or more of its consolidated net worth. The Federal Reserve may
disapprove such a purchase or redemption if it determines that the proposal would constitute an unsafe or unsound practice or would violate any law, regulation, Federal Reserve order or any condition imposed by, or written agreement with, the Federal
Reserve. The capital conservation buffer requirement may also limit or preclude dividends payable by the Company.
Sarbanes-Oxley Act of 2002. The Sarbanes-Oxley Act was enacted in 2002 in response to public concerns regarding corporate accountability in connection with
accounting scandals. The stated goals of the Sarbanes-Oxley Act are to increase corporate responsibility, to provide for enhanced penalties for accounting and auditing improprieties at publicly traded companies and to protect investors by improving
the accuracy and reliability of corporate disclosures pursuant to the securities laws. The Sarbanes-Oxley Act generally applies to all companies, both U.S. and non-U.S., that file or are required to file periodic reports with the SEC under the
Securities Exchange Act of 1934, including the Company.
The Sarbanes-Oxley Act includes very specific additional disclosure requirements and new corporate governance rules, and requires the SEC and securities exchanges to adopt extensive additional
disclosures, corporate governance and related rules. The Sarbanes-Oxley Act represents significant federal involvement in matters traditionally left to state regulatory systems, such as the regulation of the accounting profession, and to state
corporate law, such as the relationship between a board of directors and management and between a board of directors and its committees.
The Dodd-Frank Wall Street Reform and Consumer Protection Act of 2010. The Dodd-Frank-Act imposed new restrictions and an expanded framework of regulatory
oversight for financial institutions, including capital regulations of depository institutions discussed above under “- Regulation and Supervision of the Bank - Capital Requirements.” In addition, among other requirements, the Dodd-Frank Act requires
public companies, such as the Company, to (i) provide their shareholders with a non-binding vote (a) at least once every three years on the compensation paid to executive officers and (b) at least once every six years on whether they should have a
“say on pay” vote every one, two or three years; (ii) have a separate, non-binding shareholder vote regarding golden parachutes for named executive officers when a shareholder vote takes place on mergers, acquisitions, dispositions or other
transactions that would trigger the parachute payments; (iii) provide disclosure in annual proxy materials concerning the relationship between the executive compensation paid and the financial performance of the issuer; and (iv) amend Item 402 of
Regulation S-K to require companies to disclose the ratio of the Chief Executive Officer's annual total compensation to the median annual total compensation of all other employees.
30
Item 1A. Risk Factors
An investment in our common stock is subject to risks inherent in our business. Before making an investment decision, you should carefully consider the risks and
uncertainties described below together with all of the other information included in this report. In addition to the risks and uncertainties described below, other risks and uncertainties not currently known to us or that we currently deem to be immaterial also may materially and adversely affect our business, financial condition and results of operations. The value or market price of our common stock could decline due to any of these identified or other risks, and you could lose all or part of your investment. The risks below also include forward-looking statements. This
report is qualified in its entirety by these risk factors.
The COVID-19 pandemic has adversely affected our ability to conduct business and is expected to adversely impact our future financial results and those of our customers. The
ultimate impact will depend on future developments, which are highly uncertain and cannot be predicted, including the scope and duration of the pandemic and actions taken by governmental authorities in response to the COVID-19 pandemic.
The COVID-19 pandemic has significantly adversely affected our operations and the way we provide banking and financial services to businesses and individuals, most of whom are currently under
varying levels of government issued stay-at-home orders. As an essential business, we continue to provide banking and financial services to our customers with drive-thru access available at the majority of our branch locations and in-person services
available by appointment. In addition, we continue to provide access to banking and financial services through online banking, ATMs and by telephone. If the COVID-19 pandemic worsens, it could limit or disrupt our ability to provide banking and
financial services to our customers.
In response to the stay-at-home orders, approximately forty percent of our employees are currently working remotely to enable us to continue to provide banking services to our customers.
Heightened cybersecurity, information security and operational risks may result from these remote work-from-home arrangements. We also could be adversely affected if key personnel or a significant number of employees were to become unavailable due to
the effects and restrictions of the COVID-19 pandemic. We also rely upon our third-party vendors to conduct business and to process, record and monitor transactions. If any of these vendors are unable to continue to provide us with these services, it
could negatively impact our ability to serve our customers. We have business continuity plans and other safeguards in place; however, there is no assurance that such plans and safeguards will be effective.
There is uncertainty surrounding the future economic conditions that will emerge in the months and years following the start of the COVID-19 pandemic. As a result, management is confronted with a
significant and unfamiliar degree of uncertainty in estimating the impact of the COVID-19 pandemic on credit quality, revenues and asset values. To date, the COVID-19 pandemic has resulted in declines in loan demand and loan originations (other than
through government sponsored programs such as the PPP), deposit availability, and market interest rates and has negatively impacted many of our business and consumer borrowers’ ability to make their loan payments. Because the length of the COVID-19
pandemic and the efficacy of the extraordinary measures being put in place to address its economic consequences (including recent reductions in the targeted federal funds rate) are unknown, until the COVID-19 pandemic subsides, we expect our net
interest income and net interest margin will be adversely affected. Many of our borrowers have become unemployed or may face unemployment, and certain businesses are at risk of insolvency as their revenues decline precipitously, especially in
businesses related to travel, hospitality, leisure and physical personal services. Businesses may ultimately not reopen as there is a significant level of uncertainty regarding the level of economic activity that will return to our markets over time,
the impact of governmental assistance, the speed of economic recovery, the resurgence of COVID-19 in subsequent seasons and changes to demographic and social norms that will take place.
The impact of the COVID-19 pandemic is expected to continue to adversely affect us during 2020 and possibly longer as the ability of many of our customers to make loan payments has been
significantly affected. Although the Company makes estimates of loan losses related to the COVID-19 pandemic as part of its evaluation of the allowance for loan losses, such estimates involve significant judgment and are made in the context of
significant uncertainty as to the impact the COVID-19 pandemic will have on the credit quality of our loan portfolio. It is likely that loan delinquencies, adversely classified loans and loan charge-offs will increase in the future as a result of the
COVID-19 pandemic. Consistent with guidance provided by banking regulators through an interagency statement and guidance under the CARES Act, we have modified loans by providing various loan payment deferral options to our borrowers affected by the
COVID-19 pandemic. Notwithstanding these modifications, these borrowers may not be able to resume making full payments on their loans once the COVID-19 pandemic subsides. Any increases in the allowance for loan losses will result in a decrease in net
income and, most likely, capital, and may have a material negative effect on our financial condition and results of operations.
31
The PPP loans made by the Bank are guaranteed by the SBA and, if the loan funds are used by the borrower for specific purposes as provided under the PPP, may be fully or partially forgiven by the
SBA at which time, the Bank will receive funds related to the PPP loan forgiveness directly from the SBA. However, in the event of a loss resulting from a default on a PPP loan and a determination by the SBA that there was a deficiency in the manner
in which the PPP loan was originated, funded or serviced by the Bank, the SBA may deny its liability under the guaranty, reduce the amount of the guaranty or, if it has already made payment under the guaranty, seek recovery of any loss related to the
deficiency from the Bank. In addition, since the commencement of the PPP, several banks have been subject to litigation regarding their processing of PPP loan applications. The Bank may be exposed to the risk of similar litigation, from both
customers and non-customers that approached the Bank seeking PPP loans. PPP lenders, including the Bank, may also be subject to the risk of litigation in connection with other aspects of the PPP, including but not limited to borrowers seeking
forgiveness of their loans. If any such litigation is filed against the Bank, it may result in significant financial or reputational harm to us.
Even after the COVID-19 pandemic subsides, the U.S. economy will likely require some time to recover from its effects, the length of which is unknown and during which time the U.S. may experience
a recession. As a result, we anticipate our business may be materially and adversely affected during this recovery. To the extent the effects of the COVID-19 pandemic adversely impact our business, financial condition, liquidity or results of
operations, it may also have the effect of heightening many of the other risks described below and in any subsequently filed Quarterly Reports on Form 10-Q.
Our business may be adversely affected by downturns in the national and the regional economies on which we depend.
Substantially all of our loans are to businesses and individuals in the states of Washington and Oregon. A decline in the economies of the seven counties in which we operate, including the
Portland, Oregon metropolitan area, which we consider to be our primary market area, could have a material adverse effect on our business, financial condition, results of operations and prospects. Weakness in the global economy has adversely affected
many businesses operating in our markets that are dependent upon international trade and it is not known how changes in tariffs being imposed on international trade may also affect these businesses. Changes in agreements or relationships between the
U.S. and other countries may also affect these businesses. The COVID-19 pandemic has adversely impacted most of the Company's customers directly or indirectly. Their businesses have been adversely affected by quarantines and travel restrictions due
to the COVID-19 pandemic. See “-The COVID-19 pandemic has adversely impacted our ability to conduct business and is expected to adversely impact our financial results and those of our customers. The ultimate impact will depend on future developments,
which are highly uncertain and cannot be predicted, including the scope and duration of the pandemic and actions taken by governmental authorities in response to the COVID-19 pandemic.”
Deterioration in economic conditions in the market areas we serve as a result of COVID-19 or other factors could result in the following consequences, any of which could have a
materially adverse impact on our business, financial condition and results of operations:
|
•
|
loan delinquencies, problem assets and foreclosures may increase;
|
|
•
|
we may increase our allowance for loan losses;
|
|
•
|
the slowing of sales of foreclosed assets;
|
|
•
|
demand for our products and services may decline possibly resulting in a decrease in our total loans or assets;
|
|
•
|
collateral for loans made may decline further in value, exposing us to increased risk loans, reducing customers’ borrowing power, and reducing the value of assets and collateral
associated with existing loans;
|
|
•
|
the net worth and liquidity of loan guarantors may decline, impairing their ability to honor commitments to us; and
|
|
•
|
the amount of our low-cost or non-interest bearing deposits may decrease.
|
A decline in local economic conditions may have a greater effect on our earnings and capital than on the earnings and capital of larger financial institutions whose real estate
loan portfolios are geographically diverse. Many of the loans in our portfolio are secured by real estate. Deterioration in the real estate markets where collateral for a mortgage loan is located could negatively affect the borrower’s ability to
repay the loan and the value of the collateral securing the loan. Real estate values are affected by various other factors, including changes in general or regional economic conditions, governmental rules or policies and natural disasters such as
earthquakes and tornadoes. If we are required to liquidate a significant amount of collateral during a period of reduced real estate values, our financial condition and profitability could be adversely affected.
32
Adverse changes in the regional and general economy could reduce our growth rate, impair our ability to collect loans and generally have a negative effect on our financial
condition and results of operations.
Our real estate construction and land acquisition and development loans expose us to risk.
We make construction and land acquisition and development loans primarily to builders to finance the construction of single and multifamily homes, subdivisions, as well as commercial properties.
We originate these loans whether or not the collateral property underlying the loan is under contract for sale. At March 31, 2020, construction loans totaled $64.8 million, or 7.1% of our total loan portfolio, of which $12.2 million were for
residential real estate projects. Undisbursed funds for construction projects totaled $24.0 million at March 31, 2020. Land acquisition and development loans, which are loans made with land as security, totaled $14.0 million, or 1.5% of our total
loan portfolio at March 31, 2020.
In general, construction and land lending involves additional risks because of the inherent difficulty in estimating a property's value both before and at completion of the project, as well as the
estimated cost of the project and the time needed to sell the property at completion. Construction costs may exceed original estimates as a result of increased materials, labor or other costs. Because of the uncertainties inherent in estimating
construction costs, as well as the market value of the completed project and the effects of governmental regulation on real property, it is relatively difficult to evaluate accurately the total funds required to complete a project and the related
loan-to-value ratio. Changes in the demand, such as for new housing and higher than anticipated building costs may cause actual results to vary significantly from those estimated. For these reasons, this type of lending also typically involves higher
loan principal amounts and is often concentrated with a small number of builders. A downturn in housing, or the real estate market, could increase loan delinquencies, defaults and foreclosures, and significantly impair the value of our collateral and
our ability to sell the collateral upon foreclosure. Some of our builders have more than one loan outstanding with us and also have residential mortgage loans for rental properties with us. Consequently, an adverse development with respect to one
loan or one credit relationship can expose us to a significantly greater risk of loss.
In addition, during the term of most of our construction loans, no payment from the borrower is required since the accumulated interest is added to the principal of the loan through an interest
reserve. As a result, construction loans often involve the disbursement of substantial funds with repayment dependent on the success of the ultimate project and the ability of the borrower to sell or lease the property or refinance the indebtedness,
rather than the ability of the borrower or guarantor to repay principal and interest. If the appraisal of the value of the completed project proves to be overstated, we may have inadequate security for the
repayment of the loan upon completion of construction of the project and may incur a loss. Because construction loans require active monitoring of the building process, including cost comparisons and on-site inspections, these loans are more
difficult and costly to monitor.
Increases in market rates of interest may have a more pronounced effect on construction loans by rapidly increasing the end-purchasers' borrowing costs, thereby reducing the overall demand for the
project. Properties under construction are often difficult to sell and typically must be completed in order to be successfully sold which also complicates the process of working out problem construction loans. This may require us to advance
additional funds and/or contract with another builder to complete construction. Further, in the case of speculative construction loans, there is the added risk associated with identifying an end-purchaser for the finished project, and thus pose a
greater potential risk than construction loans to individuals on their personal residences. Loans on land under development or raw land held for future construction, including lot loans made to individuals for the future construction of a residence
also pose additional risk because of the lack of income being produced by the property and the potential illiquid nature of the collateral. These risks can also be significantly impacted by supply and demand conditions.
At March 31, 2020, real estate construction and land acquisition and development loans totaled $78.9 million comprised mainly of $12.0 million of speculative construction loans, $14.0 million of
land acquisition and development loans, $52.6 million of commercial/multi-family construction loans and $207,000 of custom/presold construction loans.
Our emphasis on commercial real estate lending may expose us to increased lending risks.
Our current business strategy is focused on the expansion of commercial real estate lending. This type of lending activity, while potentially more profitable than single-family residential
lending, is generally more sensitive to regional and local economic conditions, making loss levels more difficult to predict. Collateral evaluation and financial statement analysis in these types of loans requires a more detailed analysis at the time
of loan underwriting and on an ongoing basis. Many of our commercial borrowers have more than one loan outstanding with us. Consequently, an adverse development with respect to one loan or one credit relationship can expose us to a significantly
greater risk of loss.
33
At March 31, 2020, we had $566.2 million of commercial and multi-family real estate mortgage loans, representing 61.12% of our total loan portfolio. These loans typically involve higher principal
amounts than other types of loans and some of our commercial borrowers have more than one loan outstanding with us. Consequently, an adverse development with respect to one loan or one credit relationship can expose us to a significantly greater risk
of loss compared to an adverse development with respect to a one-to-four family residential loan. Repayment on these loans is dependent upon income generated, or expected to be generated, by the property securing the loan in amounts sufficient to
cover operating expenses and debt service, which may be adversely affected by changes in the economy or local market conditions. For example, if the cash flow from the borrower’s project is reduced as a result of leases not being obtained or renewed,
the borrower’s ability to repay the loan may be impaired. Commercial and multi-family mortgage loans also expose a lender to greater credit risk than loans secured by one-to-four family residential real estate because the collateral securing these
loans typically cannot be sold as easily as residential real estate. In addition, many of our commercial and multi-family real estate loans are not fully amortizing and contain large balloon payments upon maturity. Such balloon payments may require
the borrower to either sell or refinance the underlying property in order to make the payment, which may increase the risk of default or non-payment.
A secondary market for most types of commercial real estate and multi-family loans is not readily liquid, so we have less opportunity to mitigate credit risk by selling part or all of our interest
in these loans. As a result of these characteristics, if we foreclose on a commercial or multi-family real estate loan, our holding period for the collateral typically is longer than for one-to-four family residential mortgage loans because there are
fewer potential purchasers of the collateral. Accordingly, charge-offs on commercial and multi-family real estate loans may be larger on a per loan basis than those incurred with our residential or consumer loan portfolios.
The level of our commercial real estate loan portfolio may subject us to additional regulatory scrutiny.
The FDIC, the Federal Reserve and the Office of the Comptroller of the Currency have promulgated joint guidance on sound risk management practices for financial institutions
with concentrations in commercial real estate lending. Under this guidance, a financial institution that, like us, is actively involved in commercial real estate lending should perform a risk assessment to identify concentrations. A financial
institution may have a concentration in commercial real estate lending if, among other factors (i) total reported loans for construction, land development, and other land represent 100% or more of total capital, or (ii) total reported loans secured
by multi-family and non-farm residential properties, loans for construction, land development and other land, and loans otherwise sensitive to the general commercial real estate market, including loans to commercial real estate related entities,
represent 300% or more of total capital. Based on these criteria, the Bank has a concentration in commercial real estate lending as total loans for multifamily, non-farm/non-residential, construction, land development and other land represented 358%
of total risk-based capital at March 31, 2020. The particular focus of the guidance is on exposure to commercial real estate loans that are dependent on the cash flow from the real estate held as collateral and that are likely to be at greater risk
to conditions in the commercial real estate market (as opposed to real estate collateral held as a secondary source of repayment or as an abundance of caution). The purpose of the guidance is to guide banks in developing risk management practices and
capital levels commensurate with the level and nature of real estate concentrations. The guidance states that management should employ heightened risk management practices including board and management oversight and strategic planning, development
of underwriting standards, risk assessment and monitoring through market analysis and stress testing.
Our business may be adversely affected by credit risk associated with residential property.
At March 31, 2020, $83.2 million, or 9.1% of our total loan portfolio, was secured by one-to-four family mortgage loans and home equity loans. This type of lending is generally
sensitive to regional and local economic conditions that significantly impact the ability of borrowers to meet their loan payment obligations, making loss levels difficult to predict. A decline in residential real estate values resulting from a
downturn in the Washington and Oregon housing markets in which we operate may reduce the value of the real estate collateral securing these types of loans and increase our risk of loss if borrowers default on their loans. Recessionary conditions or
declines in the volume of real estate sales and/or the sales prices coupled with elevated unemployment rates may result in higher than expected loan delinquencies or problem assets, and a decline in demand for our products and services. These
potential negative events may cause us to incur losses, adversely affect our capital and liquidity and damage our financial condition and business operations.
Many of our one-to-four family loans and home equity lines of credit are secured by liens on mortgage properties. Residential loans with high combined loan-to-value ratios will
be more sensitive to declining property values than those with lower combined loan-to-value ratios and therefore may experience a higher incidence of default and severity of losses. In addition, if the borrowers sell their homes, they may be unable
to repay their loans in full from the sale. Further, the majority of our home equity lines of credit consist of second mortgage loans. For those home equity lines secured by a second
34
mortgage, it is unlikely that we will be successful in recovering all or a portion of our loan proceeds in the event of default unless we are prepared to repay the first
mortgage loan and such repayment and the costs associated with a foreclosure are justified by the value of the property.
Repayment of our commercial business loans is often dependent on the cash flows of the borrower, which may be unpredictable, and the collateral securing
these loans may fluctuate in value.
At March 31, 2020, we had $179.0 million, or 19.6% of total loans, in commercial business loans. Commercial lending involves risks that are different from those associated with
residential and commercial real estate lending. Real estate lending is generally considered to be collateral based lending with loan amounts based on predetermined loan to collateral values and liquidation of the underlying real estate collateral
being viewed as the primary source of repayment in the event of borrower default. Our commercial loans are primarily made based on the cash flow of the borrower and secondarily on the underlying collateral provided by the borrower. The borrowers'
cash flow may be unpredictable, and collateral securing these loans may fluctuate in value. This collateral may consist of equipment, inventory, accounts receivable, or other business assets. In the case of loans secured by accounts receivable, the
availability of funds for the repayment of these loans may be substantially dependent on the ability of the borrower to collect amounts due from its customers. Other collateral securing loans may depreciate over time, may be difficult to appraise,
may be illiquid and may fluctuate in value based on the specific type of business and equipment. As a result, the availability of funds for the repayment of commercial business loans may be substantially dependent on the success of the business
itself which, in turn, is often dependent in part upon general economic conditions and secondarily on the underlying collateral provided by the borrower.
Our allowance for loan losses may prove to be insufficient to absorb losses in our loan portfolio.
Lending money is a substantial part of our business and each loan carries a certain risk that it will not be repaid in accordance with its terms or that any underlying collateral will not be
sufficient to assure repayment. This risk is affected by, among other things:
|
•
|
the cash flow of the borrower and/or the project being financed;
|
|
•
|
in the case of a collateralized loan, the changes and uncertainties as to the future value of the collateral;
|
|
•
|
the duration of the loan;
|
|
•
|
the credit history of a particular borrower; and
|
|
•
|
changes in economic and industry conditions.
|
We maintain an allowance for loan losses, which is a reserve established through a provision for loan losses charged to expense, which we believe is appropriate to provide for probable losses in
our loan portfolio. The amount of this allowance is determined by management through periodic reviews and consideration of several factors, including, but not limited to:
|
•
|
our general reserve, based on our historical default and loss experience and certain macroeconomic factors based on management’s expectations of future events;
|
|
•
|
our specific reserve, based on our evaluation of impaired loans and their underlying collateral or discounted cash flow; and
|
|
•
|
an unallocated reserve to provide for other credit losses inherent in our loan portfolio that may not have been contemplated in the other loss factors.
|
The determination of the appropriate level of the allowance for loan losses inherently involves a high degree of subjectivity and requires us to make significant estimates of current credit risks
and future trends, all of which may undergo material changes. If our estimates are incorrect, the allowance for loan losses may not be sufficient to cover losses inherent in our loan portfolio, resulting in the need for increases in our allowance for
loan losses through the provision for losses on loans which is charged against income. Deterioration in economic conditions affecting borrowers, new information regarding existing loans, identification of additional problem loans and other factors,
both within and outside of our control, may also require an increase in the allowance for loan losses. Additionally, pursuant to our growth strategy, management recognizes that significant new growth in loan portfolios, new loan products and the
refinancing of existing loans can result in portfolios comprised of unseasoned loans that may not perform in a historical or projected manner and will increase the risk that our allowance may be insufficient to absorb losses without significant
additional provisions.
35
The Financial Accounting Standards Board has adopted a new accounting standard update (“ASU”) that will be effective for our first fiscal year beginning after December 15, 2022. This standard,
referred to as “Current Expected Credit Loss”, or “CECL”, will require financial institutions to determine periodic estimates of lifetime expected credit losses on loans and recognize the expected credit losses as allowances for credit losses at
inception of the loan. This will change the current method of providing allowances for credit losses that are probable of having been incurred, which may require us to increase our allowance for loan losses, and may greatly increase the types of data
we would need to collect and review to determine the appropriate level of the allowance for credit losses. For more on this ASU, see Note 1 of the Notes to Consolidated Financial Statements - Recently Issued Accounting Pronouncements contained in
Item 8 of this report. In addition, a further decline in national and local economic conditions, including as a result of the COVID-19 pandemic, results of the bank regulatory agencies’ periodic review of our allowance for loan losses or other
factors may require an increase in the provision for possible loan losses or the recognition of further loan charge-offs. If charge-offs in future periods exceed the allowance for loan losses, we may need additional provisions to replenish the
allowance for loan losses. Any increases in the allowance for loan losses will result in a decrease in net income and, most likely, capital, and may have a material negative effect on our financial condition and results of operations.
Uncertainty relating to the London Interbank Offered Rate ("LIBOR") calculation process and potential phasing out of LIBOR may adversely affect our results of operations.
On July 27, 2017, the Chief Executive of the United Kingdom Financial Conduct Authority, which regulates LIBOR, announced that it intends to stop persuading or compelling banks to submit rates for
the calibration of LIBOR to the administrator of LIBOR after 2021. The announcement indicates that the continuation of LIBOR on the current basis cannot and will not be guaranteed after 2021. It is impossible to predict whether and to what extent
banks will continue to provide LIBOR submissions to the administrator of LIBOR or whether any additional reforms to LIBOR may be enacted in the United Kingdom or elsewhere. At this time, no consensus exists as to what rate or rates may become
acceptable alternatives to LIBOR and it is impossible to predict the effect of any such alternatives on the value of LIBOR-based securities and variable rate loans, subordinated debentures, or other securities or financial arrangements, given LIBOR's
role in determining market interest rates globally. The Federal Reserve, in conjunction with the Alternative Reference Rates Committee, a steering committee comprised of large U.S. financial institutions, selected a new index (the Secured Overnight
Financing Rate or "SOFR") to replace LIBOR. SOFR is calculated as a volume-weighted median of transaction level data from the Bank of New York Mellon, Global Collateral Finance Repo and bilateral Treasury repo transactions cleared through the Fixed
Income Clearing Corporation. SOFR is observed and backward looking, which stands in contrast with LIBOR under the current methodology, which is an estimated forward-looking rate and relies, to some degree, on the expert judgment of submitting panel
members. Given that SOFR is a secured rate backed by government securities, it will be a rate that does not take into account bank credit risk (as is the case with LIBOR). SOFR is therefore likely to be lower than LIBOR and is less likely to
correlate with the funding costs of financial institutions. Whether or not SOFR attains market traction as a LIBOR replacement tool remains in question, although some transactions using SOFR have been completed including by Fannie Mae. Both Fannie
Mae and Freddie Mac have recently announced that they will cease accepting adjustable rate mortgages tied to LIBOR by the end of 2020 and will soon begin accepting mortgages based on SOFR. Continued uncertainty as to the nature of alternative
reference rates and as to potential changes or other reforms to LIBOR may adversely affect LIBOR rates and the value of LIBOR-based loans, and to a lesser extent securities in our portfolio, and may impact the availability and cost of hedging
instruments and borrowings, including the rates we pay on our subordinated debentures and trust preferred securities. If LIBOR rates are no longer available, and we are required to implement substitute indices for the calculation of interest rates
under our loan agreements with our borrowers or our existing borrowings, we may incur significant expenses in effecting the transition, and may be subject to disputes or litigation with customers and creditors over the appropriateness or
comparability to LIBOR of the substitute indices, which could have an adverse effect on our results of operations.
If our investments in real estate are not properly valued or sufficiently reserved to cover actual losses, or if we are required to increase our valuation reserves, our earnings
could be reduced.
We obtain updated valuations in the form of appraisals and broker price opinions when a loan has been foreclosed and the property is taken in as REO and at certain other times during the assets’
holding periods. Our net book value (“NBV”) in the loan at the time of foreclosure and thereafter is compared to the updated market value of the foreclosed property less estimated selling costs (fair value). A charge-off is recorded for any excess in
the asset’s NBV over its fair value. If our valuation process is incorrect, or if property values decline, the fair value of the investments in real estate may not be sufficient to recover our carrying value in such assets, resulting in the need for
additional write-downs. Significant write-downs to our investments in real estate could have a material adverse effect on our financial condition, liquidity and results of operations.
36
In addition, bank regulators periodically review our REO and may require us to recognize further write-downs. Any increase in our write-downs, as required by the bank regulators, may have a
material adverse effect on our financial condition, liquidity and results of operations.
Our securities portfolio may be negatively impacted by fluctuations in market value and interest rates.
Our securities portfolio may be impacted by fluctuations in market value, potentially reducing accumulated other comprehensive income (loss) and/or earnings. Fluctuations in market value may be
caused by changes in market interest rates, lower market prices for securities and limited investor demand. Our securities portfolio is evaluated for OTTI. If this evaluation shows impairment to the actual or projected cash flows associated with one
or more securities, a potential loss to earnings may occur. Changes in interest rates can also have an adverse effect on our financial condition, as our available-for-sale securities are reported at their estimated fair value and therefore are
impacted by fluctuations in interest rates. We increase or decrease our shareholders' equity by the amount of change in the estimated fair value of the available-for-sale securities, net of taxes. There can be no assurance that declines in market
value, including as a result of the COVID-19 pandemic, will not result in OTTI of these assets, which would lead to accounting charges that could have a material adverse effect on our net income and capital levels.
Changes in interest rates may reduce our net interest income and may result in higher defaults in a rising rate environment.
Our earnings and cash flows are largely dependent upon our net interest income, which is the difference, or spread, between the interest earned on loans, securities and other
interest-earning assets and the interest paid on deposits, borrowings, and other interest-bearing liabilities. Interest rates are highly sensitive to many factors that are beyond our control, including domestic and international economic conditions
and policies of various governmental and regulatory agencies and, in particular, the Federal Reserve. After steadily increasing the target federal funds rate in 2018 and 2017, the Federal Reserve in 2019 decreased the target federal funds rate by 75
basis points, and in response to the COVID-19 pandemic in March 2020, decreased the target federal funds rate by an additional 150 basis points to a range of 0.0% to 0.25% as of March 31, 2020. The Federal Reserve could make additional changes in
interest rates during 2020 subject to economic conditions. If the Federal Reserve increases the target federal funds rate, overall interest rates will likely rise, which may negatively impact the housing markets and the U.S. economic recovery. In
addition, deflationary pressures, while possibly lowering our operating costs, could have a significant negative effect on our borrowers, especially our business borrowers, and the values of collateral securing loans, which could negatively affect
our financial performance.
We principally manage interest rate risk by managing our volume and mix of our earning assets and funding liabilities. Changes in monetary policy, including changes in interest
rates, could influence not only the interest we receive on loans and investments and the amount of interest we pay on deposits and borrowings, but also can affect: (1) our ability to originate and/or sell loans; (2) the fair value of our financial
assets and liabilities, which could negatively impact shareholders’ equity, and our ability to realize gains from the sale of such assets; (3) our ability to obtain and retain deposits in competition with other available investment alternatives; (4)
the ability of our borrowers to repay adjustable or variable rate loans; and (5) the average duration of our investment securities portfolio and other interest-earning assets.
If the interest rates paid on deposits and other borrowings increase at a faster rate than the interest rates received on loans and other investments, our net interest income,
and therefore earnings, could be adversely affected. Earnings could also be adversely affected if the interest rates received on loans and other investments fall more quickly than the interest rates paid on deposits and other borrowings. In a
changing interest rate environment, we may not be able to manage this risk effectively. If we are unable to manage interest rate risk effectively, our business, financial condition and results of operations could be materially affected.
Changes in interest rates could also have a negative impact on our results of operations by reducing the ability of borrowers to repay their current loan obligations or by
reducing our margins and profitability. Our net interest margin is the difference between the yield we earn on our assets and the interest rate we pay for deposits and our other sources of funding. Changes in interest rates—up or down—could
adversely affect our net interest margin and, as a result, our net interest income. Although the yields we earn on our assets and our funding costs tend to move in the same direction in response to changes in interest rates, one can rise or fall
faster than the other, causing our net interest margin to expand or contract. Our liabilities tend to be shorter in duration than our assets, so they may adjust faster in response to changes in interest rates. As a result, when interest rates rise,
our funding costs may rise faster than the yield we earn on our assets, causing our net interest margin to contract until the yield catches up. Changes in the slope of the “yield curve”—or the spread between short-term and long-term interest
rates—could also reduce our net interest margin. Normally, the yield curve is upward sloping, meaning short-term rates are lower than long-term rates. Because our liabilities tend to be shorter in duration than our
37
assets, when the yield curve flattens or even inverts, we could experience pressure on our net interest margin as our cost of funds increases relative to the yield we can earn
on our assets. Also, interest rate decreases can lead to increased prepayments of loans and mortgage-backed securities as borrowers refinance their loans to reduce borrowing costs. Under these circumstances, we are subject to reinvestment risk as
we may have to redeploy such repayment proceeds into lower yielding investments, which would likely hurt our income.
A sustained increase in market interest rates could adversely affect our earnings. A significant portion of our loans have fixed interest rates and longer terms than our
deposits and borrowings. As is the case with many financial institutions, our emphasis on increasing the development of core deposits, those deposits bearing no or a relatively low rate of interest with no stated maturity date, has resulting in our
having a significant amount of these deposits which have a shorter duration than our assets. At March 31, 2020, we had $271.0 million in non-interest bearing demand deposits and $74.1 million in certificates of deposit that mature within one year. We
would incur a higher cost of funds to retain these deposits in a rising interest rate environment. Our net interest income could be adversely affected if the rates we pay on deposits and borrowings increase more rapidly than the rates we earn on
loans. In addition, a substantial amount of our home equity lines of credit have adjustable interest rates. As a result, these loans may experience a higher rate of default in a rising interest rate environment.
Changes in interest rates also affect the value of our interest-earning assets and in particular our securities portfolio. Generally, the fair value of fixed-rate securities
fluctuates inversely with changes in interest rates. Unrealized gains and losses on securities available for sale are reported as a separate component of equity, net of tax. Decreases in the fair value of securities available for sale resulting
from increases in interest rates could have an adverse effect on stockholders’ equity.
Although management believes it has implemented effective asset and liability management strategies to reduce the potential effects of changes in interest rates on our results
of operations, any substantial, unexpected or prolonged change in market interest rates could have a material adverse effect on our financial condition and results of operations. Also, our interest rate risk modeling techniques and assumptions likely
may not fully predict or capture the impact of actual interest rate changes on our consolidated balance sheet or projected operating results. In this regard, because the length of the COVID-19 pandemic and the efficacy of the extraordinary measures
being put in place to address its economic consequences are unknown, including the recent 150 basis point reductions in the targeted federal funds rate, until the COVID-19 pandemic subsides, the Company expects its net interest income and net
interest margin will be adversely affected in fiscal 2021 and possibly longer. See Item 7A., “Quantitative and Qualitative Disclosures About Market Risk,” of this Form 10-K.
Ineffective liquidity management could adversely affect our financial results and condition.
Effective liquidity management is essential to our business. We require sufficient liquidity to meet customer loan requests, customer deposit maturities and withdrawals, payments on our debt
obligations as they come due and other cash commitments under both normal operating conditions and other unpredictable circumstances, including events causing industry or general financial market stress. An inability to raise funds through deposits,
borrowings, the sale of loans or investment securities, or other sources could have a substantial negative effect on our liquidity. Our access to funding sources in amounts adequate to finance our activities on terms that are acceptable to us could
be impaired by factors that affect us specifically or the financial services industry or economy in general. Factors that could detrimentally impact our access to liquidity sources include a decrease in the level of our business activity as a result
of a downturn in the Washington or Oregon markets in which our loans are concentrated, negative operating results, or adverse regulatory action against us. Our ability to borrow could also be impaired by factors that are not specific to us, such as a
disruption in the financial markets or negative views and expectations about the prospects for the financial services industry and the continued uncertainty in credit markets. In particular, our liquidity position could be significantly constrained
if we are unable to access funds from the FHLB, the Federal Reserve Bank of San Francisco or other wholesale funding sources, or if adequate financing is not available at acceptable interest rates. Finally, if we are required to rely more heavily on
more expensive funding sources, our revenues may not increase proportionately to cover our costs. Any decline in available funding could adversely impact our ability to originate loans, invest in securities, meet our expenses, or fulfill obligations
such as repaying our borrowings or meeting deposit withdrawal demands, any of which could, in turn, have a material adverse effect on our business, financial condition and results of operations.
Additionally, collateralized public funds are bank deposits of state and local municipalities. These deposits are required to be secured by certain investment grade securities to ensure repayment,
which on the one hand tends to reduce our contingent liquidity risk by making these funds somewhat less credit sensitive, but on the other hand reduces standby liquidity by restricting the potential liquidity of the pledged collateral. Although these
funds historically have been a relatively stable source of funds for us, availability depends on the individual municipality's fiscal policies and cash flow needs.
38
Revenue from mortgage banking operations is sensitive to changes in economic conditions, decreased economic activity, a slowdown in the housing market, higher interest rates or
new legislation which may adversely impact our financial condition and results of operations
Our mortgage banking operations provide a significant portion of our non-interest income. We generate mortgage revenues primarily from gains on the sales of single-family mortgage loans pursuant
to programs currently offered by FNMA, FHLMC, GNMA and non-government sponsored entities. These entities account for a substantial portion of the secondary market in residential mortgage loans. Any future changes in these programs, our eligibility to
participate in such programs, the criteria for loans to be accepted or laws that significantly affect the activity of such entities could, in turn, materially adversely affect our results of operations. Mortgage banking is generally considered a
volatile source of income because it depends largely on the level of loan volume which, in turn, depends largely on prevailing market interest rates. In a rising or higher interest rate environment, our originations of mortgage loans may decrease,
resulting in fewer loans that are available to be sold to investors. This would result in a decrease in mortgage banking revenues and a corresponding decrease in non-interest income. In addition, our results of operations are affected by the amount
of non-interest expense associated with mortgage banking activities, such as salaries and employee benefits, occupancy, equipment and data processing expense and other operating costs. During periods of reduced loan demand, our results of operations
may be adversely affected to the extent that we are unable to reduce expenses commensurate with the decline in loan originations. In addition, although we sell loans into the secondary market without recourse, we are required to give customary
representations and warranties about the loans to the buyers. If we breach those representations and warranties, the buyers may require us to repurchase the loans and we may incur a loss on the repurchase.
The required accounting treatment of loans we acquire through acquisitions could result in higher net interest margins and interest income in current periods and lower net
interest margins and interest income in future periods.
Under GAAP, we are required to record loans acquired through acquisitions, including purchase credit-impaired loans, at fair value. Estimating the fair value of such loans requires management to
make estimates based on available information and facts and circumstances on the acquisition date. Actual performance could differ from management’s initial estimates. If these loans outperform our original fair value estimates, the difference
between our original estimate and the actual performance of the loan (the “discount”) is accreted into net interest income. Thus, our net interest margins may initially increase due to the discount accretion. We expect the yields on our loans to
decline as our acquired loan portfolio pays down or matures and the discount decreases, and we expect downward pressure on our interest income to the extent that the runoff on our acquired loan portfolio is not replaced with comparable high-yielding
loans. This could result in higher net interest margins and interest income in current periods and lower net interest margins and lower interest income in future periods.
A general decline in economic conditions may adversely affect the fees generated by our asset management company.
To the extent our asset management clients and their assets become adversely affected by weak economic and stock market conditions, they may choose to withdraw the amount of assets managed by us
and the value of their assets may decline. Our asset management revenues are based on the value of the assets we manage. If our clients withdraw assets or the value of their assets decline, the revenues generated by the Trust Company will be
adversely affected.
Our branching strategy may cause our expenses to increase faster than revenues.
The Company previously announced plans for three new branches located in Clark County, Washington, to complement its existing branch network. A new branch in downtown Camas is scheduled to open
this summer while our new location in the Cascade Park neighborhood of Vancouver is scheduled to open later this fall. A construction delay due to COVID-19 pandemic has pushed the opening of the new branch location in Ridgefield to early 2021. The
success of our expansion strategy is contingent upon numerous factors, such as our ability to secure managerial resources, hire and retain qualified personnel and implement effective marketing strategies. The opening of new branches may not increase
the volume of our loans and deposits as quickly or to the degree that we hope and opening new branches will increase our operating expenses. On average, de novo branches do not become profitable until three to four years after opening. Further, the
projected timeline and the estimated dollar amounts involved in opening de novo branches could differ significantly from actual results. We may not successfully manage the costs and implementation risks associated with our branching strategy.
Accordingly, any new branch may negatively impact our earnings for some period of time until the branch reaches certain economies of scale. Finally, there is a risk that our new branches will not be successful even after they have been established.
39
Our growth or future losses may require us to raise additional capital in the future, but that capital may not be available when it is needed or the cost of that capital may be
very high.
We are required by federal regulatory authorities to maintain adequate levels of capital to support our operations. Our ability to raise additional capital, if needed, will
depend on conditions in the capital markets at that time, which are outside our control, and on our financial condition and performance. Accordingly, we cannot make assurances that we will be able to raise additional capital if needed on terms that
are acceptable to us, or at all. If we cannot raise additional capital when needed, our ability to further expand our operations could be materially impaired and our financial condition and liquidity could be materially and adversely affected. In
addition, any additional capital we obtain may result in the dilution of the interests of existing holders of our common stock. Further, if we are unable to raise additional capital when required by our bank regulators, we may be subject to adverse
regulatory action.
We may experience future goodwill impairment, which could reduce our earnings.
In accordance with GAAP, we record assets acquired and liabilities assumed in a business combination at their fair values with the excess of the purchase consideration over the
net assets acquired resulting in the recognition of goodwill. As a result, business combinations typically result in recording goodwill. We perform a goodwill evaluation at least annually to test for goodwill impairment. We performed our annual
goodwill impairment test as of October 31, 2019, and no impairment was identified. Our assessment of the fair value of goodwill is based on an evaluation of current purchase transactions, discounted cash flows from forecasted earnings, our current
market capitalization, and a valuation of our assets. Our evaluation of the fair value of goodwill involves a substantial amount of judgment. If our judgment was incorrect and an impairment of goodwill was deemed to exist, we would be required to
write down our goodwill resulting in a charge to earnings, which could adversely affect our results of operations, perhaps materially; however, it would have no impact on our liquidity, operations or regulatory capital. As a result of the effects of
the COVID-19 pandemic and its impacts on the financial markets and economy, the Company completed a qualitative assessment of goodwill as of March 31, 2020 and concluded that it is more likely than not that the fair value of the Bank (the reporting
unit), exceeds its carrying value at March 31, 2020. If adverse economic conditions or the recent decrease in the Company’s common stock price and market capitalization as a result of the COVID-19 pandemic were sustained in the future rather than
temporary, it may significantly affect the fair value of the reporting unit and may trigger future goodwill impairment charges. Any such impairment charge could have a material adverse effect on our operating results and financial condition.
We operate in a highly regulated environment and may be adversely affected by changes in federal and state laws and regulations.
The financial services industry is extensively regulated. Federal and state banking regulations are designed primarily to protect the deposit insurance funds and consumers, not
to benefit a company’s shareholders. These regulations may sometimes impose significant limitations on operations. Regulatory authorities have extensive discretion in connection with their supervisory and
enforcement activities, including the imposition of restrictions on the operation of an institution, the classification of assets by the institution and the adequacy of an institution's allowance for loan losses. These bank regulators also have the
ability to impose conditions in the approval of merger and acquisition transactions. The significant federal and state banking regulations that affect us are described under the heading “Item 1. Business-Regulation” in Item I of this Form 10-K. These
regulations, along with the currently existing tax, accounting, securities, insurance, and monetary laws, regulations, rules, standards, policies, and interpretations control the methods by which financial institutions conduct business, implement
strategic initiatives and tax compliance, and govern financial reporting and disclosures. These laws, regulations, rules, standards, policies, and interpretations are constantly evolving and may change significantly over time. Any new regulations or
legislation, change in existing regulations or oversight, whether a change in regulatory policy or a change in a regulator’s interpretation of a law or regulation, may require us to invest significant management attention and resources to make any
necessary changes to operations to comply and could have an adverse effect on our business, financial condition and results of operations. Additionally, actions by regulatory agencies or significant litigation against us may lead to penalties that
materially affect us. Further, changes in accounting standards can be both difficult to predict and involve judgment and discretion in their interpretation by us and our independent registered public accounting firm. These accounting changes could
materially impact, potentially even retroactively, how we report our financial condition and results of our operations as could our interpretation of those changes.
40
Non-compliance with the USA PATRIOT Act, Bank Secrecy Act, or other laws and regulations could result in fines or sanctions and limit our ability to get
regulatory approval of acquisitions.
The USA PATRIOT and Bank Secrecy Acts require financial institutions to develop programs to prevent financial institutions from being used for money laundering and terrorist activities. If such
activities are detected, financial institutions are obligated to file suspicious activity reports with the U.S. Treasury’s Office of Financial Crimes Enforcement Network. These rules require financial institutions to establish procedures for
identifying and verifying the identity of customers seeking to open new financial accounts. Failure to comply with these regulations could result in fines or sanctions and limit our ability to get regulatory approval of acquisitions. Recently,
several banking institutions have received large fines for non-compliance with these laws and regulations. While we have developed policies and procedures designed to assist in compliance with these laws and regulations, no assurance can be given
that these policies and procedures will be effective in preventing violations of these laws and regulations. Failure to maintain and implement adequate programs to combat money laundering and terrorist financing could also have serious reputational
consequences for us. Any of these results could have a material adverse effect on our business, financial condition, results of operations and growth prospects.
Competition with other financial institutions could adversely affect our profitability.
Although we consider ourselves competitive in our market areas, we face intense competition in both making loans and attracting deposits. Price competition for loans and deposits might result in
our earning less on our loans and paying more on our deposits, which reduces net interest income. Some of the institutions with which we compete have substantially greater resources than we have and may offer services that we do not provide. We
expect competition to increase in the future as a result of legislative, regulatory and technological changes and the continuing trend of consolidation in the financial services industry. Our profitability will depend upon our continued ability to
compete successfully in our market areas.
We are subject to certain risks in connection with our use of technology.
Our security measures may not be sufficient to mitigate the risk of a cyber-attack. Communications and information systems are essential to the conduct of
our business, as we use such systems to manage our customer relationships, our general ledger and virtually all other aspects of our business. Our operations rely on the secure processing, storage, and transmission of confidential and other
information in our computer systems and networks. Although we take protective measures and endeavor to modify them as circumstances warrant, the security of our computer systems, software, and networks may be vulnerable to breaches, fraudulent or
unauthorized access, denial or degradation of service attacks, misuse, computer viruses, malware or other malicious code and cyber-attacks that could have a security impact. If one or more of these events occur, this could jeopardize our or our
customers' confidential and other information processed and stored in, and transmitted through, our computer systems and networks, or otherwise cause interruptions or malfunctions in our operations or the operations of our customers or
counterparties. We may be required to expend significant additional resources to modify our protective measures or to investigate and remediate vulnerabilities or other exposures, and we may be subject to litigation and financial losses that are
either not insured against or not fully covered through any insurance maintained by us. We could also suffer significant reputational damage.
Further, our cardholders use their debit and credit cards to make purchases from third parties or through third-party processing services. As such, we are subject to risk from data breaches of
such third-party’s information systems or their payment processors. Such a data security breach could compromise our account information. The payment methods that we offer also subject us to potential fraud and theft by criminals, who are becoming
increasingly more sophisticated, seeking to obtain unauthorized access to or exploit weaknesses that may exist in the payment systems. If we fail to comply with applicable rules or requirements for the payment methods we accept, or if payment-related
data is compromised due to a breach or misuse of data, we may be liable for losses associated with reimbursing our clients for such fraudulent transactions on clients’ card accounts, as well as costs incurred by payment card issuing banks and other
third parties or may be subject to fines and higher transaction fees, or our ability to accept or facilitate certain types of payments may be impaired. We may also incur other costs related to data security breaches, such as replacing cards
associated with compromised card accounts. In addition, our customers could lose confidence in certain payment types, which may result in a shift to other payment types or potential changes to our payment systems that may result in higher costs.
Breaches of information security also may occur through intentional or unintentional acts by those having access to our systems or our clients’ or counterparties’ confidential information,
including employees. The Company is continuously working to install new and upgrade its existing information technology systems and provide employee awareness training around phishing, malware, and other cyber risks to further protect the Company
against cyber risks and security breaches.
41
There continues to be a rise in electronic fraudulent activity, security breaches and cyber-attacks within the financial services industry, especially in the commercial banking sector due to cyber
criminals targeting commercial bank accounts. We are regularly the target of attempted cyber and other security threats and must continuously monitor and develop our information technology networks and infrastructure to prevent, detect, address and
mitigate the risk of unauthorized access, misuse, computer viruses and other events that could have a security impact. Insider or employee cyber and security threats are increasingly a concern for companies, including ours. We are not aware that we
have experienced any material misappropriation, loss or other unauthorized disclosure of confidential or personally identifiable information as a result of a cyber-security breach or other act, however, some of our clients may have been affected by
third-party breaches, which could increase their risks of identity theft, credit card fraud and other fraudulent activity that could involve their accounts with us.
Security breaches in our internet banking activities could further expose us to possible liability and damage our reputation. Increases in criminal
activity levels and sophistication, advances in computer capabilities, new discoveries, vulnerabilities in third-party technologies (including browsers and operating systems) or other developments could result in a compromise or breach of the
technology, processes and controls that we use to prevent fraudulent transactions and to protect data about us, our clients and underlying transactions. Any compromise of our security could deter customers from using our internet banking services
that involve the transmission of confidential information. We rely on standard internet security systems to provide the security and authentication necessary to effect secure transmission of data. Although we have developed and continue to invest in
systems and processes that are designed to detect and prevent security breaches and cyber-attacks and periodically test our security, these precautions may not protect our systems from compromises or breaches of our security measures, and could
result in losses to us or our clients, our loss of business and/or clients, damage to our reputation, the incurrence of additional expenses, disruption to our business, our inability to grow our online services or other businesses, additional
regulatory scrutiny or penalties, or our exposure to civil litigation and possible financial liability, any of which could have a material adverse effect on our business, financial condition and results of operations.
Our security measures may not protect us from system failures or interruptions. While we have established policies and procedures to prevent or limit the
impact of systems failures and interruptions, there can be no assurance that such events will not occur or that they will be adequately addressed if they do. In addition, we outsource certain aspects of our data processing and other operational
functions to certain third-party providers. While the Company selects third-party vendors carefully, it does not control their actions. If our third-party providers encounter difficulties, including those
resulting from breakdowns or other disruptions in communication services provided by a vendor, failure of a vendor to handle current or higher transaction volumes, cyber-attacks and security breaches or if we otherwise have difficulty in
communicating with them, our ability to adequately process and account for transactions could be affected, and our ability to deliver products and services to our customers and otherwise conduct our business operations could be adversely impacted.
Replacing these third-party vendors could also entail significant delay and expense. Threats to information security also exist in the processing of customer information through various other vendors and their personnel.
We cannot assure that such breaches, failures or interruptions will not occur or, if they do occur, that they will be adequately addressed by us or the third parties on which we rely. We may not
be insured against all types of losses as a result of third-party failures and insurance coverage may be inadequate to cover all losses resulting from breaches, system failures or other disruptions. If any of our third-party service providers
experience financial, operational or technological difficulties, or if there is any other disruption in our relationships with them, we may be required to identify alternative sources of such services, and we cannot assure that we could negotiate
terms that are as favorable to us, or could obtain services with similar functionality as found in our existing systems without the need to expend substantial resources, if at all. Further, the occurrence of any systems failure or interruption could
damage our reputation and result in a loss of customers and business, could subject us to additional regulatory scrutiny, or could expose us to legal liability. Any of these occurrences could have a material adverse effect on our financial condition
and results of operations.
The board of directors oversees the risk management process, including the risk of cybersecurity, and engages with management on cybersecurity issues.
42
Our ability to retain and recruit key management personnel and bankers is critical to the success of our business strategy and any failure to do so could impair our customer
relationships and adversely affect our business and results of operations.
Competition for qualified employees and personnel in the banking industry is intense and there are a limited number of qualified persons with knowledge of, and experience in, the community banking
industry where the Bank conducts its business. The process of recruiting personnel with the combination of skills and attributes required to carry out our strategies is often lengthy. Our success depends to a significant degree upon our ability to
attract and retain qualified management, loan origination, finance, administrative, marketing and technical personnel and upon the continued contributions of our management and personnel. In particular, our success has been and continues to be highly
dependent upon the abilities of key executives, including our President and Chief Executive Officer, and certain other employees. Our ability to retain and grow our loans, deposits, and fee income depends upon the business generation capabilities,
reputation, and relationship management skills of our lenders. If we were to lose the services of any of our bankers, including successful bankers employed by banks that we may acquire, to a new or existing competitor, or otherwise, we may not be
able to retain valuable relationships and some of our customers could choose to use the services of a competitor instead of our services. In addition, our success has been and continues to be highly dependent upon the services of our directors, many
of whom are at or nearing retirement age, and we may not be able to identify and attract suitable candidates to replace such directors.
We rely on other companies to provide key components of our business infrastructure.
We rely on numerous external vendors to provide us with products and services necessary to maintain our day-to-day operations. Accordingly, our operations are exposed to risk that these vendors
will not perform in accordance with the contracted arrangements under service level agreements. The failure of an external vendor to perform in accordance with the contracted arrangements under service level agreements because of changes in the
vendor’s organizational structure, financial condition, support for existing products and services or strategic focus or for any other reason, could be disruptive to our operations, which in turn could have a material negative impact on our financial
condition and results of operations. We also could be adversely affected to the extent such an agreement is not renewed by the third-party vendor or is renewed on terms less favorable to us. Additionally, the bank regulatory agencies expect financial
institutions to be responsible for all aspects of our vendors’ performance, including aspects which they delegate to third parties. Disruptions or failures in the physical infrastructure or operating systems that support our business and clients, or
cyber-attacks or security breaches of the networks, systems or devices that our clients use to access our products and services could result in client attrition, regulatory fines, penalties or intervention, reputational damage, reimbursement or other
compensation costs, and/or additional compliance costs, any of which could materially adversely affect our results of operations or financial condition.
If our enterprise risk management framework is not effective at mitigating risk and loss to us, we could suffer unexpected losses and our results of operations could be
materially adversely affected.
Our enterprise risk management framework seeks to achieve an appropriate balance between risk and return, which is critical to optimizing shareholder value. We have established processes and
procedures intended to identify, measure, monitor, report, analyze and control the types of risk to which we are subject. These risks include, among others, liquidity, credit, market, interest rate, operational, legal and compliance, and reputational
risk. Our framework also includes financial or other modeling methodologies that involve management assumptions and judgment. We also maintain a compliance program to identify, measure, assess, and report on our adherence to applicable laws, policies
and procedures. While we assess and improve these programs on an ongoing basis, there can be no assurance that our risk management or compliance programs, along with other related controls, will effectively mitigate risk under all circumstances, or
that it will adequately mitigate any risk or loss to us. However, as with any risk management framework, there are inherent limitations to our risk management strategies as they may exist, or develop in the future, including risks that we have not
appropriately anticipated or identified. If our risk management framework proves ineffective, we could suffer unexpected losses and our business, financial condition, results of operations or growth prospects could be materially adversely affected.
We may also be subject to potentially adverse regulatory consequences.
43
Our business may be adversely affected by an increasing prevalence of fraud and other financial crimes.
As a bank, we are susceptible to fraudulent activity that may be committed against us or our clients, which may result in financial losses or increased costs to us or our clients, disclosure or
misuse of our information or our client information, misappropriation of assets, privacy breaches against our clients, litigation or damage to our reputation. Such fraudulent activity may take many forms, including check fraud, electronic fraud, wire
fraud, phishing, social engineering and other dishonest acts. Nationally, reported incidents of fraud and other financial crimes have increased. We have also experienced losses due to apparent fraud and other financial crimes. While we have policies
and procedures designed to prevent such losses, there can be no assurance that such losses will not occur.
Managing reputational risk is important to attracting and maintaining customers, investors and employees.
Threats to our reputation can come from many sources, including adverse sentiment about financial institutions generally, unethical practices, employee misconduct, failure to deliver minimum
standards of service or quality or operational failures due to integration or conversion challenges as a result of acquisitions we undertake, compliance deficiencies, and questionable or fraudulent activities of our customers. We have policies and
procedures in place to protect our reputation and promote ethical conduct, but these policies and procedures may not be fully effective. Negative publicity regarding our business, employees, or customers, with or without merit, may result in the loss
of customers, investors and employees, costly litigation, a decline in revenues and increased governmental regulation.
We rely on dividends from the Bank for substantially all of our revenue at the holding company level.
We are an entity separate and distinct from our principal subsidiary, the Bank, and derive substantially all of our revenue at the holding company level in the form of dividends from that
subsidiary. Accordingly, we are, and will be, dependent upon dividends from the Bank to pay the principal of and interest on our indebtedness, to satisfy our other cash needs and to pay dividends on our common stock. The Bank's ability to pay
dividends is subject to its ability to earn net income and to meet certain regulatory requirements. In the event the Bank is unable to pay dividends to us, we may not be able to pay dividends on our common stock. Also, our right to participate in a
distribution of assets upon a subsidiary's liquidation or reorganization is subject to the prior claims of the subsidiary's creditors.
44
Item 1B. Unresolved Staff Comments
None.
Item 2. Properties
The executive offices of the Company are located in downtown Vancouver, Washington at 900 Washington Street. The Company’s operational center is also located in Vancouver, Washington (both offices
are leased). At March 31, 2020, the Bank had 10 offices located in Clark County, Washington (five of which are leased), two offices in Klickitat County, Washington and one office in Skamania County, Washington. The Bank also has three offices in
Multnomah County, Oregon, one leased office in Washington County, Oregon and one office in Marion County, Oregon. In addition, at March 31, 2020, the Trust Company had one office as part of the executive offices leased and one leased office in
Clackamas County, Oregon. In the opinion of management, all properties are adequately covered by insurance, are in a good state of repair and are appropriately designed for their present and future use.
Item 3. Legal Proceedings
Periodically, there have been various claims and lawsuits involving the Company, such as claims to enforce liens, condemnation proceedings on properties in which the Company holds security
interests, claims involving the making and servicing of real property loans and other issues incident to the Company’s business. The Company is not a party to any pending legal proceedings that it believes would have a material adverse effect on the
financial condition, results of operations or liquidity of the Company.
Item 4. Mine Safety Disclosures
Not applicable.
45
PART II
Item 5. Market for Registrant’s Common Equity, Related Stockholder Matters and Issuer Purchases of Equity Securities
The Company's common stock is traded on the Nasdaq Global Market under the symbol “RVSB.” At March 31, 2020, the number of shares of Company common stock issued and outstanding were 22,748,385 and
22,544,285, respectively, 565 stockholders of record and an estimated 2,913 holders in nominee or “street name”.
Stock Repurchase
The Company may repurchase shares of its common stock from time-to-time in open market transactions. The timing, volume and price of purchases are made at our discretion and are also contingent
upon our overall financial condition, as well as general market conditions.
On February 27, 2020, the Company announced that its Board of Directors adopted a stock repurchase program. Under the repurchase program, the Company may repurchase up to 500,000 shares of the
Company’s outstanding shares of common stock, in the open market, based on prevailing market prices, or in private negotiated transactions, over a period beginning March 12, 2020 continuing until the earlier of the completion of the repurchase or the
next six months, depending on market conditions. As of March 31, 2020, the Company had repurchased 204,100 shares under the stock repurchase program at an average price of $4.94 per share. As of April 17, 2020, the Company had repurchased the
remaining 295,900 shares at an average price of $4.85 per share. The Company did not repurchase any shares of its common stock during the years ended March 31, 2019 or 2018.
The following table sets forth the Company’s repurchases of its outstanding common stock during the fourth quarter of the year ended March 31, 2020:
|
Period
|
Total
Number of
Shares
Purchased
|
Average
Price
Paid per
Share
|
Total Number of
Shares Purchased
as Part of Publicly Announced Stock Repurchase
Program
|
Maximum Number (or Approximate Dollar
Value) of Shares that
May Yet Be Purchased
Under the Stock
Repurchase Program
|
||||||||||||
|
March 12, 2020
|
500,000
|
|||||||||||||||
|
March 12, 2020 – March 31, 2020
|
204,100
|
$
|
4.94
|
204,100
|
295,900
|
|||||||||||
|
Total
|
204,100
|
4.94
|
204,100
|
|||||||||||||
Securities for Equity Compensation Plans
Please refer to Item 12 in this Form 10-K for a listing of securities authorized for issuance under equity compensation plans.
Five-Year Stock Performance Graph
The following graph compares the cumulative total shareholder return on our common stock with the cumulative total return on the Standard & Poor's 500 Stock Index and The NASDAQ Bank Index.
The graph assumes that total return includes the reinvestment of all dividends and that the value of the investment in Riverview’s common stock and each index was $100 on March 31, 2015, and is the base amount used in the graph. The closing price of
Riverview’s common stock on March 31, 2020 was $5.01.
46
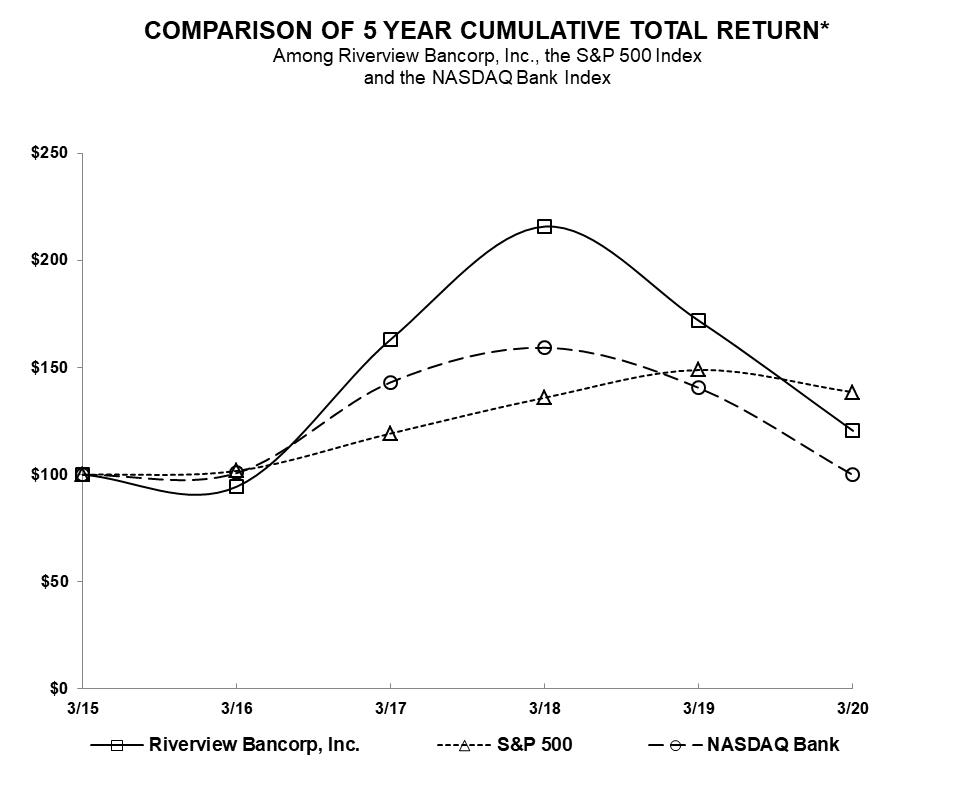
|
|
3/31/15*
|
3/31/16
|
3/31/17
|
3/31/18
|
3/31/19
|
3/31/20
|
|
|
Riverview Bancorp, Inc.
|
100.00
|
94.47
|
163.25
|
215.79
|
171.74
|
120.47
|
|
|
S & P 500
|
100.00
|
101.78
|
119.26
|
135.95
|
148.86
|
138.47
|
|
|
NASDAQ Bank
|
100.00
|
100.81
|
143.18
|
159.22
|
140.44
|
99.82
|
*$100 invested on 3/31/15 in stock or index-including reinvestment of dividends.
Copyright © 2020, Standard & Poor's, a division of S&P Global. All rights reserved.
www.researchdatagroup.com/S&P.htm
47
Item 6. Selected Financial Data
The following condensed consolidated statements of operations and financial condition and selected performance ratios as of March 31, 2020, 2019, 2018, 2017 and 2016 and for the years then ended
have been derived from the Company’s audited Consolidated Financial Statements. The information below is qualified in its entirety by the detailed information included elsewhere herein and should be read along with Item 7. “Management’s Discussion
and Analysis of Financial Condition and Results of Operations” and Item 8. “Financial Statements and Supplementary Data” included in this Form 10-K.
|
At March 31,
|
|||||||||||||||
|
2020
|
2019
|
2018
|
2017
|
2016
|
|||||||||||
|
(In thousands)
|
|||||||||||||||
|
FINANCIAL CONDITION DATA:
|
|||||||||||||||
|
Total assets
|
$
|
1,180,808
|
$
|
1,156,921
|
$
|
1,151,535
|
$
|
1,133,939
|
$
|
921,229
|
|||||
|
Loans receivable, net
|
898,885
|
864,659
|
800,610
|
768,904
|
614,934
|
||||||||||
|
Loans held for sale
|
275
|
909
|
210
|
478
|
503
|
||||||||||
|
Investment securities available for sale
|
148,291
|
178,226
|
213,221
|
200,214
|
150,690
|
||||||||||
|
Investment securities held to maturity
|
28
|
35
|
42
|
64
|
75
|
||||||||||
|
Cash and cash equivalents
|
41,968
|
22,950
|
44,767
|
64,613
|
55,400
|
||||||||||
|
Deposits
|
990,448
|
925,068
|
995,691
|
980,058
|
779,803
|
||||||||||
|
Shareholders’ equity
|
148,843
|
133,122
|
116,901
|
111,264
|
108,273
|
||||||||||
|
Years Ended March 31,
|
|||||||||||||||
|
2020
|
2019
|
2018
|
2017
|
2016
|
|||||||||||
|
(Dollars in thousands, except per share data)
|
|||||||||||||||
|
OPERATING DATA:
|
|||||||||||||||
|
Interest and dividend income
|
$
|
50,495
|
$
|
49,869
|
$
|
45,314
|
$
|
36,054
|
$
|
31,374
|
|||||
|
Interest expense
|
4,764
|
2,815
|
2,349
|
1,869
|
1,742
|
||||||||||
|
Net interest income
|
45,731
|
47,054
|
42,965
|
34,185
|
29,632
|
||||||||||
|
Provision for (recapture of) loan losses
|
1,250
|
50
|
-
|
-
|
(1,150
|
)
|
|||||||||
|
Net interest income after provision for (recapture of) loan losses
|
44,481
|
47,004
|
42,965
|
34,185
|
30,782
|
||||||||||
|
Gains from sales of loans, securities and real estate owned
|
282
|
326
|
722
|
493
|
338
|
||||||||||
|
Other non-interest income
|
12,078
|
10,781
|
9,928
|
9,094
|
8,611
|
||||||||||
|
Non-interest expense
|
36,263
|
35,699
|
35,618
|
32,981
|
29,947
|
||||||||||
|
Income before income taxes
|
20,578
|
22,412
|
17,997
|
10,791
|
9,784
|
||||||||||
|
Provision for income taxes
|
4,830
|
5,146
|
7,755
|
3,387
|
3,426
|
||||||||||
|
Net income
|
$
|
15,748
|
$
|
17,266
|
$
|
10,242
|
$
|
7,404
|
$
|
6,358
|
|||||
|
Earnings per share:
|
|||||||||||||||
|
Basic
|
$
|
0.70
|
$
|
0.76
|
$
|
0.45
|
$
|
0.33
|
$
|
0.28
|
|||||
|
Diluted
|
0.69
|
0.76
|
0.45
|
0.33
|
0.28
|
||||||||||
|
Dividends per share
|
0.19000
|
0.15000
|
0.10500
|
0.08000
|
0.06500
|
||||||||||
48
|
At or For the Years Ended March 31,
|
||||||||||||||||||||
|
2020
|
2019
|
2018
|
2017
|
2016
|
||||||||||||||||
|
KEY FINANCIAL RATIOS:
|
||||||||||||||||||||
|
Performance Ratios:
|
||||||||||||||||||||
|
Return on average assets
|
1.35
|
%
|
1.51
|
%
|
0.90
|
%
|
0.76
|
%
|
0.72
|
%
|
||||||||||
|
Return on average equity
|
10.96
|
13.86
|
8.78
|
6.66
|
5.93
|
|||||||||||||||
|
Dividend payout ratio (1)
|
27.54
|
19.74
|
23.33
|
24.24
|
23.21
|
|||||||||||||||
|
Interest rate spread
|
4.04
|
4.32
|
4.02
|
3.76
|
3.65
|
|||||||||||||||
|
Net interest margin
|
4.26
|
4.45
|
4.12
|
3.83
|
3.72
|
|||||||||||||||
|
Non-interest expense to average assets
|
3.11
|
3.13
|
3.15
|
3.38
|
3.39
|
|||||||||||||||
|
Efficiency ratio (2)
|
62.42
|
61.38
|
66.43
|
75.35
|
77.62
|
|||||||||||||||
|
Average equity to average assets
|
12.32
|
10.92
|
10.30
|
11.39
|
12.14
|
|||||||||||||||
|
Asset Quality Ratios:
|
||||||||||||||||||||
|
Allowance for loan losses to
total loans at end of period
|
1.38
|
1.31
|
1.33
|
1.35
|
1.58
|
|||||||||||||||
|
Allowance for loan losses to
nonperforming loans
|
904.95
|
754.25
|
445.24
|
382.98
|
364.22
|
|||||||||||||||
|
Net charge-offs (recoveries) to average outstanding
loans during the period
|
0.01
|
(0.08
|
)
|
(0.03
|
)
|
(0.10
|
)
|
(0.05
|
)
|
|||||||||||
|
Ratio of nonperforming assets
to total assets
|
0.12
|
0.13
|
0.24
|
0.27
|
0.36
|
|||||||||||||||
|
Ratio of nonperforming loans
to total loans
|
0.15
|
0.17
|
0.30
|
0.35
|
0.43
|
|||||||||||||||
|
Capital Ratios:
|
||||||||||||||||||||
|
Total capital to risk-weighted assets
|
17.01
|
16.88
|
15.41
|
14.06
|
16.07
|
|||||||||||||||
|
Tier 1 capital to risk-weighted assets
|
15.76
|
15.63
|
14.16
|
12.81
|
14.81
|
|||||||||||||||
|
Common equity tier 1 capital to risk-weighted assets
|
15.76
|
15.63
|
14.16
|
12.81
|
14.81
|
|||||||||||||||
|
Leverage ratio
|
11.79
|
11.56
|
10.26
|
10.21
|
11.18
|
|||||||||||||||
|
(1)
|
Dividends per share divided by diluted earnings per share.
|
|
(2)
|
Non-interest expense divided by the sum of net interest income and non-interest income.
|
49
Item 7. Management’s Discussion and Analysis of Financial Condition and Results of Operations
General
Management’s Discussion and Analysis of Financial Condition and Results of Operations is intended to assist in understanding the financial condition and results of operations of the Company. The
information contained in this section should be read in conjunction with the Consolidated Financial Statements and accompanying Notes thereto contained in Item 8 of this Form 10-K and the other sections contained in this Form 10-K. This section
contains certain financial information determined by methods other than in accordance with GAAP. These measures include net interest income on a fully tax equivalent basis and net interest margin on a fully tax equivalent basis. Management uses these
non-GAAP measures in its analysis of the Company’s performance. The tax equivalent adjustment to net interest income recognizes the income tax savings when comparing taxable and tax-exempt assets. Management believes that it is a standard practice in
the banking industry to present net interest income and net interest margin on a fully tax equivalent basis, and accordingly believes that providing these measures may be useful for peer comparison purposes. These disclosures should not be viewed as
substitutes for the results determined to be in accordance with GAAP, nor are they necessarily comparable to non-GAAP performance measures that may be presented by other companies.
Recent Developments Related to COVID-19
In response to the current global situation surrounding the novel coronavirus of 2019 (“COVID-19”) pandemic, the Company is offering a variety of relief options designed to support our customers
and the communities we serve.
Paycheck Protection Program ("PPP") Participation – The Coronavirus Aid, Relief and Economic Security Act of 2020 (“CARES Act”) was
signed into law on March 27, 2020, and authorized the Small Business Administration (“SBA”) to temporarily guarantee loans under the PPP, a new loan program. The goal of the PPP is to avoid as many layoffs as possible and to encourage small
businesses to maintain payrolls. As a qualified SBA lender, the Company was automatically authorized to originate PPP loans upon commencement of the program in April 2020. Under terms of the PPP, all PPP loans have: (a) an interest rate of 1.0%, (b)
a two-year loan term to maturity; and (c) principal and interest payments deferred for six months from the date of loan funding. The SBA guarantees 100% of the PPP loans made to eligible borrowers. The entire principal amount of the borrower’s PPP
loan, including any accrued interest, is eligible to be forgiven and repaid by the SBA so long as employee and compensation levels of the borrower’s business are maintained and 75% of the loan proceeds are used for payroll expenses, with the
remaining 25% of the loan proceeds used for other qualifying expenses. The Company has accepted more than 700 applications for PPP loans, consisting primarily of existing customers who are small to midsize businesses as well as independent
contractors, sole proprietors and partnerships and non-for-profits as allowed under the PPP guidance.
As of May 31, 2020, we have funded 781 PPP loans for a total of $116.2 million, with an average loan amount of $150,000. Another $12,000 in PPP loans have been approved and are in the application
pipeline process as of May 31, 2020. In addition to the 1% interest earned on these loans, the SBA pays us fees for processing PPP loans in the following amounts: (i) five percent for loans of not more than $350,000; (ii) three percent for loans of
more than $350,000 and less than $2,000,000; and one percent for loans of at least $2,000,000. We may not collect any fees from the loan applicants.
We may utilize the FRB's Paycheck Protection Program Liquidity Facility (“PPPLF”), pursuant to which the Company will pledge its PPP loans at face value as collateral to obtain FRB non-recourse
borrowings. The Company will also assist our customers with accessing other borrowing options as they become available such as other government sponsored lending programs, as appropriate.
Allowance for Loan Losses and Loan Modifications – The Company recorded a provision for loan losses of $1.3 million for the fiscal year
2020, compared to $50,000 in fiscal 2019 due primarily to deterioration in economic conditions related to COVID-19.
As of May 31, 2020, the Bank’s loan portfolio exposures to industries most affected by the COVID-19 pandemic were as follows (dollars in thousands):
|
Balance
|
Percent
to total
loans
|
Weighted Average Loan-To-Value
Percentage
|
Weighted Average Debt-Service-
Coverage Ratio
|
|||||||||||||
|
Hotel/Motel
|
$
|
108,055
|
10.7
|
%
|
53.2
|
%
|
1.94
|
|||||||||
|
Retail strip centers
|
79,925
|
7.9
|
51.5
|
1.66
|
||||||||||||
|
Gas station/auto repair
|
41,712
|
4.1
|
51.8
|
2.70
|
||||||||||||
|
Restaurant/fast food
|
14,867
|
1.5
|
57.3
|
1.45
|
||||||||||||
50
We have received, and continue to receive, inquiries and requests from borrowers for some type of payment relief due to the COVID-19 pandemic although the number of new requests have recently
slowed. These modifications were not classified as TDRs in accordance with the guidance of the CARES Act and subsequent bank regulatory guidance. The Company has made available the following short-term relief option to all borrowers affected by
COVID-19:
|
•
|
Interest only payments for up to 90 days;
|
|
•
|
Full payment deferrals for up to 90 days upon request with an extension for another 90 days upon submission of specified documentation and recovery plans;
|
|
•
|
Loan re-amortization, especially in cases where significant prepayments of principal have occurred and to provide for continuing payment reduction at the end of the 180-day deferment
period;
|
|
•
|
Covenant waivers and resets; and
|
|
•
|
Extension of up to six months on loans maturing prior to December 31, 2020.
|
All loans modified due to COVID-19 will be separately monitored and any request for continuation of relief beyond the initial modification will be reassessed at that time to determine if a further
modification should be granted and if a downgrade in risk rating is appropriate.
As of March 31, 2020, the Company had approved payment deferrals for ten commercial loans that were impacted by the COVID-19 pandemic totaling $36.2 million which consisted of deferral of
regularly scheduled principal and interest payments. As of March 31, 2020, the Bank had not received any requests for payment deferrals for consumer loans. As of May 31, 2020, the Bank had approved payment deferrals for 91 commercial loans that were
impacted by the COVID-19 pandemic totaling $145.8 million. In general, the payment deferral period for these loans was 90 days. Depending on economic conditions, extensions to the initial payment deferral periods may be necessary. The Bank has
received an additional 13 commercial loan modification requests totaling $25.3 million that are in the process of being completed. In addition, as of May 31, 2020, 42 consumer and mortgage loans totaling $10.1 million were approved for payment
deferrals. Furthermore, 20 mortgage loans serviced for FHLMC totaling $3.4 million were approved for payment deferrals.
The primary method of relief granted by the Company has been to allow the borrower to defer their loan payments for up to 90 days. After the deferral period, normal loan payments will continue,
however, payments will be applied first to interest until the deferred interest is repaid and thereafter applied to both principal and interest with any deficiency in amortized principal payments added to the balloon payment due at maturity. We
believe the steps we are taking are necessary to effectively manage our portfolio and assist our customers through the ongoing uncertainty surrounding the duration, impact and government response to the COVID-19 pandemic.
Branch Operations and Additional Customer Support – We have taken various steps to ensure the safety of our customers and our
personnel. Many of our employees are working remotely or have flexible work schedules, and we have established measures within our offices to help ensure the safety of those employees who must work on-site. The Family First Coronavirus Response Act
also provides additional flexibility to our employees to help navigate their individual challenges.
The COVID-19 pandemic has caused significant disruptions to our branch operations resulting in the implementation of various social distancing measures at the Company to address client and
community needs, including branch lobby closures. To ensure the safety of our customers and employees, services are offered through drive up facilities, ATMs, online banking, our call center operations and/or by appointment.
Critical Accounting Policies
The Company has established various accounting policies that govern the application of GAAP in the preparation of the Company’s Consolidated Financial Statements. The Company has identified
policies that due to judgments, estimates and assumptions inherent in those policies are critical to an understanding of the Company’s Consolidated Financial Statements. These policies relate to the methodology for the determination of the allowance
for loan losses, the valuation of investment securities, goodwill valuation and the calculation of income taxes. These policies and the judgments, estimates and assumptions are described in greater detail in the Notes to the Consolidated Financial
Statements contained in Item 8 of this Form 10-K. In particular, Note 1 of the Notes to Consolidated Financial Statements, “Summary of Significant Accounting Policies,” describes generally the Company’s accounting policies. Management believes that
the judgments, estimates and assumptions used in the preparation of the Company’s Consolidated Financial Statements are appropriate given the factual circumstances at the time. However, given the sensitivity of the Company’s Consolidated Financial
Statements to these critical accounting policies, the use of other judgments, estimates and assumptions could result in material differences in the Company’s results of operations or financial condition.
51
Operating Strategy
Fiscal year 2020 marked the 97th anniversary since the Bank began operations in 1923. The primary business strategy of the Company is to provide comprehensive banking and related
financial services within its primary market area. The historical emphasis had previously been on residential real estate lending. Since 1998, however, the Company has been diversifying its loan portfolio through the expansion of its commercial and
construction loan portfolios. At March 31, 2020, commercial and construction loans represented 90.42% of total loans. Commercial lending, including commercial real estate loans, typically has higher credit risk, greater interest margins and shorter
terms than residential lending which can increase the loan portfolio’s profitability.
The Company’s goal is to deliver returns to shareholders by increasing higher-yielding assets (in particular, commercial real estate and commercial business loans), increasing core deposit
balances, managing problem assets, reducing expenses, hiring experienced employees with a commercial lending focus and exploring expansion opportunities. The Company seeks to achieve these results by focusing on the following objectives:
Execution of our Business Plan. The Company is focused on increasing its loan portfolio, especially higher yielding commercial and construction
loans, and its core deposits by expanding its customer base throughout its primary market areas. By emphasizing total relationship banking, the Company intends to deepen the relationships with its customers and increase individual customer
profitability through cross-marketing programs, which allows the Company to better identify lending opportunities and services for customers. To build its core deposit base, the Company will continue to utilize additional product offerings,
technology and a focus on customer service in working toward this goal. The Company will also continue to seek to expand its franchise through de novo branches, the selective acquisition of individual branches, loan purchases and whole bank
transactions that meet its investment and market objectives. In this regard, the Company previously announced plans for three new branches located in Clark County, Washington, to complement its existing branch
network. A new branch in downtown Camas is scheduled to open this summer while our new location in the Cascade Park neighborhood of Vancouver is scheduled to open later this fall. A construction delay due to COVID-19 has pushed the opening of the
new branch location in Ridgefield to early 2021.
Maintaining Strong Asset Quality. The Company believes that strong asset quality is a key to long-term financial success. The Company has actively
managed delinquent loans and nonperforming assets by aggressively pursuing the collection of consumer debts, marketing saleable properties upon foreclosure or repossession, and through work-outs of classified assets and loan charge-offs. The
Company’s approach to credit management uses well defined policies and procedures and disciplined underwriting criteria resulting in our strong asset quality and credit metrics in fiscal year 2020. Although the Company intends to prudently increase
the percentage of its assets consisting of higher-yielding commercial real estate, real estate construction and commercial business loans, which offer higher risk-adjusted returns, shorter maturities and more sensitivity to interest rate
fluctuations, the Company intends to manage credit exposure through the use of experienced bankers in these areas and a conservative approach to its lending.
Implementation of a Profit Improvement Plan (“PIP”). The Company’s PIP committee is comprised of several members of management and the Board of
Directors to undertake several initiatives to reduce non-interest expense and continue its on-going efforts to identify cost saving opportunities throughout all aspects of the Company’s operations. The PIP committee’s mission is not only to find
additional cost saving opportunities but also to search for and implement revenue enhancements and additional areas for improvement. As a result, the Company has improved its efficiency ratio over the last several years from 98.0% at March 31, 2014
to 62.42% at March 31, 2020.
Introduction of New Products and Services. The Company continuously reviews new products and services to provide its customers more financial
options. All new technology and services are generally reviewed for business development and cost saving purposes. The Company continues to experience growth in customer use of its online banking services, where the Bank provides a full array of
traditional cash management products as well as online banking products including mobile banking, mobile deposit, bill pay, e-statements, and text banking. The products are tailored to meet the needs of small to medium size businesses and households
in the markets we serve. The Company launched a new online mortgage origination platform in June 2019. The Company intends to selectively add other products to further diversify revenue sources and to capture more of each customer’s banking
relationship by cross selling loan and deposit products and additional services, including services provided through the Trust Company to increase its fee income. Assets under management by the Trust Company totaled $1.2 billion and $646.0 million at
March 31, 2020 and March 31, 2019, respectively. The Company also offers a third-party identity theft product to its customers. The identity theft product assists our customers in monitoring their credit and includes an identity theft restoration
service.
52
Attracting Core Deposits and Other Deposit Products. The Company offers personal checking, savings and
money-market accounts, which generally are lower-cost sources of funds than certificates of deposit and are less likely to be withdrawn when interest rates fluctuate. To build its core deposit base, the Company has sought to reduce its dependence on
traditional higher cost deposits in favor of stable lower cost core deposits to fund loan growth and decrease its reliance on other wholesale funding sources, including FHLB and FRB advances. The Company believes that its continued focus on building
customer relationships will help to increase the level of core deposits and locally-based retail certificates of deposit. In addition, the Company intends to increase demand deposits by growing business banking relationships through expanded product
lines tailored to meet its target business customers’ needs. The Company maintains technology-based products to encourage the growth of lower cost deposits, such as personal financial management, business cash management, and business remote deposit
products, that enable it to meet its customers’ cash management needs and compete effectively with banks of all sizes. Core branch deposits increased $58.7 million at March 31, 2020 compared to March 31, 2019 reflecting the Company’s commitment to
increasing core deposits versus relying on wholesale funding. However, the Company continues to experience increased competition and pricing pressure for deposits.
Recruiting and Retaining Highly Competent Personnel with a Focus on Commercial Lending. The Company’s ability
to continue to attract and retain banking professionals with strong community relationships and significant knowledge of its markets will be a key to its success. The Company believes that it enhances its market position and adds profitable growth
opportunities by focusing on hiring and retaining experienced bankers focused on owner occupied commercial real estate and commercial lending, and the deposit balances that accompany these relationships. The Company emphasizes to its employees the
importance of delivering exemplary customer service and seeking opportunities to build further relationships with its customers. The goal is to compete with other financial service providers by relying on the strength of the Company’s customer
service and relationship banking approach. The Company believes that one of its strengths is that its employees are also shareholders through the Company’s employee stock ownership (“ESOP”) and 401(k) plans.
53
Comparison of Financial Condition at March 31, 2020 and 2019
Cash and cash equivalents, including interest-earning accounts, totaled $42.0 million at March 31, 2020 compared to $23.0 million at March 31, 2019. The increase in cash balances was primarily the
result of the increase in deposits. The Company’s cash balances fluctuate based upon funding needs, and the Company will deploy a portion of excess cash balances to purchase investment securities to earn higher yields than the nominal yield earned on
cash held in interest-earning accounts, based on the Company’s asset/liability management program and liquidity objectives in order to maximize earnings. As a part of this strategy, the Company has the ability to invest a portion of its excess cash
in short-term certificates of deposit held for investment. All of the certificates of deposit held for investment are fully insured by the FDIC. At March 31, 2020, certificates of deposits held for investment totaled $249,000 compared to $747,000 at
March 31, 2019.
Investment securities totaled $148.3 million and $178.3 million at March 31, 2020 and 2019, respectively. The decrease was due to the utilization of the cash proceeds from regular scheduled
investment securities repayments, pay downs, calls and maturities which were used to fund loan growth. During the fiscal year ended March 31, 2020, purchases of investment securities totaled $18.1 million which was partially offset by investment
sales totaling $17.8 million. The Company primarily purchases a combination of securities backed by government agencies (FHLMC, FNMA, SBA or GNMA). At March 31, 2020, the Company determined that none of its investment securities required an OTTI
charge. For additional information on the Company’s investment securities, see Note 3 of the Notes to the Consolidated Financial Statements contained in Item 8 of this Form 10-K.
Loans receivable, net, totaled $898.9 million at March 31, 2020, compared to $864.7 million at March 31, 2019, an increase of $34.2 million. The Company has had steady loan demand in its market
areas and anticipates continued organic loan growth, in particular through government sponsored lending programs initiated in response to the COVID-19 pandemic. The increase was mainly concentrated in commercial real estate loans which increased
$46.4 million or 10.1%. In addition, commercial business loans increased $16.2 million, or 10.0%, and multi-family loans increased $6.8 million, or 13.2%. Partially offsetting these increases were decreases in real estate construction loans of $26.0
million, or 28.7%, consumer loans of $5.0 million, or 5.5%, and land loans of $3.0 million, or 17.6%. Due to the timing of the completion of these real estate construction projects, balances may fluctuate in these categories. Once these projects are
completed, these loans will roll to permanent financing and be classified within a category under other real estate mortgage. The Company also purchases the guaranteed portion of SBA loans as a way to supplement loan originations, further diversify
its loan portfolio and earn a higher yield than earned on its cash or short-term investments. These SBA loans are originated through another financial institution located outside the Company’s primary market area. These loans are purchased with
servicing retained by the seller. At March 31, 2020, the Company’s purchased SBA loan portfolio was $74.8 million compared to $67.9 million at March 31, 2019. During the year ended March 31, 2020, the Bank purchased $17.3 million of SBA loans,
including premiums.
Goodwill was $27.1 million at March 31, 2020 and 2019. For additional information on our goodwill impairment testing, see "Goodwill Valuation" included in this Item 7.
Deposits increased $65.4 million to $990.4 million at March 31, 2020 compared to $925.1 million at March 31, 2019. The increase was due a concentrated effort by the Company to increase deposits.
The Company increased interest rates on certain deposit products to be more competitive in its market area. The Company had no wholesale-brokered deposits at March 31, 2020 and 2019. Core branch deposits accounted for 97.6% of total deposits at March
31, 2020 compared to 98.2% at March 31, 2019. The Company plans to continue its focus on core deposits and on building customer relationships as opposed to obtaining deposits through the wholesale markets.
The Bank had no FHLB advances at March 31, 2020 compared to $56.6 million at March 31, 2019. Based upon the increase in deposit balances, the Company was able to pay off its outstanding FHLB
balances during the second fiscal quarter of 2020. In the prior fiscal year, the outstanding advances were deployed to supplement the funding of loan originations and offset the decrease in deposit balances.
Shareholders' equity increased $15.7 million to $148.8 million at March 31, 2020 from $133.1 million at March 31, 2019. The increase was mainly attributable to net income of $15.7 million and an
increase in accumulated other comprehensive income related to unrealized holding loss on securities available for sale, net of tax, of $4.7 million for the fiscal year ended March 31, 2020. The increase was partially offset by cash dividends declared
of $4.3 million for the fiscal year ended March 31, 2020.
54
Goodwill Valuation
Goodwill is initially recorded when the purchase price paid for an acquisition exceeds the estimated fair value of the net identified tangible and intangible assets acquired. Goodwill is presumed
to have an indefinite useful life and is tested, at least annually, for impairment at the reporting unit level. The Company has two reporting units, the Bank and the Trust Company, for purposes of evaluating goodwill for impairment. All of the
Company’s goodwill has been allocated to the Bank reporting unit. The Company performs an annual review in the third quarter of each fiscal year, or more frequently if indications of potential impairment exist, to determine if the recorded goodwill
is impaired. If the fair value exceeds the carrying value, goodwill at the reporting unit level is not considered impaired and no additional analysis is necessary. If the carrying value of the reporting unit is greater than its fair value, there is
an indication that impairment may exist and additional analysis must be performed to measure the amount of impairment loss, if any. The amount of impairment is determined by comparing the implied fair value of the reporting unit’s goodwill to the
carrying value of the goodwill in the same manner as if the reporting unit was being acquired in a business combination. Specifically, the Company would allocate the fair value to all of the assets and liabilities of the reporting unit, including
unrecognized intangible assets, in a hypothetical analysis that would calculate the implied fair value of goodwill. If the implied fair value of goodwill is less than the recorded goodwill, the Company would record an impairment charge for the
difference.
A significant amount of judgment is involved in determining if an indicator of impairment has occurred. Such indicators may include, among others: a significant decline in our expected future cash
flows; a sustained, significant decline in our stock price and market capitalization; a significant adverse change in legal factors or in the business climate; adverse action or assessment by a regulator; and unanticipated competition. Any adverse
change in these factors could have a significant impact on the recoverability of these assets and could have a material impact on the Company’s consolidated financial statements.
The Company performed its annual goodwill impairment test as of October 31, 2019. The goodwill impairment test involves a two-step process. Step one of the goodwill impairment test estimates the
fair value of the reporting unit utilizing the allocation of corporate value approach, the income approach and the market approach in order to derive an enterprise value of the Company. The allocation of corporate value approach applies the aggregate
market value of the Company and divides it among the reporting units. A key assumption in this approach is the control premium applied to the aggregate market value. A control premium is utilized as the value of a company from the perspective of a
controlling interest is generally higher than the widely quoted market price per share. The Company used an expected control premium of 30%, which was based on comparable transactional history. The income approach uses a reporting unit’s projection
of estimated operating results and cash flows that are discounted using a rate that reflects current market conditions. The projection uses management’s best estimates of economic and market conditions over the projected period including growth rates
in loans and deposits, estimates of future expected changes in net interest margins and cash expenditures. Assumptions used by the Company in its discounted cash flow model (income approach) included an annual revenue growth rate that approximated
5.3%, a net interest margin that approximated 4.0% and a return on assets that ranged from 1.24% to 1.34% (average of 1.29%). In addition to utilizing the above projections of estimated operating results, key assumptions used to determine the fair
value estimate under the income approach were the discount rate of 15.54% utilized for our cash flow estimates and a terminal value estimated at 1.43 times the ending book value of the reporting unit. The Company used a build-up approach in
developing the discount rate that included: an assessment of the risk free interest rate, the rate of return expected from publicly traded stocks, the industry the Company operates in and the size of the Company. The market approach estimates fair
value by applying tangible book value multiples to the reporting unit’s operating performance. The multiples are derived from comparable publicly traded companies with similar operating and investment characteristics of the reporting unit. In
applying the market approach method, the Company selected four publicly traded comparable institutions. After selecting comparable institutions, the Company derived the fair value of the reporting unit by completing a comparative analysis of the
relationship between their financial metrics listed above and their market values utilizing a market multiple of 1.1 times tangible book value. The Company calculated a fair value of its reporting unit of $217.0 million using the corporate value
approach, $170.0 million using the income approach and $253.0 million using the market approach, with a final concluded value of $216.0 million, with equal weight given to the corporate value approach and market approach and slightly less weight
given to the income approach. The results of the Company’s step one test indicated that the reporting unit’s fair value was greater than its carrying value and therefore no impairment of goodwill exists.
55
Even though the Company determined that there was no goodwill impairment, a sustained decline in the value of its stock price as well as values of other financial institutions, declines in revenue
for the Company beyond our current forecasts, significant adverse changes in the operating environment for the financial industry or an increase in the value of our assets without an increase in the value of the reporting unit may result in a future
impairment charge.
It is possible that changes in circumstances existing at the measurement date or at other times in the future, or in the numerous estimates associated with management’s judgments, assumptions and
estimates made in assessing the fair value of our goodwill, could result in an impairment charge of a portion or all of our goodwill. If the Company recorded an impairment charge, its financial position and results of operations would be adversely
affected; however, such an impairment charge would have no impact on our liquidity, operations or regulatory capital.
As a result of the effects of the COVID-19 pandemic and its impacts on the financial markets and economy, the Company completed a qualitative assessment of goodwill and concluded that it is more
likely than not that the fair value of the Bank (the reporting unit), exceeds its carrying value at March 31, 2020. If adverse economic conditions or the recent decrease in the Company’s common stock price and market capitalization as a result of the
COVID-19 pandemic were sustained in the future rather than temporary, it may significantly affect the fair value of the reporting unit and may trigger future goodwill impairment charges. Any impairment charge could have a material adverse effect on
our results of operations and financial condition. However, such an impairment would not impact the Company’s liquidity, operations or regulatory capital.
Estimated Fair Value of Level 3 Assets
The Company determines the estimated fair value of certain assets that are classified as Level 3 under the fair value hierarchy established under GAAP. These Level 3 assets are
valued using significant unobservable inputs that are supported by little or no market activity and that are significant to the estimated fair value of the assets. These Level 3 assets are certain loans measured for impairment for which there is
neither an active market for identical assets from which to determine fair value, nor is there sufficient, current market information about similar assets to use as observable, corroborated data for all significant inputs in a valuation model. Under
these circumstances, the estimated fair values of these assets are determined using pricing models, discounted cash flow methodologies, appraisals, and other valuation methods in accordance with accounting standards, for which the determination of
fair value requires significant management judgment or estimation.
Valuations using models or other techniques are dependent upon assumptions used for the significant inputs. Where market data is available, the inputs used for valuation reflect that information
as of the valuation date. In periods of extreme volatility, lessened liquidity or in illiquid markets, there may be more variability in market pricing or a lack of market data to use in the valuation process. Judgment is then applied in formulating
those inputs.
Certain loans included in the loan portfolio were deemed impaired at March 31, 2020. Accordingly, loans measured for impairment were classified as Level 3 in the fair value hierarchy as there is
no active market for these loans. Measuring impairment of a loan requires judgment and estimates, and the eventual outcomes may differ from those estimates. Impairment was measured based on a number of factors, including recent independent appraisals
which are further reduced for estimated selling costs or by estimating the present value of expected future cash flows, discounted at the loan’s effective interest rate.
For additional information on our Level 1, 2 and 3 fair value measurements see Note 15 of the Notes to the Consolidated Financial Statements contained in Item 8 of this Form 10-K.
56
Comparison of Operating Results for the Years Ended March 31, 2020 and 2019
Net Income. Net income was $15.7 million, or $0.69 per diluted share, for the fiscal year ended March 31, 2020, compared to $17.3 million, or $0.76 per
diluted share, for the fiscal year ended March 31, 2019. The Company’s earnings for the year ended March 31, 2020 compared to last year decreased primarily due to the provision for loan losses of $1.3 million.
Increases occurred in both interest and non-interest income and were offset by increases in interest and non-interest expense compared to the respective prior year period. Additionally, a one-time $355,000 gain on sale of land and building related to
our Longview branch closure that occurred in the fiscal year ended March 31, 2019 and was recorded in non-interest expense, was not present in the current fiscal year ended March 31, 2020.
Net Interest Income. The Company’s profitability depends primarily on its net interest income, which is the difference between the income it receives on
interest-earning assets and the interest paid on deposits and borrowings. When the rate earned on interest-earning assets equals or exceeds the rate paid on interest-bearing liabilities, this positive interest rate spread will generate net interest
income. The Company’s results of operations are also significantly affected by general economic and competitive conditions, particularly changes in market interest rates, government legislation and regulation, and monetary and fiscal policies.
Net interest income for fiscal year 2020 decreased $1.3 million, or 2.81%, to $45.7 million compared to $47.1 million in fiscal year 2019. The net interest margin for the fiscal year ended March
31, 2020 was 4.26% compared to 4.45% for the prior fiscal year. This decrease in the net interest margin was primarily the result of the increase in the cost of interest- bearing deposits and to a lesser extent the decrease in the average yield on
net loans.
Interest and Dividend Income. Interest and dividend income increased slightly to $50.5 million for the fiscal year ended March 31, 2020 from $49.9 million
for the fiscal year ended March 31, 2019 due primarily to increases in interest from loans receivable of $898.9 million. This increase was due to higher average balances for loans receivable as compared to the prior fiscal year. The average balance
of net loans increased $40.4 million to $884.5 million for the fiscal year ended March 31, 2020 from $844.1 million for the prior fiscal year. The average yield on net loans was 5.25% for the fiscal year ended March 31, 2020 compared to 5.32% for the
prior fiscal year, reflecting the decreasing rate environment over the last fiscal year.
Interest Expense. Interest expense for the fiscal year ended March 31, 2020 totaled $4.8 million, a $1.9 million or 69.2% increase from $2.8 million for the
fiscal year ended March 31, 2019. The increase in interest expense was primarily the result of a 27 basis points increase in the weighted average interest rate on interest-bearing liabilities for the year ended March 31, 2020 compared to the prior
fiscal year. The weighted average interest rate on interest-bearing deposits increased to 0.43% for the fiscal year ended March 31, 2020 from 0.15% for the prior fiscal year. The weighted average interest rate on other interest-bearing liabilities
decreased to 3.78% for the fiscal year ended March 31, 2020 compared to 4.10% for the prior fiscal year. Interest expense on deposits increased $1.9 million due to the increase in the average cost of interest-bearing deposits primarily as a result of
the Company increasing the interest rates paid on certain deposit products due to increased competition and pricing pressures in the Company’s market area. The average balance of interest-bearing deposits increased $2.3 million to $676.5 million for
the fiscal year ended March 31, 2020 compared to $674.2 million for the fiscal year ended March 31, 2019.
Provision for Loan Losses. The provision for loan losses totaled $1.3 million and $50,000 for the fiscal years ended March 31, 2020 and 2019,
respectively. The increase in the provision for loan losses for the fiscal year 2020 was primarily due to the weakening economic conditions as a result of the COVID-19 pandemic and to a lesser extent, the overall increase in the loan portfolio. A
further decline in national and local economic conditions, as a result of the COVID-19 pandemic or other factors, could result in a material increase in the allowance for loan losses and may adversely affect the Company’s financial condition and
results of operations.
At March 31, 2020, the Company had an allowance for loan losses of $12.6 million, or 1.38% of total loans, compared to $11.5 million, or 1.31% at March 31, 2019. Net charge-offs for the year ended
March 31, 2020 were $83,000 compared to net recoveries of $641,000 for the year ended March 31, 2019. Net charge-offs to average net loans for the year ended March 31, 2020 was 0.01%. Net recoveries to average net loans for the year ended March 31,
2019 were (0.08)%.
57
Impaired loans are subjected to an impairment analysis to determine an appropriate reserve amount to be held against each loan. As of March 31, 2020, the Company had identified $5.2 million of
impaired loans. Because the significant majority of the impaired loans are collateral dependent, nearly all of the specific allowances are calculated based on the estimated fair value of the collateral. Of those impaired loans, $5.1 million have no
specific valuation allowance as their estimated net collateral value is equal to or exceeds the carrying amount of the loan, which in some cases is the result of previous loan charge-offs. The remaining $137,000 have specific valuation allowances
totaling $12,000. Charge-offs on these impaired loans totaled $83,000 from their original loan balances. Based on a comprehensive analysis, management deemed the allowance for loan losses adequate to cover probable losses inherent in the loan
portfolio at March 31, 2020. See Note 5 of the Notes to the Consolidated Financial Statements in Item 8 of this Form 10-K for additional information regarding the allowance for loan losses.
Non-Interest Income. Non-interest income increased $1.3 million to $12.4 million for the year ended March 31, 2020 from $11.1 million for fiscal year 2019.
The increase in non-interest income was primarily due to increases in fees and service charges, asset management fees and bank-owned life insurance of $593,000, $617,000, and $130,000, respectively. These increases were partially offset by a decrease
in net gains on sales of loans held for sale of $65,000 for the year ended March 31, 2020 compared to the prior fiscal year reflecting the decline in loans originated for sale.
Non-Interest Expense. Non-interest expense increased $564,000 to $36.3 million for the fiscal year ended March 31, 2020 compared to $35.7 million for the
fiscal year ended March 31, 2019. The increase for the fiscal year ended March 31, 2020 was due to an increase in occupancy and depreciation expense of $242,000, salaries and employee benefits of $485,000 and data processing of $162,000 for the year
ended March 31, 2020 compared to the prior fiscal year, due to additional staffing attributable to the overall growth of the Company and continued investments into enhancing our information technology infrastructure, including investments in our
digital product offerings. Offsetting these increases was a decrease in professional fees of $306,000 primarily due to and a decrease in FDIC insurance premiums of $245,000. The decrease in FDIC insurance premium expense is attributable to credits
for previously paid deposit insurance premiums which were a result of the FDIC exceeding its stated Deposit Insurance Fund Reserve Ratio. The Company has $44,000 in credits on future assessments remaining as of March 31, 2020, which may be recognized
in future periods when allowed for by the FDIC upon insurance fund levels being met. In addition, other non-interest expense increased $163,000 primarily due to the $355,000 gain on sale of land and building recognized in the last fiscal year with no
similar transaction occurring in the year ended March 31, 2020.
Income Taxes. The provision for income taxes was $4.8 million and $5.1 million for the fiscal years ended March 31, 2020 and 2019, respectively, primarily
reflecting lower pre-tax income. The effective tax rate was 23.5% for the year ended March 31, 2020 compared to 23.0% for the year ended March 31, 2019. At March 31, 2020, the Company had a deferred tax asset of
$3.3 million. As of March 31, 2020, management deemed that a deferred tax asset valuation allowance related to the Company’s deferred tax asset was not necessary. See Note 11 of the Notes to the Consolidated Financial Statements contained in Item 8
of this Form 10-K for further discussion of the Company’s income taxes.
58
Average Balance Sheet. The following table sets forth, for the periods indicated, information regarding average balances of assets and liabilities as well
as the total dollar amounts of interest income earned on average interest-earning assets and interest expense paid on average interest-bearing liabilities, resultant yields, interest rate spread, ratio of interest-earning assets to interest-bearing
liabilities and net interest margin. Average balances for a period have been calculated using monthly average balances during such period. Non-accruing loans were included in the average loan amounts outstanding. Loan fees, net, of $1.5 million,
$1.5 million and $1.4 million were included in interest income for the years ended March 31, 2020, 2019 and 2018, respectively.
|
Years Ended March 31,
|
|||||||||||||||||||||||||||||
|
2020
|
2019
|
2018
|
|||||||||||||||||||||||||||
|
Average
Balance
|
Interest
and
Dividends
|
Yield/
Cost
|
Average
Balance
|
Interest
and
Dividends
|
Yield/
Cost
|
Average
Balance
|
Interest
and
Dividends
|
Yield/
Cost
|
|||||||||||||||||||||
|
(Dollars in thousands)
|
|||||||||||||||||||||||||||||
|
Interest-earning assets:
|
|||||||||||||||||||||||||||||
|
Mortgage loans
|
$
|
695,930
|
$
|
37,721
|
5.42
|
%
|
$
|
663,225
|
$
|
36,476
|
5.50
|
%
|
$
|
629,153
|
$
|
32,268
|
5.13
|
%
|
|||||||||||
|
Non-mortgage loans
|
188,568
|
8,684
|
4.61
|
180,917
|
8,462
|
4.68
|
160,051
|
7,745
|
4.84
|
||||||||||||||||||||
|
Total net loans (1)
|
884,498
|
46,405
|
5.25
|
844,142
|
44,938
|
5.32
|
789,204
|
40,013
|
5.07
|
||||||||||||||||||||
|
Investment securities (2)
|
164,028
|
3,594
|
2.19
|
199,463
|
4,647
|
2.33
|
214,723
|
4,786
|
2.23
|
||||||||||||||||||||
|
Daily interest-earning assets
|
95
|
1
|
1.05
|
64
|
1
|
1.56
|
104
|
-
|
-
|
||||||||||||||||||||
|
Other earning assets
|
26,676
|
532
|
1.99
|
15,394
|
328
|
2.13
|
40,876
|
558
|
1.37
|
||||||||||||||||||||
|
Total interest-earning assets
|
1,075,297
|
50,532
|
4.70
|
1,059,063
|
49,914
|
4.71
|
1,044,907
|
45,357
|
4.34
|
||||||||||||||||||||
|
Non-interest-earning assets:
|
|||||||||||||||||||||||||||||
|
Office properties and equipment, net
|
15,830
|
15,485
|
15,888
|
||||||||||||||||||||||||||
|
Other non-interest-earning assets
|
74,591
|
66,142
|
71,648
|
||||||||||||||||||||||||||
|
Total assets
|
$
|
1,165,718
|
$
|
1,140,690
|
$
|
1,132,443
|
|||||||||||||||||||||||
|
Interest-bearing liabilities:
|
|||||||||||||||||||||||||||||
|
Savings accounts
|
$
|
189,207
|
$
|
1,054
|
0.56
|
%
|
$
|
136,720
|
$
|
145
|
0.11
|
%
|
$
|
132,376
|
$
|
133
|
0.10
|
%
|
|||||||||||
|
Interest checking accounts
|
180,969
|
100
|
0.06
|
180,256
|
101
|
0.06
|
170,124
|
100
|
0.06
|
||||||||||||||||||||
|
Money market accounts
|
194,061
|
229
|
0.12
|
252,202
|
302
|
0.12
|
275,092
|
335
|
0.12
|
||||||||||||||||||||
|
Certificates of deposit
|
112,282
|
1,507
|
1.34
|
105,049
|
448
|
0.43
|
136,370
|
640
|
0.47
|
||||||||||||||||||||
|
Total interest-bearing deposits
|
676,519
|
2,890
|
0.43
|
674,227
|
996
|
0.15
|
713,962
|
1,208
|
0.17
|
||||||||||||||||||||
|
Other interest-bearing liabilities
|
49,573
|
1,874
|
3.78
|
44,368
|
1,819
|
4.10
|
29,668
|
1,141
|
3.85
|
||||||||||||||||||||
|
Total interest-bearing liabilities
|
726,092
|
4,764
|
0.66
|
718,595
|
2,815
|
0.39
|
743,630
|
2,349
|
0.32
|
||||||||||||||||||||
|
Non-interest-bearing liabilities:
|
|||||||||||||||||||||||||||||
|
Non-interest-bearing deposits
|
284,748
|
289,707
|
264,128
|
||||||||||||||||||||||||||
|
Other liabilities
|
11,226
|
7,846
|
8,016
|
||||||||||||||||||||||||||
|
Total liabilities
|
1,022,066
|
1,016,148
|
1,015,774
|
||||||||||||||||||||||||||
|
Shareholders’ equity
|
143,652
|
124,542
|
116,669
|
||||||||||||||||||||||||||
|
Total liabilities and shareholders’ equity
|
$
|
1,165,718
|
$
|
1,140,690
|
$
|
1,132,443
|
|||||||||||||||||||||||
|
Net interest income
|
$
|
45,768
|
$
|
47,099
|
$
|
43,008
|
|||||||||||||||||||||||
|
Interest rate spread
|
4.04
|
%
|
4.32
|
%
|
4.02
|
%
|
|||||||||||||||||||||||
|
Net interest margin
|
4.26
|
%
|
4.45
|
%
|
4.12
|
%
|
|||||||||||||||||||||||
|
Ratio of average interest-earning assets
to average interest-bearing liabilities
|
148.09
|
%
|
147.38
|
%
|
140.51
|
%
|
|||||||||||||||||||||||
|
Tax-Equivalent Adjustment (3)
|
$
|
37
|
$
|
45
|
$
|
43
|
|||||||||||||||||||||||
|
(1) Includes non-accrual loans.
|
|||||||||||||||||||||||||||||
|
(2) For purposes of the computation of average yield on investment securities available for sale, historical cost balances were utilized; therefore, the yield information does not
give effect to changes in fair value that are reflected as a component of shareholders’ equity.
|
|||||||||||||||||||||||||||||
|
(3) Tax-equivalent adjustment relates to non-taxable investment interest income and preferred equity securities dividend income.
|
|||||||||||||||||||||||||||||
59
Rate/Volume Analysis
The following table sets forth the effects of changing rates and volumes on net interest income of the Company for the fiscal year ended March 31, 2020 compared to the fiscal year ended March 31,
2019, and the fiscal year ended March 31, 2019 compared to the fiscal year ended March 31, 2018. Information is provided with respect to: (i) effects on interest income attributable to changes in volume (changes in volume multiplied by prior rate);
(ii) effects on interest income attributable to changes in rate (changes in rate multiplied by prior volume); and (iii) changes in rate/volume (change in rate multiplied by change in volume). Variances that were insignificant have been allocated
based upon the percentage relationship of changes in volume and changes in rate to the total net change (in thousands). The changes noted in the table below include tax equivalent adjustments, and as a result, will not agree to the amounts reflected
on the Company’s consolidated statements of income for the categories that have been adjusted to reflect tax equivalent income.
|
Year Ended March 31,
|
||||||||||||||||||||||||
|
2020 vs. 2019
|
2019 vs. 2018
|
|||||||||||||||||||||||
|
Increase (Decrease) Due to
|
Increase (Decrease) Due to
|
|||||||||||||||||||||||
|
Total
|
||||||||||||||||||||||||
|
(Dollars in thousands)
|
Volume
|
Rate
|
Increase
(Decrease)
|
Volume
|
Rate
|
Total
Increase
|
||||||||||||||||||
|
Interest Income:
|
||||||||||||||||||||||||
|
Mortgage loans
|
$
|
1,781
|
$
|
(536
|
)
|
$
|
1,245
|
$
|
1,801
|
$
|
2,407
|
$
|
4,208
|
|||||||||||
|
Non-mortgage loans
|
351
|
(129
|
)
|
222
|
980
|
(263
|
)
|
717
|
||||||||||||||||
|
Investment securities (1)
|
(787
|
)
|
(266
|
)
|
(1,053
|
)
|
(349
|
)
|
210
|
(139
|
)
|
|||||||||||||
|
Daily interest-earning
|
-
|
-
|
-
|
-
|
1
|
1
|
||||||||||||||||||
|
Other earning assets
|
227
|
(23
|
)
|
204
|
(451
|
)
|
221
|
(230
|
)
|
|||||||||||||||
|
Total interest income
|
1,572
|
(954
|
)
|
618
|
1,981
|
2,576
|
4,557
|
|||||||||||||||||
|
Interest Expense:
|
||||||||||||||||||||||||
|
Savings accounts
|
78
|
831
|
909
|
3
|
9
|
12
|
||||||||||||||||||
|
Interest checking accounts
|
(1
|
)
|
-
|
(1
|
)
|
1
|
-
|
1
|
||||||||||||||||
|
Money market accounts
|
(73
|
)
|
-
|
(73
|
)
|
(33
|
)
|
-
|
(33
|
)
|
||||||||||||||
|
Certificates of deposit
|
33
|
1,026
|
1,059
|
(140
|
)
|
(52
|
)
|
(192
|
)
|
|||||||||||||||
|
Other interest-bearing liabilities
|
203
|
(148
|
)
|
55
|
600
|
78
|
678
|
|||||||||||||||||
|
Total interest expense
|
240
|
1,709
|
1,949
|
431
|
35
|
466
|
||||||||||||||||||
|
Net interest income
|
$
|
1,332
|
$
|
(2,663
|
)
|
$
|
(1,331
|
)
|
$
|
1,550
|
$
|
2,541
|
$
|
4,091
|
||||||||||
(1) Interest on municipal securities is presented on a fully tax-equivalent basis.
Asset and Liability Management
The Company's principal financial objective is to achieve long-term profitability while reducing its exposure to fluctuating market interest rates. The Company has sought to reduce the exposure of
its earnings to changes in market interest rates by attempting to manage the difference between asset and liability maturities and interest rates. The principal element in achieving this objective is to increase the interest rate sensitivity of the
Company's interest-earning assets and interest-bearing liabilities. Interest rate sensitivity increases by retaining portfolio loans with interest rates subject to periodic adjustment to market conditions and selling fixed-rate one-to-four family
mortgage loans with terms to maturity of more than 15 years. The Company relies on retail deposits as its primary source of funds. Management believes retail deposits reduce the effects of interest rate fluctuations because they generally represent a
stable source of funds. As part of its interest rate risk management strategy, the Company promotes transaction accounts and certificates of deposit with terms up to ten years.
The Company has adopted a strategy that is designed to maintain or improve the interest rate sensitivity of assets relative to its liabilities. The primary elements of this strategy involve: the
origination of adjustable rate loans; increasing commercial loans, consumer loans that are adjustable rate and other short-term loans as a portion of total net loans receivable because of their generally shorter terms and higher yields than other
one-to-four family residential mortgage loans; matching asset and liability maturities; investing in short-term securities; and selling most long term, fixed-rate, one-to-four family mortgage loan originations. The strategy for liabilities has been
to shorten the maturities for both deposits and borrowings. The longer-term objective is to increase the proportion of noninterest bearing demand deposits, low interest bearing demand deposits, money market accounts, and savings deposits relative to
certificates of deposit to reduce our overall cost of funds.
60
The Company's mortgage servicing activities provide additional protection from interest rate risk. The Company retains servicing rights on all mortgage loans sold. As market interest rates rise,
the fixed-rate loans held in the loan portfolio diminish in value. However, the value of the servicing loan portfolio tends to rise as market interest rates increase because borrowers tend not to prepay the underlying mortgages, thus providing an
interest rate risk hedge versus the fixed-rate loan portfolio. See "Item 1. Business – Lending Activities – Mortgage Loan Servicing."
Consumer loans, such as home equity lines of credit and installment loans, commercial loans and construction loans typically have shorter terms and higher yields than permanent residential
mortgage loans, and accordingly reduce the Company's exposure to fluctuations in interest rates. Adjustable interest rate loans totaled $491.7 million or 53.95% of total loans at March 31, 2020 as compared to $499.6 million or 57.02% at March 31,
2019. Although the Company has sought to originate adjustable rate loans, the ability to originate and purchase such loans depends to a great extent on market interest rates and borrowers' preferences. Particularly in lower interest rate
environments, borrowers often prefer to obtain fixed-rate loans. See Item 1. “Business - Lending Activities – Real Estate Construction " and “- Lending Activities - Consumer Lending."
The Company may also invest in short-term to medium-term U.S. Government securities as well as mortgage-backed securities issued or guaranteed by U.S. Government agencies. At March 31, 2020, the
combined investment portfolio carried at $148.3 million had an average life of 3.2 years. Adjustable rate mortgage-backed securities totaled $11.6 million at March 31, 2020 compared to $14.7 million at March 31, 2019. See Item 1. “Business –
Investment Activities" for additional information.
Liquidity and Capital Resources
Liquidity is essential to our business. The objective of the Bank’s liquidity management is to maintain ample cash flows to meet obligations for depositor withdrawals, to fund the borrowing needs
of loan customers, and to fund ongoing operations. Core relationship deposits are the primary source of the Bank’s liquidity. As such, the Bank focuses on deposit relationships with local consumer and business clients who maintain multiple accounts
and services at the Bank.
Liquidity management is both a short and long-term responsibility of the Company's management. The Company adjusts its investments in liquid assets based upon management's assessment of (i)
expected loan demand, (ii) projected loan sales, (iii) expected deposit flows, (iv) yields available on interest-bearing deposits and (v) its asset/liability management program objectives. Excess liquidity is invested generally in interest-bearing
overnight deposits and other short-term government and agency obligations. If the Company requires funds beyond its ability to generate them internally, it has additional diversified and reliable sources of funds with the FHLB, the FRB and other
wholesale facilities. These sources of funds may be used on a long or short-term basis to compensate for a reduction in other sources of funds or on a long-term basis to support lending activities.
The Company's primary sources of funds are customer deposits, proceeds from principal and interest payments on loans, proceeds from the sale of loans, maturing securities, FHLB advances and FRB
borrowings. While maturities and scheduled amortization of loans and securities are a predictable source of funds, deposit flows and prepayment of mortgage loans and mortgage-backed securities are greatly influenced by general interest rates,
economic conditions and competition. Management believes that its focus on core relationship deposits coupled with access to borrowing through reliable counterparties provides reasonable and prudent assurance that ample liquidity is available.
However, depositor or counterparty behavior could change in response to competition, economic or market situations or other unforeseen circumstances, which could have liquidity implications that may require different strategic or operational actions.
The Company must maintain an adequate level of liquidity to ensure the availability of sufficient funds for loan originations, deposit withdrawals and continuing operations, satisfy other
financial commitments and take advantage of investment opportunities. During the year ended March 31, 2020, the Bank used its sources of funds primarily to fund loan commitments. At March 31, 2020, cash and cash equivalents, certificates of deposit
held for investment and available for sale investment securities totaled $190.5 million, or 16.1% of total assets. The Bank generally maintains sufficient cash and short-term investments to meet short-term liquidity needs; however, its primary
liquidity practice is to manage short-term borrowings, including FRB borrowings and FHLB advances consistent with its asset/liability objectives. At March 31, 2020, the Bank had no advances from the FRB and had a borrowing capacity of $67.3 million
from the FRB, subject to sufficient collateral. At March 31, 2020, the Bank had no advances from the FHLB and had available borrowing capacity of $235.9 million, subject to sufficient collateral and stock investment. At March 31, 2020, the Bank had
sufficient unpledged collateral to allow it to utilize its available borrowing capacity from the FRB and the FHLB. Borrowing capacity may, however, fluctuate based on acceptability and risk rating of loan collateral and counterparties could adjust
discount rates applied to such collateral at their discretion.
61
An additional source of wholesale funding includes brokered certificates of deposit. While the Company has utilized brokered deposits from time to time, the Company historically has not
extensively relied on brokered deposits to fund its operations. At March 31, 2020 and 2019, the Bank had no wholesale brokered deposits. The Bank also participates in the CDARS and ICS deposit products, which allow the Company to accept deposits in
excess of the FDIC insurance limit for a depositor and obtain “pass-through” insurance for the total deposit. The Bank’s CDARS and ICS balances were $5.3 million, or 0.54% of total deposits, and $14.5 million, or 1.6% of total deposits, at March 31,
2020 and 2019, respectively. In addition, the Bank is enrolled in an internet deposit listing service. Under this listing service, the Bank may post time deposit rates on an internet site where institutional investors have the ability to deposit
funds with the Bank. At March 31, 2020 and 2019, the Company had no deposits through this listing service. Although the Company did not originate any internet based deposits during the year ended March 31, 2020, the Company may do so in the future
consistent with its asset/liability objectives. The combination of all the Bank’s funding sources gives the Bank available liquidity of $676.0 million, or 57.2% of total assets at March 31, 2020.
At March 31, 2020, the Company had total commitments of $160.7 million, which includes commitments to extend credit of $35.8 million, unused lines of credit totaling $98.9 million, undisbursed
construction loans totaling $24.0 million, and standby letters of credit totaling $2.0 million. The Company anticipates that it will have sufficient funds available to meet current loan commitments. Certificates of deposit that are scheduled to
mature in less than one year from March 31, 2020 totaled $74.1 million. Historically, the Bank has been able to retain a significant amount of its deposits as they mature. Offsetting these cash outflows are scheduled loan maturities of less than one
year totaling $55.1 million at March 31, 2020.
Riverview Bancorp, Inc., as a separate legal entity from the Bank, must provide for its own liquidity. Sources of capital and liquidity for Riverview Bancorp, Inc. include distributions from the
Bank and the issuance of debt or equity securities. Dividends and other capital distributions from the Bank are subject to regulatory notice. At March 31, 2020, Riverview Bancorp, Inc. had $10.3 million in cash to meet its liquidity needs.
Effect of Inflation and Changing Prices
The Consolidated Financial Statements and related financial data presented herein have been prepared in accordance with GAAP, which require the measurement of financial position and operating
results in terms of historical dollars without considering the change in the relative purchasing power of money over time due to inflation. The primary impact of inflation is reflected in the increased cost of the Company's operations. Unlike most
industrial companies, virtually all the assets and liabilities of a financial institution are monetary in nature. As a result, interest rates generally have a more significant impact on a financial institution's performance than do general levels of
inflation. Interest rates do not necessarily move in the same direction or to the same extent as the prices of goods and services.
New Accounting Pronouncements
For a discussion of new accounting pronouncements and their impact on the Company, see Note 1 of the Notes to the Consolidated Financial Statements included in Item 8 of this Form 10-K.
Litigation
The Company is periodically a party to litigation arising in the ordinary course of business. In the opinion of management, these actions will not have a material adverse
effect, if any, on the Company’s future financial position, results of operations, or liquidity. The Bank has entered into employment contracts with certain key employees, which provide for contingent payment subject to future events.
62
Off-Balance Sheet Arrangements
The Company is a party to financial instruments with off-balance sheet risk in the normal course of business to meet the financing needs of its customers. These financial instruments generally
include commitments to originate mortgage, commercial and consumer loans. Those instruments involve, to varying degrees, elements of credit and interest rate risk in excess of the amount recognized in the consolidated balance sheets. The Company’s
maximum exposure to credit loss in the event of nonperformance by the borrower is represented by the contractual amount of those instruments. The Company uses the same credit policies in making commitments as it does for on-balance sheet instruments.
Commitments to originate loans are conditional and are honored for up to 45 days subject to the Company’s usual terms and conditions. Collateral is not required to support commitments.
At March 31, 2020, the Company had commercial loan commitments of $15.9 million and undisbursed commercial lines of credit of $73.3 million. Commercial real estate mortgage loan commitments
totaled $323,000 and the undisbursed balance of commercial real estate mortgage loans was $987,000 at March 31, 2020. At March 31, 2020, construction loan commitments totaled $16.9 million and undisbursed construction loans totaled $24.0 million.
Land development loan commitments at March 31, 2020, totaled $550,000 and the unused lines of credit secured by land development loans totaled $1.7 million. Real estate one-to-four family loan commitments totaled $2.1 million and unused lines of
credit secured by real estate one-to-four family loans totaled $18.6 million at March 31, 2020. Unused lines of credit on other installment loans totaled $1.1 million and unused lines of credit secured by multi-family real estate totaled $3.1 million
at March 31, 2020. At March 31, 2020, the Company had standby letters of credit totaling $2.0 million. For additional information regarding future financial commitments, this discussion and analysis should be read in conjunction with Note 17 of the
Notes to the Consolidated Financial Statements contained in Item 8 of this Form 10-K.
63
Item 7A. Quantitative and Qualitative Disclosures About Market Risk
Our financial condition and operations are influenced significantly by general economic conditions, including the absolute level of interest rates as well as changes in interest rates and the
slope of the yield curve. Our profitability is dependent to a large extent on our net interest income, which is the difference between the interest received from our interest-earning assets and the interest expense incurred on our interest-bearing
liabilities. Our activities, like all financial institutions, inherently involve the assumption of interest rate risk. Interest rate risk is the risk that changes in market interest rates will have an adverse
impact on the institution’s earnings and underlying economic value. Interest rate risk is determined by the maturity and repricing characteristics of an institution’s assets, liabilities and off-balance-sheet contracts. Interest rate risk is measured
by the variability of financial performance and economic value resulting from changes in interest rates. Interest rate risk is the primary market risk affecting our financial performance.
Our Asset/Liability Management Committee (“ALCO”) is responsible for monitoring and reviewing asset/liability processes and interest rate risk exposure to determine the level of risk appropriate
given our operating environment, business plan strategies, performance objectives, capital and liquidity constraints, and asset and liability allocation alternatives; and to manage our interest rate risk consistent with regulatory guidelines and
policies approved by the Board of Directors. Through such management, we seek to reduce the vulnerability of our earnings and capital position to changes in the level of interest rates. Our actions in this regard are taken under the guidance of the
ALCO, which is comprised of members of our senior management. The ALCO closely monitors our interest sensitivity exposure, asset and liability allocation decisions, liquidity and capital positions, and local and national economic conditions and
attempts to structure the loan and investment portfolios and funding sources to maximize earnings within acceptable risk tolerances.
The Company does not maintain a trading account for any class of financial instrument nor does it engage in hedging activities or purchase high-risk derivative instruments. Furthermore, the
Company is not subject to foreign currency exchange rate risk or commodity price risk. For information regarding the sensitivity to interest rate risk of the Company's interest-earning assets and interest-bearing liabilities, see the tables under
Item 1. “Business – Lending Activities,” “– Investment Activities” and “– Deposit Activities and Other Sources of Funds”.
The Company's principal financial objective is to achieve long-term profitability while limiting its exposure to fluctuating market interest rates. The Company intends to reduce risk where
appropriate but accepts a degree of risk when warranted by economic circumstances. The Company has sought to reduce the exposure of its earnings to changes in market interest rates by attempting to manage the mismatch between asset and liability
maturities and interest rates. The principal element in achieving this objective is to increase the interest rate sensitivity of the Company's interest-earning assets by retaining in its loan portfolio, short–term loans and loans with interest rates
subject to periodic adjustments.
Consumer and commercial loans are originated and held in the loan portfolio as the short-term nature of these portfolio loans match durations more closely with the short-term nature of retail
deposits such as interest checking, money market accounts and savings accounts. The Company relies on retail deposits as its primary source of funds. Management believes retail deposits reduce the effects of interest rate fluctuations because they
generally represent a more stable source of funds. As part of its interest rate risk management strategy, the Company promotes transaction accounts and certificates of deposit with longer terms to maturity. Except for immediate short-term cash needs,
and depending on the current interest rate environment, FHLB advances will have short or long-term maturities. FRB borrowings have short-term maturities. For additional information, see Item 7. “Management's Discussion and Analysis of Financial
Condition and Results of Operations" contained herein.
A number of measures are utilized to monitor and manage interest rate risk, including simulation modeling and traditional interest rate gap analysis. While both methods provide an indication of
risk for a given change in interest rates, the simulation model is primarily used to assess the impact on earnings that changes in interest rates may produce. Key assumptions in the model include cash flows and maturities of financial instruments,
changes in market conditions, loan volumes and pricing, deposit sensitivity, consumer preferences and management’s capital leverage plans. These assumptions are inherently uncertain; therefore, the model cannot precisely estimate net interest income
or precisely predict the impact of higher or lower interest rates on net interest income. Actual results may significantly differ from simulated results due to timing, magnitude and frequency of interest rate changes and changes in market conditions
and specific strategies among other factors.
64
The following table shows the approximate percentage change in net interest income as of March 31, 2020 over a 12 and 24-month period under several rate scenarios:
|
Change in interest rates (1)
|
Percent change in net
interest income (12 months)
|
Percent change in net
interest income (24 months)
|
||
|
Up 300 basis points
|
(2.4)%
|
3.3%
|
||
|
Up 200 basis points
|
(1.3)%
|
1.1%
|
||
|
Up 100 basis points
|
(0.3)%
|
(1.4)%
|
||
|
Base case
|
-
|
(4.6)%
|
||
|
Down 100 basis points
|
0.9%
|
(3.7)%
|
||
|
(1) The target federal funds rate as of March 31, 2020 was between 0.00% - 0.25%. No rates in this model are allowed to go below zero and
therefore a down 200 and down 300 basis point scenario would not be plausible.
|
||||
Our consolidated balance sheet continues to be slightly asset sensitive, meaning that interest-earning assets reprice faster than interest-bearing liabilities in a given period. However, due to a
number of loans in our loan portfolio with interest rate floors, our net interest income will be negatively impacted in a rising interest rate environment until such time as the current rate exceeds these interest rate floors. Net interest income
will increase in year two as our interest-earning assets are expected to continue to reprice faster than interest-bearing liabilities. In a falling interest rate environment over a shorter duration, these interest rate floors coupled with the ability
to be able to decrease deposit costs will assist in maintaining our net interest income. However, in a falling interest rate environment over a longer duration, our net interest income will be negatively impacted as our deposit costs are currently
relatively low and interest rates paid cannot decrease significantly. We attempt to limit our interest rate risk through managing the repricing characteristics of our assets and liabilities.
As with any method of measuring interest rate risk, certain shortcomings are inherent in the method of analysis presented in the foregoing table. For example, although certain assets and
liabilities may have similar maturities or periods of repricing, they may react in different degrees to changes in market interest rates. Also, the interest rates on certain types of assets and liabilities may fluctuate in advance of changes in
market interest rates, while interest rates on other types may lag behind changes in market rates. Additionally, certain assets, such as ARM loans, have features that restrict changes in interest rates on a short-term basis and over the life of the
asset. Furthermore, in the event of a change in interest rates, expected rates of prepayments on loans and early withdrawals from certificates could deviate significantly from those assumed in calculating the table.
The following table shows the Company's financial instruments that are sensitive to changes in interest rates, categorized by expected maturity, and the instruments' fair values at March 31, 2020.
Market risk sensitive instruments are generally defined as on- and off-balance sheet derivatives and other financial instruments (dollars in thousands).
|
Average
Rate
|
Within
1 Year
|
After
1 - 3
Years
|
After
3 - 5
Years
|
After
5 - 10
Years
|
Beyond
10
Years
|
Total
|
||||||||||||||||||||||
|
Interest-Sensitive Assets:
|
||||||||||||||||||||||||||||
|
Loans receivable
|
4.69
|
%
|
$
|
55,068
|
$
|
55,179
|
$
|
72,713
|
$
|
495,061
|
$
|
233,488
|
$
|
911,509
|
||||||||||||||
|
Investment securities and other
|
||||||||||||||||||||||||||||
|
interest-earning assets
|
1.83
|
35,930
|
2,831
|
4,647
|
35,416
|
97,610
|
176,434
|
|||||||||||||||||||||
|
FHLB stock
|
5.46
|
284
|
568
|
568
|
-
|
-
|
1,420
|
|||||||||||||||||||||
|
Total assets
|
$
|
91,282
|
$
|
58,578
|
$
|
77,928
|
$
|
530,477
|
$
|
331,098
|
$
|
1,089,363
|
||||||||||||||||
|
Interest-Sensitive Liabilities:
|
||||||||||||||||||||||||||||
|
Interest checking
|
0.06
|
$
|
37,560
|
$
|
75,119
|
$
|
75,119
|
$
|
-
|
$
|
-
|
$
|
187,798
|
|||||||||||||||
|
Savings accounts
|
0.48
|
45,376
|
90,752
|
90,752
|
-
|
-
|
226,880
|
|||||||||||||||||||||
|
Money market accounts
|
0.12
|
33,960
|
67,919
|
67,919
|
-
|
-
|
169,798
|
|||||||||||||||||||||
|
Certificate accounts
|
1.68
|
74,078
|
54,882
|
4,983
|
982
|
16
|
134,941
|
|||||||||||||||||||||
|
FHLB advances
|
-
|
-
|
-
|
-
|
-
|
-
|
-
|
|||||||||||||||||||||
|
Subordinated debentures
|
2.43
|
-
|
-
|
-
|
-
|
27,836
|
27,836
|
|||||||||||||||||||||
|
Finance lease liability
|
7.16
|
40
|
100
|
130
|
481
|
1,618
|
2,369
|
|||||||||||||||||||||
|
Total liabilities
|
191,014
|
288,772
|
238,903
|
1,463
|
29,470
|
749,622
|
||||||||||||||||||||||
|
Interest sensitivity gap
|
(99,732
|
)
|
(230,194
|
)
|
(160,975
|
)
|
529,014
|
301,628
|
$
|
339,741
|
||||||||||||||||||
|
Cumulative interest sensitivity gap
|
$
|
(99,732
|
)
|
$
|
(329,926
|
)
|
$
|
(490,901
|
)
|
$
|
38,113
|
$
|
339,741
|
|||||||||||||||
|
Off-Balance Sheet Items:
|
||||||||||||||||||||||||||||
|
Commitments to extend credit
|
$
|
35,797
|
$
|
-
|
$
|
-
|
$
|
-
|
$
|
-
|
$
|
35,797
|
||||||||||||||||
|
Unused lines of credit
|
$
|
122,840
|
$
|
-
|
$
|
-
|
$
|
-
|
$
|
-
|
$
|
122,840
|
||||||||||||||||
65
Item 8. Financial Statements and Supplementary Data
RIVERVIEW BANCORP, INC. AND SUBSIDIARY
Consolidated Financial Statements for the Years Ended March 31, 2020, 2019 and 2018
Report of Independent Registered Public Accounting Firm
|
TABLE OF CONTENTS
|
|
|
Page
|
|
|
Report of Independent Registered Public Accounting Firm
|
67
|
|
Consolidated Balance Sheets as of March 31, 2020 and 2019
|
68
|
|
Consolidated Statements of Income for the Years Ended March 31, 2020, 2019 and 2018
|
69
|
|
Consolidated Statements of Comprehensive Income for the Years Ended March 31, 2020, 2019 and 2018
|
70
|
|
Consolidated Statements of Shareholders’ Equity for the Years Ended March 31, 2020, 2019 and 2018
|
71
|
|
Consolidated Statements of Cash Flows for the Years Ended March 31, 2020, 2019 and 2018
|
72
|
|
Notes to Consolidated Financial Statements
|
73
|
66

Report of Independent Registered Public Accounting Firm
To the Board of Directors and Shareholders of
Riverview Bancorp, Inc.
Riverview Bancorp, Inc.
Opinion on the Financial Statements
We have audited the accompanying consolidated balance sheets of Riverview Bancorp, Inc. and Subsidiary (collectively, "the Company") as of March 31, 2020 and 2019, and the
related consolidated statements of income, comprehensive income, shareholders' equity, and cash flows for each of the years in the three-year period ended March 31, 2020, and the related notes (collectively referred to as "the financial statements").
In our opinion, the financial statements present fairly, in all material respects, the financial position of the Company as of March 31, 2020 and 2019, and the results of its operations and its cash flows for each of the years in the three-year
period ended March 31, 2020, in conformity with accounting principles generally accepted in the United States of America (U.S.).
Basis for Opinion
These financial statements are the responsibility of the Company's management. Our responsibility is to express an opinion on the Company's financial statements based on our
audits. We are a public accounting firm registered with the Public Company Accounting Oversight Board (United States) (PCAOB) and are required to be independent with respect to the Company in accordance with the U.S. federal securities laws and the
applicable rules and regulations of the Securities and Exchange Commission and the PCAOB.
We conducted our audits in accordance with the standards of the PCAOB. Those standards require that we plan and perform the audit to obtain reasonable assurance about whether
the financial statements are free of material misstatement, whether due to error or fraud. The Company is not required to have, nor were we engaged to perform, an audit of its internal control over financial reporting. As part of our audits, we are
required to obtain an understanding of internal control over financial reporting, but not for the purpose of expressing an opinion on the effectiveness of the Company's internal control over financial reporting. Accordingly, we express no such
opinion.
Our audits included performing procedures to assess the risks of material misstatement of the financial statements, whether due to error or fraud, and performing procedures
that respond to those risks. Such procedures included examining, on a test basis, evidence regarding the amounts and disclosures in the financial statements. Our audits also included evaluating the accounting principles used and significant estimates
made by management, as well as evaluating the overall presentation of the financial statements. We believe that our audits provide a reasonable basis for our opinion.
We have served as the Company's auditor since 2015.
Lake Oswego, Oregon
June 17, 2020
67
RIVERVIEW BANCORP, INC. AND SUBSIDIARY
CONSOLIDATED BALANCE SHEETS
AS OF MARCH 31, 2020 AND 2019
|
(In thousands, except share and per share data)
|
2020
|
2019
|
||||
|
ASSETS
|
||||||
|
Cash and cash equivalents (including interest-earning accounts of $27,866 and $5,844)
|
$
|
41,968
|
$
|
22,950
|
||
|
Certificates of deposit held for investment
|
249
|
747
|
||||
|
Loans held for sale
|
275
|
909
|
||||
|
Investment securities:
|
||||||
|
Available for sale, at estimated fair value
|
148,291
|
178,226
|
||||
|
Held to maturity, at amortized cost (estimated fair value of $28 and $35)
|
28
|
35
|
||||
|
Loans receivable (net of allowance for loan losses of $12,624 and $11,457)
|
898,885
|
864,659
|
||||
|
Prepaid expenses and other assets
|
7,452
|
4,596
|
||||
|
Accrued interest receivable
|
3,704
|
3,919
|
||||
|
Federal Home Loan Bank (“FHLB”) stock, at cost
|
1,420
|
3,644
|
||||
|
Premises and equipment, net
|
17,078
|
15,458
|
||||
|
Deferred income taxes, net
|
3,277
|
4,195
|
||||
|
Mortgage servicing rights, net
|
191
|
296
|
||||
|
Goodwill
|
27,076
|
27,076
|
||||
|
Core deposit intangible (“CDI”), net
|
759
|
920
|
||||
|
Bank owned life insurance (“BOLI”)
|
30,155
|
29,291
|
||||
|
TOTAL ASSETS
|
$
|
1,180,808
|
$
|
1,156,921
|
||
|
LIABILITIES AND SHAREHOLDERS’ EQUITY
|
||||||
|
LIABILITIES:
|
||||||
|
Deposits
|
$
|
990,448
|
$
|
925,068
|
||
|
Accrued expenses and other liabilities
|
11,783
|
12,536
|
||||
|
Advance payments by borrowers for taxes and insurance
|
703
|
631
|
||||
|
FHLB advances
|
-
|
56,586
|
||||
|
Junior subordinated debentures
|
26,662
|
26,575
|
||||
|
Finance lease liability
|
2,369
|
2,403
|
||||
|
Total liabilities
|
1,031,965
|
1,023,799
|
||||
|
COMMITMENTS AND CONTINGENCIES (See Note 17)
|
||||||
|
SHAREHOLDERS’ EQUITY:
|
||||||
|
Serial preferred stock, $.01 par value; 250,000 shares authorized; issued and outstanding: none
|
-
|
-
|
||||
|
Common stock, $.01 par value; 50,000,000 shares authorized
|
||||||
|
March 31, 2020 – 22,748,385 shares issued and 22,544,285 shares outstanding
|
225
|
226
|
||||
|
March 31, 2019 – 22,607,712 shares issued and outstanding
|
||||||
|
Additional paid-in capital
|
64,649
|
65,094
|
||||
|
Retained earnings
|
81,870
|
70,428
|
||||
|
Accumulated other comprehensive income (loss)
|
2,099
|
(2,626
|
)
|
|||
|
Total shareholders’ equity
|
148,843
|
133,122
|
||||
|
TOTAL LIABILITIES AND SHAREHOLDERS’ EQUITY
|
$
|
1,180,808
|
$
|
1,156,921
|
See accompanying notes to consolidated financial statements.
68
RIVERVIEW BANCORP, INC. AND SUBSIDIARY
CONSOLIDATED STATEMENTS OF INCOME
FOR THE YEARS ENDED MARCH 31, 2020, 2019 AND 2018
|
(In thousands, except share and per share data)
|
2020
|
2019
|
2018
|
||||||||
|
INTEREST AND DIVIDEND INCOME:
|
|||||||||||
|
Interest and fees on loans receivable
|
$
|
46,405
|
$
|
44,938
|
$
|
40,013
|
|||||
|
Interest on investment securities – taxable
|
3,440
|
4,456
|
4,648
|
||||||||
|
Interest on investment securities – nontaxable
|
117
|
146
|
95
|
||||||||
|
Other interest and dividends
|
533
|
329
|
558
|
||||||||
|
Total interest and dividend income
|
50,495
|
49,869
|
45,314
|
||||||||
|
INTEREST EXPENSE:
|
|||||||||||
|
Interest on deposits
|
2,890
|
996
|
1,208
|
||||||||
|
Interest on borrowings
|
1,874
|
1,819
|
1,141
|
||||||||
|
Total interest expense
|
4,764
|
2,815
|
2,349
|
||||||||
|
Net interest income
|
45,731
|
47,054
|
42,965
|
||||||||
|
Provision for loan losses
|
1,250
|
50
|
-
|
||||||||
|
Net interest income after provision for loan losses
|
44,481
|
47,004
|
42,965
|
||||||||
|
NON-INTEREST INCOME:
|
|||||||||||
|
Fees and service charges
|
6,541
|
5,948
|
5,425
|
||||||||
|
Asset management fees
|
4,408
|
3,791
|
3,448
|
||||||||
|
Net gains on sales of loans held for sale
|
252
|
317
|
641
|
||||||||
|
BOLI
|
864
|
734
|
819
|
||||||||
|
Other, net
|
295
|
317
|
317
|
||||||||
|
Total non-interest income, net
|
12,360
|
11,107
|
10,650
|
||||||||
|
NON-INTEREST EXPENSE:
|
|||||||||||
|
Salaries and employee benefits
|
22,805
|
22,320
|
21,743
|
||||||||
|
Occupancy and depreciation
|
5,576
|
5,334
|
5,454
|
||||||||
|
Data processing
|
2,629
|
2,467
|
2,313
|
||||||||
|
Amortization of CDI
|
161
|
183
|
232
|
||||||||
|
Advertising and marketing
|
856
|
769
|
747
|
||||||||
|
FDIC insurance premium
|
81
|
326
|
476
|
||||||||
|
State and local taxes
|
675
|
651
|
605
|
||||||||
|
Telecommunications
|
327
|
353
|
417
|
||||||||
|
Professional fees
|
1,120
|
1,426
|
1,181
|
||||||||
|
Other
|
2,033
|
1,870
|
2,450
|
||||||||
|
Total non-interest expense
|
36,263
|
35,699
|
35,618
|
||||||||
|
INCOME BEFORE INCOME TAXES
|
20,578
|
22,412
|
17,997
|
||||||||
|
PROVISION FOR INCOME TAXES
|
4,830
|
5,146
|
7,755
|
||||||||
|
NET INCOME
|
$
|
15,748
|
$
|
17,266
|
$
|
10,242
|
|||||
|
Earnings per common share:
|
|||||||||||
|
Basic
|
$
|
0.70
|
$
|
0.76
|
$
|
0.45
|
|||||
|
Diluted
|
0.69
|
0.76
|
0.45
|
||||||||
|
Weighted average number of common shares outstanding:
|
|||||||||||
|
Basic
|
22,642,795
|
22,588,395
|
22,531,480
|
||||||||
|
Diluted
|
22,698,415
|
22,659,594
|
22,623,455
|
See accompanying notes to consolidated financial statements.
RIVERVIEW BANCORP, INC. AND SUBSIDIARY
69
RIVERVIEW BANCORP, INC. AND SUBSIDIARY
CONSOLIDATED STATEMENTS OF COMPREHENSIVE INCOME
FOR THE YEARS ENDED MARCH 31, 2020, 2019 AND 2018
|
(In thousands)
|
2020
|
2019
|
2018
|
||||||||
|
Net income
|
$
|
15,748
|
$
|
17,266
|
$
|
10,242
|
|||||
|
Other comprehensive income (loss):
|
|||||||||||
|
Net unrealized holding gain (loss) from available for sale investment securities arising
|
|||||||||||
|
during the period, net of tax of ($1,499), ($629) and $871, respectively
|
4,748
|
2,122
|
(2,719
|
)
|
|||||||
|
Reclassification adjustment of net gain from sale of available for sale investment
|
|||||||||||
|
securities included in income, net of tax of $7, $0 and $0, respectively
|
(23
|
)
|
-
|
-
|
|||||||
|
Total other comprehensive income (loss), net
|
4,725
|
2,122
|
(2,719
|
)
|
|||||||
|
Total comprehensive income, net
|
$
|
20,473
|
$
|
19,388
|
$
|
7,523
|
|||||
See accompanying notes to consolidated financial statements.
70
CONSOLIDATED STATEMENTS OF SHAREHOLDERS’ EQUITY
84
FOR THE YEARS ENDED MARCH 31, 2020, 2019 AND 2018
|
(In thousands, except share and per share data)
|
Common Stock
|
|
|
Unearned
Shares
Issued to
Employee
Stock
|
Accumulated
|
Total
|
||||||||||||||||
|
Shares
|
Amount
|
Additional
Paid-In
Capital
|
Retained
Earnings
|
Ownership
Plan
(“ESOP”)
|
Other
Comprehensive
Income (Loss)
|
|||||||||||||||||
|
Balance April 1, 2017
|
22,510,890
|
$
|
225
|
$
|
64,468
|
$
|
48,335
|
$
|
(77
|
)
|
$
|
(1,687)
|
$
|
111,264
|
||||||||
|
Net income
|
-
|
-
|
-
|
10,242
|
-
|
-
|
10,242
|
|||||||||||||||
|
Cash dividend on common stock ($0.105 per share)
|
-
|
-
|
-
|
(2,367
|
)
|
-
|
-
|
(2,367
|
)
|
|||||||||||||
|
Exercise of stock options
|
59,289
|
1
|
244
|
-
|
-
|
-
|
245
|
|||||||||||||||
|
Stock-based compensation expense
|
-
|
-
|
88
|
-
|
-
|
-
|
88
|
|||||||||||||||
|
Reclassification of certain stranded income tax effects as
a result of change in federal corporate income tax rate
|
-
|
-
|
-
|
342
|
-
|
(342
|
)
|
-
|
||||||||||||||
|
Earned ESOP shares
|
-
|
-
|
71
|
-
|
77
|
-
|
148
|
|||||||||||||||
|
Other comprehensive loss, net
|
-
|
-
|
-
|
-
|
-
|
(2,719
|
)
|
(2,719
|
)
|
|||||||||||||
|
Balance March 31, 2018
|
22,570,179
|
226
|
64,871
|
56,552
|
-
|
(4,748)
|
116,901
|
|||||||||||||||
|
Net income
|
-
|
-
|
-
|
17,266
|
-
|
-
|
17,266
|
|||||||||||||||
|
Cash dividend on common stock ($0.15 per share)
|
-
|
-
|
-
|
(3,390
|
)
|
-
|
-
|
(3,390
|
)
|
|||||||||||||
|
Exercise of stock options
|
37,533
|
-
|
179
|
-
|
-
|
-
|
179
|
|||||||||||||||
|
Stock-based compensation expense
|
-
|
-
|
44
|
-
|
-
|
-
|
44
|
|||||||||||||||
|
Other comprehensive income, net
|
-
|
-
|
-
|
-
|
-
|
2,122
|
2,122
|
|||||||||||||||
|
Balance March 31, 2019
|
22,607,712
|
226
|
65,094
|
70,428
|
-
|
(2,626
|
)
|
133,122
|
||||||||||||||
|
Net income
|
-
|
-
|
-
|
15,748
|
-
|
-
|
15,748
|
|||||||||||||||
|
Cash dividend on common stock ($0.19 per share)
|
-
|
-
|
-
|
(4,306
|
)
|
-
|
-
|
(4,306
|
)
|
|||||||||||||
|
Exercise of stock options
|
58,000
|
1
|
226
|
-
|
-
|
-
|
227
|
|||||||||||||||
|
Restricted stock grants
|
82,673
|
-
|
-
|
-
|
-
|
-
|
-
|
|||||||||||||||
|
Stock repurchased
|
(204,100
|
)
|
(2
|
)
|
(1,017
|
)
|
-
|
-
|
-
|
(1,019
|
)
|
|||||||||||
|
Stock-based compensation expense
|
-
|
-
|
346
|
-
|
-
|
-
|
346
|
|||||||||||||||
|
Other comprehensive income, net
|
-
|
-
|
-
|
-
|
-
|
4,725
|
4,725
|
|||||||||||||||
|
Balance March 31, 2020
|
22,544,285
|
$
|
225
|
$
|
64,649
|
$
|
81,870
|
$
|
-
|
$
|
2,099
|
$
|
148,843
|
|||||||||
See accompanying notes to consolidated financial statements.
71
RIVERVIEW BANCORP, INC. AND SUBSIDIARY
CONSOLIDATED STATEMENTS OF CASH FLOWS
FOR THE YEARS ENDED MARCH 31, 2020, 2019 AND 2018
|
(In thousands)
|
2020
|
2019
|
2018
|
||||||||
|
CASH FLOWS FROM OPERATING ACTIVITIES:
|
|||||||||||
|
Net income
|
$
|
15,748
|
$
|
17,266
|
$
|
10,242
|
|||||
|
Adjustments to reconcile net income to net cash provided by operating activities:
|
|||||||||||
|
Depreciation and amortization
|
2,963
|
2,718
|
2,917
|
||||||||
|
Purchased loans amortization (accretion), net
|
53
|
(147
|
)
|
(277
|
)
|
||||||
|
Provision for loan losses
|
1,250
|
50
|
-
|
||||||||
|
Provision (benefit) for deferred income taxes
|
(574
|
)
|
(11
|
)
|
3,668
|
||||||
|
Expense related to ESOP
|
-
|
-
|
148
|
||||||||
|
Stock-based compensation expense
|
346
|
44
|
88
|
||||||||
|
Increase in deferred loan origination fees, net of amortization
|
138
|
498
|
498
|
||||||||
|
Origination of loans held for sale
|
(8,941
|
)
|
(11,105
|
)
|
(20,502
|
)
|
|||||
|
Proceeds from sales of loans held for sale
|
9,743
|
10,579
|
21,204
|
||||||||
|
Net gains on sales of loans held for sale, sales of investment securities,
sales of real estate owned (“REO”) and sales of premises and equipment
|
(355
|
)
|
(682
|
)
|
(725
|
)
|
|||||
|
Income from BOLI
|
(864
|
)
|
(734
|
)
|
(819
|
)
|
|||||
|
Changes in certain other assets and liabilities:
|
|||||||||||
|
Prepaid expenses and other assets
|
2,622
|
(868
|
)
|
(212
|
)
|
||||||
|
Accrued interest receivable
|
215
|
(442
|
)
|
(536
|
)
|
||||||
|
Accrued expenses and other liabilities
|
(6,427
|
)
|
2,988
|
(3,755
|
)
|
||||||
|
Net cash provided by operating activities
|
15,917
|
20,154
|
11,939
|
||||||||
|
CASH FLOWS FROM INVESTING ACTIVITIES:
|
|||||||||||
|
Loan repayments (originations), net
|
(11,786
|
)
|
(34,427
|
)
|
11,156
|
||||||
|
Purchases of loans receivable
|
(23,818
|
)
|
(29,929
|
)
|
(43,016
|
)
|
|||||
|
Principal repayments on investment securities available for sale
|
28,371
|
26,519
|
28,569
|
||||||||
|
Purchases of investment securities available for sale
|
(18,125
|
)
|
-
|
(47,494
|
)
|
||||||
|
Proceeds from calls, maturities, and sales of investment securities available for sale
|
24,623
|
10,000
|
950
|
||||||||
|
Principal repayments on investment securities held to maturity
|
7
|
7
|
22
|
||||||||
|
Purchases of premises and equipment
|
(2,953
|
)
|
(1,046
|
)
|
(753
|
)
|
|||||
|
Redemption of certificates of deposit held for investment
|
498
|
5,220
|
5,075
|
||||||||
|
Redemption (purchases) of FHLB stock, net
|
2,224
|
(2,291
|
)
|
(172
|
)
|
||||||
|
Proceeds from sales of REO and premises and equipment
|
81
|
976
|
81
|
||||||||
|
Net cash used in investing activities
|
(878
|
)
|
(24,971
|
)
|
(45,582
|
)
|
|||||
|
CASH FLOWS FROM FINANCING ACTIVITIES:
|
|||||||||||
|
Net increase (decrease) in deposits
|
65,394
|
(70,568
|
)
|
15,771
|
|||||||
|
Dividends paid
|
(4,075
|
)
|
(3,163
|
)
|
(2,140
|
)
|
|||||
|
Proceeds from borrowings
|
224,897
|
326,956
|
55,980
|
||||||||
|
Repayment of borrowings
|
(281,483
|
)
|
(270,370
|
)
|
(55,980
|
)
|
|||||
|
Net increase (decrease) in advance payments by borrowers for taxes and insurance
|
72
|
(6
|
)
|
(56
|
)
|
||||||
|
Principal payments on finance lease liability
|
(34
|
)
|
(28
|
)
|
(23
|
)
|
|||||
|
Proceeds from exercise of stock options
|
227
|
179
|
245
|
||||||||
|
Repurchase of common stock
|
(1,019
|
)
|
-
|
-
|
|||||||
|
Net cash provided by (used in) financing activities
|
3,979
|
(17,000
|
)
|
13,797
|
|||||||
|
NET INCREASE (DECREASE) IN CASH AND CASH EQUIVALENTS
|
19,018
|
(21,817
|
)
|
(19,846
|
)
|
||||||
|
CASH AND CASH EQUIVALENTS, BEGINNING OF YEAR
|
22,950
|
44,767
|
64,613
|
||||||||
|
CASH AND CASH EQUIVALENTS, END OF YEAR
|
$
|
41,968
|
$
|
22,950
|
$
|
44,767
|
|||||
|
SUPPLEMENTAL DISCLOSURES OF CASH FLOW INFORMATION:
|
|||||||||||
|
Cash paid during the year for:
|
|||||||||||
|
Interest
|
$
|
4,576
|
$
|
2,686
|
$
|
2,176
|
|||||
|
Income taxes
|
4,438
|
6,877
|
3,280
|
||||||||
|
NONCASH INVESTING AND FINANCING ACTIVITIES:
|
|||||||||||
|
Dividends declared and accrued in other liabilities
|
$
|
1,135
|
$
|
904
|
$
|
677
|
|||||
|
Other comprehensive income (loss)
|
6,217
|
2,751
|
(3,590
|
)
|
|||||||
|
Income tax effect related to other comprehensive income (loss)
|
(1,492
|
)
|
(629
|
)
|
871
|
||||||
|
Recognition of right-of-use lease assets and operating lease liabilities (See Note 18)
|
5,603
|
-
|
-
|
See accompanying notes to consolidated financial statements.
72
RIVERVIEW BANCORP, INC. AND SUBSIDIARY
NOTES TO CONSOLIDATED FINANCIAL STATEMENTS
YEARS ENDED MARCH 31, 2020, 2019 and 2018
|
1.
|
SUMMARY OF SIGNIFICANT ACCOUNTING POLICIES
|
Principles of Consolidation – The accompanying consolidated financial statements include the accounts of Riverview
Bancorp, Inc.; its wholly-owned subsidiary, Riverview Community Bank (the “Bank”); the Bank’s wholly-owned subsidiary, Riverview Services, Inc., and the Bank’s majority-owned subsidiary, Riverview Trust Company (the “Trust Company”) (collectively
referred to as the “Company”). All inter-company transactions and balances have been eliminated in consolidation.
For the period from April 1, 2017 through December 2019, the Trust Company was a wholly-owned subsidiary of the Bank. In December 2019, the Trust Company issued 1,500 shares
of Trust Company stock in conjunction with the exercise of 1,500 Trust Company stock options by the Trust Company’s President and Chief Executive Officer. As a result of this transaction, the Bank’s ownership in the Trust Company decreased from 100%
to 98%, resulting in a noncontrolling interest. The noncontrolling interest was $107,000 as of March 31, 2020, and net income attributable to the noncontrolling interest was $5,000 for the year ended March 31, 2020. These amounts are not presented
separately in the accompanying consolidated financial statements due to their insignificance.
The Company has three subsidiary grantor trusts which were established in connection with the issuance of trust preferred securities (see Note 10). In accordance with
accounting principles generally accepted in the United States of America (“generally accepted accounting principles” or “GAAP”), the accounts and transactions of the trusts are not included in the accompanying consolidated financial statements.
Nature of Operations – The Bank is a community-oriented financial institution which operates 18 branches in rural
and suburban communities in southwest Washington State and Multnomah, Washington and Marion counties of Oregon. The Bank is engaged primarily in the business of attracting deposits from the general public and using such funds, together with other
borrowings, to make various commercial business, commercial real estate, land, multi-family real estate, real estate construction and consumer loans. Additionally, the Trust Company offers trust and investment services and Riverview Services, Inc.
acts as a trustee for deeds of trust on mortgage loans granted by the Bank and receives a reconveyance fee for each deed of trust.
In September 2018, the Bank completed a purchase and assumption transaction in which all of the Bank’s Longview, Washington branch deposits were sold to a community bank
headquartered in Longview. The Bank sold approximately $3.2 million of deposits and recognized a gain on sale of these deposits of approximately $70,000, which is included in other non-interest income in the accompanying consolidated statement of
income for the year ended March 31, 2019. This purchase and assumption transaction did not include the sale of any loans or the exchange of any assets or liabilities other than deposits. The Bank subsequently sold the Longview branch land and
building in December 2018 and recognized a $355,000 gain on sale, which is included in other non-interest expense in the accompanying consolidated statement of income for the year ended March 31, 2019.
Business segments – The Company's operations are managed along two operating segments, consisting of banking
operations performed by the Bank and trust and investment services performed by the Trust Company. While the chief operating decision maker uses financial information related to these segments to analyze business performance and allocate resources,
the trust and investment services segment does not meet the quantitative threshold under GAAP to be considered a reportable segment. As such, these operating segments are aggregated into a single reportable operating segment in the consolidated
financial statements. No revenues are derived from foreign countries.
Use of Estimates in the Preparation of Consolidated Financial Statements – The preparation of consolidated
financial statements in conformity with GAAP requires management to make estimates and assumptions that affect the reported amounts of certain assets and liabilities and disclosure of contingent assets and liabilities at the date of the consolidated
financial statements and the reported amounts of related revenue and expense during the reporting period. Actual results could differ from those estimates. The estimates utilized to determine the appropriate allowance for loan losses at March 31,
2020 may be materially different from actual results due to the novel coronavirus of 2019 (“COVID-19”) pandemic.
Cash and Cash Equivalents – Cash and cash equivalents include amounts on hand, due from banks and interest-earning
deposits in other banks. Cash and cash equivalents have a maturity of 90 days or less at the time of purchase.
73
Certificates of Deposit Held for Investment – Certificates of deposit held for investment include amounts
invested with financial institutions at a stated interest rate and maturity date. Early withdrawal penalties apply; however, the Company plans to hold these investments to maturity.
Loans Held for Sale – The Company identifies loans held for sale at the time of origination and such loans are
carried at the lower of aggregate cost or estimated fair value. Estimated fair values are derived from available market quotations for comparable pools of mortgage loans. Adjustments for unrealized losses, if any, are charged to income.
Gains or losses on sales of loans held for sale are recognized at the time of sale and are determined by the difference between the net sales proceeds and the allocated basis
of these loans sold. The Company capitalizes mortgage servicing rights (“MSRs”) acquired through the sale of originated mortgage loans or the securitization of mortgage loans with servicing rights retained. Upon sale of mortgage loans held for sale,
the total cost of the loans designated for sale is allocated to mortgage loans with and without MSRs based on their relative fair values. The MSRs are included as a component of net gains on sales of loans held for sale. The MSRs are amortized in
proportion to and over the estimated period of the net servicing income and such amortization is reflected as a component of loan servicing income and is included in the consolidated statements of income in other non-interest income.
Investment Securities – Investments in debt securities are classified as held to maturity when the Company has
the ability and positive intent to hold such securities to maturity. Investments in debt securities held to maturity are carried at amortized cost. Unrealized losses on investments in debt securities held to maturity due to fluctuations in fair value
are recognized when it is determined that a credit-related other than temporary decline in value has occurred. Investments in debt securities bought and held principally for the purpose of sale in the near-term are classified as trading securities.
Investments in debt securities that the Company intends to hold for an indefinite period, but not necessarily to maturity, are classified as available for sale. Such debt securities may be sold to implement the Company’s asset/liability management
strategies and in response to changes in interest rates and similar factors. Investments in debt securities available for sale are reported at estimated fair value. Unrealized gains and losses on investment securities available for sale, net of the
related deferred tax effect, are included in total comprehensive income and are reported as a net amount in a separate component of shareholders’ equity entitled “accumulated other comprehensive income (loss).” Realized gains and losses on sales of
investments in debt securities available for sale, determined using the specific identification method, are included in earnings on the trade date. Amortization of premiums and accretion of discounts are recognized in interest income over the period
to contractual maturity or expected call, if sooner. The Company’s investment portfolio consists of debt securities and does not include any equity securities.
The Company analyzes investments in debt securities for other than temporary impairment (“OTTI”) on a quarterly basis. OTTI is separated into a credit component and a
noncredit component. Credit component losses are reported in non-interest income when the present value of expected future cash flows is less than the amortized cost. Noncredit component losses are recorded in other comprehensive income (loss) when
the Company (1) does not intend to sell the security or (2) is not more likely than not to have to sell the security prior to the security’s anticipated recovery. If the Company is likely to sell an investment in a debt security, any noncredit
component losses are recognized and are reported in non-interest income.
Loans Receivable – Loans are stated at the amount of unpaid principal, reduced by net deferred loan origination
fees and an allowance for loan losses. Interest on loans is accrued daily based on the principal amount outstanding.
Loans are reviewed regularly and it is the Company’s general policy that a loan is past due when it is 30 days to 89 days delinquent. In general, when a loan is 90 days
delinquent or when collection of principal or interest appears doubtful, it is placed on non-accrual status, at which time the accrual of interest ceases and a reserve for unrecoverable accrued interest is established and charged against operations.
As a general practice, payments received on non-accrual loans are applied to reduce the outstanding principal balance on a cost recovery method. Also as a general practice, a loan is not removed from non-accrual status until all delinquent principal,
interest and late fees have been brought current and the borrower has demonstrated a history of performance based upon the contractual terms of the note. A history of repayment performance generally would be a minimum of six months.
Loan origination and commitment fees and certain direct loan origination costs are deferred and amortized as an adjustment of the yield of the related loan.
Acquired Loans – Purchased loans, including loans acquired in business
combinations, are recorded at their estimated fair value at the acquisition date. Credit discounts are included in the determination of fair value; therefore, an allowance for loan losses is not recorded at the acquisition date. Acquired loans are
evaluated upon acquisition and classified as either purchased credit-impaired (“PCI”) or purchased non-credit-impaired. PCI loans reflect credit deterioration since origination
74
such that it is probable at acquisition that the Company will be unable to collect all contractually required payments. The excess of the cash flows expected to be collected
over a PCI loan's carrying value is considered to be the accretable yield and is recognized as interest income over the estimated life of the PCI loan using the effective yield method. The excess of the undiscounted contractual balances due over the
cash flows expected to be collected is considered to be the nonaccretable difference. The nonaccretable difference represents the Company's estimate of the credit losses expected to occur and would be considered in determining the estimated fair
value of the loans as of the acquisition date. Subsequent to the acquisition date, any increases in expected cash flows over those expected at the purchase date in excess of fair value are adjusted through a change to the accretable yield on a
prospective basis. Any subsequent decreases in expected cash flows attributable to credit deterioration are recognized by recording an allowance for loan losses. The Company had no PCI loans as of March 31, 2020 and 2019.
For purchased non-credit-impaired loans, the difference between the fair value and unpaid principal balance of the loan at the acquisition date is amortized or accreted to
interest income over the lives of the related loans. Any subsequent deterioration in credit quality is recognized by recording an allowance for loan losses.
Allowance for Loan Losses – The allowance for loan losses is maintained at a level sufficient to provide for
estimated loan losses based on evaluating known and inherent risks in the loan portfolio. The allowance is provided based upon management’s ongoing quarterly assessment of the pertinent factors underlying the quality of the loan portfolio. These
factors include changes in the size and composition of the loan portfolio, delinquency levels, actual loan loss experience, current economic conditions and a detailed analysis of individual loans for which full collectability may not be assured. The
detailed analysis includes techniques to estimate the fair value of loan collateral and the existence of potential alternative sources of repayment. The allowance consists of specific, general and unallocated components.
The specific component relates to loans that are considered impaired. For loans that are classified as impaired, an allowance is established when the discounted cash flows or
collateral value (less estimated selling costs, if applicable) of the impaired loan is lower than the carrying value of that loan.
The general component covers non-impaired loans based on the Company’s risk rating system and historical loss experience adjusted for qualitative factors. The Company
calculates its historical loss rates using the average of the last four quarterly 24-month periods. The Company calculates and applies its historical loss rates by individual loan types in its loan portfolio. These historical loss rates are adjusted
for qualitative and environmental factors.
An unallocated component is maintained to cover uncertainties that the Company believes have resulted in incurred losses that have not yet been allocated to specific elements
of the general and specific components of the allowance for loan losses. Such factors include uncertainties in economic conditions, uncertainties in identifying triggering events that directly correlate to subsequent loss rates, changes in appraised
value of underlying collateral, risk factors that have not yet manifested themselves in loss allocation factors and historical loss experience data that may not precisely correspond to the current loan portfolio or economic conditions. The
unallocated component of the allowance reflects the margin of imprecision inherent in the underlying assumptions used in the methodologies for estimating specific and general losses in the loan portfolio. The appropriate allowance level is estimated
based upon factors and trends identified by the Company as of the date of the filing of the consolidated financial statements.
When available information confirms that specific loans or portions thereof are uncollectible, identified amounts are charged against the allowance for loan losses. The
existence of some or all of the following criteria will generally confirm that a loss has been incurred: the loan is significantly delinquent and the borrower has not demonstrated the ability or intent to bring the loan current; the Company has no
recourse to the borrower, or if it does, the borrower has insufficient assets to pay the debt; and/or the estimated fair value of the loan collateral is significantly below the current loan balance, and there is little or no near-term prospect for
improvement.
A loan is considered impaired when it is probable that the Company will be unable to collect all amounts due (principal and interest) according to the contractual terms of
the loan agreement. Typically, factors used in determining if a loan is impaired include, but are not limited to, whether the loan is 90 days or more delinquent, internally designated as substandard or worse, on non-accrual status or represents a
troubled debt restructuring (“TDR”). The majority of the Company’s impaired loans are considered collateral dependent. When a loan is considered collateral dependent, impairment is measured using the estimated value of the underlying collateral, less
any prior liens, and when applicable, less estimated selling costs. For impaired loans that are not collateral dependent, impairment is measured using the present value of expected future cash flows, discounted at the loan’s original effective
interest rate. When the estimated net realizable value of the impaired loan is less than the recorded investment in the loan (including accrued interest, net deferred loan fees or costs, and unamortized premium or discount), an impairment is
recognized by adjusting an allocation of the allowance for loan losses. Subsequent
75
to the initial allocation of allowance to the individual loan, the Company may conclude that it is appropriate to record a charge-off of the impaired portion of the loan.
When a charge-off is recorded, the loan balance is reduced and the specific allowance is eliminated. Generally, when a collateral dependent loan is initially measured for impairment and has not had an appraisal of the collateral in the last six
months, the Company obtains an updated market valuation. Subsequently, the Company generally obtains an updated market valuation of the collateral on an annual basis. The collateral valuation may occur more frequently if the Company determines that
there is an indication that the market value may have declined.
In accordance with the Company’s policy guidelines, unsecured loans are generally charged-off when no payments have been received for three consecutive months unless an
alternative action plan is in effect. Consumer installment loans delinquent six months or more that have not received at least 75% of their required monthly payments in the last 90 days are charged-off. In addition, loans discharged in bankruptcy
proceedings are charged-off. Loans under bankruptcy protection with no payments received for four consecutive months are charged-off. The outstanding balance of a secured loan that is in excess of the net realizable value of the underlying collateral
is generally charged-off if no payments are received for four to five consecutive months. However, charge-offs are postponed if alternative proposals to restructure, obtain additional guarantors, obtain additional assets as collateral or a potential
sale of the underlying collateral would result in full repayment of the outstanding loan balance. Once any other potential sources of repayment are exhausted, the impaired portion of the loan is charged-off. Regardless of whether a loan is unsecured
or collateralized, once an amount is determined to be a confirmed loan loss it is charged off.
A provision for loan losses is charged against income and is added to the allowance for loan losses based on regular assessments of the loan portfolio. The allowance for loan
losses is allocated to certain loan categories based on the relative risk characteristics, asset classifications and actual loss experience of the loan portfolio. While management has allocated the allowance for loan losses to various loan portfolio
segments, the allowance is general in nature and is available for the loan portfolio in its entirety.
Management’s evaluation of the allowance for loan losses is based on ongoing, quarterly assessments of the known and inherent risks in the loan portfolio. Loss factors are
based on the Company’s historical loss experience with additional consideration and adjustments made for changes in economic conditions, changes in the amount and composition of the loan portfolio, delinquency rates, changes in collateral values,
seasoning of the loan portfolio, duration of the current business cycle, a detailed analysis of impaired loans and other factors as deemed appropriate. These factors are evaluated on a quarterly basis. Loss rates used by the Company are affected as
changes in these factors increase or decrease from quarter to quarter. In addition, regulatory agencies, as an integral part of their examination process, periodically review the Company’s allowance for loan losses and may require the Company to make
additions to the allowance based on their judgment about information available to them at the time of their examinations.
Allowance for Unfunded Loan Commitments – The allowance for unfunded loan commitments is maintained at a level
believed by management to be sufficient to absorb estimated probable losses related to these unfunded credit facilities. The determination of the adequacy of the allowance is based on periodic evaluations of the unfunded credit facilities including
an assessment of the probability of commitment usage, credit risk factors for loans outstanding to these same customers, and the terms and expiration dates of the unfunded credit facilities. The allowance for unfunded loan commitments is included in
accrued expenses and other liabilities in the consolidated balance sheets, with changes to the balance charged against non-interest expense.
REO – REO consists of properties acquired through foreclosure and is initially recorded at the estimated fair
value of the properties, less estimated costs of disposal. At the time of foreclosure, specific charge-offs are taken against the allowance for loan losses based upon a detailed analysis of the fair value of collateral on the underlying loans on
which the Company is in the process of foreclosing. Subsequently, the Company performs an evaluation of the properties and records a valuation allowance with an offsetting charge to REO expenses for any declines in value. Management considers
third-party appraisals, as well as independent fair market value assessments from realtors or persons involved in selling real estate, in determining the estimated fair value of particular properties. In addition, as certain of these third-party
appraisals and independent fair market value assessments are only updated periodically, changes in the values of specific properties may have occurred subsequent to the most recent appraisals. The amounts the Company will ultimately recover and
record in the accompanying consolidated financial statements from the disposition of REO may differ from the amounts used in arriving at the net carrying value of these assets because of future market factors beyond the Company’s control or because
of changes in the Company’s strategy for the sale of the property. Costs relating to development and improvement of the properties or assets are capitalized, while costs relating to holding the properties or assets are expensed. At March 31, 2020, there were no mortgage loans secured by residential real estate for which formal foreclosure proceedings were in process.
76
Federal Home Loan Bank Stock – The Bank, as a member of the Federal Home Loan Bank of Des Moines (“FHLB”), is
required to maintain a minimum investment in capital stock of the FHLB based on specific percentages of its outstanding FHLB advances. The Company’s investment in FHLB stock is carried at cost, which approximates fair value. The Company views its
investment in FHLB stock as a long-term investment. Accordingly, when evaluating FHLB stock for impairment, the value is determined based on the ultimate redemption of the par value rather than recognizing temporary declines in value. The
determination of whether a decline affects the ultimate redemption value is influenced by criteria such as: (1) the significance of any decline in net assets of the FHLB as compared to the capital stock amount of the FHLB and the length of time this
situation has persisted, (2) commitments by the FHLB to make payments required by law or regulation and the level of such payments in relation to the operating performance of the FHLB, (3) the impact of legislative and regulatory changes on
institutions and, accordingly, the customer base of the FHLB, and (4) the liquidity position of the FHLB. The Company evaluated its investment in FHLB stock for OTTI, consistent with its accounting policy. Based on the Company’s evaluation, the
Company determined there is not any OTTI on its FHLB stock at March 31, 2020.
Premises and Equipment – Premises and equipment are stated at cost less accumulated depreciation and amortization.
Leasehold improvements are amortized over the estimated term of the related lease or the estimated useful life of the improvements, whichever is less. Depreciation and amortization is generally computed on the straight-line method over the following
estimated useful lives: buildings and improvements – up to 45 years; furniture and equipment – 3 to 20 years; and leasehold improvements – 15 to 25 years, or estimated lease term if shorter. Gains or losses on dispositions are reflected in earnings.
The cost of maintenance and repairs is charged to expense as incurred. Assets are reviewed for impairment when events indicate their carrying value may not be recoverable. If management determines impairment exists the asset is reduced by an
offsetting charge to expense.
Assets held under the Company’s finance lease, net of accumulated amortization, are included in premises and equipment. The assets held under the finance lease are amortized
on a straight-line basis over the lease term and the amortization is included in depreciation and amortization expense.
MSRs – The Company services certain loans that it has originated and sold to the Federal Home Loan Mortgage
Corporation (“FHLMC”). Loan servicing includes collecting payments; remitting funds to investors, insurance companies and tax authorities; collecting delinquent payments; and foreclosing on properties when necessary. Fees earned for servicing loans
for the FHLMC are reported as income when the related mortgage loan payments are collected. Loan servicing costs are charged to expense as incurred. In addition, the Company has recorded MSRs, which represent the rights to service loans.
The Company records its originated MSRs at fair value in accordance with GAAP, which requires the Company to allocate the total cost of all mortgage loans sold between the
MSRs and the loans (without the MSRs) based on their relative fair values if it is practicable to estimate those fair values. The Company stratifies its MSRs based on the predominant characteristics of the underlying financial assets including the
coupon interest rate and the contractual maturity of the mortgage. The Company is amortizing the MSRs in proportion to and over the period of estimated net servicing income.
MSRs are reviewed quarterly for impairment based on their estimated fair value. The estimated fair value of the MSRs is determined
quarterly using a discounted cash flow model. The model estimates the present value of the future net cash flows of the servicing loan portfolio based on various factors, such as servicing costs, servicing income, expected prepayment speeds, discount
rate, loan maturity and interest rate. Market sources are used to determine prepayment speeds, ancillary income, servicing cost and pre-tax required yield. The effect of changes in market interest rates on estimated rates of loan prepayments
represents the predominant risk characteristic underlying the MSRs portfolio. Impairment losses are recognized through a valuation allowance for each impaired stratum, with any associated provision recorded as a component of loan servicing income.
Business Combinations, CDI and Goodwill – GAAP requires the total purchase price in a business combination to be
allocated to the estimated fair values of assets acquired and liabilities assumed, including certain intangible assets. Subsequent adjustments to the initial allocation of the purchase price may be made related to fair value estimates for which all
relevant information has not been obtained, known, or discovered relating to the acquired entity during the allocation period (which is the period of time required to identify and measure the estimated fair values of the assets acquired and
liabilities assumed in a business combination). The allocation period is generally limited to one year following consummation of a business combination.
77
CDI represents the value assigned to demand, interest checking, money market and savings accounts acquired as part of a business combination. CDI represents the future
economic benefit of the potential cost savings from acquiring core deposits as part of a business combination compared to the cost of alternative funding sources. CDI is amortized to non-interest expense using an accelerated method based on an
estimated runoff of related deposits over a period of ten years. CDI is evaluated for impairment and recoverability whenever events or changes in circumstances indicate that its carrying amount may not be recoverable, with any changes in estimated
useful life accounted for prospectively over the revised remaining life. At both March 31, 2020 and 2019, gross CDI was $1.36 million. At March 31, 2020 and 2019, accumulated amortization was $604,000 and $443,000, respectively. The amortization
expense for CDI in future years is estimated to be $140,000, $125,000, $116,000, $108,000, $100,000 and $170,000 for the years ended March 31, 2021, 2022, 2023, 2024, 2025 and thereafter, respectively.
Goodwill and certain other intangibles generally arise from business combinations. Goodwill and other intangibles generated from business combinations that are deemed to have
indefinite lives are not subject to amortization and are instead tested for impairment not less than annually. The Company performs an annual review in the third quarter of each year, or more frequently if indicators of potential impairment exist, to
determine if the recorded goodwill is impaired (see Note 7).
BOLI – BOLI policies are recorded at their cash surrender value less applicable surrender charges. Income from
BOLI is recognized when earned.
Advertising and Marketing – Costs incurred for advertising, merchandising, market research, community investment
and business development are classified as advertising and marketing expense and are expensed as incurred.
Income Taxes – Income taxes are accounted for using the asset and liability method. Under this method, a deferred
tax asset or liability is determined based on the enacted tax rates which will be in effect when the differences between the financial statement carrying amounts and tax basis of existing assets and liabilities are expected to be reported in the
Company’s income tax returns. The effect on deferred taxes of a change in tax rates is recognized in income in the period that includes the enactment date.
Valuation allowances are established to reduce the net carrying amount of deferred tax assets if it is determined to be more likely than not that all or some portion of the
potential deferred tax asset will not be realized. The Company files a consolidated federal income tax return. The Bank provides for income taxes separately and remits to the Company amounts currently due.
Transfers of financial assets – Transfers of financial assets are accounted for as sales when control over the
assets has been surrendered. Control over transferred assets is deemed to be surrendered when (1) the assets have been isolated from the Company, (2) the transferee obtains the right (free of conditions that constrain it from taking advantage of that
right) to pledge or exchange the transferred assets, and (3) the Company does not maintain effective control over the transferred assets through an agreement to repurchase them before their maturity.
Trust Assets – Assets held by the Trust Company in a fiduciary or agency capacity for trust customers are not
included in the consolidated financial statements because such items are not assets of the Company. Assets totaling $1.2 billion and $646.0 million were held in trust as of March 31, 2020 and 2019, respectively.
Earnings Per Share – GAAP requires all companies whose capital structure includes dilutive potential common
shares to make a dual presentation of basic and diluted earnings per share for all periods presented. The Company’s basic earnings per share is computed by dividing net income available to common shareholders by the weighted average number of common
shares outstanding for the period, excluding restricted stock and unallocated shares owned by the ESOP. The Company’s diluted earnings per share reflects the potential dilution that could occur if securities or other contracts to issue common stock
were exercised and has been computed after giving consideration to the weighted average diluted effect of the Company’s stock options and restricted stock awards.
Stock-Based Compensation – The Company measures compensation cost for all stock-based awards based on the
grant-date fair value of the awards and recognizes compensation cost over the service period of stock-based awards. The fair value of stock options is determined using the Black-Scholes valuation model. The fair value of restricted stock is
determined based on the grant date fair value of the Company’s common stock.
78
ESOP – The Company sponsors a leveraged ESOP; however, all ESOP debt was fully repaid during the year ended March
31, 2018. As shares were released, compensation expense was recorded equal to the then current market price of the shares and the shares became available for earnings per share calculations. The Company recorded cash dividends on unallocated shares
as a reduction of debt and accrued interest. See Note 12 for further discussion.
Accounting Pronouncements Recently Issued or Adopted– In February 2016, the Financial Accounting Standards Board
(“FASB”) issued Accounting Standards Update (“ASU”) 2016-02, “Leases”, which created FASB Accounting Standards Codification (“ASC”) Topic 842 ("ASC 842"). The principal change required by ASC 842 relates to lessee accounting, and is that for
operating leases, a lessee is required to (1) recognize a right-of-use asset and a lease liability, initially measured at the present value of the lease payments, in the statement of financial position, (2) recognize a single lease cost, calculated
so that the cost of the lease is allocated over the lease term generally on a straight-line basis, and (3) classify all cash payments within operating activities in the statement of cash flows. For leases with a term of 12 months or less, a lessee is
permitted to make an accounting policy election by class of underlying asset not to recognize lease assets and lease liabilities. If a lessee makes this election, it should recognize lease expense for such leases generally on a straight-line basis
over the lease term. ASC 842 also changes disclosure requirements related to leasing activities and requires certain qualitative disclosures along with specific quantitative disclosures. ASC 842 was effective for annual periods, and interim periods
within those annual periods, beginning after December 15, 2018. The Company adopted ASC 842 effective April 1, 2019 using a modified retrospective method of application to all leases existing on April 1, 2019. Therefore, the comparative prior period
information has not been restated and continues to be reported under superseded ASC 840. The adoption of ASC 842 resulted in the Company recognizing operating lease right-of-use assets and operating lease liabilities of $5.6 million in the Company's
consolidated balance sheet as of April 1, 2019. As the operating lease right-of-use assets and the operating lease liabilities were the same upon adoption of ASC 842, there was no cumulative effect impact on the Company's total consolidated assets,
liabilities and shareholders' equity. The Company elected the package of practical expedients permitted under ASC 842's transition guidance, which allows the Company to carryforward its historical lease classifications and its assessment as to
whether a contract is or contains a lease. The Company also elected to not recognize lease assets and lease liabilities for leases with an initial term of 12 months or less. See Note 18 for additional discussion.
In June 2016, the FASB issued ASU 2016-13, “Financial Instruments – Credit Losses: Measurement of Credit Losses on Financial Instruments” (“ASU 2016-13”) as amended by ASU
2018-19, ASU 2019-04, ASU 2019-05, ASU 2019-10 and ASU 2019-11. ASU 2016-13 replaces the existing incurred losses methodology for estimating allowances with a current expected credit losses methodology with respect to most financial assets measured
at amortized cost and certain other instruments, including trade and other receivables, loans, held to maturity investment securities and off-balance sheet commitments. In addition, ASU 2016-13 requires credit losses relating to available for sale
debt securities to be recorded through an allowance for credit losses rather than as a reduction of carrying amount. ASU 2016-13 also changes the accounting for purchased credit impaired debt securities and loans. ASU 2016-13 retains many of the
current disclosure requirements in GAAP and expands certain disclosure requirements. As a Securities Exchange Commission “smaller reporting company” filer, ASU 2016-13 is effective for the Company for fiscal years beginning after December 15, 2022,
including interim periods within those fiscal years. Upon adoption, the Company expects a change in the processes and procedures to calculate the allowance for loan losses, including changes in assumptions and estimates to consider expected credit
losses over the life of the loan versus the current accounting practice that utilizes the incurred loss model. In addition, the current accounting policy and procedures for other-than-temporary impairment of investment securities available for sale
will be replaced with an allowance approach. The Company is reviewing the requirements of ASU 2016-13 and has begun developing and implementing processes and procedures to ensure it is fully compliant with the amendments at the adoption date. At this
time, management anticipates the allowance for loan losses will increase as a result of the implementation of ASU 2016-13; however, until management’s evaluation is complete, the magnitude of the increase will not be known.
In January 2017, the FASB issued ASU 2017-04, “Intangibles – Goodwill and Other: Simplifying the Test for Goodwill Impairment” (“ASU 2017-04”). ASU 2017-04 simplifies the
subsequent measurement of goodwill and eliminates Step 2 from the goodwill impairment test. In computing the implied fair value of goodwill under Step 2, an entity had to perform procedures to determine the fair value at the impairment testing date
of its assets and liabilities (including unrecognized assets and liabilities) following the procedure that would be required in determining the fair value of assets acquired and liabilities assumed in a business combination. Under ASU 2017-04, an
entity should perform its annual, or interim, goodwill impairment test by comparing the fair value of a reporting unit with its carrying amount. An entity should recognize an impairment charge for the amount by which the carrying amount exceeds the
reporting unit’s fair value; however, the loss recognized should not exceed the total amount of goodwill allocated to that reporting unit. Additionally, an entity should consider income tax effects from any tax deductible goodwill on the carrying
amount of the reporting unit when measuring
79
the goodwill impairment loss, if applicable. ASU 2017-04 is effective for annual or interim goodwill impairment tests in fiscal years beginning after December 15, 2022. Early
application of ASU 2017-04 is permitted for interim or annual goodwill impairment tests performed on testing dates after January 1, 2017. The adoption of ASU 2017-04 is not expected to have a material impact on the Company's future consolidated
financial statements.
In August 2018, the FASB issued ASU 2018-13, “Fair Value Measurement (Topic 820): Disclosure Framework – Changes to the Disclosure Requirements for Fair Value Measurement”
(“ASU 2018-13”). ASU 2018-13 modifies the disclosure requirements for fair value measurements. The following disclosure requirements were removed from ASC Topic 820 – Fair Value Measurement: (1) the amount of and reasons for transfers between Level 1
and Level 2 of the fair value hierarchy; (2) the policy for timing of transfers between levels; and (3) the valuation processes for Level 3 fair value measurements. ASU 2018-13 clarifies that the measurement uncertainty disclosure is to communicate
information about the uncertainty in measurement as of the reporting date. In addition, ASU 2018-13 adds new disclosure requirements for Level 3 measurements. ASU 2018-13 is effective for fiscal years beginning after December 15, 2019, including
interim periods within those fiscal years. Early adoption is permitted for any removed or modified disclosures. The adoption of ASU 2018-13 is not expected to have a material impact on the Company's future consolidated financial statements.
In August 2018, the FASB issued ASU 2018-15, “Intangibles - Goodwill and Other - Internal-Use Software (Subtopic 350-40), Customer's Accounting for Implementation Costs
Incurred in a Cloud Computing Arrangement That Is a Service Contract” (“ASU 2018-15”). The amendments in ASU 2018-15 broaden the scope of ASC Subtopic 350-40 to include costs incurred to implement a hosting arrangement that is a service contract. The
amendments align the requirements for capitalizing implementation costs incurred in a hosting arrangement that is a service contract with the requirements for capitalizing implementation costs incurred to develop or obtain internal-use software (and
hosting arrangements that include an internal-use software license). The costs are capitalized or expensed depending on the nature of the costs and the project stage during which they are incurred, consistent with the accounting for internal-use
software costs. The amendments in ASU 2018-15 result in consistent capitalization of implementation costs of a hosting arrangement that is a service contract and implementation costs incurred to develop or obtain internal use software (and hosting
arrangements that include an internal-use software license). The accounting for the service element of a hosting arrangement that is a service contract is not affected by the amendments in ASU 2018-15. ASU 2018-15 is effective for fiscal years
beginning after December 15, 2019, including interim periods within those fiscal years. The adoption of ASU 2018-15 is not expected to have a material impact on the Company's future consolidated financial statements.
In December 2019, the FASB issued ASU 2019-12, “Income Taxes (Topic 740), Simplifying the Accounting for Income Taxes” (“ASU 2019-12”). ASU 2019-12 simplifies the accounting
for income taxes by removing, among other things (1) the exception to the incremental approach for intra-period tax allocation when there is a loss from continuing operations and income or a gain from other items, and (2) the general methodology for
calculating income taxes in an interim period when a year-to-date loss exceeds the anticipated loss for the year. ASU 2019-12 also requires that an entity reflect the effect of an enacted change in tax laws or rates in the annual effective tax rate
computation in the interim period that includes the enactment date. ASU 2019-12 is effective for fiscal years beginning after December 15, 2020, including interim periods within those fiscal years. The adoption of ASU 2019-12 is not expected to have
a material impact on the Company's future consolidated financial statements.
In March 2020, the FASB issued ASU 2020-04, “Reference Rate Reform (Topic 848): Facilitation of the Effects of Reference Rate Reform on Financial Reporting” (“ASU 2020-04”).
ASU 2020-04 applies to contracts, hedging relationships and other transactions that reference LIBOR or other rate references expected to be discontinued because of reference rate reform. ASU 2020-04 permits an entity to make necessary modifications
to eligible contracts or transactions without requiring contract remeasurement or reassessment of a previous accounting determination. The Company’s current interest rates on its junior subordinated debentures are based upon the three-month LIBOR
plus a spread. ASU 2020-04 is effective for all entities as of March 12, 2020 through December 31, 2022. The Company has not adopted ASU 2020-04 as of March 31, 2020. The adoption of ASU 2020-04 is not expected to have a material impact on the
Company’s future consolidated financial statements.
80
On March 22, 2020, federal banking regulators issued an interagency statement that included guidance on their approach for the accounting of loan modifications in light of
the economic impact of the COVID-19 pandemic. The guidance interprets current GAAP related to TDRs and indicates that a lender can conclude that a borrower is not experiencing financial difficulty if short-term modifications are made in response to
COVID-19, such as payment deferrals, fee waivers, extensions of repayment terms, or other delays in payment when both (1) the modifications are insignificant related to the loans, and (2) the borrower is less than 30 days past due on its contractual
payments at the time a modification program is implemented. Accordingly, the banking regulatory agencies confirmed in working with the FASB that short-term modifications which meet the preceding criteria and that are made on a good faith basis in
response to COVID-19 to borrowers are not TDRs.
The Coronavirus Aid, Relief, and Economic Security Act of 2020 ("CARES Act"), signed into law on March 27, 2020, amended GAAP with respect to the modification of loans to
borrowers affected by the COVID-19 pandemic. Among other criteria, this guidance provided that short-term loan modifications made on a good faith basis to borrowers who were current as defined under the CARES Act prior to any relief, are not TDRs.
This includes short-term (e.g., six months) modifications such as payment deferrals, fee waivers, extensions of repayment terms, or other delays in payment that are insignificant. To qualify as an eligible loan under the CARES Act, a loan
modification must be (1) related to COVID-19; (2) executed on a loan that was not more than 30 days past due as of December 31, 2019; and (3) executed between March 1, 2020, and the earlier of (a) 60 days after the date of termination of the national
emergency by the President or (b) December 31, 2020. As of March 31, 2020 the Company had approved ten such loan modifications related to the COVID-19 pandemic totaling $36.2 million. Loan modifications in accordance with the CARES Act are still
subject to an evaluation in regards to determining whether or not a loan is deemed to be impaired. The spread of COVID-19 and the ensuing pandemic has caused significant economic disruption throughout the global economy, including the states and
municipalities which constitute the Company's market area. The potential future financial impact is unknown at this time. Prolonged economic disruption will likely affect the ability of the Company's customers to make timely payments on their loans.
It may also have an adverse effect on the collateral values securing customers' loan obligations. This may negatively impact the Company's future operations, results of operations, and financial condition.
Reclassifications – Certain prior period amounts have been reclassified to conform to the current period
presentation; such reclassifications had no effect on previously reported net income or total shareholders’ equity.
|
2.
|
RESTRICTED ASSETS
|
Regulations of the Board of Governors of the Federal Reserve System require that the Bank maintain minimum reserve balances either on hand or on deposit with the Federal
Reserve Bank of San Francisco (“FRB”) based on a percentage of deposits. Effective March 26, 2020, the reserve requirement was reduced to zero and the Bank was not required to maintain any such reserve balances as of March 31, 2020. The minimum
reserve balance as of March 31, 2019 was $1.8 million.
|
3.
|
INVESTMENT SECURITIES
|
The amortized cost and approximate fair value of investment securities consisted of the following at the dates indicated (in thousands):
|
Amortized
Cost
|
Gross
Unrealized
Gains
|
Gross
Unrealized
Losses
|
Estimated Fair
Value
|
|||||||||||||
|
March 31, 2020
|
||||||||||||||||
|
Available for sale:
|
||||||||||||||||
|
Municipal securities
|
$
|
4,740
|
$
|
137
|
$
|
-
|
$
|
4,877
|
||||||||
|
Agency securities
|
6,009
|
17
|
(10
|
)
|
6,016
|
|||||||||||
|
Real estate mortgage investment conduits (1)
|
42,663
|
1,128
|
-
|
43,791
|
||||||||||||
|
Residential mortgage-backed securities (1)
|
58,700
|
1,415
|
(30
|
)
|
60,085
|
|||||||||||
|
Other mortgage-backed securities (2)
|
33,417
|
256
|
(151
|
)
|
33,522
|
|||||||||||
|
Total available for sale
|
$
|
145,529
|
$
|
2,953
|
$
|
(191
|
)
|
$
|
148,291
|
|||||||
|
Held to maturity:
|
||||||||||||||||
|
Residential mortgage-backed securities (3)
|
$
|
28
|
$
|
-
|
$
|
-
|
$
|
28
|
||||||||
81
|
Amortized
Cost
|
Gross
Unrealized
Gains
|
Gross
Unrealized
Losses
|
Estimated Fair
Value
|
|||||||||||||
|
March 31, 2019
|
||||||||||||||||
|
Available for sale:
|
||||||||||||||||
|
Municipal securities
|
$
|
8,885
|
$
|
30
|
$
|
(34
|
)
|
$
|
8,881
|
|||||||
|
Agency securities
|
12,426
|
22
|
(107
|
)
|
12,341
|
|||||||||||
|
Real estate mortgage investment conduits (1)
|
40,835
|
-
|
(673
|
)
|
40,162
|
|||||||||||
|
Residential mortgage-backed securities (1)
|
77,402
|
7
|
(1,588
|
)
|
75,821
|
|||||||||||
|
Other mortgage-backed securities (2)
|
42,133
|
12
|
(1,124
|
)
|
41,021
|
|||||||||||
|
Total available for sale
|
$
|
181,681
|
$
|
71
|
$
|
(3,526
|
)
|
$
|
178,226
|
|||||||
|
Held to maturity:
|
||||||||||||||||
|
Residential mortgage-backed securities (3)
|
$
|
35
|
$
|
-
|
$
|
-
|
$
|
35
|
||||||||
|
(1) Comprised of FHLMC, Federal National Mortgage Association (“FNMA”) and Ginnie Mae (“GNMA”) issued securities.
|
||||||||||||||||
|
(2) Comprised of U.S. Small Business Administration (“SBA”) issued securities and commercial real estate (“CRE”) secured securities issued by FNMA.
|
||||||||||||||||
|
(3) Comprised of FHLMC and FNMA issued securities.
|
||||||||||||||||
The contractual maturities of investment securities as of March 31, 2020 are as follows (in thousands):
|
Available for Sale
|
Held to Maturity
|
|||||||||||||||
|
Amortized
Cost
|
Estimated
Fair Value
|
Amortized
Cost
|
Estimated
Fair Value
|
|||||||||||||
|
Due in one year or less
|
$
|
1,001
|
$
|
1,015
|
$
|
-
|
$
|
-
|
||||||||
|
Due after one year through five years
|
4,324
|
4,320
|
25
|
25
|
||||||||||||
|
Due after five years through ten years
|
33,195
|
33,983
|
3
|
3
|
||||||||||||
|
Due after ten years
|
107,009
|
108,973
|
-
|
-
|
||||||||||||
|
Total
|
$
|
145,529
|
$
|
148,291
|
$
|
28
|
$
|
28
|
||||||||
Expected maturities of investment securities may differ from contractual maturities because borrowers may have the right to prepay obligations with or without prepayment
penalties.
The fair value of temporarily impaired investment securities, the amount of unrealized losses and the length of time these unrealized losses existed are as follows at the dates
indicated (in thousands):
|
Less than 12 months
|
12 months or longer
|
Total
|
||||||||||||||||||||||
|
Estimated
Fair Value
|
Unrealized
Losses
|
Estimated
Fair Value
|
Unrealized
Losses
|
Estimated
Fair Value
|
Unrealized
Losses
|
|||||||||||||||||||
|
March 31, 2020
|
||||||||||||||||||||||||
|
Available for sale:
|
||||||||||||||||||||||||
|
Agency securities
|
$
|
1,998
|
$
|
(10
|
)
|
$
|
-
|
$
|
-
|
$
|
1,998
|
$
|
(10
|
)
|
||||||||||
|
Residential mortgage-backed securities (1)
|
2,509
|
(22
|
)
|
409
|
(8
|
)
|
2,918
|
(30
|
)
|
|||||||||||||||
|
Other mortgage-backed securities (3)
|
11,726
|
(58
|
)
|
4,911
|
(93
|
)
|
16,637
|
(151
|
)
|
|||||||||||||||
|
Total available for sale
|
$
|
16,233
|
$
|
(90
|
)
|
$
|
5,320
|
$
|
(101
|
)
|
$
|
21,553
|
$
|
(191
|
)
|
|||||||||
|
March 31, 2019
|
||||||||||||||||||||||||
|
Available for sale:
|
||||||||||||||||||||||||
|
Municipal securities
|
$
|
-
|
$
|
-
|
$
|
6,554
|
$
|
(34
|
)
|
$
|
6,554
|
$
|
(34
|
)
|
||||||||||
|
Agency securities
|
-
|
-
|
6,861
|
(107
|
)
|
6,861
|
(107
|
)
|
||||||||||||||||
|
Real estate mortgage investment conduits (2)
|
-
|
-
|
40,126
|
(673
|
)
|
40,126
|
(673
|
)
|
||||||||||||||||
|
Residential mortgage-backed securities (2)
|
-
|
-
|
74,288
|
(1,588
|
)
|
74,288
|
(1,588
|
)
|
||||||||||||||||
|
Other mortgage-backed securities (3)
|
-
|
-
|
40,409
|
(1,124
|
)
|
40,409
|
(1,124
|
)
|
||||||||||||||||
|
Total available for sale
|
$
|
-
|
$
|
-
|
$
|
168,238
|
$
|
(3,526
|
)
|
$
|
168,238
|
$
|
(3,526
|
)
|
||||||||||
|
(1) Comprised of FHLMC and FNMA issued securities.
|
||||||||||||||||||||||||
|
(2) Comprised of FHLMC, FNMA and GNMA issued securities.
|
||||||||||||||||||||||||
|
(3) Comprised of SBA and CRE secured securities issued by FNMA.
|
||||||||||||||||||||||||
The unrealized losses on the Company’s investment securities were primarily attributable to increases in market interest rates subsequent to their purchase by the Company. The
Company expects the fair value of these securities to recover as the securities approach their maturity dates or sooner if market yields for such securities decline. The Company does not believe that these securities are other than temporarily
impaired because of their credit quality or related to any issuer or industry specific event. Based on management’s evaluation and intent, the unrealized losses related to the investment securities in the above tables are considered temporary.
82
Proceeds from the sale of investment securities totaled $17.8 million for the year ended March 31, 2020. Gross realized gains on sales of investment securities totaled $30,000
for the year ended March 31, 2020 and are included in other non-interest income in the accompanying consolidated statements of income. The Company had no sales and realized no gains or losses on sales of investment securities for the years ended
March 31, 2019 and 2018. Investment securities available for sale with an amortized cost of $6.6 million and $5.8 million and a fair value of $6.8 million and $5.7 million at March 31, 2020 and 2019, respectively, were pledged as collateral for
government public funds held by the Bank. There were no held to maturity securities pledged as collateral for government public funds held by the Bank at March 31, 2020 and 2019.
|
4.
|
LOANS RECEIVABLE
|
Loans receivable at March 31, 2020 and 2019 are reported net of deferred loan fees totaling $4.1 million and $4.0 million, respectively. Loans receivable are also reported
net of discounts and premiums, totaling $1.1 million and $1.5 million, respectively, as of March 31, 2020, compared to $1.5 million and $1.8 million, respectively, as of March 31, 2019. Loans receivable, excluding loans held for sale, consisted of
the following at the dates indicated (in thousands):
|
March 31,
2020
|
March 31,
2019
|
||||
|
Commercial and construction
|
|||||
|
Commercial business
|
$
|
179,029
|
$
|
162,796
|
|
|
Commercial real estate
|
507,871
|
461,432
|
|||
|
Land
|
14,026
|
17,027
|
|||
|
Multi-family
|
58,374
|
51,570
|
|||
|
Real estate construction
|
64,843
|
90,882
|
|||
|
Total commercial and construction
|
824,143
|
783,707
|
|||
|
Consumer
|
|||||
|
Real estate one-to-four family
|
83,150
|
84,053
|
|||
|
Other installment
|
4,216
|
8,356
|
|||
|
Total consumer
|
87,366
|
92,409
|
|||
|
Total loans
|
911,509
|
876,116
|
|||
|
Less: Allowance for loan losses
|
12,624
|
11,457
|
|||
|
Loans receivable, net
|
$
|
898,885
|
$
|
864,659
|
|
The Company’s loan portfolio includes originated and purchased loans. Originated loans and purchased loans for which there was no evidence of credit deterioration at their
acquisition date and for which it was probable that the Company would be able to collect all contractually required payments, are referred to collectively as “loans”. The Company originates commercial business, commercial real estate, land,
multi-family real estate, real estate construction, residential real estate and other consumer loans. At March 31, 2020 and 2019, the Company had no loans to foreign domiciled businesses or foreign countries, or loans related to highly leveraged
transactions. Substantially all of the mortgage loans in the Company’s loan portfolio are secured by properties located in Washington and Oregon, and accordingly, the ultimate collectibility of a substantial portion of the Company’s loan portfolio is
susceptible to changes in the local economic conditions in these markets. Loans and extensions of credit outstanding at one time to one borrower are generally limited by federal regulations to 15% of the Bank’s shareholders’ equity, excluding
accumulated other comprehensive income (loss) (“AOCI”). The Company considers its loan portfolio to have very little exposure to sub-prime mortgage loans since the Company has not historically engaged in this type of lending. At March 31, 2020, loans
carried at $525.6 million were pledged as collateral to the FHLB and FRB for borrowing arrangements.
Aggregate loans to officers and directors, all of which are current, consist of the following for the periods indicated (in thousands):
|
Year Ended March 31,
|
||||||||||||
|
2020
|
2019
|
2018
|
||||||||||
|
Beginning balance
|
$
|
778
|
$
|
981
|
$
|
859
|
||||||
|
Originations
|
977
|
359
|
526
|
|||||||||
|
Principal repayments
|
(1,130
|
)
|
(562
|
)
|
(404
|
)
|
||||||
|
Ending balance
|
$
|
625
|
$
|
778
|
$
|
981
|
||||||
83
Loan segment risk characteristics – The Company considers its loan classes to be the same as its loan segments. The
following are loan segment risk characteristics of the Company’s loan portfolio:
Commercial business – Commercial business loans are primarily made based on the operating cash flows of the borrower or conversion of working capital assets to cash and
secondarily on the underlying collateral provided by the borrower. The cash flows of borrowers may be volatile and the value of the collateral securing these loans may be difficult to measure. Most commercial business loans are secured by the assets
being financed or other business assets such as accounts receivable or inventory and generally include a personal guarantee based on a review of personal financial statements. The Company will extend some short-term loans on an unsecured basis to
highly qualified borrowers. Although commercial business loans are often collateralized by equipment, inventory, accounts receivable or other business assets, the liquidation of collateral in the event of a borrower default is often an insufficient
source of repayment, because accounts receivable may be uncollectible and inventories and equipment may be obsolete or of limited use. Accordingly, the repayment of a commercial business loan depends primarily on the credit-worthiness of the borrower
(and any guarantors), while the liquidation of collateral is a secondary and potentially insufficient source of repayment. The Company attempts to mitigate these risks by adhering to its underwriting policies in evaluating the management of the
business and the credit-worthiness of the borrowers and the guarantors.
Commercial real estate – The Company originates commercial real estate loans within its primary market areas secured by properties such as office buildings,
warehouse/industrial, retail, assisted living, single purpose facilities, and other commercial properties. These are cash flow loans that share characteristics of both real estate and commercial business loans. The primary source of repayment is cash
flow from the operation of the collateral property and secondarily through liquidation of the collateral. These loans are generally higher risk than other classifications of loans in that they typically involve higher loan amounts, are dependent on
the management experience of the owners, and may be adversely affected by conditions in the real estate market or the economy. Owner-occupied commercial real estate loans are generally of lower credit risk than non-owner occupied commercial real
estate loans as the borrowers' businesses are likely dependent on the properties. Underwriting for these loans is primarily dependent on the repayment capacity derived from the operation of the occupying business rather than rents paid by
third-parties. The Company attempts to mitigate these risks by generally limiting the maximum loan-to-value ratio to 65%-80% depending on the property type and scrutinizing the financial condition of the borrower, the quality of the collateral and
the management of the property securing the loan.
Land – The Company has historically originated loans for the acquisition of raw land upon which the purchaser can then build or make improvements necessary to build or
sell as improved lots. Currently, the Company is originating new land loans on a limited basis. Loans secured by undeveloped land or improved lots involve greater risks than one-to-four family residential mortgage loans because these loans are more
difficult to evaluate. If the estimate of value proves to be inaccurate, in the event of default or foreclosure, the Company may incur a loss. The Company attempts to minimize this risk by generally limiting the maximum loan-to-value ratio on raw
land loans to 65% and on improved land loans to 75%.
Multi-family – The Company originates loans secured by multi-family dwelling units (more than four units). These loans involve a greater degree of risk than one-to-four
family residential mortgage loans as these loans are usually greater in amount, dependent on the cash flow capacity of the project, and are more difficult to evaluate and monitor. Repayment of loans secured by multi-family properties typically
depends on the successful operation and management of the properties. Consequently, repayment of such loans may be affected by adverse conditions in the real estate market or economy. The Company attempts to mitigate these risks by thoroughly
evaluating the global financial condition of the borrower, the management experience of the borrower, and the quality of the collateral property securing the loan.
Real estate construction- – The Company originates construction loans for one-to-four family residential, multi-family, and commercial real estate properties. The
one-to-four family residential construction loans include construction of consumer custom homes whereby the home buyer is the borrower as well as speculative and presold loans for home builders. Speculative one-to four-family construction loans are
loans for which the home builder does not have, at the time of the loan origination, a signed contract with a home buyer who has a commitment for permanent financing with the Company or another lender for the finished home. The home buyer may be
identified either during or after the construction period. Multi-family construction loans are originated to construct apartment buildings and condominium projects. Commercial construction loans are originated to construct properties such as office
buildings, retail rental space and mini-storage facilities, and assisted living facilities. All construction loans are short-term and generally the rate is variable in nature. Construction lending can involve a higher level of risk than other types
of lending because
84
funds are advanced based on a prospective value of the project at completion, the total estimated construction cost of the project, and the borrowers’ equity at risk.
Additionally, the repayment of the loan is conditional on the success of the ultimate project which is subject to interest rate changes, governmental regulations, general economic conditions and the ability of the borrower to sell or lease the
property or refinance the indebtedness. If the Company’s estimate of the value of a project at completion proves to be overstated, it may have inadequate security for repayment of the loan and may incur a loss if the borrower does not repay the loan.
Projects may also be jeopardized by disagreements between borrowers and builders and by the failure of builders to pay subcontractors. Loans to construct homes for which no purchaser has been identified carry more risk because the payoff for the loan
depends on the builder’s ability to sell the property prior to the time that the construction loan is due. Although the nature of real estate construction loans is such that they are generally more difficult to evaluate and monitor, the Company
attempts to closely monitor the construction project by on-site inspections. The Company also attempts to mitigate the risks of construction lending by adhering to its underwriting policies, disbursement procedures and monitoring practices.
Real estate one-to-four family – The Company originates both fixed-rate and adjustable-rate loans secured by one- to-four family residences located in its primary market
areas. The majority of the fixed-rate one-to-four family loans are sold in the secondary market for asset/liability management purposes and to generate non-interest income. The Company’s lending policies generally limit the maximum loan-to-value on
one-to-four family loans to 80% of the lesser of the appraised value or the purchase price. However, the Company usually obtains private mortgage insurance on the portion of the principal amount that exceeds 80% of the appraised value of the
property. Terms of maturity typically range from 15 to 30 years. The Company also originates home equity lines of credit and second mortgage loans. Home equity lines of credit and second mortgage loans have a greater credit risk than one-to-four
family residential mortgage loans because they are secured by mortgages subordinated to the existing first mortgage on the property, which may or may not be held by the Company. The Company attempts to mitigate residential lending risks by adhering
to its underwriting policies in evaluating the collateral and the credit-worthiness of the borrower.
Other installment – The Company originates other consumer loans, which include automobile, boat, motorcycle, recreational vehicle, savings account and unsecured loans.
Other consumer loans generally have shorter terms to maturity than mortgage loans. Other consumer loans generally involve a greater degree of risk than do residential mortgage loans, particularly in the case of consumer loans that are unsecured or
secured by rapidly depreciating assets such as automobiles. In such cases, any repossessed collateral for a defaulted consumer loan may not provide an adequate source of repayment of the outstanding loan balance as a result of the greater likelihood
of damage, loss or depreciation. The Company attempts to mitigate these risks by adhering to its underwriting policies in evaluating the credit-worthiness of the borrower.
|
5.
|
ALLOWANCE FOR LOAN LOSSES
|
The following tables present a reconciliation of the allowance for loan losses for the periods indicated (in thousands):
|
March 31, 2020
|
Commercial Business
|
Commercial
Real Estate
|
Land
|
Multi-
Family
|
Real Estate Construction
|
Consumer
|
Unallocated
|
Total
|
||||||||||||||||
|
Beginning balance
|
$
|
1,808
|
$
|
5,053
|
$
|
254
|
$
|
728
|
$
|
1,457
|
$
|
1,447
|
$
|
710
|
$
|
11,457
|
||||||||
|
Provision for (recapture of)
loan losses
|
264
|
1,368
|
(24
|
)
|
126
|
(308
|
)
|
(65
|
)
|
(111
|
)
|
1,250
|
||||||||||||
|
Charge-offs
|
(64
|
)
|
-
|
-
|
-
|
-
|
(82
|
)
|
-
|
(146
|
)
|
|||||||||||||
|
Recoveries
|
-
|
-
|
-
|
-
|
-
|
63
|
-
|
63
|
||||||||||||||||
|
Ending balance
|
$
|
2,008
|
$
|
6,421
|
$
|
230
|
$
|
854
|
$
|
1,149
|
$
|
1,363
|
$
|
599
|
$
|
12,624
|
|
March 31, 2019
|
|||||||||||||||||||||||||
|
Beginning balance
|
$
|
1,668
|
$
|
4,914
|
$
|
220
|
$
|
822
|
$
|
618
|
$
|
1,809
|
$
|
715
|
$
|
10,766
|
|||||||||
|
Provision for (recapture of)
loan losses
|
139
|
(685
|
)
|
34
|
(94
|
)
|
839
|
(178
|
)
|
(5
|
)
|
50
|
|||||||||||||
|
Charge-offs
|
-
|
-
|
-
|
-
|
-
|
(291
|
)
|
-
|
(291
|
)
|
|||||||||||||||
|
Recoveries
|
1
|
824
|
-
|
-
|
-
|
107
|
-
|
932
|
|||||||||||||||||
|
Ending balance
|
$
|
1,808
|
$
|
5,053
|
$
|
254
|
$
|
728
|
$
|
1,457
|
$
|
1,447
|
$
|
710
|
$
|
11,457
|
|||||||||
|
March 31, 2018
|
|||||||||||||||||||||||||
|
Beginning balance
|
$
|
1,418
|
$
|
5,084
|
$
|
228
|
$
|
297
|
$
|
714
|
$
|
2,099
|
$
|
688
|
$
|
10,528
|
|||||||||
|
Provision for (recapture of)
loan losses
|
10
|
(156
|
)
|
(301
|
)
|
525
|
(96
|
)
|
(9
|
)
|
27
|
-
|
|||||||||||||
|
Charge-offs
|
-
|
(68
|
)
|
-
|
-
|
-
|
(340
|
)
|
-
|
(408
|
)
|
||||||||||||||
|
Recoveries
|
240
|
54
|
293
|
-
|
-
|
59
|
-
|
646
|
|||||||||||||||||
|
Ending balance
|
$
|
1,668
|
$
|
4,914
|
$
|
220
|
$
|
822
|
$
|
618
|
$
|
1,809
|
$
|
715
|
$
|
10,766
|
|||||||||
85
The following tables present an analysis of loans receivable and the allowance for loan losses, based on impairment methodology, at the dates indicated (in thousands):
|
Allowance for Loan Losses
|
Recorded Investment in Loans
|
|||||||||||||||||||||||
|
March 31, 2020
|
Individually
Evaluated for
Impairment
|
Collectively
Evaluated for Impairment
|
Total
|
Individually
Evaluated for
Impairment
|
Collectively
Evaluated for
Impairment |
Total
|
||||||||||||||||||
|
Commercial business
|
$
|
-
|
$
|
2,008
|
$
|
2,008
|
$
|
139
|
$
|
178,890
|
$
|
179,029
|
||||||||||||
|
Commercial real estate
|
-
|
6,421
|
6,421
|
2,378
|
505,493
|
507,871
|
||||||||||||||||||
|
Land
|
-
|
230
|
230
|
714
|
13,312
|
14,026
|
||||||||||||||||||
|
Multi-family
|
-
|
854
|
854
|
1,549
|
56,825
|
58,374
|
||||||||||||||||||
|
Real estate construction
|
-
|
1,149
|
1,149
|
-
|
64,843
|
64,843
|
||||||||||||||||||
|
Consumer
|
12
|
1,351
|
1,363
|
432
|
86,934
|
87,366
|
||||||||||||||||||
|
Unallocated
|
-
|
599
|
599
|
-
|
-
|
-
|
||||||||||||||||||
|
Total
|
$
|
12
|
$
|
12,612
|
$
|
12,624
|
$
|
5,212
|
$
|
906,297
|
$
|
911,509
|
||||||||||||
|
March 31, 2019
|
||||||||||||||||||||||||
|
Commercial business
|
$
|
-
|
$
|
1,808
|
$
|
1,808
|
$
|
160
|
$
|
162,636
|
$
|
162,796
|
||||||||||||
|
Commercial real estate
|
-
|
5,053
|
5,053
|
2,482
|
458,950
|
461,432
|
||||||||||||||||||
|
Land
|
-
|
254
|
254
|
728
|
16,299
|
17,027
|
||||||||||||||||||
|
Multi-family
|
-
|
728
|
728
|
1,598
|
49,972
|
51,570
|
||||||||||||||||||
|
Real estate construction
|
-
|
1,457
|
1,457
|
-
|
90,882
|
90,882
|
||||||||||||||||||
|
Consumer
|
22
|
1,425
|
1,447
|
697
|
91,712
|
92,409
|
||||||||||||||||||
|
Unallocated
|
-
|
710
|
710
|
-
|
-
|
-
|
||||||||||||||||||
|
Total
|
$
|
22
|
$
|
11,435
|
$
|
11,457
|
$
|
5,665
|
$
|
870,451
|
$
|
876,116
|
||||||||||||
Changes in the allowance for unfunded loan commitments were as follows for the years indicated (in thousands):
|
Year Ended March 31,
|
||||||||||||
|
2020
|
2019
|
2018
|
||||||||||
|
Beginning balance
|
$
|
469
|
$
|
480
|
$
|
388
|
||||||
|
Net change in allowance for unfunded loan commitments
|
5
|
(11
|
)
|
92
|
||||||||
|
Ending balance
|
$
|
474
|
$
|
469
|
$
|
480
|
||||||
The following tables present an analysis of loans by aging category at the dates indicated (in thousands):
|
March 31, 2020
|
30-89 Days
Past Due
|
90 Days
and
Greater
Past Due
|
Non-accrual
|
Total Past
Due and
Non-
accrual
|
Current
|
Total Loans
Receivable
|
||||||||||||||||||
|
Commercial business
|
$
|
-
|
$
|
-
|
$
|
201
|
$
|
201
|
$
|
178,828
|
$
|
179,029
|
||||||||||||
|
Commercial real estate
|
-
|
-
|
1,014
|
1,014
|
506,857
|
507,871
|
||||||||||||||||||
|
Land
|
-
|
-
|
-
|
-
|
14,026
|
14,026
|
||||||||||||||||||
|
Multi-family
|
-
|
-
|
-
|
-
|
58,374
|
58,374
|
||||||||||||||||||
|
Real estate construction
|
-
|
-
|
-
|
-
|
64,843
|
64,843
|
||||||||||||||||||
|
Consumer
|
271
|
-
|
180
|
451
|
86,915
|
87,366
|
||||||||||||||||||
|
Total
|
$
|
271
|
$
|
-
|
$
|
1,395
|
$
|
1,666
|
$
|
909,843
|
$
|
911,509
|
||||||||||||
|
March 31, 2019
|
||||||||||||||||||||||||
|
Commercial business
|
$
|
-
|
$
|
-
|
$
|
225
|
$
|
225
|
$
|
162,571
|
$
|
162,796
|
||||||||||||
|
Commercial real estate
|
-
|
-
|
1,081
|
1,081
|
460,351
|
461,432
|
||||||||||||||||||
|
Land
|
-
|
-
|
-
|
-
|
17,027
|
17,027
|
||||||||||||||||||
|
Multi-family
|
-
|
-
|
-
|
-
|
51,570
|
51,570
|
||||||||||||||||||
|
Real estate construction
|
-
|
-
|
-
|
-
|
90,882
|
90,882
|
||||||||||||||||||
|
Consumer
|
345
|
3
|
210
|
558
|
91,851
|
92,409
|
||||||||||||||||||
|
Total
|
$
|
345
|
$
|
3
|
$
|
1,516
|
$
|
1,864
|
$
|
874,252
|
$
|
876,116
|
||||||||||||
Interest income foregone on non-accrual loans was $75,000, $94,000 and $102,000 for the years ended March 31, 2020, 2019 and 2018, respectively.
86
Credit quality indicators – The Company monitors credit risk in its loan portfolio using a risk rating system (on a
scale of one to nine) for all commercial (non-consumer) loans. The risk rating system is a measure of the credit risk of the borrower based on their historical, current and anticipated future financial characteristics. The Company assigns a risk
rating to each commercial loan at origination and subsequently updates these ratings, as necessary, so that the risk rating continues to reflect the appropriate risk characteristics of the loan. Application of appropriate risk ratings is key to
management of loan portfolio risk. In determining the appropriate risk rating, the Company considers the following factors: delinquency, payment history, quality of management, liquidity, leverage, earnings trends, alternative funding sources,
geographic risk, industry risk, cash flow adequacy, account practices, asset protection and extraordinary risks. Consumer loans, including custom construction loans, are not assigned a risk rating but rather are grouped into homogeneous pools with
similar risk characteristics. When a consumer loan is delinquent 90 days, it is placed on non-accrual status and assigned a substandard risk rating. Loss factors are assigned to each risk rating and homogeneous pool based on historical loss
experience for similar loans. This historical loss experience is adjusted for qualitative factors that are likely to cause the estimated credit losses to differ from the Company’s historical loss experience. The Company uses these loss factors to
estimate the general component of its allowance for loan losses.
Pass – These loans have a risk rating between 1 and 4 and are to borrowers that meet normal credit standards. Any deficiencies in satisfactory asset
quality, liquidity, debt servicing capacity and coverage are offset by strengths in other areas. The borrower currently has the capacity to perform according to the loan terms. Any concerns about risk factors such as stability of margins, stability
of cash flows, liquidity, dependence on a single product/supplier/customer, depth of management, etc. are offset by strengths in other areas. Typically, these loans are secured by the operating assets of the borrower and/or real estate. The
borrower’s management is considered competent. The borrower has the ability to repay the debt in the normal course of business.
Watch – These loans have a risk rating of 5 and are included in the “pass” rating. However, there would typically be some reason for additional management oversight, such
as the borrower’s recent financial setbacks and/or deteriorating financial position, industry concerns and failure to perform on other borrowing obligations. Loans with this rating are monitored closely in an effort to correct deficiencies.
Special mention – These loans have a risk rating of 6 and are rated in accordance with regulatory guidelines. These loans have potential weaknesses that deserve
management’s close attention. If left uncorrected, these potential weaknesses may result in deterioration of the repayment prospects for the loan or in the credit position at some future date. These loans pose elevated risk but their weakness does
not yet justify a “substandard” classification.
Substandard – These loans have a risk rating of 7 and are rated in accordance with regulatory guidelines, for which the accrual of interest may or may not be
discontinued. By definition under regulatory guidelines, a “substandard” loan has defined weaknesses which make payment default or principal exposure likely but not yet certain. Repayment of such loans is likely to be dependent upon collateral
liquidation, a secondary source of repayment, or an event outside of the normal course of business.
Doubtful – These loans have a risk rating of 8 and are rated in accordance with regulatory guidelines. Such loans are placed on non-accrual status and repayment may be
dependent upon collateral which has value that is difficult to determine or upon some near-term event which lacks certainty.
Loss – These loans have a risk rating of 9 and are rated in accordance with regulatory guidelines. Such loans are charged-off or charged-down when payment is acknowledged
to be uncertain or when the timing or value of payments cannot be determined. “Loss” is not intended to imply that the loan or some portion of it will never be paid, nor does it in any way imply that there has been a forgiveness of debt.
87
The following tables present an analysis of loans by credit quality indicators at the dates indicated (in thousands):
|
March 31, 2020
|
Pass
|
Special
Mention
|
Substandard
|
Doubtful
|
Loss
|
Total Loans
Receivable
|
||||||||||||||||||
|
Commercial business
|
$
|
177,399
|
$
|
1,282
|
$
|
348
|
$
|
-
|
$
|
-
|
$
|
179,029
|
||||||||||||
|
Commercial real estate
|
506,794
|
63
|
1,014
|
-
|
-
|
507,871
|
||||||||||||||||||
|
Land
|
14,026
|
-
|
-
|
-
|
-
|
14,026
|
||||||||||||||||||
|
Multi-family
|
58,295
|
45
|
34
|
-
|
-
|
58,374
|
||||||||||||||||||
|
Real estate construction
|
64,843
|
-
|
-
|
-
|
-
|
64,843
|
||||||||||||||||||
|
Consumer
|
87,186
|
-
|
180
|
-
|
-
|
87,366
|
||||||||||||||||||
|
Total
|
$
|
908,543
|
$
|
1,390
|
$
|
1,576
|
$
|
-
|
$
|
-
|
$
|
911,509
|
||||||||||||
|
March 31, 2019
|
||||||||||||||||||||||||
|
Commercial business
|
$
|
159,997
|
$
|
840
|
$
|
1,959
|
$
|
-
|
$
|
-
|
$
|
162,796
|
||||||||||||
|
Commercial real estate
|
454,013
|
4,030
|
3,389
|
-
|
-
|
461,432
|
||||||||||||||||||
|
Land
|
16,299
|
-
|
728
|
-
|
-
|
17,027
|
||||||||||||||||||
|
Multi-family
|
51,093
|
457
|
20
|
-
|
-
|
51,570
|
||||||||||||||||||
|
Real estate construction
|
90,882
|
-
|
-
|
-
|
-
|
90,882
|
||||||||||||||||||
|
Consumer
|
92,199
|
-
|
210
|
-
|
-
|
92,409
|
||||||||||||||||||
|
Total
|
$
|
864,483
|
$
|
5,327
|
$
|
6,306
|
$
|
-
|
$
|
-
|
$
|
876,116
|
||||||||||||
Impaired loans – The following tables present information regarding impaired loans at the dates and for the years
indicated (in thousands):
|
March 31, 2020
|
Recorded
Investment with
No Specific
Valuation
Allowance
|
Recorded
Investment
with Specific Valuation
Allowance
|
Total
Recorded
Investment
|
Unpaid
Principal
Balance
|
Related
Specific
Valuation
Allowance
|
|||||||||||||||
|
Commercial business
|
$
|
139
|
$
|
-
|
$
|
139
|
$
|
170
|
$
|
-
|
||||||||||
|
Commercial real estate
|
2,378
|
-
|
2,378
|
3,405
|
-
|
|||||||||||||||
|
Land
|
714
|
-
|
714
|
748
|
-
|
|||||||||||||||
|
Multi-family
|
1,549
|
-
|
1,549
|
1,662
|
-
|
|||||||||||||||
|
Consumer
|
295
|
137
|
432
|
543
|
12
|
|||||||||||||||
|
Total
|
$
|
5,075
|
$
|
137
|
$
|
5,212
|
$
|
6,528
|
$
|
12
|
||||||||||
|
March 31, 2019
|
||||||||||||||||||||
|
Commercial business
|
$
|
160
|
$
|
-
|
$
|
160
|
$
|
182
|
$
|
-
|
||||||||||
|
Commercial real estate
|
2,482
|
-
|
2,482
|
3,424
|
-
|
|||||||||||||||
|
Land
|
728
|
-
|
728
|
766
|
-
|
|||||||||||||||
|
Multi-family
|
1,598
|
-
|
1,598
|
1,709
|
-
|
|||||||||||||||
|
Consumer
|
281
|
416
|
697
|
807
|
22
|
|||||||||||||||
|
Total
|
$
|
5,249
|
$
|
416
|
$
|
5,665
|
$
|
6,888
|
$
|
22
|
||||||||||
|
Year ended
March 31, 2020
|
Year ended
March 31, 2019
|
Year ended
March 31, 2018
|
||||||||||||||||||||||
|
Average
Recorded
Investment |
Interest
Recognized
on Impaired
Loans
|
Average
Recorded
Investment
|
Interest
Recognized
on Impaired
Loans |
Average
Recorded
Investment |
Interest
Recognized
on Impaired Loans |
|||||||||||||||||||
|
Commercial business
|
$
|
150
|
$
|
62
|
$
|
334
|
$
|
-
|
$
|
930
|
$
|
41
|
||||||||||||
|
Commercial real estate
|
2,420
|
40
|
2,607
|
64
|
4,185
|
101
|
||||||||||||||||||
|
Land
|
720
|
90
|
742
|
7
|
781
|
-
|
||||||||||||||||||
|
Multi-family
|
1,573
|
-
|
1,620
|
88
|
1,668
|
90
|
||||||||||||||||||
|
Consumer
|
494
|
29
|
992
|
45
|
1,452
|
62
|
||||||||||||||||||
|
Total
|
$
|
5,357
|
$
|
221
|
$
|
6,295
|
$
|
204
|
$
|
9,016
|
$
|
294
|
||||||||||||
The cash basis interest income on impaired loans was not materially different than the interest recognized on impaired loans as shown in the above tables.
88
TDRs and other loan modifications – TDRs are loans for which the Company, for economic or legal reasons related to
the borrower's financial condition, has granted a concession to the borrower that it would otherwise not consider. A TDR typically involves a modification of terms such as a reduction of the stated interest rate or face amount of the loan, a
reduction of accrued interest, and/or an extension of the maturity date(s) at a stated interest rate lower than the current market rate for a new loan with similar risk. TDRs are considered impaired loans and as such, impairment is measured as
described for impaired loans in Note 1 – Summary of Significant Accounting Policies – Allowance for Loan Losses.
The following table presents TDRs by interest accrual status at the dates indicated (in thousands):
|
March 31, 2020
|
March 31, 2019
|
|||||||||||||||||||||||
|
Accrual
|
Nonaccrual
|
Total
|
Accrual
|
Nonaccrual
|
Total
|
|||||||||||||||||||
|
Commercial business
|
$
|
-
|
$
|
139
|
$
|
139
|
$
|
-
|
$
|
160
|
$
|
160
|
||||||||||||
|
Commercial real estate
|
1,364
|
1,014
|
2,378
|
1,401
|
1,081
|
2,482
|
||||||||||||||||||
|
Land
|
714
|
-
|
714
|
728
|
-
|
728
|
||||||||||||||||||
|
Multi-family
|
1,549
|
-
|
1,549
|
1,598
|
-
|
1,598
|
||||||||||||||||||
|
Consumer
|
432
|
-
|
432
|
697
|
-
|
697
|
||||||||||||||||||
|
Total
|
$
|
4,059
|
$
|
1,153
|
$
|
5,212
|
$
|
4,424
|
$
|
1,241
|
$
|
5,665
|
||||||||||||
At March 31, 2020, the Company had no commitments to lend additional funds on these loans. At March 31, 2020, all of the Company’s TDRs were paying as agreed except for one
commercial real estate loan with a recorded investment of $851,000 which is classified as nonaccrual.
There was one new TDR for the year ended March 31, 2020. The new TDR is a consumer real estate loan secured by a 1-4 family property located in Southwest Washington, for which
the Company granted a rate reduction and extended the maturity date by 10 years. The recorded investment in the loan prior to modification and at March 31, 2020 was $27,000 and $25,000, respectively. There were no
new TDRs for the year ended March 31, 2019 and 2018.
In March 2020, the Company began offering short-term loan modifications to assist borrowers during the COVID-19 pandemic. The CARES Act along with a joint agency statement
issued by banking regulatory agencies provides that a short-term modification made in response to COVID-19 and which meets certain criteria does not need to be accounted for as a TDR. Accordingly, the Company does not account for such loan
modifications as TDRs. See Note 1 – Summary of Significant Accounting Policies for more information.
|
6.
|
PREMISES AND EQUIPMENT
|
Premises and equipment consisted of the following at the dates indicated (in thousands):
|
March 31,
|
||||||||
|
2020
|
2019
|
|||||||
|
Land
|
$
|
4,531
|
$
|
4,531
|
||||
|
Buildings and improvements
|
15,356
|
15,349
|
||||||
|
Leasehold improvements
|
1,666
|
1,666
|
||||||
|
Furniture and equipment
|
10,819
|
10,694
|
||||||
|
Building under finance lease
|
2,956
|
2,956
|
||||||
|
Construction in progress
|
3,245
|
733
|
||||||
|
Total
|
38,573
|
35,929
|
||||||
|
Less accumulated depreciation and amortization
|
(21,495
|
)
|
(20,471
|
)
|
||||
|
Premises and equipment, net
|
$
|
17,078
|
$
|
15,458
|
||||
Depreciation and amortization expense was $1.3 million, $1.1 million and $1.2 million for the years ended March 31, 2020, 2019 and 2018, respectively.
89
|
7.
|
GOODWILL
|
Goodwill and certain other intangibles generally arise from business combinations accounted for under the purchase method of accounting. Goodwill and other intangibles deemed
to have indefinite lives generated from business combinations are not subject to amortization and are instead tested for impairment not less than annually. The Company has two reporting units, the Bank and the Trust Company, for purposes of
evaluating goodwill for impairment. All of the Company’s goodwill has been allocated to the Bank reporting unit.
The Company performed its annual impairment assessment as of October 31, 2019 and determined that no impairment of goodwill exists. The goodwill impairment test involves a
two-step process. The first step is a comparison of the reporting unit’s fair value to its carrying value. If the reporting unit’s fair value is less than its carrying value, the Company would be required to progress to the second step. In the second
step, the Company calculates the implied fair value of goodwill and compares the implied fair value of goodwill to the carrying amount of goodwill in the Company’s consolidated balance sheet. If the carrying amount of the goodwill is greater than the
implied fair value of that goodwill, an impairment loss must be recognized in an amount equal to that excess. The implied fair value of goodwill is determined in the same manner as goodwill recognized in a business combination. The results of the
Company’s step one test indicated that the reporting unit’s fair value was greater than its carrying value, and, therefore, a step two analysis was not required; however, no assurance can be given that the Company’s goodwill will not be written down
in future periods.
As a result of the effects of the COVID-19 pandemic and its impacts on the financial markets and economy, the Company completed a qualitative assessment of goodwill as of
March 31, 2020, and concluded that it is more likely than not that the fair value of the Bank (the reporting unit), exceeds its carrying value. If adverse economic conditions or the recent decrease in the Company’s common stock price and market
capitalization as a result of the COVID-19 pandemic were sustained in the future rather than temporary, it may significantly affect the fair value of the reporting unit and may trigger future goodwill impairment charges. Any impairment charge could
have a material adverse effect on our results of operations and financial condition.
|
8.
|
DEPOSITS
|
Deposit accounts consisted of the following at the dates indicated (in thousands):
|
Account Type
|
March 31,
2020
|
March 31,
2019
|
||||||
|
Non-interest-bearing
|
$
|
271,031
|
$
|
284,854
|
||||
|
Interest-bearing checking
|
187,798
|
183,388
|
||||||
|
Money market
|
169,798
|
233,317
|
||||||
|
Savings accounts
|
226,880
|
137,503
|
||||||
|
Certificates of deposit
|
134,941
|
86,006
|
||||||
|
Total
|
$
|
990,448
|
$
|
925,068
|
||||
Individual certificates of deposit in amounts of $250,000 or more totaled $35.9 million and $10.5 million at March 31, 2020 and 2019, respectively.
Scheduled maturities of certificates of deposit for future years ending March 31 are as follows (in thousands):
|
Year Ending March 31:
|
||||
|
2021
|
$
|
74,078
|
||
|
2022
|
40,579
|
|||
|
2023
|
14,303
|
|||
|
2024
|
2,360
|
|||
|
2025
|
2,623
|
|||
|
Thereafter
|
998
|
|||
|
Total
|
$
|
134,941
|
||
Interest expense by deposit type was as follows for the years indicated (in thousands):
|
Year Ended March 31,
|
||||||||||||
|
2020
|
2019
|
2018
|
||||||||||
|
Interest-bearing checking
|
$
|
100
|
$
|
101
|
$
|
100
|
||||||
|
Money market
|
229
|
302
|
335
|
|||||||||
|
Savings accounts
|
1,054
|
145
|
133
|
|||||||||
|
Certificates of deposit
|
1,507
|
448
|
640
|
|||||||||
|
Total
|
$
|
2,890
|
$
|
996
|
$
|
1,208
|
||||||
90
|
9.
|
FEDERAL HOME LOAN BANK ADVANCES
|
FHLB advances – which consist of overnight borrowings – are summarized as follows at the dates indicated (dollars in thousands):
|
March 31,
2020
|
March 31,
2019
|
|||||||
|
FHLB advances
|
$
|
-
|
$
|
56,586
|
||||
|
Weighted average interest rate on FHLB advances (1)
|
2.54
|
%
|
2.58
|
%
|
||||
|
(1) Computed based on the borrowing activity for the years ending March 31, 2020 and 2019, respectively.
|
||||||||
The Bank has a credit line with the FHLB equal to 45% of total assets, limited by available collateral. At March 31, 2020, based on collateral values, the Bank had additional
borrowing capacity of $235.9 million from the FHLB.
FHLB advances are collateralized with the FHLB by certain investment and mortgage-backed securities, FHLB stock owned by the Bank, deposits with the FHLB, and certain mortgages
on deeds of trust securing such properties as provided in the agreements with the FHLB. At March 31, 2020, loans carried at $397.2 million were pledged as collateral to the FHLB.
|
10.
|
JUNIOR SUBORDINATED DEBENTURES
|
The Company has wholly-owned subsidiary grantor trusts that were established for the purpose of issuing trust preferred securities and common securities. The trust preferred
securities accrue and pay distributions periodically at specified annual rates as provided in each trust agreement. The trusts used the net proceeds from each of the offerings to purchase a like amount of junior subordinated debentures (the
“Debentures”) of the Company. The Debentures are the sole assets of the trusts. The Company’s obligations under the Debentures and related documents, taken together, constitute a full and unconditional guarantee by the Company of the obligations of
the trusts. The trust preferred securities are mandatorily redeemable upon maturity of the Debentures or upon earlier redemption as provided in the indentures. The Company has the right to redeem the Debentures in whole or in part on or after
specific dates, at a redemption price specified in the indentures governing the Debentures plus any accrued but unpaid interest to the redemption date. The Company also has the right to defer the payment of interest on each of the Debentures for a
period not to exceed 20 consecutive quarters, provided that the deferral period does not extend beyond the stated maturity. During such deferral period, distributions on the corresponding trust preferred securities will also be deferred and the
Company may not pay cash dividends to the holders of shares of the Company’s common stock.
The Debentures issued by the Company to the grantor trusts, totaling $26.7 million and $26.6 million at March 31, 2020 and 2019, respectively, are reported
as “junior subordinated debentures” in the consolidated balance sheets. The common securities issued by the grantor trusts were purchased by the Company, and the Company’s investment in the common securities of $836,000 at both March 31, 2020 and
2019, is included in prepaid expenses and other assets in the consolidated balance sheets. The Company records interest expense on the Debentures in the consolidated statements of income.
The following table is a summary of the terms and the amounts outstanding of the Debentures at March 31, 2020 (dollars in thousands):
|
Issuance Trust
|
Issuance
Date
|
Amount
Outstanding
|
Rate Type
|
Initial
Rate
|
Current
Rate
|
Maturity
Date |
||||||||
|
Riverview Bancorp Statutory Trust I
|
12/2005
|
$
|
7,217
|
Variable (1)
|
5.88
|
%
|
2.10
|
%
|
3/2036
|
|||||
|
Riverview Bancorp Statutory Trust II
|
06/2007
|
15,464
|
Variable (2)
|
7.03
|
%
|
2.09
|
%
|
9/2037
|
||||||
|
Merchants Bancorp Statutory Trust I (4)
|
06/2003
|
5,155
|
Variable (3)
|
4.16
|
%
|
4.33
|
%
|
6/2033
|
||||||
|
27,836
|
||||||||||||||
|
Fair value adjustment (4)
|
(1,174
|
)
|
||||||||||||
|
Total Debentures
|
$
|
26,662
|
||||||||||||
|
(1) The trust preferred securities reprice quarterly based on the three-month LIBOR plus 1.36%.
|
||||||||||||||
|
(2) The trust preferred securities reprice quarterly based on the three-month LIBOR plus 1.35%.
|
||||||||||||||
|
(3) The trust preferred securities reprice quarterly based on the three-month LIBOR plus 3.10%.
|
||||||||||||||
|
(4) Amount, net of accretion, attributable to a prior year’s business combination.
|
||||||||||||||
91
|
11.
|
INCOME TAXES
|
Provision for income taxes consisted of the following for the periods indicated (in thousands):
|
Year Ended March 31
|
||||||||||||
|
|
2020 |
|
2019 |
|
2018 | |||||||
|
Current
|
$
|
5,404
|
$
|
5,157
|
$
|
4,087
|
||||||
|
Deferred
|
(574
|
)
|
(11
|
)
|
3,668
|
|||||||
|
Total
|
$
|
4,830
|
$
|
5,146
|
$
|
7,755
|
||||||
The tax effects of temporary differences that give rise to significant portions of deferred tax assets and deferred tax liabilities are as follows at the dates indicated (in
thousands):
|
March 31, 2020
|
March 31, 2019
|
|||||||
|
Deferred tax assets:
|
||||||||
|
Deferred compensation
|
$
|
63
|
$
|
45
|
||||
|
Allowance for loan losses
|
3,143
|
2,862
|
||||||
|
Accrued expenses
|
137
|
131
|
||||||
|
Accumulated depreciation and amortization
|
935
|
797
|
||||||
|
Deferred gain on sale
|
129
|
167
|
||||||
|
Purchase accounting
|
123
|
141
|
||||||
|
Net unrealized loss on investment securities available for sale
|
-
|
829
|
||||||
|
Operating lease liabilities
|
971
|
-
|
||||||
|
Other
|
352
|
242
|
||||||
|
Total deferred tax assets
|
5,853
|
5,214
|
||||||
|
Deferred tax liabilities:
|
||||||||
|
FHLB stock dividend
|
(38
|
)
|
(97
|
)
|
||||
|
Prepaid expenses
|
(84
|
)
|
(148
|
)
|
||||
|
Operating lease right-of-use assets
|
(947
|
)
|
-
|
|||||
|
Net unrealized gain on investment securities available for sale
|
(663
|
)
|
-
|
|||||
|
Loan fees/costs
|
(844
|
)
|
(774
|
)
|
||||
|
Total deferred tax liabilities
|
(2,576
|
)
|
(1,019
|
)
|
||||
|
Deferred tax assets, net
|
$
|
3,277
|
$
|
4,195
|
||||
A reconciliation of the Company’s effective income tax rate with the federal statutory tax rate is as follows for the years indicated:
|
Year Ended March 31,
|
||||||||||||
|
2020
|
2019
|
2018
|
||||||||||
|
Statutory federal income tax rate
|
21.0
|
%
|
21.0
|
%
|
30.8
|
%
|
||||||
|
State and local income tax rate
|
3.0
|
3.0
|
2.5
|
|||||||||
|
Revaluation of net deferred tax assets due to Tax Act
|
-
|
-
|
11.4
|
|||||||||
|
ESOP market value adjustment
|
(0.1
|
)
|
(0.1
|
)
|
-
|
|||||||
|
BOLI
|
(1.0
|
)
|
(0.8
|
)
|
(1.5
|
)
|
||||||
|
Other, net
|
0.6
|
(0.1
|
)
|
(0.1
|
)
|
|||||||
|
Effective federal income tax rate
|
23.5
|
%
|
23.0
|
%
|
43.1
|
%
|
||||||
For the fiscal years ended 2020 and 2019, the Company utilized a federal corporate income tax rate of 21.0%. On December 22, 2017, the federal government enacted the Tax Cuts
and Jobs Act (the “Tax Act”). The Tax Act made significant changes to the U.S. tax law including, among other things: a reduction in the federal corporate income tax rate from a maximum of 35.0% to 21.0% effective January 1, 2018; changes to the tax
treatment of net operating loss carryforwards and carrybacks; and a repeal of the corporate alternative minimum tax. The Tax Act reduced the Company’s federal corporate income tax rate from 34.0% to a blended federal corporate income tax rate of
30.8% for the fiscal year ended March 31, 2018. As a result of using a blended tax rate, the Company recognized a $422,000 benefit for income taxes during the year ended March 31, 2018. Also as a result of the Tax Act, the reduction of the corporate
tax rate required the Company to remeasure its deferred tax assets and liabilities based upon the lower federal tax rate. Accordingly, during the year ended March 31, 2018, the Company recorded a one-time $2.1 million charge to the provision for
income taxes in conjunction with remeasuring its net deferred tax assets to account for the future impact of the decrease in the federal corporate income tax rate. In addition, during the year ended March 31, 2018, the Company made an adjustment
between retained earnings and AOCI related to the stranded tax effects due to the change in the federal corporate tax rate applied to the net unrealized losses on available for sale investment securities.
92
The Bank’s retained earnings at both March 31, 2020 and 2019 include a base year allowance for loan losses, which amounted to $2.2 million, for which no federal income tax
liability has been recognized. The related unrecognized deferred tax liability at both March 31, 2020 and 2019 was $517,000. This represents the balance of the allowance for loan losses created for tax purposes as of December 31, 1987. This amount is
subject to recapture in the unlikely event that the Company’s banking subsidiaries (1) make distributions in excess of current and accumulated earnings and profits, as calculated for federal tax purposes, (2) redeem their stock, or (3) liquidate.
Management does not expect this temporary difference to reverse in the foreseeable future.
At March 31, 2020 and 2019, the Company had no unrecognized tax benefits or uncertain tax positions. In addition, the Company had no accrued interest or penalties related to
income tax matters as of March 31, 2020 or 2019. It is the Company’s policy to recognize potential accrued interest and penalties related to income tax matters as a component of the provision for income taxes. The Company is subject to U.S. federal
and State of Oregon income taxes. The years 2017 to 2019 remain open to examination for federal income taxes, and the years 2016 to 2019 remain open to State of Oregon examination.
|
12.
|
EMPLOYEE BENEFIT PLANS
|
Retirement Plan – The Riverview Bancorp, Inc.
Employees’ Savings and Profit Sharing Plan (the “Plan”) is a defined contribution profit-sharing plan incorporating the provisions of Section 401(k) of the Internal Revenue Code. Company expenses related to the Plan for the years ended March 31,
2020, 2019 and 2018 were $561,000, $527,000 and $547,000, respectively.
Directors’ and Executive Officers’ Deferred Compensation Plan (“Deferred Compensation Plan”) – The Deferred
Compensation Plan is a nonqualified deferred compensation plan. Directors may elect to defer their monthly directors’ fees until retirement with no income tax payable by the director until retirement benefits are received. The Chairman, President,
and Executive and Senior Vice Presidents of the Company may also defer salary into the Deferred Compensation Plan. The Company accrues annual interest on the unfunded liability under the Deferred Compensation Plan based upon a formula relating to
gross revenues, which was 4.46%, 4.28% and 3.99% for the years ended March 31, 2020, 2019 and 2018, respectively. The estimated liability under the Deferred Compensation Plan is accrued as earned by the participants. At March 31, 2020 and 2019, the
Company’s aggregate liability under the Deferred Compensation Plan was $263,000 and $186,000, respectively, which is recorded in accrued expenses and other liabilities in the accompanying consolidated balance sheets.
Stock Option Plans – In
July 2003, shareholders of the Company approved the adoption of the 2003 Stock Option Plan (“2003 Plan”). The 2003 Plan was effective in July 2003 and expired in July 2013. Accordingly, no further option awards may be granted under the 2003 Plan;
however, any awards granted prior to their respective expiration dates remain outstanding subject to their terms. Each option granted under the 2003 Plan has an exercise price equal to the fair market value of the Company’s common stock on the date
of the grant, a maximum term of ten years and a vesting period from zero to five years.
In July 2017, the shareholders of the Company approved the Riverview Bancorp, Inc. 2017 Equity Incentive Plan (“2017 Plan”). The 2017 Plan provides for the grant of incentive
stock options, non-qualified stock options, restricted stock and restricted stock units. The Company has reserved 1,800,000 shares of its common stock for issuance under the 2017 Plan. The 2003 Plan and the 2017 Plan are collectively referred to as
“the Stock Option Plans.”
The fair value of each stock option granted is estimated on the date of grant using the Black-Scholes stock option valuation model. The fair value of all awards is amortized
on a straight-line basis over the requisite service periods, which are generally the vesting periods. The expected life of options granted represents the period of time that they are expected to be outstanding. The expected life is determined based
on historical experience with similar options, giving consideration to the contractual terms and vesting schedules. Expected volatility is estimated at the date of grant based on the historical volatility of the Company’s common stock. Expected
dividends are based on dividend trends and the market value of the Company’s common stock at the time of grant. The risk-free interest rate for periods within the contractual life of the options is based on the U.S. Treasury yield curve in effect at
the time of the grant. There were no stock options granted during the years ended March 31, 2020, 2019 and 2018 under the Stock Option Plans.
As of March 31, 2020, all outstanding stock options were fully vested and there was no remaining unrecognized compensation expense related to stock options granted under the
Stock Option Plans. There was no stock-based compensation expense related to stock options for the years ended March 31, 2020, 2019 and 2018 under the Stock Option Plans.
93
The following table presents the activity related to stock options under the Stock Option Plans for the years indicated:
|
Year Ended March 31,
|
||||||||||||||||||||||||
|
2020
|
2019
|
2018
|
||||||||||||||||||||||
|
Number of
Shares
|
Weighted
Average
Exercise
Price
|
Number of
Shares
|
Weighted
Average
Exercise
Price
|
Number of
Shares
|
Weighted
Average
Exercise
Price
|
|||||||||||||||||||
|
Balance, beginning of year
|
101,332
|
$
|
3.26
|
141,365
|
$
|
3.77
|
220,654
|
$
|
4.74
|
|||||||||||||||
|
Options exercised
|
(58,000
|
)
|
3.69
|
(37,533
|
)
|
4.84
|
(59,289
|
)
|
4.13
|
|||||||||||||||
|
Options expired
|
-
|
-
|
(2,500
|
)
|
8.12
|
(20,000
|
)
|
13.42
|
||||||||||||||||
|
Balance, end of year
|
43,332
|
$
|
2.69
|
101,332
|
$
|
3.26
|
141,365
|
$
|
3.77
|
|||||||||||||||
Additional information regarding stock options outstanding as of March 31, 2020 is as follows:
`
| Options Outstanding |
Options Exercisable |
|||||||||
|
Weighted Avg
|
Weighted
|
Weighted
|
||||||||
|
Remaining
|
Average
|
Average
|
||||||||
|
Range of
|
Contractual
|
Exercise
|
Exercise
|
|||||||
|
Exercise Price
|
Life (years)
|
Number
|
Price
|
Number
|
Price
|
|||||
|
$1.00 - $3.00
|
2.80
|
43,332
|
$2.69
|
43,332
|
$2.69
|
|||||
The following table presents information on stock options outstanding, less estimated forfeitures, as of March 31, 2020 and 2019:
|
March 31, 2020
|
March 31, 2019
|
|||||||
|
Stock options fully vested and expected to vest:
|
||||||||
|
Number
|
43,332
|
101,332
|
||||||
|
Weighted average exercise price
|
$
|
2.69
|
$
|
3.26
|
||||
|
Aggregate intrinsic value (1)
|
$
|
101,000
|
$
|
410,000
|
||||
|
Weighted average contractual term of options (years)
|
2.80
|
2.20
|
||||||
|
Stock options fully vested and currently exercisable:
|
||||||||
|
Number
|
43,332
|
101,332
|
||||||
|
Weighted average exercise price
|
$
|
2.69
|
$
|
3.26
|
||||
|
Aggregate intrinsic value (1)
|
$
|
101,000
|
$
|
410,000
|
||||
|
Weighted average contractual term of options (years)
|
2.80
|
2.20
|
||||||
|
(1) The aggregate intrinsic value of a stock option in the table above represents the total pre-tax intrinsic
value (the amount by which the current market value of the underlying stock exceeds the exercise price) that would have been received by the option holders had all option holders exercised. This amount changes based on changes in the market
value of the Company’s stock.
|
||||||||
The total intrinsic value of stock options exercised was $238,000, $153,000 and $257,000 for the years ended March 31, 2020, 2019 and 2018, respectively.
During the year ended March 31, 2020, the Company granted a total of 82,673 shares of restricted stock pursuant to the 2017 Plan of which vesting for 49,298 shares of restricted
stock were time based and vesting for 33,375 shares of restricted stock were performance based subject to attaining certain performance metrics.
The fair value of restricted stock awards is equal to the fair value of the Company’s stock on the date of grant. The related stock-based compensation expense is recorded over
the requisite service period. Stock-based compensation related to restricted stock grants was $302,000 for the year ended March 31, 2020. There was no stock-based compensation related to restricted stock for the years ended March 31, 2019 and 2018.
The unrecognized stock-based compensation related to restricted stock was $323,000 at March 31, 2020. The weighted average vesting period for the restricted stock was 1.68 years at March 31, 2020.
94
The following table presents the activity related to restricted stock for the year ended March 31, 2020 :
|
Time-Based
|
Performance-Based
|
Total
|
||||||||||||||||||||||
|
Number of
Unvested
Shares
|
Weighted
Average
Market
Price
|
Number of
Unvested
Shares
|
Weighted
Average
Market
Price
|
Number of
Unvested
Shares
|
Weighted
Average
Market
Price
|
|||||||||||||||||||
|
Balance, beginning of period
|
-
|
$
|
-
|
-
|
$
|
-
|
-
|
$
|
-
|
|||||||||||||||
|
Granted
|
49,298
|
8.35
|
33,375
|
8.35
|
82,673
|
8.35
|
||||||||||||||||||
|
Forfeited
|
-
|
-
|
-
|
-
|
-
|
-
|
||||||||||||||||||
|
Vested
|
-
|
-
|
-
|
-
|
-
|
-
|
||||||||||||||||||
|
Cancelled
|
-
|
-
|
-
|
-
|
-
|
-
|
||||||||||||||||||
|
Balance, end of period
|
49,298
|
$
|
8.35
|
33,375
|
$
|
8.35
|
82,673
|
$
|
8.35
|
|||||||||||||||
The Company anticipates cancelling approximately 8,000 shares of performance-based restricted stock subsequent to March 31, 2020 due to not achieving certain performance
metrics.
Employee Stock Ownership Plan - The Company sponsors an ESOP that covers
all employees with at least one year and 1,000 hours of service who are over the age of 21. During the year ended March 31, 2018, all remaining unreleased ESOP shares were allocated to participants. Accordingly, as of March 31, 2018, all of the
original 962,584 ESOP shares had been released and allocated to participant accounts. ESOP compensation expense included in salaries and employee benefits was $148,000 for the year ended March 31, 2018.
For the years ended March 31, 2020 and 2019, the Bank purchased 43,545 and 25,000 shares of common stock, respectively, on the open market and contributed such shares to the
ESOP as a discretionary employer contribution. As of March 31, 2020, there were approximately 19,000 shares which had not been allocated to participant accounts under the Company’s ESOP. As of March 31, 2019,
there were an insignificant number of shares which had not been allocated to participant accounts under the Company’s ESOP. The Company recorded employee benefits expense of $195,000 and $197,000 for these contributions for the years ended March 31,
2020 and 2019, respectively, which represented the fair value of the related common stock on the date it was acquired. Shares held by the ESOP at March 31, 2020 and 2019 totaled 410,045 and 441,966, respectively.
Trust Company Stock Options – At March 31, 2020 and 2019, there were 1,000 and 2,500 Trust Company stock options
outstanding, respectively, which had been granted to the President and Chief Executive Officer of the Trust Company. During each of the years ended March 31, 2020 and 2019, the Trust Company incurred $44,000 of stock-based compensation expense
related to these options. For the year ended March 31, 2020, 1,500 Trust Company stock options were exercised. For the year ended March 31, 2019, no Trust Company stock options were exercised. There were no Trust Company stock options granted during
the years ended March 31, 2020, 2019 and 2018.
|
13.
|
SHAREHOLDERS’ EQUITY AND REGULATORY CAPITAL REQUIREMENTS
|
The Bank is subject to various regulatory capital requirements administered by the Office of the Comptroller of the Currency (“OCC”). Failure to meet minimum capital requirements can result in the initiation of certain mandatory and possibly additional discretionary actions by regulators that, if undertaken, could have a
direct material effect on the Bank’s financial statements. Under capital adequacy guidelines and the
regulatory framework for prompt corrective action, the Bank must meet specific capital guidelines that involve quantitative measures of the Bank’s assets, liabilities and certain off-balance sheet items as calculated under regulatory accounting
practices. The Bank’s capital amounts and classification are also subject to qualitative judgments by the regulators about components, risk weightings and other factors.
Quantitative measures established by regulation to ensure capital adequacy require the Bank to maintain minimum amounts and ratios of total and tier I capital to
risk-weighted assets, core capital to total assets and tangible capital to tangible assets (set forth in the table below). Management believes the Bank met all capital adequacy requirements
to which it was subject as of March 31, 2020.
95
As of March 31, 2020, the most recent notification from the OCC categorized the Bank as “well capitalized” under the regulatory framework for prompt corrective action. The
Bank’s actual and required minimum capital amounts and ratios were as follows at the dates indicated (dollars in thousands):
|
Actual
|
For Capital
Adequacy Purposes
|
“Well Capitalized”
Under Prompt
Corrective Action
|
||||||||||||||||||||||
|
Amount
|
Ratio
|
Amount
|
Ratio
|
Amount
|
Ratio
|
|||||||||||||||||||
|
March 31, 2020
|
||||||||||||||||||||||||
|
Total Capital:
|
||||||||||||||||||||||||
|
(To Risk-Weighted Assets)
|
$
|
145,949
|
17.01
|
%
|
$
|
68,630
|
8.0
|
%
|
$
|
85,787
|
10.0
|
%
|
||||||||||||
|
Tier 1 Capital:
|
||||||||||||||||||||||||
|
(To Risk-Weighted Assets)
|
135,196
|
15.76
|
51,472
|
6.0
|
68,630
|
8.0
|
||||||||||||||||||
|
Common equity tier 1 Capital:
|
||||||||||||||||||||||||
|
(To Risk-Weighted Assets)
|
135,196
|
15.76
|
38,604
|
4.5
|
55,762
|
6.5
|
||||||||||||||||||
|
Tier 1 Capital (Leverage):
|
||||||||||||||||||||||||
|
(To Average Tangible Assets)
|
135,196
|
11.79
|
45,851
|
4.0
|
57,313
|
5.0
|
||||||||||||||||||
|
Actual
|
For Capital
Adequacy Purposes
|
“Well Capitalized”
Under Prompt
Corrective Action
|
||||||||||||||||||||||
|
March 31, 2019
|
Amount
|
Ratio
|
Amount
|
Ratio
|
Amount
|
Ratio
|
||||||||||||||||||
|
Total Capital:
|
||||||||||||||||||||||||
|
(To Risk-Weighted Assets)
|
$
|
140,062
|
16.88
|
%
|
$
|
66,379
|
8.0
|
%
|
$
|
82,974
|
10.0
|
%
|
||||||||||||
|
Tier 1 Capital:
|
||||||||||||||||||||||||
|
(To Risk-Weighted Assets)
|
129,671
|
15.63
|
49,784
|
6.0
|
66,379
|
8.0
|
||||||||||||||||||
|
Common equity tier 1 Capital:
|
||||||||||||||||||||||||
|
(To Risk-Weighted Assets)
|
129,671
|
15.63
|
37,338
|
4.5
|
53,933
|
6.5
|
||||||||||||||||||
|
Tier 1 Capital (Leverage):
|
||||||||||||||||||||||||
|
(To Average Tangible Assets)
|
129,671
|
11.56
|
44,874
|
4.0
|
56,092
|
5.0
|
||||||||||||||||||
In addition to the minimum common equity tier 1 (“CET1”), Tier 1 and total capital ratios, the Bank is required to maintain a capital conservation buffer consisting of
additional CET1 capital in order to avoid limitations on paying dividends, engaging in share repurchases, and paying discretionary bonuses based on percentages of eligible retained income that could be utilized for such actions. The capital
conservation buffer is required to be an amount greater than 2.5% of risk-weighted assets. As of March 31, 2020, the Bank’s CET1 capital exceeded the required capital conservation buffer at an amount greater than 2.5%.
For a savings and loan holding company, such as the Company, the capital guidelines apply on a bank only basis. The Federal Reserve expects the holding company’s subsidiary
banks to be well capitalized under the prompt corrective action regulations. If the Company was subject to regulatory guidelines for bank holding companies at March 31, 2020, the Company would have exceeded all regulatory capital requirements.
At periodic intervals, the OCC and the FDIC routinely examine the Bank’s financial condition and risk management processes as part of their legally prescribed oversight.
Based on their examinations, these regulators can direct that the Company’s consolidated financial statements be adjusted in accordance with their findings. A future examination by the OCC or the FDIC could include a review of certain transactions or
other amounts reported in the Company’s 2020 consolidated financial statements.
|
14.
|
EARNINGS PER SHARE
|
Basic earnings per share (“EPS”) is computed by dividing net income or loss applicable to common stock by the weighted average number of common shares outstanding during the
period, without considering any dilutive items. Diluted EPS is computed by dividing net income or loss applicable to common stock by the weighted average number of common shares and common stock equivalents for items that are dilutive, net of shares
assumed to be repurchased using the treasury stock method at the average share price for the Company’s common stock during the period. Common stock equivalents arise from the assumed exercise of outstanding stock options and assumed vesting of
restricted stock. For the years ended March 31, 2020 and 2019, there were no stock options excluded in computing diluted EPS. For the year ended March 31, 2018, stock options for 8,000 shares of common stock were excluded in computing diluted EPS
because they were antidilutive.
96
In February 2020, the Company’s Board of Directors adopted a stock repurchase program (the “repurchase program”). Under the repurchase program, the Company may repurchase up
to 500,000 shares of the Company’s outstanding shares of common stock, in the open market based on prevailing market prices, or in private negotiated transactions, during the period from March 12, 2020 until the earlier of the completion of the
repurchase of 500,000 shares of the Company’s common stock or the next six months, depending on market conditions. As of March 31, 2020, the Company had repurchased 204,100 shares under the repurchase program at an average price of $4.94 per share.
As of April 17, 2020, the Company had repurchased the remaining 295,900 shares at an average price of $4.85 per share. The Company did not repurchase any shares of its common stock during the years ended March 31, 2019 or 2018.
The following table presents a reconciliation of the components used to compute basic and diluted EPS for the years indicated:
|
Year Ended March 31,
|
||||||||||||||
|
(Dollars and share data in thousands, except per share data)
|
2020
|
2019
|
2018
|
|||||||||||
|
P
|
||||||||||||||
|
Basic EPS computation:
|
||||||||||||||
|
Numerator-net income
|
$
|
15,748
|
$
|
17,266
|
$
|
10,242
|
||||||||
|
Denominator-weighted average common shares outstanding
|
22,643
|
22,588
|
22,531
|
|||||||||||
|
Basic EPS
|
$
|
0.70
|
$
|
0.76
|
$
|
0.45
|
||||||||
|
Diluted EPS computation:
|
||||||||||||||
|
Numerator-net income
|
$
|
15,748
|
$
|
17,266
|
$
|
10,242
|
||||||||
|
Denominator-weighted average common shares outstanding
|
22,643
|
22,588
|
22,531
|
|||||||||||
|
Effect of dilutive stock options and restricted stock
|
55
|
72
|
92
|
|||||||||||
|
Weighted average common shares and common stock
|
||||||||||||||
|
equivalents
|
22,698
|
22,660
|
22,623
|
|||||||||||
|
Diluted EPS
|
$
|
0.69
|
$
|
0.76
|
$
|
0.45
|
||||||||
|
15.
|
FAIR VALUE MEASUREMENTS
|
Fair value is defined under GAAP as the exchange price that would be received for an asset or paid to transfer a liability (exit price) in the principal or most advantageous
market for the asset or liability in an orderly transaction between market participants on the measurement date. GAAP requires that valuation techniques maximize the use of observable inputs and minimize the use of unobservable inputs. GAAP also
establishes a fair value hierarchy which prioritizes the valuation inputs into three broad levels. Based on the underlying inputs, each fair value measurement in its entirety is reported in one of three levels. These levels are:
Quoted prices in active markets for identical assets (Level 1): Inputs that are quoted unadjusted prices in active markets for identical assets or liabilities that the Company
has the ability to access at the measurement date. An active market is a market in which transactions for the asset or liability occur with sufficient frequency and volume to provide pricing information on an ongoing basis.
Other observable inputs (Level 2): Inputs that reflect the assumptions market participants would use in pricing the asset or liability developed based on market data obtained
from sources independent of the reporting entity including quoted prices for similar assets or liabilities in active markets, quoted prices for identical or similar assets or liabilities in inactive markets and inputs derived principally from or
corroborated by observable market data by correlation or other means.
Significant unobservable inputs (Level 3): Inputs that reflect the reporting entity's own assumptions about the assumptions market participants would use in pricing an asset or
liability developed based on the best information available in the circumstances.
Financial instruments are presented in the tables that follow by recurring or nonrecurring measurement status. Recurring assets are initially measured at fair value and are
required to be remeasured at fair value in the consolidated financial statements at each reporting date. Assets measured on a nonrecurring basis are assets that, as a result of an event or circumstance, were required to be remeasured at fair value
after initial recognition in the consolidated financial statements at some time during the reporting period.
97
The following tables present assets that are measured at estimated fair value on a recurring basis at the dates indicated (in thousands):
|
Estimated Fair Value Measurements Using
|
||||||||||||||||
|
March 31, 2020
|
Total Estimated
Fair Value
|
Level 1
|
Level 2
|
Level 3
|
||||||||||||
|
Investment securities available for sale:
|
||||||||||||||||
|
Municipal securities
|
$
|
4,877
|
$
|
-
|
$
|
4,877
|
$
|
-
|
||||||||
|
Agency securities
|
6,016
|
-
|
6,016
|
-
|
||||||||||||
|
Real estate mortgage investment conduits
|
43,791
|
-
|
43,791
|
-
|
||||||||||||
|
Residential mortgage-backed securities
|
60,085
|
-
|
60,085
|
-
|
||||||||||||
|
Other mortgage-backed securities
|
33,522
|
-
|
33,522
|
-
|
||||||||||||
|
Total assets measured at fair value on a recurring basis
|
$
|
148,291
|
$
|
-
|
$
|
148,291
|
$
|
-
|
||||||||
|
Estimated Fair Value Measurements Using
|
||||||||||||||||
|
March 31, 2019
|
Total Estimated
Fair Value
|
Level 1
|
Level 2
|
Level 3
|
||||||||||||
|
Investment securities available for sale:
|
||||||||||||||||
|
Municipal securities
|
$
|
8,881
|
$
|
-
|
$
|
8,881
|
$
|
-
|
||||||||
|
Agency securities
|
12,341
|
-
|
12,341
|
-
|
||||||||||||
|
Real estate mortgage investment conduits
|
40,162
|
-
|
40,162
|
-
|
||||||||||||
|
Residential mortgage-backed securities
|
75,821
|
-
|
75,821
|
-
|
||||||||||||
|
Other mortgage-backed securities
|
41,021
|
-
|
41,021
|
-
|
||||||||||||
|
Total assets measured at fair value on a recurring basis
|
$
|
178,226
|
$
|
-
|
$
|
178,226
|
$
|
-
|
||||||||
There were no transfers of assets into or out of Levels 1, 2 or 3 during the years ended March 31, 2020 and 2019.
The following methods were used to estimate the fair value of investment securities in the above table:
Investment securities are included within Level 1 of the hierarchy when quoted prices in an active market for identical assets are available. The Company uses a third-party
pricing service to assist the Company in determining the fair value of its Level 2 securities, which incorporates pricing models and/or quoted prices of investment securities with similar characteristics. Investment securities are included within
Level 3 of the hierarchy when there are significant unobservable inputs.
For Level 2 securities, the independent pricing service provides pricing information by utilizing evaluated pricing models supported with market data information. Standard
inputs include benchmark yields, reported trades, broker/dealer quotes, issuer spreads, two-sided markets, benchmark securities, bids, offers and reference data from market research publications. The Company’s third-party pricing service has
established processes for the Company to submit inquiries regarding the estimated fair value. In such cases, the Company’s third-party pricing service will review the inputs to the evaluation in light of any new market data presented by the Company.
The Company’s third-party pricing service may then affirm the original estimated fair value or may update the evaluation on a go-forward basis.
Management reviews the pricing information received from the third-party pricing service through a combination of procedures that include an evaluation of methodologies used by
the pricing service, analytical reviews and performance analysis of the prices against statistics and trends. Based on this review, management determines whether the current placement of the security in the fair value hierarchy is appropriate or
whether transfers may be warranted. As necessary, management compares prices received from the pricing service to discounted cash flow models or by performing independent valuations of inputs and assumptions similar to those used by the pricing
service in order to help ensure prices represent a reasonable estimate of fair value.
98
The following tables present assets that are measured at estimated fair value on a nonrecurring basis at the dates indicated (in thousands):
|
|
Estimated fair value measurements using
|
|||||||||||||||
|
March 31, 2020
|
Total estimated
fair value
|
Level 1
|
Level 2
|
Level 3
|
||||||||||||
|
Impaired loans
|
$
|
125
|
$
|
-
|
$
|
-
|
$
|
125
|
||||||||
|
March 31, 2019
|
||||||||||||||||
|
Impaired loans
|
$
|
394
|
$
|
-
|
$
|
-
|
$
|
394
|
||||||||
The following table presents quantitative information about Level 3 inputs for financial instruments measured at fair value on a nonrecurring basis at March 31, 2020 and 2019:
|
Valuation technique
|
Significant unobservable inputs
|
Range
|
||||
|
Impaired loans
|
Appraised value
Discounted cash flows
|
Adjustment for market conditions
Discount rate
|
N/A(1)
5.25% - 8.00%
|
|||
|
(1) There were no adjustments to appraised values of impaired loans as of March 31, 2020 and 2019.
|
||||||
For information regarding the Company’s method for estimating the fair value of impaired loans, see Note 1 – Summary of Significant Accounting Policies – Allowance for Loan
Losses.
In determining the estimated net realizable value of the underlying collateral, the Company primarily uses third-party appraisals which may utilize a single valuation approach
or a combination of approaches including comparable sales and the income approach. Adjustments are routinely made in the appraisal process by the appraisers to adjust for differences between the comparable sales and income data available and include
consideration of variations in location, size, and income production capacity of the property. Additionally, the appraisals are periodically further adjusted by the Company in consideration of charges that may be incurred in the event of foreclosure
and are based on management’s historical knowledge, changes in business factors and changes in market conditions.
Impaired loans are reviewed and evaluated quarterly for additional impairment and adjusted accordingly based on the same factors identified above. Because of the high degree of
judgment required in estimating the fair value of collateral underlying impaired loans and because of the relationship between fair value and general economic conditions, the Company considers the fair value of impaired loans to be highly sensitive
to changes in market conditions.
The following disclosure of the estimated fair value of financial instruments is made in accordance with GAAP. The Company, using available market information and appropriate
valuation methodologies, has determined the estimated fair value amounts. However, considerable judgment is necessary to interpret market data in the development of the estimates of fair value. Accordingly, the estimates presented herein are not
necessarily indicative of the amounts the Company could realize in the future. The use of different market assumptions and/or estimation methodologies may have a material effect on the estimated fair value amounts.
99
The carrying amounts and estimated fair values of financial instruments are as follows at the dates indicated (in thousands):
|
March 31, 2020
|
Carrying
Amount
|
Level 1
|
Level 2
|
Level 3
|
Estimated
Fair Value
|
|||||||||||||||
|
Assets:
|
||||||||||||||||||||
|
Cash and cash equivalents
|
$
|
41,968
|
$
|
41,968
|
$
|
-
|
$
|
-
|
$
|
41,968
|
||||||||||
|
Certificates of deposit held for investment
|
249
|
-
|
258
|
-
|
258
|
|||||||||||||||
|
Loans held for sale
|
275
|
-
|
275
|
-
|
275
|
|||||||||||||||
|
Investment securities available for sale
|
148,291
|
-
|
148,291
|
-
|
148,291
|
|||||||||||||||
|
Investment securities held to maturity
|
28
|
-
|
28
|
-
|
28
|
|||||||||||||||
|
Loans receivable, net
|
898,885
|
-
|
-
|
889,398
|
889,398
|
|||||||||||||||
|
FHLB stock
|
1,420
|
-
|
1,420
|
-
|
1,420
|
|||||||||||||||
|
Liabilities:
|
||||||||||||||||||||
|
Certificates of deposit
|
134,941
|
-
|
136,997
|
-
|
136,997
|
|||||||||||||||
|
Junior subordinated debentures
|
26,662
|
-
|
-
|
12,127
|
12,127
|
|||||||||||||||
|
|
||||||||||||||||||||
|
March 31, 2019
|
||||||||||||||||||||
|
Assets:
|
||||||||||||||||||||
|
Cash and cash equivalents
|
$
|
22,950
|
$
|
22,950
|
$
|
-
|
$
|
-
|
$
|
22,950
|
||||||||||
|
Certificates of deposit held for investment
|
747
|
-
|
746
|
-
|
746
|
|||||||||||||||
|
Loans held for sale
|
909
|
-
|
909
|
-
|
909
|
|||||||||||||||
|
Investment securities available for sale
|
178,226
|
-
|
178,226
|
-
|
178,226
|
|||||||||||||||
|
Investment securities held to maturity
|
35
|
-
|
35
|
-
|
35
|
|||||||||||||||
|
Loans receivable, net
|
864,659
|
-
|
-
|
862,429
|
862,429
|
|||||||||||||||
|
FHLB stock
|
3,644
|
-
|
3,644
|
-
|
3,644
|
|||||||||||||||
|
Liabilities:
|
||||||||||||||||||||
|
Certificates of deposit
|
86,006
|
-
|
84,455
|
-
|
84,455
|
|||||||||||||||
|
FHLB advances
|
56,586
|
-
|
56,586
|
-
|
56,586
|
|||||||||||||||
|
Junior subordinated debentures
|
26,575
|
-
|
-
|
15,468
|
15,468
|
|||||||||||||||
Fair value estimates were based on existing financial instruments without attempting to estimate the value of anticipated future business. The fair value
was not estimated for assets and liabilities that were not considered financial instruments.
|
16.
|
REVENUE FROM CONTRACTS WITH CUSTOMERS
|
In accordance with ASC Topic 606 “Revenues from Contracts with Customers” (“ASC 606”), revenues are recognized when goods or services are transferred to the customer in exchange
for the consideration the Company expects to be entitled to receive. The largest portion of the Company’s revenue is from interest income, which is not within the scope of ASC 606. All of the Company's revenue from contracts with customers within the
scope of ASC 606 is recognized in non-interest income with the exception of gains on sales of REO, which are included in non-interest expense.
If a contract is determined to be within the scope of ASC 606, the Company recognizes revenue as it satisfies a performance obligation. Payments from customers are generally
collected at the time services are rendered, monthly, or quarterly. For contracts with customers within the scope of ASC 606, revenue is either earned at a point in time or revenue is earned over time. Examples of revenue earned at a point in time
are automated teller machine (“ATM”) transaction fees, wire transfer fees, overdraft fees and interchange fees. Revenue earned at a point in time is primarily based on the number and type of transactions that are generally derived from transactional
information accumulated by the Company’s systems and is recognized immediately as the transactions occur or upon providing the service to complete the customer’s transaction. The Company is generally the principal in these contracts, with the
exception of interchange fees, in which case the Company is acting as the agent and records revenue net of expenses paid to the principal. Examples of revenue earned over time, which generally occur on a monthly basis, are deposit account maintenance
fees, investment advisory fees, merchant revenue, trust and investment management fees and safe deposit box fees. Revenue is generally derived from transactional information accumulated by the Company’s systems or those of third-parties and is
recognized as the related transactions occur or services are rendered to the customer.
100
Disaggregation of Revenue
The following table includes the Company’s non-interest income disaggregated by type of service (in thousands):
|
Year Ended March 31
|
||||||||||||
|
2020
|
2019
|
2018
|
||||||||||
|
Asset management fees
|
$
|
4,408
|
$
|
3,791
|
$
|
3,448
|
||||||
|
Debit card and ATM fees
|
3,102
|
3,104
|
2,961
|
|||||||||
|
Deposit related fees
|
2,212
|
1,721
|
1,628
|
|||||||||
|
Loan related fees
|
605
|
507
|
317
|
|||||||||
|
BOLI (1)
|
864
|
734
|
819
|
|||||||||
|
Net gains on sales of loans held for sale (1)
|
252
|
317
|
641
|
|||||||||
|
FHLMC loan servicing fees (1)
|
147
|
141
|
122
|
|||||||||
|
Other, net
|
770
|
792
|
714
|
|||||||||
|
Total non-interest income
|
$
|
12,360
|
$
|
11,107
|
$
|
10,650
|
||||||
|
(1) Not within the scope of ASC 606
|
||||||||||||
For the years ended March 31, 2020, 2019 and 2018, substantially all of the Company’s revenues within the scope of ASC 606 are for performance obligations satisfied at a point
in time.
Revenues recognized within the scope of ASC 606
Asset management fees: Asset management fees are variable, since they are based on the underlying portfolio value,
which is subject to market conditions and amounts invested by clients through the Trust Company. Asset management fees are recognized over the period that services are provided, and when the portfolio values are known or can be estimated at the end
of each quarter.
Debit card and ATM fees: Debit and ATM interchange income represents fees earned when a debit card issued by the Bank
is used. The Bank earns interchange fees from debit cardholder transactions through the MasterCard® payment network. Interchange fees from cardholder transactions represent a percentage of the underlying transaction value and are recognized daily,
concurrently with the transaction processing services provided to the cardholder. The performance obligation is satisfied and the fees are earned when the cost of the transaction is charged to the cardholders’ debit card. Certain expenses directly
associated with the debit cards are recorded on a net basis with the interchange income.
Deposit related fees: Fees are earned on the Bank’s deposit accounts for various products offered to or services
performed for the Bank’s customers. Fees include business account fees, non-sufficient fund fees, stop payment fees, wire services, safe deposit box and others. These fees are recognized on a daily, monthly or quarterly basis, depending on the type
of service.
Loan related fees: Non-interest loan fee income is earned on loans that the Bank services, excluding loans serviced
for the FHLMC which are not within the scope of ASC 606. Loan related fees include prepayment fees, late charges, brokered loan fees, maintenance fees and others. These fees are recognized on a daily, monthly, quarterly or annual basis, depending on
the type of service.
Other: Fees earned on other services, such as merchant services or occasional non-recurring type services, are
recognized at the time of the event or the applicable billing cycle.
Contract Balances
As of March 31, 2020 and 2019, the Company had no significant contract liabilities where the Company had an obligation to transfer goods or services for which the Company had
already received consideration. In addition, the Company had no material unsatisfied performance obligations as of March 31, 2020 and 2019.
101
|
17.
|
COMMITMENTS AND CONTINGENCIES
|
Off-balance sheet arrangements – In the normal course of business, the
Company is a party to financial instruments with off-balance sheet risk in order to meet the financing needs of its customers. These financial instruments generally include commitments to originate mortgage, commercial and consumer loans. These
instruments involve, to varying degrees, elements of credit and interest rate risk in excess of the amounts recognized in the consolidated balance sheets. The Company’s maximum exposure to credit loss in the event of nonperformance by the borrower is
represented by the contractual amount of those instruments. The Company uses the same credit policies in making commitments as it does for on-balance sheet instruments. Commitments to originate loans are conditional and are honored for up to 45 days
subject to the Company’s usual terms and conditions. Collateral is not required to support commitments.
Standby letters of credit are conditional commitments issued by the Company to guarantee the performance of a customer to a third-party. These guarantees are primarily used
to support public and private borrowing arrangements. The credit risk involved in issuing letters of credit is essentially the same as that involved in extending loan facilities to customers. Collateral held varies and is required in instances where
the Company deems it necessary.
Significant off-balance sheet commitments are listed below at the dates indicated (in thousands):
|
Contract or Notional Amount
|
||||||||
|
March 31,
2020
|
March 31,
2019
|
|||||||
|
Commitments to originate loans:
|
||||||||
|
Adjustable-rate
|
$
|
18,712
|
$
|
30,579
|
||||
|
Fixed-rate
|
17,085
|
10,158
|
||||||
|
Standby letters of credit
|
2,045
|
2,410
|
||||||
|
Undisbursed loan funds and unused lines of credit
|
122,840
|
139,842
|
||||||
|
Total
|
$
|
160,682
|
$
|
182,989
|
||||
At March 31, 2020, the Company had firm commitments to sell $1.1 million of residential loans to the FHLMC. Typically, these agreements are short-term fixed-rate commitments
and no material gain or loss is likely.
Other Contractual Obligations – In connection with certain asset sales,
the Company typically makes representations and warranties about the underlying assets conforming to specified guidelines. If the underlying assets do not conform to the specifications, the Company may have an obligation to repurchase the assets or
indemnify the purchaser against loss. At March 31, 2020, loans under warranty totaled $99.5 million, which substantially represents the unpaid principal balance of the Company’s loans serviced for the FHLMC. The Company believes that the potential
for loss under these arrangements is remote. At March 31, 2020, the Company had an allowance for FHLMC loans of $12,000.
The Bank is a public depository and, accordingly, accepts deposit and other public funds belonging to, or held for the benefit of, Washington and Oregon states, political
subdivisions thereof, and municipal corporations. In accordance with applicable state law, in the event of default of a participating bank, all other participating banks in the state collectively assure that no loss of funds are suffered by any
public depositor. Generally, in the event of default by a public depository, the assessment attributable to all public depositories is allocated on a pro rata basis in proportion to the maximum liability of each depository as it existed on the date
of loss. The Company has not incurred any losses related to public depository funds for the years ended March 31, 2020, 2019 and 2018.
The Bank has entered into employment contracts with certain key employees, which provide for contingent payments subject to future events.
Litigation – The Company is periodically a party to litigation arising in the ordinary course of business. In the
opinion of management, these actions will not have a material adverse effect, if any, on the Company’s future consolidated financial position, results of operations and cash flows.
102
|
18.
|
LEASES
|
The Company has a finance lease for the shell of the building constructed as the Company's operations center which expires in November 2039. The Company is also obligated
under various noncancelable operating lease agreements for land, buildings and equipment that require future minimum rental payments. For operating each lease, the Company records an operating lease right-of-use asset (representing the right to use
the underlying asset for the lease term) and an operating lease liability (representing the obligation to make lease payments required under the terms of the lease). Right-of-use assets and lease liabilities are recognized at the lease commencement
date based on the present value of lease payments over the lease term. The Company uses its estimated incremental borrowing rate – derived from information available at the lease commencement date – as the discount rate when determining the present
value of lease payments. The Company does not have any operating leases with an initial term of 12 months or less. Certain operating leases contain various provisions for increases in rental rates, based either on changes in the published Consumer
Price Index or a predetermined escalation schedule. Certain operating leases provide the Company with the option to extend the lease term one or more times following expiration of the initial term. Lease extensions are not reasonably certain and the
Company generally does not include payments occurring during option periods in the calculation of its operating lease right-of-use assets and operating lease liabilities. The Company adopted the requirements of ASC 842 effective April 1, 2019, which
required the Company to record in the consolidated balance sheet operating lease right-of-use assets and operating lease liabilities for leases with an initial term of more than 12 months for leases that existed as of April 1, 2019. The periods prior
to the date of adoption are accounted for under superseded ASC 840; therefore, the following disclosures include only the period for which ASC 842 was effective.
The table below presents the lease right-of-use assets and lease liabilities recorded in the consolidated balance sheet at March 31, 2020 (in thousands):
|
Leases
|
Classification in the consolidated balance sheets
|
||||
|
Finance lease right-of-use asset
|
$
|
1,508
|
Premises and equipment, net
|
||
|
Finance lease liability
|
$
|
2,369
|
Finance lease liability
|
||
|
Finance lease remaining lease term
|
19.68
|
years
|
|||
|
Finance lease discount rate
|
7.16
|
%
|
|||
|
Operating lease right-of-use assets
|
$
|
3,949
|
Prepaid expenses and other assets
|
||
|
Operating lease liabilities
|
$
|
4,046
|
Accrued expenses and other liabilities
|
||
|
Operating lease weighted-average remaining lease term
|
3.92
|
years
|
|||
|
Operating lease weighted-average discount rate
|
2.77
|
%
|
The table below presents certain information related to the lease costs for operating leases, which are recorded in occupancy and depreciation in the accompanying
consolidated statements of income, for the year ended March 31, 2020 (in thousands):
|
Lease Costs
|
|||
|
Finance lease amortization of right-of-use asset
|
$
|
77
|
|
|
Finance lease interest on lease liability
|
171
|
||
|
Operating lease costs
|
1,508
|
||
|
Variable lease costs
|
209
|
||
|
Total lease cost (1)
|
$
|
1,965
|
|
|
(1) income related to sub-lease activity is not significant and is not presented herein.
|
|||
Rent expense was $2.0 million and $2.1 million for the years ended March 31, 2019 and 2018, respectively.
Supplemental cash flow information - Operating cash flows paid for operating lease amounts included in the measurement of lease
liabilities was $1.7 million for the year ended March 31, 2020. During the year ended March 31, 2020, the Company did not record any lease right-of-use assets that were exchanged for operating lease liabilities.
103
The following table reconciles the undiscounted cash flows for the periods presented related to the Company’s lease liabilities as of March 31, 2020 (in thousands):
|
Years Ending March 31:
|
Operating
Leases
|
Finance
Lease
|
||||||
|
2021
|
$
|
1,011
|
$
|
208
|
||||
|
2022
|
747
|
212
|
||||||
|
2023
|
573
|
215
|
||||||
|
2024
|
583
|
219
|
||||||
|
2025
|
577
|
222
|
||||||
|
Thereafter
|
929
|
3,400
|
||||||
|
Total minimum lease payments
|
4,420
|
4,476
|
||||||
|
Less: amount of lease payment representing interest
|
(374
|
)
|
(2,107
|
)
|
||||
|
Lease liabilities
|
$
|
4,046
|
$
|
2,369
|
||||
In March 2010, the Company sold two of its branch locations. The Company maintains a substantial continuing involvement in the locations through various non-cancellable
operating leases that contain certain renewal options. The resulting gain on sale of $2.1 million was deferred and is being amortized over the lives of the respective leases. At March 31, 2020, the remaining deferred gain was $537,000 and is included
in accrued expenses and other liabilities in the accompanying consolidated balance sheet.
104
|
19.
|
RIVERVIEW BANCORP, INC. (PARENT COMPANY ONLY)
|
|
BALANCE SHEETS
|
||||||||
|
AS OF MARCH 31, 2020 AND 2019
|
||||||||
|
(In thousands)
|
2020
|
2019
|
||||||
|
ASSETS
|
||||||||
|
Cash and cash equivalents
|
$
|
10,269
|
$
|
4,178
|
||||
|
Investment in the Bank
|
165,130
|
155,041
|
||||||
|
Other assets
|
1,440
|
1,445
|
||||||
|
TOTAL ASSETS
|
$
|
176,839
|
$
|
160,664
|
||||
|
LIABILITIES AND SHAREHOLDERS’ EQUITY
|
||||||||
|
Accrued expenses and other liabilities
|
$
|
199
|
$
|
63
|
||||
|
Dividend payable
|
1,135
|
904
|
||||||
|
Borrowings
|
26,662
|
26,575
|
||||||
|
Shareholders' equity
|
148,843
|
133,122
|
||||||
|
TOTAL LIABILITIES AND SHAREHOLDERS’ EQUITY
|
$
|
176,839
|
$
|
160,664
|
||||
|
STATEMENTS OF INCOME
|
||||||||||||
|
FOR THE YEARS ENDED MARCH 31, 2020, 2019 AND 2018
|
||||||||||||
|
(In thousands)
|
2020
|
2019
|
2018
|
|||||||||
|
INCOME:
|
||||||||||||
|
Interest on investment securities and other short-term investments
|
$
|
33
|
$
|
35
|
$
|
26
|
||||||
|
Interest on loan receivable from the Bank
|
-
|
-
|
6
|
|||||||||
|
Total income
|
33
|
35
|
32
|
|||||||||
|
EXPENSE:
|
||||||||||||
|
Management service fees paid to the Bank
|
143
|
143
|
143
|
|||||||||
|
Other expenses
|
1,233
|
1,298
|
1,020
|
|||||||||
|
Total expense
|
1,376
|
1,441
|
1,163
|
|||||||||
|
LOSS BEFORE INCOME TAXES AND EQUITY
|
||||||||||||
|
IN UNDISTRIBUTED INCOME OF THE BANK
|
(1,343
|
)
|
(1,406
|
)
|
(1,131
|
)
|
||||||
|
BENEFIT FOR INCOME TAXES
|
(282
|
)
|
(294
|
)
|
(513
|
)
|
||||||
|
LOSS OF PARENT COMPANY
|
(1,061
|
)
|
(1,112
|
)
|
(618
|
)
|
||||||
|
EQUITY IN UNDISTRIBUTED INCOME OF THE BANK
|
16,809
|
18,378
|
10,860
|
|||||||||
|
NET INCOME
|
$
|
15,748
|
$
|
17,266
|
$
|
10,242
|
||||||
There were no items of other comprehensive income that were solely attributable to the parent company.
105
RIVERVIEW BANCORP, INC. (PARENT COMPANY ONLY)
STATEMENTS OF CASH FLOWS
FOR THE YEARS ENDED MARCH 31, 2020, 2019 AND 2018
|
(In thousands)
|
2020
|
2019
|
2018
|
|||||||||
|
CASH FLOWS FROM OPERATING ACTIVITIES:
|
||||||||||||
|
Net income
|
$
|
15,748
|
$
|
17,266
|
$
|
10,242
|
||||||
|
Adjustments to reconcile net income to net cash provided by (used in)
operating activities:
|
||||||||||||
|
Equity in undistributed income of the Bank
|
(16,809
|
)
|
(18,378
|
)
|
(10,860
|
)
|
||||||
|
Amortization
|
87
|
91
|
94
|
|||||||||
|
Provision for deferred income taxes
|
-
|
10
|
174
|
|||||||||
|
Earned ESOP shares
|
-
|
-
|
148
|
|||||||||
|
Stock based compensation
|
346
|
44
|
88
|
|||||||||
|
Changes in assets and liabilities:
|
||||||||||||
|
Other assets
|
(278
|
)
|
(447
|
)
|
1,770
|
|||||||
|
Accrued expenses and other liabilities
|
364
|
97
|
(220
|
)
|
||||||||
|
Net cash provided by (used in) operating activities
|
(542
|
)
|
(1,317
|
)
|
1,436
|
|||||||
|
CASH FLOWS FROM INVESTING ACTIVITIES:
|
||||||||||||
|
Dividend from the Bank
|
11,500
|
2,000
|
1,750
|
|||||||||
|
Net cash provided by investing activities
|
11,500
|
2,000
|
1,750
|
|||||||||
|
CASH FLOWS FROM FINANCING ACTIVITIES:
|
||||||||||||
|
Dividends paid
|
(4,075
|
)
|
(3,163
|
)
|
(2,140
|
)
|
||||||
|
Proceeds from exercise of stock options
|
227
|
179
|
245
|
|||||||||
|
Repurchase of common stock
|
(1,019
|
)
|
-
|
-
|
||||||||
|
Net cash used in financing activities
|
(4,867
|
)
|
(2,984
|
)
|
(1,895
|
)
|
||||||
|
NET INCREASE (DECREASE) IN CASH AND CASH EQUIVALENTS
|
6,091
|
(2,301
|
)
|
1,291
|
||||||||
|
CASH AND CASH EQUIVALENTS, BEGINNING OF YEAR
|
4,178
|
6,479
|
5,188
|
|||||||||
|
CASH AND CASH EQUIVALENTS, END OF YEAR
|
$
|
10,269
|
$
|
4,178
|
$
|
6,479
|
||||||
106
RIVERVIEW BANCORP, INC.
SELECTED QUARTERLY FINANCIAL DATA (UNAUDITED):
|
(Dollars in thousands, except per share data)
|
Three Months Ended
|
|||||||||||||||
|
March 31
|
December 31
|
September 30
|
June 30
|
|||||||||||||
|
Fiscal 2020:
|
||||||||||||||||
|
Interest and dividend income
|
$
|
12,291
|
$
|
12,766
|
$
|
12,882
|
$
|
12,556
|
||||||||
|
Interest expense
|
1,241
|
1,274
|
1,163
|
1,086
|
||||||||||||
|
Net interest income
|
11,050
|
11,492
|
11,719
|
11,470
|
||||||||||||
|
Provision for loan losses
|
1,250
|
-
|
-
|
-
|
||||||||||||
|
Non-interest income, net
|
2,892
|
3,163
|
3,169
|
3,136
|
||||||||||||
|
Non-interest expense
|
8,818
|
9,248
|
9,003
|
9,194
|
||||||||||||
|
Income before income taxes
|
3,874
|
5,407
|
5,885
|
5,412
|
||||||||||||
|
Provision for income taxes
|
980
|
1,279
|
1,351
|
1,220
|
||||||||||||
|
Net income
|
$
|
2,894
|
$
|
4,128
|
$
|
4,534
|
$
|
4,192
|
||||||||
|
Basic earnings per common share (1)
|
$
|
0.13
|
$
|
0.18
|
$
|
0.20
|
$
|
0.19
|
||||||||
|
Diluted earnings per common share (1)
|
$
|
0.13
|
$
|
0.18
|
$
|
0.20
|
$
|
0.18
|
||||||||
|
Fiscal 2019:
|
||||||||||||||||
|
Interest and dividend income
|
$
|
12,802
|
$
|
12,390
|
$
|
12,389
|
$
|
12,288
|
||||||||
|
Interest expense
|
930
|
656
|
611
|
618
|
||||||||||||
|
Net interest income
|
11,872
|
11,734
|
11,778
|
11,670
|
||||||||||||
|
Provision for loan losses
|
-
|
-
|
250
|
(200
|
)
|
|||||||||||
|
Non-interest income, net
|
2,670
|
2,728
|
2,840
|
2,869
|
||||||||||||
|
Non-interest expense
|
8,962
|
8,803
|
8,915
|
9,019
|
||||||||||||
|
Income before income taxes
|
5,580
|
5,659
|
5,453
|
5,720
|
||||||||||||
|
Provision for income taxes
|
1,373
|
1,271
|
1,224
|
1,278
|
||||||||||||
|
Net income
|
$
|
4,207
|
$
|
4,388
|
$
|
4,229
|
$
|
4,442
|
||||||||
|
Basic earnings per common share (1)
|
$
|
0.19
|
$
|
0.19
|
$
|
0.19
|
$
|
0.20
|
||||||||
|
Diluted earnings per common share (1)
|
$
|
0.19
|
$
|
0.19
|
$
|
0.19
|
$
|
0.20
|
||||||||
(1) Quarterly earnings per common share may vary from annual earnings per common share due to rounding.
Item 9. Changes in and Disagreements with Accountants on Accounting and Financial Disclosure
Not applicable.
Item 9A. Controls and Procedures
(a) Evaluation of Disclosure Controls and Procedures: An evaluation of the Company’s disclosure controls and procedures (as defined in Rule 13a-15(e) of the Securities
Exchange Act of 1934 (“Exchange Act”)) was carried out under the supervision and with the participation of the Company’s Chief Executive Officer, Chief Financial Officer and several other members of the Company’s senior management as of the end of
the period covered by this annual report. The Company’s Chief Executive Officer and Chief Financial Officer concluded that as of March 31, 2020, the Company’s disclosure controls and procedures were effective in ensuring that the information required
to be disclosed by the Company in the reports it files or submits under the Exchange Act is (i) accumulated and communicated to the Company’s management (including the Chief Executive Officer and Chief Financial Officer) in a timely manner, and (ii)
recorded, processed, summarized and reported within the time periods specified in the SEC’s rules and forms.
While the Company believes the present design of its disclosure controls and procedures is effective to achieve its goal, future events affecting its business may cause the Company to modify its
disclosure controls and procedures. The Company does not expect that its disclosure controls and procedures and internal control over financial reporting will prevent all errors and fraud. A control procedure, no matter how well conceived and
operated, can provide only reasonable, not absolute, assurance that the objectives of the control procedure are met. Because of the inherent limitations in all control procedures, no evaluation of controls can provide absolute assurance that all
control issues and instances of fraud, if any, within the Company have been
107
detected. These inherent limitations include the realities that judgments in decision-making can be faulty and that breakdowns in controls or procedures can occur because of simple errors or
mistakes. Additionally, controls can be circumvented by the individual acts of some persons, by collusion of two or more people, or by management override of the controls. The design of any control procedure is based in part upon certain assumptions
about the likelihood of future events, and there can be no assurance that any design will succeed in achieving its stated goals under all potential future conditions; over time, controls may become inadequate because of changes in conditions, or the
degree of compliance with the policies or procedures may deteriorate. Because of the inherent limitations in a cost-effective control procedure, misstatements attributable to errors or fraud may occur and not be detected.
(b) Changes in Internal Controls: There was no change in the Company’s internal control over financial reporting during the Company’s
most recently completed fiscal quarter that has materially affected, or is reasonably likely to materially affect, the Company’s internal control over financial reporting.
(c) Management’s Annual Report on Internal Control Over Financial Reporting: The management of Riverview Bancorp, Inc. is responsible for establishing and maintaining adequate internal control over financial reporting.
This internal control system has been designed to provide reasonable assurance to the Company’s management and board of directors regarding the preparation and fair presentation of the Company’s published consolidated financial statements.
All internal control systems, no matter how well designed, have inherent limitations. Therefore, even those systems determined to be effective can provide only
reasonable assurance with respect to financial statement preparation and presentation.
The management of Riverview Bancorp, Inc. has assessed the effectiveness of the Company’s internal control over financial reporting as of March 31, 2020. To make the assessment, we used the
criteria for effective internal control over financial reporting described in Internal Control – Integrated Framework (2013), issued by the Committee of Sponsoring Organizations of the Treadway Commission. Based on our assessment, we have concluded
that, as of March 31, 2020, the Company’s internal control over financial reporting was effective based on those criteria.
Item 9B. Other Information
There was no information to be disclosed by the Company in a report on Form 8-K during the fourth quarter of fiscal year 2020 that was not so disclosed.
108
PART III
Item 10. Directors, Executive Officers and Corporate Governance
The information contained under the section captioned "Proposal I ‑ Election of Directors" contained in the Company's Proxy Statement for the 2020 Annual Meeting of Stockholders, and "Part I -
Business -- Executive Officers" of this Form 10-K, is incorporated herein by reference.
Code of Ethics
The Board of Directors has adopted the Officer and Director Code of Ethics. The Code of Ethics is applicable to each of the Company’s officers, including the principal executive officer and senior
financial officers, and requires individuals to maintain the highest standards of professional conduct. A copy of the Code of Ethics is available on the Company’s website at www.riverviewbank.com.
Audit Committee Matters and Audit Committee Financial Expert
The Company has a separately-designated standing Audit Committee, composed of Directors Patricia W. Eby, Bess. R. Wills, and Jerry C. Olson. Each member of the Audit Committee is “independent,” as
defined in the Nasdaq Stock Market Listing Standards. The Company’s Board of Directors has designated Mr. Olson, Audit Committee Chairman, as its financial expert, as defined in SEC’s Regulation S-K.
Nomination Procedures
There have been no material changes to the procedures by which shareholders may recommend nominees to the Company’s Board of Directors.
Item 11. Executive Compensation
The information set forth under the sections captioned "Executive Compensation" and "Directors' Compensation" in the Company’s Proxy Statement for the 2020 Annual Meeting of Stockholders
(excluding the information contained under the heading “Personnel/Compensation Committee Report,”) is incorporated herein by reference.
109
Item 12. Security Ownership of Certain Beneficial Owners and Management and Related Stockholder Matters
The information set forth under the caption "Security Ownership of Certain Beneficial Owners and Management" in the Company’s Proxy Statement for the 2020 Annual Meeting of Stockholders is
incorporated herein by reference.
Equity Compensation Plan Information. The following table summarizes share and exercise price information about the Company’s equity compensation plan as
of March 31, 2020:
|
Plan category
|
Number of
securities to be
issued upon
exercise of
outstanding
options
|
Weighted-
average
price of
outstanding
options
|
Number of
securities to be
issued upon
vesting of
restricted stock
awards
|
Number of
securities
remaining
available for future
issuance under
equity
compensation
plans excluding
securities reflected
in column (A)
|
|||||||
|
Equity compensation plans approved by security holders:
|
(A)
|
(B)
|
(C)
|
(D)
|
|||||||
|
2017 Equity Incentive Plan
|
-
|
-
|
82,673
|
1,717,327
|
|||||||
|
2003 Stock Option Plan
|
43,332
|
$
|
2.69
|
-
|
-
|
||||||
|
Equity compensation plans not approved by security holders:
|
-
|
-
|
-
|
||||||||
|
Total
|
43,332
|
$
|
2.69
|
82,673
|
1,717,327
|
||||||
Item 13. Certain Relationships and Related Transactions, and Director Independence
The information set forth under the headings “Related Party Transactions” and “Director Independence” under the heading “Meetings and Committees of the Board of Directors and Corporate Governance
Matters – Corporate Governance” in the Company’s Proxy Statement for the 2020 Annual Meeting of Stockholders is incorporated herein by reference.
Item 14. Principal Accounting Fees and Services
The information set forth under the section captioned “Independent Registered Public Accounting Firm” in the Company’s Proxy Statement for the 2020 Annual Meeting of Stockholders (excluding the
information contained under the heading of “Report of the Audit Committee”) is incorporated herein by reference.
110
PART IV
Item 15. Exhibits and Financial Statement Schedules
| (1) |
Filed as an exhibit to the Registrant’s Current Report on Form 8-K filed with the SEC on September 29, 2016 and incorporated herein by reference.
|
| (2) |
Filed as an exhibit to the Registrant's Registration Statement on Form S-1 (Registration No. 333-30203), and incorporated herein by reference.
|
| (3) |
Filed as an exhibit to the Registrant’s Current Report on Form 8-K filed with the SEC on May 3, 2019 and incorporated herein by reference.
|
| (4) |
Filed as an exhibit to the Registrant’s Annual Report on Form 10-K for the year ended March 31, 2019, and incorporated herein by reference.
|
| (5) |
Filed as an exhibit to the Registrant's Annual Report on Form 10-K for the year ended March 31, 2017 and incorporated herein by reference.
|
| (6) |
Filed as an exhibit to the Registrant's Annual Report on Form 10-K for the year ended March 31, 1998, and incorporated herein by reference.
|
| (7) |
Filed as an exhibit to the Registrant’s Definitive Annual Meeting Proxy Statement (000-22957), filed with the Commission on June 5, 2003, and incorporated herein by reference.
|
| (8) |
Filed as an exhibit to the Registrant’s Quarterly Report on Form 10-Q for the quarter ended September 30, 2005, and incorporated herein by reference.
|
| (9) |
Filed as an exhibit to the Registrant’s Annual Report on Form 10-K for the year ended March 31, 2009 and incorporated herein by reference.
|
| (10) |
Filed as Appendix A to the Registrant’s Definitive Annual Meeting Proxy Statement (000-22957), filed with the Commission on June 16, 2017, and incorporated herein by reference.
|
| (11) |
Filed as an exhibit to the Registrant’s Registration Statement on Form S-8 (Registration No. 333-228099), and incorporated herein by reference.
|
| (12) |
Registrant elects to satisfy Regulation S-K §229.406(c) by posting its Code of Ethics on its website at www.riverviewbank.com in the section titled About: Code of Conduct.
|
| (13) |
Filed as an exhibit to the Registrant’s Annual Report on Form 10-K for the year ended March 31, 2020, and incorporated herein by reference.
|
| * |
Filed herewith
|
111
Item 16. Form 10-K Summary
None.
112
SIGNATURES
Pursuant to the requirements of Section 13 or 15(d) of the Securities Exchange Act of 1934, the registrant has duly caused this report to be signed on its behalf by the
undersigned, thereunto duly authorized.
| RIVERVIEW BANCORP, INC. | |||
|
Date:
|
June 17, 2020
|
By:
|
/s/ Kevin J. Lycklama
|
|
|
|
|
Kevin J. Lycklama
|
|
|
|
|
President and Chief Executive Officer
Director
(Duly Authorized Representative)
|
Pursuant to the requirements of the Securities Exchange Act of 1934, this report
has been signed below by the following persons on behalf of the registrant and in the capacities and on the dates indicated.
|
By:
|
/s/ Patrick Sheaffer
|
By:
|
/s/ Kevin J. Lycklama
|
|
|
Patrick Sheaffer
|
|
Kevin J. Lycklama
|
|
|
Chairman of the Board
|
|
President and Chief Executive Officer
Director
(Principal Executive Officer)
|
|
|
|
|
|
|
Date:
|
June 17, 2020
|
Date:
|
June 17, 2020
|
|
|
|
|
|
|
|
|
|
|
|
By:
|
/s/ David Lam
|
By:
|
/s/ Bess R. Wills
|
|
|
David Lam
|
|
Bess R. Wills
|
|
|
Executive Vice President and
|
|
Director
|
|
|
Chief Financial Officer
(Principal Financial and Accounting Officer)
|
|
|
|
|
|
|
|
|
Date:
|
June 17, 2020 |
Date:
|
June 17, 2020
|
|
|
|
|
|
|
|
|
|
|
|
By:
|
/s/ David Nierenberg
|
By:
|
/s/ Bradley J. Carlson
|
|
|
David Nierenberg
|
|
Bradley J. Carlson
|
|
|
Director
|
|
Director |
|
|
|
|
|
|
Date:
|
June 17, 2020
|
Date:
|
June 17, 2020
|
|
|
|
|
|
|
|
|
|
|
|
By:
|
/s/ John A. Karas
|
By:
|
/s/ Jerry C. Olson
|
|
|
John A. Karas
|
|
Jerry C. Olson
|
| Director | Director | ||
| Date: | June 17, 2020 | Date: | June 17, 2020 |
| By: | /s/ Gerald L. Nies | By: | /s/ Patricia W. Eby |
|
|
Gerald L. Nies
|
|
Patricia W. Eby
|
|
|
Director
|
|
Director
|
|
Date:
|
June 17, 2020
|
Date:
|
June 17, 2020
|
113