Attached files
| file | filename |
|---|---|
| 8-K - 8-K - INTERFACE INC | a8-k6820.htm |

Stifel 2020 Cross Sector Insight Conference JUNE 9, 2020

Forward Looking Statements and Non-GAAP Measures This presentation contains forward-looking statements, including, in particular, statements about Interface’s plans, strategies and prospects. These are based on the Company’s current assumptions, expectations and projections about future events. Although Interface believes that the expectations reflected in these forward-looking statements are reasonable, the Company can give no assurance that these expectations will prove to be correct or that savings or other benefits anticipated in the forward-looking statements will be achieved. The forward- looking statements set forth involve a number of risks and uncertainties that could cause actual results to differ materially from any such statement, including risks and uncertainties associated with the economic conditions in the commercial interiors industry. Additional risks and uncertainties that may cause actual results to differ materially from those predicted in forward-looking statements also include, but are not limited to the risk factors included in Part II, Item 1A of the Quarterly Report on Form 10-Q for the quarter ended April 5, 2020, and the risks under the subheadings in “Risk Factors” in the Company's Annual Report on Form 10-K for the fiscal year ended December 29, 2019, which discussions are hereby incorporated by reference. Forward-looking statements in this presentation include, without limitation, the information set forth on the slides titled “Investment Thesis”, “COVID-19 Response,” “Growth and Value Creation Strategy” and “Premium Player in the Specified Channel”, and the section of this presentation titled “Growth and Value Creation”. Other forward-looking statements can be identified by words such as “may,” “expect,” “forecast,” “anticipate,” “intend,” “plan,” “believe,” “could,” “should”, “goal”, “aim”, “objective”, “seek,” “project,” “estimate,” “target,” and similar expressions. Forward-looking statements speak only as of the date made. The Company assumes no responsibility to update or revise forward-looking statements and cautions listeners and meeting attendees not to place undue reliance on any such statements. This presentation includes certain financial measures not calculated in accordance with U.S. GAAP. They may be different from similarly titled non-GAAP measures used by other companies, and should not be used as a substitute for, or considered superior to, GAAP measures. Reconciliations to the most directly comparable GAAP measures appear in the Appendix. 2

Dan Hendrix Chairman, President and Chief Executive Officer Bruce Hausmann Vice President and Chief Financial Officer 3
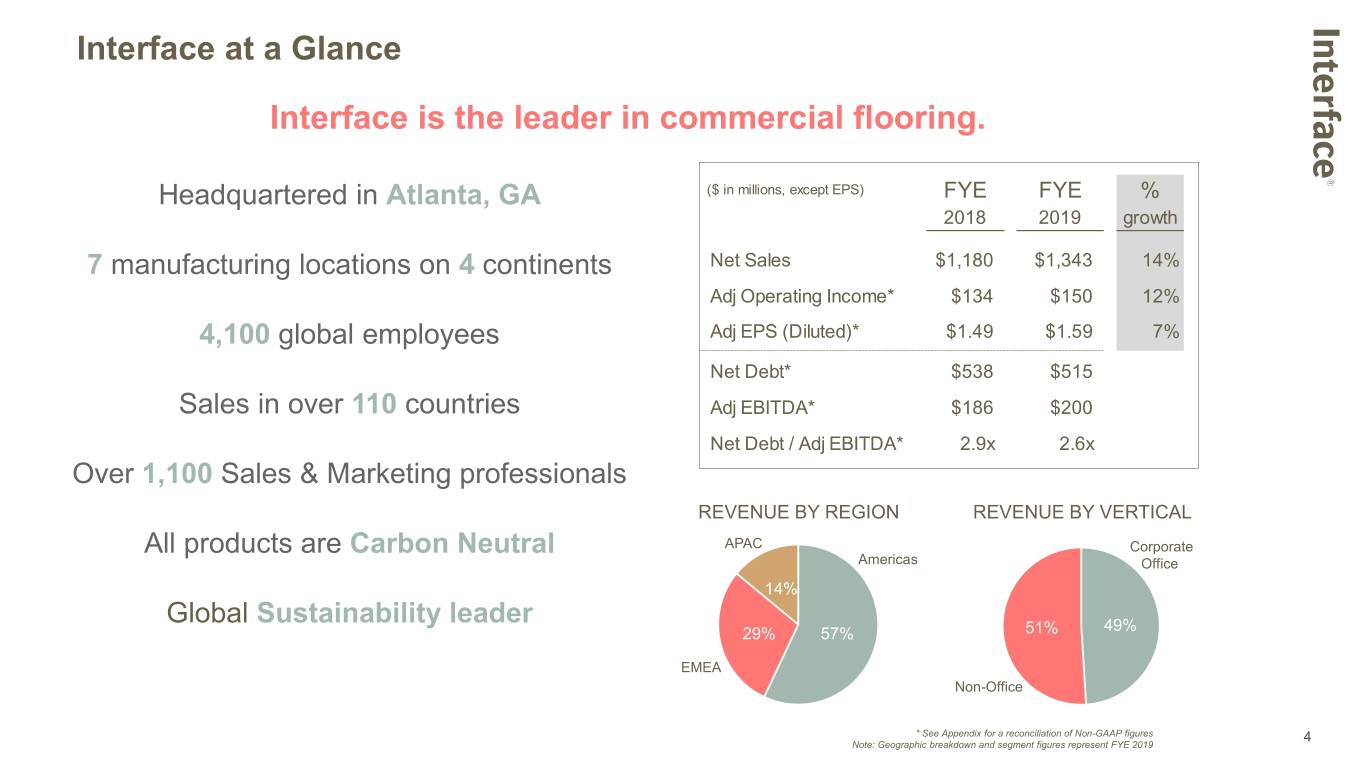
Interface at a Glance Interface is the leader in commercial flooring. Headquartered in Atlanta, GA ($ in millions, except EPS) FYE FYE % 2018 2019 growth 7 manufacturing locations on 4 continents Net Sales $1,180 $1,343 14% Adj Operating Income* $134 $150 12% 4,100 global employees Adj EPS (Diluted)* $1.49 $1.59 7% Net Debt* $538 $515 Sales in over 110 countries Adj EBITDA* $186 $200 Net Debt / Adj EBITDA* 2.9x 2.6x Over 1,100 Sales & Marketing professionals REVENUE BY REGION REVENUE BY VERTICAL All products are Carbon Neutral APAC Corporate Americas Office 14% Global Sustainability leader 49% 29% 57% 51% EMEA Non-Office * See Appendix for a reconciliation of Non-GAAP figures 4 Note: Geographic breakdown and segment figures represent FYE 2019
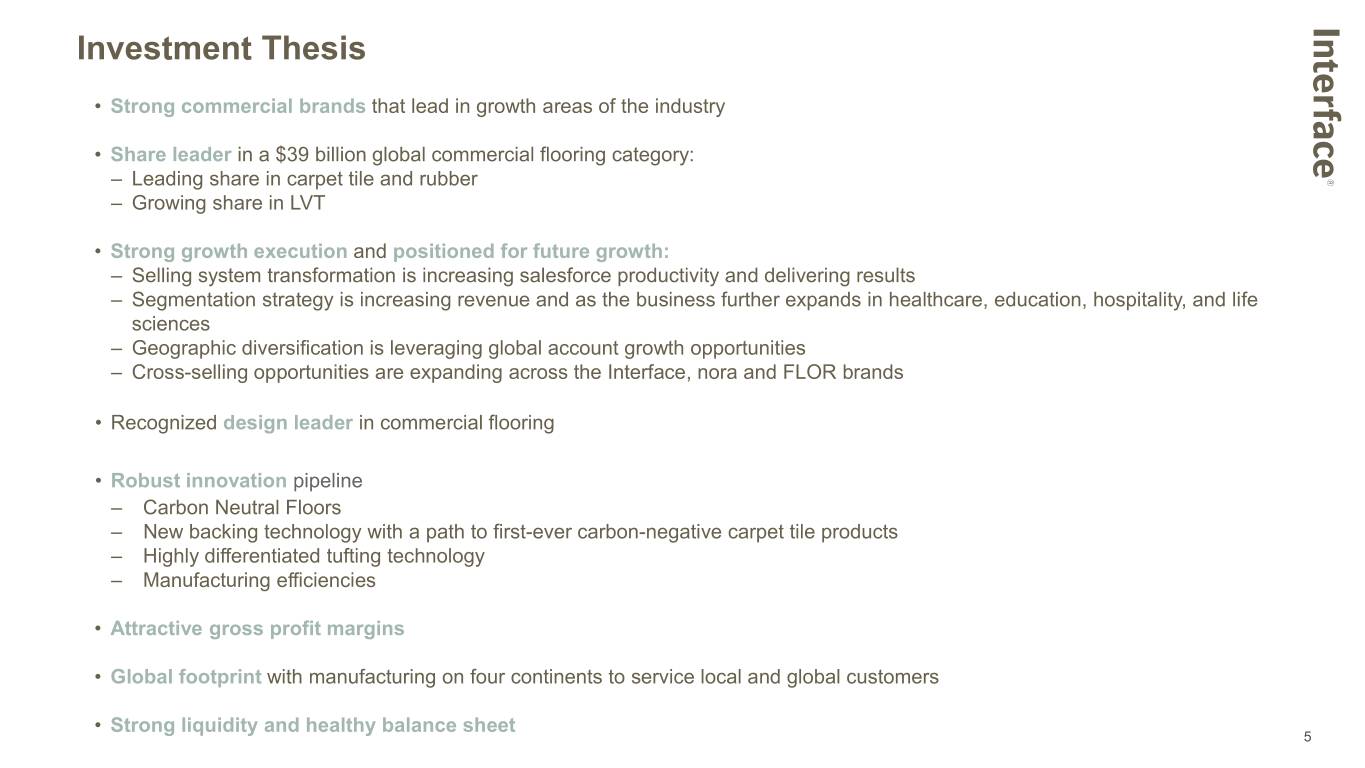
Investment Thesis • Strong commercial brands that lead in growth areas of the industry • Share leader in a $39 billion global commercial flooring category: – Leading share in carpet tile and rubber – Growing share in LVT • Strong growth execution and positioned for future growth: – Selling system transformation is increasing salesforce productivity and delivering results – Segmentation strategy is increasing revenue and as the business further expands in healthcare, education, hospitality, and life sciences – Geographic diversification is leveraging global account growth opportunities – Cross-selling opportunities are expanding across the Interface, nora and FLOR brands • Recognized design leader in commercial flooring • Robust innovation pipeline ‒ Carbon Neutral Floors ‒ New backing technology with a path to first-ever carbon-negative carpet tile products ‒ Highly differentiated tufting technology ‒ Manufacturing efficiencies • Attractive gross profit margins • Global footprint with manufacturing on four continents to service local and global customers • Strong liquidity and healthy balance sheet 5

COVID-19 Response Balanced approach to navigating COVID-19 crisis – right-sizing the organization in line with current demand while maintaining customer service and commitment to strategic agenda HEALTH & SAFETY COST REDUCTIONS SUPPLY CHAIN LIQUIDITY • Remote working • Right-sizing organization to • Ensuring continuity and • Maintaining strong liquidity meet demand maintaining service levels • Travel and group meeting • Ample availability under restrictions • Significant reductions in • Global carpet tile revolving credit facility discretionary spending manufacturing with redundant • Facility changes and capabilities that can be flexed • Current credit facility in place behavioral best practices • Suspended merit-based pay to mitigate interruptions through 2023 (social distancing, cleaning increases, 401(k), and NSP and sanitation) company matching • Variable/fixed cost mix allows • Moderated capital spending contributions for scaling down without • Compliance with all significant margin erosion government orders and • Voluntary separations, regulations involuntary separations, furloughs and other time-and- • Maintaining trust and pay reductions communication • Lower performance-based compensation and variable commission compensation Adapting our business to the evolving post-COVID future and flexing our strategy and operations to the changing landscape 6
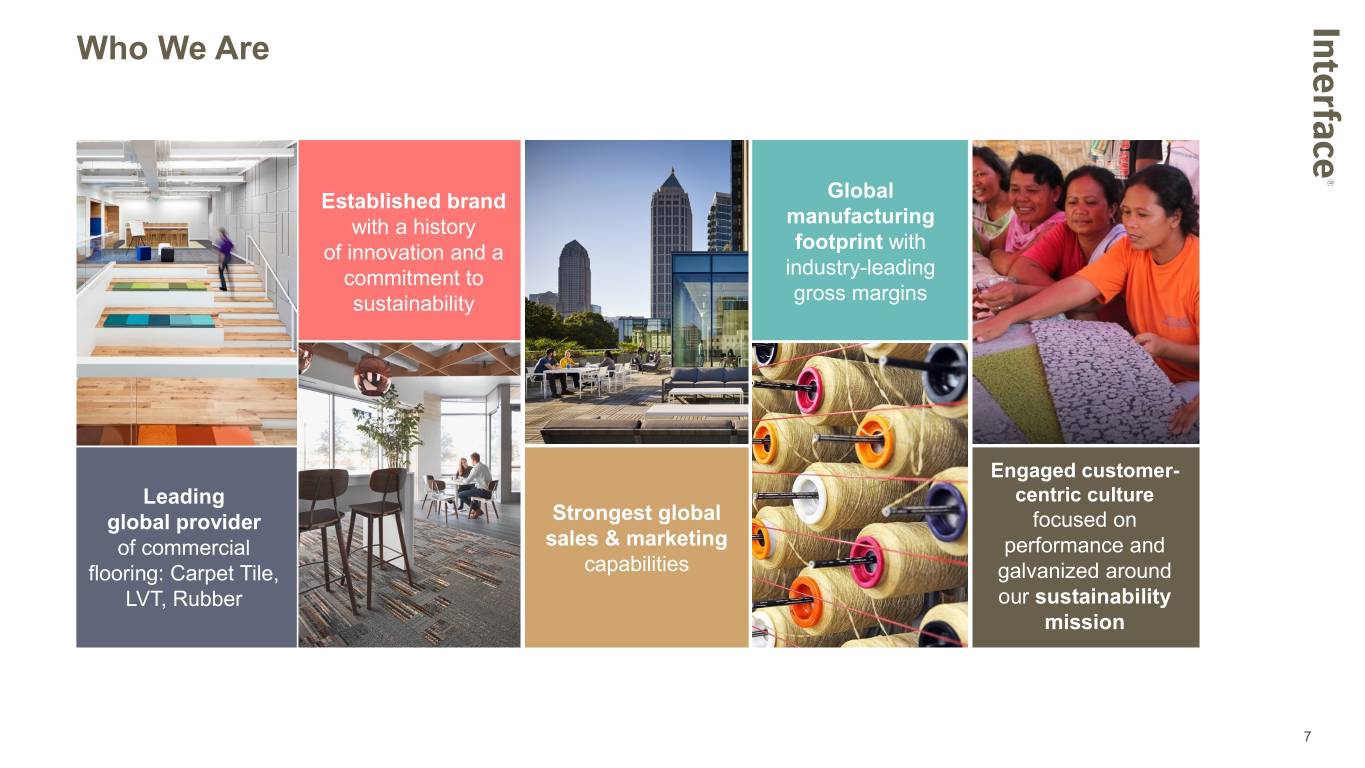
Who We Are Established brand Global with a history manufacturing of innovation and a footprint with commitment to industry-leading sustainability gross margins Engaged customer- Leading centric culture global provider Strongest global focused on of commercial sales & marketing performance and flooring: Carpet Tile, capabilities galvanized around LVT, Rubber our sustainability mission 7

Growth Strategy Interface is the Leader in Commercial Flooring Grow the Core Build Execute Optimize SG&A Carpet Tile a Resilient Supply Chain Resources Business Flooring Business Productivity Lead a World-Changing Sustainability Movement Centered Around Climate Take Back. 8

Attractive Product Portfolio Carpet Tile • Biomimicry-inspired random design (i2) • High recycled content • No glue installation (TacTiles®) • Faster, more profitable installation for contractors • Easily recycled (ReEntry® program) • Carbon neutral (Carbon Neutral Floors™) Luxury Vinyl Tile (LVT) • Creative design freedom • Complements and enhances our carpet tile portfolio − No transition strips needed − Same sizes as our carpet tiles • High acoustic value (Sound Choice™ backing) • Carbon neutral (Carbon Neutral Floors™) Rubber • norament® - modular rubber tiles • noraplan® - sheet rubber • Ideal for hygienic, safe flooring applications • Extremely durable with strong chemical resistance • Carbon neutral (Carbon Neutral Floors™) 9
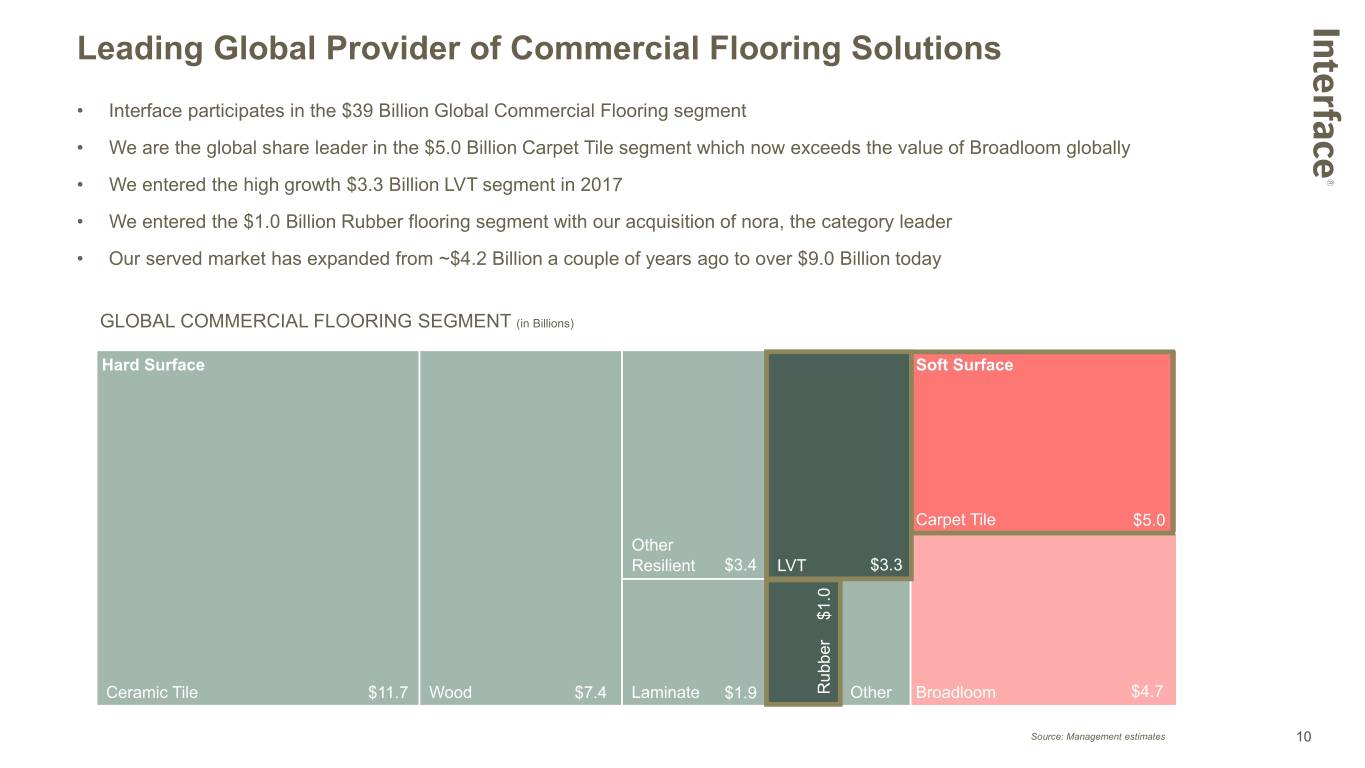
Leading Global Provider of Commercial Flooring Solutions • Interface participates in the $39 Billion Global Commercial Flooring segment • We are the global share leader in the $5.0 Billion Carpet Tile segment which now exceeds the value of Broadloom globally • We entered the high growth $3.3 Billion LVT segment in 2017 • We entered the $1.0 Billion Rubber flooring segment with our acquisition of nora, the category leader • Our served market has expanded from ~$4.2 Billion a couple of years ago to over $9.0 Billion today GLOBAL COMMERCIAL FLOORING SEGMENT (in Billions) $5.0 Other $3.4 $3.3 $1.0 $11.7 $7.4 $1.9 Rubber $4.7 Source: Management estimates 10

Participating in Attractive Commercial Flooring Segments • Interface serves growing segments of hard and soft surface with the highest margins GLOBAL COMMERCIAL FLOORING: SEGMENT SIZE vs FORECASTED GROWTH and GROSS MARGIN 14% Bubble size = Global commercial value of category, 2019 12% LVT 10% 8% 6% Ceramic Tile 4% Carpet Tile Rubber 2% Wood Estimated CAGR through through 2024 CAGR Estimated 0% Broadloom Other Laminate (2%) Resilient (4%) 0% 5% 10% 15% 20% 25% 30% 35% 40% 45% 50% Gross Margin Source: Management estimates 11
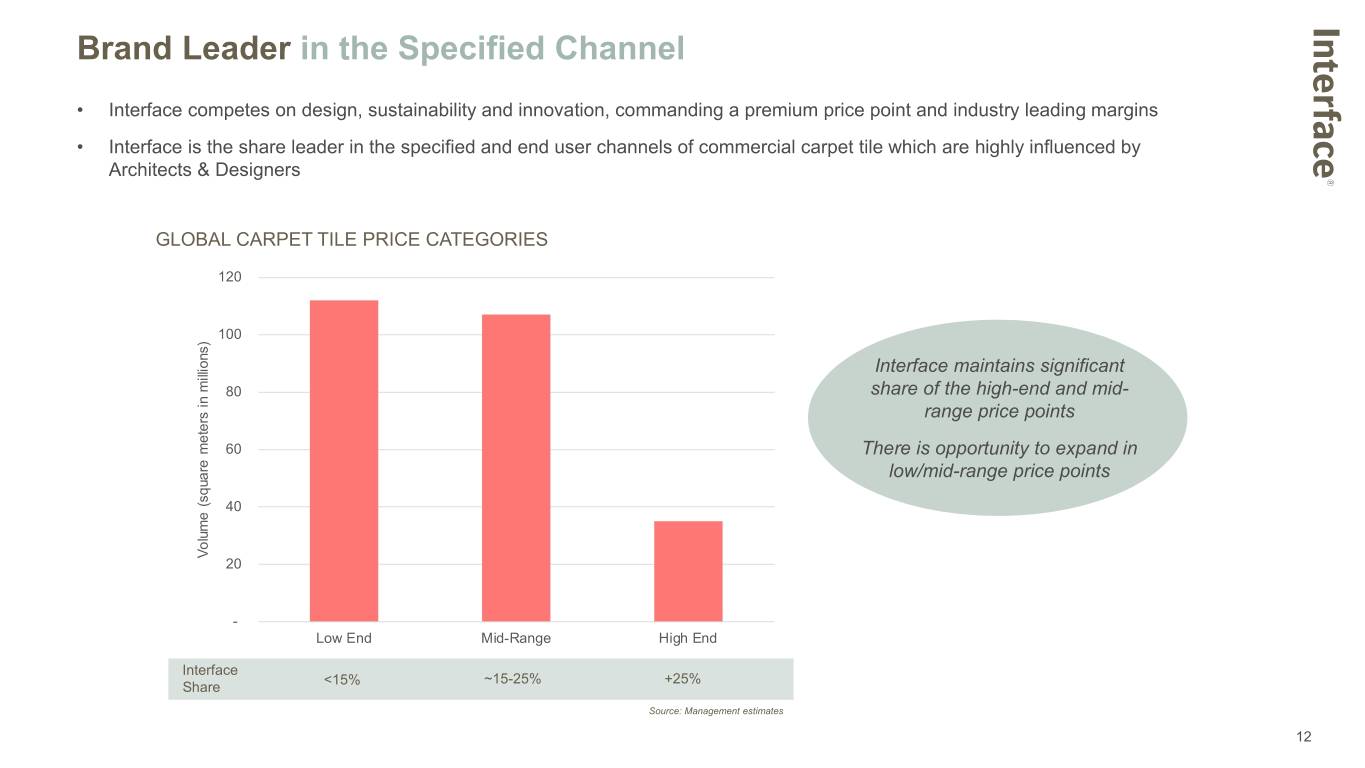
Brand Leader in the Specified Channel • Interface competes on design, sustainability and innovation, commanding a premium price point and industry leading margins • Interface is the share leader in the specified and end user channels of commercial carpet tile which are highly influenced by Architects & Designers GLOBAL CARPET TILE PRICE CATEGORIES 120 100 Interface maintains significant 80 share of the high-end and mid- range price points 60 There is opportunity to expand in low/mid-range price points 40 Volume (square meters in millions) in meters (square Volume 20 - Low End Mid-Range High End Interface <15% ~15-25% +25% Share Source: Management estimates 12

Global Sales and Manufacturing Platform • Sales in over 110 countries • Seven manufacturing locations on four continents • Over 1,100 sales & marketing professionals • Global supply chain management • Global account management • Unique blend of efficiency and customization AMERICAS EMEA ASIA-PACIFC 57% 29% 14% of Net Sales of Net Sales of Net Sales Carpet Manufacturing Facility Rubber Manufacturing Facility LVT Supplier Facility Showroom Note: Figures represent FYE 2019 13

Diversified Customer Verticals CORPORATE OFFICE • Highest penetration of carpet tile vs broadloom • Global Account management • Emerging market penetration BILLINGS BY SEGMENT EDUCATION • K-12 and higher education • Second highest penetration of carpet tile vs broadloom • Second largest market for rubber HOSPITALITY • Guest rooms, corridors and public spaces Non-Office Office • Named the brand standard or alternate at Hilton, Marriott, 51% 49% IHG and Choice Hotels properties HEALTHCARE • Hospitals, MOB, Assisted Living, Senior Living and Life Sciences • Largest rubber market based on hygienic properties, chemical resistance and durability Note: Figures represent FYE 2019 sales for Interface and nora combined RETAIL • Retail and bank branches • Significant opportunity for broadloom conversion • High penetration of LVT 14

Purpose-Driven Culture Galvanized Around a Common Sustainability Mission 2019 Recognition Our sustainability journey began in GlobeScan SustainAbility Leaders Report 1994, led by our founder, Ray Anderson. Floor Covering Weekly’s GreenStep Awards Over the last 25 years, we’ve changed Pinnacle Award Winner our business to help change the world INEX Sustainable Product of the Year (India) by becoming, first and foremost, a purpose-driven company. Sustainable Business Awards (Singapore) Winner, Climate Changes & Best Flagship Initiative GLOBESCAN SUSTAINABILITY SURVEY – 20+ YEAR HISTORY Unilever Patagonia IKEA Only company recognized consistently since survey inception Natura Danone Nestle 15

Radical Reductions in Environmental Impacts 96% 89% 54% Reduction in Greenhouse Gas Reduction in Water Of total raw materials used emissions intensity intake intensity are bio-based or made since 1996 since 1996 of recycled materials 89% 69% 92% Energy use from Reduction in Carbon footprint Reduction in Waste-to-landfill renewable sources of products since 1996 since 1996 Note: Figures represent Interface carpet tile operations as of 2018 16
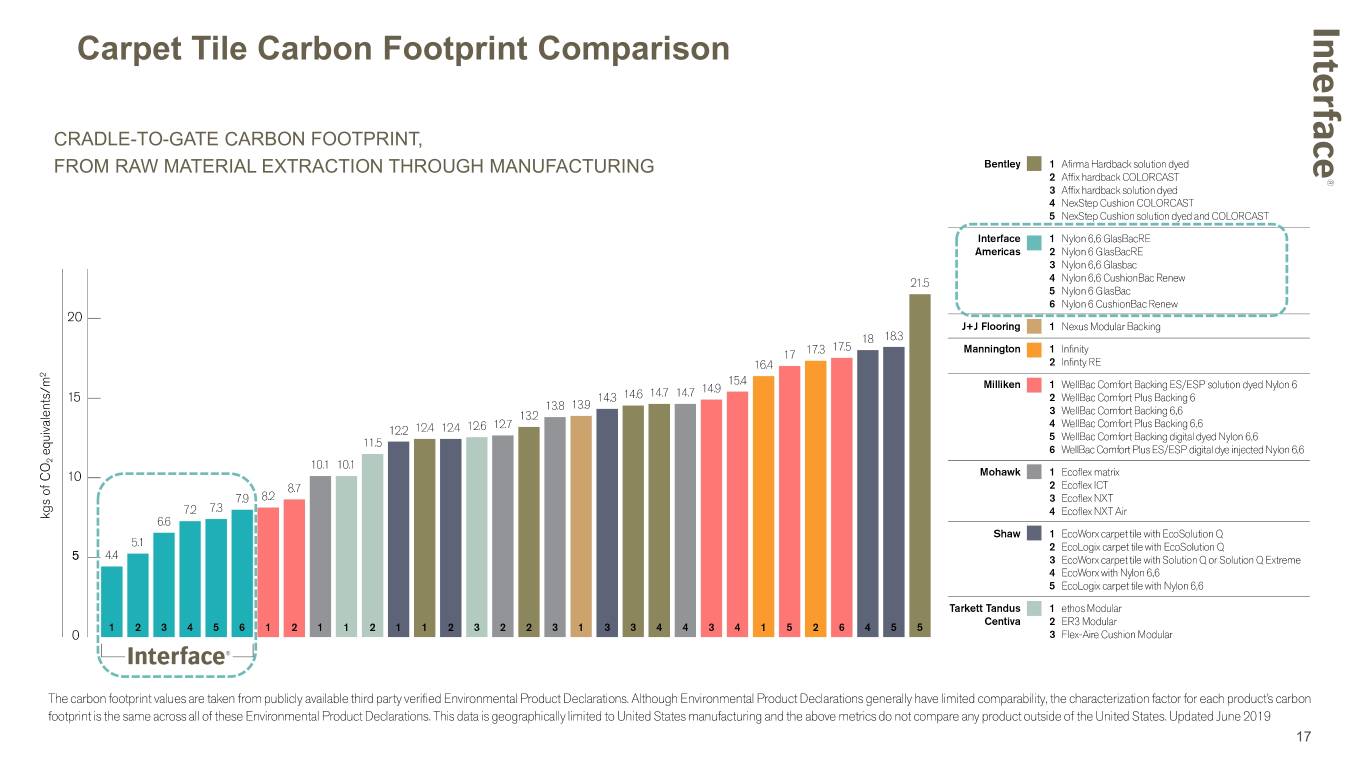
Carpet Tile Carbon Footprint Comparison CRADLE-TO-GATE CARBON FOOTPRINT, FROM RAW MATERIAL EXTRACTION THROUGH MANUFACTURING 17

Financial Performance
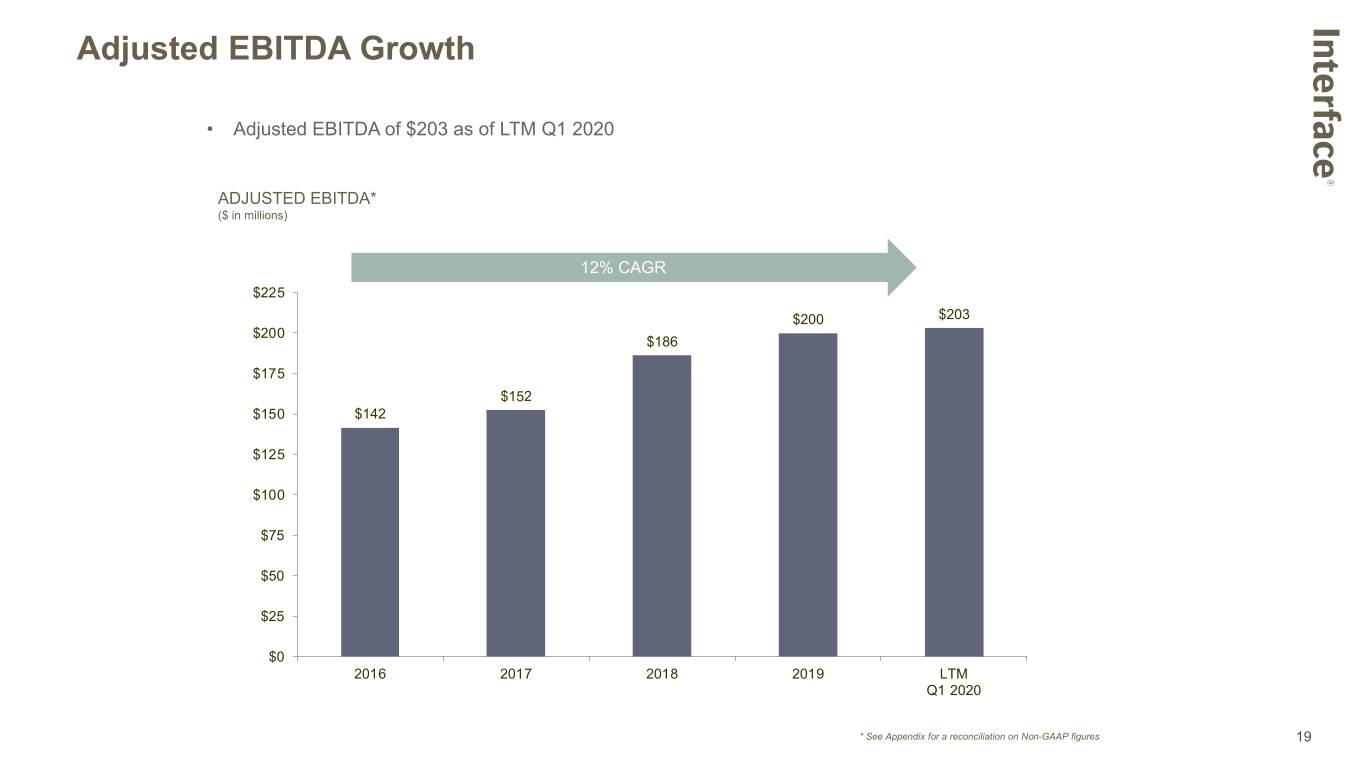
Adjusted EBITDA Growth • Adjusted EBITDA of $203 as of LTM Q1 2020 ADJUSTED EBITDA* ($ in millions) 12% CAGR $225 $200 $203 $200 $186 $175 $152 $150 $142 $125 $100 $75 $50 $25 $0 2016 2017 2018 2019 LTM Q1 2020 * See Appendix for a reconciliation on Non-GAAP figures 19

Adjusted Earnings Per Share • Our value creation strategy is generating double digit Adjusted EPS growth ADJUSTED EARNINGS PER SHARE (DILUTED)* 18% CAGR $1.77 $1.80 $1.59 $1.60 $1.49 $1.40 $1.18 $1.20 $1.03 $1.00 $0.80 $0.60 $0.40 $0.20 $0.00 2016 2017 2018 2019 LTM Q1 2020 * See Appendix for a reconciliation on Non-GAAP figures 20

Capitalization and Liquidity TOTAL DEBT NET DEBT $700 ($ in millions) $700($ in millions) $627 $619 $596 $555 $538 $515 $525 $525 $350 $350 $270 $230 $175 $175 $143 $105 $0 $0 2016 2017 2018 2019 Q1 2020 2016 2017 2018 2019 Q1 2020 ADJUSTED EBITDA* NET DEBT / ADJUSTED EBITDA* $250 ($ in millions) 3.5x 2.9x $200 $203 3.0x 2.7x $200 $186 2.6x 2.5x $152 $142 $150 2.0x $100 1.5x 0.9x 1.0x 0.7x $50 0.5x $0 0.0x 2016 2017 2018 2019 LTM 2016 2017 2018 2019 LTM Q1 2020 Q1 2020 * See Appendix for a reconciliation on Non-GAAP figures 21

Who We Are Established brand Global with a history manufacturing of innovation and a footprint with commitment to industry-leading sustainability gross margins Engaged customer- Leading centric culture global provider Strongest global focused on of commercial sales & marketing performance and flooring: Carpet Tile, capabilities galvanized around LVT, Rubber our sustainability mission 22

Appendix

Appendix: Reconciliation of Non-GAAP Figures ($ in millions) Q1 2019 Q1 2020 Net Sales as Reported (GAAP) $297.7 $288.2 Impact of Changes in Currency - 4.9 Organic Sales $297.7 $293.1 Gross Profit as Reported (GAAP) $116.5 $114.3 Purchase Accounting Amortization 1.9 1.3 Adjusted Gross Profit $118.4 $115.6 SG&A Expense as Reported (GAAP) $100.1 $87.7 Impact of Change in Equity Award Forfeiture Accounting - (1.4) Adjusted SG&A Expense $100.1 $86.3 2018 2019 Operating Income as Reported (GAAP) $76.4 $130.9 $16.4 ($93.5) Purchase Accounting Amortization 32.1 5.9 1.9 1.3 Transaction Related Expenses 5.3 - - - Goodwill and Intangible Asset Impairment Charge - - - 121.3 Impact of Change in Equity Award Forfeiture Accounting - - - 1.4 Restructuring Charges 20.5 12.9 - (1.1) Adjusted Operating Income* $134.3 $149.8 $18.3 $29.4 Net Income as Reported (GAAP) $7.1 ($102.2) Purchase Accounting Amortization 1.3 0.9 Goodwill and Intangible Asset Impairment Charge - 119.8 Impact of Change in Equity Award Forfeiture Accounting - 1.1 Restructuring Charges - (0.9) Adjusted Net Income $8.4 $18.7 * Sum of reconciling items may differ from total due to rounding of individual components 24
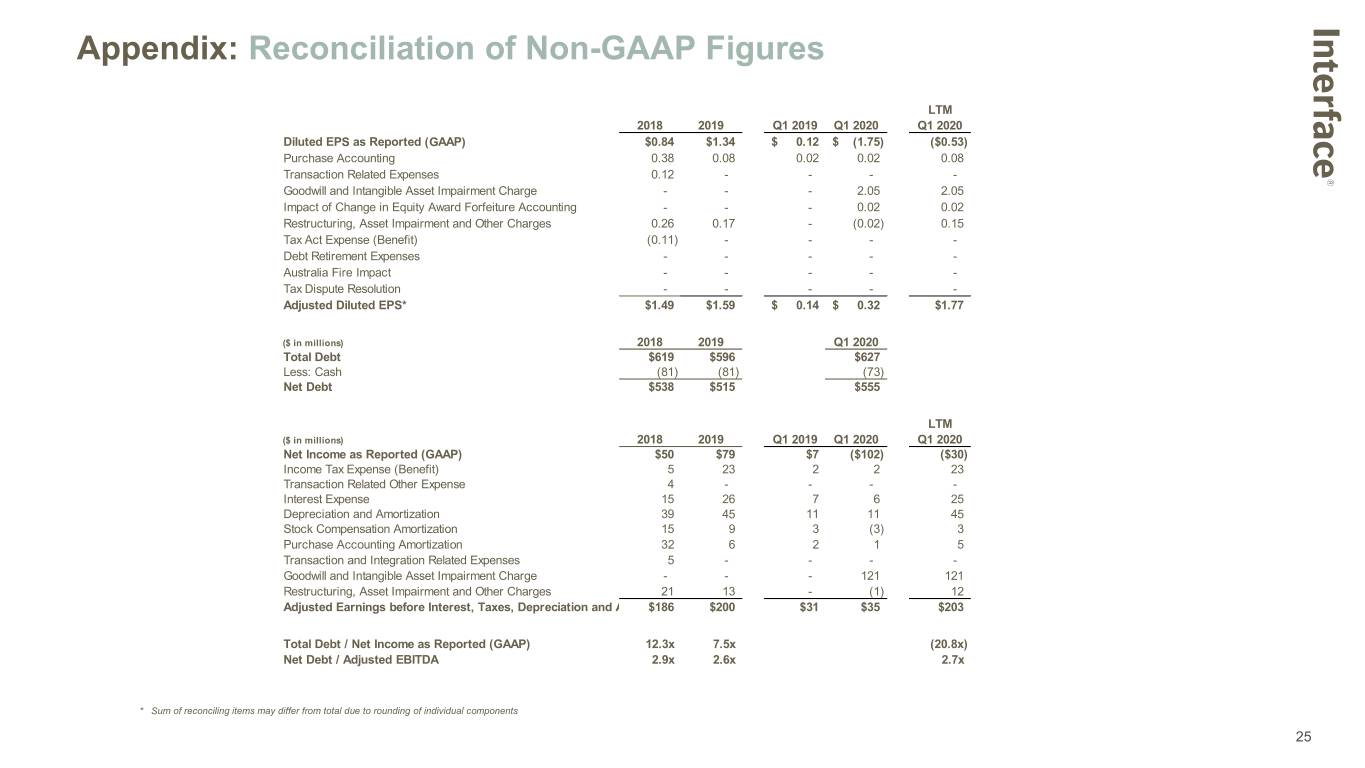
Appendix: Reconciliation of Non-GAAP Figures LTM 2018 2019 Q1 2019 Q1 2020 Q1 2020 Diluted EPS as Reported (GAAP) $0.84 $1.34 $ 0.12 $ (1.75) ($0.53) Purchase Accounting 0.38 0.08 0.02 0.02 0.08 Transaction Related Expenses 0.12 - - - - Goodwill and Intangible Asset Impairment Charge - - - 2.05 2.05 Impact of Change in Equity Award Forfeiture Accounting - - - 0.02 0.02 Restructuring, Asset Impairment and Other Charges 0.26 0.17 - (0.02) 0.15 Tax Act Expense (Benefit) (0.11) - - - - Debt Retirement Expenses - - - - - Australia Fire Impact - - - - - Tax Dispute Resolution - - - - - Adjusted Diluted EPS* $1.49 $1.59 $ 0.14 $ 0.32 $1.77 ($ in millions) 2018 2019 Q1 2020 Total Debt $619 $596 $627 Less: Cash (81) (81) (73) Net Debt $538 $515 $555 LTM ($ in millions) 2018 2019 Q1 2019 Q1 2020 Q1 2020 Net Income as Reported (GAAP) $50 $79 $7 ($102) ($30) Income Tax Expense (Benefit) 5 23 2 2 23 Transaction Related Other Expense 4 - - - - Interest Expense 15 26 7 6 25 Depreciation and Amortization 39 45 11 11 45 Stock Compensation Amortization 15 9 3 (3) 3 Purchase Accounting Amortization 32 6 2 1 5 Transaction and Integration Related Expenses 5 - - - - Goodwill and Intangible Asset Impairment Charge - - - 121 121 Restructuring, Asset Impairment and Other Charges 21 13 - (1) 12 Adjusted Earnings before Interest, Taxes, Depreciation and A $186 $200 $31 $35 $203 Total Debt / Net Income as Reported (GAAP) 12.3x 7.5x (20.8x) Net Debt / Adjusted EBITDA 2.9x 2.6x 2.7x * Sum of reconciling items may differ from total due to rounding of individual components 25
