Attached files
| file | filename |
|---|---|
| 8-K - 8-K - TRANSATLANTIC PETROLEUM LTD. | tat-8k_20200604.htm |

2020 Annual Meeting June 5, 2020 Exhibit 99.1
Disclaimer Outlooks, projections, estimates, targets, and business plans in this presentation or any related subsequent discussions by TransAtlantic Petroleum Ltd. (together with its subsidiaries, “we,” “us,” “our,” or the “Company”) are forward-looking statements. Such forward-looking statements or information are based on a number of assumptions, which may prove to be incorrect. Although we believe that the expectations reflected in such forward-looking statements or information are reasonable, undue reliance should not be placed on forward-looking statements because we can give no assurance that such expectations will prove to be correct. Forward-looking statements or information are based on current expectations, estimates, and projections that involve a number of risks and uncertainties which could cause actual results to differ materially from those anticipated by us and described in the forward-looking statements or information. These risks and uncertainties include, but are not limited to, our ability to continue as a going concern; well development results; access to sufficient capital; market prices for natural gas, natural gas liquids, and oil products, including price changes resulting from coronavirus fears as well as oil oversupply concerns; estimates of reserves and economic assumptions; the ability to produce and transport natural gas, natural gas liquids, and oil products, including price changes resulting from coronavirus fears as well as oil oversupply concerns; the results of exploration and development drilling and related activities; the effects of the coronavirus on our operations, demand for oil and natural gas as well as governmental actions in response to the coronavirus; economic conditions in the countries and provinces in which we carry on business, especially economic slowdowns; actions by governmental authorities; the unwinding of our hedges against a decline in the price of oil; receipt of required approvals; increases in taxes; legislative and regulatory initiatives relating to fracture stimulation activities; changes in environmental and other regulations; renegotiations of contracts; political uncertainty, including sanctions, armed conflicts, and actions by insurgent groups; outcomes of litigation; the negotiation and closing of material contracts; and other risks discussed here and under the heading “Risk Factors" in our Annual Report on Form 10-K for the year ended December 31, 2019, which is available on our website at www.transatlanticpetroleum.com and at www.sec.gov. See also our audited financial statements and the accompanying management discussion and analysis. Forward-looking statements are based on management’s knowledge and reasonable expectations on the date hereof, and we assume no duty to update forward-looking statements, except as required by law. The information set forth in this presentation does not constitute an offer, solicitation, or recommendation to sell or an offer to buy any of our securities. The information published herein is provided for informational purposes only. We make no representation that the information and opinions expressed herein are accurate, complete, or current. The information contained herein is current as of the date hereof but may become outdated or subsequently may change. Nothing contained herein constitutes financial, legal, tax, or other advice. Note on BOE: BOE (barrel of oil equivalent) is derived by converting natural gas to oil in the ratio of six thousand cubic feet (MCF) of natural gas to one barrel (bbl) of oil. BOE may be misleading, particularly if used in isolation. A BOE conversion ratio of 6 Mcf:1 bbl is based on an energy equivalency conversion method primarily applicable at the burner tip and does not represent a value equivalency at the wellhead.
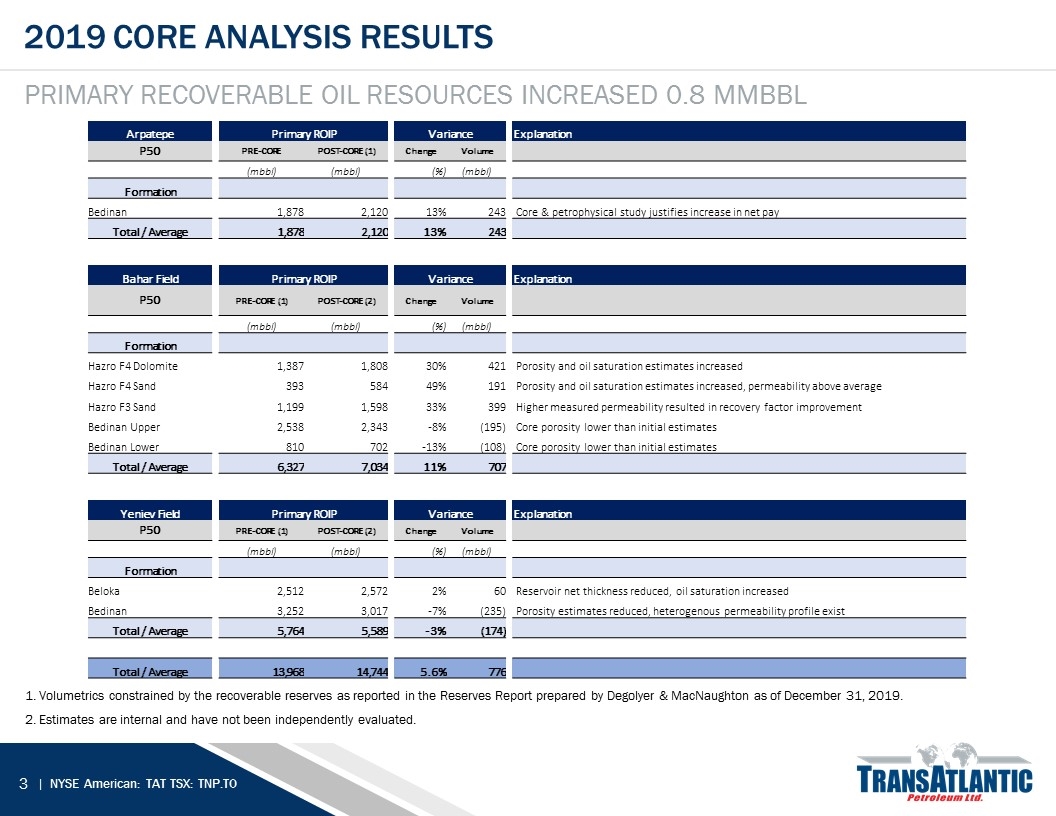
2019 core analysis Results Primary recoverable oil resources increased 0.8 mmBBL 1. Volumetrics constrained by the recoverable reserves as reported in the Reserves Report prepared by Degolyer & MacNaughton as of December 31, 2019. 2. Estimates are internal and have not been independently evaluated. Arpatepe Primary ROIP Variance Explanation P50 PRE-CORE POST-CORE (1) Change Volume (mbbl) (mbbl) (%) (mbbl) Formation Bedinan 1,878 2,120 13% 243 Core & petrophysical study justifies increase in net pay Total / Average 1,878 2,120 13% 243 Bahar Field Primary ROIP Variance Explanation P50 PRE-CORE (1) POST-CORE (2) Change Volume (mbbl) (mbbl) (%) (mbbl) Formation Hazro F4 Dolomite 1,387 1,808 30% 421 Porosity and oil saturation estimates increased Hazro F4 Sand 393 584 49% 191 Porosity and oil saturation estimates increased, permeability above average Hazro F3 Sand 1,199 1,598 33% 399 Higher measured permeability resulted in recovery factor improvement Bedinan Upper 2,538 2,343 -8% (195) Core porosity lower than initial estimates Bedinan Lower 810 702 -13% (108) Core porosity lower than initial estimates Total / Average 6,327 7,034 11% 707 Yeniev Field Primary ROIP Variance Explanation P50 PRE-CORE (1) POST-CORE (2) Change Volume (mbbl) (mbbl) (%) (mbbl) Formation Beloka 2,512 2,572 2% 60 Reservoir net thickness reduced, oil saturation increased Bedinan 3,252 3,017 -7% (235) Porosity estimates reduced, heterogenous permeability profile exist Total / Average 5,764 5,589 -3% (174) Total / Average 13,968 14,744 5.6% 776
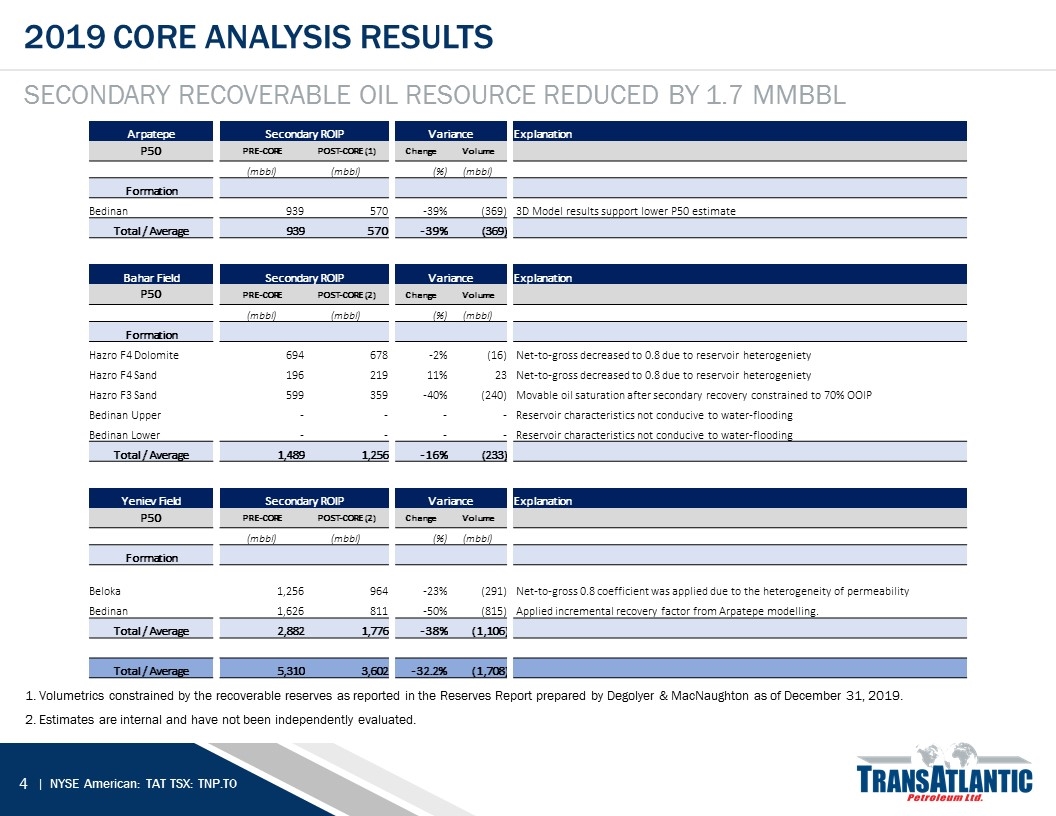
2019 core analysis Results Secondary recoverable oil Resource reduced by 1.7 MmBBL 1. Volumetrics constrained by the recoverable reserves as reported in the Reserves Report prepared by Degolyer & MacNaughton as of December 31, 2019. 2. Estimates are internal and have not been independently evaluated. Arpatepe Secondary ROIP Variance Explanation P50 PRE-CORE POST-CORE (1) Change Volume (mbbl) (mbbl) (%) (mbbl) Formation Bedinan 939 570 -39% (369) 3D Model results support lower P50 estimate Total / Average 939 570 -39% (369) Bahar Field Secondary ROIP Variance Explanation P50 PRE-CORE POST-CORE (2) Change Volume (mbbl) (mbbl) (%) (mbbl) Formation Hazro F4 Dolomite 694 678 -2% (16) Net-to-gross decreased to 0.8 due to reservoir heterogeniety Hazro F4 Sand 196 219 11% 23 Net-to-gross decreased to 0.8 due to reservoir heterogeniety Hazro F3 Sand 599 359 -40% (240) Movable oil saturation after secondary recovery constrained to 70% OOIP Bedinan Upper - - - - Reservoir characteristics not conducive to water-flooding Bedinan Lower - - - - Reservoir characteristics not conducive to water-flooding Total / Average 1,489 1,256 -16% (233) Yeniev Field Secondary ROIP Variance Explanation P50 PRE-CORE POST-CORE (2) Change Volume (mbbl) (mbbl) (%) (mbbl) Formation Beloka 1,256 964 -23% (291) Net-to-gross 0.8 coefficient was applied due to the heterogeneity of permeability Bedinan 1,626 811 -50% (815) Applied incremental recovery factor from Arpatepe modelling. Total / Average 2,882 1,776 -38% (1,106) Total / Average 5,310 3,602 -32.2% (1,708)
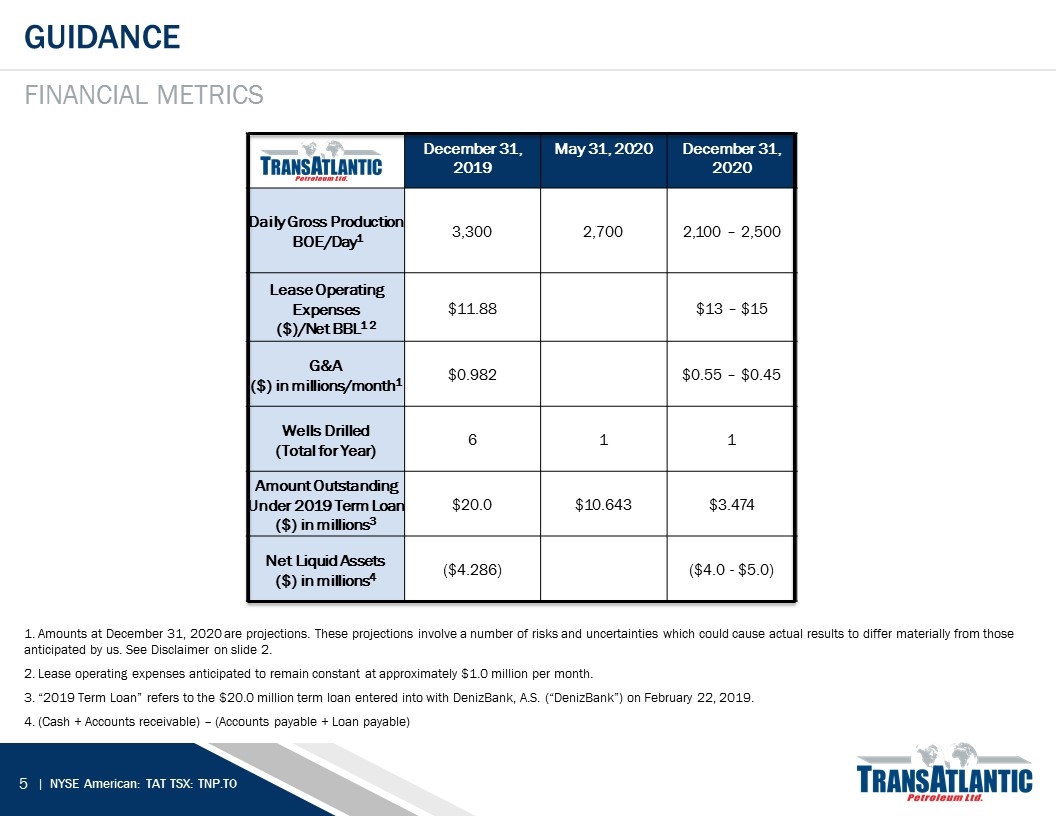
guidance financial metrics 1. Amounts at December 31, 2020 are projections. These projections involve a number of risks and uncertainties which could cause actual results to differ materially from those anticipated by us. See Disclaimer on slide 2. 2. Lease operating expenses anticipated to remain constant at approximately $1.0 million per month. 3. “2019 Term Loan” refers to the $20.0 million term loan entered into with DenizBank, A.S. (“DenizBank”) on February 22, 2019. 4. (Cash + Accounts receivable) – (Accounts payable + Loan payable) December 31, 2019 May 31, 2020 December 31, 2020 Daily Gross Production BOE/Day1 3,300 2,700 2,100 – 2,500 Lease Operating Expenses ($)/Net BBL1 2 $11.88 $13 – $15 G&A ($) in millions/month1 $0.982 $0.55 – $0.45 Wells Drilled (Total for Year) 6 1 1 Amount Outstanding Under 2019 Term Loan ($) in millions3 $20.0 $10.643 $3.474 Net Liquid Assets ($) in millions4 ($4.286) ($4.0 - $5.0)
OIL PRICE DECLINE In March 2020, crude oil prices declined to low of approximately $25 per barrel for Brent crude as a result of market concerns about the economic impact from the coronavirus (COVID-19) as well as the ability of OPEC and Russia to agree on a perceived need to implement further production cuts in response to weaker worldwide demand. Since then, ICE Brent Crude Forward Month prices have rebounded to approximately $39 per barrel as of June 3, 2020 and remain volatile and unpredictable. The current futures forward curve for Brent crude indicates that prices may continue at or near current prices for an extended time. UNWINDING HEDGES AND PAYING DOWN THE 2019 TERM LOAN On March 9, 2020, we unwound our commodity derivative contracts with respect to our future crude oil production. In connection with these transactions, we received $6.5 million. In order to reduce future interest expense, we used these proceeds to pay down the 2019 Term Loan, which left approximately $10.6 million outstanding under the 2019 Term Loan. As of June 3, 2020, we still had $10.6 million of outstanding principal under the 2019 Term Loan. The 2019 Term Loan is payable in one monthly installment of $0.6 million plus accrued interest in June 2020 and seven monthly installments of $1.4 million plus accrued interest from July 2020 through the maturity date in February 2021. ENTRY INTO HEDGE On April 3, 2020, we entered into a new swap contract (the “Hedge”) with DenizBank, A.S. (“DenizBank”), which hedged approximately 2,000 barrels of oil per day. The swap contract is in place from May 2020 through February 2021, has an ICE Brent Index strike price of $36.00 per barrel, and is settled monthly. Therefore, DenizBank is required to make a payment to us if the average monthly ICE Brent Index price is less than $36.00 per barrel, and we are required to make a payment to DenizBank if the average monthly ICE Brent Index price is greater than $36.00 per barrel. Financial condition Recent events
INCREASE IN DIFFERENTIAL BETWEEN HEDGED PRICES AND REALIZED PRICES Türkiye Petrol Rafinerileri A.Ş. (“TUPRAS”), a privately-owned oil refinery in Turkey, purchases substantially all of our crude oil production. The price of substantially all of the oil delivered pursuant to the purchase and sale agreement with TUPRAS is tied to Arab Medium oil price adjusted upward based on an API adjustment, Suez Canal tariff costs, and freight charges. In the second quarter of 2020, there has been a significant widening of the differential between the ICE Brent Index price, the price to which the Hedge is tied, and our realized price. In 2018 and 2019, the average monthly differential between the ICE Brent Index price and our realized price was $2.44 and $0.17 per barrel, respectively. In April and May 2020, the average monthly differential between the ICE Brent Index price and our realized price was $6.90 and $8.38 per barrel, respectively. The widening of the differential between ICE Brent Index price and our realized price has rendered the Hedge less effective, resulting in significantly lowered revenues. For example, in May 2020, the average ICE Brent Index price was $32.41 per barrel. If the differential between the ICE Brent Index price and our realized price had been $0.17 per barrel, the average differential in 2019, our realized price would have been $32.27 per barrel. In May 2020, with an $8.38 per barrel differential, our realized price was $24.03 per barrel. Under the Hedge, for May 2020, we are only entitled to receive the difference between $36 per barrel and the ICE Brent Index price of $32.41 per barrel, subject to adjustment for fees, for 2,000 barrels of oil per day. The differential may expand or contract in the future. Financial condition Recent events
ELECTION TO PAY SECOND QUARTER 2020 DIVIDEND ON SERIES A PREFERRED SHARES IN COMMON SHARES Dividends on our 12% Series A Convertible Redeemable Preferred Shares (“Series A Preferred Shares”) are payable quarterly at our election in cash, common shares, or a combination of cash and common shares at an annual dividend rate of 12.0% of the liquidation preference if paid in cash or 16.0% of the liquidation preference if paid in common shares. If paid partially in cash and partially in common shares, the dividend rate on the cash portion is 12.0%, and the dividend rate on the common share portion is 16.0%. In order to conserve cash, in May 2020, we elected to pay the second dividend in 2020 in common shares. Financial condition Recent events
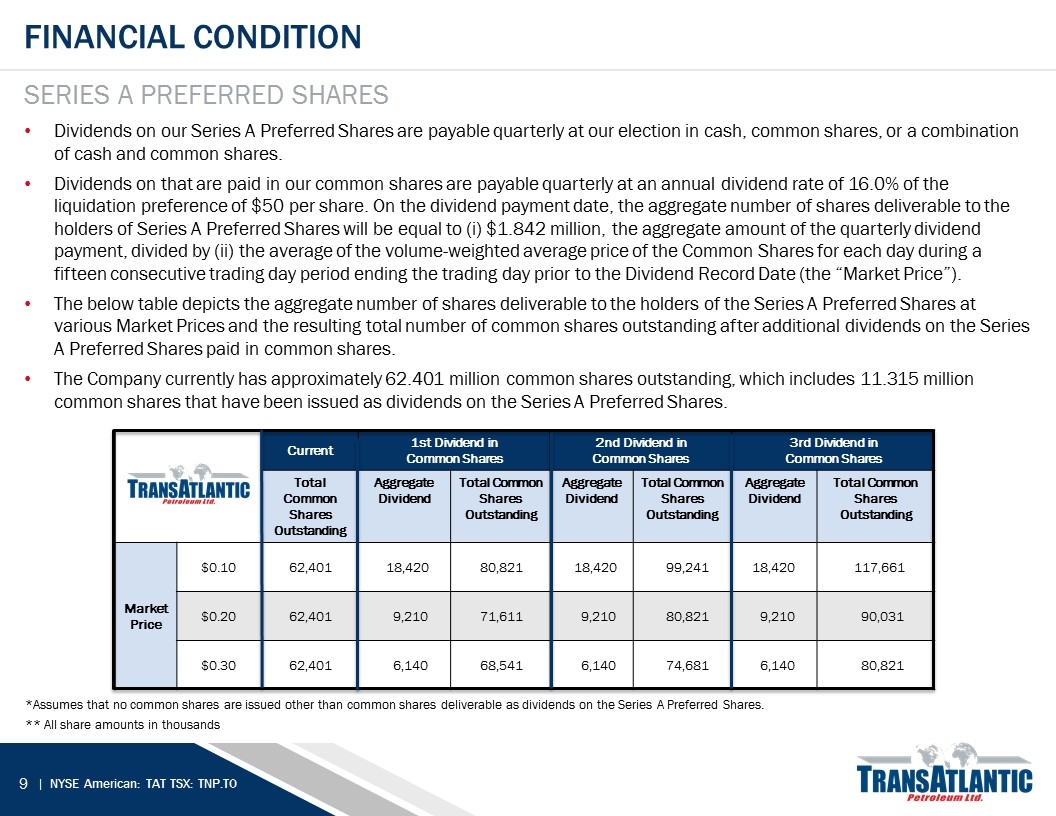
Financial condition Series A Preferred Shares Dividends on our Series A Preferred Shares are payable quarterly at our election in cash, common shares, or a combination of cash and common shares. Dividends on that are paid in our common shares are payable quarterly at an annual dividend rate of 16.0% of the liquidation preference of $50 per share. On the dividend payment date, the aggregate number of shares deliverable to the holders of Series A Preferred Shares will be equal to (i) $1.842 million, the aggregate amount of the quarterly dividend payment, divided by (ii) the average of the volume-weighted average price of the Common Shares for each day during a fifteen consecutive trading day period ending the trading day prior to the Dividend Record Date (the “Market Price”). The below table depicts the aggregate number of shares deliverable to the holders of the Series A Preferred Shares at various Market Prices and the resulting total number of common shares outstanding after additional dividends on the Series A Preferred Shares paid in common shares. The Company currently has approximately 62.401 million common shares outstanding, which includes 11.315 million common shares that have been issued as dividends on the Series A Preferred Shares. *Assumes that no common shares are issued other than common shares deliverable as dividends on the Series A Preferred Shares. ** All share amounts in thousands Current 1st Dividend in Common Shares 2nd Dividend in Common Shares 3rd Dividend in Common Shares Total Common Shares Outstanding Aggregate Dividend Total Common Shares Outstanding Aggregate Dividend Total Common Shares Outstanding Aggregate Dividend Total Common Shares Outstanding Market Price $0.10 62,401 18,420 80,821 18,420 99,241 18,420 117,661 $0.20 62,401 9,210 71,611 9,210 80,821 9,210 90,031 $0.30 62,401 6,140 68,541 6,140 74,681 6,140 80,821
The price of the oil delivered pursuant to the purchase and sale agreement with TUPRAS is determined under the Petroleum Market Law No. 5015 under the laws of the Republic of Turkey. In November 2019, TUPRAS filed a lawsuit seeking restitution from us for alleged overpayments resulting from a February 2019 amendment to the Turkish domestic crude oil pricing formula under Petroleum Market Law No. 5015 (the “Pricing Amendment”). TUPRAS also claimed that the Pricing Amendment violates the Constitution of the Republic of Turkey and seeks to have the Pricing Amendment cancelled. Additionally, in April 2020, TUPRAS notified us that it intends to extend payment terms for oil purchases by 60 days. The outcome of the TUPRAS lawsuit and negotiations regarding the extension of payment terms is uncertain; however, a conclusion of the lawsuit in TUPRAS’s favor or an extension of payment terms would reduce or delay our cash flow and decrease our cash balances. In the second quarter of 2020, we borrowed approximately $626,000 pursuant to the U.S. Paycheck Protection Program (the “PPP”) to cover certain payroll, benefit, and rent expenses. We have forecast that amounts borrowed or received pursuant to the PPP will be forgiven for cash flow purposes. New guidance on the criteria for forgiveness continues to be released, and we currently expect that a majority of the amounts borrowed will be forgiven and a yet-to-be-determined amount will need to be repaid. Additionally, in the second quarter of 2020, the Turkish government passed legislation permitting employers to reduce the working hours of employees, reducing payroll and benefit expenses, through the end of June 2020. The projected reduction in payroll and benefit expenses due to this Turkish legislation is approximately $360,000. Financial condition Cash flow timing uncertainty
As of the date hereof, based on cash on hand and projected future cash flow from operations, our current liquidity position is severely constrained and is forecast to worsen during 2020 as revenues are insufficient to meet our ordinary course expenditures and debt obligations. Based on our current cash flow forecasts, we may fall below our standard minimum working cash balance of $3 million in the third quarter of 2020, and we may be unable to pay the scheduled monthly installments on the 2019 Term Loan in the fourth quarter of 2020, unless we can further reduce expenses, increase revenues, obtain additional financing, or restructure our current obligations. To date, we have been unable to restructure our current obligations or obtain additional financing to alleviate these liquidity issues. As a result, substantial doubt exists regarding our ability to continue as a going concern. Our management is actively pursuing improving our working capital position in order to remain a going concern for the foreseeable future. The Special Committee of our Board of Directors has received multiple offers from a group of the Company’s current shareholders affiliated with N. Malone Mitchell 3rd, the Company’s chief executive officer and chairman of the board of directors, and his children (collectively, the “Mitchell Group”) to acquire 100% of the Company’s outstanding common shares, subject to certain conditions. Each offer contemplated that the sale would be structured as a merger, which we currently estimate would take 28 weeks from the date of execution of definitive merger documents in order to close due to the estimated timing for Turkish regulatory approvals. Pursuant to the most recent Mitchell Group offer (the “Offer”), each shareholder that was not a member of the Mitchell Group would receive at closing (i) $0.11 per common share plus (ii) its pro rata portion of (a) undrawn amounts under a $5.75 million revolving line of credit provided by the Mitchell Group to the Company, if any, plus (b) working capital of the Company in excess of $3 million. After consultation with the Company’s legal and financial advisors, the Special Committee rejected the Offer. The Special Committee and the Mitchell Group continue to engage in discussions.1 2 Financial condition Summary 1. The description of the Offer is qualified in its entirety by reference to the full text of the offer, a copy of which is attached as Exhibit 99.1 to the Company’s Current Report on Form 8-K, dated June 3, 2020, filed with the Securities and Exchange Commission on June 3, 2020. 2. There is no assurance that discussions will result in a sale of the Company or any other transaction.
