Attached files
| file | filename |
|---|---|
| 8-K - FORM 8-K FOR 2020 ASM SLIDE DECK OF PICO HOLDINGS, INC. - VIDLER WATER RESOURCES, INC. | form8-kx2020amspresentation.htm |

PICO Holdings, Inc. Annual Meeting of Shareholders May 28, 2020 1

FORWARD LOOKING STATEMENTS SAFE HARBOR This presentation contains forward-looking statements within the meaning of Section 27A of the Securities Act of 1933, as amended and Section 21E of the Securities Exchange Act of 1934, as amended and are made pursuant to the “safe harbor” provisions of the Private Securities Litigation Reform Act of 1995. All statements, other than statements of historical or current fact, are statements that could be deemed forward-looking statements; these include, without limitation, any projections or guidance regarding earnings, earnings per share, revenues, cash flows, dividends, capital expenditures or other financial items; and any statements concerning plans, strategy and management objectives for future operations, as well as statements regarding future economic, industry, or company conditions or performance and any statements of belief and any statement of assumptions underlying any of the foregoing. Forward-looking statements often address current expected future business and financial performance, including the demand and pricing for PICO’s real estate and water assets, the completion of proposed monetization transactions, the return of capital to shareholders, and the reduction of costs. Forward- looking statements may contain words such as “expects,” “estimates,” “anticipates,” “intends,” “plans,” “projects,” “believes,” “seeks,” or “will.” All forward-looking statements included in this presentation are based on information available to PICO as of the date hereof; PICO specifically disclaims and assumes no obligation to update any forward-looking statements. Actual results could, and likely will, differ materially from those described in the forward-looking statements. Forward-looking statements involve risks and uncertainties, outside of our control, including, but not limited to, economic, competitive and governmental actions that may cause our business, industry, strategy or actual results to differ materially from the forward-looking statements. Factors that could cause or contribute to such differences include, but are not limited to, those discussed in detail under the heading “Risk Factors” in PICO’s periodic reports filed with the U.S. Securities and Exchange Commission. This presentation should be reviewed in connection with, and is qualified by, PICO’s Annual Report on Form 10-K filed for the period ending December 31, 2019, and PICO’s quarterly report on Form 10-Q filed for the period ended March 31, 2020. A number of the slides in the presentation contain information from public sources that PICO has not independently verified. 22

COVID-19 Update Our presentation is based primarily on data up until March 2020 and does not reflect any impact of the Coronavirus on the economies of our service areas (primarily northern Nevada and the Phoenix, AZ metropolitan area). Any economic impacts on the demand for our assets due to the contraction of the economy in the U.S. - which began mid-March - will be reflected in future financial statements and filings with the SEC commencing with our quarterly report on Form 10-Q for the period ending June 30, 2020, to be filed in August of 2020, and beyond. 33

Our Mission We are governance – oriented and committed to advancing our shareholder and stakeholders’ interests: » Our corporate mission is to facilitate and support economic growth in water – scarce regions through the development of sustainable and reliable water supplies. » We have deep and decades – long relationships with government, developers, regulators and communities. For example, Vidler Water Company currently has partnerships with local governments and agencies such as Lincoln County and Lyon County, Nevada and Truckee Meadows Water Authority to develop and manage new water resources. » Our Board of Directors has significant ownership interest and alignment with our shareholders. » Our Board possesses deep expertise in water engineering and development, finance, capital markets, environmental issues and regulations. 44

Our Business Plan • Monetize existing assets at maximum possible present value and return on invested capital • Return capital to our shareholders (we may occasionally use asset sale proceeds to enhance existing assets) • Reduce net costs where possible 55
Our Major Assets: Summary Arizona Long-Term Storage Credits » Our Arizona LTSCs are part of the solution to the Colorado River Lower Basin structural deficit, the drought contingency plan and the needs of new communities, homebuilders, state agencies and other users. In addition, Phoenix and Pinal AMAs are experiencing water shortages - our LTSCs banked in Harquahala Valley can be used as a new water source to support existing users and for development. » Our current inventory is 28,297 LTSCs banked in the Phoenix AMA and 250,683 LTSCs banked at our recharge site in La Paz, County AZ. » Most recent significant sale of Phoenix AMA credits at $347.50 per credit. 66

Our Major Assets: Summary Northern Nevada Water Resources (North Valleys, Reno and Dayton Corridor areas) » Pent-up demand exists due to housing shortages and lack of available water in the North Valleys and Dayton corridor: Monetization and timing of sales is highly dependent on new residential and commercial demand and issuance of building permits as Reno / northern Nevada attracts new employers and employees in an increasingly diversified business environment – including from California’s “reverse Great Migration.” Our sustainable, in perpetuity water resources in northern Nevada can support the needed increase in affordable homes and infrastructure for Reno’s growing workforce. » Our Fish Springs Ranch subsidiary owns 7,756 AF municipal use water rights (with governmental permitting underway to move a further 5,000 AF) available for the North Valleys with current pricing at $41,500 per AF for residential developments. » We own or control the equivalent of 4,192 AF of municipal and industrial water rights in and around the Dayton corridor area; our current pricing is $26,000 per AF. 77

Our Accomplishments in 2019 and 2020 Year - to - Date • Sold 134 AF of Fish Spring Ranch water credits for $4.7 million in 2019 ($35,000 per AF) and 17.04 AF of Fish Springs Ranch water credits for $613,440 YTD 2020 ($36,000 per AF). • Sold 488 AF of water rights at Dodge Flat, NV for $3.1 million in 2019 and a further 470 AF in Q2 of 2020 for $3.1 million. • Sold Dodge Flat Real Estate in 2019: 1,064 acres for $8.8 million. • Sold 25,260 LTSCs in Phoenix AMA for $8.8 million in 2019 ($347.50 per LTSC). • Generated Net Income of $11.5 million in 2019 with no federal income taxes payable due to the utilization of our NOLs carried forward ($156.5 million federal NOLs at December 31, 2019). • Repurchased approximately 1.45 million shares on the open market for $14.5 million in 2019 and 2020 to date. • Closed the La Jolla, CA office and completed transition of all finance and accounting functions to Carson City, NV resulting in estimated annual savings of approximately $600,000. 88

Our Customer Base • Our water resource & real estate assets provide critical resources for a wide variety of users: » Solar energy developer, northern NV » The municipality of Golden, CO » The municipalities of El Mirage and Scottsdale, AZ » Developers in Santa Fe and farmers in Las Cruces, NM » Homebuilders in Reno, NV and real estate developers in northern and southern Nevada » Arizona state water agencies » Gold mining operations, northern NV » Apartment buildings, warehouses, industrial, gas stations, drought mitigation water, golf courses, homebuilder associations, & schools 99

NORTH VALLEYS Vidler Assets in FSR PIPELINE Northern Nevada WASHOE LEMMON VALLEY SPANISH DODGE FLAT • Dodge Flat SPRINGS FERNLEY » 438.51 AF Under Option to Purchase Q4 2020 for $3.3 million SUN • Fish Springs Ranch (FSR) VALLEY » Land: 7,309.78 acres » Municipal Water: 7,755.94 AF + 5,000 AF (Governmental permitting underway to move an additional 5,000 AF) SPARKS » Agricultural Water: 791.35 AF – Ground Water & Surface Water RENO » Pipeline Capacity 22,000 AF • Carson-Lyon » Municipal Water: 1,127.10 AF STOREY » Municipal Water Options: SILVER – 895.55 AF of Carson River Water Rights SPRINGS – 402.61 AF of Dayton Valley Groundwater » Agricultural: 3,288.89 AF 1,766.83 AF (Mun) » 950 Ranch: 949.58 acres DAYTON-SILVER SPRINGS » Pipeline Capacity 5,000 AF INTERTIE » Highway 50 Utility Right-of-Way Project – Right-of-Way for a utility corridor between Dayton and DESERT WELLS PRESERVE Silver Springs. In-house preliminary engineering and routing as well as the initial permitting with NDOT and 950 RANCH BLM and related groundwork. Hard costs such as DAYTON surveying, biological and cultural services to be paid by the Carson Water Subconservancy District’s Regional Water System funding source. LYON CARSON INTERTIE CARSON VIDLER PARCELS PENDING PROJECTS DOUGLAS FUTURE DEVELOPABLE PROPERTY 1010 OPPORTUNITY ZONES 10
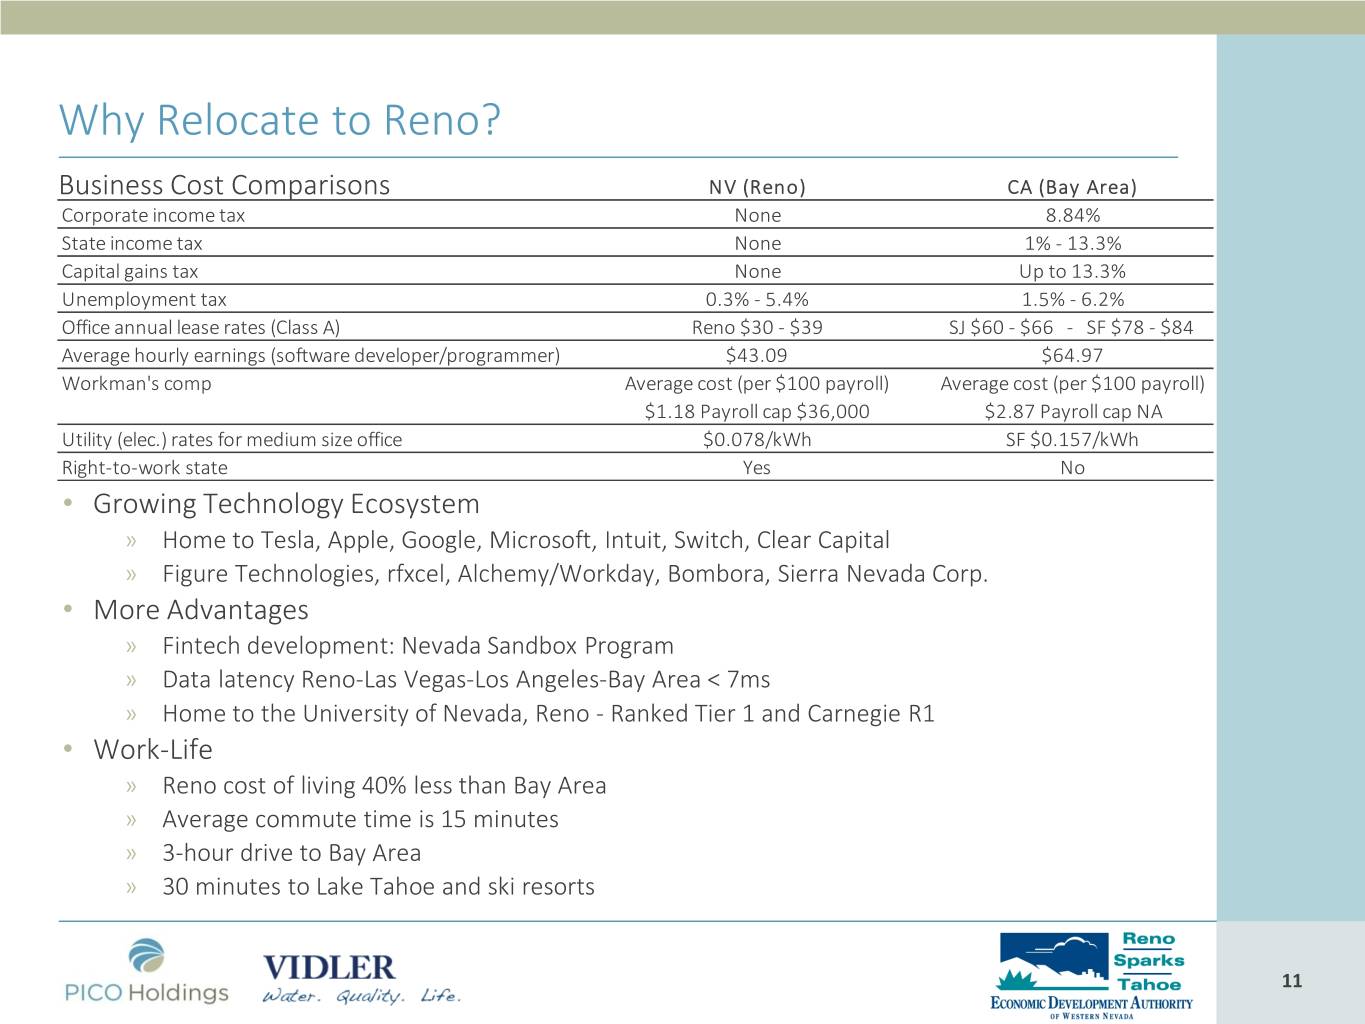
Why Relocate to Reno? Business Cost Comparisons NV (Reno) CA (Bay Area) Corporate income tax None 8.84% State income tax None 1% - 13.3% Capital gains tax None Up to 13.3% Unemployment tax 0.3% - 5.4% 1.5% - 6.2% Office annual lease rates (Class A) Reno $30 - $39 SJ $60 - $66 - SF $78 - $84 Average hourly earnings (software developer/programmer) $43.09 $64.97 Workman's comp Average cost (per $100 payroll) Average cost (per $100 payroll) $1.18 Payroll cap $36,000 $2.87 Payroll cap NA Utility (elec.) rates for medium size office $0.078/kWh SF $0.157/kWh Right-to-work state Yes No • Growing Technology Ecosystem » Home to Tesla, Apple, Google, Microsoft, Intuit, Switch, Clear Capital » Figure Technologies, rfxcel, Alchemy/Workday, Bombora, Sierra Nevada Corp. • More Advantages » Fintech development: Nevada Sandbox Program » Data latency Reno-Las Vegas-Los Angeles-Bay Area < 7ms » Home to the University of Nevada, Reno - Ranked Tier 1 and Carnegie R1 • Work-Life » Reno cost of living 40% less than Bay Area » Average commute time is 15 minutes » 3-hour drive to Bay Area » 30 minutes to Lake Tahoe and ski resorts 1111

Fish Springs Ranch Update • TMWA provided new water dedication rates in March 2020 for their service area: Residential dedication is now 0.28 AF per 6,000 sq. ft. residential lot (from 0.36 AF per lot). • In response we have adjusted our pricing for residential development to $41,500 per AF from May 1, 2020 (Commercial development dedication rates are unchanged and our pricing at present remains at $36,000 per AF). • Our total preferred capital in the FSR partnership at March 31, 2020 totals $193 million – currently compounding at approximately $3 million per quarter; total capital due to Vidler prior to profit split with partners is $209.7 million at March 31, 2020. • Lease income from solar developer for up to 2,600 acres at $400 per acre with 2% per annum escalator. First phase (650-700 acres) expected to commence in 2020. 1212

North Valleys Estimated Total Water Usage from New Residential Projects Development Area Single Commercial / Estimated Project Sold (AF) in (Prior Name) Family Units Industrial Acres Water Demand (AF) 2019 Stonegate 1245 Multi-Family, 3,755 1,793 (Heinz Ranch) 51 Ac Commerc/Ind Train Town 2,500 0 634 White Lake Vistas 324 0 235 Silver Hills 1,650 0 742 Silver Star Ranch 1,600 0 449 Evans Ranch 5,679 62 1,832 Stead Airport 0 1,700 Prado Ranch 529 Multi-Family, 195 Acres 176 318 (NVIG 4) Industrial,5 Ac Commercial Prado Ranch North 490 0 112 NVIG 6 & 7 2,522 0 792 NVIG 8 238 0 109 Arroyo Crossing 236 0 74 Echeverria Peavine 1,900 0 750 North Valley Estates 252 0 66 33.83 Unit 1-3 Silver Dollar Estates 605 0 85 60.45 Lakes at Lemmon V. 1.53 Industrial Buildings 10.04 Vista Enclave 75 0 28 28.19 TOTAL 8,019 134.04 1313

North Valleys: Developments (March 2020) Stonegate (1) – Phase 1A Tentative Map Approved. Special Assessment District approval expected June. Waterline to start October 2020. Silver Hills (4) – Received final Approval. Anticipate to break ground Summer 2021. Evans Ranch (7) & Silver Star Ranch (6). Assisting owners to obtain a waterline easement through the Stead Airport Phs 1 Property (8). Prado Ranch North Phase 1 (16) Tentative Map Approved by Washoe County Commission. Prado (15) has not advertised for re-hearing. Phs 1 Echeverria (19) North Valley Estates (20) Anchor Pointe (22) (Silver Dollar Estates) Stonefield (Green Near 20) Vista Enclave (Purple near 22) 1414

Vidler Assets in Southern Nevada – Lincoln County-Vidler Teaming Agreement 1 4 2 3 5 7 6 1. Garden Valley 2. Coal Valley 8 3. Pahroc Valley 4. Dry Lake Valley 5. Clover Valley 6. Tule Desert 7. Kane Springs Valley 8. Mesquite Valley 1515
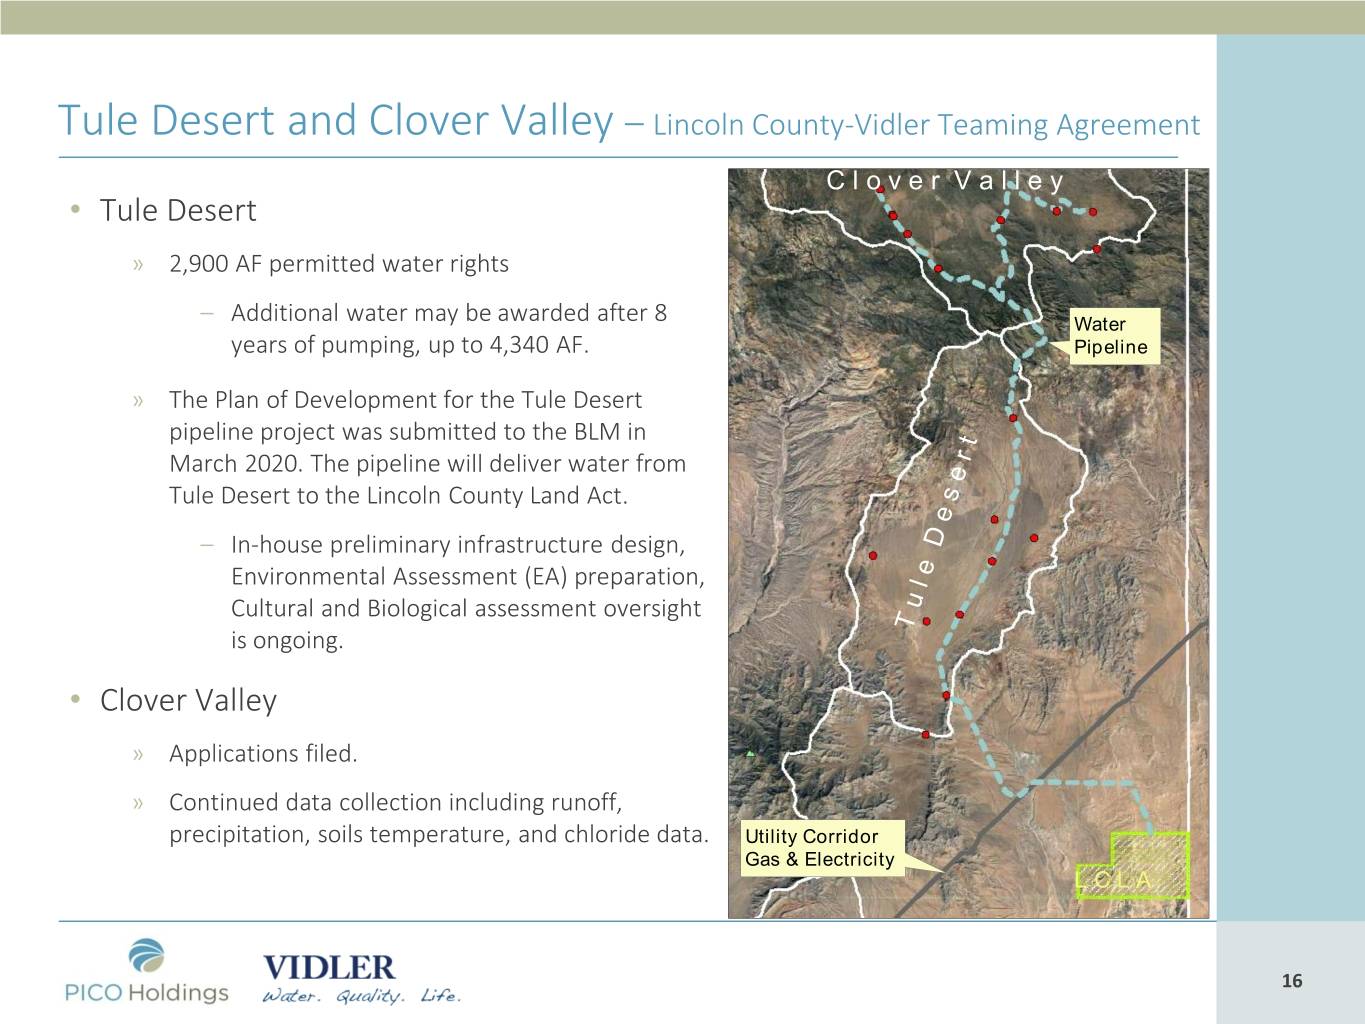
Tule Desert and Clover Valley – Lincoln County-Vidler Teaming Agreement C l o v e r V a l l e y • Tule Desert » 2,900 AF permitted water rights – Additional water may be awarded after 8 Water years of pumping, up to 4,340 AF. Pipeline » The Plan of Development for the Tule Desert pipeline project was submitted to the BLM in March 2020. The pipeline will deliver water from Tule Desert to the Lincoln County Land Act. – In-house preliminary infrastructure design, Environmental Assessment (EA) preparation, Cultural and Biological assessment oversight is ongoing. • Clover Valley » Applications filed. » Continued data collection including runoff, precipitation, soils temperature, and chloride data. Utility Corridor Gas & Electricity L C L A 1616

Kane Springs Valley – Lincoln County-Vidler Teaming Agreement • Kane Springs Valley » 500 AF permitted water rights, Vidler option with Coyote Springs. » Additional applications filed. » The Nevada State Engineer is currently evaluating whether to include the Kane Springs Valley groundwater basin within the greater Lower White River Flow System “super-basin.” 1717

Dry Lake Valley – Lincoln County-Vidler Teaming Agreement • Dry Lake Valley » 1,009 AF certificated agricultural water rights. » 600 acre parcel located within BLM-designated solar energy development zone. 1818

Garden Valley, Coal Valley & Pahroc Valley – Lincoln County-Vidler Teaming Agreement • Garden Valley » Applications filed • Coal Valley » Applications filed • Pahroc Valley » Applications filed • Continued Data Collection in Garden & Coal Valleys » including runoff, precipitation, soils temperature, and chloride data 1919

Mesquite Valley Groundwater Basin (Sandy Valley Water Rights) • Permitted March 26, 2020. • Amount of Appropriation – 30 AF Annually. • Price - $10,000 per AF. • Water for a Marijuana Cultivation Facility location in Clark County southwest of Las Vegas. • Lease Option of $700 per AF for up to 3 years with one-half lease payment applicable to purchase price. 2020

Vidler Assets in Arizona: Long-Term Storage Credits Utah Colorado Location LTSC (AF) Nevada Harquahala INA 250,682.53 Phoenix AMA 28,296.69 California Harquahala INA New Mexico Phoenix AMA Pinal AMA 2121

Phoenix Active Management Area LTSCs » Sold 25,000 AF of Phoenix AMA LTSCs to the City of El Mirage in December 2019 for a price of $347.50 per credit. » Remaining Phoenix AMA inventory is approximately 28,297 LTSCs of which 450 are under Contract – Apache Sun Golf: 450 LTSC pricing $350.64 to $375.18 per credit, contract terminates on September 30th, 2021. 2222

Harquahala Recharge Site, La Paz County, Arizona Our Recharge site which contains 250,683 LTSCs is located in La Paz County and is in a recently designated federal Opportunity Zone at the juncture of I-10 and high- capacity electric, fiber, natural gas and water infrastructure. Land Use application submitted to CAP to wheel LTSCs in the future. Stored water will travel via CAP canal to end users. Opportunity Zone Hatching 2323

Current Arizona Water Issues • Increased water demand fueled by growth, especially within the Phoenix and Pinal Active Management Areas (AMA). • The Pinal AMA is a largely agricultural area located between the Phoenix and Tucson metropolitan areas. • The Pinal AMA is facing intense water shortages due to the increased growth from new residential, commercial, and industrial users, with – “…insufficient groundwater in the Pinal AMA to support all existing users and issued assured water supply determinations.” (Arizona Department of Water Resources). • Needs for existing and increasing housing supply and infrastructure cannot be met unless new water sources can be found to sustain this new development. • Our banked water in Harquahala Valley can be used as a new water supply to satisfy a portion of this need. 2424

Vidler Assets in New Mexico Santa Fe • Lower Rio Grande Campbell Ranch »Agricultural Water: 1,214.78 AF Albuquerque »6 AF under contract at $5,700 per AF • Middle Rio Grande »Municipal Water: 84.95 AF »72.494 AF under contract: –62.494 AF at $25,750 per AF –10.00 AF at $25,000 per AF • Campbell Ranch (Application) »New Mexico Second Judicial District Court denied the Application S-2615 for 350 AF of groundwater rights. »We have filed an appeal with the Court of Appeals of the State of New Mexico. Las Cruces 2525 25
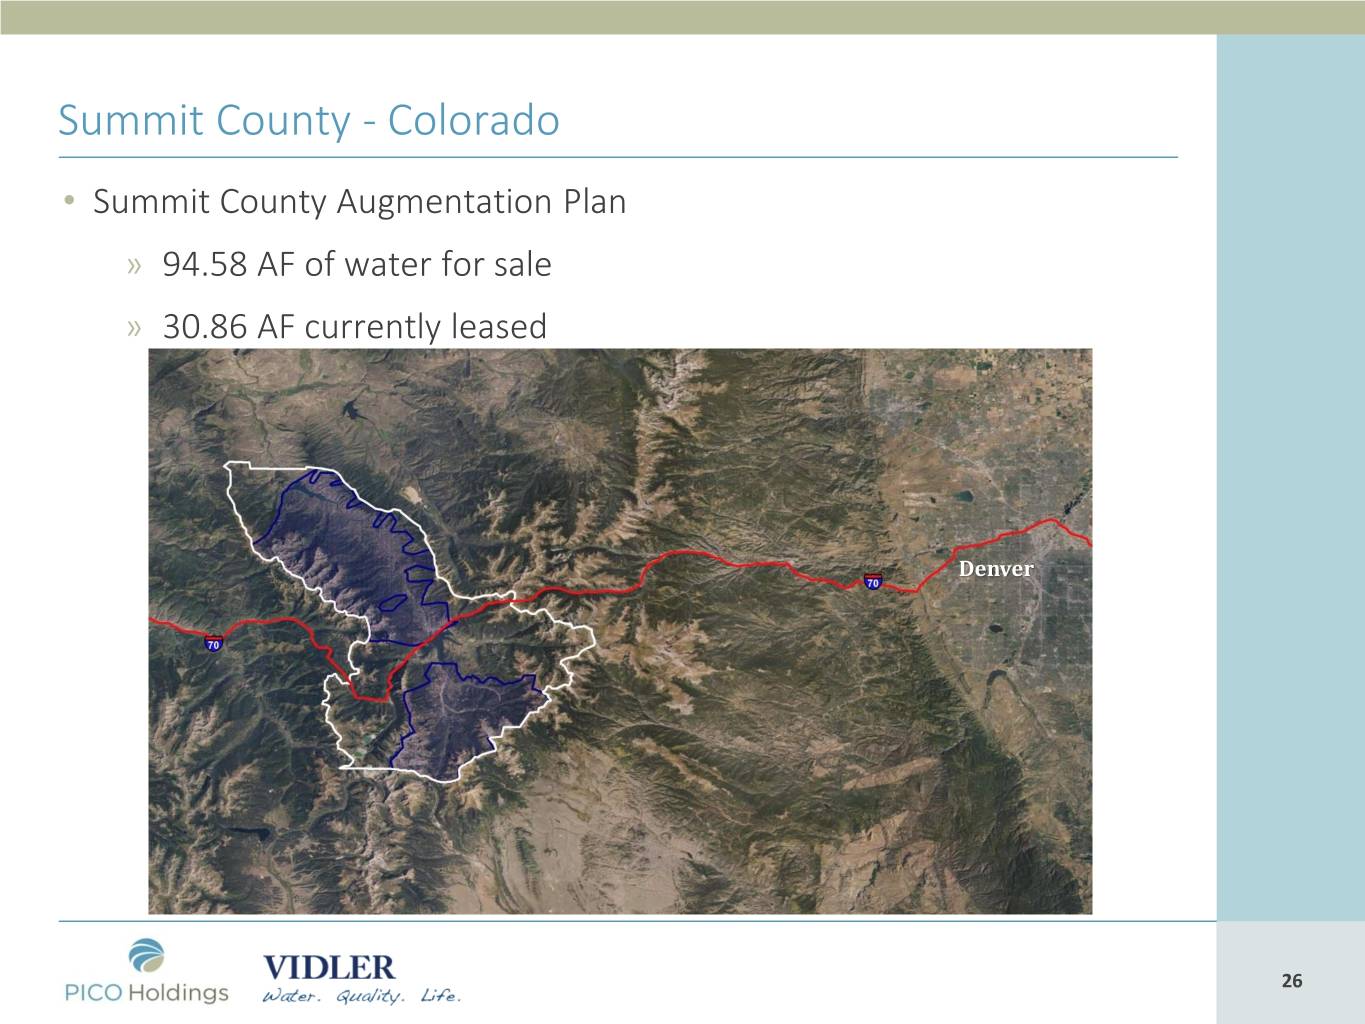
Summit County - Colorado • Summit County Augmentation Plan » 94.58 AF of water for sale » 30.86 AF currently leased Denver 2626

Return on Invested Capital • Our focus as we execute our business plan is to maximize our return on invested capital. • Our overall return on invested capital is dependent on the margin and turnover of asset monetizations, control over our net annual cash expenditures and our leverage. • We are unleveraged and not dependent on access to credit markets. Customers know we are a strong and reliable counterparty and that our water assets are "free and clear" for sale. 2727

Incentives to Maximize Return on Invested Capital • We are incentivized and aligned with our shareholders to maximize asset gross margins, asset turnover, reduce net costs and allocate capital to highest return generating alternative: » Board and management equity ownership is over 11%. » Management equity grant now 50% of any annual bonus earned. » Adjustment factor reduces management bonus in year in which capital not allocated in a form of a return of asset sale proceeds to shareholders. » Bonus calculation includes a cumulative annual time value of money charge on invested capital. » Bonus calculation includes all annual costs charged against margin generated on invested capital. 2828

Return of Capital to Shareholders to Date • Special Dividend (tax-free return of capital) of $5 per share in 2017 (approximately $115.9 million). • Open market repurchases of stock: approximately 3.95 million shares repurchased through May 22, 2020 for total cost of $42.8 million. • Any significant additional monetization proceeds may be returned to shareholders through tender offer, and/or open market repurchases, and/or special dividends depending on facts and circumstances existing at the time of monetization. 2929

Annual Net Cash Expenditures • Our current estimate of annual net cash expenditures, that is net annual cash flows from operating income less all operating costs - before any asset monetizations and associated costs, and capital allocation - is approximately $5.5 million. • Our gross operating costs comprise three elements: » costs directly related to a specific asset or project (20% of total); » overhead costs (60% of total); and » public company costs (20% of total). • We aim to reduce our annual net cash expenditures further by increasing annual recurring cash inflows such as potential solar lease revenue from FSR and potential water lease income from TMWA, as well as continually reviewing our operating cost base. 3030

Current Liquidity • Our current cash position is $13.7 million with minimal liabilities and no federal taxes payable on taxable income generated in 2019 due to our federal NOLs carried forward. • Deferred payment for acquisition of Carson Lyon, NV water rights until 2021. • Evaluating / deferring project costs where possible. • Continual monitoring of share repurchase program and cash flow outlook: Balancing working capital needs with current favorable conditions to repurchase shares on the open market. • Portfolio consists of a wide range of water resource assets; to date we have completed frequent monetizations to a varied pool of buyers and users. 3131

Q. & A. 3232
Data Appendix • Reno & Northern Nevada housing demand and population growth • Arizona water needs and population growth 3333

Regional Residential Development Potential North Valleys: 25,761 Units in Active Projects: 3,118 Approved Units: 3,041 Pending, Not Approved: 19,602 SS/Sparks: 18,683 Units in Active Projects: 3,639 Approved Units: 6,632 West Reno: 3,042 Pending, Not Approved: 9,412 Units in Active Projects: 906 Approved Units: 225 Pending, Not Approved: 1,911 Fernley: 6,143 Units in Active Projects: 618 Approved Units: 5,052 Pending, Not Approved: 473 Balance of Reno: 10,133 Units in Active Projects: 3,114 Approved Units: 2,016 Pending, Not Approved: 5,003 South Reno: 13,871 Units in Active Projects: 3,910 Approved Units: 2,186 Pending, Not Approved: 7,775 Dayton Corridor: 19,496 Units in Active Projects: 886 Approved Units: 6,161 Pending, Not Approved: 12,449 Source: American Community Survey, US Census Bureau RENO-SPARKS HOUSING OUTLOOK – JANUARY 2020, with Q1 2020 Updates 3434

EPIC Report Update: Northern Nevada Study Area EPIC Study Area Actual Population Tracking: Dec-14 to Feb-20 (EPIC Forecast Period: 2019-2023) Dec 2014 Feb 2020 # Change % Change Actual 598,639 649,590 50,951 8.5% EPIC (Original & New) 598,639 651,313 52,675 8.8% Note: Light pink area denotes “New EPIC” forecast period. Sources: EPIC Committee, RCG Economics, NV State Demographer, TMRPA, Woods & Poole, TMWA, EMSI, BLS, Census. 3535

EPIC Report Update: Northern Nevada Study Area EPIC Study Area Actual Employment Tracking: Dec-14 to Mar-20 (EPIC Forecast Period: 2019-2023) Dec 2014 Mar 2020 # Change % Change Actual 353,140 424,009 70,869 20.1% EPIC (Original & New) 353,140 427,777 74,637 21.1% Note: Light pink area denotes “New EPIC” forecast period. Sources: EPIC Committee, RCG Economics, NV State Demographer, TMRPA, Woods & Poole, TMWA, EMSI, BLS, Census. 3636

EPIC Report Update: Northern Nevada Study Area EPIC Study Area Actual Households Tracking: Dec-14 to Feb-20 (EPIC Forecast Period: 2019-2023) Dec 2014 Feb 2020 # Change % Change Actual 237,040 263,081 26,041 11.0% EPIC (Original & New) 237,040 264,074 27,034 11.4% Note: Light pink area denotes “New EPIC” forecast period. Sources: EPIC Committee, RCG Economics, NV State Demographer, TMRPA, Woods & Poole, TMWA, EMSI, BLS, Census. 3737

Sources: Washoe County Assessor and Department of Employment, Training, & Rehabilitation (CES data) 3838

RENO-SPARKS BY THE NUMBERS 5,100: job added to the area in 2019 0.38: new single-family homes built for every new job 0.97: new residential unit built for every new job (includes MF) $1,194: average rent for a one-bedroom unit (Q1 2020) Median sales prices of single-family homes (Q1 2020) $390,000: for an existing home in the Greater Reno-Sparks Area $460,000: for a new home in the Greater Reno-Sparks Area $330,000: for an existing home in North Valleys $377,000: for a new home in North Valleys 3939

RENO-SPARKS HOUSING OUTLOOK (Update) – MAY 2020 4040

Existing Single-Family Median Home Values RENO-SPARKS HOUSING OUTLOOK (Update) – MAY 2020 4141

Reno-Sparks Apartment Vacancies and Rents Source: Johnson-Perkins-Griffin Apartment Survey Apartment Units Under Construction = 3,762 Apartment Units Approved = 8,329 Estimated Household Income to Afford $1,324 = $52,644 Source: Johnson Perkins Griffin Apartment Survey (Excludes affordable, senior, and student housing and apartments with less than 80 units) RENO-SPARKS HOUSING OUTLOOK (Update) – MAY 2020 4242

Arizona Water Needs 4343

Arizona Population Growth • Our text 4444

Arizona Population Growth • Our text 4545

Arizona Population Growth • Our text 4646

Arizona Population Growth • Our text 4747

Arizona Population Growth • Our text 4848
