Attached files
Exhibit 99.2

|
Investment Letter
1st Quarter 2020 | |
| Goldman Sachs Middle Market Lending Corp. | ||
Dear Investor,
Please find enclosed the quarterly investment letter for the quarter ended March 31, 2020 for Goldman Sachs Middle Market Lending Corp. (the “Fund” or “MMLC”). This letter provides an overview of the Fund, including investment activity and portfolio characteristics as of March 31, 2020.
FUND SUMMARY AS OF MARCH 31, 2020
| Key Fund Statistics |
Total Portfolio1 |
|||||||||
| Total committed capital ($mm) |
$ | 1,034.6 |
Total investments at fair value and commitments ($mm) |
$ | 1,750.6 | |||||
| % called |
100 | % | Unfunded commitments ($mm) |
$ | 88.7 | |||||
| Funded capital commitments ($mm) |
$ | 1,034.6 | Investments at fair value ($mm) |
$ | 1,661.9 | |||||
| Net internal rate of return (IRR) (%)3 |
3.3 | % | Number of portfolio companies |
83 | ||||||
| 2020 Q1 net investment income yield (annualized %)4 |
11.9 | % | ||||||||
| 2020 Q1 distribution yield (annualized %)5 |
10.1 | % | ||||||||
Overview
In these extraordinary times, all of us at Goldman Sachs would like to send our best wishes for the health and safety of our investors and your loved ones. We also want to send our deepest thanks to all of the frontline and essential workers around the world, including doctors, nurses, paramedics and hospital staff and all the police, fire and sanitation workers, supermarket and pharmacy employees and many others whose work every day allows the rest of us to stay safely at home. We are extremely grateful to these workers and their inspiring example of courage and dedication.
We also want our investors to know that the entire Goldman Sachs team that manages and supports the Fund has shown extraordinary resilience and professionalism in this new environment. The team quickly absorbed the reality of this unprecedented economic environment, re-underwrote every single investment in light of this new reality, and seamlessly shifted to working at home while maintaining unwavering focus on everything we do to manage our investors’ capital. As the COVID-19 pandemic has unfolded over the last two months, we know that our investors are re-evaluating their own portfolios and we have made it a priority to communicate information about the Fund to you quickly and transparently. On April 20, we provided estimates of our first quarter operating results, including estimated net investment income and estimated net asset value. We are pleased to report that our final first quarter results that we announced on Friday May 15th are squarely within the estimated ranges that we provided. We hope that our investor communications have helped you better understand your investment in the Fund and we look forward to providing additional communications going forward.
Financial Results
The Fund generated net investment income per share of $0.52 during the quarter. This equated to annualized net investment income of 11.9% based on average net assets. During the quarter, all of our 83 portfolio companies made their expected interest payments and we had no investments on non-accrual status. We believe that these results are very solid given the economic disruption that escalated over the course of the quarter. Notwithstanding the generally solid fundamental performance of our portfolio companies during the quarter, we marked down the value of the investment portfolio primarily in recognition of wider credit spreads that we observed in comparable asset classes. This markdown resulted in a decline in net asset value per share of 8.6%.
| 1 | The discussion of the investment portfolio excludes the investment in a money market fund. Please see endnotes for additional disclosures. |
| 2 | Internal rate of return, or IRR, is a measure of the Fund’s discounted cash flows (inflows and outflows). In addition, the IRR takes into consideration the fair market valuation of each unrealized investment held plus any realized gains (losses). The net IRR is net of all fees and expenses. IRR for the quarter declined primarily due to a decline in NAV during the quarter. |
| 3 | Annualized except for certain operating expenses. |
| 4 | The distribution yield has been computed by annualizing the distribution by the Fund’s daily average members’ equity during the respective period. |
| Goldman Sachs Asset Management | 1 |
Liquidity and Capital Resources
As the impact of the pandemic came into focus in early March, companies around the world began drawing on undrawn loan commitments to shore up balance sheets. Approximately 30% of the Fund’s unfunded commitments were drawn during the quarter. The Fund had more than ample liquidity to satisfy these obligations and as of quarter end had $108.2 million of cash and cash equivalents on the balance sheet versus remaining unfunded investment commitments of $88.7 million.
Ending net debt-to-equity ratio for the three months ended March 31, 2020 was 0.80x compared to 0.76x for the three months ended December 31, 2019. We believe that this is a relatively conservative balance sheet construction. For example, the average debt to equity ratio of the publicly traded BDC sector at the end of the first quarter is well in excess of 1.0x, which is more than 20% more leverage than the Fund. The Fund’s leverage is provided by a syndicate of banks under a secured credit facility pursuant to which the Fund has pledged its investment portfolio as collateral. The credit facility is scheduled to mature in March 2022. While this provides important runway, we are focused on optimizing our capital structure for the benefit of investors as we move forward. Importantly, the Fund was in compliance with all financial covenants under its credit facility as of March 31, 2020 and continues to be in compliance through the present date.
Update on Previously Announced Merger
On December 9, 2019, we announced that the Fund had entered into a merger agreement with an affiliated publicly-traded business development company, Goldman Sachs BDC Inc., which trades on the New York Stock Exchange under the ticker “GSBD.” On prior calls and investor filings, we have described what we believe are the significant benefits of the proposed merger to investors in the Fund. While the economic environment has changed significantly since the merger was announced, most of those benefits remain as compelling today as they were when the merger was announced last December, including:
| • | Access to liquidity. The merger contemplates that shares in the Fund will be exchanged for shares of GSBD, subject to staggered lock-up periods such that 1/3rd of the shares will be released on each of 90, 180 and 270 days following the close of the transaction. While liquidity is always a valued attribute of an investment, we know that many investors are particularly focused on the liquidity profile of their investment portfolio at this time of heightened financial uncertainty. We continue to consider all options to create liquidity for our investors, but at this time we believe that the merger still presents the most direct, value maximizing path to achieving liquidity for the Fund’s investors. |
| • | Benefits of scale, including improved access to diversified financing sources that a larger, public company provides. Again, this was an important benefit of the merger even before the onset of COVID-19. However, access to diversified funding sources takes on an even greater importance in times of financial market volatility. The combination would increase the size of MMLC, and is expected to result in benefits of scale, including improved access to diversified funding sources. While standalone MMLC is a finite life company without a credit rating from a nationally recognized credit rating agency, the combined company has permanent equity capital and an investment grade credit rating. The combined company would have better access to the unsecured institutional debt market, which would improve financial flexibility by allowing the company to borrow without pledging its assets as collateral. |
| • | Distribution per share accretion. Based on GSBD’s regular quarterly distribution of $0.45 per share, the merger may result in a higher distribution yield at book value as compared to the Fund’s regular quarterly distribution of $0.43 per share. |
However, due to the volatility of GSBD’s stock price precipitated by COVID-19, as of today we would be unable to meet a closing condition in the merger agreement that requires MMLC investors to receive shares of GSBD that have a market value in excess of MMLC’s net asset value. The outside date for the merger specified in the merger agreement is December 9, 2020. We and the respective Boards for each of GSBD and MMLC continue to closely monitor financial market conditions and are maintaining dialogue regarding the transaction. We’ll be sure to provide any update to investors regarding the merger as warranted.
First Quarter Dividend Distribution
As described above, MMLC performed very well in the first quarter, and our capital position is solid. Specifically, all of our portfolio companies paid their expected interest payments in the first quarter, we were, and are, in compliance with all covenants under our secured credit facility and we had more than enough cash on hand at quarter end to satisfy all outstanding investment commitments. As a result, subsequent to quarter end, on April 30, we paid a $0.43 per share dividend to investors, consistent with our historical dividend distribution. However, in order to increase our net equity capital position which we believe is important in the current economic environment, we decided not to declare the next quarterly distribution at this time, which will likely delay the distribution for the quarter ending June 30, 2020. At present, we have no immediate alternative use for the retained cash, but we are mindful that enhanced net equity capital and liquidity will provide incremental protection from any unforeseen events. Simply put, while our decision may prove to have been conservative in hindsight, we strongly believe that retaining capital in MMLC for the short-term is the best approach to protecting long-term investor capital. We want to reiterate that we remain in compliance with all covenants under MMLC’s credit facility, and to emphasize that there has been no significant change to the outlook for the investment portfolio since the end of the first quarter. However, we strongly believe that this is a time for prudence and focus on downside protection. We expect to evaluate the timing of future dividend payments on an ongoing basis, and our current conservative approach is subject to change pending market and MMLC-specific conditions.
| Goldman Sachs Asset Management | 2 |
Outlook
Beginning in mid-March as the COVID-19 outbreak provoked widespread orders to stay at home, deal volumes for middle market financings declined precipitously. At this time, we have not observed very much rebound in activity. However, the decline in activity has not had a significant impact on the Fund since we have already called 100% of investor commitments and the Fund’s investment portfolio has already been assembled. Our investment philosophy has always been to underwrite each loan based on the assumption that an economic recession will occur while the loan is outstanding. This philosophy permeates the construction of the Fund’s portfolio, which is focused on first lien, senior secured loans to US domiciled middle market companies that we believe are less exposed to cyclical pressures. As a result, our portfolio has limited direct exposure to sectors that have been most impacted by the COVID-19 outbreak, including energy, travel, restaurants, hospitality, and retail. Instead, the largest exposures are to sectors that we expect to have more resilience, namely software, health care technology, interactive media & services, health care providers & services, and IT services.
While we believe that the Fund’s liquidity profile, comparatively conservative balance sheet construction and portfolio positioning are significant sources of value in this environment, we are keenly aware that the timing of an economic recovery is uncertain. Our team is bringing extraordinary focus to the Fund’s portfolio and working with the private equity sponsors and owners of these companies and their respective management teams to plan for an extended period of disruption. We have been encouraged by the speed and thoughtfulness that all parties have brought to this endeavor and we are pleased by the conservative assumptions that are being incorporated into future projections. Businesses are demonstrating remarkable creativity as they adapt to meet their customers’ changing needs and preferences. While much of the pandemic remains to play out, much is being done to prepare and adapt.
We thank you for the privilege of managing your capital and look forward to providing you additional updates in the weeks and months to come.
| Goldman Sachs Asset Management | 3 |
Investment Activity
During the first quarter, the Fund made new investment commitments and fundings of $107.1 million and $128.5 million, respectively, including net fundings of $31.7 million of previously unfunded commitments. New investment commitments were across four new portfolio companies and one existing portfolio companies. New investment commitments were comprised of 100% first lien debt. Sales and repayments totaled $60.8 million resulting in a net funded portfolio growth of $67.7 million.
Set forth below is a brief description of the Fund’s investment activity during the quarter:
New Investment Commitments
Governmentjobs.com (“NeoGov”) is a cloud-based human capital management software for HR departments of state and local government, universities and K-12 organizations. In February 2020, the Fund provided a $29.2 million first lien senior secured loan and $3.9 million first lien revolver to NeoGov. This loan and revolver bear interest at a rate of LIBOR plus 6.50% per year (subject to a 1.00% LIBOR floor) and mature in 2026.
Instructure Holdings (“Instructure”) provides SaaS-based applications for learning, assessment, and performance management, particularly to the higher education market. In March 2020, the Fund provided a $38.8 million first lien senior secured loan and a $3.0 million first lien revolver to Instructure. This loan and revolver bear interest at a rate of LIBOR plus 7.00% per year (subject to a 1.00% LIBOR floor) and mature in 2026.
MRI Software LLC (“MRI”) provides end-to-end real estate management software solutions to real estate owners, managers, and investors. In February 2020, the Fund provided an $11.9 million first lien senior secured loan, $2.7 million delayed draw first lien term loan, and a $1.0 million first lien revolver to MRI. These loans bear interest at a rate of LIBOR plus 5.50% per year (subject to a 1.00% LIBOR floor) and mature in 2026.
NetVoyage Corporation (“NetDocuments”) provides cloud-based document management services to law firms and corporate legal departments. In February 2020, the Fund provided a $0.9 million first lien senior secured loan to NetDocuments. This loan bears interest at a rate of LIBOR plus 7.75% per year (subject to a 1.00% LIBOR floor) and matures in 2022.
Villa Bidco Inc. (“Authority Brands”) is the parent company of seven home services franchisors including HVAC, residential cleaning, plumbing, at-home senior care, electrical, pest control services and swimming pool repair and maintenance. In March 2020, the Fund provided a $16.2 million first lien senior secured loan and $1.3 million first lien revolver to Authority Brands. These loans bear interest at a rate of LIBOR plus 5.75% per year (subject to a 1.00% LIBOR floor) and mature in 2025.
Sales and Repayments
The Center for Orthopedic and Research Excellence, Inc. (“HOPCo”) is a physician practice management company focused on orthopedic services. In February 2020, the Fund sold $3.7 million of its first lien senior secured loan.
Clarkson Eyecare, LLC (“EyeCare Partners”) is a chain of full service vision care centers providing optometry and ophthalmology care as well as retail eyewear products. In February 2020, EyeCare Partners fully repaid $18.2 million of its term loans.
DiscoverOrg, LLC (“DiscoverOrg”) is the largest IT Data sales intelligence company in the country. In February 2020, DiscoverOrg fully repaid $23.5 million of its term loan.
Gastro Health Holdco, LLC (“Gastro”) is a gastroenterology physician practice management company that provides services for the treatment of gastrointestinal disorders, nutrition and digestive health. In March 2020, the Fund sold $4.1 million of its first lien senior secured term loan.
Pathway Vet Alliance LLC (“Pathway”) is an operator of veterinary facilities offering a full range of general medical, surgical and specialty services. In March 2020, Pathway fully repaid $7.0 of its first lien senior secured loan and $2.5 million of its delayed draw term loan.
| Goldman Sachs Asset Management | 4 |
PORTFOLIO SUMMARY AS OF MARCH 31, 20201
| Invested Portfolio |
Portfolio Companies |
|||||||||
| Total investments at fair value and commitments ($mm) |
$ | 1,750.6 | Number of portfolio companies |
83 | ||||||
| Unfunded commitments ($mm) |
$ | 88.7 | Weighted average leverage (net debt/EBITDA) |
5.9x | ||||||
| Investments at fair value ($mm) |
$ | 1,661.9 | Weighted average interest coverage |
2.5x | ||||||
| Yield at amortized cost of investments (%) |
8.5 | % | Median EBITDA ($mm) |
$ | 41.0 | |||||
| Yield at fair value of investments (%) |
10.1 | % | Investments on non-accrual |
None | ||||||
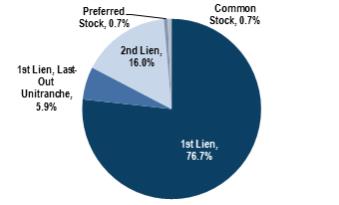
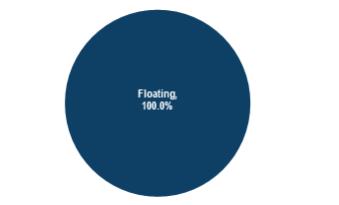
| Seniority2 | Fixed / Floating3 | |
|
|
| 1 | The discussion of the investment portfolio excludes the investment in a money market fund. Allocations as of March 31, 2020. Please see Endnotes for additional disclosures. |
| 2 | Based on fair market value of investments. |
| 3 | Based on fair market value of performing debt investments. Includes income producing preferred stock investments, if applicable. |
| Goldman Sachs Asset Management | 5 |
SUMMARY OF INVESTMENTS AS OF MARCH 31, 2020
All figures in $ millions unless noted as denominated in Euro (€) except for shares
| Portfolio Company |
Industry |
Interest |
Maturity |
Par Amount | Cost | Fair Value | ||||||||||||
| 1st Lien / Senior Secured |
||||||||||||||||||
| 3SI Security Systems, Inc.(1) |
Commercial Services & Supplies |
L + 5.75%; 1.00% Floor |
6/16/2023 | $ | 2.2 | $ | 2.2 | $ | 2.2 | |||||||||
| Accuity Delivery Systems, LLC (1) (2) |
Health Care Providers & Services |
L + 7.00%; 1.00% Floor |
6/13/2023 | 14.5 | 14.2 | 14.6 | ||||||||||||
| Acquia, Inc.(1) (2) |
Software |
L + 7.00%; 1.00% Floor |
10/31/2025 | 18.2 | 17.9 | 17.3 | ||||||||||||
| Acquia, Inc.(1) (2) (3) |
Software |
L + 7.00%; 1.00% Floor |
10/31/2025 | 1.9 | 0.0 | -0.1 | ||||||||||||
| Apptio, Inc.(1) (2) |
IT Services |
L + 7.25%; 1.00% Floor |
1/10/2025 | 46.5 | 45.7 | 45.2 | ||||||||||||
| Apptio, Inc.(1) (2) (3) |
IT Services |
L + 7.25%; 1.00% Floor |
1/10/2025 | 3.2 | -0.1 | -0.1 | ||||||||||||
| Associations, Inc.(1) (2) |
Real Estate Management & Development |
L + 7.00% (incl. 3.00% PIK); 1.00% Floor |
7/30/2024 | 19.4 | 19.3 | 18.0 | ||||||||||||
| Associations, Inc.(1) (2) (3) |
Real Estate Management & Development |
L + 7.00% (incl. 3.00% PIK); 1.00% Floor |
7/30/2024 | 4.3 | 3.0 | 2.7 | ||||||||||||
| Associations, Inc.(1) (2) |
Real Estate Management & Development |
L + 6.00%; 1.00% Floor |
7/30/2024 | 0.8 | 0.8 | 0.8 | ||||||||||||
| BJH Holdings III Corp. (dba Jack’s Family |
Hotels, Restaurants & Leisure |
L + 5.75%; 1.00% Floor |
8/19/2025 | 9.1 | 9.0 | 8.6 | ||||||||||||
| Brillio, LLC(1) (2) |
IT Services |
L + 4.75%; 1.00% Floor |
2/6/2025 | 6.6 | 6.5 | 6.2 | ||||||||||||
| Brillio, LLC(1) (2) (3) |
IT Services |
L + 4.75%; 1.00% Floor |
2/6/2025 | 2.2 | 1.1 | 1.0 | ||||||||||||
| Bullhorn, Inc.(1) (2) |
Professional Services |
L + 5.50%; 1.00% Floor |
10/1/2025 | 16.1 | 15.8 | 15.3 | ||||||||||||
| Bullhorn, Inc.(1) (2) |
Professional Services |
L + 5.50%; 1.00% Floor |
10/1/2025 | 0.8 | 0.8 | 0.8 | ||||||||||||
| Bullhorn, Inc.(1) (2) |
Professional Services |
L + 5.50%; 1.00% Floor |
10/1/2025 | 0.3 | 0.3 | 0.3 | ||||||||||||
| Bullhorn, Inc.(1) (2) (3) |
Professional Services |
L + 5.50%; 1.00% Floor |
10/1/2025 | 1.1 | 0.2 | 0.2 | ||||||||||||
| Businessolver.com, Inc.(1) (2) |
Health Care Technology |
L + 7.50%; 1.00% Floor |
5/15/2023 | 30.1 | 29.7 | 28.6 | ||||||||||||
| Businessolver.com, Inc.(1) (2) |
Health Care Technology |
L + 7.50%; 1.00% Floor |
5/15/2023 | 4.5 | 4.4 | 4.3 | ||||||||||||
| Businessolver.com, |
Health Care Technology |
L + 7.50%; 1.00% Floor |
5/15/2023 | 3.8 | 0.0 | -0.2 | ||||||||||||
| CFS Management, LLC (dba Center for Sight Management)(1) (2) |
Health Care Providers & Services |
L + 5.75%; 1.00% Floor |
7/1/2024 | 7.0 | 6.9 | 6.6 | ||||||||||||
| CFS Management, LLC (dba Center for Sight Management)(1) (2) (3) |
Health Care Providers & Services |
L + 5.75%; 1.00% Floor |
7/1/2024 | 2.1 | 0.0 | -0.1 | ||||||||||||
| Chronicle Bidco Inc. (dba Lexitas)(1) (2) |
Professional Services |
L + 5.75%; 1.00% Floor |
11/14/2025 | 10.3 | 10.1 | 9.9 | ||||||||||||
| Chronicle Bidco Inc. (dba Lexitas)(1) (2) (3) |
Professional Services |
L + 5.75%; 1.00% Floor |
11/14/2025 | 4.3 | 2.3 | 2.2 | ||||||||||||
| Chronicle Bidco Inc. (dba Lexitas)(1) (2) (3) |
Professional Services |
L + 5.75%; 1.00% Floor |
11/14/2025 | 1.3 | 0.0 | 0.0 | ||||||||||||
| Collaborative Imaging, LLC (dba Texas Radiology Associates) (1) (2) |
Health Care Providers & Services |
L + 6.50%; 1.00% Floor |
3/28/2025 | 12.7 | 12.6 | 12.3 | ||||||||||||
| Collaborative Imaging, LLC (dba Texas Radiology Associates) (1) (2) |
Health Care Providers & Services |
L + 6.50%; 1.00% Floor |
3/28/2025 | 9.7 | 9.5 | 9.4 | ||||||||||||
| ConnectWise, LLC(1) (2) |
IT Services |
L + 6.00%; 1.00% Floor |
2/28/2025 | 19.9 | 19.5 | 18.5 | ||||||||||||
| ConnectWise, LLC(1) (2) (3) |
IT Services |
L + 6.00%; 1.00% Floor |
2/28/2025 | 1.5 | 0.0 | -0.1 | ||||||||||||
| Convene 237 Park Avenue, LLC (dba Convene)(1) (2) |
Real Estate Management & Development |
L + 7.50%; 1.50% Floor |
8/30/2024 | 31.0 | 30.4 | 26.4 | ||||||||||||
| Convene 237 Park Avenue, LLC (dba Convene)(1) (2) (3) |
Real Estate Management & Development |
L + 7.50%; 1.50% Floor |
8/30/2024 | 9.1 | 4.6 | 3.4 | ||||||||||||
| CorePower Yoga LLC(2) |
Diversified Consumer Services |
L + 4.50% | 5/14/2025 | 14.8 | 14.6 | 13.3 | ||||||||||||
| CorePower Yoga LLC(2) (3) |
Diversified Consumer Services |
L + 4.50% | 5/14/2025 | 0.2 | 0.0 | 0.0 | ||||||||||||
| CorePower Yoga LLC(2) (3) |
Diversified Consumer Services |
L + 4.75% | 5/14/2025 | 1.0 | 0.0 | -0.1 | ||||||||||||
| CST Buyer Company (dba Intoxalock)(2) |
Diversified Consumer Services |
L + 5.75%; 1.00% Floor |
10/3/2025 | 18.2 | 18.0 | 15.4 | ||||||||||||
| CST Buyer Company (dba Intoxalock)(2) (3) |
Diversified Consumer Services |
L + 5.75%; 1.00% Floor |
10/3/2025 | 1.3 | 0.8 | 0.6 | ||||||||||||
| DDS USA Holding, Inc.(1) (2) |
Health Care Equipment & Supplies |
L + 4.75%; 1.00% Floor |
6/30/2022 | 5.4 | 5.4 | 5.2 | ||||||||||||
| DDS USA Holding, Inc.(1) (2) |
Health Care Equipment & Supplies |
L + 4.75%; 1.00% Floor |
6/30/2022 | 5.1 | 5.1 | 4.9 | ||||||||||||
| DDS USA Holding, Inc.(1) (2) |
Health Care Equipment & Supplies |
P + 3.75%; 1.00% Floor |
6/30/2022 | 1.5 | 1.5 | 1.5 | ||||||||||||
| Diligent Corporation(1) (2) |
Professional Services |
L + 5.50%; 1.00% Floor |
4/14/2022 | € | 22.8 | 26.1 | 24.9 | |||||||||||
| Diligent Corporation(1) (2) |
Professional Services |
L + 5.50%; 1.00% Floor |
4/14/2022 | 5.4 | 5.4 | 5.4 | ||||||||||||
| Diligent Corporation(1) (2) |
Professional Services |
L + 5.50%; 1.00% Floor |
4/14/2022 | 2.1 | 2.1 | 2.1 | ||||||||||||
Past performance does not guarantee future results, which may vary. Any reference to a specific company or security does not constitute a recommendation to buy, sell, hold or directly invest in the company or its securities. It should not be assumed that the recommendations made in the future will be profitable or will equal the performance of the securities discussed in this document. Portfolio holdings shown above are as of the date indicated and may not be representative of future investments. The holdings shown may not represent all of the portfolio’s investments. Future investments may or may not be profitable. Source: SEC filings. The economic and market forecasts presented herein are for informational purposes as of the date of this presentation. There can be no assurance that the forecasts will be achieved. Please see additional disclosures at the end of this presentation.
| Goldman Sachs Asset Management | 6 |
| Portfolio Company |
Industry |
Interest |
Maturity | Par Amount | Cost | Fair Value | ||||||||||||||
| Diligent Corporation(1) (2) (3) |
Professional Services |
L + 5.50%; 1.00% Floor |
4/14/2022 | $ | 1.8 | $ | 1.6 | $ | 1.6 | |||||||||||
| Diligent Corporation(1) (2) |
Professional Services |
L + 5.50%; 1.00% Floor |
4/14/2022 | 0.7 | 0.7 | 0.7 | ||||||||||||||
| Diligent Corporation(1) (2) |
Professional Services |
L + 5.50%; 1.00% Floor |
4/14/2022 | 0.4 | 0.3 | 0.3 | ||||||||||||||
| Diligent Corporation(1) (2) (3) |
Professional Services |
L + 5.50%; 1.00% Floor |
4/14/2022 | 6.1 | 0.0 | -0.1 | ||||||||||||||
| DocuTAP, Inc.(1) (2) |
Health Care Technology |
L + 5.50%; 1.00% Floor |
5/12/2025 | 35.0 | 34.2 | 33.5 | ||||||||||||||
| E2open, LLC(1) (2) |
Software |
L + 5.75%; 1.00% Floor |
11/26/2024 | 24.2 | 24.0 | 23.1 | ||||||||||||||
| Elemica Parent, Inc.(1) (2) |
Chemicals |
L + 5.50% | 9/18/2025 | 4.2 | 4.1 | 3.9 | ||||||||||||||
| Elemica Parent, Inc.(1) (2) (3) |
Chemicals |
L + 5.50% | 9/18/2025 | 0.6 | 0.4 | 0.4 | ||||||||||||||
| Elemica Parent, Inc.(1) (2) (3) |
Chemicals |
L + 5.50% | 9/18/2025 | 0.8 | 0.0 | -0.1 | ||||||||||||||
| Empirix, Inc.(1) (2) |
Diversified Telecommunication Services |
L + 6.25%; 1.00% Floor |
9/25/2024 | 31.4 | 31.0 | 27.6 | ||||||||||||||
| Empirix, Inc.(1) (2) |
Diversified Telecommunication Services |
L + 6.25%; 1.00% Floor |
9/25/2023 | 1.8 | 1.8 | 1.6 | ||||||||||||||
| Eptam Plastics, Ltd.(1) (2) |
Health Care Equipment & Supplies |
L + 5.50%; 1.00% Floor |
12/6/2025 | 6.4 | 6.3 | 6.1 | ||||||||||||||
| Eptam Plastics, Ltd.(1) (2) |
Health Care Equipment & Supplies |
L + 5.50%; 1.00% Floor |
12/6/2025 | 1.4 | 1.3 | 1.3 | ||||||||||||||
| Eptam Plastics, Ltd.(1) (2) (3) |
Health Care Equipment & Supplies |
L + 5.50%; 1.00% Floor |
12/6/2025 | 2.7 | 0.0 | -0.1 | ||||||||||||||
| Fenergo Finance 3 |
Diversified Financial Services |
L + 6.25%; 1.00% Floor |
9/5/2024 | € | 25.3 | 29.0 | 26.6 | |||||||||||||
| Fenergo Finance 3 |
Diversified Financial Services |
L + 6.25%; 1.00% Floor |
9/5/2024 | 1.7 | 0.0 | -0.1 | ||||||||||||||
| Fenergo Finance 3 |
Diversified Financial Services |
L + 6.25%; 1.00% Floor |
9/5/2024 | € | 2.2 | 0.0 | -0.1 | |||||||||||||
| FWR Holding Corporation (dba First Watch Restaurants) (1) |
Hotels, Restaurants & Leisure |
L + 5.50%; 1.00% Floor |
8/21/2023 | 4.0 | 4.0 | 3.8 | ||||||||||||||
| FWR Holding Corporation (dba First Watch Restaurants)(1) |
Hotels, Restaurants & Leisure |
L + 5.50%; 1.00% Floor |
8/21/2023 | 3.0 | 3.0 | 2.9 | ||||||||||||||
| FWR Holding Corporation (dba First Watch Restaurants) (1) |
Hotels, Restaurants & Leisure |
L + 5.50%; 1.00% Floor |
8/21/2023 | 3.0 | 3.0 | 2.8 | ||||||||||||||
| FWR Holding Corporation (dba First Watch Restaurants)(1) |
Hotels, Restaurants & Leisure |
L + 5.50%; 1.00% Floor |
8/21/2023 | 11.4 | 11.2 | 10.7 | ||||||||||||||
| FWR Holding Corporation (dba First Watch Restaurants)(1) |
Hotels, Restaurants & Leisure |
L + 5.50%; 1.00% Floor |
8/21/2023 | 2.3 | 2.2 | 2.1 | ||||||||||||||
| FWR Holding Corporation (dba First Watch Restaurants)(1) |
Hotels, Restaurants & Leisure |
L + 5.50%; 1.00% Floor |
8/21/2023 | 1.4 | 1.4 | 1.4 | ||||||||||||||
| FWR Holding Corporation (dba First Watch Restaurants)(1) (3) |
Hotels, Restaurants & Leisure |
L + 5.50%; 1.00% Floor |
8/21/2023 | 1.5 | 1.0 | 0.9 | ||||||||||||||
| Gastro Health Holdco, LLC(1) (2) |
Health Care Providers & Services |
L + 5.50%; 1.00% Floor |
9/4/2024 | 13.9 | 13.6 | 13.2 | ||||||||||||||
| Gastro Health Holdco, LLC(1) (2) |
Health Care Providers & Services |
L + 5.50%; 1.00% Floor |
9/4/2024 | 7.2 | 7.0 | 6.8 | ||||||||||||||
| Gastro Health Holdco, LLC(1) (2) |
Health Care Providers & Services |
L + 5.50%; 1.00% Floor |
9/4/2024 | 6.9 | 6.8 | 6.6 | ||||||||||||||
| Gastro Health Holdco, LLC(1) (2) |
Health Care Providers & Services |
L + 5.50%; 1.00% Floor |
9/4/2023 | 2.9 | 2.9 | 2.8 | ||||||||||||||
| GlobalTranz Enterprises, Inc.(2) |
Road & Rail |
L + 5.00% | 5/15/2026 | 11.4 | 11.2 | 8.1 | ||||||||||||||
| Governmentjobs.com, Inc. (dba NeoGov)(1) (2) |
Software |
L + 6.50%; 1.00% Floor |
2/5/2026 | 29.2 | 28.6 | 28.5 | ||||||||||||||
| Governmentjobs.com, Inc. (dba NeoGov)(1) (2) (3) |
Software |
L + 6.50%; 1.00% Floor |
2/5/2026 | 3.9 | -0.1 | -0.1 | ||||||||||||||
| Granicus, Inc.(2) |
Software |
L + 4.75%; 1.00% Floor |
9/7/2022 | 14.5 | 14.4 | 13.7 | ||||||||||||||
| HS4 AcquisitionCo, Inc. (dba HotSchedules & Fourth)(1) (2) |
Hotels, Restaurants & Leisure |
L + 6.75%; 1.00% Floor |
7/9/2025 | 34.5 | 34.0 | 31.1 | ||||||||||||||
| HS4 AcquisitionCo, Inc. (dba HotSchedules & |
Hotels, Restaurants & Leisure |
L + 6.75%; 1.00% Floor |
7/9/2025 | 2.8 | 1.6 | 1.3 | ||||||||||||||
| Hygiena Borrower LLC |
Life Sciences Tools & Services |
L + 4.00%; 1.00% Floor |
8/26/2022 | 5.3 | 5.3 | 5.0 | ||||||||||||||
| Hygiena Borrower LLC(3) |
Life Sciences Tools & Services |
L + 4.00%; 1.00% Floor |
8/26/2022 | 0.6 | 0.0 | 0.0 | ||||||||||||||
| Hygiena Borrower LLC(3) |
Life Sciences Tools & Services |
L + 4.00%; 1.00% Floor |
8/26/2022 | 0.8 | 0.0 | 0.0 | ||||||||||||||
| iCIMS, Inc.(1) (2) |
Software |
L + 6.50%; 1.00% Floor |
9/12/2024 | 42.6 | 41.9 | 40.6 | ||||||||||||||
| iCIMS, Inc.(1) (2) |
Software |
L + 6.50%; 1.00% Floor |
9/12/2024 | 7.8 | 7.7 | 7.5 | ||||||||||||||
| iCIMS, Inc.(1) (2) (3) |
Software |
L + 6.50%; 1.00% Floor |
9/12/2024 | $ | 2.7 | ($ | 0.0 | ) | ($ | 0.1 | ) | |||||||||
| Instructure Holdings(2) |
Diversified Consumer Services |
L + 7.00%; 1.00% Floor |
3/24/2026 | 38.8 | 38.3 | 38.3 | ||||||||||||||
| Instructure Holdings(2) (3) |
Diversified Consumer Services |
L + 7.00%; 1.00% Floor |
3/24/2026 | 3.0 | 0.0 | 0.0 | ||||||||||||||
| Integral Ad Science, Inc.(1) (2) |
Interactive Media & Services |
L + 7.25% (incl. 1.25% PIK); 1.00% Floor |
7/19/2024 | 36.7 | 36.1 | 35.3 | ||||||||||||||
| Integral Ad Science, Inc.(1) (2) (3) |
Interactive Media & Services |
L + 6.00%; 1.00% Floor |
7/19/2023 | 2.6 | 0.0 | -0.1 | ||||||||||||||
| Internet Truckstop Group, LLC (dba Truckstop)(1) (2) |
Transportation Infrastructure |
L + 5.50%; 1.00% Floor |
4/2/2025 | 32.3 | 31.6 | 31.0 | ||||||||||||||
Past performance does not guarantee future results, which may vary. Any reference to a specific company or security does not constitute a recommendation to buy, sell, hold or directly invest in the company or its securities. It should not be assumed that the recommendations made in the future will be profitable or will equal the performance of the securities discussed in this document. Portfolio holdings shown above are as of the date indicated and may not be representative of future investments. The holdings shown may not represent all of the portfolio’s investments. Future investments may or may not be profitable. Source: SEC filings. The economic and market forecasts presented herein are for informational purposes as of the date of this presentation. There can be no assurance that the forecasts will be achieved. Please see additional disclosures at the end of this presentation.
| Goldman Sachs Asset Management | 7 |
| Portfolio Company |
Industry |
Interest |
Maturity | Par Amount | Cost | Fair Value | ||||||||||||||
| Internet Truckstop Group, LLC (dba Truckstop)(1) (2) (3) |
Transportation Infrastructure | L + 5.50%; 1.00% Floor | 4/2/2025 | $ | 2.6 | $ | -0.1 | $ | -0.1 | |||||||||||
| Lithium Technologies, Inc.(1) (2) |
Interactive Media & Services | L + 8.00%; 1.00% Floor | 10/3/2022 | 50.0 | 49.3 | 47.4 | ||||||||||||||
| Lithium Technologies, Inc.(1) (2) (3) |
Interactive Media & Services | L + 8.00%; 1.00% Floor | 10/3/2022 | 3.4 | 0.0 | -0.2 | ||||||||||||||
| Mailgun Technologies, Inc.(1) (2) |
Interactive Media & Services | L + 6.00%; 1.00% Floor | 3/26/2025 | 23.1 | 22.7 | 22.0 | ||||||||||||||
| Mailgun Technologies, Inc.(1) (2) (3) |
Interactive Media & Services | L + 6.00%; 1.00% Floor | 3/26/2025 | 1.4 | 0.0 | -0.1 | ||||||||||||||
| Midwest Transport, Inc.(1) (2) |
Road & Rail | L + 7.00%; 1.00% Floor | 10/2/2023 | 16.7 | 16.6 | 16.4 | ||||||||||||||
| MMIT Holdings, LLC (dba Managed Markets Insight & Technology)(1) (2) |
Health Care Technology | L + 5.50%; 1.00% Floor | 11/15/2024 | 29.7 | 29.2 | 28.6 | ||||||||||||||
| MMIT Holdings, LLC (dba Managed Markets Insight & |
Health Care Technology | L + 5.50%; 1.00% Floor | 11/15/2024 | 4.5 | 3.7 | 3.6 | ||||||||||||||
| MRI Software LLC |
Real Estate Management & Development | L + 5.50%; 1.00% Floor | 2/10/2026 | 12.5 | 12.4 | 10.9 | ||||||||||||||
| MRI Software LLC(3) |
Real Estate Management & Development | L + 5.50%; 1.00% Floor | 2/10/2026 | 1.0 | 0.5 | 0.4 | ||||||||||||||
| MRI Software LLC(3) |
Real Estate Management & Development | L + 5.50%; 1.00% Floor | 2/10/2026 | 2.2 | 0.0 | -0.3 | ||||||||||||||
| Netvoyage Corporation (dba NetDocuments)(1) (2) |
Software | L + 7.75%; 1.00% Floor | 3/22/2024 | 7.9 | 7.8 | 7.5 | ||||||||||||||
| Netvoyage Corporation (dba NetDocuments)(1) (2) |
Software | L + 7.75%; 1.00% Floor | 3/22/2024 | 6.0 | 5.9 | 5.7 | ||||||||||||||
| Netvoyage Corporation (dba NetDocuments)(1) (2) |
Software | L + 7.75%; 1.00% Floor | 3/24/2022 | 0.9 | 0.9 | 0.8 | ||||||||||||||
| Netvoyage Corporation (dba NetDocuments)(1) (2) (3) |
Software | L + 7.75%; 1.00% Floor | 3/24/2022 | 0.6 | 0.0 | 0.0 | ||||||||||||||
| Picture Head Midco LLC(1) (2) |
Entertainment | L + 6.75%; 1.00% Floor | 8/31/2023 | 27.5 | 27.0 | 24.9 | ||||||||||||||
| PlanSource Holdings, Inc.(1) (2) |
Health Care Technology | L + 6.25%; 1.00% Floor | 4/22/2025 | 33.9 | 33.3 | 32.1 | ||||||||||||||
| PlanSource Holdings, Inc.(1) (2) (3) |
Health Care Technology | L + 6.25%; 1.00% Floor | 4/22/2025 | 4.7 | -0.1 | -0.3 | ||||||||||||||
| Power Stop, LLC(2) |
Auto Components | L + 4.50% | 10/19/2025 | 10.8 | 10.7 | 9.7 | ||||||||||||||
| Premier Imaging, LLC (dba Lucid Health)(1) (2) |
Health Care Providers & Services | L + 5.50%; 1.00% Floor | 1/2/2025 | 17.2 | 17.0 | 16.3 | ||||||||||||||
| PT Intermediate Holdings III, LLC (dba Parts Town)(2) |
Trading Companies & Distributors | L + 5.50%; 1.00% Floor | 10/15/2025 | 17.3 | 17.2 | 14.2 | ||||||||||||||
| Riverpoint Medical, LLC(1) (2) |
Health Care Equipment & Supplies | L + 4.75%; 1.00% Floor | 6/21/2025 | 13.4 | 13.3 | 12.4 | ||||||||||||||
| Riverpoint Medical, LLC(1) (2) (3) |
Health Care Equipment & Supplies | L + 4.75%; 1.00% Floor | 6/21/2025 | 2.5 | 1.2 | 1.0 | ||||||||||||||
| Selectquote, Inc.(2) |
Insurance | L + 6.00%; 1.00% Floor | 11/5/2024 | 15.8 | 15.5 | 14.2 | ||||||||||||||
| SF Home Décor, LLC (dba SureFit Home Décor)(1) (2) |
Household Products | L + 9.75%; 1.00% Floor | 7/13/2022 | 23.8 | 23.3 | 21.9 | ||||||||||||||
| Shopatron, LLC (dba Kibo)(1) (2) |
Internet & Direct Marketing Retail | L + 8.00%; 1.00% Floor | 12/18/2020 | 8.9 | 8.8 | 8.7 | ||||||||||||||
| Shopatron, LLC (dba Kibo)(1) (2) (5) |
Internet & Direct Marketing Retail | L + 8.00%; 1.00% Floor | 12/18/2020 | 2.8 | 2.7 | 2.7 | ||||||||||||||
| SPay, Inc. (dba Stack Sports)(1) (2) |
Interactive Media & Services | L + 5.75%; 1.00% Floor | 6/17/2024 | 14.7 | 14.5 | 13.2 | ||||||||||||||
| SPay, Inc. (dba Stack Sports)(1) (2) (3) |
Interactive Media & Services | L + 5.75%; 1.00% Floor | 6/17/2024 | 1.6 | 1.1 | 0.9 | ||||||||||||||
| SPay, Inc. (dba Stack Sports)(1) (2) |
Interactive Media & Services | L + 5.75%; 1.00% Floor | 6/17/2024 | 0.5 | 0.5 | 0.5 | ||||||||||||||
| The Center for Orthopedic and Research Excellence, Inc. (dba HOPCo)(1) (2) |
Health Care Providers & Services | L + 5.25%; 1.00% Floor | 8/15/2025 | 15.9 | 15.7 | 15.1 | ||||||||||||||
| The Center for Orthopedic and Research Excellence, Inc. (dba HOPCo)(1) (2) |
Health Care Providers & Services | L + 5.25%; 1.00% Floor | 8/15/2025 | 2.7 | 2.7 | 2.6 | ||||||||||||||
| Viant Medical Holdings, Inc.(1) (2) |
Health Care Equipment & Supplies | L + 6.25%; 1.00% Floor | 7/2/2025 | 19.1 | 18.8 | 16.7 | ||||||||||||||
| Villa Bidco Inc (dba Authority Brands)(2) |
Diversified Consumer Services | L + 5.75%; 1.00% Floor | 3/21/2025 | 16.2 | 15.8 | 15.8 | ||||||||||||||
| Villa Bidco Inc (dba Authority Brands)(2) (3) |
Diversified Consumer Services | L + 5.75%; 1.00% Floor | 3/21/2025 | $ | 1.3 | $ | 0.3 | $ | 0.3 | |||||||||||
| VRC Companies, LLC (dba Vital Records Control) |
Commercial Services & Supplies | L + 6.50%; 1.00% Floor | 3/31/2023 | 10.0 | 9.9 | 9.8 | ||||||||||||||
| VRC Companies, LLC (dba Vital Records Control) |
Commercial Services & Supplies | L + 6.50%; 1.00% Floor | 3/31/2022 | 0.2 | 0.2 | 0.2 | ||||||||||||||
| WebPT, Inc.(1) (2) |
Health Care Technology | L + 6.75%; 1.00% Floor | 8/28/2024 | 14.9 | 14.7 | 13.7 | ||||||||||||||
| WebPT, Inc.(1) (2) |
Health Care Technology | L + 6.75%; 1.00% Floor | 8/28/2024 | 1.6 | 1.5 | 1.4 | ||||||||||||||
| WebPT, Inc.(1) (2) (3) |
Health Care Technology | L + 6.75%; 1.00% Floor | 8/28/2024 | 1.9 | 0.0 | -0.2 | ||||||||||||||
| Wine.com, LLC(1) (2) |
Beverages | L + 7.00%; 1.00% Floor | 11/14/2024 | 9.0 | 8.9 | 8.6 | ||||||||||||||
Past performance does not guarantee future results, which may vary. Any reference to a specific company or security does not constitute a recommendation to buy, sell, hold or directly invest in the company or its securities. It should not be assumed that the recommendations made in the future will be profitable or will equal the performance of the securities discussed in this document. Portfolio holdings shown above are as of the date indicated and may not be representative of future investments. The holdings shown may not represent all of the portfolio’s investments. Future investments may or may not be profitable. Source: SEC filings. The economic and market forecasts presented herein are for informational purposes as of the date of this presentation. There can be no assurance that the forecasts will be achieved. Please see additional disclosures at the end of this presentation.
| Goldman Sachs Asset Management | 8 |
| Portfolio Company |
Industry |
Interest |
Maturity | Par Amount | Cost | Fair Value | ||||||||||||||
| Wolfpack IP Co. (dba Lone Wolf Technologies)(1) (2) (4) |
Real Estate Management & Development | L + 6.50%; 1.00% Floor | 6/13/2025 | $ | 47.2 | $ | 46.4 | $ | 46.0 | |||||||||||
| Wolfpack IP Co. (dba Lone Wolf |
Real Estate Management & Development | L + 6.50%; 1.00% Floor | 6/13/2025 | 4.7 | -0.1 | -0.1 | ||||||||||||||
| WorkForce Software, |
Software | L + 6.50%; 1.00% Floor | 7/31/2025 | 12.7 | 12.5 | 11.9 | ||||||||||||||
| WorkForce Software, |
Software | L + 6.50%; 1.00% Floor | 7/31/2025 | 1.1 | 0.0 | -0.1 | ||||||||||||||
| Wrike, Inc.(1) (2) |
Professional Services | L + 6.75%; 1.00% Floor | 12/31/2024 | 32.3 | 31.7 | 31.3 | ||||||||||||||
| Wrike, Inc.(1) (2) (3) |
Professional Services | L + 6.75%; 1.00% Floor | 12/31/2024 | 2.3 | 0.0 | -0.1 | ||||||||||||||
| Xactly Corporation(1) (2) |
IT Services | L + 7.25%; 1.00% Floor | 7/29/2022 | 34.9 | 34.5 | 33.6 | ||||||||||||||
| Xactly Corporation(1) (2) (3) |
IT Services | L + 7.25%; 1.00% Floor | 7/29/2022 | 2.2 | 0.0 | -0.1 | ||||||||||||||
| Yasso, Inc.(1) (2) |
Food Products | L + 7.75%; 1.00% Floor | 3/23/2022 | 7.4 | 7.3 | 7.1 | ||||||||||||||
|
|
|
|
|
|||||||||||||||||
| Total 1st Lien/Senior Secured |
$ | 1,342.5 | $ | 1,275.9 | ||||||||||||||||
| Portfolio Company |
Industry |
Interest |
Maturity | Par Amount | Cost | Fair Value | ||||||||||||||
| 1st Lien, Last-Out Unitranche4 |
||||||||||||||||||||
| Doxim, Inc. |
Diversified Financial Services | L + 6.00%; 1.00% Floor | 2/28/2024 | $ | 27.3 | $ | 26.7 | $ | 25.5 | |||||||||||
| Doxim, Inc. |
Diversified Financial Services | L + 6.00%; 1.00% Floor | 2/28/2024 | 22.4 | 21.9 | 20.9 | ||||||||||||||
| RugsUSA, LLC |
Household Products | L + 6.50%; 1.00% Floor | 4/30/2023 | 8.3 | 8.3 | 8.0 | ||||||||||||||
| Smarsh, Inc. |
Interactive Media & Services | L + 7.88%; 1.00% Floor | 3/31/2021 | 44.3 | 44.0 | 43.0 | ||||||||||||||
|
|
|
|
|
|||||||||||||||||
| Total 1st Lien, Last-Out Unitranche |
$ | 100.9 | $ | 97.5 | ||||||||||||||||
| 2nd Lien/Senior Secured |
||||||||||||||||||||
| American Dental Partners, Inc.(1) (2) |
Health Care Providers & Services | L + 8.50%; 1.00% Floor | 9/25/2023 | $ | 5.3 | $ | 5.3 | $ | 4.8 | |||||||||||
| Chase Industries, Inc. (dba Senneca Holdings)(1) (2) |
Building Products | L + 9.50% (incl. 1.50% PIK); 1.00% Floor | 5/11/2026 | 24.3 | 23.7 | 20.7 | ||||||||||||||
| DiscoverOrg, LLC(2) |
Software | L + 8.50% | 2/1/2027 | 14.6 | 14.4 | 13.1 | ||||||||||||||
| ERC Finance, LLC (dba Eating Recovery |
Health Care Providers & Services | L + 8.22%; 1.00% Floor | 9/22/2025 | 25.4 | 25.0 | 24.1 | ||||||||||||||
| Genesis Acquisition Co. (dba ProCare Software)(1) (2) |
Diversified Financial Services | L + 7.50% | 7/31/2025 | 10.0 | 9.8 | 9.0 | ||||||||||||||
| Genesis Acquisition Co. (dba ProCare Software)(1) (2) (3) |
Diversified Financial Services | L + 7.50% | 7/31/2025 | 2.5 | 0.0 | -0.3 | ||||||||||||||
| Hygiena Borrower LLC(1) |
Life Sciences Tools & Services | L + 7.75%; 1.00% Floor | 8/26/2023 | 2.7 | 2.6 | 2.4 | ||||||||||||||
| Hygiena Borrower LLC(1) (3) |
Life Sciences Tools & Services | L + 7.75%; 1.00% Floor | 8/26/2023 | 1.0 | 0.1 | 0.1 | ||||||||||||||
| ICP Industrial, Inc.(1) (2) |
Chemicals | L + 8.25%; 1.00% Floor | 5/3/2024 | 28.9 | 28.4 | 27.2 | ||||||||||||||
| Intelligent Medical Objects, Inc.(1) (2) |
Health Care Technology | L + 8.50%; 1.00% Floor | 12/22/2024 | 21.9 | 21.5 | 20.6 | ||||||||||||||
| Market Track, LLC(1) (2) |
Media | L + 7.75%; 1.00% Floor | 6/5/2025 | 20.0 | 19.6 | 18.7 | ||||||||||||||
| National Spine and Pain Centers, LLC(1) (2) |
Health Care Providers & Services | L + 8.25%; 1.00% Floor | 12/2/2024 | 17.4 | 17.0 | 15.4 | ||||||||||||||
| Odyssey Logistics & Technology Corporation(2) |
Road & Rail | L + 8.00%; 1.00% Floor | 10/12/2025 | 26.6 | 26.2 | 18.5 | ||||||||||||||
| SMB Shipping Logistics, LLC (dba Worldwide Express)(1) (2) |
Air Freight & Logistics | L + 8.00%; 1.00% Floor | 2/3/2025 | 25.0 | 24.7 | 22.4 | ||||||||||||||
| Spectrum Plastics Group, |
Containers & Packaging | L + 7.00% | 1/31/2026 | 6.3 | 6.3 | 4.1 | ||||||||||||||
| USRP Holdings, Inc. (dba U.S.
Retirement |
Insurance | L + 8.75%; 1.00% Floor | 9/29/2025 | 9.7 | 9.6 | 8.7 | ||||||||||||||
| USRP Holdings, Inc. (dba U.S.
Retirement |
Insurance | L + 8.75%; 1.00% Floor | 9/29/2025 | 1.6 | 1.6 | 1.4 | ||||||||||||||
| Xcellence, Inc. (dba Xact Data Discovery)(1) (2) |
IT Services | L + 8.75%; 1.00% Floor | 6/22/2024 | 26.1 | 25.6 | 23.6 | ||||||||||||||
| YI, LLC (dba Young Innovations)(1) (2) |
Health Care Equipment & Supplies | L + 7.75%; 1.00% Floor | 11/7/2025 | 21.6 | 21.1 | 18.7 | ||||||||||||||
| Zep Inc.(2) |
Chemicals | L + 8.25%; 1.00% Floor | 8/11/2025 | 30.5 | 29.9 | 12.2 | ||||||||||||||
|
|
|
|
|
|||||||||||||||||
| Total 2nd Lien/Senior Secured |
$ | 312.2 | $ | 265.4 | ||||||||||||||||
| Total Corporate Debt |
$ | 1,755.5 | $ | 1,638.8 | ||||||||||||||||
| Portfolio Company |
Shares | Cost | Fair Value | |||||||||||||||||
| Preferred Stock |
||||||||||||||||||||
| Accuity Delivery Systems, LLC |
Health Care Providers & Services | 136,589 | $ | 4.5 | $ | 8.1 | ||||||||||||||
| Wine.com, LLC |
Beverages | 314,154 | 2.7 | 2.8 | ||||||||||||||||
|
|
|
|
|
|||||||||||||||||
| Total Preferred Stock |
$ | 7.2 | $ | 10.9 | ||||||||||||||||
Past performance does not guarantee future results, which may vary. Any reference to a specific company or security does not constitute a recommendation to buy, sell, hold or directly invest in the company or its securities. It should not be assumed that the recommendations made in the future will be profitable or will equal the performance of the securities discussed in this document. Portfolio holdings shown above are as of the date indicated and may not be representative of future investments. The holdings shown may not represent all of the portfolio’s investments. Future investments may or may not be profitable. Source: SEC filings. The economic and market forecasts presented herein are for informational purposes as of the date of this presentation. There can be no assurance that the forecasts will be achieved. Please see additional disclosures at the end of this presentation.
| Goldman Sachs Asset Management | 9 |
| Portfolio Company |
Shares | Cost | Fair Value | |||||||||||||||
| Common Stock |
||||||||||||||||||
| Collaborative Imaging Holdco, LLC (dba Texas Radiology Associates) - Class B (1) (2) (8) |
Health Care Providers & Services | 11,719 | $ | 1.6 | $ | 2.0 | ||||||||||||
| Collaborative Imaging Holdco, LLC (dba Texas Radiology Associates) - Performance |
Health Care Providers & Services | 11,060 | 0.2 | 0.4 | ||||||||||||||
| Country Fresh Holding Company Inc.(1) (2) (7) (8) |
Food Products | 843 | 1.1 | 0.3 | ||||||||||||||
| Elah Holdings, Inc. (1) (2) (7) (8) |
Capital Markets | 65,436 | 3.2 | 3.2 | ||||||||||||||
| National Spine and Pain Centers, LLC(1) (2) (7) (8) |
Health Care Providers & Services | 500 | 0.5 | 0.1 | ||||||||||||||
| Wrike, Inc.(1) (2) (7) (8) |
Professional Services | 4,949,520 | 3.1 | 5.9 | ||||||||||||||
| Yasso, Inc.(1) (2) (7) (8) |
Food Products | 790 | 0.8 | 0.4 | ||||||||||||||
|
|
|
|
|
|||||||||||||||
| Total Common Stock |
$ | 10.4 | $ | 12.3 | ||||||||||||||
|
|
|
|
|
|||||||||||||||
| TOTAL INVESTMENTS |
$ | 1,773.09 | $ | 1,661.92 | ||||||||||||||
|
|
|
|
|
|||||||||||||||
| 1 | The fair value of the investment was determined using significant unobservable inputs. |
| 2 | Represent co-investments made with certain funds managed by the Investment Adviser in accordance with the terms of the exemptive relief that the Company received from the U.S. Securities and Exchange Commission. |
| 3 | Position or portion thereof is an unfunded loan commitment, and no interest is being earned on the unfunded portion. The unfunded loan commitment may be subject to a commitment termination date that may expire prior to the maturity date stated. The negative cost, if applicable, is the result of capitalized discount being greater than the principal amount outstanding on the loan. The negative fair value, if applicable, is the result of the capitalized discount on the loan. |
| 4 | The investment is not a qualifying asset under Section 55(a) of the Investment Company Act of 1940. The Company may not acquire any non-qualifying asset unless, at the time of acquisition, qualifying assets represent at least 70% of the Company’s total assets. As of March 31, 2020 the aggregate fair value of these securities is $72,698 or 4.06% of the Company’s total assets. |
| 5 | The investment includes an exit fee that is receivable upon repayment of the loan. See Note 2 “Significant Accounting Policies”. |
| 6 | In exchange for the greater risk of loss, the “last-out” portion of the Company’s unitranche loan investment generally earns a higher interest rate than the “first-out” portions. The “first-out” portion of the loan would generally receive priority with respect to payment of principal, interest and any other amounts due thereunder over the “last-out” portion that the Company would continue to hold. |
| 7 | Non-income producing security. |
| 8 | Securities exempt from registration under the Securities Act of 1933 (the “Securities Act”), and may be deemed to be “restricted securities” under the Securities Act. As of March 31, 2020, the aggregate fair value of these securities is $23,127 or 2.52% of the Company’s net assets. |
Endnotes
Total investments and commitments shown at fair value.
Commitments are generally subject to borrowers meeting certain criteria such as compliance with covenants and certain operational metrics. These amounts may remain outstanding until the commitment period of an applicable loan expires, which may be shorter than the loan’s maturity date.
Yield at cost/fair value: Computed based on the (a) annual actual interest rate or yield earned plus amortization of fees and discounts on the performing debt and other income producing investments as of the reporting date, divided by (b) the total investments (including investments on non-accrual and non-incoming producing investments) at amortized cost or fair value, respectively. Equivalent to Weighted Average Yield for the total portfolio in the section “Portfolio and Investment Activity” in Item 7 of the Fund’s report on Form 10-Q for the quarter ended March 31, 2020.
For a particular portfolio company, we calculate the level of contractual indebtedness net of cash (“net debt”) owed by the portfolio company and compare that amount to measures of cash flow available to service the net debt. To calculate net debt, we include debt that is both senior and pari passu to the tranche of debt owned by us but exclude debt that is legally and contractually subordinated in ranking to the debt owned by us. We believe this calculation method assists in describing the risk of our portfolio investments, as it takes into consideration contractual rights of repayment of the tranche of debt owned by us relative to other senior and junior creditors of a portfolio company. We typically calculate cash flow available for debt service at a portfolio company by taking net income before net interest expense, income tax expense, depreciation and amortization (“EBITDA”) for the trailing twelve month period. Weighted average net debt to EBITDA is weighted based on the fair value of our debt investments, excluding investments where net debt to EBITDA may not be the appropriate measure of credit risk, such as cash collateralized loans and investments that are underwritten and covenanted based on recurring revenue. For a particular portfolio company, we also calculate the level of contractual interest expense owed by the portfolio company, and compare that amount to EBITDA (“interest coverage ratio”). We believe this calculation method assists in describing the risk of our portfolio investments, as it takes into consideration contractual interest obligations of the portfolio company. Weighted average interest coverage is weighted based on the fair value of our performing debt investments, excluding investments where interest coverage may not be the appropriate measure of credit risk, such as cash collateralized loans and investments that are underwritten and covenanted based on recurring revenue. Median EBITDA is based on our debt investments, excluding investments where net debt to EBITDA may not be the appropriate measure of credit risk, such as cash collateralized loans and investments that are underwritten and covenanted based on recurring revenue. Portfolio company statistics are derived from the most recently available financial statements of each portfolio company as of the reported end date. Statistics of the portfolio companies have not been independently verified by us and may reflect a normalized or adjusted amount. As of March 31, 2020, investments where net debt to EBITDA may not be the appropriate measure of credit risk represented 33.8% of total debt investments at fair value. Portfolio company statistics are derived from the most recently available financial statements of each portfolio company as of the respective reported end date. Portfolio company statistics have not been independently verified by us and may reflect a normalized or adjusted amount.
Valuation levels for the assets listed in the Fund statements and other documents containing prices reflect GSAM’s good faith effort to ascertain fair market levels (including accrued income, if any) for all positions. The valuation information is believed by GSAM to be reliable for round lot sizes. The prices are indicative only of the assumed fair value of the positions on the relevant date. These valuation levels may not be realized by the Fund upon liquidation. Market conditions and transaction size will affect liquidity and price received upon liquidation. Current exchange rates will be applied in valuing positions in foreign currency.
Risks and General Disclosures
This material is provided at your request for informational purposes only. It is not an offer or solicitation to buy or sell any securities.
This material is provided for informational purposes only and should not be construed as investment advice or an offer or solicitation to buy or sell securities. This material is not intended to be used as a general guide to investing, or as a source of any specific investment recommendations, and makes no implied or express recommendations concerning the manner in which any client’s account should or would be handled, as appropriate investment strategies depend upon the client’s investment objectives.
| Goldman Sachs Asset Management | 10 |
THIS MATERIAL DOES NOT CONSTITUTE AN OFFER OR SOLICITATION IN ANY JURISDICTION WHERE OR TO ANY PERSON TO WHOM IT WOULD BE UNAUTHORIZED OR UNLAWFUL TO DO SO.
Prospective investors should inform themselves as to any applicable legal requirements and taxation and exchange control regulations in the countries of their citizenship, residence or domicile which might be relevant.
Forward-Looking Statements
This investor letter may contain forward-looking statements that involve substantial risks and uncertainties, including the impact of COVID-19 on the business, future operating results, access to capital and liquidity of the Fund and its portfolio companies. You can identify these statements by the use of forward-looking terminology such as “may,” “will,” “should,” “expect,” “anticipate,” “project,” “target,” “estimate,” “intend,” “continue,” or “believe” or the negatives thereof or other variations thereon or comparable terminology. You should read statements that contain these words carefully because they discuss our plans, strategies, prospects and expectations concerning the Fund’s business, operating results, financial condition and other similar matters. These statements represent the Fund’s belief regarding future events that, by their nature, are uncertain and outside of the Fund’s control. There are likely to be events in the future, however, that the Fund is not able to predict accurately or control. Any forward-looking statement made by the Fund in this investor letter speaks only as of the date on which we make it. Factors or events that could cause our actual results to differ, possibly materially from our expectations, include, but are not limited to, the ability of GSBD and MMLC to consummate the proposed merger (the “Merger”) on the expected timeline, or at all, failure of GSBD or MMLC to obtain the requisite stockholder approval for the Proposals (as defined below) as set forth in the Proxy Statement (as defined below), the ability to realize the anticipated benefits of the Merger, effects of disruption on the business of GSBD and MMLC from the Merger, the effect that the announcement or consummation of the Merger may have on the trading price of GSBD’s common stock on the New York Stock Exchange, the combined company’s plans, expectations, objectives and intentions as a result of the Merger, any decision by MMLC to pursue continued operations, any termination of the Merger Agreement, future operating results of GSBD or MMLC, the business prospects of GSBD and MMLC and the prospects of their portfolio companies, actual and potential conflicts of interests with GSAM and other affiliates of Goldman Sachs, general economic and political trends and other factors, the dependence of GSBD’s and MMLC’s future success on the general economy and its effect on the industries in which they invest; and future changes in laws or regulations and interpretations thereof, and the risks, uncertainties and other factors we identify in the sections entitled “Risk Factors” and “Cautionary Statement Regarding Forward-Looking Statements” in filings MMLC and GSBD make with the Securities and Exchange Commission (the “SEC”), including those risk factors relating to COVID-19 included in the Fund’s Quarterly Report on Form 10-Q filed with the SEC on May 15, 2020 and those contained in the Proxy Statement, when such document becomes available, and it is not possible for us to predict or identify all of them. We undertake no obligation to update or revise publicly any forward-looking statements, whether as a result of new information, future events or otherwise, except as required by law.
Additional Information and Where to Find It
This communication relates to a proposed business combination involving GSBD and MMLC, along with related proposals for which stockholder approval will be sought (collectively, the “Proposals”). In connection with the Proposals, GSBD and MMLC have filed relevant materials with the SEC, including a registration statement on Form N-14, filed with the SEC on January 8, 2020, which includes a joint proxy statement of GSBD and MMLC and a prospectus of GSBD (the “Proxy Statement”). This communication does not constitute an offer to sell or the solicitation of an offer to buy any securities or a solicitation of any vote or approval. No offer of securities shall be made except by means of a prospectus meeting the requirements of Section 10 of the Securities Act. STOCKHOLDERS OF EACH OF GSBD AND MMLC ARE URGED TO READ ALL RELEVANT DOCUMENTS FILED WITH THE SEC, INCLUDING THE PROXY STATEMENT WHEN IT BECOMES AVAILABLE, AS WELL AS ANY AMENDMENTS OR SUPPLEMENTS THERETO, BECAUSE THEY WILL CONTAIN IMPORTANT INFORMATION ABOUT GSBD, MMLC, THE MERGER AND THE PROPOSALS. Investors and security holders will be able to obtain the documents filed with the SEC free of charge at the SEC’s web site, http://www.sec.gov or, for documents filed by GSBD, from GSBD’s website at http://www.GoldmanSachsBDC.com.
Participants in the Solicitation
GSBD and MMLC and their respective directors, executive officers and certain other members of management and employees of GSAM and its affiliates, may be deemed to be participants in the solicitation of proxies from the stockholders of GSBD and MMLC in connection with the Proposals. Information about the directors and executive officers of GSBD is set forth in its Annual Report on Form 10-K for the year ended December 31, 2019, which was filed with the SEC on February 20, 2020 and its definitive proxy statement for its 2020 annual meeting of stockholders, which was filed with the SEC on May 12, 2020. Information about the directors and executive officers of MMLC is set forth in its Annual Report on Form 10-K for the year ended December 31, 2019, which was filed with the SEC on February 27, 2020 and the Proxy Statement. Information regarding the persons who may, under the rules of the SEC, be considered participants in the solicitation of the GSBD and MMLC stockholders in connection with the Proposals will be contained in the Proxy Statement when such document becomes available. This document may be obtained free of charge from the sources indicated above.
The material provided herein is for informational purposes only. It does not constitute an offer to sell or a solicitation of an offer to buy any securities relating to any of the products referenced herein, notwithstanding that any such securities may be currently being offered to others. Any such offering will be made only in accordance with the terms and conditions set forth in the offering documents pertaining to such Fund. Prior to investing, investors are strongly urged to review carefully all of the offering documents.
No person has been authorized to give any information or to make any representation, warranty, statement or assurance not contained in the offering documents.
This material contains information that pertains to past performance or is the basis for previously-made discretionary investment decisions. This information should not be construed as a current recommendation, research or investment advice. It should not be assumed that any investment decisions shown will prove to be profitable, or that any investment decisions made in the future will be profitable or will equal the performance of investments discussed herein. Any mention of an investment decision is intended only to illustrate our investment approach and/or strategy, and is not indicative of the performance of our strategy as a whole. Any such illustration is not necessarily representative of other investment decisions.
This material has been prepared by GSAM and is not financial research nor a product of Goldman Sachs Global Investment Research (GIR). It was not prepared in compliance with applicable provisions of law designed to promote the independence of financial analysis and is not subject to a prohibition on trading following the distribution of financial research. The views and opinions expressed may differ from those of Goldman Sachs Global Investment Research or other departments or divisions of Goldman Sachs and its affiliates. This information may not be current and GSAM has no obligation to provide any updates or changes. It should not be relied upon in making an investment decision.
Portfolio holdings and/or allocations shown herein are as of the date indicated and may not be representative of future investments. The holdings and/or allocations shown may not represent all of the portfolio’s investments. Future investments may or may not be profitable.
A Goldman Sachs affiliate has claimed relief from CFTC regulation as a “commodity pool operator” (“CPO”) under the Commodity Exchange Act (“CEA”) for the Fund pursuant to a CFTC staff no-action letter with respect to the Fund’s operations, which means that the Fund will be limited in its ability to use futures contracts or options on futures contracts or engage in swap transactions.
Views and opinions expressed are for informational purposes only and do not constitute a recommendation by GSAM to buy, sell, or hold any security. Views and opinions are current as of the date of this presentation and may be subject to change, they should not be construed as investment advice.
All or a portion of the Fund’s distributions may be treated for tax purposes as a return of capital, however, the final characterization of such distributions will be reported annually on Form 1099-DIV. The final tax status of the distributions may differ substantially from the above dividend information.
Economic and market forecasts presented herein reflect a series of assumptions and judgments as of the date of this presentation and are subject to change without notice. These forecasts do not take into account the specific investment objectives, restrictions, tax and financial situation or other needs of any specific client. Actual data will vary and may not be reflected here. These forecasts are subject to high levels of uncertainty that may affect actual performance. Accordingly, these forecasts should be viewed as merely representative of a broad range of possible outcomes. These forecasts are estimated, based on assumptions, and are subject to significant revision and may change materially as economic and market conditions change. Goldman Sachs has no obligation to provide updates or changes to these forecasts. Case studies and examples are for illustrative purposes only.
| Goldman Sachs Asset Management | 11 |
Supplemental Risk Disclosure for All Potential Direct and Indirect Investors in Hedge Funds and other private investment funds (collectively, “Alternative Investments”)
In connection with your consideration of an investment in any Alternative Investment, you should be aware of the following risks:
Alternative Investments are not subject to the same regulatory requirements or governmental oversight as mutual funds. The sponsor or manager of any Alternative Investment may not be registered with any governmental agency.
Alternative Investments often engage in leverage and other investment practices that are extremely speculative and involve a high degree of risk. Such practices may increase the volatility of performance and the risk of investment loss, including the loss of the entire amount that is invested.
Alternative Investments may purchase instruments that are traded on exchanges located outside the United States that are “principal markets” and are subject to the risk that the counterparty will not perform with respect to contracts. Furthermore, since there is generally less government supervision and regulation of foreign exchanges, Alternative Investments are also subject to the risk of the failure of the exchanges and there may be a higher risk of financial irregularities and/or lack of appropriate risk monitoring and controls.
Past performance is not a guide to future performance and the value of Alternative Investments and the income derived from them can go down as well as up. Future returns are not guaranteed and a loss of principal may occur.
Alternative Investments may impose significant fees, including incentive fees that are based upon a percentage of the realized and unrealized gains, and such fees may offset all or a significant portion of such Alternative Investment’s trading profits.
Alternative Investments are offered in reliance upon an exemption from registration under the Securities Act of 1933, as amended, for offers and sales of securities that do not involve a public offering. No public or other market is available or will develop. Similarly, interests in an Alternative Investment are highly illiquid and generally are not transferable without the consent of the sponsor, and applicable securities and tax laws will limit transfers.
Alternative Investments may themselves invest in instruments that may be highly illiquid and extremely difficult to value. This also may limit your ability to redeem or transfer your investment or delay receipt of redemption proceeds.
Alternative Investments are not required to provide their investors with periodic pricing or valuation information.
There may be conflicts of interest between the Alternative Investment and other service providers, including the investment manager and sponsor of the Alternative Investment.
Investors in Alternative Investments may have limited rights with respect to their investment interest, including limited voting rights and participation in the management of the Alternative Investment.
Alternative Investments may involve complex tax and legal structures. Investment in any particular Alternative Investment or Alternative Investments generally, is only suitable for sophisticated investors for whom such an investment does not constitute a complete investment program and who fully understand and are willing to assume the risks involved in such Alternative Investment. You are urged to consult with your own tax, accounting and legal advisers regarding any investment in any Alternative Investment.
Investors are also urged to take appropriate advice regarding any applicable legal requirements and any applicable taxation and exchange control regulations in the country of their citizenship, residence or domicile which may be relevant to the subscription, purchase, holding, exchange, redemption or disposal of any Alternative Investment.
Supplemental Risk Disclosure
In connection with your consideration of this presentation, you should be aware of the following risks:
BDCs are highly regulated investment vehicles. If regulations or the regulatory regime applicable to the Fund, its investment adviser and/or its affiliates were to change, it could have a negative impact on the Fund and its investors. Additionally, to the extent that there are changes to the current tax treatment for offshore and/or onshore investors, this could potentially have a negative impact on returns.
The Fund expects to pay significant fees, including incentive fees that are based upon performance (including realized and gains), and such fees may offset all or a significant portion of the Fund’s profits.
The Fund will be subject to limitations on the types of investments it can make. The Fund may invest in instruments that may be highly illiquid and extremely difficult to value. Investors will be exposed to significant market, credit and liquidity risks. The Fund may make loans with a high degree of credit risk and engage in leverage and other investment practices that are extremely speculative and involve a high degree of risk. Such practices may increase the volatility of performance and the risk of investment loss, including the loss of the entire amount that is invested.
BDCs may involve complex tax and legal structures and accordingly are only suitable for sophisticated investors. You are urged to consult with your own tax, accounting and legal advisers regarding any investment in the Fund.
Conflicts of Interest
There may be conflicts of interest relating to the Alternative Investment and its service providers, including Goldman Sachs and its affiliates. These activities and interests include potential multiple advisory, transactional and other interests in securities and instruments that may be purchased or sold by the Alternative Investment. These are considerations of which investors should be aware and additional information relating to these conflicts is set forth in the offering materials for the Alternative Investment.
Jurisdictional Disclosures
Hong Kong
This material has not been delivered for registration to the Registrar of Companies in Hong Kong nor has its content been reviewed by any regulatory authority in Hong Kong. Accordingly, unless permitted by the securities laws of Hong Kong, (i) no person may issue or cause to be issued this material in Hong Kong, other than to persons who are “professional investors” within the meaning of the Securities and Futures Ordinance (Cap. 571 of the Laws of Hong Kong) and any rules made thereunder or in circumstances which do not constitute an offer or sale of shares in the fund(s) mentioned to the public in Hong Kong for the purposes of the prospectus requirements of the Companies Ordinance (Cap. 32 of the Laws of Hong Kong); and (ii) no person may issue or have in its possession for the purposes of issue, this material, or any advertisement, invitation or document relating to the shares in the fund(s) mentioned, whether in Hong Kong or elsewhere, which is directed at, or the contents of which are likely to be accessed by, the public in Hong Kong, other than with respect to the shares in the fund(s) mentioned which are intended to be disposed of only to persons outside Hong Kong or only to “professional investors” within the meaning of the Securities and Futures Ordinance (Cap. 571 of the Laws of Hong Kong) and any rules made thereunder.
British Virgin Islands
The Fund is not registered or recognised in the British Virgin Islands and as such Shares in the Fund may not be offered to individuals in the British Virgin Islands. However, Shares may be offered to British Virgin Islands Business Companies and/or persons who are not members of the public from outside the British Virgin Islands. A British Virgin Islands Business Company is a company formed under or otherwise governed by the British Virgin Islands Business Companies Act, 2004 (British Virgin Islands).
Cayman Islands
The fund does not intend to establish a place of business or otherwise intend to conduct business in the Cayman Islands. Accordingly, the fund should not be subject to the supervision of any Cayman Islands authority.
| Goldman Sachs Asset Management | 12 |
Colombia
This document does not constitute a public offer in the Republic of Colombia. The offer of the Fund is addressed to less than one hundred specifically identified investors. The Fund may not be promoted or marketed in Colombia or to Colombia residents, unless such promotion and marketing is made in compliance with Decree 2555 of 2010 and other applicable rules and regulations related to the promotion of foreign funds in Colombia.
The distribution of this material and the offering of Shares may be restricted in certain jurisdictions. The information contained in this material is for general guidance only, and it is the responsibility of any person or persons in possession of this material and wishing to make application for Shares to inform themselves of, and to observe, all applicable laws and regulations of any relevant jurisdiction. Prospective applicants for Shares should inform themselves of any applicable legal requirements, exchange control regulations and applicable taxes in the countries of their respective citizenship, residence or domicile.
This material is for the client’s sole and exclusive use and cannot be understood as being addressed to, or be used by, any third party , including but not limited to those third parties for which the addressee can legally or contractually represent. The securities have not been and will not be offered in the Republic of Colombia (“Colombia”) through a public offering pursuant to Colombian laws and regulations and will not be registered in the Colombian National Registry of Securities and Issuers or on the Colombian Stock Exchange. The client acknowledges that the Colombian laws and regulations (specifically foreign exchange and tax regulations) are applicable to any transaction or investment made in connection with the Securities and that the client is the sole party liable for full compliance with any such laws and regulations. The investment in the securities is a permitted investment for the client under its corporate bylaws and/or particular applicable investment regime. Please contact your sales representative for further information about the securities and applicable selling restrictions.
© 2020 Goldman Sachs. All rights reserved. Compliance Code: 204578-OTU-1199209
Date of First Use: May 20, 2020.
| Goldman Sachs Asset Management | 13 |