Attached files
| file | filename |
|---|---|
| EX-99.1 - EX-99.1 - Williams Industrial Services Group Inc. | tmb-20200513xex99d1.htm |
| 8-K - 8-K - Williams Industrial Services Group Inc. | tmb-20200513x8k.htm |
Exhibit 99.2
| Q1 2020 Financial Results May 14, 2020 Tracy Pagliara President & CEO OTCQX: WLMS Randy Lay SVP & Chief Financial Officer |

| 2 2 Forward-looking Statement Disclaimer This presentation contains “forward-looking statements” within the meaning of the term set forth in the Private Securities Litigation Reform Act of 1995. The forward-looking statements include statements or expectations regarding the Company’s ability to realize opportunities and successfully achieve its growth and strategic initiatives, the Company’s strategy to generate cash and strengthen its capital structure, the Company’s ability to uplist to a major exchange in 2020, the impact of the COVID-19 pandemic on the Company’s business, operations, and financial condition, the Company’s ability to control costs, future demand for the Company’s services, the Company’s ability to diversity its business, offset the impact of the expected Vogtle project completion, manage expenses, reduce working capital, and improve returns for shareholders, the Company’s performance, work in the nuclear, industrial, oil and gas, markets, expectations for future growth of revenue, profitability and earnings, including the Company’s ability to grow its core business, expand its customer base, increase backlog and convert backlog to revenue, as well as revenue, profitability and earnings, the Company’s ability to expand in the energy deliver, fossil fuel and renewable energy markets, and other related matters. These statements reflect the Company’s current views of future events and financial performance and are subject to a number of risks and uncertainties, some of which have been, and may further be, exacerbated by the COVID-19 pandemic, including its ability to comply with the terms of its debt instruments and access letters of credit, ability to implement strategic initiatives, business plans, and liquidity plans, and ability to maintain effective internal control over financial reporting and disclosure controls and procedures. Actual results, performance or achievements may differ materially from those expressed or implied in the forward-looking statements. Additional risks and uncertainties that could cause or contribute to such material differences include, but are not limited to, reduced need for construction or maintenance services in the Company’s targeted markets, or increased regulation of such markets, loss of any of the Company’s major customers, whether pursuant to the loss of pending or future bids for either new business or an extension of existing business, termination of customer or vendor relationships, cost increases and project cost overruns, unforeseen schedule delays, poor performance by its subcontractors, cancellation of projects, the impact of the COVID-19 pandemic on the Company generally or on any of the Company’s customers or vendors upon which it relies, including, among other things, changes in capital spending by the Company’s customers and the significant adverse impacts on economic and market conditions of the COVID-19 pandemic and the Company’s ability to respond to the challenges and business disruption presented by the COVID-19 pandemic, the recent disruption of the global energy market and resulting low fuel prices, competition, including competitors being awarded business by current customers, damage to the Company’s reputation, warranty or product liability claims, increased exposure to environmental or other liabilities, failure to comply with various laws and regulations, failure to attract and retain highly-qualified personnel, loss of customer relationships with critical personnel, volatility of the Company’s stock price, deterioration or uncertainty of credit markets, and changes in the economic, social and political conditions in the United States, including the banking environment or monetary policy. Other important factors that may cause actual results to differ materially from those expressed in the forward-looking statements are discussed in the Company’s filings with the U.S. Securities and Exchange Commission, including the section of the Annual Report on Form 10-K for its 2019 fiscal year titled “Risk Factors” and in subsequent filings. Any forward-looking statement speaks only as of the date of this presentation. Except as may be required by applicable law, the Company undertakes no obligation to publicly update or revise any forward-looking statements, whether as a result of new information, future events or otherwise, and you are cautioned not to rely upon them unduly. Non-GAAP Financial Measures This presentation will discuss some non-GAAP financial measures, which the Company believes are useful in evaluating its performance. You should not consider the presentation of this additional information in isolation or as a substitute for results prepared in accordance with GAAP. The Company has provided reconciliations of comparable GAAP to non-GAAP measures in tables found on the slides following the “Supplemental Information” slide of this presentation. Cautionary Notes Note: Unless otherwise noted, all discussion is based upon continuing operations. |
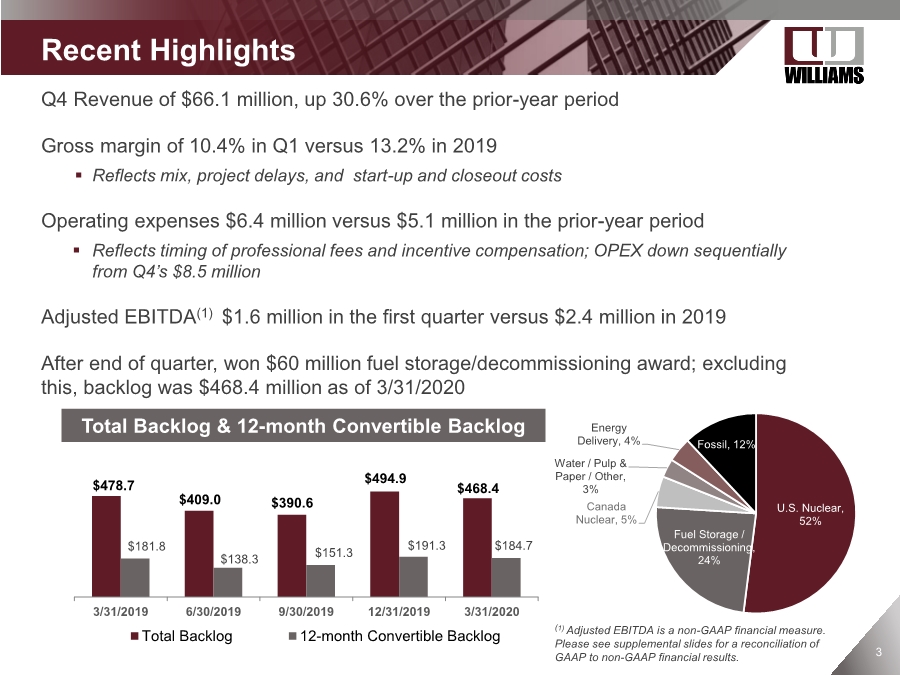
| 3 Q4 Revenue of $66.1 million, up 30.6% over the prior-year period Gross margin of 10.4% in Q1 versus 13.2% in 2019 . Reflects mix, project delays, and start-up and closeout costs Operating expenses $6.4 million versus $5.1 million in the prior-year period . Reflects timing of professional fees and incentive compensation; OPEX down sequentially from Q4’s $8.5 million Adjusted EBITDA(1) $1.6 million in the first quarter versus $2.4 million in 2019 After end of quarter, won $60 million fuel storage/decommissioning award; excluding this, backlog was $468.4 million as of 3/31/2020 Recent Highlights (1) Adjusted EBITDA is a non-GAAP financial measure. Please see supplemental slides for a reconciliation of GAAP to non-GAAP financial results. $478.7 $409.0 $390.6 $494.9 $468.4 $181.8 $138.3 $151.3 $191.3 $184.7 3/31/2019 6/30/2019 9/30/2019 12/31/2019 3/31/2020 Total Backlog 12-month Convertible Backlog Total Backlog & 12-month Convertible Backlog U.S. Nuclear, 52% Fuel Storage / Decommissioning, 24% Canada Nuclear, 5% Water / Pulp & Paper / Other, 3% Energy Delivery, 4% Fossil, 12% |
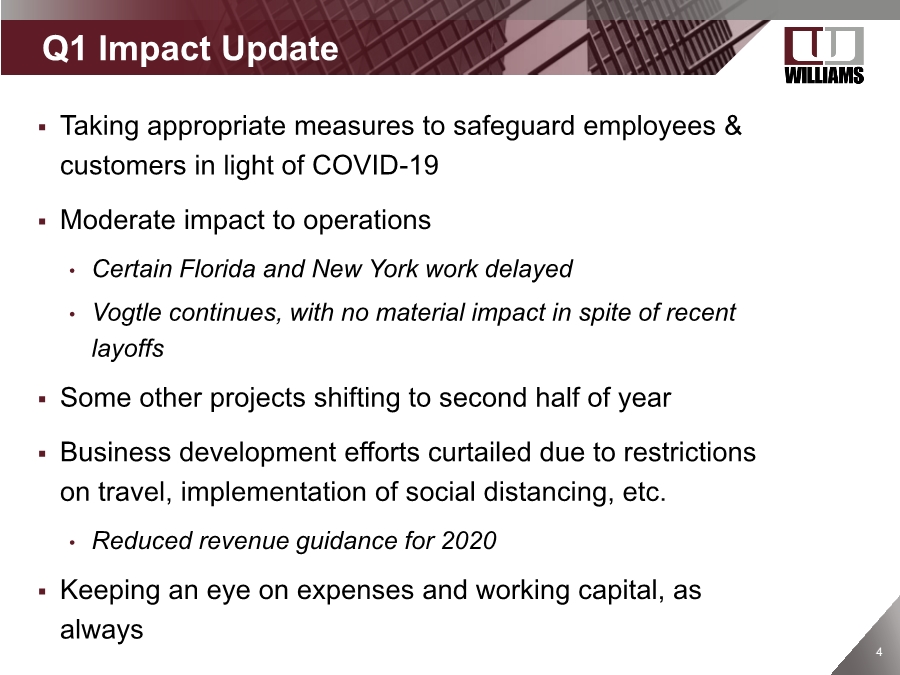
| 4 4 Q1 Impact Update . Taking appropriate measures to safeguard employees & customers in light of COVID-19 . Moderate impact to operations • Certain Florida and New York work delayed • Vogtle continues, with no material impact in spite of recent layoffs . Some other projects shifting to second half of year . Business development efforts curtailed due to restrictions on travel, implementation of social distancing, etc. • Reduced revenue guidance for 2020 . Keeping an eye on expenses and working capital, as always |
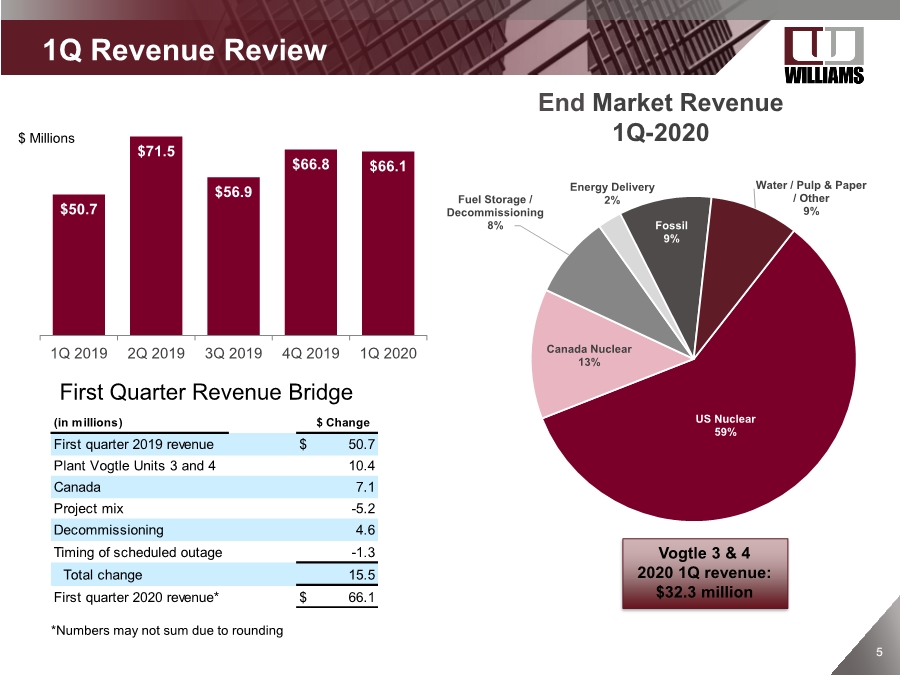
| 5 5 US Nuclear 59% Canada Nuclear 13% Fuel Storage / Decommissioning 8% Energy Delivery 2% Fossil 9% Water / Pulp & Paper / Other 9% 1Q Revenue Review End Market Revenue 1Q-2020 Vogtle 3 & 4 2020 1Q revenue: $32.3 million $50.7 $71.5 $56.9 $66.8 $66.1 1Q 2019 2Q 2019 3Q 2019 4Q 2019 1Q 2020 First Quarter Revenue Bridge $ Millions (in millions) $ Change First quarter 2019 revenue $ 50.7 Plant Vogtle Units 3 and 4 10.4 Canada 7.1 Project mix -5.2 Decommissioning 4.6 Timing of scheduled outage -1.3 Total change 15.5 First quarter 2020 revenue* $ 66.1 *Numbers may not sum due to rounding |
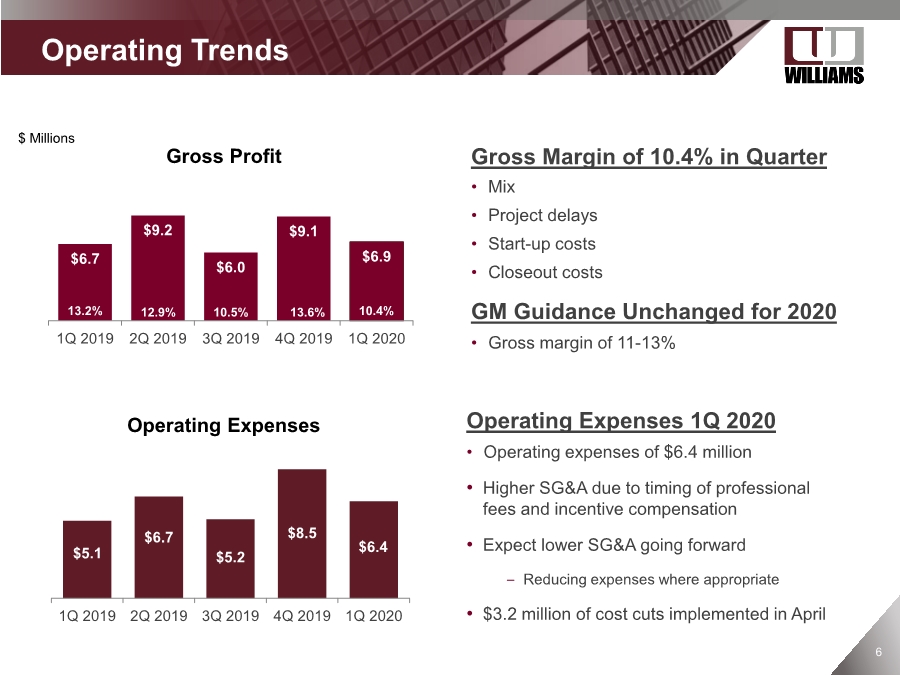
| 6 Operating Trends Gross Margin of 10.4% in Quarter • Mix • Project delays • Start-up costs • Closeout costs GM Guidance Unchanged for 2020 • Gross margin of 11-13% $6.7 $9.2 $6.0 $9.1 $6.9 1Q 2019 2Q 2019 3Q 2019 4Q 2019 1Q 2020 13.2% 13.6% $ Millions 12.9% 10.5% $5.1 $6.7 $5.2 $8.5 $6.4 1Q 2019 2Q 2019 3Q 2019 4Q 2019 1Q 2020 $1.4 Gross Profit Operating Expenses 1Q 2020 • Operating expenses of $6.4 million • Higher SG&A due to timing of professional fees and incentive compensation • Expect lower SG&A going forward – Reducing expenses where appropriate • $3.2 million of cost cuts implemented in April 10.4% Operating Expenses |
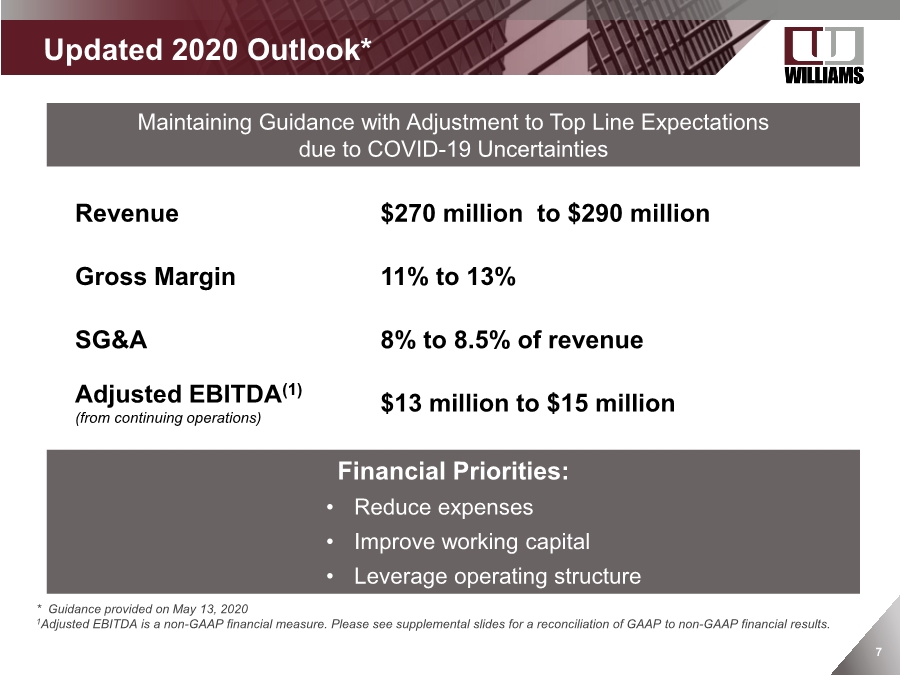
| 7 . Updated 2020 Outlook* * Guidance provided on May 13, 2020 1Adjusted EBITDA is a non-GAAP financial measure. Please see supplemental slides for a reconciliation of GAAP to non-GAAP financial results. Maintaining Guidance with Adjustment to Top Line Expectations due to COVID-19 Uncertainties Revenue $270 million to $290 million Gross Margin 11% to 13% SG&A 8% to 8.5% of revenue Adjusted EBITDA(1) (from continuing operations) $13 million to $15 million Financial Priorities: • Reduce expenses • Improve working capital • Leverage operating structure |
| Supplemental Information OTCQX: WLMS |

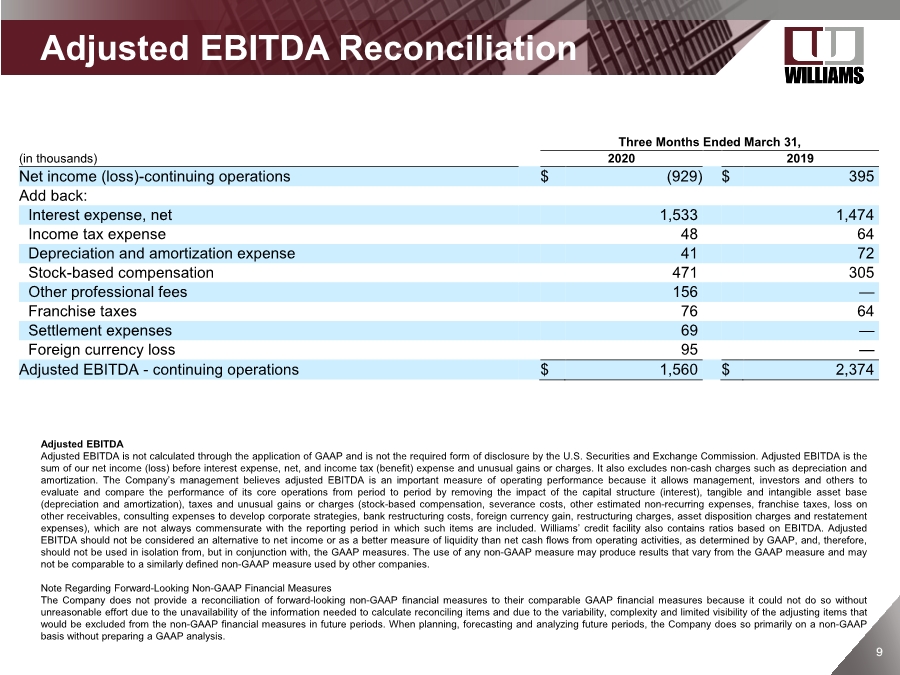
| 9 9 Adjusted EBITDA Reconciliation Adjusted EBITDA Adjusted EBITDA is not calculated through the application of GAAP and is not the required form of disclosure by the U.S. Securities and Exchange Commission. Adjusted EBITDA is the sum of our net income (loss) before interest expense, net, and income tax (benefit) expense and unusual gains or charges. It also excludes non-cash charges such as depreciation and amortization. The Company’s management believes adjusted EBITDA is an important measure of operating performance because it allows management, investors and others to evaluate and compare the performance of its core operations from period to period by removing the impact of the capital structure (interest), tangible and intangible asset base (depreciation and amortization), taxes and unusual gains or charges (stock-based compensation, severance costs, other estimated non-recurring expenses, franchise taxes, loss on other receivables, consulting expenses to develop corporate strategies, bank restructuring costs, foreign currency gain, restructuring charges, asset disposition charges and restatement expenses), which are not always commensurate with the reporting period in which such items are included. Williams’ credit facility also contains ratios based on EBITDA. Adjusted EBITDA should not be considered an alternative to net income or as a better measure of liquidity than net cash flows from operating activities, as determined by GAAP, and, therefore, should not be used in isolation from, but in conjunction with, the GAAP measures. The use of any non-GAAP measure may produce results that vary from the GAAP measure and may not be comparable to a similarly defined non-GAAP measure used by other companies. Note Regarding Forward-Looking Non-GAAP Financial Measures The Company does not provide a reconciliation of forward-looking non-GAAP financial measures to their comparable GAAP financial measures because it could not do so without unreasonable effort due to the unavailability of the information needed to calculate reconciling items and due to the variability, complexity and limited visibility of the adjusting items that would be excluded from the non-GAAP financial measures in future periods. When planning, forecasting and analyzing future periods, the Company does so primarily on a non-GAAP basis without preparing a GAAP analysis. Three Months Ended March 31, (in thousands) 2020 2019 Net income (loss)-continuing operations $ (929) $ 395 Add back: Interest expense, net 1,533 1,474 Income tax expense 48 64 Depreciation and amortization expense 41 72 Stock-based compensation 471 305 Other professional fees 156 — Franchise taxes 76 64 Settlement expenses 69 — Foreign currency loss 95 — Adjusted EBITDA - continuing operations $ 1,560 $ 2,374 |