Attached files
| file | filename |
|---|---|
| EX-32.2 - EX-32.2 - Starwood Real Estate Income Trust, Inc. | ck0001711929-ex322_9.htm |
| EX-32.1 - EX-32.1 - Starwood Real Estate Income Trust, Inc. | ck0001711929-ex321_6.htm |
| EX-31.2 - EX-31.2 - Starwood Real Estate Income Trust, Inc. | ck0001711929-ex312_8.htm |
| EX-31.1 - EX-31.1 - Starwood Real Estate Income Trust, Inc. | ck0001711929-ex311_7.htm |
UNITED STATES
SECURITIES AND EXCHANGE COMMISSION
WASHINGTON, D.C. 20549
FORM 10-Q
(Mark One)
|
☒ |
QUARTERLY REPORT PURSUANT TO SECTION 13 OR 15(d) OF THE SECURITIES EXCHANGE ACT OF 1934 |
FOR THE QUARTERLY PERIOD ENDED MARCH 31, 2020
OR
|
☐ |
TRANSITION REPORT PURSUANT TO SECTION 13 OR 15(d) OF THE SECURITIES EXCHANGE ACT OF 1934 |
For the Transition period from to .
Commission file number 000-56046

Starwood Real Estate Income Trust, Inc.
(Exact name of Registrant as specified in Governing Instruments)
|
Maryland |
1601 Washington Avenue, Suite 800 Miami Beach, FL 33139 |
82-2023409 |
|
(State or other jurisdiction of incorporation or organization) |
(Address of principal executive offices) (Zip Code) |
(I.R.S. Employer Identification No.) |
Registrant’s telephone number, including area code: (305) 695-5500
Indicate by check mark whether the Registrant (1) has filed all reports required to be filed by Section 13 or 15(d) of the Securities Exchange Act of 1934 during the preceding 12 months (or for such shorter period that the Registrant was required to file such reports), and (2) has been subject to such filing requirements for the past 90 days. Yes ☒ No ☐
Indicate by check mark whether the registrant has submitted electronically every Interactive Data File required to be submitted pursuant to Rule 405 of Regulation S-T (§232.405 of this chapter) during the preceding 12 months (or for such shorter period that the registrant was required to submit such files). Yes ☒ No ☐
Indicate by check mark whether the registrant is a large accelerated filer, an accelerated filer, a non-accelerated filer, smaller reporting company, or an emerging growth company. See the definitions of “large accelerated filer,” “accelerated filer,” “smaller reporting company,” and “emerging growth company” in Rule 12b-2 of the Exchange Act.:
|
Large accelerated filer |
|
☐ |
|
|
Accelerated filer |
|
☐ |
|
Non-accelerated filer |
|
☒ |
|
|
Smaller reporting company |
|
☒ |
|
|
|
|
|
|
Emerging growth company |
|
☒ |
If an emerging growth company, indicate by check mark if the registrant has elected not to use the extended transition period for complying with any new or revised financial accounting standards provided pursuant to Section 13(a) of the Exchange Act. ☒
Indicate by check mark whether the registrant is a shell company (as defined in Rule 12b-2 of the Act). Yes ☐ No ☒
Securities registered pursuant to Section 12(b) of the Act: None.
|
Title of each class |
|
Trading Symbol(s) |
|
Name of each exchange on which registered |
|
|
|
|
|
|
As of May 12, 2020, the registrant had the following shares outstanding: 2,117,183 shares of Class T common stock, 37,371,265 shares of Class S common stock, 2,386,535 shares of Class D common stock and 26,033,765 shares of Class I common stock.
|
PART I. |
|
|
|
|
|
|
|
ITEM 1. |
|
|
|
|
|
|
|
|
Consolidated Financial Statements (Unaudited): |
|
|
|
|
|
|
|
Consolidated Balance Sheets as of March 31, 2020 and December 31, 2019 |
1 |
|
|
|
|
|
|
Consolidated Statements of Operations for the Three Months Ended March 31, 2020 and 2019 |
2 |
|
|
|
|
|
|
Consolidated Statements of Changes in Equity for the Three Months Ended March 31, 2020 and 2019 |
3 |
|
|
|
|
|
|
Consolidated Statements of Cash Flows for the Three Months Ended March 31, 2020 and 2019 |
4 |
|
|
|
|
|
|
5 |
|
|
|
|
|
|
ITEM 2. |
MANAGEMENT'S DISCUSSION AND ANALYSIS OF FINANCIAL CONDITION AND RESULTS OF OPERATIONS |
26 |
|
|
|
|
|
ITEM 3. |
40 |
|
|
|
|
|
|
ITEM 4. |
41 |
|
|
|
|
|
|
PART II. |
|
|
|
|
|
|
|
ITEM 1. |
42 |
|
|
|
|
|
|
ITEM 1A. |
42 |
|
|
|
|
|
|
ITEM 2. |
42 |
|
|
|
|
|
|
ITEM 3. |
43 |
|
|
|
|
|
|
ITEM 4. |
43 |
|
|
|
|
|
|
ITEM 5. |
43 |
|
|
|
|
|
|
ITEM 6. |
44 |
Starwood Real Estate Income Trust, Inc.
Consolidated Balance Sheets (Unaudited)
(in thousands, except share and per share data)
|
|
|
March 31, 2020 |
|
|
December 31, 2019 |
|
||
|
Assets |
|
|
|
|
|
|
|
|
|
Investments in real estate, net |
|
$ |
3,216,839 |
|
|
$ |
1,798,044 |
|
|
Investments in real estate-related securities |
|
|
314,465 |
|
|
|
277,651 |
|
|
Investments in unconsolidated real estate ventures |
|
|
12,253 |
|
|
|
12,169 |
|
|
Cash and cash equivalents |
|
|
61,222 |
|
|
|
48,479 |
|
|
Restricted cash |
|
|
94,261 |
|
|
|
140,482 |
|
|
Other assets |
|
|
219,845 |
|
|
|
113,497 |
|
|
Total assets |
|
$ |
3,918,885 |
|
|
$ |
2,390,322 |
|
|
Liabilities and Equity |
|
|
|
|
|
|
|
|
|
Mortgage notes and revolving credit facility, net |
|
$ |
2,238,903 |
|
|
$ |
1,238,102 |
|
|
Repurchase agreements |
|
|
198,434 |
|
|
|
81,035 |
|
|
Accounts payable, accrued expenses and other liabilities |
|
|
101,114 |
|
|
|
47,979 |
|
|
Subscriptions received in advance |
|
|
41,012 |
|
|
|
110,618 |
|
|
Due to affiliates |
|
|
69,953 |
|
|
|
63,341 |
|
|
Total liabilities |
|
|
2,649,416 |
|
|
|
1,541,075 |
|
|
|
|
|
|
|
|
|
|
|
|
Commitments and contingencies |
|
|
— |
|
|
|
— |
|
|
Redeemable non-controlling interest |
|
|
10,187 |
|
|
|
— |
|
|
|
|
|
|
|
|
|
|
|
|
Equity |
|
|
|
|
|
|
|
|
|
Preferred stock, $0.01 par value per share, 100,000,000 shares authorized; none issued and outstanding as of March 31, 2020 and December 31, 2019 |
|
|
— |
|
|
|
— |
|
|
Common stock — Class T shares, $0.01 par value per share, 250,000,000 shares authorized; 2,016,251 and 1,412,563 shares issued and outstanding as of March 31, 2020 and December 31, 2019, respectively |
|
|
20 |
|
|
|
14 |
|
|
Common stock — Class S shares, $0.01 par value per share, 250,000,000 shares authorized; 35,762,788 and 26,164,794 shares issued and outstanding as of March 31, 2020 and December 31, 2019, respectively |
|
|
358 |
|
|
|
262 |
|
|
Common stock — Class D shares, $0.01 par value per share, 250,000,000 shares authorized; 2,293,273 and 1,653,094 shares issued and outstanding as of March 31, 2020 and December 31, 2019, respectively |
|
|
23 |
|
|
|
17 |
|
|
Common stock — Class I shares, $0.01 par value per share, 250,000,000 shares authorized; 25,118,918 and 16,114,284 shares issued and outstanding as of March 31, 2020 and December 31, 2019, respectively |
|
|
251 |
|
|
|
161 |
|
|
Additional paid-in capital |
|
|
1,291,542 |
|
|
|
883,506 |
|
|
Accumulated deficit and cumulative distributions |
|
|
(102,742 |
) |
|
|
(46,697 |
) |
|
Total stockholders' equity |
|
|
1,189,452 |
|
|
|
837,263 |
|
|
Non-controlling interests in consolidated joint ventures |
|
|
69,830 |
|
|
|
11,984 |
|
|
Total equity |
|
|
1,259,282 |
|
|
|
849,247 |
|
|
Total liabilities and equity |
|
$ |
3,918,885 |
|
|
$ |
2,390,322 |
|
See accompanying notes to consolidated financial statements.
1
Starwood Real Estate Income Trust, Inc.
Consolidated Statements of Operations (Unaudited)
(in thousands, except share and per share data)
|
|
|
Three Months Ended March 31, |
|
|||||
|
|
|
2020 |
|
|
2019 |
|
||
|
Revenues |
|
|
|
|
|
|
|
|
|
Rental revenue |
|
$ |
46,465 |
|
|
$ |
4,310 |
|
|
Hotel revenue |
|
|
10,215 |
|
|
|
10,852 |
|
|
Other revenue |
|
|
357 |
|
|
|
253 |
|
|
Total revenues |
|
|
57,037 |
|
|
|
15,415 |
|
|
Expenses |
|
|
|
|
|
|
|
|
|
Rental property operating |
|
|
15,544 |
|
|
|
1,762 |
|
|
Hotel operating |
|
|
5,964 |
|
|
|
5,503 |
|
|
General and administrative |
|
|
2,358 |
|
|
|
912 |
|
|
Management fees |
|
|
3,946 |
|
|
|
— |
|
|
Performance participation allocation |
|
|
46 |
|
|
|
857 |
|
|
Depreciation and amortization |
|
|
30,543 |
|
|
|
5,358 |
|
|
Total expenses |
|
|
58,401 |
|
|
|
14,392 |
|
|
Other income (expense) |
|
|
|
|
|
|
|
|
|
Earnings from unconsolidated real estate ventures |
|
|
360 |
|
|
|
43 |
|
|
(Loss) income from real estate-related securities, net |
|
|
(20,173 |
) |
|
|
102 |
|
|
Interest income |
|
|
303 |
|
|
|
58 |
|
|
Interest expense |
|
|
(19,641 |
) |
|
|
(3,598 |
) |
|
Other expense |
|
|
(132 |
) |
|
|
(96 |
) |
|
Total other expense |
|
|
(39,283 |
) |
|
|
(3,491 |
) |
|
Net loss |
|
$ |
(40,647 |
) |
|
$ |
(2,468 |
) |
|
Net loss attributable to non-controlling interests in consolidated joint ventures |
|
$ |
638 |
|
|
$ |
— |
|
|
Net loss attributable to non-controlling interests in Operating Partnership |
|
|
332 |
|
|
|
— |
|
|
Net loss attributable to stockholders |
|
$ |
(39,677 |
) |
|
$ |
(2,468 |
) |
|
Net loss per share of common stock, basic and diluted |
|
$ |
(0.69 |
) |
|
$ |
(0.24 |
) |
|
Weighted-average shares of common stock outstanding, basic and diluted |
|
|
57,844,231 |
|
|
|
10,089,598 |
|
See accompanying notes to consolidated financial statements.
2
Starwood Real Estate Income Trust, Inc.
Consolidated Statements of Changes in Equity (Unaudited)
(in thousands)
|
|
|
|
|
|
|
|
|
|
|
|
|
|
|
|
|
|
|
|
|
|
|
|
|
|||||||||||||
|
|
|
Three Months Ended March 31, 2020 |
|
|||||||||||||||||||||||||||||||||
|
|
|
Par Value |
|
|
|
|
|
|
Accumulated |
|
|
|
|
|
|
|
|
|
|
|
|
|
||||||||||||||
|
|
|
Common Stock Class T |
|
|
Common Stock Class S |
|
|
Common Stock Class D |
|
|
Common Stock Class I |
|
|
Additional Paid-In Capital |
|
|
Deficit and Cumulative Distributions |
|
|
Total Stockholders' Equity |
|
|
Non- controlling Interests |
|
|
Total Equity |
|
|||||||||
|
Balance at December 31, 2019 |
|
$ |
14 |
|
|
$ |
262 |
|
|
$ |
17 |
|
|
$ |
161 |
|
|
$ |
883,506 |
|
|
$ |
(46,697 |
) |
|
$ |
837,263 |
|
|
$ |
11,984 |
|
|
$ |
849,247 |
|
|
Common stock issued |
|
|
6 |
|
|
|
94 |
|
|
|
6 |
|
|
|
89 |
|
|
|
421,464 |
|
|
|
— |
|
|
|
421,659 |
|
|
|
— |
|
|
|
421,659 |
|
|
Offering costs |
|
|
— |
|
|
|
— |
|
|
|
— |
|
|
|
— |
|
|
|
(20,528 |
) |
|
|
— |
|
|
|
(20,528 |
) |
|
|
— |
|
|
|
(20,528 |
) |
|
Distribution reinvestments |
|
|
— |
|
|
|
2 |
|
|
|
— |
|
|
|
1 |
|
|
|
8,361 |
|
|
|
— |
|
|
|
8,364 |
|
|
|
— |
|
|
|
8,364 |
|
|
Amortization of restricted stock grants |
|
|
— |
|
|
|
— |
|
|
|
— |
|
|
|
— |
|
|
|
21 |
|
|
|
— |
|
|
|
21 |
|
|
|
— |
|
|
|
21 |
|
|
Common stock repurchased |
|
|
— |
|
|
|
— |
|
|
|
— |
|
|
|
— |
|
|
|
(980 |
) |
|
|
— |
|
|
|
(980 |
) |
|
|
— |
|
|
|
(980 |
) |
|
Net loss ($332 allocated to redeemable non- controlling interest) |
|
|
— |
|
|
|
— |
|
|
|
— |
|
|
|
— |
|
|
|
— |
|
|
|
(39,677 |
) |
|
|
(39,677 |
) |
|
|
(638 |
) |
|
|
(40,315 |
) |
|
Contributions from non-controlling interests |
|
|
— |
|
|
|
— |
|
|
|
— |
|
|
|
— |
|
|
|
— |
|
|
|
— |
|
|
|
— |
|
|
|
58,840 |
|
|
|
58,840 |
|
|
Distributions to non-controlling interests |
|
|
— |
|
|
|
— |
|
|
|
— |
|
|
|
— |
|
|
|
— |
|
|
|
— |
|
|
|
— |
|
|
|
(356 |
) |
|
|
(356 |
) |
|
Distributions declared on common stock (see Note 9) |
|
|
— |
|
|
|
— |
|
|
|
— |
|
|
|
— |
|
|
|
— |
|
|
|
(16,368 |
) |
|
|
(16,368 |
) |
|
|
— |
|
|
|
(16,368 |
) |
|
Allocation to redeemable non- controlling interest |
|
|
— |
|
|
|
— |
|
|
|
— |
|
|
|
— |
|
|
|
(302 |
) |
|
|
— |
|
|
|
(302 |
) |
|
|
— |
|
|
|
(302 |
) |
|
Balance at March 31, 2020 |
|
$ |
20 |
|
|
$ |
358 |
|
|
$ |
23 |
|
|
$ |
251 |
|
|
$ |
1,291,542 |
|
|
$ |
(102,742 |
) |
|
$ |
1,189,452 |
|
|
$ |
69,830 |
|
|
$ |
1,259,282 |
|
|
|
|
|
|
|
|
|
|
|
|
|
|
|
|
|
|
|
|
|
|
|
|
|
|
|
|
|
|
|
|
|
|
|
|
|
|
|
|
|
|
Three Months Ended March 31, 2019 |
|
|||||||||||||||||||||||||||||||||
|
|
|
Par Value |
|
|
|
|
|
|
Accumulated |
|
|
|
|
|
|
|
|
|
|
|
|
|
||||||||||||||
|
|
|
Common Stock Class T |
|
|
Common Stock Class S |
|
|
Common Stock Class D |
|
|
Common Stock Class I |
|
|
Additional Paid-In Capital |
|
|
Deficit and Cumulative Distributions |
|
|
Total Stockholders' Equity |
|
|
Non- controlling Interests |
|
|
Total Equity |
|
|||||||||
|
Balance at December 31, 2018 |
|
$ |
— |
|
|
$ |
66 |
|
|
$ |
— |
|
|
$ |
15 |
|
|
$ |
148,770 |
|
|
$ |
(1,729 |
) |
|
$ |
147,122 |
|
|
$ |
— |
|
|
$ |
147,122 |
|
|
Common stock issued |
|
|
2 |
|
|
|
17 |
|
|
|
3 |
|
|
|
21 |
|
|
|
85,543 |
|
|
|
— |
|
|
|
85,586 |
|
|
|
— |
|
|
|
85,586 |
|
|
Offering costs |
|
|
— |
|
|
|
— |
|
|
|
— |
|
|
|
— |
|
|
|
(4,049 |
) |
|
|
— |
|
|
|
(4,049 |
) |
|
|
— |
|
|
|
(4,049 |
) |
|
Distribution reinvestments |
|
|
— |
|
|
|
— |
|
|
|
— |
|
|
|
— |
|
|
|
396 |
|
|
|
— |
|
|
|
396 |
|
|
|
— |
|
|
|
396 |
|
|
Amortization of restricted stock grants |
|
|
— |
|
|
|
— |
|
|
|
— |
|
|
|
— |
|
|
|
29 |
|
|
|
— |
|
|
|
29 |
|
|
|
— |
|
|
|
29 |
|
|
Net loss |
|
|
— |
|
|
|
— |
|
|
|
— |
|
|
|
— |
|
|
|
— |
|
|
|
(2,468 |
) |
|
|
(2,468 |
) |
|
|
— |
|
|
|
(2,468 |
) |
|
Distributions declared on common stock (see Note 9) |
|
|
— |
|
|
|
— |
|
|
|
— |
|
|
|
— |
|
|
|
— |
|
|
|
(1,631 |
) |
|
|
(1,631 |
) |
|
|
— |
|
|
|
(1,631 |
) |
|
Balance at March 31, 2019 |
|
$ |
2 |
|
|
$ |
83 |
|
|
$ |
3 |
|
|
$ |
36 |
|
|
$ |
230,689 |
|
|
$ |
(5,828 |
) |
|
$ |
224,985 |
|
|
$ |
— |
|
|
$ |
224,985 |
|
See accompanying notes to consolidated financial statements.
3
Starwood Real Estate Income Trust, Inc.
Consolidated Statements of Cash Flows (Unaudited)
(in thousands)
|
|
|
Three Months Ended March 31, |
|
|||||
|
|
|
2020 |
|
|
2019 |
|
||
|
Cash flows from operating activities |
|
|
|
|
|
|
|
|
|
Net loss |
|
$ |
(40,647 |
) |
|
$ |
(2,468 |
) |
|
Adjustments to reconcile net loss to net cash provided by operating activities |
|
|
|
|
|
|
|
|
|
Management fee |
|
|
3,946 |
|
|
|
— |
|
|
Performance participation allocation |
|
|
46 |
|
|
|
857 |
|
|
Depreciation and amortization |
|
|
30,543 |
|
|
|
5,358 |
|
|
Amortization of deferred financing costs |
|
|
436 |
|
|
|
156 |
|
|
Deferred income amortization |
|
|
(235 |
) |
|
|
— |
|
|
Unrealized loss on changes in fair value of financial instruments |
|
|
26,973 |
|
|
|
130 |
|
|
Losses on sales of real estate-related securities |
|
|
1,329 |
|
|
|
— |
|
|
Amortization of restricted stock grants |
|
|
21 |
|
|
|
29 |
|
|
Distributions from investments in unconsolidated real estate ventures |
|
|
276 |
|
|
|
— |
|
|
Earnings from unconsolidated real estate ventures |
|
|
(360 |
) |
|
|
(43 |
) |
|
Other items |
|
|
(266 |
) |
|
|
— |
|
|
Change in assets and liabilities |
|
|
|
|
|
|
|
|
|
Increase in other assets |
|
|
(12,472 |
) |
|
|
(10,302 |
) |
|
Increase in due to affiliates |
|
|
144 |
|
|
|
189 |
|
|
Increase in accounts payable, accrued expenses and other liabilities |
|
|
17,711 |
|
|
|
8,256 |
|
|
Net cash provided by operating activities |
|
|
27,445 |
|
|
|
2,162 |
|
|
Cash flows from investing activities |
|
|
|
|
|
|
|
|
|
Acquisitions of real estate |
|
|
(1,512,285 |
) |
|
|
(205,980 |
) |
|
Capital improvements to real estate |
|
|
(1,838 |
) |
|
|
(389 |
) |
|
Purchase of real estate-related securities |
|
|
(65,754 |
) |
|
|
(107,325 |
) |
|
Proceeds from settlement of real estate-related securities |
|
|
5,029 |
|
|
|
— |
|
|
Net cash used in investing activities |
|
|
(1,574,848 |
) |
|
|
(313,694 |
) |
|
Cash flows from financing activities |
|
|
|
|
|
|
|
|
|
Proceeds from issuance of common stock, net |
|
|
307,520 |
|
|
|
85,586 |
|
|
Offering costs paid |
|
|
(3,901 |
) |
|
|
(730 |
) |
|
Subscriptions received in advance |
|
|
41,012 |
|
|
|
40,354 |
|
|
Repurchase of common stock |
|
|
(980 |
) |
|
|
— |
|
|
Borrowings from mortgage notes and revolving credit facility |
|
|
1,007,273 |
|
|
|
47,948 |
|
|
Repayments of mortgage notes and revolving credit facility |
|
|
(734 |
) |
|
|
(363 |
) |
|
Net borrowings under repurchase agreements |
|
|
117,399 |
|
|
|
63,567 |
|
|
Payment of deferred financing costs |
|
|
(5,971 |
) |
|
|
(3,020 |
) |
|
Contributions from non-controlling interests |
|
|
58,840 |
|
|
|
— |
|
|
Distributions to non-controlling interests |
|
|
(356 |
) |
|
|
— |
|
|
Distributions |
|
|
(6,177 |
) |
|
|
(178 |
) |
|
Net cash provided by financing activities |
|
|
1,513,925 |
|
|
|
233,164 |
|
|
Net change in cash and cash equivalents and restricted cash |
|
|
(33,478 |
) |
|
|
(78,368 |
) |
|
Cash and cash equivalents and restricted cash at the beginning of the period |
|
|
188,961 |
|
|
|
164,921 |
|
|
Cash and cash equivalents and restricted cash at the end of the period |
|
$ |
155,483 |
|
|
$ |
86,553 |
|
|
Reconciliation of cash and cash equivalents and restricted cash to the consolidated balance sheets: |
|
|
|
|
|
|
|
|
|
Cash and cash equivalents |
|
$ |
61,222 |
|
|
$ |
31,038 |
|
|
Restricted cash |
|
|
94,261 |
|
|
|
55,515 |
|
|
Total cash and cash equivalents and restricted cash |
|
$ |
155,483 |
|
|
$ |
86,553 |
|
|
Non-cash financing activities: |
|
|
|
|
|
|
|
|
|
Assumption of mortgage notes in conjunction with acquisitions in real estate |
|
$ |
— |
|
|
$ |
220,932 |
|
|
Accrued stockholder servicing fee due to affiliate |
|
$ |
18,151 |
|
|
$ |
3,150 |
|
|
Accrued offering costs due to affiliates |
|
$ |
— |
|
|
$ |
159 |
|
|
Right of use asset/liability |
|
$ |
6,408 |
|
|
$ |
— |
|
|
Redeemable non-controlling interest issued as settlement for performance participation allocation |
|
$ |
10,366 |
|
|
$ |
— |
|
|
Accrued distributions |
|
$ |
6,191 |
|
|
$ |
1,058 |
|
|
Distribution reinvestment |
|
$ |
8,364 |
|
|
$ |
396 |
|
See accompanying notes to consolidated financial statements.
4
Starwood Real Estate Income Trust, Inc.
Notes to Consolidated Financial Statements
(Unaudited)
|
1. |
Organization and Business Purpose |
Starwood Real Estate Income Trust, Inc. (the “Company”) was formed on June 22, 2017 as a Maryland corporation and intends to qualify and elect to be taxed as a real estate investment trust (“REIT”) for U.S. federal income tax purposes commencing with the taxable year ended December 31, 2019. The Company was organized to invest primarily in stabilized, income-oriented commercial real estate and debt secured by commercial real estate. The Company’s portfolio is principally comprised of properties and debt secured by properties located in the United States but may also be diversified on a global basis through the acquisition of properties, and debt secured by properties, outside of the United States, with a focus on Europe. To a lesser extent, the Company invests in real estate-related securities. The Company is the sole general partner of Starwood REIT Operating Partnership, L.P., a Delaware limited partnership (the “Operating Partnership”). Starwood REIT Special Limited Partner, L.L.C. (the “Special Limited Partner”), a wholly owned subsidiary of Starwood Capital Group Holdings, L.P. (the “Sponsor”), owns a special limited partner interest in the Operating Partnership. Substantially all of the Company’s business is conducted through the Operating Partnership. The Company and the Operating Partnership are externally managed by Starwood REIT Advisors, L.L.C. (the “Advisor”), an affiliate of the Sponsor.
The Company has registered with the Securities and Exchange Commission (the “SEC”) an offering of up to $5.0 billion in shares of common stock, consisting of up to $4.0 billion in shares in its primary offering and up to $1.0 billion in shares pursuant to its distribution reinvestment plan (the “Offering”). The Company is selling in the Offering any combination of four classes of shares of its common stock, with a dollar value up to the maximum aggregate amount. The share classes have different upfront selling commissions, dealer manager fees and ongoing stockholder servicing fees. The Company intends to continue selling shares on a monthly basis.
As of March 31, 2020, the Company owned 93 investments in real estate and 84 positions in real estate-related securities. The Company currently operates in six reportable segments: Multifamily, Hotel, Industrial, Office, Medical Office and Real Estate-Related Securities. Financial results by segment are reported in Note 13.
Principles of Consolidation and Basis of Presentation
The accompanying unaudited consolidated financial statements have been prepared in accordance with accounting principles generally accepted in the United States of America (“GAAP”) for interim financial information and the instructions to Form 10-Q and Rule 10-01 of Regulation S-X. All significant intercompany balances and transactions have been eliminated in consolidation. Management believes it has made all necessary adjustments, consisting of only normal recurring items, so that the consolidated financial statements are presented fairly and that estimates made in preparing its consolidated financial statements are reasonable and prudent. The accompanying unaudited consolidated interim financial statements should be read in conjunction with the audited consolidated financial statements included in the Company’s Annual Report on Form 10-K for the fiscal year ended December 31, 2019 filed with the SEC.
The accompanying unaudited consolidated financial statements include the accounts of the Company, the Company’s subsidiaries and joint ventures in which the Company has a controlling interest. For consolidated joint ventures, the non-controlling partner’s share of the assets, liabilities and operations of the joint ventures is included in non-controlling interests as equity of the Company. The non-controlling partner’s interest is generally computed as the joint venture partner’s ownership percentage.
In determining whether the Company has a controlling financial interest in a partially owned entity and the requirement to consolidate the accounts of that entity, the Company considers whether the entity is a variable interest entity (“VIE”) and whether it is the primary beneficiary. The Company is the primary beneficiary of a VIE when it has (i) the power to direct the most significant activities impacting the economic performance of the VIE and (ii) the obligation to absorb losses or receive benefits significant to the VIE. The Operating Partnership is considered to be a VIE. The Company consolidates the Operating Partnership because it has the ability to direct the most significant activities of the entities such as purchases, dispositions, financings, budgets, and overall operating plans. Where the Company does not have the power to direct the activities of the VIE that most significantly impact its economic performance, the Company's interest for those partially owned entities are accounted for using the equity method of accounting. The Company meets the VIE disclosure exemption criteria, as the Company’s interest in the Operating Partnership is considered a majority voting interest.
5
The preparation of financial statements in conformity with GAAP requires management to make estimates and assumptions that affect the reported amounts of assets and liabilities and disclosures of contingent assets and liabilities at the date of the balance sheet. Actual results could differ from those estimates.
Cash and Cash Equivalents
Cash and cash equivalents represent cash held in banks, cash on hand, and liquid investments with original maturities of three months or less. The Company may have bank balances in excess of federally insured amounts; however, the Company deposits its cash and cash equivalents with high credit-quality institutions to minimize credit risk exposure.
Restricted Cash
Restricted cash primarily consists of cash received for subscriptions prior to the date in which the subscriptions are effective. The Company’s restricted cash is held primarily in a bank account controlled by the Company’s transfer agent but in the name of the Company. The remaining balance of restricted cash primarily consists of amounts in escrow related to real estate taxes and insurance in connection with mortgages at certain of the Company’s properties and tenant security deposits.
Investments in Real Estate
In accordance with the guidance for business combinations, the Company determines whether the acquisition of a property qualifies as a business combination, which requires that the assets acquired and liabilities assumed constitute a business. If the property acquired is not a business, the Company accounts for the transaction as an asset acquisition. All property acquisitions to date have been accounted for as asset acquisitions.
The Company capitalizes acquisition-related costs associated with asset acquisitions. Upon acquisition of a property, the Company assesses the fair value of acquired tangible and intangible assets (including land, buildings, tenant improvements, “above-market” and “below-market” leases, acquired in-place leases, other identified intangible assets and assumed liabilities) and allocates the purchase price to the acquired assets and assumed liabilities. The Company assesses and considers fair value based on estimated cash flow projections that utilize discount and/or capitalization rates that it deems appropriate, as well as other available market information. Estimates of future cash flows are based on a number of factors including the historical operating results, known and anticipated trends and market and economic conditions.
The fair value of the tangible assets of an acquired property considers the value of the property as if it were vacant. The Company also considers an allocation of purchase price of other acquired intangibles, including acquired in-place leases that may have a customer relationship intangible value, including (but not limited to) the nature and extent of the existing relationship with the tenants, the tenants’ credit quality and expectations of lease renewals. Based on its acquisitions to date, the Company’s allocation to customer relationship intangible assets has not been material.
The cost of buildings and improvements includes the purchase price of the Company’s properties and any acquisition-related costs, along with any subsequent improvements to such properties. The Company’s investments in real estate are stated at cost and are generally depreciated on a straight-line basis over the estimated useful lives of the assets as follows:
|
Description |
|
Depreciable Life |
|
Building |
|
35 - 40 years |
|
Building and land improvements |
|
5 - 15 years |
|
Furniture, fixtures and equipment |
|
5 - 7 years |
|
Lease intangibles and leasehold improvements |
|
Shorter of useful life or lease term |
Repairs and maintenance are expensed to operations as incurred and are included in Rental property operating and Hotel operating expenses on the Company’s Consolidated Statements of Operations. Significant improvements to properties are capitalized. When assets are sold or retired, their costs and related accumulated depreciation are removed from the accounts with the resulting gains or losses reflected in net income or loss for the period.
6
The Company records acquired above-market and below-market leases at their fair values (using a discount rate which reflects the risks associated with the leases acquired) equal to the difference between (1) the contractual amounts to be paid pursuant to each in-place lease and (2) management’s estimate of fair market lease rates for each corresponding in-place lease, measured over a period equal to the remaining term of the lease for above-market leases and the initial term plus the term of any below-market fixed rate renewal options for below-market leases. Other intangible assets acquired include amounts for in-place lease values that are based on the Company’s evaluation of the specific characteristics of each tenant’s lease. Factors to be considered include estimates of carrying costs during hypothetical expected lease-up periods considering current market conditions, and costs to execute similar leases. In estimating carrying costs, the Company includes real estate taxes, insurance and other operating expenses and estimates of lost rentals at market rates during the expected lease-up periods, depending on local market conditions. In estimating costs to execute similar leases, the Company considers leasing commissions, legal and other related expenses.
The amortization of acquired above-market and below-market leases is recorded as an adjustment to rental revenue on the Company’s Consolidated Statements of Operations. The amortization of in-place leases is recorded as an adjustment to Depreciation and amortization expense on the Company’s Consolidated Statements of Operations.
Certain of the Company’s investments in real estate are subject to a ground lease, for which a lease liability and corresponding right-of-use (“ROU”) asset were recognized. The Company calculates the amount of the lease liability and ROU asset by taking the present value of the remaining lease payments, and adjusting the ROU asset for any existing straight-line ground rent liability and acquired ground lease intangibles. The Company’s estimated incremental borrowing rate of a loan with a similar term as the ground lease was used as the discount rate. The lease liability is included as a component of Accounts payable, accrued expenses, and other liabilities and the related ROU asset is recorded as a component of Investments in real estate, net on the Company’s Consolidated Balance Sheets. The amortization of the below-market ground lease will be recorded as an adjustment to Depreciation and amortization expense on the Company’s Consolidated Statements of Operations.
The Company’s management reviews its real estate properties for impairment when there is an event or change in circumstances that indicates an impaired value. Since cash flows on real estate properties considered to be “long-lived assets to be held and used” are considered on an undiscounted basis to determine whether an asset has been impaired, the Company’s strategy of holding properties over the long term directly decreases the likelihood of recording an impairment loss. If the Company’s strategy changes or market conditions otherwise dictate an earlier sale date, an impairment loss may be recognized and such loss could be material to the Company’s results. If the Company determines that an impairment has occurred, the affected assets must be reduced to their fair value. During the periods presented, no such impairment occurred.
Investments in Unconsolidated Real Estate Ventures
Investments in unconsolidated joint ventures are initially recorded at cost, and subsequently adjusted for equity in earnings and cash contributions and distributions. Under the equity method of accounting, the net equity investment of the Company is reflected within the Consolidated Balance Sheets, and the Company’s share of net income or loss from the joint ventures is included within the Consolidated Statements of Operations. The joint venture agreements may designate different percentage allocations among investors for profits and losses; however, the Company’s recognition of joint venture income or loss generally follows the joint venture’s distribution priorities, which may change upon the achievement of certain investment return thresholds. The Company’s investments in unconsolidated joint ventures are reviewed for impairment periodically and the Company records impairment charges when events or circumstances change indicating that a decline in the fair values below the carrying values has occurred and such decline is other-than-temporary. The ultimate realization of the investment in unconsolidated joint ventures is dependent on a number of factors, including the performance of each investment and market conditions.
Investments in Real Estate-Related Securities
The Company has elected to classify its investment in real estate-related securities as trading securities and carry such investments at estimated fair value. As such, the resulting gains and losses are recorded as a component of (Loss) income from real estate-related securities, net on the Consolidated Statements of Operations.
Interest income from the Company’s investments in real estate securities is recognized over the life of each investment using the effective interest method and is recorded on the accrual basis. Recognition of premiums and discounts associated with these investments is deferred and recorded over the term of the investment as an adjustment to yield. Such items are recorded as components of Investments in real estate-related securities on the Company’s Consolidated Balance Sheets.
7
In the normal course of business, the Company is exposed to the effect of interest rate changes. The Company seeks to manage these risks by following established risk management policies and procedures including the use of derivatives to hedge interest rate risk on debt instruments. The Company recognizes all derivatives as either assets or liabilities in the Consolidated Balance Sheets and measures those instruments at fair value.
Fair Value Measurements
Under normal market conditions, the fair value of an investment is the amount that would be received to sell an asset or transfer a liability in an orderly transaction between market participants at the measurement date (i.e., the exit price). Additionally, there is a hierarchal framework that prioritizes and ranks the level of market price observability used in measuring investments at fair value. Market price observability is impacted by a number of factors, including the type of investment and the characteristics specific to the investment and the state of the market place, including the existence and transparency of transactions between market participants. Investments with readily available active quoted prices or for which fair value can be measured from actively quoted prices generally will have a higher degree of market price observability and a lesser degree of judgment used in measuring fair value.
Investments measured and reported at fair value are classified and disclosed in one of the following levels within the fair value hierarchy:
Level 1 — quoted prices are available in active markets for identical investments as of the measurement date. The Company does not adjust the quoted price for these investments.
Level 2 — quoted prices are available in markets that are not active or model inputs are based on inputs that are either directly or indirectly observable as of the measurement date.
Level 3 — pricing inputs are unobservable and include instances where there is minimal, if any, market activity for the investment. These inputs require significant judgment or estimation by management or third parties when determining fair value and generally represent anything that does not meet the criteria of Levels 1 and 2. Due to the inherent uncertainty of these estimates, these values may differ materially from the values that would have been used had a ready market for these investments existed.
Valuation
The Company generally determines the fair value of its real estate-related securities by utilizing broker-dealer quotations, reported trades or valuation estimates from pricing models to determine the reported price. Pricing models for real estate-related securities are generally discounted cash flow models that usually consider the attributes applicable to a particular class of security (e.g., credit rating, seniority), current market data, and estimated cash flows for each class and incorporate deal collateral performance such as prepayment speeds and default rates, as available. As of December 31, 2019 and March 31, 2020 the Company’s investments in real estate-related securities are classified as Level 2 and Level 3, respectively. On January 1, 2020, the entire Investments in Real Estate-Related Securities portfolio was transferred into Level 3 primarily due to decreased price transparency.
The significant unobservable input in our Level 3 measurements for the real estate-related securities measured at fair value on a recurring basis is the yield of the security. The yield ranged from 1.8% to 17.9% and had a weighted average of 5.5% for the period ended March 31, 2020. A significant increase (decrease) in the yield in isolation would result in a significantly lower (higher) fair value measurement. Refer to Note 5 for additional information.
Fair value of the Company’s indebtedness is estimated by modeling the cash flows required by the Company’s debt agreements and discounting them back to the present value using an appropriate discount rate. Additionally, the Company considers current market rate and conditions by evaluating similar borrowing agreements with comparable loan-to-value ratios and credit profiles. The inputs used in determining the fair value of the Company’s indebtedness are considered Level 3. As of March 31, 2020, the fair value of the Company’s mortgage notes, revolving credit facility and repurchase agreements was approximately $8.3 million below the outstanding principal balance.
The Company’s derivative positions are valued using models developed by the respective counterparty as well as third party pricing service providers that use as their basis readily observable market parameters (such as forward yield curves and credit default swap data). The Company’s derivative positions are classified as Level 2. As of March 31, 2020, the fair value of the Company’s derivatives was approximately $4.4 million below their cost.
8
The fair values of the Company’s financial instruments (other than real estate-related securities, mortgage notes, revolving credit facility and derivative instruments), including cash and cash equivalents and other financial instruments, approximate their carrying or contract value.
Deferred Charges
The Company’s deferred charges include financing and leasing costs. Deferred financing costs include legal, structuring and other loan costs incurred by the Company for its financing agreements. Deferred financing costs related to the Company’s mortgage notes are recorded as an offset to the related liability and amortized over the term of the applicable financing instruments as interest expense. Deferred financing costs related to the Company’s revolving credit facility are recorded as a component of Other assets on the Company’s Consolidated Balance Sheets and amortized over the term of the applicable financing agreement. Deferred leasing costs incurred in connection with new leases, which consist primarily of brokerage commissions, are recorded as a component of Investments in real estate, net on the Company’s Consolidated Balance Sheets and amortized over the life of the related lease.
Revenue Recognition
The Company commences revenue recognition on its leases based on a number of factors, including the initial determination that the contract is or contains a lease. Generally, all of the Company’s contracts are, or contain leases, and therefore revenue is recognized when the lessee takes possession of or controls the physical use of the leased assets. In most instances this occurs on the lease commencement date. At the inception of a new lease, including new leases that arise from amendments, the Company assesses the terms and conditions of the lease to determine the proper lease classification.
The Company adopted the provisions of Accounting Standards Update (“ASU”) 2016-02, Leases (Topic 842) and related ASUs subsequently issued (collectively, “ASC 842”) as of January 1, 2019. A lease is classified as an operating lease if none of the following criteria are met: (i) ownership transfers to the lessee at the end of the lease term, (ii) the lessee has a purchase option that is reasonably expected to be exercised, (iii) the lease term is for a major part of the economic life of the leased property, (iv) the present value of the future lease payments and any residual value guaranteed by the lessee that is not already reflected in the lease payments equals or exceeds substantially all of the fair value of the leased property, and (v) the leased property is of such a specialized nature that it is expected to have no future alternative use to the Company at the end of the lease term. If one or more of these criteria are met, the lease will generally be classified as a sales-type lease, unless the lease contains a residual value guarantee from a third party other than the lessee, in which case it would be classified as a direct financing lease under certain circumstances in accordance with ASC 842.
The Company’s rental revenue primarily consists of fixed contractual base rent arising from tenant leases at the Company’s properties under operating leases. Revenue under operating leases that are deemed probable of collection, is recognized as revenue on a straight-line basis over the non-cancelable terms of the related leases. For leases that have fixed and measurable rent escalations, the difference between such rental income earned and the cash rent due under the provisions of the lease is recorded in the Consolidated Balance Sheets. The Company’s Hotel revenue consists of room revenue and food and beverage revenue. Room revenue is recognized when the related room is occupied and other hotel revenue is recognized when the service is rendered.
Certain of the Company’s contracts contain nonlease components (e.g., charges for management fees, common area maintenance, and reimbursement of third-party maintenance expenses) in addition to lease components (i.e., monthly rental charges). Services related to nonlease components are provided over the same period of time as, and billed in the same manner as, monthly rental charges. The Company elected to apply the practical expedient available under ASC 842, for all classes of assets, not to segregate the lease components from the nonlease components when accounting for operating leases. Since the lease component is the predominant component under each of these leases, combined revenues from both the lease and nonlease components are accounted for in accordance with ASC 842 and reported as rental revenues in the accompanying Consolidated Statements of Operations.
In connection with its investments, the Company has utilized loan programs designed to encourage housing development. The proceeds from these loans are governed by restrictive covenants. For certain housing development loans, so long as the Company remains in compliance with the covenants and program requirements, the loans will be forgiven in equal annual installments until the loans are discharged in full. The Company treats these loans as deferred income and records them as a component of Accounts payable, accrued expenses and other liabilities on the Company’s Consolidated Balance Sheets. As of March 31, 2020 and December 31, 2019, deferred income related to these loans amounted to $6.4 million and $6.6 million, respectively. As the loan balances are reduced during the compliance period, the Company will record income associated with the discharge of the loans as a component of Other revenue on the Consolidated Statements of Operations. For the three months ended March 31, 2020 and 2019, Other revenue related to these loans amounted to $0.2 million and $0.2 million, respectively.
Other revenues and interest income are recorded on an accrual basis.
9
Organization and Offering Expenses
Organization costs are expensed as incurred and recorded as a component of General and administrative expenses on the Company’s Consolidated Statements of Operations and offering costs are charged to equity as such amounts are incurred.
The Advisor advanced $7.3 million of organization and offering expenses on behalf of the Company (including legal, accounting, and other expenses attributable to the organization, but excluding upfront selling commissions, dealer manager fees and stockholder servicing fees) through December 21, 2019, the first anniversary of the date on which the proceeds from escrow were released. The Company reimburses the Advisor for all such advanced expenses ratably over a 60 month period following December 21, 2019. These organization and offering costs are recorded as a component of Due to affiliates on the Company’s Consolidated Balance Sheets as of March 31, 2020 and December 31, 2019.
Starwood Capital, L.L.C. (the “Dealer Manager”), a registered broker-dealer affiliated with the Advisor, serves as the dealer manager for the Offering. The Dealer Manager is entitled to receive selling commissions and dealer manager fees based on the transaction price of each applicable class of shares sold in the primary offering. The Dealer Manager is also entitled to receive a stockholder servicing fee based on the aggregate net asset value (“NAV”) of the Company’s outstanding Class T shares, Class S shares, and Class D shares.
The following table details the selling commissions, dealer manager fees, and stockholder servicing fees for each applicable share class as of March 31, 2020:
|
|
|
Common Stock Class T |
|
|
Common Stock Class S |
|
|
Common Stock Class D |
|
|
Common Stock Class I |
|
Selling commissions and dealer manager fees (% of transaction price) |
|
up to 3.5% |
|
|
up to 3.5% |
|
|
up to 1.5% |
|
|
— |
|
Stockholder servicing fee (% of NAV) |
|
0.85% |
|
|
0.85% |
|
|
0.25% |
|
|
— |
For Class S shares sold in the primary offering, investors will pay upfront selling commissions of up to 3.5% of the transaction price. For Class T shares sold in the primary offering, investors will pay upfront selling commissions of up to 3.0% of the transaction price and upfront dealer manager fees of 0.5% of the transaction price, however such amounts may vary at certain participating broker-dealers, provided that the sum will not exceed 3.5% of the transaction price. For Class D shares sold in the primary offering, investors will pay upfront selling commissions of up to 1.5% of the transaction price. Prior to February 4, 2020, no upfront selling commissions were paid on Class D shares.
The Dealer Manager is entitled to receive stockholder servicing fees of 0.85% per annum of the aggregate NAV for Class S shares and Class T shares. For Class T shares such stockholder servicing fee includes, an advisor stockholder servicing fee of 0.65% per annum, and a dealer stockholder servicing fee of 0.20% per annum, of the aggregate NAV for the Class T shares, however, with respect to Class T shares sold through certain participating broker-dealers, the advisor stockholder servicing fee and the dealer stockholder servicing fee may be other amounts, provided that the sum of such fees will always equal 0.85% per annum of the NAV of such shares. The Class D shares will incur a stockholder servicing fee equal to 0.25% per annum of the aggregate NAV for the Class D shares. There is no stockholder servicing fee with respect to Class I shares.
The Dealer Manager has entered into agreements with the selected dealers distributing the Company’s shares in the Offering, which provide, among other things, for the re-allowance of the full amount of the selling commissions and dealer manager fees received and all or a portion of the stockholder servicing fees to such selected dealers. The Company will cease paying the stockholder servicing fee with respect to any Class T share, Class S share or Class D share sold in the primary offering at the end of the month in which the total selling commissions, dealer manager fees and stockholder servicing fees paid with respect to the shares held by such stockholder within such account would exceed 8.75% (or, in the case of Class T shares sold through certain participating broker-dealers, a lower limit as set forth in any applicable agreement between the Dealer Manager and a participating broker-dealer) of the gross proceeds from the sale of such share (including the gross proceeds of any shares issued under the Company’s distribution reinvestment plan with respect thereto). The Company will accrue the full cost of the stockholder servicing fee as an offering cost at the time each Class T, Class S and Class D share is sold during the primary offering. As of March 31, 2020 and December 31, 2019, the Company had accrued $60.8 million and $44.1 million respectively, of stockholder servicing fees related to shares sold and recorded such amount as a component of Due to affiliates on the Company’s Consolidated Balance Sheets.
10
The Company intends to elect to be taxed as a REIT under the Internal Revenue Code (the “Code”), for federal income tax purposes, beginning with its taxable year ended December 31, 2019. If the Company qualifies for taxation as a REIT, it generally will not be subject to U.S. federal corporate income tax on its net taxable income that is currently distributed to its stockholders. A REIT is subject to a number of organizational and operational requirements, including a requirement that it currently distributes at least 90% of its REIT taxable income (subject to certain adjustments) to its stockholders. If the Company fails to qualify as a REIT in a taxable year, without the benefit of certain relief provisions, it will be subject to federal and state income tax on its taxable income at regular corporate tax rates. Even if the Company qualifies for taxation as a REIT, it may also be subject to certain federal, state, and local taxes on its income and assets, including (1) taxes on any undistributed income, (2) taxes related to its taxable REIT subsidiaries (“TRSs”) and (3) certain state or local income taxes.
In anticipation of the Company’s REIT election, the Company has formed wholly-owned subsidiaries to function as TRSs and filed TRS elections, together with such subsidiaries, with the Internal Revenue Service. In general, a TRS may perform additional services for the Company’s tenants and generally may engage in any real estate or non-real estate-related business other than management or operation of a lodging facility or a health care facility. The TRSs will be subject to taxation at the federal, state and local levels, as applicable, at the regular corporate tax rates. The Company accounts for applicable income taxes by utilizing the asset and liability method. As such, the Company records deferred tax assets and liabilities for the future tax consequences resulting from the difference between the carrying value of existing assets and liabilities and their respective tax basis. A valuation allowance for deferred tax assets is provided if the Company believes all or some portion of the deferred tax asset may not be realized.
For the three months ended March 31, 2020 and 2019, the Company recognized an income tax provision of $0.1 million and $0.0 million, respectively, within Other expense on the Company’s Consolidated Statements of Operations. As of March 31, 2020 and December 31, 2019, the Company recorded a deferred tax liability of $0.1 million and $0.1 million, respectively, due to its hotel investments within Other assets on the Company’s Consolidated Balance Sheets.
Net Loss per Share
Basic net loss per share is computed by dividing net loss for the period by the weighted average number of common shares outstanding during the period. All classes of common stock are allocated net loss at the same rate per share and receive the same gross distribution per share. Diluted loss per share is computed by dividing net loss for the period by the weighted average number of common shares and common share equivalents outstanding (unless their effect is antidilutive) for the period. There are no common share equivalents outstanding that would have a dilutive effect as a result of the net loss, and accordingly, the weighted average number of common shares outstanding is identical for the periods ended March 31, 2020 and 2019, for both basic and diluted shares.
The restricted stock grants of Class I shares held by the Company’s independent directors are not considered to be participating securities because they do not contain non-forfeitable rights to distributions. As a result, there is no impact of these restricted stock grants on basic and diluted net loss per common share until the restricted stock grants have fully vested.
Recent Accounting Pronouncements
In June 2016, the Financial Accounting Standards Board (the “FASB”) issued ASU 2016-13, Financial Instruments—Credit Losses (Topic 326): Measurement of Credit Losses on Financial Instruments, to amend the accounting for credit losses for certain financial instruments. Under the new guidance, an entity recognizes its estimate of expected credit losses as an allowance, which the FASB believes will result in more timely recognition of such losses. In November 2018, the FASB released ASU 2018-19, Codification Improvements to Topic 326, Financial Instruments—Credit Losses. This amendment clarifies that receivables arising from operating leases are not within the scope of Subtopic 326-20. Instead, impairment of receivables arising from operating leases should be accounted for in accordance with Subtopic 842-30, Leases—Lessor. These ASUs are effective for interim and annual reporting periods in fiscal years beginning after December 15, 2019, with early adoption permitted as of the fiscal year beginning after December 15, 2018, including adoption in an interim period. The majority of the Company’s receivables arise in the ordinary course of business from operating leases with its tenants and are therefore not subject to the guidance in Subtopic 326-20. Adopted as of January 1, 2020, the Company has determined the adoption of this guidance did not have a material effect on its consolidated financial statements.
In August 2018, the FASB issued ASU 2018-13, “Fair Value Measurement (Topic 820) – Disclosure Framework,” which adds new disclosure requirements and modifies or eliminates existing disclosure requirements of ASC 820. This ASU is effective for annual periods, and interim periods therein, beginning after December 15, 2019. The Company has determined the application of this ASU does not materially impact the Company.
11
In December 2019, the FASB issued ASU 2019-12, "Income Taxes (Topic 740): Simplifying the Accounting for Income Taxes." The amendments simplify the accounting for income taxes by removing certain exceptions to the general principles of Topic 740, "Income Taxes" and also improve consistent application by clarifying and amending existing guidance. The new standard is effective for fiscal years, and interim periods within those fiscal years, beginning after December 15, 2020. Early adoption is permitted, with the amendments to be applied on a retrospective, modified retrospective or prospective basis, depending on the specific amendment. The Company is currently evaluating the impact of adopting this guidance.
In March 2020, the FASB issued ASU 2020-04, “Reference Rate Reform (Topic 848): Facilitation of the Effects of Reference Rate Reform on Financial Reporting.” This ASU provides optional expedients for applying GAAP to contract modifications and hedging relationships, subject to meeting certain criteria that reference LIBOR or another rate that is expected to be discontinued. The amendments in the ASU are effective for all entities as of March 12, 2020 through December 31, 2022. The adoption of this guidance did not have a material impact on the Company’s consolidated financial statements.
|
3. |
Investments |
Investments in Real Estate
Investments in real estate, net consisted of the following ($ in thousands):
|
|
|
|
March 31, 2020 |
|
|
|
|
|
December 31, 2019 |
|
||
|
Building and building improvements |
|
$ |
|
2,622,792 |
|
|
|
|
$ |
|
1,455,204 |
|
|
Land and land improvements |
|
|
|
483,415 |
|
|
|
|
|
|
322,520 |
|
|
Furniture, fixtures and equipment |
|
|
|
52,779 |
|
|
|
|
|
|
46,268 |
|
|
Right of use asset - operating lease(1) |
|
|
|
101,717 |
|
|
|
|
|
|
— |
|
|
Total |
|
|
|
3,260,703 |
|
|
|
|
|
|
1,823,992 |
|
|
Accumulated depreciation |
|
|
|
(43,864 |
) |
|
|
|
|
|
(25,948 |
) |
|
Investments in real estate, net |
|
$ |
|
3,216,839 |
|
|
|
|
$ |
|
1,798,044 |
|
|
(1) |
Refer to Note 12 for additional details on the Company’s leases. |
During the three months ended March 31, 2020, the Company acquired interests in 21 properties, which were comprised of 18 multifamily properties, two office buildings and one medical office building. As of December 31, 2019, the Company acquired interests in 71 properties, which were comprised of 16 multifamily properties, eight hotel properties, 12 office buildings, 33 industrial assets and two other properties.
The following table provides further details of the properties acquired during the three months ended March 31, 2020 ($ in thousands):
|
Investment |
|
Ownership Interest |
|
Number of Properties |
|
Location |
|
Sector |
|
Acquisition Date |
|
Real Estate Acquisition (1) |
|
|
|
Southeast Affordable Housing Portfolio |
|
99.99% |
|
18 |
|
Various (2) |
|
Multifamily |
|
February 13, 2020 |
|
$ |
465,523 |
|
|
Nashville Office |
|
100% |
|
1 |
|
Nashville, TN |
|
Office |
|
February 21, 2020 |
|
|
265,404 |
|
|
Barlow Building |
|
100% |
|
1 |
|
Chevy Chase, MD |
|
Medical Office |
|
March 6, 2020 |
|
|
162,212 |
|
|
60 State St |
|
75% |
|
1 |
|
Boston, MA |
|
Office |
|
March 20, 2020 |
|
|
613,052 |
|
|
|
|
|
|
21 |
|
|
|
|
|
|
|
$ |
1,506,190 |
|
|
(1) |
Purchase price is inclusive of acquisition-related costs. |
|
(2) |
The Southeast Affordable Housing Portfolio is primarily concentrated in Orlando, FL (27% of units), Newport News, VA (14%), Tucson, AZ (10%), Jacksonville, FL (9%), Charlotte, NC (8%) and Raleigh, NC (8%). |
12
The following table summarizes the purchase price allocation for the properties acquired during the three months ended March 31, 2020 ($ in thousands):
|
|
60 State St |
|
|
Southeast Affordable Housing Portfolio |
|
|
Nashville Office |
|
|
Barlow Building |
|
|
Total |
|
||||||||||
|
Building and building improvements |
$ |
|
479,291 |
|
|
$ |
|
360,356 |
|
|
$ |
|
228,180 |
|
|
$ |
|
110,793 |
|
|
$ |
|
1,178,620 |
|
|
Land and land improvements |
|
|
472 |
|
|
|
|
88,378 |
|
|
|
|
21,636 |
|
|
|
|
31,681 |
|
|
|
|
142,167 |
|
|
Furniture, fixtures and equipment |
|
|
— |
|
|
|
|
5,886 |
|
|
|
|
— |
|
|
|
|
— |
|
|
|
|
5,886 |
|
|
Below-market ground lease(1) |
|
|
95,536 |
|
|
|
|
— |
|
|
|
|
— |
|
|
|
|
— |
|
|
|
|
95,536 |
|
|
In-place lease intangibles |
|
|
47,625 |
|
|
|
|
6,254 |
|
|
|
|
18,791 |
|
|
|
|
12,188 |
|
|
|
|
84,858 |
|
|
Above-market lease intangibles |
|
|
10,345 |
|
|
|
|
— |
|
|
|
|
410 |
|
|
|
|
5,848 |
|
|
|
|
16,603 |
|
|
Below-market lease intangibles |
|
|
(19,019 |
) |
|
|
|
— |
|
|
|
|
(4,917 |
) |
|
|
|
(510 |
) |
|
|
|
(24,446 |
) |
|
Total purchase price(2) |
$ |
|
614,250 |
|
|
$ |
|
460,874 |
|
|
$ |
|
264,100 |
|
|
$ |
|
160,000 |
|
|
$ |
|
1,499,224 |
|
|
Non-controlling interest |
|
|
(56,155 |
) |
|
|
|
— |
|
|
|
|
— |
|
|
|
|
— |
|
|
|
|
(56,155 |
) |
|
Net purchase price |
$ |
|
558,095 |
|
|
$ |
|
460,874 |
|
|
$ |
|
264,100 |
|
|
$ |
|
160,000 |
|
|
$ |
|
1,443,069 |
|
|
(1) |
The below-market ground lease value was recorded as a component of the Right of use asset – operating leases on the Consolidated Balance Sheet. Refer to Note 12 for additional details on the Company’s leases. |
|
(2) |
Purchase price does not include acquisition related costs and acquired working capital of $7.0 million. |
The weighted-average amortization periods for the acquired in-place lease intangibles, above-market lease intangibles, below-market lease intangibles and below-market ground lease for the properties acquired during the three months ended March 31, 2020 were seven years, seven years, eight years and 47 years, respectively.
The estimated future amortization on the Company’s below-market ground lease for each of the next five years and thereafter as of March 31, 2020 is as follows ($ in thousands):
|
|
|
Below-market Ground |
|
|
|
|
|
Lease |
|
|
|
2020 (remaining) |
|
$ |
1,529 |
|
|
2021 |
|
|
2,039 |
|
|
2022 |
|
|
2,039 |
|
|
2023 |
|
|
2,039 |
|
|
2024 |
|
|
2,039 |
|
|
Thereafter |
|
|
85,624 |
|
|
|
|
$ |
95,309 |
|
Investments in unconsolidated real estate ventures
On March 13, 2019, the Company entered into a joint venture (the "Joint Venture") to acquire a Fort Lauderdale hotel. The Company owns a 43% interest in the Joint Venture. The Joint Venture is accounted for using the equity method of accounting and is included in Investment in unconsolidated real estate venture in the Company’s Consolidated Balance Sheets. The Company's investment in the Joint Venture totaled $12.3 million and $12.2 million as of March 31, 2020 and December 31, 2019, respectively. The Company’s income from its investment in the Joint Venture is presented in Earnings from unconsolidated real estate ventures on the Company’s Consolidated Statements of Operations and totaled $0.4 million and $0.04 million for the three months ended March 31, 2020 and 2019, respectively.
13
The gross carrying amount and accumulated amortization of the Company’s intangible assets and liabilities consisted of the following ($ in thousands):
|
|
March 31, 2020 |
|
|
December 31, 2019 |
|
||||
|
Intangible assets: (1) |
|
|
|
|
|
|
|
|
|
|
In-place lease intangibles |
$ |
|
162,892 |
|
|
$ |
|
77,311 |
|
|
Above-market lease intangibles |
|
|
22,045 |
|
|
|
|
5,387 |
|
|
Other |
|
|
31,019 |
|
|
|
|
30,801 |
|
|
Total intangible assets |
|
|
215,956 |
|
|
|
|
113,499 |
|
|
Accumulated amortization: |
|
|
|
|
|
|
|
|
|
|
In-place lease amortization |
|
|
(24,434 |
) |
|
|
|
(12,341 |
) |
|
Above-market lease intangibles |
|
|
(709 |
) |
|
|
|
(318 |
) |
|
Other |
|
|
(1,369 |
) |
|
|
|
(635 |
) |
|
Total accumulated amortization |
|
|
(26,512 |
) |
|
|
|
(13,294 |
) |
|
Intangible assets, net |
$ |
|
189,444 |
|
|
$ |
|
100,205 |
|
|
Intangible liabilities: (2) |
|
|
|
|
|
|
|
|
|
|
Below-market lease intangibles |
$ |
|
31,440 |
|
|
$ |
|
7,032 |
|
|
Accumulated amortization |
|
|
(784 |
) |
|
|
|
(331 |
) |
|
Intangible liabilities, net |
$ |
|
30,656 |
|
|
$ |
|
6,701 |
|
|
(1) |
Included in Other assets on the Company’s Consolidated Balance Sheets. |
|
(2) |
Included in Accounts payable, accrued expenses and other liabilities on the Company’s Consolidated Balance Sheets. |
The estimated future amortization on the Company’s intangibles for each of the next five years and thereafter as of March 31, 2020 is as follows ($ in thousands):
|
|
|
In-place Lease Intangibles |
|
|
Above-market Lease Intangibles |
|
|
Other |
|
|
Below-market Lease Intangibles |
|
||||
|
2020 (remaining) |
|
$ |
23,542 |
|
|
$ |
2,846 |
|
|
$ |
2,724 |
|
|
$ |
(2,658 |
) |
|
2021 |
|
|
27,912 |
|
|
|
3,779 |
|
|
|
2,933 |
|
|
|
(3,486 |
) |
|
2022 |
|
|
21,763 |
|
|
|
3,294 |
|
|
|
2,924 |
|
|
|
(3,206 |
) |
|
2023 |
|
|
15,990 |
|
|
|
2,850 |
|
|
|
2,839 |
|
|
|
(2,950 |
) |
|
2024 |
|
|
11,462 |
|
|
|
1,859 |
|
|
|
2,825 |
|
|
|
(2,514 |
) |
|
Thereafter |
|
|
37,789 |
|
|
|
6,708 |
|
|
|
15,405 |
|
|
|
(15,842 |
) |
|
|
|
$ |
138,458 |
|
|
$ |
21,336 |
|
|
$ |
29,650 |
|
|
$ |
(30,656 |
) |
|
5. |
Investments in Real Estate-Related Securities |
The following tables detail the Company’s investments in real estate-related securities ($ in thousands):
|
|
|
|
|
|
|
March 31, 2020 |
|
|||||||||||
|
Instrument |
|
Number of Positions |
|
|
Weighted Average Coupon (1) |
|
|
Weighted Average Maturity Date (2) |
|
Cost Basis |
|
|
Fair Value |
|
||||
|
RMBS |
|
72 |
|
|
3.45% |
|
|
June 13, 1944 |
|
$ |
298,966 |
|
|
$ |
285,640 |
|
||
|
CLO |
|
8 |
|
|
6.11% |
|
|
August 15, 2031 |
|
|
25,166 |
|
|
|
17,631 |
|
||
|
CMBS |
|
4 |
|
|
4.28% |
|
|
December 22, 2036 |
|
|
11,443 |
|
|
|
11,194 |
|
||
|
|
|
|
84 |
|
|
|
|
|
|
|
|
$ |
335,575 |
|
|
$ |
314,465 |
|
14
|
|
|
|
|
|
|
December 31, 2019 |
|
|||||||||||
|
Instrument |
|
Number of Positions |
|
|
Weighted Average Coupon (1) |
|
|
Weighted Average Maturity Date (2) |
|
Cost Basis |
|
|
Fair Value |
|
||||
|
RMBS |
|
59 |
|
|
3.76% |
|
|
October 17, 1940 |
|
$ |
235,405 |
|
|
$ |
236,844 |
|
||
|
CLO |
|
12 |
|
|
6.12% |
|
|
May 11, 2031 |
|
|
29,302 |
|
|
|
29,236 |
|
||
|
CMBS |
|
4 |
|
|
3.73% |
|
|
March 13, 2037 |
|
|
11,473 |
|
|
|
11,571 |
|
||
|
|
|
|
75 |
|
|
|
|
|
|
|
|
$ |
276,180 |
|
|
$ |
277,651 |
|
|
(1) |
As of March 31, 2020, our RMBS investments had floating rate coupons ranging from 2.40% to 7.00%, our CLO securities had floating rate coupons ranging from 5.75% to 9.60% and our CMBS investments had floating rate coupons ranging from 4.07% to 5.00%. |
|
(2) |
Weighted average maturity date is based on the fully extended maturity date of the underlying collateral. |
The majority of the Company’s real estate-related securities portfolio consist of non-agency residential mortgage-backed securities (“RMBS”). The Company has also invested in collateralized loan obligations (“CLOs”) and commercial mortgage-backed securities (“CMBS”).
During the three months ended March 31, 2020, the Company recorded net unrealized and realized losses on its real estate-related securities portfolio of $22.6 million and $1.3 million, respectively. During the three months ended March 31, 2019, the Company recorded an unrealized loss of $0.1 million on its real estate-related securities portfolio. During the three months ended March 31, 2019, the Company did not sell any securities. Such amounts are recorded as a component of (Loss) income from real estate-related securities, net on the Company’s Consolidated Statements of Operations.
|
6. |
Mortgage Notes and Revolving Credit Facility |
The following table is a summary of the mortgage notes and revolving credit facility secured by the Company’s properties ($ in thousands):
|
|
|
|
|
|
|
|
|
|
|
|
|
Principal Balance Outstanding (2) |
|
|||||
|
Indebtedness |
|
Weighted Average Interest Rate(1) |
|
|
Weighted Average Maturity Date |
|
Maximum Facility Size |
|
|
March 31, 2020 |
|
|
December 31, 2019 |
|
||||
|
Fixed rate loans |
|
|
|
|
|
|
|
|
|
|
|
|
|
|
|
|
|
|
|
Fixed rate mortgages |
|
3.50% |
|
|
7/20/2029 |
|
N/A |
|
|
$ |
1,340,373 |
|
|
$ |
1,004,423 |
|
||
|
Total fixed rate loans |
|
|
|
|
|
|
|
|
|
|
|
|
1,340,373 |
|
|
|
1,004,423 |
|
|
Variable rate loans |
|
|
|
|
|
|
|
|
|
|
|
|
|
|
|
|
|
|
|
Floating rate mortgages |
|
L + 1.75% |
|
|
1/27/2025 |
|
N/A |
|
|
|
738,389 |
|
|
|
240,599 |
|
||
|
Variable rate revolving credit facility (3) |
|
L + 2.00% |
|
|
10/21/2020 |
|
$ |
200,000 |
|
|
|
172,800 |
|
|
|
— |
|
|
|
Total variable rate loans |
|
|
|
|
|
|
|
|
|
|
|
|
911,189 |
|
|
|
240,599 |
|
|
Total loans secured by the Company's properties |
|
|
|
|
|
|
|
|
|
|
|
|
2,251,562 |
|
|
|
1,245,022 |
|
|
Deferred financing costs, net |
|
|
|
|
|
|
|
|
|
|
|
|
(12,892 |
) |
|
|
(7,136 |
) |
|
Discount on assumed debt, net |
|
|
|
|
|
|
|
|
|
|
|
|
233 |
|
|
|
216 |
|
|
Mortgage notes and revolving credit facility, net |
|
|
|
|
|
|
|
|
|
|
|
$ |
2,238,903 |
|
|
$ |
1,238,102 |
|
|
(1) |
The term “L” refers to the one-month LIBOR. As of March 31, 2020, one-month LIBOR was equal to 0.99%. |
|
(2) |
The majority of the Company’s mortgages contain yield or spread maintenance provisions. |
|
(3) |
The Company’s revolving credit facility is used as bridge financing and can be drawn upon to fund the acquisition of future real estate investments. |
15
The following table presents the future principal payments under the Company’s mortgage notes and revolving credit facility as of March 31, 2020 ($ in thousands):
|
Year |
|
Amount |
|
||
|
2020 (remaining) |
|
$ |
|
175,029 |
|
|
2021 |
|
|
|
51,049 |
|
|
2022 |
|
|
|
3,235 |
|
|
2023 |
|
|
|
3,931 |
|
|
2024 |
|
|
|
213,561 |
|
|
Thereafter |
|
|
|
1,804,757 |
|
|
Total |
|
$ |
|
2,251,562 |
|
Interest paid on the Company’s mortgage notes and revolving credit facility for the three months ended March 31, 2020 and 2019 was $9.9 million and $2.2 million, respectively.
The Company’s mortgage notes and revolving credit facility may contain customary events of default and covenants, including limitations on liens and indebtedness. The Company is not aware of any instance of noncompliance with financial covenants as of March 31, 2020.
|
7. |
Repurchase Agreements |
Repurchase agreements are treated as collateralized financing transactions and are carried at their contractual amounts, including accrued interest, as specified in the respective agreements. Although structured as a sale and repurchase obligation, a repurchase agreement operates as a financing under which securities are pledged as collateral to secure a short-term loan equal in value to a specified percentage of the market value of the pledged collateral. While used as collateral, the Company retains beneficial ownership of the pledged collateral, including the right to distributions. At the maturity of a repurchase agreement, the Company is required to repay the loan and concurrently receive the pledged collateral from the lender or, with the consent of the lender, renew such agreement at the then prevailing financing rate. The Company’s repurchase agreements typically have terms of up to one month at inception.
The carrying amount of the Company’s repurchase agreements approximates fair value due to their short-term maturities or floating rate coupons. Interest rates on these borrowings are fixed based on prevailing rates corresponding to the terms of the borrowings, and interest is paid at the termination of the borrowing at which time the Company may enter into a new borrowing arrangement at prevailing market rates with the same counterparty or repay that counterparty and negotiate financing with a different counterparty.
The fair value of financial instruments pledged as collateral on the Company’s repurchase agreements disclosed in the tables below represent the Company’s fair value of such instruments, which may differ from the fair value assigned to the collateral by its counterparties.
For financial statement purposes, the Company does not offset its repurchase agreements and securities lending transactions because the conditions for netting as specified by GAAP are not met. Although not offset on the Consolidated Balance Sheets, these transactions are included in the following tables ($ in thousands):
|
|
|
|
|
|
|
March 31, 2020 |
|
|||||
|
Security Interest |
|
Weighted Average Coupon |
|
|
Collateral Assets(1) |
|
|
Outstanding Balance |
|
|||
|
RMBS |
|
2.22% |
|
|
$ |
212,050 |
|
|
$ |
182,518 |
|
|
|
CLO |
|
3.08% |
|
|
|
14,886 |
|
|
|
12,583 |
|
|
|
CMBS |
|
1.91% |
|
|
|
4,064 |
|
|
|
3,333 |
|
|
|
|
|
|
|
|
|
$ |
231,000 |
|
|
$ |
198,434 |
|
16
|
|
|
|
|
|
|
December 31, 2019 |
|
|||||
|
Security Interest |
|
Weighted Average Coupon |
|
|
Collateral Assets(1) |
|
|
Outstanding Balance |
|
|||
|
RMBS |
|
2.62% |
|
|
$ |
89,784 |
|
|
$ |
74,876 |
|
|
|
CLO |
|
4.71% |
|
|
|
7,962 |
|
|
|
6,159 |
|
|
|
|
|
|
|
|
|
$ |
97,746 |
|
|
$ |
81,035 |
|
|
(1) |
Represents the fair value of the Company’s investments in real estate-related securities. |
Interest paid on the Company’s repurchase agreements for the three months ended March 31, 2020 and 2019 was $0.7 million and $0.4 million, respectively.
|
8. |
Other Assets and Other Liabilities |
The following table summarizes the components of Other assets ($ in thousands):
|
|
|
March 31, 2020 |
|
|
December 31, 2019 |
|
||
|
Intangible assets, net |
|
$ |
189,444 |
|
|
$ |
100,205 |
|
|
Receivables |
|
|
12,476 |
|
|
|
7,763 |
|
|
Acquisition deposits |
|
|
8,807 |
|
|
|
3,050 |
|
|
Derivative instruments |
|
|
1,763 |
|
|
|
203 |
|
|
Prepaid expenses |
|
|
1,093 |
|
|
|
1,456 |
|
|
Interest receivable |
|
|
21 |
|
|
|
— |
|
|
Other |
|
|
6,241 |
|
|
|
820 |
|
|
Total |
|
$ |
219,845 |
|
|
$ |
113,497 |
|
The following table summarizes the components of Accounts payable, accrued expenses, and other liabilities ($ in thousands):
|
|
|
March 31, 2020 |
|
|
December 31, 2019 |
|
||
|
Intangible liabilities, net |
|
$ |
30,656 |
|
|
$ |
6,701 |
|
|
Accounts payable and accrued expenses |
|
|
12,119 |
|
|
|
10,188 |
|
|
Real estate taxes payable |
|
|
10,401 |
|
|
|
6,513 |
|
|
Deferred income |
|
|
9,760 |
|
|
|
6,707 |
|
|
Tenant security deposits |
|
|
6,677 |
|
|
|
3,547 |
|
|
Right of use liability - operating lease |
|
|
6,408 |
|
|
|
— |
|
|
Distributions payable |
|
|
6,191 |
|
|
|
4,216 |
|
|
Accrued interest expense |
|
|
3,882 |
|
|
|
1,993 |
|
|
Derivative instruments |
|
|
2,901 |
|
|
|
— |
|
|
Other |
|
|
12,119 |
|
|
|
8,114 |
|
|
Total |
|
$ |
101,114 |
|
|
$ |
47,979 |
|
17
Authorized Capital
The Company is authorized to issue preferred stock and four classes of common stock consisting of Class T shares, Class S shares, Class D shares, and Class I shares. The Company’s board of directors has the ability to establish the preferences and rights of each class or series of preferred stock, without stockholder approval, and as such, it may afford the holders of any series or class of preferred stock preferences, powers and rights senior to the rights of holders of common stock. The differences among the common share classes relate to upfront selling commissions, dealer manager fees and ongoing stockholder servicing fees. See Note 2 for a further description of such items. Other than the differences in upfront selling commissions, dealer manager fees and ongoing stockholder servicing fees, each class of common stock is subject to the same economic and voting rights.
As of March 31, 2020, the Company had the authority to issue 1,100,000,000 shares of capital stock, consisting of the following:
|
Classification |
|
Number of Shares |
|
|
Par Value |
|
||
|
Preferred Stock |
|
|
100,000,000 |
|
|
$ |
0.01 |
|
|
Class T Shares |
|
|
250,000,000 |
|
|
$ |
0.01 |
|
|
Class S Shares |
|
|
250,000,000 |
|
|
$ |
0.01 |
|
|
Class D Shares |
|
|
250,000,000 |
|
|
$ |
0.01 |
|
|
Class I Shares |
|
|
250,000,000 |
|
|
$ |
0.01 |
|
|
Total |
|
|
1,100,000,000 |
|
|
|
|
|
Common Stock
The following table details the movement in the Company’s outstanding shares of common stock:
|
|
|
Three months ended March 31, 2020 |
|
|||||||||||||||||
|
|
|
Class T |
|
|
Class S |
|
|
Class D |
|
|
Class I |
|
|
Total |
|
|||||
|
December 31, 2019 |
|
|
1,412,563 |
|
|
|
26,164,794 |
|
|
|
1,653,094 |
|
|
|
16,114,284 |
|
|
|
45,344,735 |
|
|
Common stock issued |
|
|
599,008 |
|
|
|
9,387,247 |
|
|
|
626,202 |
|
|
|
8,890,951 |
|
|
|
19,503,408 |
|
|
Distribution reinvestment |
|
|
9,345 |
|
|
|
236,427 |
|
|
|
16,565 |
|
|
|
126,469 |
|
|
|
388,806 |
|
|
Common stock repurchased |
|
|
(4,665 |
) |
|
|
(25,680 |
) |
|
|
(2,588 |
) |
|
|
(12,786 |
) |
|
|
(45,719 |
) |
|
March 31, 2020 |
|
|
2,016,251 |
|
|
|
35,762,788 |
|
|
|
2,293,273 |
|
|
|
25,118,918 |
|
|
|
65,191,230 |
|
Distributions
The Company generally intends to distribute substantially all of its taxable income, which does not necessarily equal net income as calculated in accordance with GAAP, to its stockholders each year to comply with the REIT provisions of the Code.
Each class of common stock receives the same gross distribution per share. The net distribution varies for each class based on the applicable stockholder servicing fee, which is deducted from the monthly distribution per share and paid directly to the applicable distributor.
The following table details the aggregate distributions declared for each applicable class of common stock for the three months ended March 31, 2020:
|
|
|
Class T |
|
|
Class S |
|
|
Class D |
|
|
Class I |
|
||||||||
|
Gross distributions declared per share of common stock |
|
$ |
|
0.3105 |
|
|
$ |
|
0.3105 |
|
|
$ |
|
0.3105 |
|
|
$ |
|
0.3105 |
|
|
Stockholder servicing fee per share of common stock |
|
|
|
(0.0454 |
) |
|
|
|
(0.0458 |
) |
|
|
|
(0.0134 |
) |
|
|
|
— |
|
|
Net distributions declared per share of common stock |
|
$ |
|
0.2651 |
|
|
$ |
|
0.2647 |
|
|
$ |
|
0.2971 |
|
|
$ |
|
0.3105 |
|
18
Redeemable Non-controlling Interest
In connection with its performance participation interest, the Special Limited Partner holds Class I units in the Operating Partnership. See Note 10 for further details of the Special Limited Partner’s performance participation interest. Because the Special Limited Partner has the ability to redeem its Class I units for cash, at the election of the Special Limited Partner, the Company has classified these Class I units as Redeemable non-controlling Interest in mezzanine equity on the Company’s Consolidated Balance Sheets. The Redeemable non-controlling Interest is recorded at the greater of the carrying amount, adjusted for its share of the allocation of income or loss and dividends, or the redemption value, which is equivalent to fair value, of such units at the end of each measurement period. As the redemption value was greater than the adjusted carrying value at March 31, 2020, the Company recorded an allocation adjustment of $0.3 million between Additional paid-in capital and Redeemable non-controlling Interest.
The following table summarizes the redeemable non-controlling interest activity for the three months ended March 31, 2020 ($ in thousands):
|
December 31, 2019 |
$ |
— |
|
|
Settlement of 2019 performance participation allocation |
|
10,366 |
|
|
GAAP income allocation |
|
(332 |
) |
|
Distributions |
|
(149 |
) |
|
Fair value allocation |
|
302 |
|
|
March 31, 2020 |
$ |
10,187 |
|
Share Repurchase Plan
The Company has adopted a share repurchase plan, whereby on a monthly basis, stockholders may request that the Company repurchase all or any portion of their shares. The Company may choose to repurchase all, some or none of the shares that have been requested to be repurchased at the end of any particular month, in its discretion, subject to any limitations in the share repurchase plan. The total amount of aggregate repurchases of Class T, Class S, Class D, and Class I shares is limited to 2% of the aggregate NAV per month and 5% of the aggregate NAV per calendar quarter. Shares are repurchased at a price equal to the transaction price on the applicable repurchase date, subject to any early repurchase deduction. Shares that have not been outstanding for at least one year are repurchased at 95% of the transaction price. Due to the illiquid nature of investments in real estate, the Company may not have sufficient liquid resources to fund repurchase requests and may elect not to repurchase some or all of the shares submitted for repurchase in a given period. Further, the Company may modify, suspend or terminate the share repurchase plan. For the three months ended March 31, 2020, the Company repurchased 45,719 shares of common stock representing a total of $1.0 million. The Company had no unfulfilled repurchase requests during the three months ended March 31, 2020.
Distribution Reinvestment Plan
The Company has adopted a distribution reinvestment plan whereby stockholders (other than clients of participating broker dealers and residents of certain states that do not permit automatic enrollment in the distribution reinvestment plan) will have their cash distributions automatically reinvested in additional shares of common stock unless they elect to receive their distributions in cash. Residents of Alabama, Arkansas, Idaho, Kansas, Kentucky, Maine, Maryland, Massachusetts, Nebraska, North Carolina, New Jersey, Ohio, Oregon and Washington and clients of participating broker-dealers that do not permit automatic enrollment in the distribution reinvestment plan will automatically receive their distributions in cash unless they elect to have their cash distributions reinvested in additional shares of the Company’s common stock. The per share purchase price for shares purchased pursuant to the distribution reinvestment plan will be equal to the transaction price before upfront selling commissions and dealer manager fees at the time the distribution is payable, which will generally be equal to the Company’s prior month’s NAV per share for that share class. Stockholders will not pay upfront selling commissions or dealer manager fees when purchasing shares pursuant to the distribution reinvestment plan. The stockholder servicing fees with respect to shares of the Company’s Class T shares, Class S shares and Class D shares are calculated based on the NAV for those shares and may reduce the NAV or, alternatively, the distributions payable with respect to shares of each such class, including shares issued in respect of distributions on such shares under the distribution reinvestment plan.
19
Acquisition of Initial Investments
On January 3, 2019, the Company acquired a multifamily property portfolio (the “Florida Multifamily Portfolio”) from an affiliate of the Advisor, for approximately $100 million, excluding closing costs. The Florida Multifamily Portfolio is a garden style multifamily portfolio totaling 1,150 units and comprised of two properties located in Jacksonville, Florida and two properties located in Naples, Florida. The affiliate of the Advisor acquired the Florida Multifamily Portfolio on October 5, 2018 from an unaffiliated third party for approximately $100 million, excluding closing costs.
On January 3, 2019, the Company acquired a multifamily property (the “Phoenix Property”) from an affiliate of the Advisor for approximately $46 million, excluding closing costs. The Phoenix Property is a garden style multifamily property totaling 256 units located in Mesa, Arizona. The affiliate of the Advisor acquired the Phoenix Property on June 29, 2018 from an unaffiliated third party for approximately $46 million, excluding closing costs.
On January 3, 2019, the Company acquired a multifamily property (the “Savannah Property”) from an affiliate of the Advisor for approximately $36 million, excluding closing costs. The Savannah Property is a new construction multifamily property located in Savannah, Georgia totaling 203 units. The affiliate of the Advisor acquired the Savannah Property on July 19, 2018 from an unaffiliated third party for approximately $36 million, excluding closing costs.
On March 20, 2020, the Company acquired a 75% interest in 60 State Street, a 911,000-square-foot office building in Boston, Massachusetts through a joint venture, between the Company and Starwood Capital Group Holdings, L.P., the Company’s sponsor (“Starwood Capital Group”). Starwood Capital Group purchased a 25% interest (the “60 State Street Membership Interests”) alongside the Company with the intent of subsequently selling it to an unaffiliated firm. Should that contemplated sale not occur, Starwood Capital Group will have the right to put the 60 State Street Membership Interests to the Company. Should Starwood Capital Group put the 60 State Street Membership Interests to the Company, the Company would acquire it at cost plus a market interest rate determined by reference to rates on comparable loans between unaffiliated parties.
Management Fee and Performance Participation Allocation
The Advisor is entitled to an annual management fee equal to 1.25% of the Company’s NAV, payable monthly as compensation for the services it provides to the Company. The management fee can be paid, at the Advisor’s election, in cash, shares of common stock, or Operating Partnership units. The Advisor waived its management fee through March 31, 2019. During the three months ended March 31, 2020, the Company incurred management fees of $3.9 million.
To date, the Advisor has elected to receive the management fee in shares of the Company’s common stock. The Company issued 114,818 unregistered Class I shares to the Advisor as payment for the management fee and also had a payable of $1.5 million related to the management fee as of March 31, 2020, which is included in Due to affiliates on the Company’s Consolidated Balance Sheets. During April 2020, the Advisor was issued 68,906 unregistered Class I shares as payment for the $1.5 million management fee accrued as of March 31, 2020. The shares issued to the Advisor for payment of the management fee were issued at the applicable NAV per share at the end of each month for which the fee was earned.
Additionally, the Special Limited Partner, an affiliate of the Advisor, holds a performance participation interest in the Operating Partnership that entitles it to receive an allocation of the Operating Partnership’s total return to its capital account. Total return is defined as distributions paid or accrued plus the change in NAV. Under the Operating Partnership agreement, the annual total return will be allocated solely to the Special Limited Partner after the other unit holders have received a total return of 5% (after recouping any loss carryforward amount) and such allocation will continue until the allocation between the Special Limited Partner and all other unit holders is equal to 12.5% and 87.5%, respectively. Thereafter, the Special Limited Partner will receive an allocation of 12.5% of the annual total return. The annual distribution of the performance participation interest will be paid in cash or Class I units of the Operating Partnership, at the election of the Special Limited Partner. During the three months ended March 31, 2020 and March 31, 2019, the Company recognized $46,000 and $0.9 million, respectively of performance participation allocation in the Company’s Consolidated Statements of Operations.
The 2019 performance participation allocation became payable on December 31, 2019 and, in January 2020, the Company issued 480,539 Class I units in the Operating Partnership to the Special Limited Partner as payment for the 2019 performance participation allocation. Such Class I units were issued at the NAV per unit as of December 31, 2019.
20
The following table details the components of Due to affiliates ($ in thousands):
|
|
|
March 31, 2020 |
|
|
December 31, 2019 |
|
||
|
Accrued stockholder servicing fee |
|
$ |
60,816 |
|
|
$ |
44,086 |
|
|
Advanced organization and offering costs |
|
|
6,923 |
|
|
|
7,290 |
|
|
Performance participation allocation |
|
|
46 |
|
|
|
10,366 |
|
|
Accrued management fee |
|
|
1,461 |
|
|
|
1,037 |
|
|
Accrued affiliate service provider expenses |
|
|
246 |
|
|
|
112 |
|
|
Advanced operating expenses |
|
|
461 |
|
|
|
450 |
|
|
Total |
|
$ |
69,953 |
|
|
$ |
63,341 |
|
Accrued stockholder servicing fee
As described in Note 2, the Company accrues the full amount of the future stockholder servicing fees payable to the Dealer Manager for Class T, Class S, and Class D shares up to the 8.75% limit at the time such shares are sold. As of March 31, 2020 and December 31, 2019, the Company has accrued $60.8 million and $44.1 million, respectively, of stockholder servicing fees payable to the Dealer Manager related to the Class T, Class S shares and Class D shares sold. The Dealer Manager has entered into agreements with the selected dealers distributing the Company’s shares in the Offering, which provide, among other things, for the re-allowance of the full amount of the selling commissions and dealer manager fee and all or a portion of the stockholder servicing fees received by the Dealer Manager to such selected dealers.
Advanced organization and offering costs
The Advisor and its affiliates have incurred $7.3 million, respectively, of organization and offering costs (excluding upfront selling commissions, dealer manager fees and stockholder servicing fees) on behalf of the Company through December 21, 2019. Such amounts are being reimbursed to the Advisor ratably over 60 months, which commenced in January 2020.
Accrued affiliate service provider expenses
The Company has engaged and expects to continue to engage Highmark Residential (formerly Milestone Management), a portfolio company owned by an affiliate of Starwood Capital Group, to provide day-to-day operational and management services (including leasing, construction management, revenue management, accounting, legal and contract management, expense management, and capital expenditure projects and transaction support services) for a portion of the Company’s multifamily properties. The cost for such services is a percentage of the gross receipts and project costs respectively (which will be reviewed periodically and adjusted if appropriate), plus actual costs allocated for transaction support services. During the three months ended March 31, 2020 and 2019, the Company has incurred approximately $0.5 million and $0.1 million, respectively, of expenses due to Highmark Residential services in connection with its investments and such amount is included in Rental property operating expenses on the Company’s Consolidated Statements of Operations.
Advanced operating expenses
As of March 31, 2020 and December 31, 2019, the Advisor had advanced approximately $0.1 million and $0.1 million, respectively, of expenses on the Company’s behalf for general corporate expenses provided by unaffiliated third parties. Such amounts are being reimbursed to the Advisor ratably over a 60 month period, which commenced in January 2020.
As of March 31, 2020 and December 31, 2019, the Advisor had advanced approximately $0.2 million and $0.3 million, respectively, of expenses on the Company’s behalf for general corporate expenses. Such amounts are being reimbursed to the Advisor one month in arrears.
Affiliate service provider expenses
The Company has engaged Rinaldi, Finkelstein & Franklin L.L.C. (“RFF”), a law firm owned and controlled by Ellis F. Rinaldi, Co-General Counsel and Senior Managing Director of Starwood Capital Group and certain of its affiliates, to provide corporate legal support services to the Company. For the three months ended March 31, 2020 and 2019, the amounts incurred for services provided by RFF was $0.1 million and $0 million, respectively.
21
As of March 31, 2020 and December 31, 2019, the Company is not subject to any material litigation nor is the Company aware of any material litigation threatened against it.
|
12. |
Leases |
Lessee
Certain of the Company’s investments in real estate are subject to a ground lease. The Company’s ground lease is classified as an operating lease based on the characteristics of the lease. The ground lease was acquired as part of the acquisition of real estate and no incremental costs were incurred for such ground lease. The Company’s ground lease is non-cancelable and does not contain any additional renewal options.
The following table presents the future lease payments due under the Company’s ground lease as of March 31, 2020 ($ in thousands):
|
|
|
Operating Leases |
|
|
|
2020 (remaining) |
|
$ |
299 |
|
|
2021 |
|
|
399 |
|
|
2022 |
|
|
399 |
|
|
2023 |
|
|
399 |
|
|
2024 |
|
|
399 |
|
|
Thereafter |
|
|
16,753 |
|
|
Total undiscounted future lease payments |
|
|
18,648 |
|
|
Difference between undiscounted cash flows and discounted cash flows |
|
|
12,240 |
|
|
Total lease liability |
|
$ |
6,408 |
|
The Company utilized its incremental borrowing rate of 6% to determine its lease liabilities. As of March 31, 2020, the weighted average remaining lease term of the Company’s operating lease was 47 years.
Payments under the Company’s ground lease contain fixed payment components. The Company’s ground lease contained escalations prior to our hold period.
Lessor
The Company’s rental revenue primarily consists of rent earned from operating leases at the Company’s multifamily, industrial, office and medical office properties. Leases at the Company’s industrial and office properties generally include a fixed base rent and certain leases also contain a variable component. The variable component of the Company’s operating leases at its industrial, office and medical office properties primarily consist of the reimbursement of operating expenses such as real estate taxes, insurance, and common area maintenance costs.
Leases at the Company’s industrial, office and medical office properties are generally longer term and may contain extension and termination options at the lessee’s election. The Company’s rental revenue earned from leases at the Company’s multifamily properties primarily consists of a fixed base rent and certain leases contain a variable component that allows for the pass-through of certain operating expenses such as utilities. Leases at the Company’s multifamily properties are short term in nature, generally not greater than 12 months in length.
The following table summarizes the fixed and variable components of the Company’s operating leases ($ in thousands):
|
|
|
Three Months Ended March 31, |
|
|||||
|
|
|
2020 |
|
|
2019 |
|
||
|
Fixed lease payments |
|
$ |
40,603 |
|
|
$ |
4,038 |
|
|
Variable lease payments |
|
|
5,862 |
|
|
|
272 |
|
|
Rental revenue |
|
$ |
46,465 |
|
|
$ |
4,310 |
|
22
The following table presents the undiscounted future minimum rents the Company expects to receive for its industrial, office and medical office properties ($ in thousands). Leases at the Company’s multifamily properties are short term, generally 12 months or less, and are therefore not included.
|
Year |
|
Future Minimum Rents |
|
|
|
2020 (remaining) |
|
$ |
90,023 |
|
|
2021 |
|
|
113,170 |
|
|
2022 |
|
|
101,612 |
|
|
2023 |
|
|
91,114 |
|
|
2024 |
|
|
79,129 |
|
|
Thereafter |
|
|
364,007 |
|
|
Total |
|
$ |
839,055 |
|
|
13. |
Segment Reporting |
The Company operates in six reportable segments: Multifamily properties, Hotel properties, Industrial properties, Office properties, Medical office properties and Real estate-related securities. The Company allocates resources and evaluates results based on the performance of each segment individually. The Company believes that segment net operating income is the key performance metric that captures the unique operating characteristics of each segment.
The following table sets forth the total assets by segment ($ in thousands):
|
|
March 31, 2020 |
|
|
December 31, 2019 |
|
||||
|
Multifamily |
$ |
|
1,486,914 |
|
|
$ |
|
1,038,777 |
|
|
Hotel |
|
|
252,828 |
|
|
|
|
253,273 |
|
|
Industrial |
|
|
324,894 |
|
|
|
|
330,110 |
|
|
Office |
|
|
1,215,375 |
|
|
|
|
303,396 |
|
|
Medical office |
|
|
202,589 |
|
|
|
|
39,143 |
|
|
Real estate-related securities |
|
|
314,465 |
|
|
|
|
277,651 |
|
|
Other (Corporate) |
|
|
121,820 |
|
|
|
|
147,972 |
|
|
Total assets |
$ |
|
3,918,885 |
|
|
$ |
|
2,390,322 |
|
23
The following table sets forth the financial results by segment for the three months ended March 31, 2020 ($ in thousands):
|
|
Multifamily |
|
|
Hotel |
|
|
Industrial |
|
|
Office |
|
|
Medical Office |
|
|
Real Estate- Related Securities |
|
|
Total |
|
||||||||||||||
|
Revenues: |
|
|
|
|
|
|
|
|
|
|
|
|
|
|
|
|
|
|
|
|
|
|
|
|
|
|
|
|
|
|
|
|
|
|
|
Rental revenue |
$ |
|
25,114 |
|
|
$ |
|
— |
|
|
$ |
|
6,688 |
|
|
$ |
|
12,813 |
|
|
$ |
|
1,850 |
|
|
$ |
|
— |
|
|
$ |
|
46,465 |
|
|
Hotel revenue |
|
|
— |
|
|
|
|
10,215 |
|
|
|
|
— |
|
|
|
|
— |
|
|
|
|
— |
|
|
|
|
— |
|
|
|
|
10,215 |
|
|
Other revenue |
|
|
262 |
|
|
|
|
74 |
|
|
|
|
— |
|
|
|
|
11 |
|
|
|
|
10 |
|
|
|
|
— |
|
|
|
|
357 |
|
|
Total revenues |
|
|
25,376 |
|
|
|
|
10,289 |
|
|
|
|
6,688 |
|
|
|
|
12,824 |
|
|
|
|
1,860 |
|
|
|
|
— |
|
|
|
|
57,037 |
|
|
Expenses: |
|
|
|
|
|
|
|
|
|
|
|
|
|
|
|
|
|
|
|
|
|
|
|
|
|
|
|
|
|
|
|
|
|
|
|
Rental property operating |
|
|
8,940 |
|
|
|
|
— |
|
|
|
|
1,716 |
|
|
|
|
4,326 |
|
|
|
|
562 |
|
|
|
|
— |
|
|
|
|
15,544 |
|
|
Hotel operating |
|
|
— |
|
|
|
|
5,964 |
|
|
|
|
— |
|
|
|
|
— |
|
|
|
|
— |
|
|
|
|
— |
|
|
|
|
5,964 |
|
|
Total segment expenses |
|
|
8,940 |
|
|
|
|
5,964 |
|
|
|
|
1,716 |
|
|
|
|
4,326 |
|
|
|
|
562 |
|
|
|
|
— |
|
|
|
|
21,508 |
|
|
Loss from real estate-related securities, net |
|
|
— |
|
|
|
|
— |
|
|
|
|
— |
|
|
|
|
— |
|
|
|
|
— |
|
|
|
|
(20,173 |
) |
|
|
|
(20,173 |
) |
|
Earnings from unconsolidated real estate ventures |
|
|
— |
|
|
|
|
360 |
|
|
|
|
— |
|
|
|
|
— |
|
|
|
|
— |
|
|
|
|
— |
|
|
|
|
360 |
|
|
Segment net operating income (loss) |
$ |
|
16,436 |
|
|
$ |
|
4,685 |
|
|
$ |
|
4,972 |
|
|
$ |
|
8,498 |
|
|
$ |
|
1,298 |
|
|
$ |
|
(20,173 |
) |
|
$ |
|
15,716 |
|
|
Depreciation and amortization |
$ |
|
(16,790 |
) |
|
$ |
|
(2,078 |
) |
|
$ |
|
(4,164 |
) |
|
$ |
|
(6,781 |
) |
|
$ |
|
(730 |
) |
|
$ |
|
— |
|
|
$ |
|
(30,543 |
) |
|
|
|
|
|
|
|
|
|
|
|
|
|
|
|
|
|
|
|
|
|
|
|
|
|
|
|
|
|
|
|
|
|
|
|
|
|
General and administrative |
|
|
|
|
|
|
|
|
|
|
|
|
|
|
|
|
|
|
|
|
|
|
|
|
|
|
|
|
|
|
|
|
(2,358 |
) |
|
Management fees |
|
|
|
|
|
|
|
|
|
|
|
|
|
|
|
|
|
|
|
|
|
|
|
|
|
|
|
|
|
|
|
|
(3,946 |
) |
|
Performance participation allocation |
|
|
|
|
|
|
|
|
|
|
|
|
|
|
|
|
|
|
|
|
|
|
|
|
|
|
|
|
|
|
|
|
(46 |
) |
|
Interest income |
|
|
|
|
|
|
|
|
|
|
|
|
|
|
|
|
|
|
|
|
|
|
|
|
|
|
|
|
|
|
|
|
303 |
|
|
Interest expense |
|
|
|
|
|
|
|
|
|
|
|
|
|
|
|
|
|
|
|
|
|
|
|
|
|
|
|
|
|
|
|
|
(19,641 |
) |
|
Other expense |
|
|
|
|
|
|
|
|
|
|
|
|
|
|
|
|
|
|
|
|
|
|
|
|
|
|
|
|
|
|
|
|
(132 |
) |
|
Net loss |
|
|
|
|
|
|
|
|
|
|
|
|
|
|
|
|
|
|
|
|
|
|
|
|
|
|
|
|
|
|
$ |
|
(40,647 |
) |
|
Net loss attributable to non- controlling interests in consolidated joint ventures |
|
|
|
|
|
|
|
|
|
|
|
|
|
|
|
|
|
|
|
|
|
|
|
|
|
|
|
|
|
|
|
|
638 |
|
|
Net loss attributable to non- controlling interests in Operating Partnership |
|
|
|
|
|
|
|
|
|
|
|
|
|
|
|
|
|
|
|
|
|
|
|
|
|
|
|
|
|
|
|
|
332 |
|
|
Net loss attributable to stockholders |
|
|
|
|
|
|
|
|
|
|
|
|
|
|
|
|
|
|
|
|
|
|
|
|
|
|
|
|
|
|
$ |
|
(39,677 |
) |
24
The following table sets forth the financial results by segment for the three months ended March 31, 2019 ($ in thousands):
|
|
Multifamily |
|
|
Hotel |
|
|
Real Estate- Related Securities |
|
|
Total |
|
||||||||
|
Revenues: |
|
|
|
|
|
|
|
|
|
|
|
|
|
|
|
|
|
|
|
|
Rental revenue |
$ |
|
4,310 |
|
|
$ |
|
— |
|
|
$ |
|
— |
|
|
$ |
|
4,310 |
|
|
Hotel revenue |
|
|
— |
|
|
|
|
10,852 |
|
|
|
|
— |
|
|
|
|
10,852 |
|
|
Other revenue |
|
|
199 |
|
|
|
|
54 |
|
|
|
|
— |
|
|
|
|
253 |
|
|
Total revenues |
|
|
4,509 |
|
|
|
|
10,906 |
|
|
|
|
— |
|
|
|
|
15,415 |
|
|
Expenses: |
|
|
|
|
|
|
|
|
|
|
|
|
|
|
|
|
|
|
|
|
Rental property operating |
|
|
1,762 |
|
|
|
|
— |
|
|
|
|
— |
|
|
|
|
1,762 |
|
|
Hotel operating |
|
|
— |
|
|
|
|
5,503 |
|
|
|
|
— |
|
|
|
|
5,503 |
|
|
Total segment expenses |
|
|
1,762 |
|
|
|
|
5,503 |
|
|
|
|
— |
|
|
|
|
7,265 |
|
|
Income from real estate-related securities, net |
|
|
— |
|
|
|
|
— |
|
|
|
|
102 |
|
|
|
|
102 |
|
|
Earnings from unconsolidated real estate ventures |
|
|
— |
|
|
|
|
43 |
|
|
|
|
— |
|
|
|
|
43 |
|
|
Segment net operating income |
$ |
|
2,747 |
|
|
$ |
|
5,446 |
|
|
$ |
|
102 |
|
|
$ |
|
8,295 |
|
|
Depreciation and amortization |
$ |
|
(3,304 |
) |
|
$ |
|
(2,054 |
) |
|
$ |
|
— |
|
|
$ |
|
(5,358 |
) |
|
|
|
|
|
|
|
|
|
|
|
|
|
|
|
|
|
|
|
|
|
|
General and administrative |
|
|
|
|
|
|
|
|
|
|
|
|
|
|
|
|
|
(912 |
) |
|
Management fees |
|
|
|
|
|
|
|
|
|
|
|
|
|
|
|
|
|
— |
|
|
Performance participation allocation |
|
|
|
|
|
|
|
|
|
|
|
|
|
|
|
|
|
(857 |
) |
|
Interest income |
|
|
|
|
|
|
|
|
|
|
|
|
|
|
|
|
|
58 |
|
|
Interest expense |
|
|
|
|
|
|
|
|
|
|
|
|
|
|
|
|
|
(3,598 |
) |
|
Other expense |
|
|
|
|
|
|
|
|
|
|
|
|
|
|
|
|
|
(96 |
) |
|
Net loss |
|
|
|
|
|
|
|
|
|
|
|
|
|
|
|
$ |
|
(2,468 |
) |
|
Net loss attributable to non-controlling interests in consolidated joint ventures |
|
|
|
|
|
|
|
|
|
|
|
|
|
|
|
|
|
— |
|
|
Net loss attributable to stockholders |
|
|
|
|
|
|
|
|
|
|
|
|
|
|
|
$ |
|
(2,468 |
) |
|
14. |
Subsequent Events |
Acquisition
On May 5, 2020, Starwood Capital Group assigned 42.4% of the 60 State Street Membership Interests to the Company for $25 million plus interest. The assignment conveyed a 10.6% ownership interest in the property located at 60 State Street.
Dispositions
Subsequent to March 31, 2020, the Company sold $30.1 million of real estate-related securities.
COVID-19 Outbreak
In December 2019, a novel strain of coronavirus (“COVID-19”) emerged in Wuhan, Hubei Province, China. While initially the outbreak was largely concentrated in China and caused significant disruptions to its economy, it has now spread to several other countries and infections have been reported globally. The World Health Organization has declared the COVID-19 outbreak a pandemic, and the Health and Human Services Secretary has declared a public health emergency in the United States in response to the outbreak. Due to the fact the Company’s property portfolio is comprised entirely of real property located in the United States, COVID-19 will impact the Company’s operating results to the extent that its continued spread reduces occupancy, negatively impacts the ability to obtain necessary goods and services or provide adequate staffing, increases the cost of operation or results in limited hours or necessitates the closure of the Company’s properties. The extent to which COVID-19 impacts the Company’s operations will depend on future developments, which are highly uncertain and cannot be predicted with confidence, including the duration of the outbreak, new information that may emerge concerning the severity of COVID-19 and the actions taken to contain COVID-19 or treat its impact, among others. At this time, the Company is unable to estimate the impact of this event on its operations.
Status of the Offering
As of May 12, 2020, the Company had sold an aggregate of 68,348,980 shares of its common stock (consisting of 2,201,323 Class T shares, 37,802,137 Class S shares, 2,446,295 Class D shares, and 25,899,225 Class I shares) in the Offering resulting in net proceeds of approximately $1.4 billion to the Company as payment for such shares.
25
References herein to "Starwood Real Estate Income Trust, Inc.", "Company," "we," "us," or "our" refer to Starwood Real Estate Income Trust, Inc. and its subsidiaries unless the context specifically requires otherwise.
The following discussion should be read in conjunction with the unaudited consolidated financial statements and notes thereto appearing elsewhere in this Quarterly Report on Form 10-Q. In addition to historical data, this discussion contains forward-looking statements about our business, operations and financial performance based on current expectations that involve risks, uncertainties and assumptions. Our actual results may differ materially from those in this discussion as a result of various factors, including but not limited to those discussed under "Item 1A. Risk Factors" in our Annual Report on Form 10-K filed with the Securities and Exchange Commission (the “SEC”) on March 20, 2020 and elsewhere in this Quarterly Report on Form 10-Q. We do not undertake to revise or update any forward-looking statements.
Forward-Looking Statements
This Quarterly Report on Form 10-Q contains forward-looking statements within the meaning of Section 27A of the Securities Act of 1933, as amended (the “Securities Act”), and Section 21E of the Exchange Act of 1934, as amended (the “Exchange Act”). Forward-looking statements include statements about our business, including, in particular, statements about our plans, strategies and objectives. Forward-looking statements can generally be identified by our use of forward-looking terminology such as “may,” “will,” “expect,” “intend,” “anticipate,” “estimate,” “believe,” “continue” or other similar words. These statements include our plans and objectives for future operations, including plans and objectives relating to future growth and availability of funds, and are based on current expectations that involve numerous risks and uncertainties. Assumptions relating to these statements involve judgments with respect to, among other things, future economic, competitive and market conditions and future business decisions, all of which are difficult or impossible to accurately predict and many of which are beyond our control.
Although we believe the assumptions underlying the forward-looking statements, and the forward-looking statements themselves, are reasonable, any of the assumptions could be inaccurate and, therefore, there can be no assurance that these forward-looking statements will prove to be accurate and our actual results, performance and achievements may be materially different from that expressed or implied by these forward-looking statements. In light of the significant uncertainties inherent in these forward looking statements, the inclusion of this information should not be regarded as a representation by us or any other person that our objectives and plans, which we consider to be reasonable, will be achieved.
You should carefully review Item 1A. Risk Factors in our Annual Report on Form 10-K for the year ended December 31, 2019, and elsewhere in this Quarterly Report on Form 10-Q for a discussion of the risks and uncertainties that we believe are material to our business, operating results, prospects and financial condition. Except as otherwise required by federal securities laws, we do not undertake to publicly update or revise any forward-looking statements, whether as a result of new information, future events or otherwise.
Overview
We were formed on June 22, 2017 as a Maryland corporation to invest primarily in stabilized, income-oriented commercial real estate and debt secured by commercial real estate. Our portfolio principally will be comprised of properties, and debt secured by properties, located in the United States, but may also be diversified on a global basis through investments in properties and debt secured by properties, outside of the United States, with a focus on Europe. We are an externally advised, perpetual-life REIT and intend to make an election to be taxed as a REIT for federal income tax purposes. We plan to own all or substantially all of our assets through the Operating Partnership, of which we are the sole partner. We and the Operating Partnership are externally managed by the Advisor.
Our board of directors will at all times have oversight and policy-making authority over us, including responsibility for governance, financial controls, compliance and disclosure. Pursuant to an advisory agreement among the Advisor the Operating Partnership and us (the “Advisory Agreement”), we have delegated to the Advisor the authority to source, evaluate and monitor our investment opportunities and make decisions related to the acquisition, management, financing and disposition of our assets, in accordance with our investment objectives, guidelines, policies and limitations, subject to oversight by our board of directors.
We intend to make an election to be taxed as a REIT under the Code for U.S. federal income tax purposes, commencing with our taxable year ended December 31, 2019. We generally will not be subject to U.S. federal income taxes on our taxable income to the extent we annually distribute all of our net taxable income to stockholders and maintain our qualification as a REIT.
26
We have registered with the SEC an Offering of up to $5.0 billion in shares of our common stock (in any combination of purchases of Class T, Class S, Class D and Class I shares of our common stock), consisting of up to $4.0 billion in shares in our primary offering and up to $1.0 billion in shares pursuant to our distribution reinvestment plan. The share classes have different upfront selling commissions and ongoing stockholder servicing fees. As of December 21, 2018, we satisfied the minimum offering requirement and our board of directors authorized the release of proceeds from escrow. We intend to continue selling shares in the Offering on a monthly basis.
As of May 12, 2020, we had received net proceeds of $1.4 billion from selling an aggregate of 68,348,980 shares of our common stock (consisting of 2,201,323 Class T shares, 37,802,137 Class S shares, 2,446,295 Class D shares, and 25,899,225 Class I shares). We have contributed the net proceeds from the Offering to the Operating Partnership in exchange for a corresponding number of Class T, Class S, Class D and Class I units. The Operating Partnership has primarily used the net proceeds to make investments in real estate and real estate-related securities as further described below under “Portfolio.”
We are not aware of any material trends or uncertainties, favorable or unfavorable, other than national economic conditions and COVID-19 affecting real estate generally that may be reasonably anticipated to have a material impact on either capital resources or the revenues or income to be derived from acquiring properties or real estate-related securities, other than those disclosed in Item 1A. Risk Factors in our Annual Report on Form 10-K for the year ended December 31, 2019, and elsewhere in this Quarterly Report on Form 10-Q.
Q1 2020 Highlights
Operating Results:
|
|
• |
Raised $418.1 million of proceeds in the Offering during the three months ended March 31, 2020. |
|
|
• |
Declared monthly net distributions totaling $16.4 million for the three months ended March 31, 2020. As of March 31, 2020 the annualized net distribution rate was 4.9% for Class S, 4.9% for Class T, 5.5% for Class D and 5.7% for Class I shares. |
|
|
• |
Inception through March 31, 2020 annualized total return, without upfront selling commissions and dealer manager fees, was 9.5% for Class S, 9.0% for Class T, 9.7% for Class D and 10.3% for Class I shares. Inception to date annualized total return assuming full upfront selling commissions and dealer manager fees was 6.6% for Class S, 6.1% for Class T and 8.5% for Class D shares. |
Investments:
|
|
• |
In February 2020, we acquired a fee-simple interest in an affordable housing multifamily portfolio (the “Southeast Affordable Housing Portfolio”) for $460.9 million, excluding closing costs. The Southeast Affordable Housing Portfolio is comprised of 18 separate multifamily communities with a total of 3,336 units. The Southeast Affordable Housing Portfolio had an occupancy of 96% as of the acquisition date. |
|
|
• |
In February 2020, we acquired a 362,000 square foot class A office tower (the “Nashville Office”) located in downtown Nashville, Tennessee for $264.1 million, excluding closing costs. |
|
|
• |
In March 2020, we acquired a 294,000 square foot institutional quality medical office building (the “Barlow Building”) in Chevy Chase, Maryland for $160.0 million, excluding closing costs. |
|
|
• |
In March 2020, through a joint venture with an affiliate of our Sponsor, we acquired a leasehold interest in 60 State Street (“60 State”), a 38-story Class A office tower located in the heart of downtown Boston, Massachusetts. The purchase price for 60 State was $614.3 million, excluding closing costs. 60 State totals 911,394 square feet along with a 240-space subterranean parking garage. |
|
|
• |
Our properties as of March 31, 2020 consisted of Multifamily (44% based on fair value), Office (34%), Industrial (9%), Hotel (7%) and Medical Office (6%) and were concentrated in the following regions: East (41%), South (31%), Midwest (18%) and West (10%). Our allocation to Office assets increased during the quarter, up from 16% in the prior quarter. Our allocation to Multifamily assets decreased during the quarter, down from 54% in the prior quarter. |
|
|
• |
We made investments in real estate-related securities with a total cost basis of $65.8 million during the three months ended March 31, 2020. |
Financings:
|
|
• |
During the three months ended March 31, 2020, we closed an aggregate of $1.0 billion in property-level financing. |
27
Summary of Portfolio
The following chart outlines the percentage of our investments in real properties and investments in real estate-related securities based on fair value as of March 31, 2020:
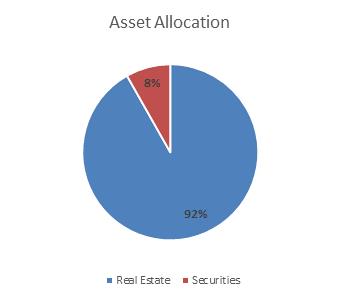
The following charts further describe the composition of our investments in real properties based on fair value as of March 31, 2020:
|
|
|
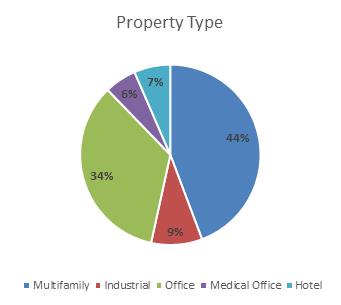
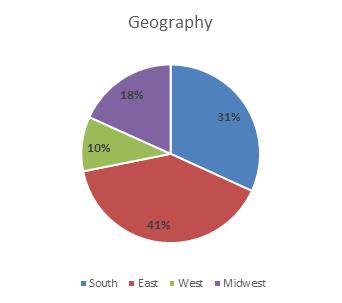
28
As of March 31, 2020, we had acquired 92 investments in real estate and one investment in an unconsolidated real estate venture with an aggregate purchase price of approximately $3.4 billion, excluding closing costs and related working capital. The following table provides a summary of our portfolio as of and for the three months ended March 31, 2020:
|
Segment |
|
Number of Properties |
|
Sq. Feet (in millions) / Number of Units/Keys |
|
Occupancy Rate (1) |
|
|
Gross Asset Value (2) ($ in thousands) |
|
|
Segment Revenue |
|
|
Percentage of Segment Revenue |
|
|||
|
Multifamily |
|
34 |
|
8,243 units |
|
95% |
|
|
$ |
1,558,921 |
|
|
$ |
25,376 |
|
|
45% |
|
|
|
Hotel |
|
9 |
|
1,293 keys |
|
69% |
|
|
|
229,016 |
|
|
|
10,289 |
|
|
18% |
|
|
|
Industrial |
|
33 |
|
4.07 sq. ft. |
|
98% |
|
|
|
322,523 |
|
|
|
6,688 |
|
|
12% |
|
|
|
Office |
|
14 |
|
2.86 sq. ft. |
|
93% |
|
|
|
1,209,334 |
|
|
|
12,824 |
|
|
22% |
|
|
|
Medical office |
|
3 |
|
0.39 sq. ft. |
|
94% |
|
|
|
201,322 |
|
|
|
1,860 |
|
|
3% |
|
|
|
Total |
|
93 |
|
|
|
|
|
|
|
$ |
3,521,116 |
|
|
$ |
57,037 |
|
|
100% |
|
|
(1) |
The occupancy rate is as of March 31, 2020 for non-hotels. The occupancy rate for our hotel investments is the average occupancy rate for the three months ended March 31, 2020. |
|
(2) |
Based on fair value as of March 31, 2020. |
Real Estate
The following table provides information regarding our portfolio of real properties as of March 31, 2020:
|
Segment and Investment |
|
Number of Properties |
|
Location |
|
Acquisition Date |
|
Ownership Interest (1) |
|
|
Purchase Price (in millions)(2) |
|
|
Sq. Feet (in millions) / Number of Units/Keys |
|
|
Occupancy(3) |
|
||||
|
Multifamily: |
|
|
|
|
|
|
|
|
|
|
|
|
|
|
|
|
|
|
|
|
|
|
|
Florida Multifamily Portfolio |
|
4 |
|
Jacksonville/Naples, FL |
|
January 2019 |
|
100% |
|
|
$ |
99.6 |
|
|
|
1,150 |
|
|
98% |
|
||
|
Phoenix Property |
|
1 |
|
Mesa, AZ |
|
January 2019 |
|
100% |
|
|
|
45.8 |
|
|
|
256 |
|
|
95% |
|
||
|
Savannah Property |
|
1 |
|
Savannah, GA |
|
January 2019 |
|
100% |
|
|
|
36.2 |
|
|
|
203 |
|
|
94% |
|
||
|
Concord Park Apartments |
|
1 |
|
Fort Meade, MD |
|
July 2019 |
|
100% |
|
|
|
86.7 |
|
|
|
335 |
|
|
95% |
|
||
|
Columbus Multifamily |
|
4 |
|
Columbus, OH |
|
September/October 2019 |
|
96% |
|
|
|
201.7 |
|
|
|
1,012 |
|
|
92% |
|
||
|
Cascades Apartments |
|
1 |
|
Charlotte, NC |
|
October 2019 |
|
100% |
|
|
|
109.6 |
|
|
|
570 |
|
|
94% |
|
||
|
Thornton Apartments |
|
1 |
|
Alexandria, VA |
|
October 2019 |
|
100% |
|
|
|
180.2 |
|
|
|
439 |
|
|
89% |
|
||
|
Exchange on Erwin |
|
1 |
|
Durham, NC |
|
November 2019 |
|
100% |
|
|
|
74.5 |
|
|
|
265 |
|
|
97% |
|
||
|
The Griffin |
|
1 |
|
Scottsdale, AZ |
|
December 2019 |
|
100% |
|
|
|
96.2 |
|
|
|
277 |
|
|
87% |
|
||
|
Avida Apartments |
|
1 |
|
Salt Lake City, UT |
|
December 2019 |
|
100% |
|
|
|
86.7 |
|
|
|
400 |
|
|
91% |
|
||
|
Southeast Affordable Housing Portfolio |
|
18 |
|
Various |
|
February 2020 |
|
99.9% |
|
|
|
460.9 |
|
|
|
3,336 |
|
|
95% |
|
||
|
Total Multifamily |
|
34 |
|
|
|
|
|
|
|
|
|
|
1,478.1 |
|
|
|
8,243 |
|
|
|
|
|
|
Hotel: |
|
|
|
|
|
|
|
|
|
|
|
|
|
|
|
|
|
|
|
|
|
|
|
U.S. Select Service Portfolio |
|
8 |
|
FL, CO, TN, OH, AR |
|
January 2019 |
|
100% |
|
|
|
229.0 |
|
|
1,057 |
|
|
67% |
|
|||
|
Fort Lauderdale Hotel (4) |
|
1 |
|
Fort Lauderdale, FL |
|
March 2019 |
|
43% |
|
|
|
12.3 |
|
|
236 |
|
|
76% |
|
|||
|
Total Hotel |
|
9 |
|
|
|
|
|
|
|
|
|
|
241.3 |
|
|
1,293 |
|
|
|
|
|
|
|
Office: |
|
|
|
|
|
|
|
|
|
|
|
|
|
|
|
|
|
|
|
|
|
|
|
Florida Office Portfolio |
|
11 |
|
Jacksonville, FL |
|
May 2019 |
|
97% |
|
|
|
231.0 |
|
|
|
1.27 |
|
|
90% |
|
||
|
Columbus Office Portfolio |
|
1 |
|
Columbus, OH |
|
October 2019 |
|
96% |
|
|
|
73.3 |
|
|
|
0.32 |
|
|
98% |
|
||
|
Nashville Office |
|
1 |
|
Nashville, TN |
|
February 2020 |
|
100% |
|
|
|
264.1 |
|
|
|
0.36 |
|
|
100% |
|
||
|
60 State Street |
|
1 |
|
Boston, MA |
|
March 2020 |
|
75% |
|
|
|
614.3 |
|
|
|
0.91 |
|
|
91% |
|
||
|
Total Office |
|
14 |
|
|
|
|
|
|
|
|
|
|
1,182.7 |
|
|
|
2.86 |
|
|
|
|
|
|
Industrial: |
|
|
|
|
|
|
|
|
|
|
|
|
|
|
|
|
|
|
|
|
|
|
|
Midwest Industrial Portfolio |
|
33 |
|
IL, IN, OH, WI |
|
November 2019 |
|
95% |
|
|
|
319.6 |
|
|
4.07 |
|
|
98% |
|
|||
|
Total Industrial |
|
33 |
|
|
|
|
|
|
|
|
|
|
319.6 |
|
|
4.07 |
|
|
|
|
|
|
|
Medical Office: |
|
|
|
|
|
|
|
|
|
|
|
|
|
|
|
|
|
|
|
|
|
|
|
Exchange on Erwin - Commercial |
|
2 |
|
Durham, NC |
|
November 2019 |
|
100% |
|
|
|
36.7 |
|
|
|
0.10 |
|
|
100% |
|
||
|
Barlow |
|
1 |
|
Chevy Chase, MD |
|
March 2020 |
|
100% |
|
|
|
160.0 |
|
|
|
0.29 |
|
|
92% |
|
||
|
Total Medical Office |
|
3 |
|
|
|
|
|
|
|
|
|
|
196.7 |
|
|
|
0.39 |
|
|
|
|
|
|
|
|
|
|
|
|
|
|
|
|
|
|
|
|
|
|
|
|
|
|
|
|
|
|
Total Investment Properties |
|
93 |
|
|
|
|
|
|
|
|
|
$ |
3,418.4 |
|
|
|
|
|
|
|
|
|
|
(1) |
Certain of the joint venture agreements entered into by us provide the seller or the other partner a profits interest based on certain internal rate of return hurdles being achieved. Such investments are consolidated by us and any profits interest due to the other partner is reported within non-controlling interests. |
|
(2) |
Purchase price excludes acquisition costs and acquired working capital of $27.1 million. |
29
|
(3) |
The occupancy rate for non-hotels is as of March 31, 2020 and for hotels the average occupancy rate for the three months ended March 31, 2020. |
|
(4) |
Purchase price represents the Company's initial equity investment into the joint venture. |
Investments in Real Estate-Related Securities
During the three months ended March 31, 2020, we invested $65.8 million in real estate-related securities. The following table details our investments in real estate-related securities as of March 31, 2020 ($ in thousands):
|
Instrument |
|
Number of Positions |
|
|
Weighted Average Coupon (1) |
|
|
Weighted Average Maturity Date (2) |
|
Cost Basis |
|
|
Fair Value |
|
||||
|
RMBS |
|
72 |
|
|
3.45% |
|
|
June 13, 1944 |
|
$ |
298,966 |
|
|
$ |
285,640 |
|
||
|
CLO |
|
8 |
|
|
6.11% |
|
|
August 15, 2031 |
|
|
25,166 |
|
|
|
17,631 |
|
||
|
CMBS |
|
4 |
|
|
4.28% |
|
|
December 22, 2036 |
|
|
11,443 |
|
|
|
11,194 |
|
||
|
|
|
|
84 |
|
|
|
|
|
|
|
|
$ |
335,575 |
|
|
$ |
314,465 |
|
|
(1) |
As of March 31, 2020, our RMBS investments had floating rate coupons ranging from 2.40% to 7.00%, our CLO securities had floating rate coupons ranging from 5.75% to 9.60% and our CMBS investments had floating rate coupons ranging from 4.07% to 5.00%. |
|
(2) |
Weighted average maturity date is based on the fully extended maturity date of the underlying collateral. |
The following chart describes the diversification of our real estate-related securities and loans by type based on fair value as of March 31, 2020:

Approximately 8% of our overall portfolio is invested in marketable securities in order to provide us with liquidity for our share repurchase plan. RMBS are mortgage pass-through certificates or collateralized mortgage obligations representing interests in or obligations backed by pools of residential mortgage loans. To a lesser extent, we also invest in securitizations of loan portfolios or CLO CMBS.
30
The following table details the expiring leases at our industrial, office and medical office properties by annualized base rent and square footage as of March 31, 2020 ($ and square feet data in thousands). The table below excludes our hotel properties and multifamily properties as substantially all leases at such properties expire within 12 months:
|
Year |
|
Number of Expiring Leases |
|
Annualized Base Rent (1) |
|
|
% of Total Annualized Base Rent Expiring |
|
|
Square Feet |
|
|
% of Total Square Feet Expiring |
|
|||||
|
2020 (remaining) |
|
19 |
|
$ |
|
17,018 |
|
|
|
8% |
|
|
|
252 |
|
|
|
4% |
|
|
2021 |
|
30 |
|
|
|
25,188 |
|
|
|
12% |
|
|
|
627 |
|
|
|
9% |
|
|
2022 |
|
40 |
|
|
|
28,531 |
|
|
|
13% |
|
|
|
954 |
|
|
|
13% |
|
|
2023 |
|
36 |
|
|
|
23,484 |
|
|
|
11% |
|
|
|
1,211 |
|
|
|
17% |
|
|
2024 |
|
36 |
|
|
|
17,220 |
|
|
|
8% |
|
|
|
913 |
|
|
|
13% |
|
|
2025 |
|
19 |
|
|
|
14,350 |
|
|
|
7% |
|
|
|
517 |
|
|
|
7% |
|
|
2026 |
|
26 |
|
|
|
17,683 |
|
|
|
8% |
|
|
|
709 |
|
|
|
10% |
|
|
2027 |
|
13 |
|
|
|
11,344 |
|
|
|
5% |
|
|
|
227 |
|
|
|
3% |
|
|
2028 |
|
10 |
|
|
|
10,634 |
|
|
|
5% |
|
|
|
167 |
|
|
|
2% |
|
|
2029 |
|
9 |
|
|
|
7,701 |
|
|
|
4% |
|
|
|
137 |
|
|
|
2% |
|
|
Thereafter |
|
25 |
|
|
|
42,171 |
|
|
|
19% |
|
|
|
1,398 |
|
|
|
20% |
|
|
Total |
|
263 |
|
$ |
|
215,324 |
|
|
|
100% |
|
|
|
7,112 |
|
|
|
100% |
|
|
(1) |
Annualized base rent is determined from the annualized base rent per leased square foot of the applicable year and excludes tenant recoveries, straight-line rent and above-market and below-market lease amortization. |
Results of Operations
Due to the significant amount of acquisitions of real estate and real estate-related securities and loans we have made since we commenced principal operations on December 21, 2018, our results of operations for the three months ended March 31, 2020 and 2019 are not comparable.
31
The following table sets forth information regarding our consolidated results of operations ($ in thousands):
|
|
|
Three Months Ended March 31, |
|
|||||
|
|
|
2020 |
|
|
2019 |
|
||
|
Revenues |
|
|
|
|
|
|
|
|
|
Rental revenue |
|
$ |
46,465 |
|
|
$ |
4,310 |
|
|
Hotel revenue |
|
|
10,215 |
|
|
|
10,852 |
|
|
Other revenue |
|
|
357 |
|
|
|
253 |
|
|
Total revenues |
|
|
57,037 |
|
|
|
15,415 |
|
|
Expenses |
|
|
|
|
|
|
|
|
|
Rental property operating |
|
|
15,544 |
|
|
|
1,762 |
|
|
Hotel operating |
|
|
5,964 |
|
|
|
5,503 |
|
|
General and administrative |
|
|
2,358 |
|
|
|
912 |
|
|
Management fees |
|
|
3,946 |
|
|
|
— |
|
|
Performance participation allocation |
|
|
46 |
|
|
|
857 |
|
|
Depreciation and amortization |
|
|
30,543 |
|
|
|
5,358 |
|
|
Total expenses |
|
|
58,401 |
|
|
|
14,392 |
|
|
Other income (expense) |
|
|
|
|
|
|
|
|
|
Earnings from unconsolidated real estate ventures |
|
|
360 |
|
|
|
43 |
|
|
(Loss) income from real estate-related securities, net |
|
|
(20,173 |
) |
|
|
102 |
|
|
Interest income |
|
|
303 |
|
|
|
58 |
|
|
Interest expense |
|
|
(19,641 |
) |
|
|
(3,598 |
) |
|
Other expense |
|
|
(132 |
) |
|
|
(96 |
) |
|
Total other expense |
|
|
(39,283 |
) |
|
|
(3,491 |
) |
|
Net loss |
|
$ |
(40,647 |
) |
|
$ |
(2,468 |
) |
|
Net loss attributable to non-controlling interests in consolidated joint ventures |
|
$ |
638 |
|
|
$ |
— |
|
|
Net loss attributable to non-controlling interests in Operating Partnership |
|
|
332 |
|
|
|
— |
|
|
Net loss attributable to stockholders |
|
$ |
(39,677 |
) |
|
$ |
(2,468 |
) |
Total Revenues
During the three months ended March 31, 2020 and 2019, total revenues were $57.0 million and $15.4 million, respectively.
Rental revenue primarily consists of base rent arising from tenant leases at our multifamily, industrial, office and medical office properties. Rental revenue is recognized on a straight-line basis over the life of the lease, including any rent steps or abatement provisions. During the three months ended March 31, 2020 and 2019, rental revenue was $46.5 million and $4.3 million, respectively. The increase is driven by the growth in our portfolio, which increased from 15 properties as of March 31, 2019 to 93 properties as of March 31, 2020.
While it is difficult to predict the future impact of COVID-19, our rent collections to date have not changed materially. As of April 27, 2020, we had collected 95% of our rental income, while on the same day in March, we had collected 97%. To date we have received very few requests from our tenants and residents seeking concessions.
Hotel revenue consists of income from our hotel properties. Hotel revenue consists primarily of room revenue. During the three months ended March 31, 2020 and 2019, hotel revenue was $10.2 million and $10.9 million, respectively. As a result of unprecedented travel declines and shelter at home orders due to COVID-19, our portfolio hotel occupancies declined from 83% during February 2020 to 45% by the end of March 2020.
During the three months ended March 31, 2020 and 2019, other revenue was $0.4 million and $0.3 million, respectively. During the three months ended March 31, 2020 and 2019, other revenue primarily consists of deferred income of $0.2 million and $0.2 million, respectively, associated with the discharge of certain housing development loans. See Note 2 – “Summary of Significant Accounting Policies” to our consolidated financial statements in this Quarterly Report on Form 10-Q for further details on the accounting treatment of deferred income.
32
Rental Property Operating and Hotel Operating Expenses
Rental property operating and hotel operating expenses consist of the costs of ownership and operation of the real estate investments. Examples of rental property operating and hotel operating expenses include real estate taxes, insurance, utilities and repair and maintenance expenses. Rental property operating and hotel operating expenses also include general and administrative expenses unrelated to the operations of the properties. During the three months ended March 31, 2020 and 2019, rental property operating and hotel operating expenses were $21.5 million and $7.3 million, respectively.
General and Administrative Expenses
General and administrative expenses are Company-level expenses that relate mainly to our compliance and administration costs. During the three months ended March 31, 2020 and 2019, general and administrative expenses were $2.4 million and $0.9 million, respectively, and consisted primarily of legal fees, accounting fees, transfer agent fees and other professional services. During the three months ended March 31, 2020, general and administrative expenses increased $1.5 million compared to the three months ended March 31, 2019, primarily due to miscellaneous corporate level expenses related to the increased size of our portfolio.
Management Fees
Management fees are earned by our Advisor for providing services pursuant to the Advisory Agreement. The Advisor waived the management fee for the period January 1, 2019 through March 31, 2019 and we began accruing the management fee payable beginning April 1, 2019. During the three months ended March 31, 2020, the total management fee expense was $3.9 million.
Performance Participation Allocation
Performance participation allocation relates to allocations from the Operating Partnership to the Special Limited Partner based on the total return of the Operating Partnership. Total return is defined as distributions paid or accrued plus the change in NAV. The performance participation allocation is measured annually and any amount earned by the Special Limited Partner becomes payable as of December 31 of the applicable year. During the three months ended March 31, 2020 and 2019, the performance participation allocation was $46,000 and $0.9 million, respectively.
Depreciation and Amortization
Depreciation and amortization expenses are impacted by the values assigned to buildings, personal property and in-place lease assets as part of the initial purchase price allocation. During the three months ended March 31, 2020 and 2019, depreciation and amortization expenses were $30.5 million and $5.4 million, respectively. The increase was driven by depreciation and amortization on our investments in real property.
(Loss) income from Real Estate-Related Securities, net
During the three months ended March 31, 2020 and 2019, (loss) income from real estate-related securities, net was $(20.2) million and $0.1 million, respectively, which consisted of the interest income, unrealized gains/(losses), and realized gains/(losses) on our investments in real estate-related securities.
The spread of COVID-19 during the quarter ended March 31, 2020 led to extreme market volatility and dislocations in the financial markets, which have in turn caused significant yield spread widening on most fixed income assets, volatility in interest rates and a severe drop in liquidity across virtually all asset classes. The market volatility led to an increase in unrealized losses during the three months ended March 31, 2020 in our portfolio of real estate-related securities.
Interest Income
During the three months ended March 31, 2020 and 2019, interest income was $0.3 million and $0.1 million, respectively, which consisted of the interest earned on cash and cash equivalents.
Interest Expense
During the three months ended March 31, 2020 and 2019, interest expense was $19.6 million and $3.6 million, respectively, which primarily consist of interest expense incurred on our mortgage notes, revolving credit facility and borrowings under our repurchase agreements. The increase was primarily due to the growth in our portfolio of real estate and real estate-related securities and the related indebtedness on such investments.
33
The balance also includes losses of $4.4 million unfavorable change in interest rate swaps and interest rate caps. The interest rate caps are used primarily to limit our interest rate payments on certain of our variable rate borrowings.
The interest rate swaps are used to introduce more certainty around cash flows and increase the cash available for distribution after debt service. The Company was able to take advantage of a unique moment in the financial markets to lock in fixed swap rates below the current LIBOR floating rates.
Funds from Operations and Adjusted Funds from Operations
We believe funds from operations (“FFO”) is a meaningful supplemental non-GAAP operating metric. Our consolidated financial statements are presented under historical cost accounting which, among other things, requires depreciation of real estate investments to be calculated on a straight-line basis. As a result, our operating results imply that the value of our real estate investments will decrease evenly over a set time period. However, we believe that the value of real estate investments will change over time based on market conditions and as such, depreciation under historical cost accounting may be less informative. FFO is a standard REIT industry metric defined by the National Association of Real Estate Investment Trusts (“NAREIT”).
FFO, as defined by NAREIT and presented below, is calculated as net income or loss (computed in accordance with GAAP), excluding gains or losses from sales of depreciable real property and impairment write-downs on depreciable real property, plus real estate-related depreciation and amortization, and similar adjustments for unconsolidated joint ventures.
We also believe that adjusted FFO (“AFFO”) is a meaningful supplemental non-GAAP disclosure of our operating results. AFFO further adjusts FFO in order for our operating results to reflect the specific characteristics of our business by adjusting for items we believe are not related to our core operations. Our adjustments to FFO to arrive at AFFO include straight-line rental income, amortization of above- and below-market lease intangibles, unrealized gains or losses from changes in the fair value of real estate–related securities and other financial instruments, amortization of restricted stock awards, performance participation allocation not payable, even if repurchased by us and similar adjustments for non-controlling interests. AFFO is not defined by NAREIT and our calculation of AFFO may not be comparable to disclosures made by other REITs.
The following table presents a reconciliation of FFO and AFFO to GAAP net loss attributable to stockholders ($ in thousands):
|
|
|
Three Months Ended March 31, |
|
|||||
|
|
|
2020 |
|
|
2019 |
|
||
|
Net loss attributable to stockholders |
|
$ |
(39,677 |
) |
|
$ |
(2,468 |
) |
|
Adjustments to arrive at FFO: |
|
|
|
|
|
|
|
|
|
Real estate depreciation and amortization |
|
|
30,543 |
|
|
|
5,358 |
|
|
Investment in unconsolidated real estate ventures – depreciation and amortization |
|
|
254 |
|
|
|
37 |
|
|
Amount attributable to non-controlling interests for above adjustments |
|
|
(688 |
) |
|
|
— |
|
|
FFO attributable to stockholders |
|
|
(9,568 |
) |
|
|
2,927 |
|
|
Adjustments to arrive at AFFO: |
|
|
|
|
|
|
|
|
|
Straight-line rental income |
|
|
(911 |
) |
|
|
— |
|
|
Amortization of above- and below-market lease intangibles, net |
|
|
87 |
|
|
|
— |
|
|
Unrealized losses from changes in the fair value of real estate-related securities and other financial instruments |
|
|
26,973 |
|
|
|
130 |
|
|
Non-cash performance participation allocation |
|
|
46 |
|
|
|
857 |
|
|
Amortization of deferred financing costs |
|
|
436 |
|
|
|
156 |
|
|
Amortization of restricted stock awards |
|
|
21 |
|
|
|
29 |
|
|
Amount attributable to non-controlling interests for above adjustments |
|
|
(388 |
) |
|
|
— |
|
|
AFFO attributable to stockholders |
|
$ |
16,696 |
|
|
$ |
4,099 |
|
FFO and AFFO should not be considered to be more relevant or accurate than the current GAAP methodology in calculating net income or in evaluating our operating performance. In addition, FFO and AFFO should not be considered as alternatives to net income (loss) as indications of our performance or as alternatives to cash flows from operating activities as indications of our liquidity, but rather should be reviewed in conjunction with these and other GAAP measurements. Further, FFO and AFFO are not intended to be used as liquidity measures indicative of cash flow available to fund our cash needs, including our ability to make distributions to our stockholders.
34
The purchase price per share for each class of our common stock will generally equal our prior month’s NAV per share, as determined monthly, plus applicable selling commissions and dealer manager fees. Our NAV for each class of shares is based on the net asset values of our investments (including real estate-related securities), the addition of any other assets (such as cash on hand) and the deduction of any liabilities, including the allocation/accrual of any performance participation, and any stockholder servicing fees applicable to such class of shares.
The following table provides a breakdown of the major components of our NAV ($ and shares in thousands):
|
Components of NAV |
|
March 31, 2020 |
|
||
|
Investments in real properties |
|
$ |
|
3,521,116 |
|
|
Investments in real estate related securities |
|
|
|
314,465 |
|
|
Cash and cash equivalents |
|
|
|
61,222 |
|
|
Restricted cash |
|
|
|
94,261 |
|
|
Other assets |
|
|
|
30,159 |
|
|
Debt obligations |
|
|
|
(2,441,702 |
) |
|
Subscriptions received in advance |
|
|
|
(41,012 |
) |
|
Other liabilities |
|
|
|
(67,954 |
) |
|
Performance participation accrual |
|
|
|
(46 |
) |
|
Management fee payable |
|
|
|
(1,461 |
) |
|
Accrued stockholder servicing fees(1) |
|
|
|
(619 |
) |
|
Minority interest |
|
|
|
(74,973 |
) |
|
Net Asset Value |
|
$ |
|
1,393,456 |
|
|
Number of outstanding shares |
|
|
|
65,672 |
|
|
(1) |
Stockholder servicing fees only apply to Class T, Class S, and Class D shares. Under GAAP, we accrue the full cost of the stockholder servicing fee as an offering cost at the time we sell Class T, Class S and Class D shares. As of March 31, 2020, we have accrued under GAAP $60.8 million of stockholder servicing fees payable to the Dealer Manager related to the Class T, Class S and Class D shares sold. |
The following table provides a breakdown of our total NAV and NAV per share by share class as of March 31, 2020:
|
NAV Per Share |
|
Class T Shares |
|
|
Class S Shares |
|
|
Class D Shares |
|
|
Class I Shares |
|
|
Third-party Operating Partnership Units (1) |
|
|
Total |
|
||||||
|
Net asset value |
|
$ |
42,504,784 |
|
|
$ |
759,784,680 |
|
|
$ |
48,454,134 |
|
|
$ |
532,525,469 |
|
|
$ |
10,187,521 |
|
|
$ |
1,393,456,588 |
|
|
Number of outstanding shares |
|
|
2,016,251 |
|
|
|
35,762,788 |
|
|
|
2,293,273 |
|
|
|
25,118,918 |
|
|
|
480,539 |
|
|
|
65,671,769 |
|
|
NAV Per Share as of March 31, 2020 |
|
$ |
21.08 |
|
|
$ |
21.25 |
|
|
$ |
21.13 |
|
|
$ |
21.20 |
|
|
$ |
21.20 |
|
|
|
|
|
|
(1) |
Includes the partnership interest of the Operating Partnership held by the Special Limited Partner. |
Set forth below are the weighted averages of the key assumptions in the discounted cash flow methodology used in the March 31, 2020 valuations, based on property types.
|
Property Type |
|
Discount Rate |
|
|
Exit Capitalization Rate |
|
|
Multifamily |
|
6.6% |
|
|
5.3% |
|
|
Hotel |
|
9.0% |
|
|
8.1% |
|
|
Office |
|
8.3% |
|
|
7.5% |
|
|
Other |
|
7.8% |
|
|
7.3% |
|
35
These assumptions are determined by the Advisor and reviewed by our independent valuation advisor. A change in these assumptions would impact the calculation of the value of our property investments. For example, assuming all other factors remain unchanged, the changes listed below would result in the following effects on our investment values:
|
Input |
|
Hypothetical Change |
|
Multifamily Investment Values |
|
|
Hotel Investment Values |
|
|
Office Investment Values |
|
|
Other Investment Values |
|
|
Discount Rate |
|
0.25% decrease |
|
2.0% |
|
|
1.9% |
|
|
1.9% |
|
|
1.7% |
|
|
(weighted average) |
|
0.25% increase |
|
(1.9)% |
|
|
(1.8)% |
|
|
(1.8)% |
|
|
(1.9)% |
|
|
Exit Capitalization Rate |
|
0.25% decrease |
|
3.1% |
|
|
1.8% |
|
|
2.1% |
|
|
1.9% |
|
|
(weighted average) |
|
0.25% increase |
|
(2.8)% |
|
|
(1.7)% |
|
|
(1.9)% |
|
|
(1.9)% |
|
The following table reconciles stockholders’ equity per our Consolidated Balance Sheet to our NAV ($ in thousands):
|
Reconciliation of Stockholders’ Equity to NAV |
|
March 31, 2020 |
|
||
|
Stockholders’ equity under U.S. GAAP |
|
$ |
|
1,189,452 |
|
|
Redeemable non-controlling interest |
|
|
|
10,187 |
|
|
Total partners' capital of Operating Partnership |
|
|
|
1,199,639 |
|
|
Adjustments: |
|
|
|
|
|
|
Accrued stockholder servicing fee |
|
|
|
60,197 |
|
|
Advanced organization and offering costs and Advanced operating expenses |
|
|
|
7,168 |
|
|
Unrealized real estate appreciation |
|
|
|
57,300 |
|
|
Accumulated depreciation and amortization |
|
|
|
69,152 |
|
|
NAV |
|
$ |
|
1,393,456 |
|
The following details the adjustments to reconcile GAAP stockholders’ equity to our NAV:
|
|
• |
Accrued stockholder servicing fee represents the accrual for the full cost of the stockholder servicing fee for Class T, Class S and Class D shares. Under GAAP we accrued the full cost of the stockholder servicing fee payable over the life of each share (assuming such share remains outstanding the length of time required to pay the maximum stockholder servicing fee) as an offering cost at the time we sold the Class T, Class S and Class D shares. Refer to Note 2 — “Summary of Significant Accounting Policies” to our consolidated financial statements in this Quarterly Report on Form 10-Q for further details of the GAAP treatment regarding the stockholder servicing fee. For purposes of NAV, we recognize the stockholder servicing fee as a reduction of NAV on a monthly basis as such fee is paid. |
|
|
• |
The Advisor advanced organization and offering costs (other than upfront selling commissions, dealer manager fees and stockholder servicing fees) on our behalf through December 21, 2019. Such costs are reimbursed to the Advisor pro rata over 60 months following December 21, 2019. Under GAAP, organization costs are expensed as incurred and offering costs are charged to equity as such amounts are incurred. For NAV, such costs are recognized as a reduction to NAV as they are reimbursed ratably over 60 months. |
|
|
• |
Our investments in real estate are presented under historical cost in our GAAP consolidated financial statements. Additionally, our mortgage notes and repurchase agreements (“Debt”) are presented at their carrying value in our consolidated financial statements. As such, any changes in the fair value of our Debt are not included in our GAAP results. For purposes of determining our NAV, our investments in real estate and our Debt are recorded at fair value. |
|
|
• |
We depreciate our investments in real estate and amortize certain other assets and liabilities in accordance with GAAP. Such depreciation and amortization is not recorded for purposes of determining our NAV. |
36
Since February 2019, we have declared monthly distributions for each class of our common stock, which are generally paid three days after month-end. Each class of our common stock received the same gross distribution per share, which was $0.3105 per share for the three months ended March 31, 2020. The net distribution varies for each class based on the applicable stockholder servicing fee, which is deducted from the gross distribution per share and paid to the dealer manager. The table below details the net distribution for each of our share classes for the three months ended March 31, 2020:
|
|
|
Class T |
|
|
Class S |
|
|
Class D |
|
|
Class I |
|
||||
|
|
|
Shares |
|
|
Shares |
|
|
Shares |
|
|
Shares |
|
||||
|
January 31, 2020 |
|
$ |
0.0881 |
|
|
$ |
0.0879 |
|
|
$ |
0.0989 |
|
|
$ |
0.1035 |
|
|
February 29, 2020 |
|
|
0.0890 |
|
|
|
0.0889 |
|
|
|
0.0993 |
|
|
|
0.1035 |
|
|
March 31, 2020 |
|
|
0.0880 |
|
|
|
0.0879 |
|
|
|
0.0989 |
|
|
|
0.1035 |
|
|
Totals |
|
$ |
0.2651 |
|
|
$ |
0.2647 |
|
|
$ |
0.2971 |
|
|
$ |
0.3105 |
|
The following table summarizes our distributions declared during the three months ended March 31, 2020 and 2019 ($ in thousands):
|
|
|
Three Months Ended March 31, 2020 |
|
|
Three Months Ended March 31, 2019 |
|
||||||||||
|
|
|
Amount |
|
|
Percentage |
|
|
Amount |
|
|
Percentage |
|
||||
|
Distributions |
|
|
|
|
|
|
|
|
|
|
|
|
|
|
|
|
|
Payable in cash |
|
$ |
7,028 |
|
|
|
43 |
% |
|
$ |
615 |
|
|
|
38 |
% |
|
Reinvested in shares |
|
|
9,336 |
|
|
|
57 |
% |
|
|
1,017 |
|
|
|
62 |
% |
|
Total distributions |
|
$ |
16,364 |
|
|
|
100 |
% |
|
$ |
1,632 |
|
|
|
100 |
% |
|
|
|
|
|
|
|
|
|
|
|
|
|
|
|
|
|
|
|
Sources of Distributions |
|
|
|
|
|
|
|
|
|
|
|
|
|
|
|
|
|
Cash flows from operating activities |
|
$ |
16,364 |
|
|
|
100 |
% |
|
$ |
1,632 |
|
|
|
100 |
% |
|
Offering proceeds |
|
|
— |
|
|
|
0 |
% |
|
|
— |
|
|
|
0 |
% |
|
Total sources of distributions |
|
$ |
16,364 |
|
|
|
100 |
% |
|
$ |
1,632 |
|
|
|
100 |
% |
|
|
|
|
|
|
|
|
|
|
|
|
|
|
|
|
|
|
|
Cash flows from operating activities |
|
$ |
27,445 |
|
|
|
|
|
|
$ |
2,162 |
|
|
|
|
|
|
Funds from operations |
|
$ |
(9,568 |
) |
|
|
|
|
|
$ |
2,927 |
|
|
|
|
|
Liquidity and Capital Resources
Our primary needs for liquidity and capital resources are to fund our investments, to make distributions to our stockholders, to repurchase shares of our common stock pursuant to our share repurchase plan, to pay our offering and operating fees and expenses and to pay interest on our outstanding indebtedness. Our operating expenses include, among other things, the management fee we pay to the Advisor (to the extent the Advisor elects to receive the management fee in cash), the performance participation allocation that the Operating Partnership pays to the Special Limited Partner (to the extent that the Advisor elects to receive the performance participation in cash), general corporate expenses and fees related to acquiring, financing, appraising and managing our properties. We do not have any office or personnel expenses as we do not have any employees.
We reimburse the Advisor for certain out-of-pocket expenses in connection with our operations. The Advisor advanced $7.3 million of our organization and offering expenses on our behalf (other than upfront selling commissions, dealer manager fees and stockholder servicing fees) through December 21, 2019. We reimburse the Advisor for such expenses ratably over the 60 months following December 21, 2019. As of March 31, 2020, $6.9 million of advanced organization and offering expenses were outstanding to the Advisor and are recorded as a component of Due to affiliates on our Consolidated Balance Sheets.
Our cash needs for acquisitions and other investments will be funded primarily from the sale of shares of our common stock and through the assumption or incurrence of debt. From inception through March 31, 2020, our distributions have been entirely funded from cash flow from operating activities.
37
The following table is a summary of our indebtedness as of March 31, 2020 and December 31, 2019 ($ in thousands):
|
|
|
|
|
|
|
|
|
|
|
|
|
Principal Balance Outstanding (2) |
|
|||||
|
Indebtedness |
|
Weighted Average Interest Rate(1) |
|
|
Weighted Average Maturity Date |
|
Maximum Facility Size |
|
|
March 31, 2020 |
|
|
December 31, 2019 |
|
||||
|
Fixed rate loans |
|
|
|
|
|
|
|
|
|
|
|
|
|
|
|
|
|
|
|
Fixed rate mortgages |
|
3.50% |
|
|
7/20/2029 |
|
N/A |
|
|
$ |
1,340,373 |
|
|
$ |
1,004,423 |
|
||
|
Total fixed rate loans |
|
|
|
|
|
|
|
|
|
|
|
|
1,340,373 |
|
|
|
1,004,423 |
|
|
Variable rate loans |
|
|
|
|
|
|
|
|
|
|
|
|
|
|
|
|
|
|
|
Floating rate mortgages |
|
L + 1.75% |
|
|
1/27/2025 |
|
N/A |
|
|
|
738,389 |
|
|
|
240,599 |
|
||
|
Variable rate revolving credit facility (3) |
|
L + 2.00% |
|
|
10/21/2020 |
|
$ |
200,000 |
|
|
|
172,800 |
|
|
|
— |
|
|
|
Total variable rate loans |
|
|
|
|
|
|
|
|
|
|
|
|
911,189 |
|
|
|
240,599 |
|
|
Total loans secured by the Company's properties |
|
|
|
|
|
|
|
|
|
|
|
|
2,251,562 |
|
|
|
1,245,022 |
|
|
Deferred financing costs, net |
|
|
|
|
|
|
|
|
|
|
|
|
(12,892 |
) |
|
|
(7,136 |
) |
|
Discount on assumed debt, net |
|
|
|
|
|
|
|
|
|
|
|
|
233 |
|
|
|
216 |
|
|
Mortgage notes and revolving credit facility, net |
|
|
|
|
|
|
|
|
|
|
|
$ |
2,238,903 |
|
|
$ |
1,238,102 |
|
|
(1) |
The term “L” refers to the one-month LIBOR. As of March 31, 2020, one-month LIBOR was equal to 0.99%. |
|
(2) |
The majority of our mortgages contain yield or spread maintenance provisions. |
|
(3) |
Our revolving credit facility is used as bridge financing and can be drawn upon to fund the acquisition of future real estate investments. |
In December 2019, COVID-19 emerged in Wuhan, Hubei Province, China. While initially the outbreak was largely concentrated in China and caused significant disruptions to its economy, it has now spread globally. The World Health Organization has declared the COVID-19 outbreak a pandemic, the Health and Human Services Secretary has declared a public health emergency in the United States in response to the outbreak and the President of the United States has declared the COVID-19 outbreak a national emergency. Due to the fact our property portfolio is comprised entirely of real property located in the United States, COVID-19 has impacted our operating results. The outbreak and shelter-at-home orders in response to the pandemic has had an adverse impact on economic and market conditions and resulted in a surge in unemployment in the United States. The rapid development and fluidity of this situation precludes any prediction as to the ultimate adverse impact of COVID-19. Nevertheless, COVID-19 presents material uncertainty and risk with respect to our future performance and financial results, such as the potential negative impact the tenants of our office, medical office, industrial and multifamily properties, the potential closure of certain of our hotel assets, financing arrangements, increased costs of operations, decrease in values of our investments in real estate-related securities, changes in law and/or regulation, and uncertainty regarding government and regulatory policy. We are unable to estimate the impact COVID-19 will have on our future financial results at this time.
Due to the turmoil in the financial markets resulting from the global pandemic of COVID-19, we have received a number of margin calls from certain of our financing counterparties. Through April 30, 2020, we met all margin calls received in a timely basis.
Subsequent to March 31, 2020, the Company raised $68.3 million in the Offering. During March and April 2020, the Company received approximately $17.6 million of investor requests to repurchase their holdings, which totaled approximately 1% of the Company’s NAV. All repurchase requests were met from new monthly investment proceeds received in the Offering.
While the long-term impact of COVID-19 to our business is not yet known, we believe we are well positioned from a liquidity perspective with $88.4 million of immediate liquidity as of March 31, 2020, made up of $27.2 million of undrawn line of credit capacity and $61.2 million of cash on hand.
38
The following table provides a breakdown of the net change in our cash and cash equivalents and restricted cash ($ in thousands):
|
|
|
Three Months Ended March 31, |
|
|||||
|
|
|
2020 |
|
|
2019 |
|
||
|
Cash flows provided by operating activities |
|
$ |
27,445 |
|
|
$ |
2,162 |
|
|
Cash flows used in investing activities |
|
|
(1,574,848 |
) |
|
|
(313,694 |
) |
|
Cash flows provided by financing activities |
|
|
1,513,925 |
|
|
|
233,164 |
|
|
Net decrease in cash and cash equivalents and restricted cash |
|
$ |
(33,478 |
) |
|
$ |
(78,368 |
) |
Cash flows provided by operating activities increased $25.3 million during the three months ended March 31, 2020 compared to the corresponding period in 2019. This increase resulted from the operations of the investments in real estate and income on our investments in real estate-related securities.
Cash flows used in investing activities increased $1,261.1 million during the three months ended March 31, 2020 compared to the corresponding period in 2019 primarily due to the acquisitions of $1,306.3 million of real estate investments and $(46.6) million of net real estate-related securities.
Cash flows provided by financing activities increased $1,280.7 million during the three months ended March 31, 2020 compared to the corresponding period in 2019 primarily due to a net increase of $959.0 million in borrowings, $53.8 million of net borrowings under repurchase agreements, and of $218.8 million in proceeds from the issuance of our common stock.
Critical Accounting Policies
The preparation of the financial statements in accordance with GAAP involve significant judgments and assumptions and require estimates about matters that are inherently uncertain. These judgments will affect our reported amounts of assets and liabilities and our disclosure of contingent assets and liabilities at the dates of the financial statements and the reported amounts of revenue and expenses during the reporting periods. With different estimates or assumptions, materially different amounts could be reported in our financial statements. We consider our accounting policies over investments in real estate and lease intangibles, investments in securities, and revenue recognition to be our critical accounting policies. Refer to Note 2 — “Summary of Significant Accounting Policies” to our consolidated financial statements in this Quarterly Report on Form 10-Q for further descriptions of such accounting policies.
Recent Accounting Pronouncements
See Note 2 — “Summary of Significant Accounting Policies” to our consolidated financial statements in this Quarterly Report on Form 10-Q for a discussion concerning recent accounting pronouncements.
Off-Balance Sheet Arrangements
We currently have no off-balance sheet arrangements that are reasonably likely to have a material current or future effect on our financial condition, changes in financial condition, revenues or expenses, results of operations, liquidity, capital expenditures or capital resources.
Contractual Obligations
The following table aggregates our contractual obligations and commitments with payments due subsequent to March 31, 2020 ($ in thousands):
|
Obligations |
|
Total |
|
|
Less than 1 year |
|
|
1-3 years |
|
|
3-5 years |
|
|
More than 5 years |
|
||||||||||
|
Indebtedness (1) |
|
$ |
|
2,782,406 |
|
|
$ |
|
291,986 |
|
|
$ |
|
135,422 |
|
|
$ |
|
452,184 |
|
|
$ |
|
1,902,814 |
|
|
Ground lease |
|
|
|
18,648 |
|
|
|
|
399 |
|
|
|
|
1,197 |
|
|
|
|
1,197 |
|
|
|
|
15,855 |
|
|
Organizational and offering costs |
|
|
|
6,926 |
|
|
|
|
1,458 |
|
|
|
|
2,916 |
|
|
|
|
2,552 |
|
|
|
|
— |
|
|
Advanced operating expenses |
|
|
|
135 |
|
|
|
|
29 |
|
|
|
|
58 |
|
|
|
|
48 |
|
|
|
|
— |
|
|
Total |
|
$ |
|
2,808,115 |
|
|
$ |
|
293,872 |
|
|
$ |
|
139,593 |
|
|
$ |
|
455,981 |
|
|
$ |
|
1,918,669 |
|
|
(1) |
The allocation of our indebtedness includes both principal and interest payments based on the current maturity date and interest rates in effect at March 31, 2020. |
39
Capital Market Risk
We are exposed to risks related to the equity capital markets and our related ability to raise capital through the issuance of our common stock. We are also exposed to risks related to the debt capital markets, and our related ability to finance our business through borrowings under mortgages, repurchase obligations or other debt instruments. As a REIT, we are required to distribute a significant portion of our taxable income annually, which constrains our ability to accumulate operating cash flow and therefore requires us to utilize debt or equity capital to finance our business.
The COVID-19 pandemic has also resulted in extreme volatility in a variety of global markets, including the real estate related debt markets. We may receive margin calls from our lenders as a result of the decline in the market value of assets pledged by us to our lenders under our repurchase agreements, and if we fail to resolve such margin calls when due by payment of cash or delivery of additional collateral, the lenders may exercise remedies including taking ownership of the assets securing the applicable obligations.
Credit Risk
The performance and value of our investments depend upon our ability to operate the properties so that they produce sufficient cash flows. The COVID-19 pandemic has significantly impacted the commercial real estate markets, causing requests from tenants for rent deferral or abatement. These negative conditions may persist into the future and impair our tenants’ ability to pay rent under various lease arrangements. We maintain a robust asset management relationship with our tenants, and have utilized these relationships to address the potential impacts of the COVID-19 pandemic on our properties.
Limited discussions we have had with our tenants have addressed potential near-term defensive lease modifications, which could include repurposing of deposits and temporary deferrals of rent. While no lease modifications of this nature have been closed to date, our investments are subject to credit risk.
Interest Rate Risk
We are exposed to interest rate risk with respect to our variable-rate mortgage indebtedness, where an increase in interest rates would directly result in higher interest expense costs. We seek to manage our exposure to interest rate risk by utilizing a mix of fixed and floating rate financings with staggered maturities and through interest rate protection agreements to fix or cap a portion of our variable rate debt. As of March 31, 2020, the outstanding principal balance of our variable rate mortgage indebtedness was $911.2 million.
Certain of our mortgage loans and repurchase agreements are variable rate and are indexed to the one-month U.S. dollar denominated LIBOR. For the three months ended March 31, 2020, a 10% increase in the one-month U.S. dollar denominated LIBOR would have resulted in an increase in interest expense of $0.3 million.
Investments in Real Estate-Related Securities
As of March 31, 2020, we held $314.5 million of real estate-related securities. Our investments in real estate-related securities are primarily floating rate and indexed to one-month or three-month U.S. dollar denominated LIBOR and as such, are exposed to interest rate risk. Our net income will increase or decrease depending on interest rate movements. While we cannot predict factors that may or may not affect interest rates, for the three months ended March 31, 2020, a 10% increase or decrease in the one-month U.S. dollar denominated LIBOR rate would have resulted in an increase or decrease to income from real estate-related securities and loans of $0.1 million.
We may also be exposed to market risk with respect to our investments in real-estate related securities due to changes in the fair value of our investments. We seek to manage our exposure to market risk with respect to our investments in real estate-related securities by making investments in securities backed by different types of collateral and varying credit ratings. The fair value of our investments may fluctuate, thus the amount we will realize upon any sale of our investments is unknown. As of March 31, 2020, the fair value at which we may sell our investments in real estate-related securities is not known, but a 10% change in the fair value of our investments in real estate-related securities may result in an unrealized gain or loss of $31.5 million.
40
In July 2017, the United Kingdom’s Financial Conduct Authority (the authority that regulates LIBOR) announced it intends to stop compelling banks to submit rates for the calculation of LIBOR after 2021. There is currently no certainty regarding the future utilization of LIBOR or of any particular replacement rate (although the secured overnight financing rate has been proposed as an alternative to U.S.-dollar LIBOR). As indicated in the “Interest Rate Risk” section above, a substantial portion of our loans, investment securities, borrowings and interest rate derivatives are indexed to LIBOR or similar reference rates. Market participants anticipate that financial instruments tied to LIBOR will require transition to an alternative reference rate if LIBOR is no longer available. Our LIBOR-based loan agreements and borrowing arrangements generally specify alternative reference rates such as the prime rate and federal funds rate, respectively. The potential effect of the discontinuation of LIBOR on our interest income and expense cannot yet be determined and any changes to benchmark interest rates could increase our financing costs and/or result in mismatches between the interest rates of our investments and the corresponding financings.
Evaluation of Disclosure Controls and Procedures
An evaluation of the effectiveness of the design and operation of our "disclosure controls and procedures" (as defined in Rule 13a-15(e) under the Exchange Act), as of the end of the period covered by this Quarterly Report on Form 10-Q was made under the supervision and with the participation of our management, including our Chief Executive Officer ("CEO") and Chief Financial Officer ("CFO"). Based upon this evaluation, our CEO and CFO have concluded that our disclosure controls and procedures (a) are effective to ensure that information required to be disclosed by us in reports filed or submitted under the Exchange Act is recorded, processed, summarized and reported within the time periods specified by SEC rules and forms and (b) include, without limitation, controls and procedures designed to ensure that information required to be disclosed by us in reports filed or submitted under the Exchange Act is accumulated and communicated to our management, including our CEO and CFO, as appropriate to allow timely decisions regarding required disclosure.
Changes in Internal Controls over Financial Reporting
There have been no changes in our "internal control over financial reporting" (as defined in Rule 13a-15(f) of the Exchange Act) that occurred during the period covered by this Quarterly Report on Form 10-Q that have materially affected, or are reasonably likely to materially affect, our internal control over financial reporting.
41
From time to time, we may be involved in various claims and legal actions arising in the ordinary course of business. As of March 31, 2020, we were not involved in any material legal proceedings.
Aside from COVID-19, there have been no material changes to the risk factors previously disclosed under Item 1A of our Annual Report on Form 10-K for the year ended December 31, 2019.
Unregistered Sales of Equity Securities
Except as described below, during the three months ended March 31, 2020, we did not sell any equity securities that were not registered under the Securities Act. As described in Note 10 – “Related Party Transaction” to our consolidated financial statements in this Quarterly Report on Form 10-Q, the Advisor is entitled to an annual management fee payable monthly in cash, shares of common stock, or units of the Operating Partnership, in each case at the Advisor's election. During the three months ended March 31, 2020, we sold equity securities that were not registered under the Securities Act as described below. For the three months ended March 31, 2020, the Advisor elected to receive its management fees in Class I shares. We issued 53,764 and 61,054 unregistered Class I shares to the Advisor in satisfaction of the management fee for January 2020 and February 2020, respectively. Additionally, we issued 68,906 unregistered Class I shares to the Advisor in April 2020 in satisfaction of the March 2020 management fee. The shares were issued at the applicable NAV per share at the end of each month for which the fee was earned. Each issuance to the Advisor was made pursuant to Section 4(a)(2) of the Securities Act.
Use of Offering Proceeds
On December 27, 2017, our Registration Statement on Form S-11 (File No. 333-220997), covering our Offering of up to $5.0 billion of common stock (in any combination of purchases of Class T, Class S, Class D and Class I shares of our common stock), consisting of up to $4.0 billion in shares in our primary offering and up to $1.0 billion in shares pursuant to our distribution reinvestment plan, was declared effective under the Securities Act. The offering price for each class of our common stock is determined monthly and is made available on our website and in prospectus supplement filings.
The following table presents information about the Offering and use of proceeds therefrom as of March 31, 2020 ($ and number of shares in thousands):
|
|
|
Class T |
|
|
Class S |
|
|
Class D |
|
|
Class I |
|
|
|
|
|
||||
|
|
|
Shares |
|
|
Shares |
|
|
Shares |
|
|
Shares |
|
|
Total |
|
|||||
|
Offering proceeds: |
|
|
|
|
|
|
|
|
|
|
|
|
|
|
|
|
|
|
|
|
|
Shares sold |
|
|
2,021 |
|
|
|
35,794 |
|
|
|
2,296 |
|
|
|
25,130 |
|
|
|
65,241 |
|
|
Gross offering proceeds |
|
$ |
42,925 |
|
|
$ |
752,919 |
|
|
$ |
47,863 |
|
|
$ |
528,588 |
|
|
$ |
1,372,295 |
|
|
Selling commissions and dealer manager fees |
|
|
(881 |
) |
|
|
(7,067 |
) |
|
|
— |
|
|
|
— |
|
|
|
(7,948 |
) |
|
Accrued stockholder servicing fees |
|
|
(203 |
) |
|
|
(4,134 |
) |
|
|
(69 |
) |
|
|
— |
|
|
|
(4,406 |
) |
|
Net offering proceeds |
|
$ |
41,841 |
|
|
$ |
741,718 |
|
|
$ |
47,794 |
|
|
$ |
528,588 |
|
|
$ |
1,359,941 |
|
We primarily used the net proceeds from the Offering toward the acquisition of $3.1 billion of real properties, $522.2 million of real estate-related securities. In addition to the net proceeds from the Offering, we financed our investments with $1.9 billion of financing secured by our investments in real estate and $198.4 million of net repurchase agreements. See Item 2 – “Management’s Discussion and Analysis of Financial Condition and Results of Operations – Liquidity and Capital Resources” for additional details on our borrowings.
Share Repurchase Plan
We have adopted a share repurchase plan, whereby on a monthly basis, stockholders may request that we repurchase all or any portion of their shares. We may choose to repurchase all, some or none of the shares that have been requested to be repurchased at the end of any particular month, in our discretion, subject to any limitations in the share repurchase plan.
42
The total amount of aggregate repurchases of Class T, Class S, Class D, and Class I shares will be limited to 2% of the aggregate NAV per month and 5% of the aggregate NAV per calendar quarter.
Shares are repurchased at a price equal to the transaction price on the applicable repurchase date, subject to any early repurchase deduction. Shares that have not been outstanding for at least one year would be repurchased at 95% of the transaction price. Due to the illiquid nature of investments in real estate, we may not have sufficient liquid resources to fund repurchase requests and may elect not to repurchase some or all of the shares submitted for repurchase in a given period. Further, we may modify, suspend or terminate the share repurchase plan.
If the transaction price for the applicable month is not made available by the tenth business day prior to the last business day of the month (or is changed after such date), then no repurchase requests will be accepted for such month and stockholders who wish to have their shares repurchased the following month must resubmit their repurchase requests.
During the three months ended March 31, 2020, we repurchased shares of our common stock in the following amounts, which represented all of the share repurchase requests received for the same period.
|
|
|
|
|
|
|
|
|
|
|
|
|
|
|
|
|
|
|
Maximum Number of Shares Pending Repurchase Pursuant to Publicly Announced Plans or Programs (1) |
|
|
|
|
|
|
|
|
|
|
|
|
|
|
|
|
|
Total Number of Shared Repurchased as Part of Publicly Announced Plans or Programs |
|
|
|
|||
|
|
|
|
|
|
|
Repurchases as a Percentage of Shares Outstanding |
|
|
|
|
|
|
|
|
|
|||||
|
|
|
Total Number of Shares Repurchased |
|
|
|
|
Average Price Paid per Share |
|
|
|
|
|
||||||||
|
|
|
|
|
|
|
|
|
|
|
|
||||||||||
|
Month of: |
|
|
|
|
|
|
|
|
|
|
||||||||||
|
January 2020 |
|
|
288 |
|
|
0.00% |
|
|
$ |
21.62 |
|
|
|
288 |
|
|
|
— |
|
|
|
February 2020 |
|
|
16,678 |
|
|
0.03% |
|
|
|
21.69 |
|
|
|
16,678 |
|
|
|
— |
|
|
|
March 2020 |
|
|
28,753 |
|
|
0.04% |
|
|
|
21.22 |
|
|
|
28,753 |
|
|
|
— |
|
|
|
Total |
|
|
45,719 |
|
|
|
|
|
|
$ |
21.61 |
|
|
|
45,719 |
|
|
|
— |
|
|
(1) |
Repurchases are limited under the share repurchase plan as described above. Under the share repurchase plan, we would have been able to repurchase up to an aggregate of $62.5 million of Class S, Class T, Class D and Class I shares based on our February 29, 2020 NAV in the first quarter of 2020 (if such repurchase requests were made). Pursuant to the share repurchase plan, this amount resets at the beginning of each quarter. |
The Special Limited Partner holds 480,539 Class I units in the Operating Partnership. Any redemption of Class I units held by the Special Limited Partner would occur outside of our share repurchase plan.
None.
Not applicable.
Not applicable.
43
|
Exhibit Number |
|
Description |
|
|
|
|
|
3.1 |
|
|
|
|
|
|
|
3.2 |
|
|
|
|
|
|
|
3.3 |
|
|
|
|
|
|
|
10.1 |
|
reference to Exhibit 10.1 to the Company’s Current Report on Form 8-K filed on February 3, 2020) |
|
|
|
|
|
10.2 |
|
as Exhibit 10.1 hereof) |
|
|
|
|
|
10.3 |
|
|
|
|
|
|
|
31.1* |
|
Certification of Chief Executive Officer pursuant to Section 302 of the Sarbanes-Oxley Act of 2002 |
|
|
|
|
|
31.2* |
|
Certification of Chief Financial Officer pursuant to Section 302 of the Sarbanes-Oxley Act of 2002 |
|
|
|
|
|
32.1* |
|
|
|
|
|
|
|
32.2* |
|
|
|
|
|
|
|
101 |
|
The following information from the Company's Quarterly Report on Form 10-Q for the quarter ended March 31, 2020, formatted in XBRL (eXtensible Business Reporting Language): (i) Consolidated Balance Sheets; (ii) Consolidated Statements of Operations (iii) Consolidated Statements of Changes in Equity; and (iv) Consolidated Statements of Cash Flows |
|
* |
Filed herewith |
The agreements and other documents filed as exhibits to this report are not intended to provide factual information or other disclosure other than with respect to the terms of the agreements or other documents themselves, and you should not rely on them for that purpose. In particular, any representations and warranties made by us in these agreements or other documents were made solely within the specific context of the relevant agreement or document and may not describe the actual state of affairs as of the date they were made or at any other time.
44
Pursuant to the requirements of Section 13 or Section 15(d) of the Securities Exchange Act of 1934, the Registrant has duly caused this report to be signed on its behalf by the undersigned, thereunto duly authorized.
STARWOOD REAL ESTATE INCOME TRUST, INC.
|
May 12, 2020 |
|
/s/ John P. McCarthy, Jr. |
|
Date |
|
John P. McCarthy, Jr. |
|
|
|
Chief Executive Officer, President and Director (Principal Executive Officer) |
|
|
|
|
|
May 12, 2020 |
|
/s/ Dave Guiteau |
|
Date |
|
Dave Guiteau |
|
|
|
Chief Financial Officer and Treasurer (Principal Financial Officer and Principal Accounting Officer) |
45