Attached files
| file | filename |
|---|---|
| 8-K - FORM 8-K - KANSAS CITY SOUTHERN | ksu-20200512.htm |
Exhibit 99.1 KANSAS CITY SOUTHERN Bank of America 2020 Transportation and Industrials Conference th KCS May 12 , 2020
Safe Harbor Statement This presentation contains forward-looking statements within the meaning of Section 27A of the Securities Act of 1933, as amended, Section 21E of the Securities Exchange Act of 1934, as amended and the Private Securities Litigation Reform Act of 1995. In addition, management may make forward-looking statements orally or in other writing, including, but not limited to, in press releases, quarterly earnings calls, executive presentations, in the annual report to stockholders and in other filings with the Securities and Exchange Commission. Readers can usually identify these forward-looking statements by the use of such words as "may," "will," "should," "likely," "plans," "projects," "expects," "anticipates," "believes" or similar words. These statements involve a number of risks and uncertainties. Actual results could materially differ from those anticipated by such forward-looking statements as a result of a number of factors or combination of factors including, but not limited: public health threats or outbreaks of communicable diseases, such as the ongoing COVID-19 pandemic and its impact on KCS’s business, suppliers, consumers, customers, employees and supply chains; rail accidents or other incidents or accidents on KCS’s rail network or at KCS’s facilities or customer facilities involving the release of hazardous materials, including toxic inhalation hazards; legislative and regulatory developments and disputes, including environmental regulations; loss of the rail concession of Kansas City Southern’s subsidiary, Kansas City Southern de México, S.A. de C.V.; domestic and international economic, political and social conditions; disruptions to the Company’s technology infrastructure, including its computer systems; increased demand and traffic congestion; the level of trade between the United States and Asia or Mexico; fluctuations in the peso-dollar exchange rate; natural events such as severe weather, hurricanes and floods; the outcome of claims and litigation involving the Company or its subsidiaries; competition and consolidation within the transportation industry; the business environment in industries that produce and use items shipped by rail; the termination of, or failure to renew, agreements with customers, other railroads and third parties; fluctuation in prices or availability of key materials, in particular diesel fuel; access to capital; climate change and the market and regulatory responses to climate change; dependency on certain key suppliers of core rail equipment; changes in securities and capital markets; unavailability of qualified personnel; labor difficulties, including strikes and work stoppages; acts of terrorism or risk of terrorist activities, war or other acts of violence; and other factors affecting the operation of the business; and other risks identified in this presentation, in KCS's Annual Report on Form 10-K for the year ended December 31, 2019, and in other reports filed by KCS with the Securities and Exchange Commission. Forward-looking statements reflect the information only as of the date on which they are made. KCS does not undertake any obligation to update any forward-looking statements to reflect future events, developments, or other information. Reconciliation to U.S. GAAP Financial Information In addition to disclosing financial results in accordance with U.S. GAAP, the accompanying presentation contains non-GAAP financial measures. These non-GAAP measures should be viewed as a supplement to and not a substitute for our U.S. GAAP measures of performance and liquidity, and the financial results calculated in accordance with U.S. GAAP and reconciliations from these results should be carefully evaluated. All reconciliations to the most directly comparable financial measures calculated and presented in accordance with U.S. GAAP can be found on the KCS's website in the Investors section. © KANSAS © KANSAS CITY SOUTHERN KCS 2
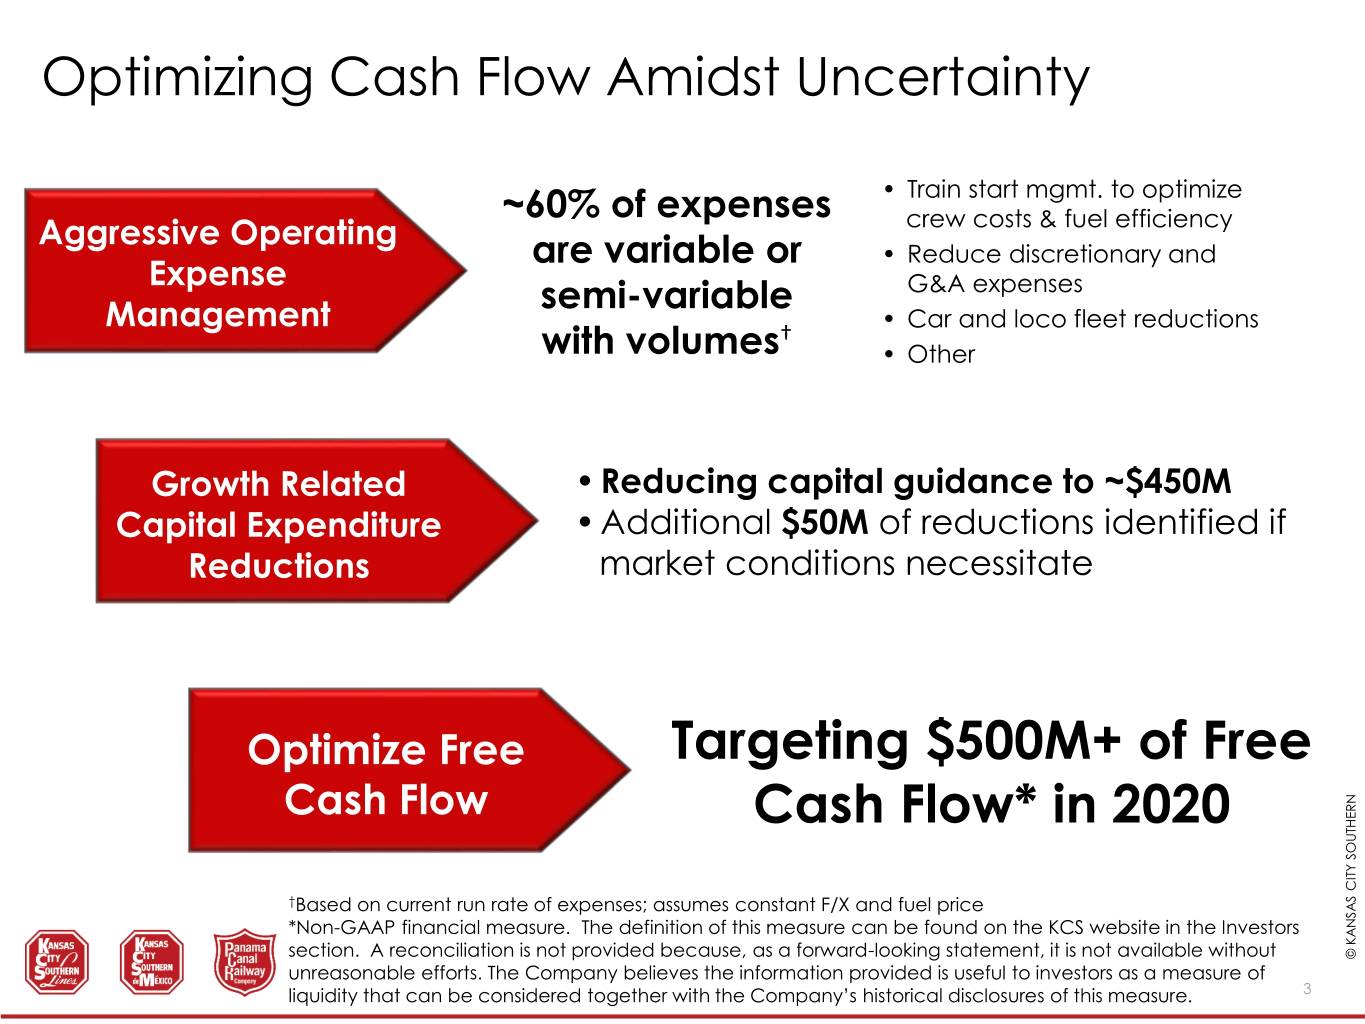
Optimizing Cash Flow Amidst Uncertainty ~60% of expenses • Train start mgmt. to optimize Aggressive Operating crew costs & fuel efficiency are variable or • Reduce discretionary and Expense semi-variable G&A expenses Management • Car and loco fleet reductions † with volumes • Other Growth Related • Reducing capital guidance to ~$450M Capital Expenditure • Additional $50M of reductions identified if Reductions market conditions necessitate Optimize Free Targeting $500M+ of Free Cash Flow Cash Flow* in 2020 †Based on current run rate of expenses; assumes constant F/X and fuel price *Non-GAAP financial measure. The definition of this measure can be found on the KCS website in the Investors section. A reconciliation is not provided because, as a forward-looking statement, it is not available without © KANSAS CITY SOUTHERN unreasonable efforts. The Company believes the information provided is useful to investors as a measure of KCS liquidity that can be considered together with the Company’s historical disclosures of this measure. 3
COMMERCIAL UPDATE © KANSAS © KANSAS CITY SOUTHERN KCS 4
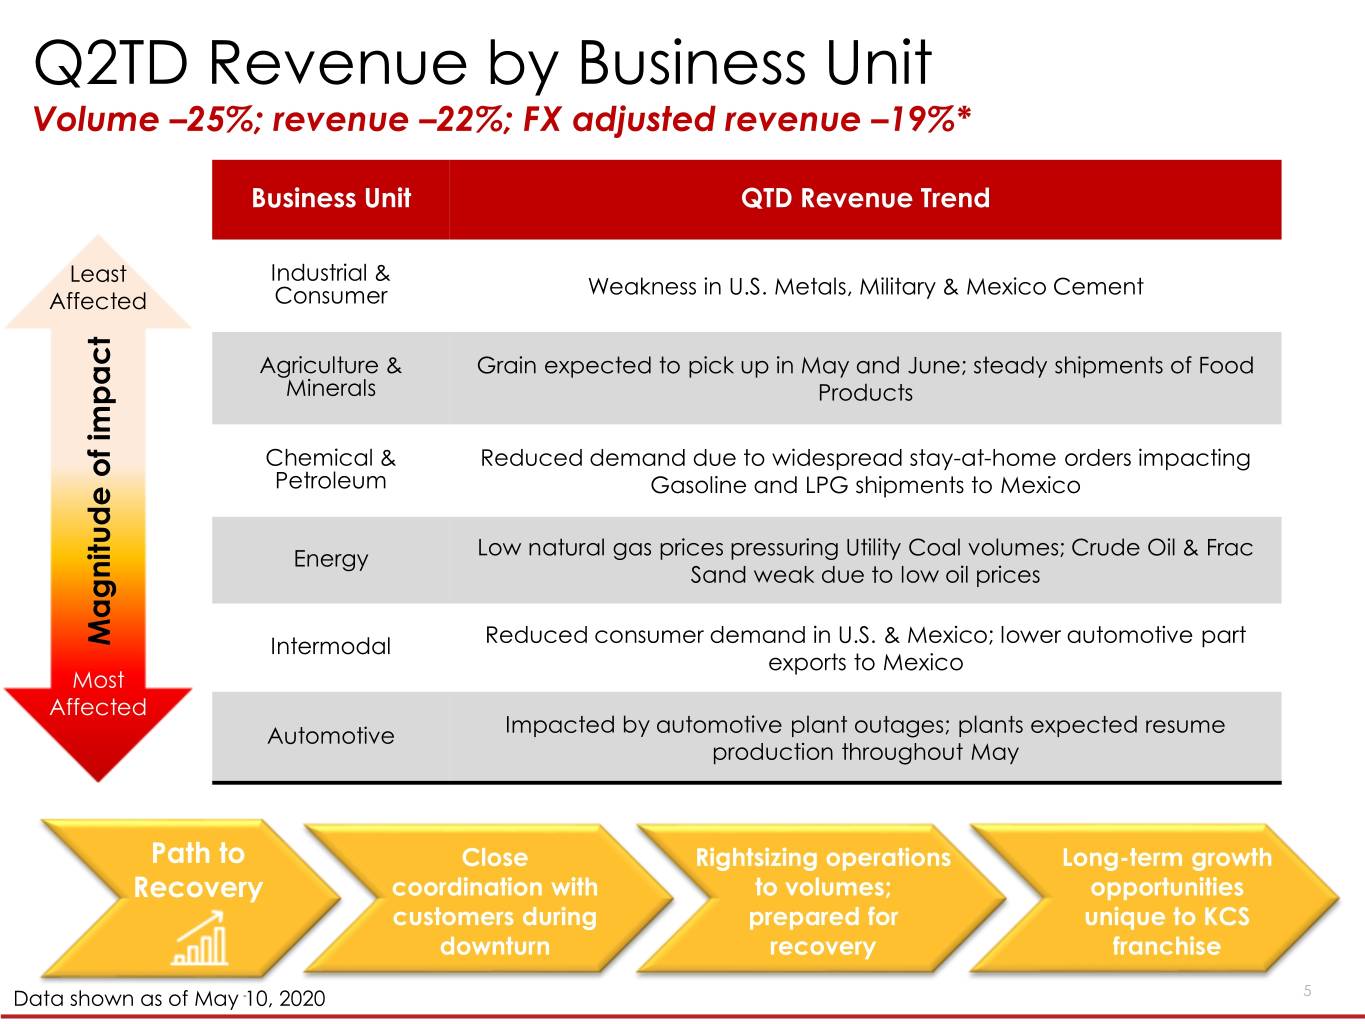
Q2TD Revenue by Business Unit Volume –25%; revenue –22%; FX adjusted revenue –19%* Business Unit QTD Revenue Trend Least Industrial & Weakness in U.S. Metals, Military & Mexico Cement Affected Consumer Agriculture & Grain expected to pick up in May and June; steady shipments of Food Minerals Products Chemical & Reduced demand due to widespread stay-at-home orders impacting Petroleum Gasoline and LPG shipments to Mexico Energy Low natural gas prices pressuring Utility Coal volumes; Crude Oil & Frac Sand weak due to low oil prices Magnitude of impact Intermodal Reduced consumer demand in U.S. & Mexico; lower automotive part exports to Mexico Most Affected Automotive Impacted by automotive plant outages; plants expected resume production throughout May Path to Close Rightsizing operations Long-term growth Recovery coordination with to volumes; opportunities customers during prepared for unique to KCS downturn recovery franchise © KANSAS CITY SOUTHERN Data shownK CSas of May 10, 2020 5
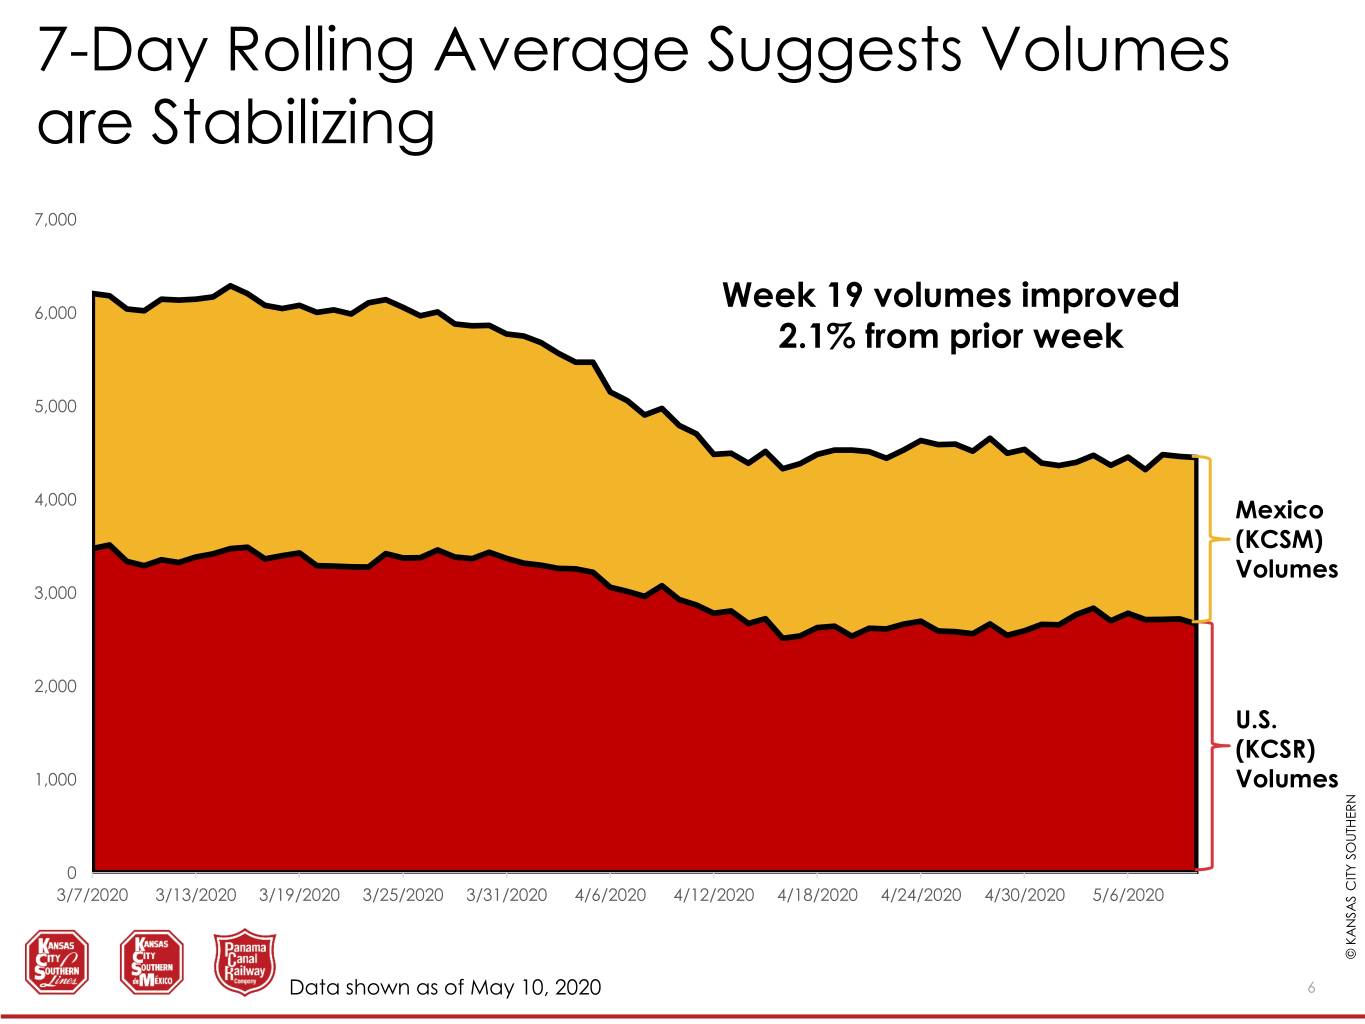
7-Day Rolling Average Suggests Volumes are Stabilizing 7,000 6,000 Week 19 volumes improved 2.1% from prior week 5,000 4,000 Mexico (KCSM) Volumes 3,000 2,000 U.S. (KCSR) 1,000 Volumes 0 3/7/2020 3/13/2020 3/19/2020 3/25/2020 3/31/2020 4/6/2020 4/12/2020 4/18/2020 4/24/2020 4/30/2020 5/6/2020 © KANSAS © KANSAS CITY SOUTHERN KCS Data shown as of May 10, 2020 6
PSR & EXPENSE MANAGEMENT © KANSAS © KANSAS CITY SOUTHERN KCS 7
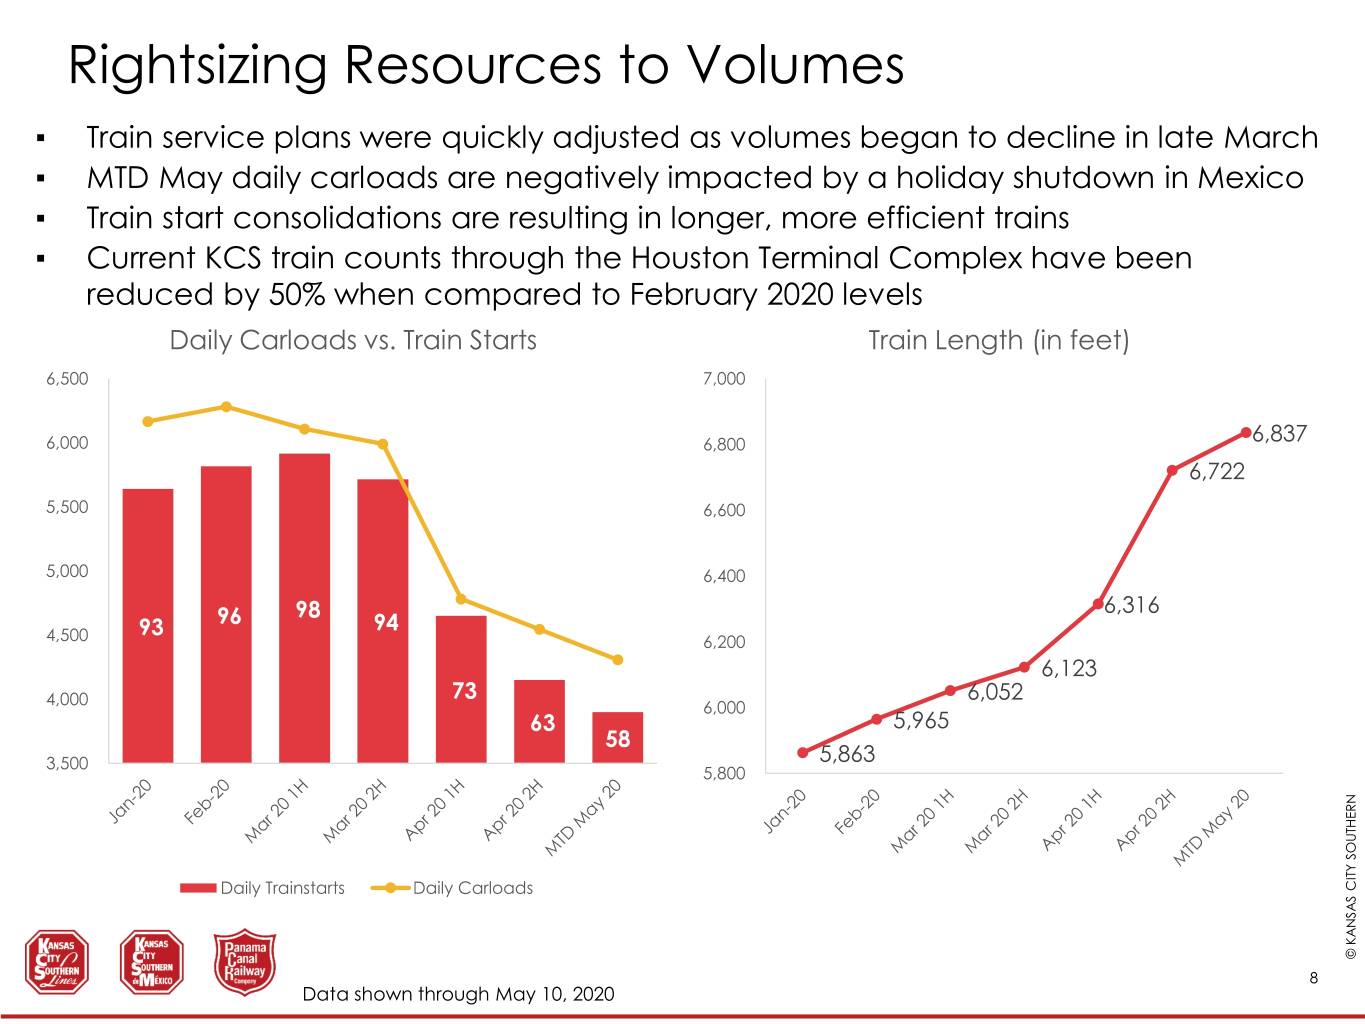
Rightsizing Resources to Volumes ▪ Train service plans were quickly adjusted as volumes began to decline in late March ▪ MTD May daily carloads are negatively impacted by a holiday shutdown in Mexico ▪ Train start consolidations are resulting in longer, more efficient trains ▪ Current KCS train counts through the Houston Terminal Complex have been reduced by 50% when compared to February 2020 levels Daily Carloads vs. Train Starts Train Length (in feet) 6,500 7,000 6,000 6,800 6,837 6,722 5,500 6,600 5,000 6,400 98 6,316 93 96 94 4,500 6,200 6,123 73 6,052 4,000 6,000 63 5,965 58 3,500 5,863 5,800 Daily Trainstarts Daily Carloads © KANSAS © KANSAS CITY SOUTHERN 8 KCS Data shown through May 10, 2020
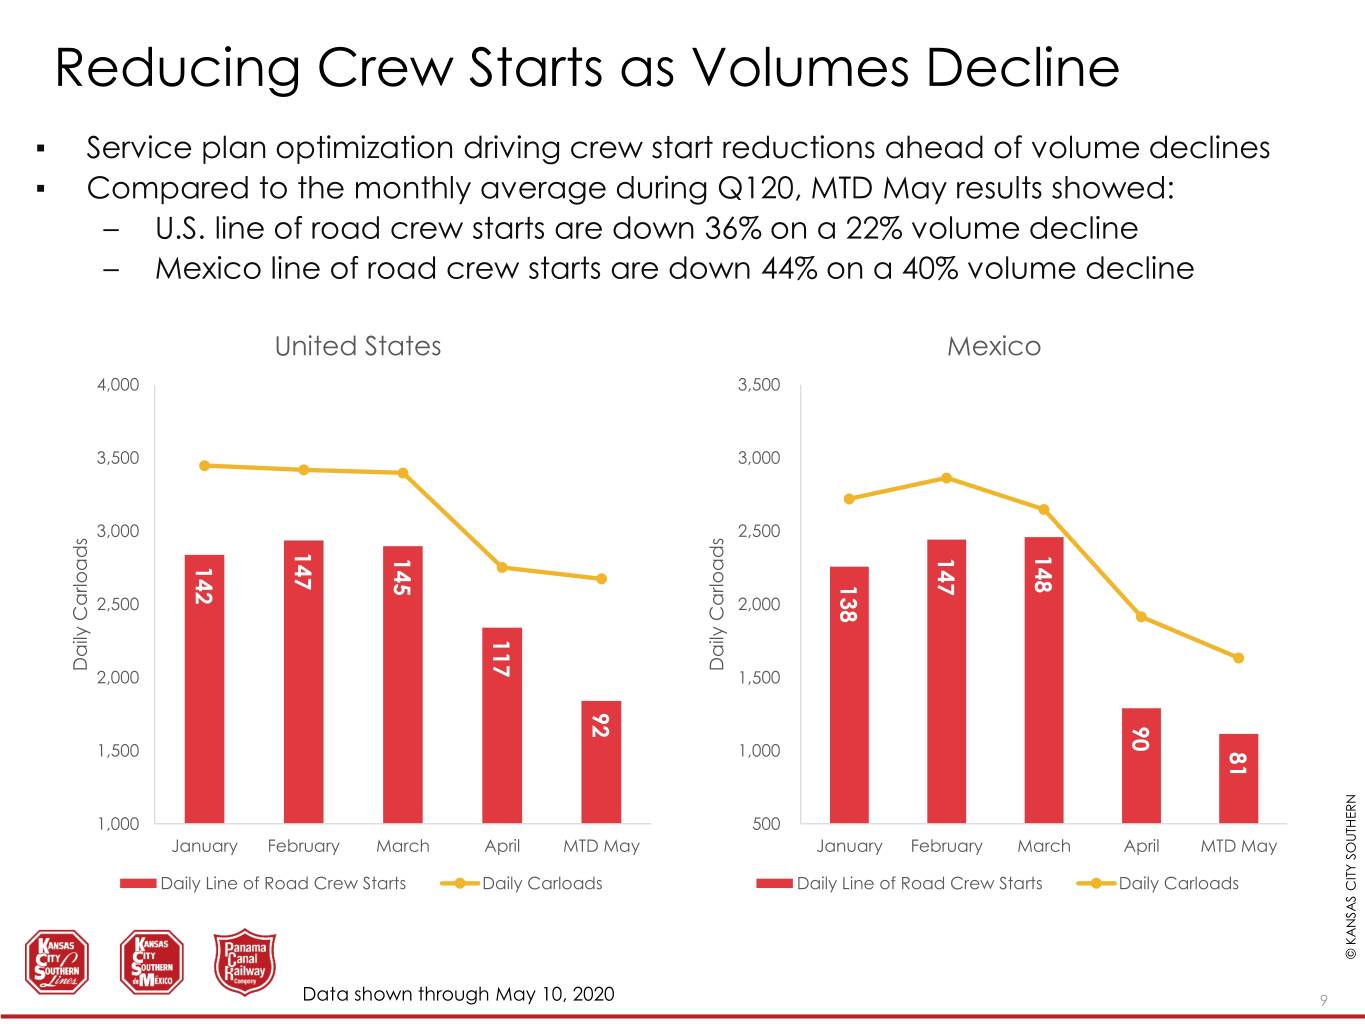
Reducing Crew Starts as Volumes Decline ▪ Service plan optimization driving crew start reductions ahead of volume declines ▪ Compared to the monthly average during Q120, MTD May results showed: – U.S. line of road crew starts are down 36% on a 22% volume decline – Mexico line of road crew starts are down 44% on a 40% volume decline United States Mexico 4,000 3,500 3,500 3,000 3,000 2,500 147 148 148 147 147 145 142 138 138 2,500 2,000 117 DailyCarloads DailyCarloads 2,000 1,500 92 90 90 1,500 1,000 81 1,000 500 January February March April MTD May January February March April MTD May Daily Line of Road Crew Starts Daily Carloads Daily Line of Road Crew Starts Daily Carloads © KANSAS © KANSAS CITY SOUTHERN KCS Data shown through May 10, 2020 9
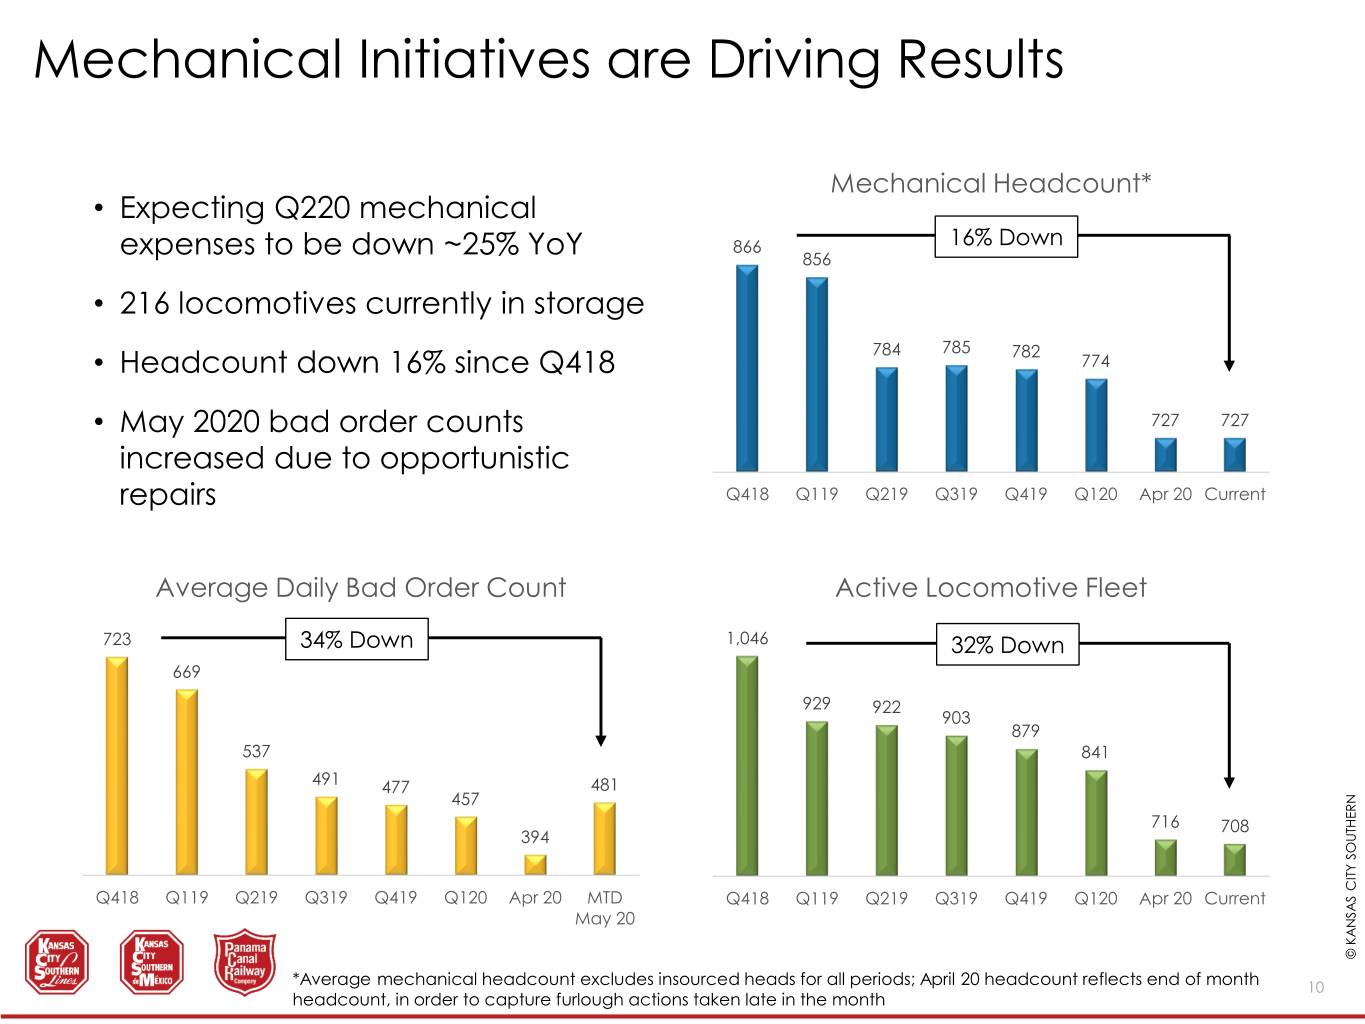
Mechanical Initiatives are Driving Results Mechanical Headcount* • Expecting Q220 mechanical 866 16% Down expenses to be down ~25% YoY 856 • 216 locomotives currently in storage 784 785 782 • Headcount down 16% since Q418 774 • May 2020 bad order counts 727 727 increased due to opportunistic repairs Q418 Q119 Q219 Q319 Q419 Q120 Apr 20 Current Average Daily Bad Order Count Active Locomotive Fleet 723 34% Down 1,046 32% Down 669 929 922 903 879 537 841 491 477 481 457 716 708 394 Q418 Q119 Q219 Q319 Q419 Q120 Apr 20 MTD Q418 Q119 Q219 Q319 Q419 Q120 Apr 20 Current May 20 © KANSAS © KANSAS CITY SOUTHERN *Average mechanical headcount excludes insourced heads for all periods; April 20 headcount reflects end of month 10 KCS headcount, in order to capture furlough actions taken late in the month
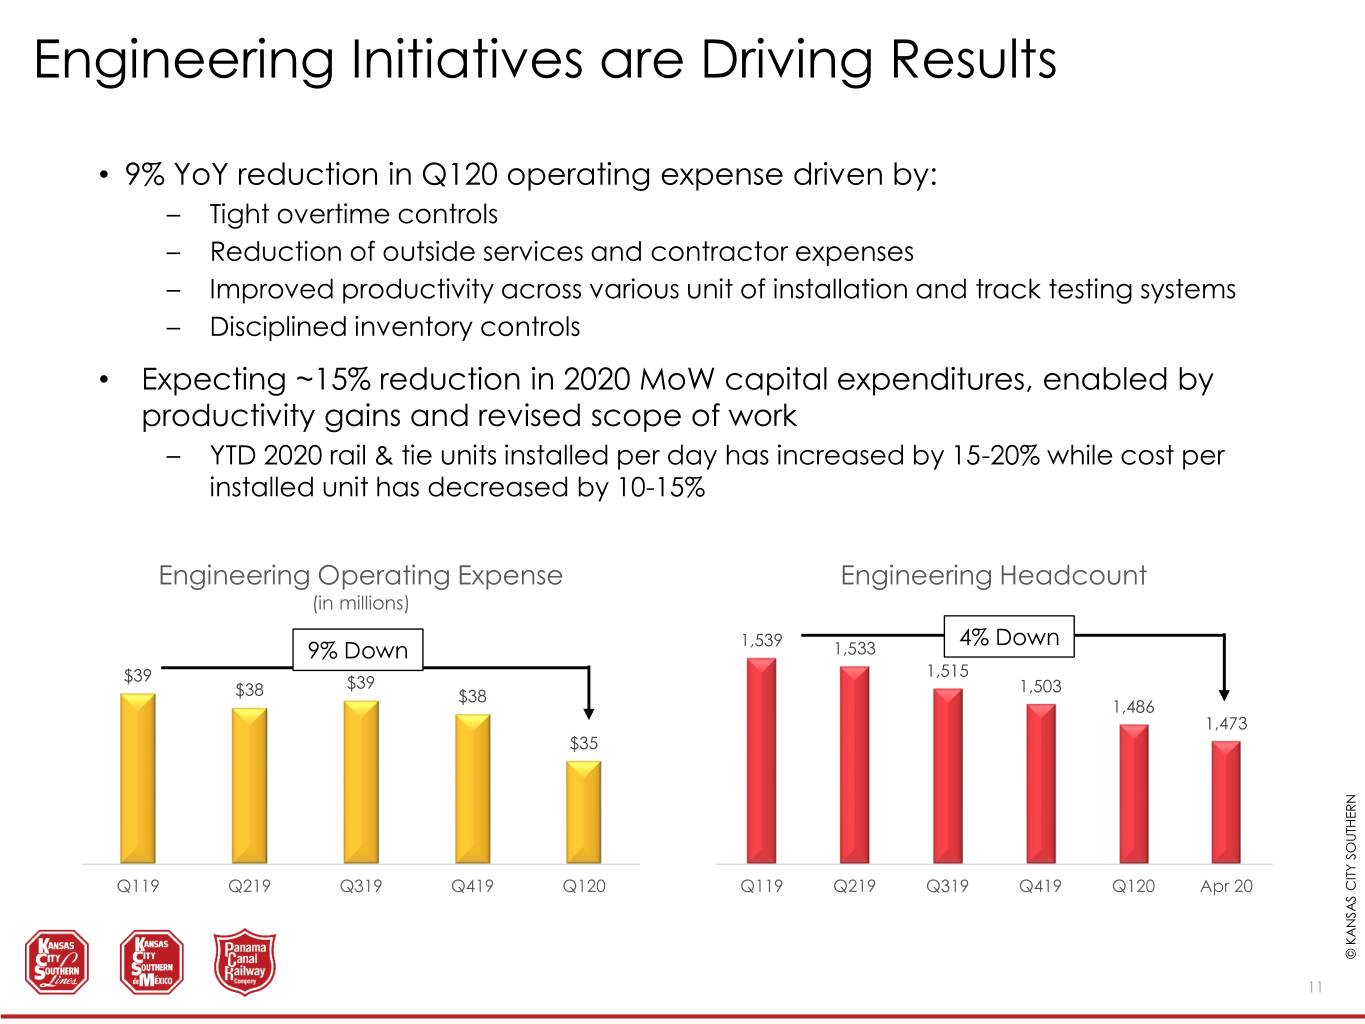
Engineering Initiatives are Driving Results • 9% YoY reduction in Q120 operating expense driven by: – Tight overtime controls – Reduction of outside services and contractor expenses – Improved productivity across various unit of installation and track testing systems – Disciplined inventory controls • Expecting ~15% reduction in 2020 MoW capital expenditures, enabled by productivity gains and revised scope of work – YTD 2020 rail & tie units installed per day has increased by 15-20% while cost per installed unit has decreased by 10-15% Engineering Operating Expense Engineering Headcount (in millions) 1,539 4% Down 9% Down 1,533 $39 1,515 $39 1,503 $38 $38 1,486 1,473 $35 Q119 Q219 Q319 Q419 Q120 Q119 Q219 Q319 Q419 Q120 Apr 20 © KANSAS © KANSAS CITY SOUTHERN KCS 11
Thank You! www.KCSouthern.com © KANSAS © KANSAS CITY SOUTHERN KCS 12
