Attached files
| file | filename |
|---|---|
| EX-99.1 - EX-99.1 - Verso Corp | d917381dex991.htm |
| 8-K - 8-K - Verso Corp | vrs-8k_20200511.htm |
Exhibit 99.2

Verso First Quarter 2020 Results Earnings Conference Call and Webcast – May 11, 2020 Verso turn to us
Forward Looking Statements & Non-GAAP Financial Information 1 In this presentation, all statements that are not purely historical facts are forward-looking statements within the meaning of Section 27A of the Securities Act of 1933 and Section 21E of the Securities Exchange Act of 1934. Forward-looking statements may be identified by the words "believe," "expect," "anticipate," "project," "plan," "estimate," "intend," “potential,” “will,” “may” and other similar expressions. Forward-looking statements are based on currently available business, economic, financial, and other information and reflect management's current beliefs, expectations, and views with respect to future developments and their potential effects on Verso. Actual results could vary materially depending on risks and uncertainties that may affect Verso and its business. Verso’s actual actions and results may differ materially from what is expressed or implied by these statements due to a variety of factors, including, without limitation, uncertainties regarding the duration and severity of the COVID-19 pandemic and measures intended to reduce its spread; the long-term structural decline and general softening of demand facing the paper industry; adverse developments in general business and economic conditions; developments in alternative media, which are expected to adversely affect the demand for some of Verso's key products, and the effectiveness of Verso's responses to these developments; intense competition in the paper manufacturing industry; Verso's ability to compete with respect to certain specialty paper products for a period of two years after the closing of the sale of Verso's Androscoggin and Stevens Point mills and related assets (the "Pixelle Sale"); Verso's business being less diversified following the sale of two mills in the Pixelle Sale; Verso's dependence on a small number of customers for a significant portion of its business; Verso's limited ability to control the pricing of its products or pass through increases in its costs to its customers; changes in the costs of raw materials and purchased energy; negative publicity, even if unjustified; any failure to comply with environmental or other laws or regulations, even if inadvertent; legal proceedings or disputes; any labor disputes, and the potential risks and uncertainties described under the caption “Risk Factors” in Verso’s Annual Report on Form 10-K for the fiscal year ended December 31, 2019, Verso’s Quarterly Report on Form 10-Q for the three months ended March 31, 2020, and from time to time in Verso’s other filings with the Securities and Exchange Commission. Verso assumes no obligation to update any forward-looking statement made in this presentation to reflect subsequent events or circumstances or actual outcomes. Non-GAAP Financial Information This presentation contains certain non-GAAP financial information relating to Verso, including EBITDA, Adjusted EBITDA, Adjusted EBITDA Margin, Mill Adjusted Net Sales and Mill Adjusted EBITDA. Definitions and reconciliations of these non-GAAP measures are included in this presentation. Because EBITDA, Adjusted EBITDA, Adjusted EBITDA Margin, Mill Adjusted Net Sales and Mill Adjusted EBITDA are not measurements determined in accordance with GAAP and are susceptible to varying calculations, EBITDA, Adjusted EBITDA, Adjusted EBITDA Margin, Mill Adjusted Net Sales and Mill Adjusted EBITDA as presented may not be comparable to similarly titled measures of other companies. You should consider our EBITDA, Adjusted EBITDA, Adjusted EBITDA Margin, Mill Adjusted Net Sales and Mill Adjusted EBITDA in addition to, and not as a substitute for or superior to, our operating or net income, which are determined in accordance with GAAP. See the Appendix in this presentation for additional information on EBITDA, Adjusted EBITDA, Adjusted EBITDA Margin, Mill Adjusted Net Sales and Mill Adjusted EBITDA.

VERSO BUSINESS UPDATE ADAM ST. JOHN PRESIDENT AND CEO

COVID-19 Update Despite challenges resulting from the COVID-19 pandemic, Verso remains focused on delivering value to all stakeholders. • Manufacturing facilities are operating per government guidelines and CDC recommendations • Corporate staff and essential workers successfully transitioned to “stay at home” state orders and are taking necessary precautions to stay healthy and safe while continuing to operate our business • Our raw materials supply chain remains solid with no anticipated supply issues • We have the expertise and flexibility to adapt to our customers’ needs through increased product development efforts into higher-demand Specialty, Packaging and Pulp grades • We continue to provide high level of service throughout our order management and delivery processes • Our financial position remains strong

Q1 2020 Highlights • Q1 2020 Adjusted EBITDA1 of $35M and Adjusted EBITDA margin1 of 7.4% – Results include revenue from Androscoggin and Stevens Point mills through February 9 Achieved good safety performance in Q1 2020, with a TIR of 0.64 • Completed sale of Androscoggin and Stevens Point mills • Implemented phase one conversion to Containerboard at Duluth Mill • Remained focused on managing costs and maintaining industry low SG&A levels • Repurchased $2.7M or 205,000 shares during Q1 2020 – We expect to continue repurchase activity and initiate a $0.10/share quarterly dividend in Q2 • Maintained a healthy balance sheet with liquidity of $498M2 1 See Appendix for definitions of EBITDA, Adjusted EBITDA and Adjusted EBITDA Margin. EBITDA, Adjusted EBITDA and Adjusted EBITDA Margin are non-GAAP Measures. 2 Includes $350M ABL facility limited by borrowing base and inclusive of cash. Dollars in Millions Q1-20 Sales $471 Adj. EBITDA1 $ 35 Adj. EBITDA Margin1 7.4% Verso

Key Actions in Response to Current Economic Environment Given the current environment, it is difficult to forecast the continuing impact of COVID-19 on our business. When you apply industry forecast1 across Verso’s book of business, we could experience approximately a 40% decline in shipments for Q2 vs. the prior year. Key Actions in Response • Accelerated and expanded workforce reduction, eliminating approximately 95 positions • Implementing austerity measures company-wide, including reducing mill operating costs • Reduced planned capital spend by $11M • Managing inventory by taking 110,000 to 120,000 tons of downtime in Q2 • Accelerating new product development in Specialty, Packaging and Pulp grades • Deferred certain compensation programs and payroll taxes (per the CARES Act) • Implemented company-wide hiring freeze 1 RISI April 2020 Paper Trader. Verso

VERSO EBITDA FINANCIAL UPDATE ALLEN CAMPBELL SENIOR VICE PRESIDENT AND CFO

Key Metrics Net Sales $M $ 639 $ 471 Operating Income $M $ 37 $ 76 Net Income $M $ 36 $ 54 Adjusted EBITDA1 $M $ 69 $ 35 Adj. EBITDA Margin1 % 10.8% 7.4% EPS - Diluted $/share $ 1.03 $ 1.52 Mill Adjusted Net Sales1,2 $M $ 508 $ 412 Mill Adjusted1,2 EBITDA $M $ 64 $ 31 I Q1 19 Q1 20 Current Mill2 System Q1 20 Net Sales Income Statement Graphic 76% 74% Specialty 15% 16% Pulp 6% 6% Packaging 3% 4% Net sales includes Androscoggin and Stevens Point mills from Q1 2019 through February 9, 2020 • Business continues to focus on growth of Packaging and Specialty papers while maintaining premium supplier position in Graphic papers • Net income driven by gain on sale of Androscoggin and Stevens Point mills 1 See Appendix for definitions of Mill Adjusted Net Sales, EBITDA, Adjusted EBITDA, Mill Adjusted EBITDA and Adjusted EBITDA Margin. Mill Adjusted Net Sales, EBITDA, Adjusted EBITDA, Mill Adjusted EBITDA and Adjusted EBITDA Margin are non-GAAP Measures. | 2 Excludes sales from the Androscoggin and Stevens Point mills, which were sold on February 9, 2020.

Q1 2020 Adjusted EBITDA Reconciliation (Dollars in millions) Q1-20 Net income $ 54 Income tax expense 26 Interest expense - Depreciation and amortization 23 EBITDA $ 103 Restructuring charges 6 Luke Mill post-closure costs 3 Non-cash equity award compensation 2 Gain on Sale of the Androscoggin/Stevens Point Mills (88) Other severance costs 4 Shareholders proxy solicitation costs 4 Other items, net 1 Adjusted EBITDA $ 35 Adjusted EBITDA Margin % 7.4% • Fed. income tax primarily on gain from sale of mills. Various deductions will reduce cash impact to zero • $88M of gain associated with the sale of the mills subject to final working capital adjustments • $9M of costs associated with the Luke Mill including restructuring (tank cleaning) and post-closure costs (waste water treatment, electricity, security, property taxes and environmental remediation) • Other severance costs as a result of position eliminations and reorganization verso

Q1 2019 to Q1 2020 Adjusted EBITDA1 Bridge ($M) Q1-19 Luke Downtime Q1-20 1 Input Costs Major Maintenance Sold Mills Price/ Mix Volume 2 Freight OPS SG&A 69 Pension Continued pressure on Graphic and Specialty pricing with Pulp pricing at Q4 2019 levels • Graphic and Specialty papers volume declining, while Packaging and Pulp volume increasing • Inflation favorable in most categories, with exception of wood • Lower fuel costs and demand benefiting freight costs • Favorable SG&A driven by continued cost-cutting initiatives1 See Appendix for definitions of EBITDA, Adjusted EBITDA and Adjusted EBITDA Margin. EBITDA, Adjusted EBITDA and Adjusted EBITDA Margin are non-GAAP Measures. Other than as shown for Q1 2019 and Q1 2020, the numbers in the bridge exclude the impact of the Androscoggin and Stevens Point mills. Verso
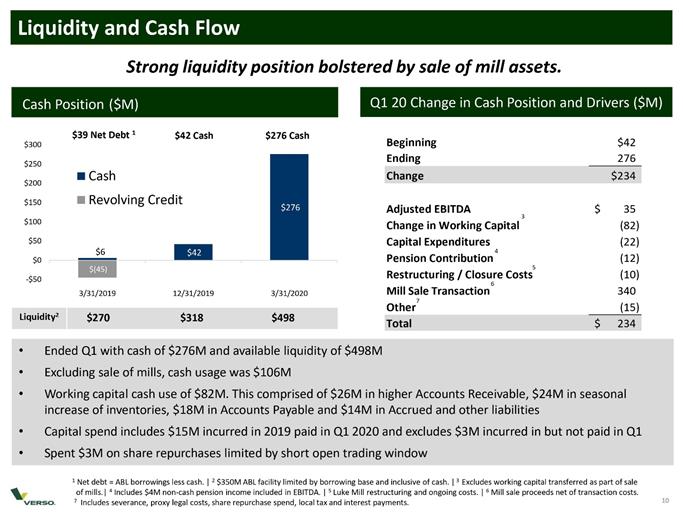
Liquidity and Cash Flow 10 • Ended Q1 with cash of $276M and available liquidity of $498M • Excluding sale of mills, cash usage was $106M • Working capital cash use of $82M. This comprised of $26M in higher Accounts Receivable, $24M in seasonal increase of inventories, $18M in Accounts Payable and $14M in Accrued and other liabilities • Capital spend includes $15M incurred in 2019 paid in Q1 2020 and excludes $3M incurred in but not paid in Q1 • Spent $3M on share repurchases limited by short open trading window Cash Position ($M) Liquidity2 $270 $318 $498 Strong liquidity position bolstered by sale of mill assets. $(45) $6 $42 $276 -$50 $0 $50 $100 $150 $200 $250 $300 3/31/2019 12/31/2019 3/31/2020 Cash Revolving Credit $39 Net Debt 1 $42 Cash $276 Cash Q1 20 Change in Cash Position and Drivers ($M) Beginning $42 Ending 276 Change $234 Adjusted EBITDA $ 35 Change in Working Capital (82) Capital Expenditures (22) Pension Contribution (12) Restructuring / Closure Costs (10) Mill Sale Transaction 340 Other (15) Total $ 234 1 Net debt = ABL borrowings less cash. | 2 $350M ABL facility limited by borrowing base and inclusive of cash. | 3 Excludes working capital transferred as part of sale of mills.| 4 Includes $4M non-cash pension income included in EBITDA. | 5 Luke Mill restructuring and ongoing costs. | 6 Mill sale proceeds net of transaction costs. 7 Includes severance, proxy legal costs, share repurchase spend, local tax and interest payments. Verso

Return of Capital 11 • The Board authorized up to $250M of net proceeds from the Androscoggin and Stevens Point mills sale to be used to repurchase outstanding shares of the company common stock. The company repurchased 205,000 shares during Q1 2020 and repurchases were constrained to a 4 -day trading window • The company plans to continue its open market shares purchases in Q2 2020. At current trading volume and price, the company estimates it could repurchase up to approximately $23M worth of shares in Q2 2020 • However, the pacing of any repurchase activity will be highly dependent on market conditions created by the current global COVID -19 pandemic • Additionally, the company expects to initiate a quarterly dividend of $0.10 per share in Q2 2020 Verso

VERSO APPENDIX
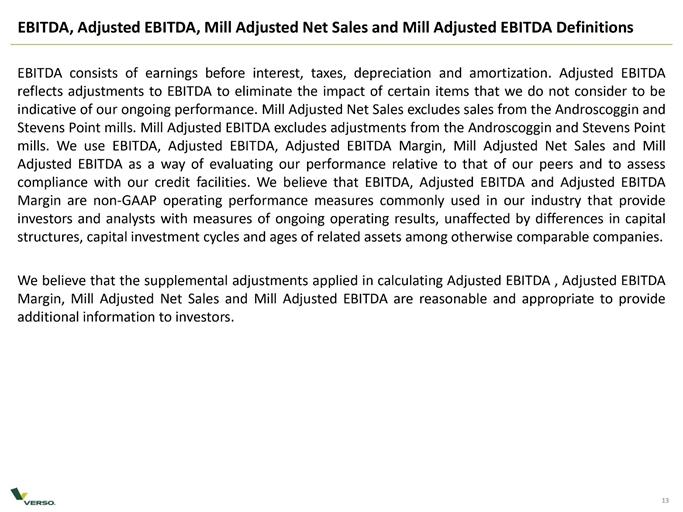
EBITDA, Adjusted EBITDA, Mill Adjusted Net Sales and Mill Adjusted EBITDA Definitions 13 EBITDA consists of earnings before interest, taxes, depreciation and amortization. Adjusted EBITDA reflects adjustments to EBITDA to eliminate the impact of certain items that we do not consider to be indicative of our ongoing performance. Mill Adjusted Net Sales excludes sales from the Androscoggin and Stevens Point mills. Mill Adjusted EBITDA excludes adjustments from the Androscoggin and Stevens Point mills. We use EBITDA, Adjusted EBITDA, Adjusted EBITDA Margin, Mill Adjusted Net Sales and Mill Adjusted EBITDA as a way of evaluating our performance relative to that of our peers and to assess compliance with our credit facilities. We believe that EBITDA, Adjusted EBITDA and Adjusted EBITDA Margin are non-GAAP operating performance measures commonly used in our industry that provide investors and analysts with measures of ongoing operating results, unaffected by differences in capital structures, capital investment cycles and ages of related assets among otherwise comparable companies. We believe that the supplemental adjustments applied in calculating Adjusted EBITDA , Adjusted EBITDA Margin, Mill Adjusted Net Sales and Mill Adjusted EBITDA are reasonable and appropriate to provide additional information to investors.

Major Maintenance1 – Current Operating Platform 14 36 3 22 5 6 38 1 20 15 2 33 - 16 14 3 2018 2019 2020F 2018 2019 2020 2018 2019 2020F 2018 2019 2020F 2018 2019 2020F FY Q1 Q2 Q3 Q4 Major Outage Timing Q1 Q2 Q3 Q4 2018 No Major Outage Quinnesec Wisconsin Rapids No Major Outage Escanaba 2019 No Major Outage Wisconsin Rapids Escanaba No Major Outage 2020F No Major Outage Quinnesec Wisconsin Rapids Escanaba No Major Outage $M 1 The 2020F data includes the austerity measures disclosed on slide 5.

Q1 2019 and Q1 2020 Adjusted EBITDA Reconciliation 15 (Dollars in millions) Q1-19 Q1-20 QoQ Δ Net income $ 36 $ 54 $ 18 Income tax expense 1 26 25 Interest expense 1 - (1) Depreciation and amortization 28 23 (5) EBITDA $ 66 $ 103 $ 37 Restructuring charges - 6 6 Luke Mill post-closure costs - 3 3 Non-cash equity award compensation 2 2 - Gain on Sale of the Androscoggin/Stevens Point Mills - (88) (88) (Gain) loss on sale or disposal of assets 1 - (1) Other severance costs - 4 4 Shareholders proxy solicitation costs - 4 4 Other items, net - 1 1 Adjusted EBITDA $ 69 $ 35 $ (34) Adjusted EBITDA Margin % 10.8% 7.4% -3.4%
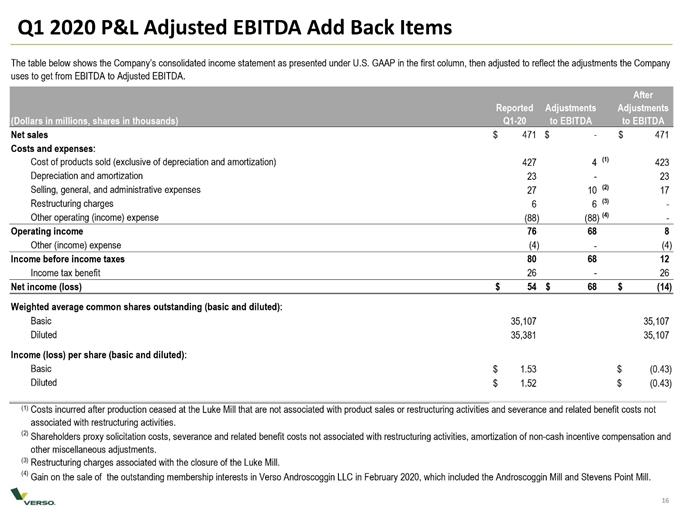
Q1 2020 P&L Adjusted EBITDA Add Back Items (Dollars in millions, shares in thousands) Reported Q1-20 Adjustments to EBITDA After Adjustments to EBITDA Net sales $ 471 $ - $ 471 Costs and expenses: Cost of products sold (exclusive of depreciation and amortization) 427 4 (1) 423 Depreciation and amortization 23 - 23 Selling, general, and administrative expenses 27 10 (2) 17 Restructuring charges 6 6 (3) - Other operating (income) expense (88) (88) (4) - Operating income 76 68 8 Other (income) expense (4) - (4) Income before income taxes 80 68 12 Income tax benefit 26 - 26 Net income (loss) $ 54 $ 68 $ (14) Weighted average common shares outstanding (basic and diluted): Basic 35,107 35,107 Diluted 35,381 35,107 Income (loss) per share (basic and diluted): Basic $ 1.53 $ (0.43) Diluted $ 1.52 $ (0.43) (1) (2) (3) (4) The table below shows the Company’s consolidated income statement as presented under U.S. GAAP in the first column, then adjusted to reflect the adjustments the Company uses to get from EBITDA to Adjusted EBITDA. Costs incurred after production ceased at the Luke Mill that are not associated with product sales or restructuring activities and severance and related benefit costs not associated with restructuring activities. Shareholders proxy solicitation costs, severance and related benefit costs not associated with restructuring activities, amortization of non-cash incentive compensation and other miscellaneous adjustments. Restructuring charges associated with the closure of the Luke Mill. Gain on the sale of the outstanding membership interests in Verso Androscoggin LLC in February 2020, which included the Androscoggin Mill and Stevens Point Mill.

Q1 2019 P&L Adjusted EBITDA Add Back Items (Dollars in millions, shares in thousands) Reported Q1-19 Adjustments to EBITDA After Adjustments to EBITDA Net sales $ 639 $ - $ 639 Costs and expenses: Cost of products sold (exclusive of depreciation and amortization) 549 - 549 Depreciation and amortization 28 - 28 Selling, general, and administrative expenses 24 3 (1) 21 Other operating (income) expense 1 - 1 Operating income 37 (3) 40 Interest expense 1 - 1 Other (income) expense (1) - (1) Income before income taxes 37 (3) 40 Income tax benefit 1 - 1 Net income $ 36 $ (3) $ 39 Weighted average common shares outstanding (basic and diluted): Basic 34,484 34,484 Diluted 35,225 35,225 Income per share (basic and diluted): Basic $ 1.05 $ 1.14 Diluted $ 1.03 $ 1.11 (1) The table below shows the Company’s consolidated income statement as presented under U.S. GAAP in the first column, then adjusted to reflect the adjustments the Company uses to get from EBITDA to Adjusted EBITDA. Amortization of non-cash incentive compensation and other miscellaneous adjustments.

TTM Adjusted EBITDA Reconciliation 18 12 Months Three Months Three Months 12 Months Ended Ended Ended Ended December 31, March 31, March 31, March 31, (Dollars in millions) 2019 2019 2020 2020 Net income $ 96 $ 36 $ 54 $ 114 Income tax expense (benefit) (117) 1 26 (92) Interest expense 2 1 - 1 Depreciation and amortization 183 28 23 178 EBITDA $ 164 $ 66 $ 103 $ 201 Adjustments to EBITDA: Restructuring charges (1) 52 - 6 58 Luke Mill post-closure costs (2) 9 - 3 12 Non-cash equity award compensation (3) 12 2 2 12 Gain on Sale of the Androscoggin/Stevens Point Mills (4) - - (88) (88) (Gain) loss on sale or disposal of assets (5) 2 1 - 1 Shareholders proxy solicitation costs (6) 1 - 4 5 Other severance costs (7) 4 - 4 8 Strategic initiatives costs (8) 6 - - 6 Other items, net (9) 1 - 1 2 Adjusted EBITDA (10) $ 251 $ 69 $ 35 $ 217 (1) (2) (3) (4) (5) (6) (7) (8) (9) (10) Adjusted EBITDA includes $13 million of income related to a pension settlement gain recorded in the fourth quarter of 2019. Costs incurred in connection with the shareholders proxy solicitation contest. Other miscellaneous adjustments. Charges are primarily associated with the closure of the Luke Mill. Gain on the sale of the outstanding membership interests in Verso Androscoggin LLC in February 2020, which included the Androscoggin Mill and Stevens Point Mill. Realized (gain) loss on the sale or disposal of assets. Amortization of non-cash incentive compensation. Severance and related benefit costs not associated with restructuring activities. Professional fees and other charges associated with our strategic alternatives initiative, including costs incurred in 2019 related to the Pixelle Sale. Costs recorded after production ceased at the Luke Mill that are not associated with product sales or restructuring activities.

Verso Q1 2020 Mill Adjusted Net Sales and Mill Adjusted EBITDA Reconciliation 19 Verso Androscoggin & Stevens Point Remain Co. (Dollars in millions) Q1 2020 Q1 2020 Q1 2020 Net sales $ 471 $ 59 $ 412 Costs and expenses Cost of products sold (Exclusive of depreciation and amortization) 427 53 374 Depreciation and amortization 23 2 21 Selling, general and administrative expenses 27 2 25 Restructuring charges 6 - 6 Other operating (income) expense (88) - (88) Operating income 76 2 74 Interest expense - - - Other (income) expense (4) - (4) Income before income taxes 80 2 78 Income tax expense 26 - 26 Net income 54 2 52 Income tax expense 26 - 26 Interest expense - - - Depreciation and amortization 23 2 21 EBITDA 103 4 99 Restructuring charges 6 - 6 Luke Mill post-closure costs 3 - 3 Non-cash equity award expense 2 - 2 Gain on Pixelle Sale (88) - (88) Shareholders proxy solicitation costs 4 - 4 Other severance costs 4 - 4 Other One-time transaction items 1 - 1 Adj. EBITDA 35 4 31
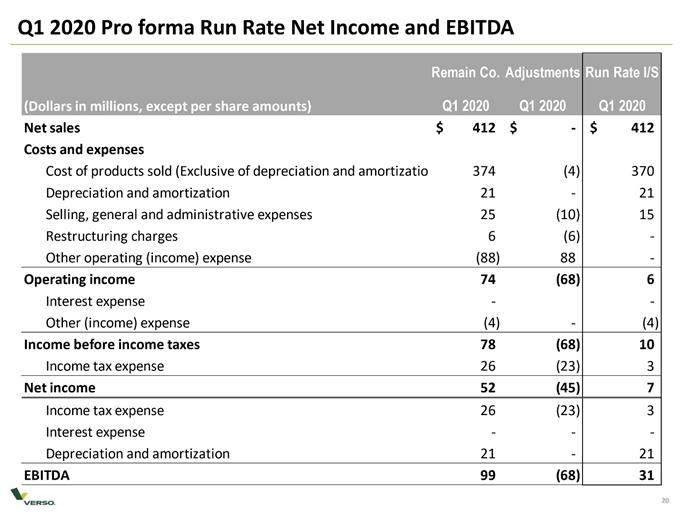
Q1 2020 Pro forma Run Rate Net Income and EBITDA 20 Remain Co. Adjustments Run Rate I/S (Dollars in millions, except per share amounts) Q1 2020 Q1 2020 Q1 2020 Net sales $ 412 $ - $ 412 Costs and expenses Cost of products sold (Exclusive of depreciation and amortization) 374 (4) 370 Depreciation and amortization 21 - 21 Selling, general and administrative expenses 25 (10) 15 Restructuring charges 6 (6) - Other operating (income) expense (88) 88 - Operating income 74 (68) 6 Interest expense - - Other (income) expense (4) - (4) Income before income taxes 78 (68) 10 Income tax expense 26 (23) 3 Net income 52 (45) 7 Income tax expense 26 (23) 3 Interest expense - - - Depreciation and amortization 21 - 21 EBITDA 99 (68) 31

Verso Q1 2019 Mill Adjusted Net Sales and Mill Adjusted EBITDA Reconciliation 21 Verso Androscoggin & Stevens Point Remain Co. (Dollars in millions) Q1 2019 Q1 2019 Q1 2019 Net sales $ 639 $ 131 $ 508 Costs and expenses Cost of products sold (Exclusive of depreciation and amortization) 549 122 427 Depreciation and amortization 28 4 24 Selling, general and administrative expenses 24 4 20 Other operating expense 1 - 1 Operating income 37 1 36 Interest expense 1 - 1 Other (income) expense (1) - (1) Income before income taxes 37 1 36 Income tax benefit 1 - 1 Net income 36 1 35 Income tax expense 1 - 1 Interest expense 1 - 1 Depreciation and amortization 28 4 24 EBITDA 66 5 61 Non-cash equity award expense 2 - 2 (Gain) loss on sale or disposal of assets 1 - 1 Adj. EBITDA 69 5 64