Attached files
| file | filename |
|---|---|
| EX-21 - Verso Corp | v175504_ex21.htm |
| EX-23.2 - Verso Corp | v175504_ex23-2.htm |
| EX-32.1 - Verso Corp | v175504_ex32-1.htm |
| EX-31.1 - Verso Corp | v175504_ex31-1.htm |
| EX-32.2 - Verso Corp | v175504_ex32-2.htm |
| EX-23.1 - Verso Corp | v175504_ex23-1.htm |
| EX-31.2 - Verso Corp | v175504_ex31-2.htm |
| EX-10.22 - Verso Corp | v175504_ex10-22.htm |
UNITED
STATES
SECURITIES
AND EXCHANGE COMMISSION
Washington,
DC 20549
FORM
10-K
(Mark
One)
þ ANNUAL
REPORT PURSUANT TO SECTION 13 OR 15(d) OF THE SECURITIES EXCHANGE ACT OF
1934
For the
fiscal year ended December 31, 2009
or
o TRANSITION
REPORT PURSUANT TO SECTION 13 OR 15(d) OF THE SECURITIES EXCHANGE ACT OF
1934
For the
transition period from _________ to _____________
Commission
file number: 001-34056
Verso
Paper Corp.
(Exact
name of registrant as specified in its charter)
|
Delaware
|
75-3217389
|
|
(State
or other jurisdiction of incorporation or organization)
|
(I.R.S.
Employer Identification Number)
|
|
6775
Lenox Center Court, Suite 400
|
|
|
Memphis,
Tennessee 38115-4436
|
(901)
369-4100
|
|
(Address
of principal executive offices) (Zip Code)
|
(Registrant’s
telephone number, including area
code)
|
Securities
registered pursuant to section 12(b) of the Act:
|
Title of each class
|
Name of each exchange on which
registered
|
|
Common
Stock, $.01 par value per share
|
New
York Stock Exchange
|
Securities
registered pursuant to Section 12(g) of the Act: None
Indicate
by check mark if the registrant is a well-known seasoned issuer, as defined in
Rule 405 of the Securities Act. Yes o No þ
Indicate
by check mark if the registrant is not required to file reports pursuant to
Section 13 or Section 15(d) of the Act. Yes o No þ
Indicate
by check mark whether the registrant (1) has filed all reports required to
be filed by Section 13 or 15(d) of the Securities Exchange Act of 1934
during the preceding 12 months (or for such shorter period that the registrant
was required to file such reports), and (2) has been subject to such filing
requirements for the past 90 days. Yes þ No o
Indicate
by check mark whether the registrant has submitted electronically and posted
on its corporate Web site, if any, every Interactive Data File required to be
submitted and posted pursuant to Rule 405 of Regulation S-T (§ 232.405 of this
chapter) during the preceding 12 months (or for such shorter period that the
registrant was required to submit and post such files). Yes o No o
Indicate
by check mark if disclosure of delinquent filers pursuant to Item 405 of
Regulation S-K (§ 229.405) is not contained herein, and will not be contained,
to the best of registrant’s knowledge, in definitive proxy or information
statements incorporated by reference in Part III of this Form 10-K or any
amendment to this Form 10-K. þ
Indicate
by check mark whether the registrant is a large accelerated filer, an
accelerated filer, a non-accelerated filer, or a smaller reporting company. See
the definitions of “large accelerated filer,” “accelerated filer,” and “smaller
reporting company” in Rule 12b-2 of the Exchange Act. (Check
one):
|
Large
accelerated filer o
|
Accelerated
filer o
|
Non-accelerated
filer þ
|
Smaller
reporting company o
|
|||
|
(Do
not check if a smaller reporting company)
|
Indicate
by check mark whether the registrant is a shell company (as defined in Rule
12b-2 of the Act). Yes o No þ
The
aggregate market value of the voting and non-voting common equity held by
non-affiliates, computed by reference to the price at which the common equity
was last sold on the last business day of the most recently completed second
fiscal quarter (June 30, 2009), was approximately $18,065,327.
As of
February 28, 2010, there were 52,375,387 shares of common stock
outstanding.
DOCUMENTS
INCORPORATED BY REFERENCE:
The
information required by Part III is incorporated by reference from portions of
the definitive proxy statement to be filed within 120 days after December 31,
2009, pursuant to Regulation 14A under the Securities Exchange Act of 1934 in
connection with the 2010 annual meeting of stockholders.
Table
of Contents
|
PART
I
|
||||
|
Page
|
||||
|
Item
1.
|
Business
|
3
|
||
|
Item
1A.
|
Risk
Factors
|
12
|
||
|
Item
1B.
|
Unresolved
Staff Comments
|
21
|
||
|
Item
2.
|
Properties
|
21
|
||
|
Item
3.
|
Legal
Proceedings
|
21
|
||
|
Item
4.
|
Submission
of Matters to a Vote of Security Holders
|
21
|
||
|
PART
II
|
||||
|
Item
5.
|
Market
for Registrant’s Common Equity, Related Stockholder Matters and Issuer
Purchases of Equity Securities
|
22
|
||
|
Item
6.
|
Selected
Financial Data
|
23
|
||
|
Item
7.
|
Management’s
Discussion and Analysis of Financial Condition and Results of
Operations
|
25
|
||
|
Item
7A.
|
Quantitative
and Qualitative Disclosures About Market Risk
|
36
|
||
|
Item
8.
|
Financial
Statements and Supplementary Data
|
39
|
||
|
Item
9.
|
Changes
in and Disagreements with Accountants on Accounting and Financial
Disclosure
|
76
|
||
|
Item
9A.
|
Controls
and Procedures
|
76
|
||
|
Item
9B.
|
Other
Information
|
76
|
||
|
|
||||
|
PART
III
|
||||
|
Item
10.
|
Directors,
Executive Officers and Corporate Governance
|
77
|
||
|
Item
11.
|
Executive
Compensation
|
77
|
||
|
Item
12.
|
Security
Ownership of Certain Beneficial Owners and Management and Related
Stockholder Matters
|
77
|
||
|
Item
13.
|
Certain
Relationships and Related Transactions and Director
Independence
|
77
|
||
|
Item
14.
|
Principal
Accountant Fees and Services
|
77
|
||
|
PART
IV
|
||||
|
Item
15.
|
Exhibits
and Financial Statement Schedules
|
78
|
||
|
Signatures
|
|
82
|
||
Forward-Looking
Statements
In this
annual report, all statements that are not purely historical facts are
forward-looking statements within the meaning of Section 27A of the Securities
Act of 1933 and Section 21E of the Securities Exchange Act of
1934. Forward-looking statements may be identified by the words
“believe,” “expect,” “anticipate,” “project,” “plan,” “estimate,” “intend,” and
similar expressions. Forward-looking statements are based on
currently available business, economic, financial, and other information and
reflect management’s current beliefs, expectations, and views with respect to
future developments and their potential effects on Verso. Actual
results could vary materially depending on risks and uncertainties that may
affect Verso and its business. For a discussion of such risks and
uncertainties, please refer to “Risk Factors” and “Management’s Discussion and
Analysis of Financial Condition and Results of Operations” and other sections of
this annual report and to Verso’s other filings with the Securities and Exchange
Commission. Verso assumes no obligation to update any forward-looking
statement made in this annual report to reflect subsequent events or
circumstances or actual outcomes.
Market
and Industry Information
Market
data and other statistical information used throughout this annual report are
based on independent industry publications, government publications, reports by
market research firms, or other published independent sources. Some data are
also based on our good-faith estimates which are derived from our review of
internal surveys, as well as the independent sources listed
above. Although we believe these sources are reliable, we have not
independently verified the information. Industry prices for coated
paper provided in this annual report are, unless otherwise expressly noted,
derived from Resource Information Systems, Inc., or “RISI, Inc.”
data. “North American” data included in this annual report that has
been derived from RISI, Inc. only includes data from the United States and
Canada. Any reference to (i) grade No. 3, grade No. 4
and grade No. 5 coated paper relates to 60 lb. basis weight, 50 lb. basis
weight and 34 lb. basis weight, respectively, (ii) lightweight coated
groundwood paper refers to groundwood paper grades that are a 36 lb. basis
weight or less, and (iii) ultra-lightweight coated groundwood paper refers
to groundwood paper grades that are a 30 lb. basis weight or
less. The RISI, Inc. data included in this annual report has been
derived from the following RISI, Inc. publications: RISI World Graphic Paper
Forecast, December 2009 and RISI Paper Trader: A Monthly Monitor of the North
American Graphic Paper Market, December 2009.
2
PART I
Item 1. Business
Unless
otherwise noted, the terms “Verso,” “Verso Paper,” “Company,” “we,” “us,” “our,”
and “Successor” refer collectively to Verso Paper Corp., a Delaware corporation,
and its subsidiaries, and references to the “Predecessor” refer to the Coated
and Supercalendered Papers Division of International Paper Company, or
“International Paper.”
Background
We began
operations on August 1, 2006, when we acquired the assets and certain
liabilities comprising the business of the Coated and Supercalendered Papers
Division of International Paper. We were formed by affiliates of
Apollo Management, L.P., or “Apollo,” for the purpose of consummating the
acquisition from International Paper, or the “Acquisition.” Verso
Paper Corp. went public on May 14, 2008, with an initial public offering, or
“IPO," of 14 million shares of common stock which generated $152.2 million in
net proceeds.
Our
principal executive offices are located at 6775 Lenox Center Court, Suite 400,
Memphis, Tennessee 38115-4436. Our telephone number is
(901) 369-4100. Our web site address is www.versopaper.com. Information
on our web site is not considered part of this annual report.
Overview
We are a
leading North American supplier of coated papers to catalog and magazine
publishers. The coating process adds a smooth uniform layer in the
paper, which results in superior color and print definition. As a
result, coated paper is used primarily in media and marketing applications,
including catalogs, magazines, and commercial printing applications, such as
high-end advertising brochures, annual reports, and direct mail
advertising.
We are
one of North America’s largest producers of coated groundwood paper, which is
used primarily for catalogs and magazines. We are also a low cost
producer of coated freesheet paper, which is used primarily for annual reports,
brochures, and magazine covers. In addition, we have a strategic
presence in supercalendered paper, which is primarily used for retail inserts,
and specialty papers. We also produce and sell market kraft pulp,
which is used to manufacture printing and writing paper grades and tissue
products.
We
operate 11 paper machines at four mills located in Maine, Michigan, and
Minnesota. The mills have a combined annual production capacity of
1,406,000 tons of coated paper, 215,000 tons of supercalendered paper, 131,000
tons of ultra-lightweight specialty and uncoated papers, and 838,000 tons of
kraft pulp.
We sell
and market our products to approximately 100 customers which comprise
approximately 670 end-user accounts. We have long-standing
relationships with many leading magazine and catalog publishers, commercial
printers, specialty retail merchandisers, and paper merchants. Our
relationships with our ten largest coated paper customers average more than 20
years. We reach our end-users through several distribution channels,
including direct sales, commercial printers, paper merchants and
brokers.
3
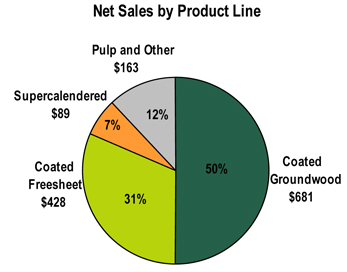
Our net
sales (in millions) by product line in 2009 are illustrated below:
Industry
Based on
2009 sales, the size of the global coated paper industry is estimated to be
approximately $41 billion, or 44 million tons of coated paper shipments,
including approximately $8 billion, or 9 million tons of coated paper shipments,
in North America. Coated paper is used primarily in media and
marketing applications, including catalogs, magazines, and commercial printing
applications, which include high-end advertising brochures, annual reports, and
direct mail advertising. Demand is generally driven by North American
advertising and print media trends, which in turn have historically been
correlated with growth in Gross Domestic Product, or “GDP.”
In North
America, coated papers are classified by brightness and fall into five grades,
labeled No. 1 to No. 5, with No. 1 having the highest brightness level and No. 5
having the lowest brightness level. Papers graded No. 1, No. 2, and
No. 3 are typically coated freesheet grades. No. 4 and No. 5 papers are
predominantly groundwood containing grades. Coated groundwood grades
are the preferred grades for catalogs and magazines, while coated freesheet is
more commonly used in commercial print applications.
Products
We
manufacture three main grades of paper: coated groundwood paper, coated
freesheet paper, and supercalendered paper. These paper grades are
differentiated primarily by their respective brightness, weight, print quality,
bulk, opacity, and strength. We also produce Northern Bleached
Hardwood Kraft, or “NBHK,” pulp. The following table sets forth our
principal products by 2009 tons sold and as a percentage of our 2009 net
sales:
|
(tons in thousands, dollars in
millions)
|
Tons Sold
|
Net Sales
|
||||||||||||||
|
Product:
|
Kts
|
%
|
$
|
%
|
||||||||||||
|
Coated groundwood
paper
|
792 | 46 | $ | 681 | 50 | |||||||||||
|
Coated freesheet
paper
|
491 | 28 | 428 | 31 | ||||||||||||
|
Supercalendered
paper
|
122 | 7 | 89 | 7 | ||||||||||||
|
Pulp
|
252 | 15 | 105 | 8 | ||||||||||||
|
Other
|
68 | 4 | 58 | 4 | ||||||||||||
|
Total
|
1,725 | 100 | $ | 1,361 | 100 | |||||||||||
4
As a
result of our scale and technological capabilities, we are able to offer our
customers a broad product offering, from ultra-lightweight coated groundwood to
heavyweight coated freesheet and supercalendered papers. Our
customers have the opportunity to sole-source all of their coated paper needs
from us while optimizing their choice of paper products. As our
customers’ preferences change, they can switch paper grades to meet their
desired balance between cost and performance attributes while maintaining their
relationship with us.
We are
also one of the largest rotogravure lightweight coated paper manufacturers in
North America. Rotogravure printing is a technique for transferring
ink onto coated papers, which typically results in a sharper image with truer
colors and less ink trapping than in other printing processes but generally
requires a smaller and higher-quality paper. Additionally, we are the
only manufacturer in North America with the technological expertise to supply
both rotogravure coated groundwood and coated freesheet.
Coated groundwood
paper. Coated groundwood paper includes a fiber component
produced through a mechanical pulping process. The use of such fiber
results in a bulkier and more opaque paper that is better suited for
applications where lighter weights and/or higher stiffness are required, such as
catalogs and magazines. In addition to mechanical pulp, coated
groundwood paper typically includes a kraft pulp component to improve brightness
and print quality.
Coated freesheet
paper. Coated freesheet paper is made from bleached kraft
pulp, which is produced using a chemical process to break apart wood fibers and
dissolve impurities such as lignin. The use of kraft pulp results in
a bright, heavier-weight paper with excellent print qualities, which is
well-suited for high-end commercial applications and premium
magazines. Coated freesheet contains primarily kraft pulp, with less
than 10% mechanical pulp in its composition.
Supercalendered
paper. Supercalendered paper consists of groundwood fibers and
a very high filler content but does not receive a separate surface
coating. Instead, the paper is passed through a supercalendering
process in which alternating steel and filled rolls “iron” the paper, giving it
a gloss and smoothness that makes it resemble coated
paper. Supercalendered papers are primarily used for retail inserts,
due to their relatively low price point.
Pulp. We produce and sell NBHK
pulp. NBHK pulp is produced through the chemical kraft process using
hardwoods. Hardwoods typically have shorter length fibers than
softwoods and are used to smooth paper. Kraft describes pulp produced
using a chemical process, whereby wood chips are combined with chemicals and
steam to separate the wood fibers. The fibers are then washed and
pressure screened to remove the chemicals and lignin which originally held the
fibers together. Finally, the pulp is bleached to the necessary
whiteness and brightness. Kraft pulp is used in applications where
brighter and whiter paper is required.
Other products. We
also offer recycled paper to help meet specific customer
requirements. Additionally, we offer customized product solutions for
strategic accounts by producing paper grades with customer-specified weight,
brightness and pulp mix characteristics, providing customers with cost benefits
and/or brand differentiation. Finally, we have recently expanded our
offerings to include ultra-lightweight uncoated printing papers and
ultra-lightweight coated and uncoated flexible packaging papers.
Manufacturing
We
operate 11 paper machines at four mills located in Maine, Michigan, and
Minnesota. We believe our coated paper mills are among the most
efficient and lowest cost coated paper mills in the world based on the cash cost
of delivery to Chicago. We attribute our manufacturing efficiency, in part, to
the significant historical investments made in our mills. Our mills have a
combined annual production capacity of 1,406,000 tons of coated paper, 215,000
tons of supercalendered paper, 131,000 tons of ultra-lightweight specialty and
uncoated papers, and 838,000 tons of kraft pulp. Of the pulp that we
produce, we consume approximately 565,000 tons internally and sell the
rest. Our facilities are strategically located within close proximity
to major publication printing customers, which affords us the ability to more
quickly and cost-effectively deliver our products. The facilities
also benefit from convenient and cost-effective access to northern softwood
fiber, which is required for the production of lightweight and ultra-lightweight
coated papers.
5
The
following table sets forth the locations of our mills, the products they
produce and other key operating information:
|
Paper
Machines |
Production
Capacity (in tons) |
|||||||||
|
Mill/Location
|
Product/Paper
Grades
|
|||||||||
|
Jay (Androscoggin), ME
|
Lightweight
Coated Groundwood
|
2 | 366,000 | |||||||
|
Lightweight
Coated Freesheet
|
1 | 148,000 | ||||||||
|
Specialty/Uncoated
|
50,000 | |||||||||
|
Pulp
|
403,000 | |||||||||
|
Bucksport, ME
|
Lightweight and
Ultra-Lightweight Coated
|
|||||||||
|
Groundwood and
High Bulk Specialty
|
||||||||||
|
Coated
Groundwood
|
3 | 425,000 | ||||||||
|
Specialty/Uncoated
|
1 | 61,000 | ||||||||
|
Quinnesec, MI
|
Coated
Freesheet
|
1 | 382,000 | |||||||
|
Specialty/Uncoated
|
20,000 | |||||||||
|
Pulp
|
435,000 | |||||||||
|
Sartell, MN
|
Lightweight and
Ultra-Lightweight Coated
|
|||||||||
|
Groundwood
|
1 | 85,000 | ||||||||
|
Supercalendered
|
2 | 215,000 | ||||||||
The basic
raw material of the papermaking process is wood pulp. The first stage
of papermaking involves converting wood logs to pulp through either a mechanical
or chemical process. Before logs can be processed into pulp, they are
passed through a debarking drum to remove the bark. Once separated,
the bark is burned as fuel in bark boilers. The wood logs are
composed of small cellulose fibers which are bound together by a glue-like
substance called lignin. The cellulose fibers are then separated from
each other through either a mechanical or a kraft pulping process.
After the
pulping phase, the fiber furnish is run onto the forming fabric of the paper
machine. On the forming fabric, the fibers become interlaced, forming
a mat of paper, and much of the water is extracted. The paper web
then goes through a pressing and drying process to extract the remaining
water. After drying, the web receives a uniform layer of coating that
makes the paper smooth and provides uniform ink absorption. After
coating, the paper goes through a calendering process that provides a smooth
finish by ironing the sheet between multiple soft nips that consist of
alternating hard (steel) and soft (cotton or synthetic) rolls. At the
dry end, the paper is wound onto spools to form a machine reel and then rewound
and split into smaller rolls on a winder. Finally, the paper is
wrapped, labeled and shipped.
Catalog
and magazine publishers with longer print runs tend to purchase paper in roll
form for use in web printing, a process of printing from a reel of paper as
opposed to individual sheets of paper, in order to minimize costs. In
contrast, commercial printers typically buy large quantities of sheeted paper in
order to satisfy the short-run printing requirements of their
customers. We believe that sheeted paper is a less attractive product
as it requires additional processing, bigger inventory stocks, a larger sales
and marketing team and a different channel strategy. For this reason,
we have pursued a deliberate strategy of configuring our manufacturing
facilities to produce all web-based papers which are shipped in roll form and
have developed relationships with third-party converters to address any sheeted
paper needs of our key customers.
6
We
utilize a manufacturing excellence program, called R-GAP, to take advantage of
the financial opportunities that exist between the current or historical
performance of our mills and the best performance possible given usual and
normal constraints (i.e., configuration, geographical and capital
constraints). Our continuous improvement process is designed to lower
our cost position and enhance operating efficiency through reduced consumption
of energy and material inputs, reduced spending on indirect costs and improved
productivity. The program utilizes benchmarking data to identify
improvement initiatives and establish performance targets. Detailed
action plans are used to monitor the execution of these initiatives and
calculate the amount saved. We also use multi-variable testing, lean
manufacturing, center of excellence teams, source-of-loss initiatives and best
practice sharing to constantly improve our manufacturing processes and
products. Since 2001, three of our four facilities have participated
in OSHA’s Voluntary Protection Program which recognizes outstanding safety
programs and performance.
Raw
Materials and Suppliers
Our key
cost inputs in the papermaking process are wood fiber, market kraft pulp,
chemicals, and energy.
Wood Fiber. We
source our wood fiber from a broad group of timberland and sawmill owners
located in our regions as well as from our 27,000-acre hybrid poplar woodlands
located near Alexandria, Minnesota.
Kraft
Pulp. Overall, we have the capacity to produce 838,000 tons of
kraft pulp, consisting of 403,000 tons of pulp at the Androscoggin mill and
435,000 tons of pulp at the Quinnesec mill, of which a total of approximately
565,000 tons are consumed internally. We supplement our internal
production of kraft pulp with purchases from third parties. In 2009,
these purchases were approximately 81,000 tons of pulp. We purchase
the pulp requirements from a variety of suppliers and are not dependent on any
single supplier to satisfy our pulp needs.
Chemicals. Chemicals
utilized in the manufacturing of coated papers include latex, starch, calcium
carbonate, and titanium dioxide. We purchase these chemicals from a
variety of suppliers and are not dependent on any single supplier to satisfy our
chemical needs.
Energy. We produce
a large portion of our energy requirements, historically producing approximately
50% of our energy needs for our coated paper mills from sources such as waste
wood and paper, hydroelectric facilities, chemicals from our pulping process,
our own steam recovery boilers, and internal energy cogeneration
facilities. Our external energy purchases vary across each one of our
mills and include fuel oil, natural gas, coal, and electricity. While
our internal energy production capacity and ability to switch between certain
energy sources mitigates the volatility of our overall energy expenditures, we
expect prices for energy to remain volatile for the foreseeable
future. We utilize derivative contracts as part of our risk
management strategy to manage our exposure to market fluctuations in energy
prices.
Sales,
Marketing, and Distribution
We reach
our end-users through several sales channels. These include selling
directly to end-users, through brokers, merchants, and printers. We
sell and market products to approximately 100 customers, which comprise
approximately 670 end-user accounts.
Sales to
End-Users. In 2009, we sold approximately 41% of our paper
products directly to end-users, most of which are catalog and magazine
publishers. These customers are typically large, sophisticated buyers
who have the scale, resources and expertise to procure paper directly from
manufacturers. Customers for our pulp products are mostly other paper
manufacturers.
Sales to Brokers and
Merchants. Our largest indirect paper sales by volume are
through brokers and merchants who resell the paper to end-users. In
2009, our total sales to brokers and merchants represented approximately 47% of
our total sales. Brokers typically act as an intermediary between
paper manufacturers and smaller end-users who do not have the scale or resources
to cost effectively procure paper directly from manufacturers. The
majority of the paper sold to brokers is resold to catalog
publishers. We work closely with brokers to achieve share targets in
the catalog, magazine, and insert end-user segments through collaborative
selling.
7
Merchants
are similar to brokers in that they act as an intermediary between the
manufacturer and the end-user. However, merchants generally take physical
delivery of the product and keep inventory on hand. Merchants tend to
deal with smaller end-users that lack the scale to warrant direct delivery from
the manufacturer. Coated freesheet comprises the majority of our
sales to merchants. In most cases, because they are relatively small,
the ultimate end-users of paper sold through merchants are generally regional or
local catalog or magazine publishers.
Sales to
Printers. In 2009, our total sales to printers represented
approximately 12% of our total sales. The majority of our sales were
to two of the four largest publication printers in the United
States. Printers also effectively act as an intermediary between
manufacturers and end-users in that they directly source paper for
printing/converting and then resell it to their customers as a finished
product.
The
majority of our products are delivered directly from our manufacturing
facilities to the printer, regardless of the sales channel. In order
to serve the grade No. 3 coated freesheet segment, we maintain a network of
distribution centers located in the West, Midwest, South, and Northeast close to
our customer base to provide quick delivery. The majority of our pulp
products are delivered to our customers’ paper mills.
Our sales
force is organized around our sales channels. We maintain an active
dialogue with all of our major customers and track product performance and
demand across grades. We have a team of sales representatives and
marketing professionals organized into three major sales groups that correspond
with our sales channels: direct sales support; support to brokers and merchants;
and printer support.
The
majority of our products are sold under contracts with our
customers. Contracted sales are more prevalent for coated groundwood
paper, as opposed to coated freesheet paper, which is more often sold without a
contract. Our contracts generally specify the volumes to be sold to
the customer over the contract term, as well as the pricing parameters for those
sales. Most of our contracts are negotiated on an annual basis, with
only a few having terms extending beyond one year. Typically, our
contracts provide for quarterly price adjustments based on market price
movements. The large portion of contracted sales allows us to plan
our production runs well in advance, optimizing production over our integrated
mill system and thereby reducing costs and increasing overall
efficiency.
Part of
our strategy is to continually reduce the cost to serve our customer base
through e-commerce initiatives which allow for simplified ordering, tracking and
invoicing. In 2009, orders totaling $344.5 million, or approximately
28% of our total paper sales, were placed through our online ordering
platforms. We are focused on further developing our technology
platform and e-commerce capabilities. To this end, we operate Nextier
Solutions, an Internet-based system that allows for collaborative production
planning, order placement, and inventory management throughout the supply
chain. Participants use the system to maximize supply chain
efficiencies, improve communication, and reduce operating costs, and they pay us
subscription and transaction fees for system usage.
Customers
We serve
the catalog, magazine, insert and commercial printing markets and have developed
long-standing relationships with the premier North American retailers and
catalog and magazine publishers. The length of our relationships with
our top ten customers averages more than 20 years. International
Paper and its divisions and subsidiaries (including xpedx and Central Lewmar
LLC) accounted for approximately 10% of our net sales in 2009. Other
key customers include leading magazine publishers such as Condé Nast
Publications, Inc., Hearst Corporation, National Geographic Society, and Time
Inc.; leading catalog producers such as Avon Products, Inc. and Sears Holding
Corporation; leading commercial printers such as Quad/Graphics, Inc., and RR
Donnelley & Sons Company; and leading paper merchants and brokers, such
as A.T. Clayton & Co., Unisource Worldwide, Inc., and Clifford Paper,
Inc.
8
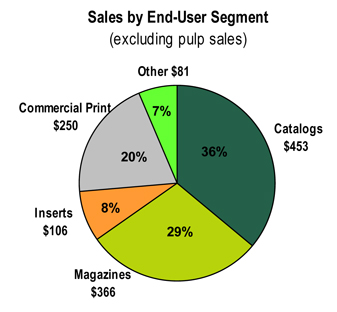
Our net
sales, excluding pulp sales, by end-user segment in 2009, are illustrated below
(dollars in millions):
Research
and Development
The
primary function of our research and development efforts is to work with
customers in developing and modifying products to accommodate their evolving
needs and to identify cost-saving opportunities within our
operations.
Examples
of our research and development efforts implemented over the past several years
include:
·
high-bulk
offset and rotogravure coated groundwood;
·
lightweight
grade No. 4 coated groundwood;
·
ultra-lightweight
grade No. 5 coated groundwood;
·
rotogravure
coated freesheet; and
·
innovative
and performance driven products for the flexible packaging, label, and specialty
printing markets.
Intellectual
Property
We have
several patents and patent applications in the United States and various foreign
countries. These patents and patent applications generally relate to
various paper manufacturing methods and equipment which may become commercially
viable in the future. We also have trademarks for our names, Verso®
and Verso Paper®, as well as for our products such as Influence®, Velocity®,
Liberty®, Advocate®, and Clarity™. In
addition to the intellectual property that we own, we license a significant
portion of the intellectual property used in our business on a perpetual,
royalty-free, non-exclusive basis from International Paper.
9
Competition
Our
business is highly competitive. A significant number of North
American competitors produce coated and supercalendered papers, and several
overseas manufacturers, principally from Europe, export to North
America. We compete based on a number of factors,
including:
·
price;
·
product
availability;
·
product
quality;
·
breadth
of product offerings;
·
timeliness
of product delivery; and
·
customer
service.
Foreign
competition in North America is also affected by the exchange rate of the U.S.
dollar relative to other currencies, especially the euro, market prices in North
America and other markets, worldwide supply and demand, and the cost of
ocean-going freight.
While our
product offering is broad in terms of grades produced (from supercalendered and
ultra-lightweight coated groundwood offerings to heavier-weight coated freesheet
products), we are focused on producing coated groundwood and coated freesheet in
roll form. This strategy is driven by our alignment with catalog and
magazine end-users which tend to purchase paper in roll form for use in long
runs of web printing in order to minimize costs. Our principal competitors
include NewPage Corporation, Abitibi Bowater Inc., UPM-Kymmene Corporation, and
Sappi Limited, all of which have North American operations. UPM and
Sappi are headquartered overseas and also have overseas manufacturing
facilities.
Employees
As of
December 31, 2009, we had approximately 2,800 employees, of whom approximately
35% are unionized and approximately 75% are hourly
employees. Employees at two of our four mills are represented by
labor unions under a total of three collective bargaining agreements which
expire in 2011. We have not experienced any work stoppages during the
past several years. We believe that we have good relations with our
employees.
Environmental
and Other Governmental Regulations
We are
subject to federal, state and local environmental, health and safety laws and
regulations, including the federal Water Pollution Control Act of 1972, or
“Clean Water Act,” the federal Clean Air Act, the federal Resource Conservation
and Recovery Act, the Comprehensive Environmental Response, Compensation and
Liability Act of 1980, or “CERCLA,” the federal Occupational Health and Safety
Act, and analogous state and local laws. Our operations also are
subject to two regional regimes designed to address climate change, the Regional
Greenhouse Gas Initiative in the northeastern United States and the Midwestern
Greenhouse Gas Reduction Accord, and in the future we may be subject to
additional federal, state, local or supranational legislation related to climate
change. Among our activities subject to environmental regulation are
the emissions of air pollutants, discharges of wastewater and stormwater,
operation of dams, storage, treatment, and disposal of materials and waste, and
remediation of soil, surface water and ground water
contamination. Many environmental laws and regulations provide for
substantial fines or penalties and criminal sanctions for any failure to
comply. In addition, failure to comply with these laws and
regulations could result in the interruption of our operations and, in some
cases, facility shutdowns.
10
Certain
of these environmental laws, such as CERCLA and analogous state laws, provide
for strict, and under certain circumstances, joint and several liability for
investigation and remediation of the release of hazardous substances into the
environment, including soil and groundwater. These laws may apply to
properties presently or formerly owned or operated by an entity or its
predecessors, as well as to conditions at properties at which wastes
attributable to an entity or its predecessors were disposed. Under
these environmental laws, a current or previous owner or operator of real
property, and parties that generate or transport hazardous substances that are
disposed of at real property, may be held liable for the cost to investigate or
clean up such real property and for related damages to natural
resources. We handle and dispose of wastes arising from our mill
operations, including disposal at on-site landfills. We are required
to maintain financial assurance for the expected cost of landfill closure and
post-closure care. We may be subject to liability, including
liability for investigation and cleanup costs, if contamination is discovered at
one of our paper mills or another location where we have disposed of, or
arranged for the disposal of, wastes. We could be subject to
potentially significant liabilities under, or fines or penalties for any failure
to comply with, any environmental rule or regulation.
Compliance
with environmental laws and regulations is a significant factor in our
business. We have made, and will continue to make, significant
expenditures to comply with these requirements. We incurred
environmental capital expenditures of $2.6 million in 2009, $9.7 million in 2008
and $3.4 million in 2007, and we expect to incur additional environmental
capital expenditures of approximately $6 million in 2010. We
anticipate that environmental compliance will continue to require increased
capital expenditures and operating expenses over time as environmental laws or
regulations, or interpretations thereof, change or the nature of our operations
require us to make significant additional capital expenditures.
Permits
are required for the operation of our mills and related
facilities. The permits are subject to renewal, modification, and
revocation. We and others have the right to challenge our permit
conditions through administrative and legal appeals and review
processes. Governmental authorities have the power to enforce
compliance with the permits, and violators are subject to civil and criminal
penalties, including fines, injunctions or both. Other parties also
may have the right to pursue legal actions to enforce compliance with the
permits.
Available
Information
Our web
site is located at www.versopaper.com. We
make available free of charge through this web site our annual reports on Form
10-K, quarterly reports on Form 10-Q, current reports on Form 8-K, and
amendments to those reports filed with or furnished to the Securities and
Exchange Commission, or “SEC,” pursuant to Section 13(a) or 15(d) of the
Securities Exchange Act of 1934, as soon as reasonably practicable after they
are electronically filed with or furnished to the SEC.
11
Item
1A. Risk Factors
Our
business is subject to various risks. Set forth below are certain of
the more important risks that we face and that could cause our actual results to
differ materially from our historical results. These risks are not
the only ones that we face. Our business also could be affected by
additional risks that are presently unknown to us or that we currently believe
are immaterial to our business.
We
have limited ability to pass through increases in our costs to our
customers. Increases in our costs or decreases in coated or
supercalendered paper prices could have a material adverse effect on our
business, financial condition, and results of operations.
Our
earnings are sensitive to price changes in coated or supercalendered
paper. Fluctuations in paper prices (and coated paper prices in
particular) historically have had a direct effect on our net income (loss) and
Earnings Before Interest, Taxes, Depreciation and Amortization, or “EBITDA,” for
several reasons:
|
·
|
Market
prices for paper products are a function of supply and demand, factors
over which we have limited control. We therefore have limited
ability to control the pricing of our products. Market prices
of grade No. 3, 60 lb. basis weight paper, which is an industry benchmark
for coated freesheet paper pricing, have fluctuated since 2000 from a high
of $1,100 per ton to a low of $705 per ton. In addition, market
prices of grade No. 5, 34 lb. basis weight paper, which is an industry
benchmark for coated groundwood paper pricing, have fluctuated between a
high of $1,120 per ton to a low of $795 per ton over the same
period. Our average coated paper prices declined in 2009 and
while we expect average prices in 2010 to remain below 2009 levels, the
rate of decline in paper prices has slowed and we expect modest price
increases in 2010. Because
market conditions determine the price for our paper products, the price
for our products could fall below our cash production
costs.
|
|
·
|
Market
prices for paper products typically are not directly affected by raw
material costs or other costs of sales, and consequently we have limited
ability to pass through increases in our costs to our customers absent
increases in the market price. In addition, a significant
portion of our sales are pursuant to contracts that limit price
increases. Thus, even though our costs may increase, we may not
have the ability to increase the prices for our products, or the prices
for our products may decline.
|
|
·
|
The
manufacturing of coated paper is highly capital-intensive and a large
portion of our operating costs are fixed. Additionally, paper
machines are large, complex machines that operate more efficiently when
operated continuously. Consequently, both we and our
competitors typically continue to run our machines whenever marginal sales
exceed the marginal costs, adversely impacting prices at times of lower
demand.
|
Therefore,
our ability to achieve acceptable margins is principally dependent on (1)
managing our cost structure, (2) managing changes in raw materials prices, which
represent a large component of our operating costs and fluctuate based upon
factors beyond our control and (3) general conditions in the paper
market. If the prices of our products decline, or if our raw material
costs increase, it could have a material adverse effect on our business,
financial condition and results of operations.
The
paper industry is cyclical and North American demand for certain paper products
tends to decline during a weak U.S. economy. Fluctuations in supply
and demand for our products could have a material adverse effect on our
business, financial condition, and results of operations.
The paper
industry is a commodity market to a significant extent and is subject to
cyclical market pressures. North American demand for coated and supercalendered
paper products tends to decline during a weak U.S. economy. Accordingly, general
economic conditions and demand for magazines and catalogs may have a material
adverse impact on the demand for our products, which may result in a material
adverse effect on our business, financial condition and results of operations.
In addition, currency fluctuations can have a significant impact on the supply
of coated paper products in North America. If the U.S. dollar strengthens,
imports may increase, which would cause the supply of paper products available
in the North American market to increase. Foreign overcapacity also could result
in an increase in the supply of paper products available in the North American
market. An increased supply of paper available in North America could put
downward pressure on prices and/or cause us to lose sales to competitors, either
of which could have a material adverse effect on our business, financial
condition and results of operations.
12
Recent
global market and economic conditions have been challenging with tight credit
conditions and a slowdown in economic growth in most major
economies. While there are some indications the economy and credit
markets are improving, economic conditions are expected to remain difficult in
2010. Continued concerns about the systemic impact of potential
long-term and wide-spread recession, energy costs, geopolitical issues, the
availability and cost of credit, and the global housing and mortgage markets
have contributed to increased market volatility and diminished expectations for
the U.S. economy. These factors have led to a decrease in spending by
businesses and consumers alike which has disproportionately impacted the
magazine industry, and a corresponding decrease in demand for our
products. See “Management’s Discussion and Analysis of Financial
Condition and Results of Operations - Selected Factors that Affect Our Operating
Results.” In addition to the cyclical downturns that our industry
regularly experiences and is currently experiencing, demand may suffer from
secular declines as the result of changes in general business conditions that
impact the use of catalogues and magazines. At times of weakening
demand, such as the current economic climate, it is difficult to determine
whether reduced demand for our products is the result of cyclical macroeconomic
factors or instead the result of structural changes in the
marketplace. Continued turbulence in the U.S. and international
markets and economies and prolonged declines in business and consumer spending
may further adversely affect our business, financial condition and results of
operations.
Our
substantial leverage could adversely affect our ability to raise additional
capital to fund our operations, limit our ability to react to changes in the
economy or our industry, expose us to interest rate risk to the extent of our
variable rate debt and prevent us from meeting our obligations under these notes
and our other indebtedness.
We have
been highly leveraged since the consummation of the Acquisition. As
of December 31, 2009, our total indebtedness was $1,192.4 million, net of $24.0
million of unamortized discounts. The total amount of payments we
will need to make on our outstanding long-term indebtedness for each of the next
three fiscal years is equal to $116.5 million, $116.5 million, and $115.7
million, respectively (assuming the current prevailing interest rates on our
outstanding floating rate indebtedness remain the same).
Our high
degree of leverage could have important consequences, including:
|
·
|
increasing our vulnerability to general adverse economic and industry conditions; |
|
·
|
requiring
us to dedicate a substantial portion of our cash flow from operations to
payments on our indebtedness, thereby reducing the availability of our
cash flow to fund working capital, capital expenditures, research and
development efforts, and other general corporate
purposes;
|
|
·
|
increasing
our vulnerability to, and limiting our flexibility in planning for, or
reacting to, changes in our business and the industry in which we
operate;
|
|
·
|
exposing
us to the risk of increased interest rates as borrowings under our senior
secured credit facilities and our second priority senior secured floating
rate notes are subject to variable rates of
interest;
|
|
·
|
placing us at a competitive disadvantage compared to our competitors that have less debt; and |
|
·
|
limiting our ability to borrow additional funds. |
13
We may be
able to incur substantial additional indebtedness in the future because the
terms of the indentures governing our outstanding notes and our senior secured
credit facilities do not fully prohibit us or our subsidiaries from doing
so. If new indebtedness is added to our and our subsidiaries’ current
debt levels, the related risks that we and they now face could
intensify.
Our
operations require substantial ongoing capital expenditures, and we may not have
adequate capital resources to fund all of our required capital
expenditures.
Our
business is capital intensive, and we incur capital expenditures on an ongoing
basis to maintain our equipment and comply with environmental laws, as well as
to enhance the efficiency of our operations. Our total capital
expenditures were $34 million in 2009, including approximately $20 million for
maintenance and environmental capital expenditures. We expect to
spend approximately $77 million on capital expenditures during 2010, with
approximately $6 million expected to be reimbursed through a Recovery Act grant
for the deployment of waste energy recovery technologies. Included in
the total for 2010 is approximately $41 million for maintenance and
environmental capital expenditures. We anticipate that our available
cash resources and cash generated from operations will be sufficient to fund our
operating needs and capital expenditures for at least the next
year. We may also dispose of certain of our non-core assets in order
to obtain additional liquidity. However, if we require additional
funds to fund our capital expenditures, we may not be able to obtain them on
favorable terms, or at all. If we cannot maintain or upgrade our
facilities and equipment as we require or as necessary to ensure environmental
compliance, it could have a material adverse effect on our business, financial
condition and results of operations.
We
will require a significant amount of cash to service our indebtedness and make
planned capital expenditures. Our ability to generate cash or refinance our
indebtedness depends on many factors beyond our control.
Our
ability to make payments on, and to refinance, our indebtedness and to fund
planned capital expenditures and research and development efforts will depend on
our ability to generate cash flow in the future and our ability to borrow under
credit facilities to the extent of available borrowings. This, to a certain
extent, is subject to general economic, financial, competitive, legislative,
regulatory and other factors that are beyond our control. If adverse
regional and national economic conditions persist, worsen, or fail to improve
significantly, we could experience decreased revenues from our operations
attributable to decreases in wholesale and consumer spending levels and could
fail to generate sufficient cash to fund our liquidity needs or fail to satisfy
the restrictive covenants and borrowing limitations which we are subject to
under our indebtedness. Additionally, until December 31, 2009, the
United States government provided an excise tax credit to taxpayers for the use
of alternative fuel mixtures. As a result of our use of an
alternative fuel mixture containing “black liquor,” a byproduct of pulp
production, at our Androscoggin and Quinnesec mills, we recognized $238.9
million of alternative fuel mixture tax credits in the year ended December 31,
2009, including approximately $10 million for claims pending at December 31,
2009. The amount recognized in fiscal 2009 includes amounts received
for claims for use of the alternative fuel mixture from September 2008 through
December 2009. The tax credit, as it relates to liquid fuels derived
from biomass, expired on December 31, 2009. Therefore, we will not
recognize any proceeds from this tax credit in future periods.
Based on
our current and expected level of operations, we believe our cash flow from
operations, available cash and available borrowings under our senior secured
credit facilities, will be adequate to meet our future liquidity needs for at
least the next year. We cannot assure you, however, that our business
(taking into account the expiration of the tax credit discussed above) will
generate sufficient cash flow from operations or that future borrowings will be
available to us under our senior secured credit facilities or otherwise in an
amount sufficient to enable us to pay our indebtedness or to fund our other
liquidity needs. We may explore additional steps to raise liquidity including
potential dispositions of non-core assets. We may need to refinance all or a
portion of our indebtedness on or before the maturity thereof. We cannot assure
you that we will be able to refinance any of our indebtedness on commercially
reasonable terms or at all. If we cannot service our indebtedness, we may have
to take actions such as selling assets, seeking additional equity or reducing or
delaying capital expenditures, strategic acquisitions, investments and
alliances. We cannot assure you that any such actions, if necessary, could be
effected on commercially reasonable terms or at all.
14
Restrictive
covenants in the indentures governing our notes and our revolving credit
agreement may restrict our ability to pursue our business
strategies.
The
indentures governing our notes and our revolving credit agreement limit our
ability, among other things, to:
·
incur
additional indebtedness;
·
pay
dividends or make other distributions or repurchase or redeem our
stock;
·
prepay,
redeem or repurchase certain of our indebtedness;
·
make
investments;
·
sell
assets, including capital stock of restricted subsidiaries;
·
enter
into agreements restricting our subsidiaries’ ability to pay
dividends;
·
consolidate,
merge, sell or otherwise dispose of all or substantially all of our
assets;
·
enter
into transactions with our affiliates; and
·
incur
liens.
A breach
of any of these restrictive covenants could result in a default under the
indentures governing our notes and our revolving credit agreement. If a default
occurs, the holders of the notes and the lenders under our revolving credit
facility may elect to declare all borrowings or notes outstanding, together with
accrued interest and other fees, to be immediately due and payable. The lenders
under our revolving credit facility would also have the right in these
circumstances to terminate any commitments they have to provide further
borrowings. If we are unable to repay our indebtedness when due or declared due,
the lenders under our revolving credit facility and our other secured
indebtedness (including our notes) will also have the right to proceed against
the collateral, including our available cash, granted to them to secure the
indebtedness. If the indebtedness under our revolving credit facility, the notes
and our other secured indebtedness were to be accelerated, we cannot assure you
that our assets would be sufficient to repay in full our secured indebtedness,
including the notes, and we could be forced into bankruptcy or
liquidation.
Lenders
under our revolving credit facility may not fund their commitments.
Lehman
Commercial Paper, Inc., or “Lehman,” which filed for bankruptcy in October 2008
is one of the lenders under our revolving credit facility, with a commitment of
$15.8 million of the $200 million available under the facility. On
October 10, 2008, we requested funding in the amount of $100 million under the
revolving credit facility, and Lehman failed to fund $7.9 million, the entire
portion of its commitment with respect to that borrowing
request. Under the credit agreement governing our revolving credit
facility, if a lender's commitment is not honored, that portion of the lender's
commitment under the revolving credit facility will be unavailable to the extent
that the lender's commitment is not replaced by a new commitment from an
alternate lender.
Lenders
under our revolving credit facility are well-diversified, totaling 14 lenders at
December 31, 2009. We currently anticipate that these lenders, other
than Lehman, will participate in future requests for
funding. However, there can be no assurance that further
deterioration in the credit markets and overall economy will not affect the
ability of our lenders to meet their funding
commitments. Additionally, our lenders have the ability to transfer
their commitments to other institutions, and the risk that committed funds may
not be available under distressed market conditions could be exacerbated to the
extent that consolidation of the commitments under our facilities or among its
lenders were to occur.
15
We
received notices of examination from the Internal Revenue Service regarding two
claims for the alternative fuel mixture tax credit for our mills.
We
believe that our Androscoggin and Quinnesec mills have been eligible to receive
the federal alternative fuel mixture tax credit since September 2008. In May
2009, we received separate notices from the Internal Revenue Service informing
us that they would be auditing the fourth quarter 2008 Quinnesec claim and the
March 2009 Androscoggin claim. Both audits are currently in progress with no
findings as of this date. Although we routinely receive notices of
examination by taxing authorities, there can be no assurance that further steps
will not be taken by the Internal Revenue Service as a result of the examination
of these claims.
Litigation
could be costly and harmful to our business.
We are
involved from time to time in claims and legal proceedings relating to
contractual, employment, environmental,
intellectual property and other matters incidental to the conduct of our
business. We do not believe
that any currently pending claim or legal proceeding is likely to result in an
unfavorable outcome that would
have a material adverse effect on our financial condition or results of
operations. Nonetheless, claims and legal
proceedings could result in unfavorable outcomes that could have a material
adverse effect on our financial condition
and results of operations.
We
have a limited operating history as a separate company. Accordingly,
our Predecessor’s combined historical financial data may not be representative
of our results as a separate company.
We
operated as a division of International Paper prior to August 1, 2006, when we
acquired the business of the Coated and Supercalendered Papers Division from
International Paper. Therefore, we have a limited operating history
as a separate company. Our business strategy as an independent entity
may not be successful on a long-term basis. Although International
Paper generally no longer sells coated or supercalendered paper, we cannot
assure you that our customers will continue to do business with us on the same
terms as when we were a division of International Paper or at all. We
may not be able to grow our business as planned and may not remain a profitable
business. In addition, the historical combined financial data
included in this annual report may not necessarily reflect what our results of
operations, financial condition and cash flows would have been had we been a
separate independent entity pursuing our own strategies during the periods
presented. Our limited operating history as a separate entity makes
evaluating our business and our future financial prospects
difficult. As a result, our business, financial condition and results
of operations may differ materially from our expectations based on the
historical financial data contained in this annual report.
Our cost
structure following our separation from International Paper is not comparable to
the cost structure that we experienced in prior periods. Our
management has limited experience managing our business as a separate company
with a significant amount of indebtedness. We cannot assure you that
our cost structure in future periods will be consistent with our current
expectations or will permit us to operate our business profitably.
The
markets in which we operate are highly competitive.
Our
business is highly competitive. Competition is based largely on
price. We compete with foreign producers, some of which are lower
cost producers than we are or are subsidized by governments. We also
face competition from numerous North American coated and supercalendered paper
manufacturers. Some of our competitors have advantages over us,
including lower raw material and labor costs and fewer environmental and
governmental regulations to comply with than we do. Furthermore, some
of our competitors have greater financial and other resources than we do or may
be better positioned than we are to compete for certain
opportunities.
16
Our
non-U.S. competitors may develop a competitive advantage over us and other U.S.
producers if the U.S. dollar strengthens in comparison to the home currency of
those competitors or ocean shipping rates decrease. If the U.S.
dollar strengthens, if shipping rates decrease or if overseas supply exceeds
demand, imports may increase, which would cause the supply of coated paper
products available in the North American market to increase. An
increased supply of coated paper could cause us to lower our prices or lose
sales to competitors, either of which could have a material adverse effect on
our business, financial condition and results of operations.
In
addition, the following factors will affect our ability to compete:
·
product
availability;
·
the
quality of our products;
·
our
breadth of product offerings;
·
our
ability to maintain plant efficiencies and to achieve high operating
rates;
·
manufacturing
costs per ton;
·
customer
service and our ability to distribute our products on time; and
·
the
availability and/or cost of wood fiber, market pulp, chemicals, energy and other
raw materials and labor.
If
we are unable to obtain energy or raw materials at favorable prices, or at all,
it could have a material adverse effect on our business, financial condition,
and results of operations.
We
purchase wood fiber, market pulp, chemicals, energy, and other raw materials
from third parties. We may experience shortages of energy supplies or
raw materials or be forced to seek alternative sources of supply. If
we are forced to seek alternative sources of supply, we may not be able to do so
on terms as favorable as our current terms or at all. In addition,
the prices for energy and many of our raw materials, especially petroleum-based
chemicals, have recently been volatile and are expected to remain volatile for
the foreseeable future. Chemical suppliers that use petroleum-based
products in the manufacture of their chemicals may, due to a supply shortage and
cost increase, ration the amount of chemicals available to us and/or we may not
be able to obtain the chemicals we need to operate our business at favorable
prices, if at all. In addition, certain specialty chemicals that we
purchase are available only from a small number of suppliers. If any
of these suppliers were to cease operations or cease doing business with us, we
may be unable to obtain such chemicals at favorable prices, if at
all.
The
supply of energy or raw materials may be adversely affected by, among other
things, hurricanes and other natural disasters or an outbreak or escalation of
hostilities between the United States and any foreign power and, in particular,
events in the Middle East. For example, wood fiber is a commodity and
prices historically have been cyclical. The primary source for wood
fiber is timber. Environmental litigation and regulatory developments
have caused, and may cause in the future, significant reductions in the amount
of timber available for commercial harvest in Canada and the United
States. In addition, future domestic or foreign legislation,
litigation advanced by aboriginal groups, litigation concerning the use of
timberlands, the protection of endangered species, the promotion of forest
biodiversity, and the response to and prevention of wildfires and campaigns or
other measures by environmental activists also could affect timber
supplies. The availability of harvested timber may further be limited
by factors such as fire and fire prevention, insect infestation, disease, ice
and wind storms, droughts, floods and other natural and man-made
causes. Additionally, due to increased fuel costs, suppliers,
distributors and freight carriers have charged fuel surcharges, which have
increased our costs. Any significant shortage or significant increase
in our energy or raw material costs in circumstances where we cannot raise the
price of our products due to market conditions could have a material adverse
effect on our business, financial condition and results of
operations. Any disruption in the supply of energy or raw materials
also could affect our ability to meet customer demand in a timely manner and
could harm our reputation. Furthermore, we may be required to post
letters of credit or other financial assurance obligations with certain of our
energy and other suppliers, which could limit our financial
flexibility.
17
Currency fluctuations may adversely
affect our business, financial condition, and results of
operations.
We
compete with producers in North America and abroad. Changes in the
relative strength or weakness of the U.S. dollar may affect international trade
flows of coated paper products. A stronger U.S. dollar may attract
imports from foreign producers, increase supply in the United States, and have a
downward effect on prices, while a weaker U.S. dollar may encourage U.S.
exports. Variations in the exchange rates between the U.S. dollar and
other currencies, particularly the Canadian dollar and the euro, may
significantly affect our competitive position, including by making it more
attractive for foreign producers to restart previously shut-down paper mills or
by increasing production capacity in North America or Europe.
We
are involved in continuous manufacturing processes with a high degree of fixed
costs. Any interruption in the operations of our manufacturing
facilities may affect our operating performance.
We seek
to run our paper machines on a nearly continuous basis for maximum
efficiency. Any downtime at any of our paper mills, including as a
result of or in connection with planned maintenance and capital expenditure
projects, results in unabsorbed fixed costs that negatively affect our results
of operations for the period in which we experience the downtime. Due
to the extreme operating conditions inherent in some of our manufacturing
processes, we may incur unplanned business interruptions from time to time and,
as a result, we may not generate sufficient cash flow to satisfy our operational
needs. In addition, many of the geographic areas where our production
is located and where we conduct our business may be affected by natural
disasters, including snow storms, forest fires, and flooding. Such
natural disasters could cause our mills to stop running, which could have a
material adverse effect on our business, financial condition and results of
operations. Furthermore, during periods of weak demand for paper
products, such as the current market, we have experienced and may in the future
experience market-related downtime, which could have a material adverse effect
on our financial condition and results of operations.
We
depend on a small number of customers for a significant portion of our
business.
Our
largest customer, International Paper and its divisions and subsidiaries
(including xpedx and Central Lewmar LLC), accounted for approximately 10% of our
net sales in 2009. In 2009, our ten largest customers (including
International Paper) accounted for approximately 50% of our net sales, while our
ten largest end-users accounted for approximately 27% of our net
sales. The loss of, or reduction in orders from, any of these
customers or other customers could have a material adverse effect on our
business, financial condition and results of operations, as could significant
customer disputes regarding shipments, price, quality or other
matters.
We
may not realize certain productivity enhancements or improvements in
costs.
As part
of our business strategy, we are in the process of identifying opportunities to
improve profitability by reducing costs and enhancing
productivity. For example, through our continuous process improvement
program, we have implemented focused programs to optimize material and energy
sourcing and usage, reduce repair costs and control overhead. We will
continue to utilize the process improvement program to drive further cost
reductions and operating improvements in our mill system, and have targeted
additional profitability enhancements in the next twelve months. Any cost
savings or productivity enhancements that we realize from such efforts may
differ materially from our estimates. In addition, any cost savings
or productivity enhancements that we realize may be offset, in whole or in part,
by reductions in pricing or volume, or through increases in other expenses,
including raw material, energy or personnel. We cannot assure you that these
initiatives will be completed as anticipated or that the benefits we expect will
be achieved on a timely basis or at all.
18
Rising
postal costs could weaken demand for our paper products.
A
significant portion of paper is used in magazines, catalogs, and other
promotional mailings. Many of these materials are distributed through
the mail. Future increases in the cost of postage could reduce the
frequency of mailings, reduce the number of pages in magazine and advertising
materials, and/or cause catalog and magazine publishers to use alternate methods
to distribute their materials. Any of the foregoing could decrease
the demand for our products, which could have a material adverse effect on our
business, financial condition and results of operations.
Our
business may suffer if we do not retain our senior management.
We depend
on our senior management. The loss of services of members of our
senior management team could adversely affect our business until suitable
replacements can be found. There may be a limited number of persons
with the requisite skills to serve in these positions and we may be unable to
locate or employ qualified personnel on acceptable terms. In
addition, our future success requires us to continue to attract and retain
competent personnel.
A
large percentage of our employees are unionized. Wage increases or
work stoppages by our unionized employees may have a material adverse effect on
our business, financial condition, and results of operations.
As of
December 31, 2009, approximately 35%, of our employees were represented by labor
unions under three collective bargaining agreements at two of our mills, which
expire in 2011. We may become subject to material cost increases or
additional work rules imposed by agreements with labor unions. This
could increase expenses in absolute terms and/or as a percentage of net
sales. In addition, although we believe we have good relations with
our employees, work stoppages or other labor disturbances may occur in the
future. Any of these factors could negatively affect our business,
financial condition and results of operations.
We
depend on third parties for certain transportation services.
We rely
primarily on third parties for transportation of our products to our customers
and transportation of our raw materials to us, in particular, by truck and
train. If any third-party transportation provider fails to deliver
our products in a timely manner, we may be unable to sell them at full
value. Similarly, if any transportation provider fails to deliver raw
materials to us in a timely manner, we may be unable to manufacture our products
on a timely basis. Shipments of products and raw materials may be
delayed due to weather conditions, strikes or other events. Any
failure of a third-party transportation provider to deliver raw materials or
products in a timely manner could harm our reputation, negatively impact our
customer relationships and have a material adverse effect on our business,
financial condition and results of operations. In addition, our
ability to deliver our products on a timely basis could be adversely affected by
the lack of adequate availability of transportation services, especially rail
capacity, whether because of work stoppages or
otherwise. Furthermore, increases in the cost of our transportation
services, including as a result of rising fuel costs, could have a material
adverse effect on our business, financial condition and results of
operations.
We
are subject to various environmental, health and safety laws and regulations
that could impose substantial costs or other liabilities upon us and may have a
material adverse effect on our business, financial condition, and results of
operations.
We are
subject to a wide range of federal, state, and local general and
industry-specific environmental, health and safety laws and regulations,
including those relating to air emissions (including greenhouse gases),
wastewater discharges, solid and hazardous waste management and disposal and
site remediation. Compliance with these laws and regulations, and
permits issued thereunder, is a significant factor in our
business. We have made, and will continue to make, significant
expenditures to comply with these requirements and our permits. In
addition, we handle and dispose of wastes arising from our mill operations and
operate a number of on-site landfills to handle that waste. We
maintain financial assurance for the projected cost of closure and post-closure
care for these landfill operations. We could be subject to
potentially significant fines, penalties, criminal sanctions, plant shutdowns,
or interruptions in operations for any failure to comply with applicable
environmental, health and safety laws, regulations, and
permits. Moreover, under certain environmental laws, a current or
previous owner or operator of real property, and parties that generate or
transport hazardous substances that are disposed of at real property, may be
held liable for the full cost to investigate or clean up such real property and
for related damages to natural resources. We may be subject to
liability, including liability for investigation and cleanup costs, if
contamination is discovered at one of our current or former paper mills, other
properties or other locations where we have disposed of, or arranged for the
disposal of, wastes. The 2006 acquisition agreement with
International Paper contains an environmental indemnity, subject to certain
limitations, for former properties and former off-site shipments related to the
business during the time it was owned by International Paper, as well as certain
other limited environmental liabilities. There can be no assurance
that International Paper will perform under any of its environmental indemnity
obligations, and its failure to do so could have a material adverse effect on
our financial condition and results of operations. We also could be
subject to claims brought pursuant to applicable laws, rules or regulations for
property damage or personal injury resulting from the environmental impact of
our operations, including due to human exposure to hazardous
substances. Increasingly stringent or new environmental requirements,
more aggressive enforcement actions or policies, the discovery of unknown
conditions or the bringing of future claims may cause our expenditures for
environmental matters to increase, and we may incur material costs associated
with these matters.
19
A recent
decision of the United States Supreme Court held that greenhouse gases are
subject to regulation under the Clean Air Act. The Environmental
Protection Agency, or “EPA,” has subsequently issued regulations applicable to
us which require monitoring of greenhouse gas emissions, and we are in
compliance with those regulations. The EPA may, in the future, issue
additional regulations which require installation of greenhouse gas emission
controls, acquisition of emission credits as to such emissions and/or other
measures which may have a material effect on our operations. The
United States Congress is also considering legislation which would similarly
provide for regulation of greenhouse gas emissions. It is also possible that we
could become subject to other federal, state, local or supranational legislation
related to climate change and greenhouse gas controls. We do not
expect that we would be disproportionately affected by these measures as
compared to similarly situated operators in the United States.
20
Item 1B. Unresolved Staff
Comments
Not
applicable.
Item 2. Properties
Our
corporate headquarters are located in Memphis, Tennessee. We own four
mills located in Maine, Michigan, and Minnesota at which we operate 11 paper
machines. We also own five hydroelectric dams, of which four provide
hydroelectric power to our Androscoggin mill and the fifth services our Sartell
mill. In addition, we own 15 and lease four woodyards for the purpose
of storage and loading of forest products and lease a number of sales
offices.
Our
headquarters and material facilities as of December 31, 2009, are shown in the
following table:
|
Location
|
Use
|
Owned/Leased
|
||
|
Memphis, TN
|
corporate
headquarters
|
leased
|
||
|
Jay (Androscoggin), ME
|
paper mill/kraft
pulp mill
|
owned
|
||
|
Bucksport, ME
|
paper
mill
|
owned
|
||
|
Quinnesec, MI
|
paper mill/kraft
pulp mill
|
owned
|
||
|
Sartell, MN
|
paper
mill
|
owned
|
||
|
West Chester, OH
|
sales,
distribution, and customer service
|
leased
|
Item 3. Legal
Proceedings
In
October 2009, Thilmany, LLC (together with its parent company, Packaging
Dynamics Corporation) served us with a lawsuit filed in circuit court in
Outagamie County, Wisconsin. Thilmany alleges in the lawsuit that the
alternative fuel mixture tax credits that we have received from the operation of
the Androscoggin mill have had the effect of reducing our costs associated with
operating the Androscoggin mill and producing the pulp that we use to
manufacture paper products for Thilmany on paper machine no. 5 under a long-term
supply agreement. Thilmany seeks unspecified damages for our alleged breach of
contract for failing to provide Thilmany with a prorated share of the purported
cost savings attributable to the tax credits and a declaration that Thilmany is
entitled to a prorated share of any such future costs savings attributable to
our use of alternative fuel mixtures at the Androscoggin mill. In November 2009,
we filed responsive pleadings with the court in which we denied Thilmany’s
claims and requested that Packaging Dynamics Corporation be dismissed from the
lawsuit.
We are
involved in legal proceedings incidental to the conduct of our business. We do
not believe that any liability that may result from these proceedings will have
a material adverse effect on our financial statements.
Not
applicable.
21
PART II
Market
Information
Our
common stock is traded on the New York Stock Exchange under the symbol
“VRS.” The following table sets forth the high and low sales prices
per share of our common stock, as reported by the New York Stock Exchange, for
the indicated periods:
|
2009
|
High
|
Low
|
||||||
|
First
quarter
|
$ | 1.40 | $ | 0.32 | ||||
|
Second
quarter
|
2.00 | 0.50 | ||||||
|
Third
quarter
|
3.79 | 1.01 | ||||||
|
Fourth
quarter
|
3.50 | 2.10 | ||||||
|
2008
|
||||||||
|
Second quarter (from May
15)
|
$ | 12.01 | $ | 7.72 | ||||
|
Third
quarter
|
8.42 | 2.16 | ||||||
|
Fourth
quarter
|
2.59 | 0.82 | ||||||
Holders
As of
February 19, 2010, there were 21 stockholders of record of our common
stock.
Dividends
We paid
no dividends on our common stock prior to our IPO. Following our IPO
in May 2008, we paid cash dividends on our common stock in the amount of $0.03
per share for the second and third quarters, which were declared and paid in the
following quarter. We suspended the payment of dividends in 2008
beginning with the fourth quarter dividend. Past dividend payments
are not indicative of our future dividend policy, and there can be no assurance
that we will declare or pay any cash dividends in the future. Any
future determination relating to our dividend policy will be made at the
discretion of our board of directors and will depend on then existing
conditions, including our financial condition, results of operations,
contractual restrictions, capital requirements, business prospects and other
factors that our board of directors may deem relevant. Our ability to
pay dividends on our common stock is limited by the covenants of our revolving
credit facility and the indentures governing our outstanding notes, and may be
further restricted by the terms of any of our future debt or preferred
securities. As of December 31, 2009, we were in compliance with these
restrictive covenants.
22
Equity
Compensation Plan Information
The table
below sets forth information regarding the number of shares of common stock to
be issued upon the exercise of the outstanding stock options granted under our
equity compensation plans and the shares of common stock remaining available for
future issuance under our equity compensation plans as of December 31,
2009.
|
Number of
|
||||||||||||
|
securities
|
||||||||||||
|
remaining
|
||||||||||||
|
available
for
|
||||||||||||
|
Number of
|
future
issuance
|
|||||||||||
|
securities
|
Weighted-
|
under
equity
|
||||||||||
|
to be
|
average
|
compensation
|
||||||||||
|
issued upon
|
exercise
|
plans
(excluding
|
||||||||||
|
exercise of
|
price of
|
securities
|
||||||||||
|
outstanding
|
outstanding
|
reflected
in
|
||||||||||
|
options
|
options
|
column (a))
|
||||||||||
|
Plan
Category
|
(a)
|
(b)
|
(c)
|
|||||||||
|
Equity compensation plans approved
by security holders
|
1,182,400 | $ | 3.35 | 2,739,600 | ||||||||
|
Equity
compensation plans not approved by security holders
|
- | - | - | |||||||||
|
Total
|
1,182,400 | $ | 3.35 | 2,739,600 | ||||||||
Item 6. Selected Financial
Data
The
following table presents our selected financial data as of and for the periods
presented. The following information is only a summary and should be
read in conjunction with “Management’s Discussion and Analysis of Financial
Condition and Results of Operations” and the financial statements and their
related notes, and the other financial information, included elsewhere in this
annual report.
The
selected historical financial data for the seven months ended July 31, 2006, and
as of and for the year ended December 31, 2005, have been derived from the
audited combined financial statements of the Coated and Supercalendered Papers
Division of International Paper, or the “Predecessor.” The selected
historical financial data as of and for the years ended December 31, 2009, 2008,
and 2007, and as of and for the five months ended December 31, 2006, have been
derived from the audited consolidated (2009 and 2008) and combined (2007 and
2006) financial statements of Verso Paper Corp., or the
“Successor.” The audited consolidated financial statements of the
Successor as of and for the years ended December 31, 2009 and 2008, and the
audited combined financial statements of the Successor for the year ended
December 31, 2007, are included elsewhere in this annual report.
23
|
Successor
Consolidated
|
Successor
Combined
|
Predecessor
Combined
|
||||||||||||||||||||||
|
Five
|
Seven
|
|||||||||||||||||||||||
|
Year
|
Year
|
Year
|
Months
|
Months
|
Year
|
|||||||||||||||||||
|
Ended
|
Ended
|
Ended
|
Ended
|
Ended
|
Ended
|
|||||||||||||||||||
|
(dollars and
tons in millions
|
December 31,
|
December 31,
|
December 31,
|
December 31,
|
July 31,
|
December 31,
|
||||||||||||||||||
|
except
per share data)
|
2009
|
2008
|
2007
|
2006
|
2006
|
2005
|
||||||||||||||||||
|
Statement of Operations
Data:
|
||||||||||||||||||||||||
|
Net sales
|
$ | 1,360.9 | $ | 1,766.8 | $ | 1,628.8 | $ | 706.8 | $ | 904.4 | $ | 1,603.8 | ||||||||||||
|
Costs and
expenses:
|
||||||||||||||||||||||||
|
Cost of products
sold - (exclusive of
|
||||||||||||||||||||||||
|
depreciation, amortization, and
depletion)
|
1,242.7 | 1,463.2 | 1,403.0 | 589.3 | 771.6 | 1,338.2 | ||||||||||||||||||
|
Depreciation, amortization, and
depletion
|
132.7 | 134.5 | 123.2 | 48.3 | 72.7 | 129.4 | ||||||||||||||||||
|
Selling, general, and
administrative expenses
|
61.9 | 79.7 | 53.2 | 14.4 | 34.3 | 65.6 | ||||||||||||||||||
|
Restructuring and
other charges
|
1.0 | 27.4 | 19.4 | 10.1 | (0.3 | ) | 10.4 | |||||||||||||||||
|
Operating income
(loss)
|
(77.4 | ) | 62.0 | 30.0 | 44.7 | 26.1 | 60.2 | |||||||||||||||||
|
Interest
income
|
(0.3 | ) | (0.8 | ) | (1.5 | ) | (1.8 | ) | - | - | ||||||||||||||
|
Interest
expense
|
123.4 | 125.6 | 143.0 | 49.1 | 8.4 | 14.8 | ||||||||||||||||||
|
Other income,
net
|
(307.3 | ) | - | - | - | - | - | |||||||||||||||||
|
Income (loss) before income
taxes
|
106.8 | (62.8 | ) | (111.5 | ) | (2.6 | ) | 17.7 | 45.4 | |||||||||||||||
|
Provision for income
taxes
|
0.8 | - | - | - | 7.0 | 17.9 | ||||||||||||||||||
|
Net income
(loss)
|
$ | 106.0 | $ | (62.8 | ) | $ | (111.5 | ) | $ | (2.6 | ) | $ | 10.7 | $ | 27.5 | |||||||||
|
Per Share
Data:
|
||||||||||||||||||||||||
|
Earnings (loss) per
share:
|
||||||||||||||||||||||||
|
Basic
|
$ | 2.03 | $ | (1.35 | ) | $ | (2.93 | ) | $ | (0.07 | ) | |||||||||||||
|
Diluted
|
2.03 | (1.35 | ) | (2.93 | ) | (0.07 | ) | |||||||||||||||||
|
Weighted average common shares
outstanding:
|
||||||||||||||||||||||||
|
Basic
|
52,138,307 | 46,691,456 | 38,046,647 | 38,046,647 | ||||||||||||||||||||
|
Diluted
|
52,153,448 | 46,691,456 | 38,046,647 | 38,046,647 | ||||||||||||||||||||
|
Statement of Cash Flows
Data:
|
||||||||||||||||||||||||
|
Cash provided by operating
activities
|
$ | 177.2 | $ | 54.1 | $ | 15.0 | $ | 128.2 | $ | 39.3 | $ | 116.8 | ||||||||||||
|
Cash used in investing
activities
|
(34.1 | ) | (81.3 | ) | (69.1 | ) | (1,402.0 | ) | (27.6 | ) | (53.0 | ) | ||||||||||||
|
Cash (used in) provided by
financing activities
|
(110.5 | ) | 88.2 | 0.2 | 1,386.3 | (11.6 | ) | (63.8 | ) | |||||||||||||||
|
Other Financial and Operating
Data:
|
||||||||||||||||||||||||
|
EBITDA (1)
|
$ | 362.6 | $ | 196.5 | $ | 153.2 | $ | 93.0 | $ | 98.8 | $ | 189.6 | ||||||||||||
|
Capital
expenditures
|
(34.2 | ) | (81.4 | ) | (70.9 | ) | (27.8 | ) | (27.7 | ) | (53.1 | ) | ||||||||||||
|
Total tons
sold
|
1,724.5 | 1,952.7 | 2,096.3 | 866.4 | 1,145.0 | 2,024.9 | ||||||||||||||||||
|
Balance Sheet
Data:
|
||||||||||||||||||||||||
|
Working capital
(2)
|
$ | 210.6 | $ | 151.9 | $ | 87.2 | $ | 153.8 | $ | 87.8 | ||||||||||||||
|
Property, plant and equipment,
net
|
1,022.6 | 1,116.0 | 1,160.2 | 1,212.3 | 1,287.0 | |||||||||||||||||||
|
Total
assets
|
1,572.7 | 1,636.4 | 1,603.5 | 1,711.0 | 1,534.1 | |||||||||||||||||||
|
Total debt
|
1,192.4 | 1,357.7 | 1,419.6 | 1,169.3 | 301.2 | |||||||||||||||||||
|
Total shareholders' equity
(deficit)
|
125.3 | (10.0 | ) | (75.1 | ) | 280.0 | 1,040.0 | |||||||||||||||||
(1) EBITDA consists of earnings before
interest, taxes, depreciation, and amortization. EBITDA is a measure commonly
used in our industry and we present EBITDA to enhance your understanding of
our operating performance.
We use EBITDA as one criterion for evaluating our performance relative to that
of our peers. We believe that EBITDA is an operating performance measure, and
not a liquidity measure, that provides investors and analysts with a
measure of operating results unaffected by
differences in capital structures, capital investment cycles and ages of related
assets among otherwise comparable companies. However, EBITDA is not a
measurement of financial performance under U.S. GAAP, and our EBITDA may not be comparable to similarly
titled measures of other companies. You should not consider our EBITDA as an
alternative to operating or net income, determined in accordance with U.S. GAAP,
as an indicator of our operating performance, or as an alternative to cash flows from operating
activities, determined in accordance with U.S. GAAP, as an indicator of our cash
flows or as a measure of liquidity.
(2) Working capital is defined as
current assets net of current liabilities, excluding the current portion of long-term debt and the
Predecessor’s accounts payable to International
Paper.
24
The
following table reconciles net income (loss) to EBITDA for the periods
presented:
|
Successor
Consolidated
|
Successor
Combined
|
Predecessor
Combined
|
||||||||||||||||||||||
|
Five
|
Seven
|
|||||||||||||||||||||||
|
Year
|
Year
|
Year
|
Months
|
Months
|
Year
|
|||||||||||||||||||
|
Ended
|
Ended
|
Ended
|
Ended
|
Ended
|
Ended
|
|||||||||||||||||||
|
December 31,
|
December 31,
|
December 31,
|
December 31,
|
July 31,
|
December 31,
|
|||||||||||||||||||
|
(In millions of
U.S. dollars)
|
2009
|
2008
|
2007
|
2006
|
2006
|
2005
|
||||||||||||||||||
|
Reconciliation of net income
(loss)
|
||||||||||||||||||||||||
|
to
EBITDA:
|
||||||||||||||||||||||||
|
Net income
(loss)
|
$ | 106.0 | $ | (62.8 | ) | $ | (111.5 | ) | $ | (2.6 | ) | $ | 10.7 | $ | 27.5 | |||||||||
|
Provision for income
taxes
|
0.8 | - | - | - | 7.0 | 17.9 | ||||||||||||||||||
|
Interest expense,
net
|
123.1 | 124.8 | 141.5 | 47.3 | 8.4 | 14.8 | ||||||||||||||||||
|
Depreciation, amortization, and
depletion
|
132.7 | 134.5 | 123.2 | 48.3 | 72.7 | 129.4 | ||||||||||||||||||
|
EBITDA
|
$ | 362.6 | $ | 196.5 | $ | 153.2 | $ | 93.0 | $ | 98.8 | $ | 189.6 | ||||||||||||
The
following discussion and analysis of our financial condition and results of
operations includes statements regarding the industry outlook and our
expectations regarding the performance of our business. These
non-historical statements in the discussion and analysis are forward-looking
statements. These forward-looking statements are subject to numerous
risks and uncertainties, including, but not limited to, the risks and
uncertainties described in “Risk Factors.” Our actual results may
differ materially from those contained in or implied by any forward-looking
statements. The discussion and analysis should be read together with
“Risk Factors” and the financial statements and their related notes included
elsewhere in this annual report.
Overview
We are a
leading North American supplier of coated papers to catalog and magazine
publishers. Coated paper is used primarily in media and marketing
applications, including catalogs, magazines, and commercial printing
applications, such as high-end advertising brochures, annual reports, and direct
mail advertising. We are one of North America’s largest producers of
coated groundwood paper which is used primarily for catalogs and
magazines. We are also a low cost producer of coated freesheet paper
which is used primarily for annual reports, brochures, and magazine
covers. In addition, we have a growing presence in supercalendered
paper which is primarily used for retail inserts, but also increasingly for
catalogs and magazines. We also produce and sell market kraft pulp
which is used to manufacture printing and writing paper grades and tissue
products. We have recently expanded our product line of specialty
papers by introducing new specialty papers for applications in flexible
packaging.
Background
We began
operations on August 1, 2006, when we acquired the assets and certain
liabilities of the business of International Paper. We were formed by
affiliates of Apollo for the purpose of consummating the Acquisition from
International Paper. Verso Paper Corp. went public on May 14, 2008,
with an IPO of 14 million shares of common stock, which generated $152.2 million
in net proceeds.
Selected
Factors Affecting Operating Results
Net
Sales
Our
sales, which we report net of rebates, allowances and discounts, are a function
of the number of tons of paper that we sell and the price at which we sell our
paper. The coated paper industry is cyclical, which results in
changes in both volume and price. Paper prices historically have been
a function of macro-economic factors which influence supply and
demand. Price has historically been substantially more variable than
volume and can change significantly over relatively short time
periods. Paper prices declined in late 2006 and early 2007, which we
believe was due to high customer and producer inventories and cautious
purchasing by customers in advance of a scheduled postal rate
increase. Beginning in mid-2007, prices began to rebound following
announcements by several of our North American competitors of permanent closures
of approximately 1 million tons of annual production capacity (approximately 9%
of North American coated paper capacity). These market conditions
continued into early 2008 with a series of announced price increases by
suppliers of coated paper. Meanwhile, customers were rebuilding their paper
inventories after a significant depletion in the second half of
2007. In the second half of 2008, we saw a significant weakening in
demand as general economic conditions began to worsen. This weakened
demand, coupled with the inventory build, put downward pressure on prices in
late 2008 and into 2009, and has caused us, and most coated paper producers, to
curtail production to match supply with demand. Coated prices
continue to remain under pressure compared to the peak levels reached in the
second half of 2008; however, improved demand combined with market downtime,
announced closures, and movements to other grades serve to balance supply with
demand.
25
We are
primarily focused on serving two end-user segments: catalogs and
magazines. In 2009, we believe we had a leading market share for the
catalog and magazine segments of coated papers. Coated paper demand
is primarily driven by advertising and print media usage. Advertising
spending and magazine and catalog circulation tend to correlate with changes in
the GDP of the United States – they rise with a strong economy and contract with
a weak economy.
The
majority of our products are sold under contracts with our
customers. Contracted sales are more prevalent for coated groundwood
paper, as opposed to coated freesheet paper, which is more often sold without a
contract. Our contracts generally specify the volumes to be sold to
the customer over the contract term, as well as the pricing parameters for those
sales. Most of our contracts are negotiated on an annual basis, with
only a few having terms extending beyond one year. Typically, our
contracts provide for quarterly price adjustments based on market price
movements. The large portion of contracted sales allows us to plan
our production runs well in advance, optimizing production over our integrated
mill system and thereby reducing costs and increasing overall
efficiency.
We reach
our end-users through several channels, including printers, brokers, paper
merchants, and direct sales to end-users. We sell and market our
products to approximately 100 customers which comprise approximately 670
end-user accounts. In 2009, International Paper and its divisions and
subsidiaries (including xpedx and Central Lewmar LLC) accounted for
approximately 10% of our total net sales.
Our
historical results include specialty papers that we manufacture for Thilmany,
LLC, or “Thilmany,” on paper machine no. 5 at the Androscoggin
mill. Under a long-term supply agreement entered into in 2005 in
connection with International Paper’s sale of its Industrial Papers business to
Thilmany, these products are sold to Thilmany at a variable charge for the paper
purchased and a fixed charge for the availability of the machine. The
amounts included in our net sales for the specialty papers sold to Thilmany
totaled $39.0 million, $42.4 million, and $37.6 million in 2009, 2008, and 2007,
respectively.
Cost
of Products Sold
The
principal components of our cost of sales are chemicals, wood, energy, labor,
maintenance, and depreciation, amortization, and depletion. Costs for
commodities, including chemicals, wood, and energy, are the most variable
component of our cost of sales because their prices can fluctuate substantially,
sometimes within a relatively short period of time. In addition, our
aggregate commodity purchases fluctuate based on the volume of paper that we
produce.
Chemicals. Chemicals
utilized in the manufacturing of coated papers include latex, starch, calcium
carbonate, and titanium dioxide. We purchase these chemicals from a
variety of suppliers and are not dependent on any single supplier to satisfy our
chemical needs. In the near term, we expect the rate of inflation for
our total chemical costs to be lower than that experienced over the last two
years. However, we expect imbalances in supply and demand will drive
higher prices for certain chemicals.
26
Wood. Our costs to
purchase wood are affected directly by market costs of wood in our regional
markets and indirectly by the effect of higher fuel costs on logging and
transportation of timber to our facilities. While we have in place
fiber supply agreements that ensure a substantial portion of our wood
requirements, purchases under these agreements are typically at market
rates. As we have begun
to utilize wood harvested from our 27,000-acre hybrid poplar woodlands located
near Alexandria, Minnesota, our ongoing wood costs should be
positively impacted.
Energy. We produce
a large portion of our energy requirements, historically producing approximately
50% of our energy needs for our coated paper mills from sources such as waste
wood and paper, hydroelectric facilities, chemicals from our pulping process,
our own steam recovery boilers and internal energy cogeneration
facilities. Our external energy purchases vary across each of our
mills and include fuel oil, natural gas, coal and electricity. While
our internal energy production capacity mitigates the volatility of our overall
energy expenditures, we expect prices for energy to remain volatile for the
foreseeable future and our energy costs to increase in a high energy cost
environment. As prices fluctuate, we have some ability to switch
between certain energy sources in order to minimize costs. We utilize
derivative contracts as part of our risk management strategy to manage our
exposure to market fluctuations in energy prices.
Labor . Labor
costs include wages, salary and benefit expenses attributable to our mill
personnel. Mill employees at a non-managerial level are compensated
on an hourly basis. Management employees at our mills are compensated
on a salaried basis. Wages, salary and benefit expenses included in
cost of sales do not vary significantly over the short term. In
addition, we have not experienced significant labor shortages.
Maintenance. Maintenance
expense includes day-to-day maintenance, equipment repairs and larger
maintenance projects, such as paper machine shutdowns for periodic
maintenance. Day-to-day maintenance expenses have not varied
significantly from year-to-year. Larger maintenance projects and
equipment expenses can produce year-to-year fluctuations in our maintenance
expenses. In conjunction with our periodic maintenance shutdowns, we
have incidental incremental costs that are primarily comprised of unabsorbed
fixed costs from lower production volumes and other incremental costs for
purchased materials and energy that would otherwise be produced as part of the
normal operation of our mills.
Depreciation, Amortization, and
Depletion. Depreciation, amortization, and depletion expense
represents the periodic charge to earnings through which the cost of tangible
assets, intangible assets, and natural resources are recognized over the asset’s
life. Capital investments can increase our asset bases and produce
year-to-year fluctuations in expense.
Selling,
General, and Administrative Expenses
The
principal components of our selling, general, and administrative expenses are
wages, salaries and benefits for our office personnel at our headquarters and
our sales force, travel and entertainment expenses, advertising expenses,
expenses relating to certain information technology systems, and research and
development expenses. In addition, we previously paid an annual management fee
to Apollo under a management agreement pursuant to which Apollo provided us with
certain financial and strategic advisory services and consulting
services. Upon the consummation of the IPO, Apollo terminated the
annual fee arrangement under the management agreement.
Critical
Accounting Policies
Our
accounting policies are fundamental to understanding management’s discussion and
analysis of financial condition and results of operations. Our
consolidated and combined financial statements are prepared in conformity with
accounting principles generally accepted in the United States of America and
follow general practices within the industry in which we operate. The
preparation of the financial statements requires management to make certain
judgments and assumptions in determining accounting
estimates. Accounting estimates are considered critical if the
estimate requires management to make assumptions about matters that were highly
uncertain at the time the accounting estimate was made, and different estimates
reasonably could have been used in the current period, or changes in the
accounting estimate are reasonably likely to occur from period to period, that
would have a material impact on the presentation of our financial condition,
changes in financial condition or results of operations.
27
Management
believes the following critical accounting policies are both important to the
portrayal of our financial condition and results of operations and require
subjective or complex judgments. These judgments about critical
accounting estimates are based on information available to us as of the date of
the financial statements.
Accounting
standards whose application may have a significant effect on the reported
results of operations and financial position, and that can require judgments by
management that affect their application, include the following: Financial
Accounting Standards Board, or “FASB,” Accounting Standards Codification, or
“ASC,” 450, Contingencies, FASB ASC 360,
Property, Plant, and
Equipment, FASB ASC 350, Intangibles – Goodwill and
Other, and FASB ASC 715, Compensation – Retirement
Benefits.
Impairment of long-lived assets and
goodwill. Long-lived assets are reviewed for impairment upon
the occurrence of events or changes in circumstances that indicate that the
carrying value of the assets may not be recoverable, as measured by comparing
their net book value to the estimated undiscounted future cash flows generated
by their use.
Goodwill
and other intangible assets are accounted for in accordance with FASB ASC
350. Intangible
assets primarily consist of trademarks, customer-related intangible assets and
patents obtained through business acquisitions. Impairment is the
condition that exists when the carrying amount of these assets exceed their
implied fair value. An impairment evaluation of the carrying amount
of goodwill and other intangible assets with indefinite lives is conducted
annually or more frequently if events or changes in circumstances indicate that
an asset might be impaired. The Company has identified the following
trademarks as intangible assets with an indefinite life: Influence®, Liberty®
and Advocate®. Goodwill is evaluated at the reporting unit level and
has been allocated to the “Coated” segment. The valuation as of
October 1, 2009, of goodwill and trademarks assigned indefinite lives, indicated
no impairment.
The
evaluation for impairment is performed by comparing the carrying amount of these
assets to their estimated fair value. If impairment is indicated,
then an impairment charge is recorded to reduce the asset to its estimated fair
value. The estimated fair value is generally determined on the basis
of discounted future cash flows. Management believes the accounting
estimates associated with determining fair value as part of the impairment test
is a critical accounting estimate because estimates and assumptions are made
about the Company’s future performance and cash flows. While
management uses the best information available to estimate future performance
and cash flows, future adjustments to management’s projections may be necessary
if economic conditions differ substantially from the assumptions used in making
the estimates.
Pension Benefit Obligations.
We offer various pension plans to employees. The calculation
of the obligations and related expenses under these plans requires the use of
actuarial valuation methods and assumptions, including the expected long-term
rate of return on plan assets, discount rates, projected future compensation
increases, health care cost trend rates and mortality
rates. Actuarial valuations and assumptions used in the determination
of future values of plan assets and liabilities are subject to management
judgment and may differ significantly if different assumptions are
used.
Contingent
liabilities. A liability is contingent if the outcome or
amount is not presently known, but may become known in the future as a result of
the occurrence of some uncertain future event. We estimate our
contingent liabilities based on management’s estimates about the probability of
outcomes and their ability to estimate the range of
exposure. Accounting standards require that a liability be recorded
if management determines that it is probable that a loss has occurred and the
loss can be reasonably estimated. In addition, it must be probable
that the loss will be confirmed by some future event. As part of the
estimation process, management is required to make assumptions about matters
that are by their nature highly uncertain.
28
The
assessment of contingent liabilities, including legal contingencies, asset
retirement obligations and environmental costs and obligations, involves the use
of critical estimates, assumptions and judgments. Management’s
estimates are based on their belief that future events will validate the current
assumptions regarding the ultimate outcome of these
exposures. However, there can be no assurance that future events will
not differ from management’s assessments.
Recent
Accounting Developments
Fair Value
Measurements and Disclosures — In January 2010, the FASB issued
Accounting Standards Update, or “ASU,” 2010-06, Fair Value Measurements and
Disclosures (Topic 820) – Improving Disclosures about Fair Value Measurements,
which provides additional guidance relating to fair value measurement
disclosures. Specifically, companies will be required to separately disclose
significant transfers into and out of Level 1 and Level 2 measurements
in the fair value hierarchy and the reasons for those transfers. For
Level 3 fair value measurements, the new guidance requires a gross
presentation of activities within the Level 3 roll
forward. Additionally, the FASB also clarified existing fair value
measurement disclosure requirements relating to the level of disaggregation,
inputs, and valuation techniques. This ASU is effective for interim or annual
reporting periods beginning after December 15, 2009, except for the detailed
Level 3 disclosures, which are effective for interim or annual reporting
periods beginning after December 15, 2010. Since ASU 2010-06 only affects
disclosure requirements, the adoption of these provisions will have no impact on
our financial condition, results of operations, or cash flows.
Other new
accounting pronouncements issued but not effective until after December 31,
2009, are not expected to have a significant effect on the Company’s financial
condition, results of operations, or cash flows.
Financial
Overview
The
economic downturn has presented a significant challenge for manufacturers of
coated paper as reduced spending on advertising and the overall weak retail
market significantly impacted our customers, especially magazine and catalog
publishers, resulting in unprecedented declines in demand for coated papers in
the first half of 2009. Coated paper demand strengthened during the second half
of 2009, and shipments were significantly improved in the fourth quarter of 2009
compared to the fourth quarter of 2008, and were down only slightly from the
seasonally strong third quarter of 2009. On a quarterly basis, year
over year demand has increased as mill and end-user inventories have moved to
the lowest level in over five years. However, coated paper prices
remained under pressure from the peak levels reached in the second half of
2008. Improved demand combined with market downtime and movements to
other grades serve to balance supply with demand.
Net sales
for the fourth quarter of 2009 increased 1.4% as sales volume increased 22.9%
compared to last year’s fourth quarter, reflecting an increase in demand, which
includes the effects of lower customer inventory levels. The average
sales price fell 17.5% from the fourth quarter of 2008, and fell 1.7%
sequentially from the third quarter of 2009. Additionally, new
product initiatives increased net sales by $10.5 million in the fourth quarter
of 2009 as compared to the same period in 2008, reflecting the development of
new paper product offerings for our customers.
In
response to market conditions, we continue to assess and implement, as
appropriate, various expense reduction initiatives. Our company-wide cost
reduction program produced approximately $62 million of savings during 2009 and
is expected to yield an additional $50 million in cost
reductions. Management expects to achieve most of these savings in
2010. Included in this program are material usage reductions, energy
usage reductions, labor cost savings, chemical substitution, selling, general,
and administrative expense reductions, and workforce planning
improvements.
29
Also
included in the results for 2009 are $238.9 million in pre-tax net benefits from
alternative fuel mixture tax credits provided by the U.S. government for our use
of black liquor in alternative fuel mixtures and $64.8 million in pre-tax net
gains from the early retirement of debt. The impact of these tax
credits is excluded from our calculation of Adjusted EBITDA. The tax
credit, as it relates to liquid fuels derived from biomass, expired on December
31, 2009. Therefore, we will not recognize any proceeds from this tax
credit in future periods.
Results
of Operations
The
following table sets forth certain consolidated and combined financial
information for the years ended December 31, 2009, 2008 and
2007. Cost of sales in the following table and discussion includes
the cost of products sold and depreciation, amortization and
depletion. The following table and discussion should be read in
conjunction with the information contained in our consolidated and combined
financial statements and the related notes included elsewhere in this annual
report.
|
Year Ended December
31,
|
||||||||||||
|
(In thousands of U.S.
dollars)
|
2009
|
|
2008
|
2007
|
||||||||
|
Net sales
|
$ | 1,360,854 | $ | 1,766,813 | $ | 1,628,753 | ||||||
|
Costs and
expenses:
|
||||||||||||
|
Cost of products
sold - exclusive of
|
||||||||||||
|
depreciation, amortization, and
depletion
|
1,242,743 | 1,463,169 | 1,403,013 | |||||||||
|
Depreciation,
amortization, and depletion
|
132,682 | 134,458 | 123,217 | |||||||||
|
Selling, general,
and administrative expenses
|
61,889 | 79,744 | 53,159 | |||||||||
|
Restructuring and
other charges
|
979 | 27,416 | 19,395 | |||||||||
|
Operating income
(loss)
|
(77,439 | ) | 62,026 | 29,969 | ||||||||
|
Interest
income
|
(246 | ) | (770 | ) | (1,544 | ) | ||||||
|
Interest
expense
|
123,365 | 125,622 | 142,976 | |||||||||
|
Other income,
net
|
(307,307 | ) | - | - | ||||||||
|
Income (loss) before income
taxes
|
106,749 | (62,826 | ) | (111,463 | ) | |||||||
|
Income tax
expense
|
746 | - | - | |||||||||
|
Net income
(loss)
|
$ | 106,003 | $ | (62,826 | ) | $ | (111,463 | ) | ||||
2009
Compared to 2008
Net Sales. Net sales for 2009
decreased 23.0% to $1,360.9 million from $1,766.8 million as total sales volume
decreased 11.7% compared to last year, primarily reflecting lower demand for
coated papers in a difficult economic environment and lower sales
prices. The average sales price per ton for all of our products fell
12.8% in 2009 due to the weak demand.
Net sales
for our coated and supercalendered papers segment decreased 23.9% to $1,198.8
million in 2009 from $1,575.0 million in 2008. The decrease reflects
a 14.7% decrease in paper sales volume and a 10.8% decrease in average paper
sales price per ton for 2009 compared to 2008.
Net sales
for our market pulp segment decreased 28.6% to $104.5 million in 2009 from
$146.4 million in 2008. This decline was due to a 27.9% decrease in
average sales price per ton combined with a 1.0% decrease in sales volume
compared to 2008.
30
Net sales
for our other segment increased 26.9% to $57.6 million in 2009 from $45.4
million in 2008. New product offerings contributed to the improvement
as sales volume increased 31.7% in 2009. This was partially offset by
a 3.6% decrease in average sales price per ton compared to 2008.
Cost of sales. Cost of sales, including
depreciation, amortization, and depletion, decreased 13.9% to $1,375.4 million
in 2009 from $1,597.7 million in 2008, primarily reflecting the decline in sales
volume and the effects of our expense reduction initiatives. Our
gross margin, excluding depreciation, amortization, and depletion, was 8.7% for
2009, compared to 17.2% for 2008. This compression in the margin
reflects lower average sales prices in 2009 and $74.9 million of unabsorbed
costs resulting from approximately 340,000 tons of market downtime taken in 2009
compared to $15.8 million of unabsorbed costs resulting from approximately
75,000 tons of market downtime taken in 2008, as we curtailed production in
response to weak demand for coated papers. Depreciation,
amortization, and depletion expense was $132.7 million for 2009, compared to
$134.5 million for 2008.
Selling, general, and
administrative. Selling, general, and
administrative expenses were $61.9 million in 2009, compared to $79.7 million in
2008, reflecting the absence of expenses associated with our IPO and the effect
of our expense reduction initiatives.
Interest expense. Interest
expense was $123.4 million in 2009, compared to $125.6 million in
2008. Included in 2008 interest expense is $5.0 million from a
prepayment penalty and the write-off of debt issuance costs resulting from the
partial repayment of our senior unsecured term loan with a portion of the IPO
proceeds. Interest expense for 2009 includes $118.0 million of cash
interest expense on our outstanding indebtedness and $5.4 million of non-cash
interest expense, including amortization of deferred debt issuance
costs.
Other income. Other income was $307.3
million in 2009 and includes $238.9 million in net benefits from alternative
fuel mixture tax credits provided by the U.S. government for our use of black
liquor in alternative fuel mixtures and $64.8 million in net gains related to
the early retirement of debt.
Restructuring and other
charges. Restructuring and other
charges in 2009, were $1.0 million compared to $27.4 million in
2008. Restructuring and other charges are comprised of transition and
other costs (i.e., technology migration costs, consulting and legal fees, and
other one-time costs), including those associated with the
Acquisition. Subsequent to the Acquisition, we entered into a
management agreement with Apollo relating to the provision of certain financial
and strategic advisory services and consulting services. Upon
consummation of the IPO, Apollo terminated the annual fee arrangement under the
management agreement for a one-time fee of $23.1 million in 2008.
2008
Compared to 2007
Net Sales. Net
sales grew 8.5% to $1,766.8 million in 2008 from $1,628.8 million in
2007. The growth was the result of a 16.5% increase in the average
sales price per ton for all of our products in 2008. This increase
was partially offset by a 6.8% decrease in total sales volume, reflecting lower
coated paper demand in a difficult economic environment.
Net sales
for our coated and supercalendered papers segment were $1,575.0 million in 2008,
compared to $1,443.2 million in 2007, an increase of 9.1%. The
improvement reflects a 17.2% increase in average paper sales price which was
partially offset by a 6.9% decrease in paper sales volume compared to
2007.
Net sales
for our hardwood market pulp segment were relatively stable at $146.4 million in
2008, compared to $148.0 million in 2007. This result reflected a
9.3% decrease in pulp sales volume which was largely offset by a 9.1% increase
in average pulp sales price.
31
Net sales
for our other segment increased 20.7% to $45.4 million in 2008 from $37.6
million in 2007. This increase reflects an 11.4% increase
in average sales price combined with an 8.4% increase in sales volume compared
to 2007.
Cost of
sales. Cost of sales, including depreciation, amortization,
and depletion, was $1,597.7 million in 2008 compared to $1,526.2 million in
2007, an increase of 4.7% which was primarily driven by higher input
costs. Our gross margin, excluding depreciation, amortization, and
depletion, was 17.2% for 2008 compared to 13.9% for 2007, reflecting the higher
average sales price in 2008. Depreciation, amortization, and
depletion expenses were $134.5 million in 2008 compared to $123.2 million in
2007.
Selling, general, and administrative
expenses. Selling, general, and administrative expenses were
$79.7 million in 2008 compared to $53.2 million in 2007. Included in
selling, general, and administrative expenses for 2008 is a one-time charge of
$10.8 million due to the accelerated vesting of the Legacy Class C Units of
Verso Paper Management LP in connection with our IPO.
Interest
expense. Interest expense was $125.6 million in 2008, compared
to $143.0 million in 2007. Included in 2008 interest expense is $5.0
million from a prepayment penalty and the write-off of debt issuance costs
resulting from the partial repayment of our senior unsecured term loan with a
portion of the IPO proceeds. The decrease in interest expense in 2008
was due to the reduction in aggregate indebtedness and lower interest rates on
floating rate debt compared to 2007. Interest expense for 2008
includes $117.1 million of cash interest expense on our outstanding indebtedness
and $8.5 million of non-cash interest expense, including amortization of
deferred debt issuance costs.
Restructuring and other
charges. Restructuring and other charges were $27.4 million in
2008 compared to $19.4 million in 2007. Restructuring and other
charges are comprised of transition and other costs associated with the
Acquisition; including costs of a transition service agreement with
International Paper, technology migration costs, consulting and legal fees, and
other one-time costs related to becoming a stand-alone
business. Subsequent to the Acquisition, we entered into a management
agreement with Apollo relating to the provision of certain financial and
strategic advisory services and consulting services. Upon
consummation of the IPO, Apollo terminated the annual fee arrangement under the
management agreement for a one-time payment of $23.1 million, which is included
in the charges for 2008. The charges in 2007 included $5.6 million of
transition service agreement costs and $2.8 million of charges under the
management agreement. As of September 30, 2007, we substantially
discontinued the use of services under the transition service
agreement.
Seasonality
We are
exposed to fluctuations in quarterly net sales volumes and expenses due to
seasonal factors. These seasonal factors are common in the coated
paper industry. Typically, the first two quarters are our slowest
quarters due to lower demand for coated paper during this period. Our
third quarter is generally our strongest quarter, reflecting an increase in
printing related to end-of-year magazines, increased end-of-year direct
mailings, and holiday season catalogs. Our working capital and
accounts receivable generally peak in the third quarter, while inventory
generally peaks in the second quarter in anticipation of the third quarter
season. We expect our seasonality trends to continue for the
foreseeable future.
Liquidity
and Capital Resources
We rely
primarily upon cash flow from operations and borrowings under our revolving
credit facility to finance operations, capital expenditures and fluctuations in
debt service requirements. We believe that our ability to manage cash
flow and working capital levels, particularly inventory and accounts payable,
will allow us to meet our current and future obligations, pay scheduled
principal and interest payments, and provide funds for working capital, capital
expenditures and other needs of the business for at least the next twelve
months. However, given the uncertainty of the current economic
environment, no assurance can be given that we will be able to generate
sufficient cash flows from operations or that future borrowings will be
available under our revolving credit facility in an amount sufficient to fund
our liquidity needs. As of December 31, 2009, $152.1 million was
available for future borrowing under our revolving credit
facility. As we focus on managing our expenses and cash flows, we
continue to assess and implement, as appropriate, various earnings and expense
reduction initiatives. Management has developed a company-wide cost reduction
program which produced approximately $62 million of savings during 2009 and is
expected to yield an additional $50 million in cost reductions. We
may also dispose of certain of our non-core assets in order to obtain additional
liquidity.
32
Net cash flows from operating
activities. Net
cash provided by operating activities increased to $177.2 million in 2009
compared to $54.1 million in 2008 and $15.0 million in 2007. The
increase from 2008 to 2009 was primarily due to improved results with $104.2
million net income in 2009compared to $62.8 million net losses in
2008. Net income in 2009 includes $238.9 million in net benefits from
alternative fuel mixture tax credits provided by the U.S. government for our use
of black liquor in alternative fuel mixtures and $64.8 million in non-cash gains
on the early retirement of debt. The tax credit, as it relates to
liquid fuels derived from biomass, expired on December 31,
2009. Therefore, we will not recognize any proceeds from this tax
credit in future periods. Partially offsetting this net positive
impact on cash flows was the negative effect of changes in working capital in
2009, which included declines in accrued liabilities and accounts payable,
primarily due to lower input costs, and an increase in accounts receivable,
reflecting the recent improvement in sales and the $10 million accrual of
alternative fuel mixture tax credits earned, while inventory balances
decreased. The increase in net cash provided by operating activities
in 2008 as compared to 2007 was primarily due to improved performance, with a
net loss of $62.8 million in 2008 compared to a net loss of $111.5 million in
2007.
Net cash flows from investing
activities. In 2009, 2008, and 2007, we used $34.1 million,
$81.3 million, and $69.1 million, respectively, of net cash in investing
activities primarily for investments in capital
expenditures. Management significantly reduced annual capital
expenditures in 2009 in response to the uncertain economic
environment. The majority of these capital expenditures were realized
during the first half of the year while the mills were experiencing significant
market downtime.
Net cash flows from financing
activities. In 2009 we used net cash of $110.5 million on financing
activities, reflecting principal payments and debt repurchases of $306.8 million
on long-term debt and $92.1 million in net payments on our revolving credit
facility, partially offset by $288.6 million in proceeds from the issuance of
$325.0 million in senior secured notes net of discount, underwriting fees, and
issuance costs. This compares to $88.2 million of net cash provided
by financing activities in 2008, which reflected principal payments of $154.0
million on outstanding borrowings and dividends paid of $3.1 million offset by
net proceeds of $153.2 million from the issuance of common stock and $92.1
million in borrowings under revolving credit facilities. In 2007 cash
flows from financing activities provided $0.2 million of net cash as the $242
million in net proceeds from the issuance of the senior unsecured term loan were
distributed to our equity holders, scheduled principal payments of $2.8 million
were made on the senior secured term loan, and borrowings under revolving credit
facilities increased by $3.1 million.
Indebtedness. As of
December 31, 2009, our aggregate indebtedness was $1,192.4 million, net of $24.0
million of unamortized discounts.
On
December 31, 2009, Verso Paper Holdings LLC, or “Verso Holdings,” had a credit
facility and outstanding debt securities consisting of:
|
·
|
$200
million revolving credit facility maturing in 2012, under which no amounts
were outstanding, $32.1 million in letters of credit were issued, and
$152.1 million was available for future borrowing. Our
availability under our revolving credit facility has been reduced by $15.8
million as a result of the bankruptcy filing of Lehman Commercial Paper,
Inc., “Lehman.” As a result of Lehman’s inability to fulfill
its obligation under the revolving credit facility, we do not expect that
Lehman will fund its pro rata share of any future borrowing
requests.
|
33
|
·
|
$325
million aggregate principal amount of 11½% senior secured fixed rate notes
due 2014;
|
|
·
|
$337
million aggregate principal amount of 9⅛% second priority senior secured
fixed rate notes due 2014;
|
|
·
|
$180
million aggregate principal amount of second priority senior secured
floating rate notes due 2014; and
|
|
·
|
$300
million aggregate principal amount of 11⅜% senior subordinated fixed rate
notes due 2016.
|
The
revolving credit facility bears interest at a rate equal to LIBOR plus 3.00%
and/or Prime plus 2.00%. Verso Holdings is required to pay a
commitment fee to the lenders under the revolving credit facility in respect of
unutilized commitments at a rate equal to 0.50% per annum and customary letter
of credit and agency fees. The revolving credit facility is secured
by first priority security interests in, and mortgages on, substantially all
tangible and intangible assets of Verso Holdings and each of its direct and
indirect subsidiaries. It is also secured by first priority pledges
of all the equity interests owned by Verso Holdings in its
subsidiaries. The obligations under the revolving credit facility are
unconditionally guaranteed by Verso Paper Finance Holdings LLC, or “Verso
Finance,” and, subject to certain exceptions, each of its direct and indirect
subsidiaries. On June 3, 2009, the credit agreement was amended and
restated to provide for the issuance of the senior secured notes due July 1,
2014 (see below). The amendment also, among other things, increased
the applicable margin for the interest rate on borrowings under the revolving
credit facility to 3.0% for Eurodollar loans and 2.0% for base rate loans and
eliminated the requirement to maintain a net first-lien secured debt to Adjusted
EBITDA ratio, providing us with additional business flexibility. The
revolving credit facility is secured on a ratable and pari passu basis with the
senior secured notes due 2014.
On
June 11, 2009, Verso Holdings issued $325.0 million aggregate principal
amount of 11.5% senior secured notes due July 1, 2014. These
fixed-rate notes pay interest semi-annually. The notes are secured by
substantially all of the property and assets of Verso Holdings and each of its
direct and indirect subsidiaries. The notes are secured on a ratable
and pari passu basis
with the revolving credit facility. The net proceeds, after
deducting the discount, underwriting fees, and issuance costs, were $288.6
million, which funds were used to repay in full $252.9 million outstanding on
Verso Holdings’ first priority term loan and to temporarily reduce the debt
outstanding under the revolving credit facility by $35.0 million. The
write-off of unamortized debt issuance costs related to the term loan resulted
in a loss of $5.9 million. On January 12, 2010, Verso Holdings issued
an additional $25.0 million aggregate principal amount of the 11.5% senior
secured notes under the existing indenture. These notes will be
treated as a single series with and have the same terms as the notes issued
under the indenture in June 2009. The net proceeds including premium,
after deducting underwriting fees and before deducting offering expenses, were
$27.0 million. We intend to use the net proceeds for capital
expenditures and other general corporate purposes.
During
2009, we repurchased and retired $12.9 million of Verso Holdings’ second
priority senior secured fixed-rate notes due on August 1, 2014, for a total
purchase price of $7.9 million, which resulted in gains of $4.7 million, net of
the write-off of unamortized debt issuance costs. During 2009, we
also repurchased and retired $69.8 million of Verso Holdings’ second priority
senior secured floating-rate notes due on August 1, 2014, for a total purchase
price of $35.1 million, which resulted in gains of $33.0 million, net of the
write-off of unamortized debt issuance costs. In addition, we
de-designated the interest rate swap hedging interest payments on these notes
and recognized losses of $0.3 million on the interest rate swap. The second
priority senior secured fixed rate notes have a fixed interest rate of 9.125%
and pay interest semiannually. The second priority senior secured
floating rate notes bear interest at a rate equal to LIBOR plus 3.75% and pay
interest quarterly. At December 31, 2009, the interest rate was
4.03%. The original principal amount of the senior subordinated notes
was outstanding at December 31, 2009. These senior subordinated notes
have a fixed interest rate of 11.375% and pay interest
semi-annually. The second priority senior secured fixed rate and
floating rate notes have the benefit of a second priority security interest in
the collateral securing our senior secured credit facility, while the
subordinated notes are unsecured.
34
Additionally,
Verso Finance has $74.1 million aggregate principal amount outstanding on its
senior unsecured floating-rate term loan which matures in 2013. In
May 2008, a portion of the net proceeds from our IPO were used to repay $138
million of the outstanding principal of the term loan and to pay a related
$1.4 million prepayment penalty. During 2009, we repurchased
$46.8 million of the term loan for a total purchase price of $12.4 million,
which resulted in gains of $33.5 million, net of the write-off of unamortized
debt issuance costs. The term loan bears interest at a rate equal to
LIBOR plus 6.25% on interest payments made in cash and LIBOR plus 7.00% for
interest paid in-kind, or “PIK,” and added to the principal
balance. The weighted-average interest rate in effect on December 31,
2009, was 6.59%. The term loan allows Verso Finance to pay interest
either in cash or in-kind through the accumulation of the outstanding principal
amount. Verso Finance has elected to exercise the PIK option for $8.9
million of interest payments due in 2009.
In
addition, as a holding company, our investments in our operating subsidiaries,
including Verso Paper LLC, constitute substantially all of our operating assets.
Consequently, our subsidiaries conduct all of our consolidated operations and
own substantially all of our operating assets. Our principal source of the cash
we need to pay our debts is the cash that our subsidiaries generate from their
operations and their borrowings. Our subsidiaries are not obligated to make
funds available to us. The terms of the senior secured credit facilities and the
indentures governing the outstanding notes of our subsidiaries significantly
restrict our subsidiaries from paying dividends and otherwise transferring
assets to us. Furthermore, our subsidiaries will be permitted under the terms of
the senior secured credit facilities and the indentures to incur additional
indebtedness that may severely restrict or prohibit the making of distributions,
the payment of dividends or the making of loans by such subsidiaries to
us. Although the terms of the debt agreements of our subsidiaries do
not restrict our operating subsidiaries from obtaining funds from their
respective subsidiaries to fund their operations and payments on indebtedness,
there can be no assurance that the agreements governing the current and future
indebtedness of our subsidiaries will permit our subsidiaries to provide us with
sufficient dividends, distributions or loans to fund our obligations or pay
dividends to our stockholders.
We may
elect to retire our outstanding debt in open market purchases, privately
negotiated transactions, or otherwise. These repurchases may be
funded through available cash from operations and borrowings from our credit
facilities. Such repurchases are dependent on prevailing market
conditions, our liquidity requirements, contractual restrictions, and other
factors.
Covenant
Compliance
The
credit agreement and the indentures governing our notes contain affirmative
covenants as well as restrictive covenants which limit our ability to, among
other things, incur additional indebtedness; pay dividends or make other
distributions; repurchase or redeem our stock; make investments; sell assets,
including capital stock of restricted subsidiaries; enter into agreements
restricting our subsidiaries’ ability to pay dividends; consolidate, merge, sell
or otherwise dispose of all or substantially all of our assets; enter into
transactions with our affiliates; and incur liens. These covenants
can result in limiting our long-term growth prospects by hindering our ability
to incur future indebtedness or grow through acquisitions. At
December 31, 2009, we were in compliance with the covenants in our debt
agreements.
Effect
of Inflation
While
inflationary increases in certain input costs, such as for energy, wood fiber,
and chemicals, have an impact on our operating results, changes in general
inflation have had minimal impact on our operating results in the last three
years. Sales prices and volumes are more strongly influenced by
supply and demand factors in specific markets and by exchange rate fluctuations
than by inflationary factors. We cannot assure you, however, that we
will not be affected by general inflation in the future.
35
Contractual
Obligations
The
following table reflects our contractual obligations and commercial commitments
as of December 31, 2009. Commercial commitments include lines of credit,
guarantees and other potential cash outflows resulting from a contingent event
that requires our performance pursuant to a funding commitment.
| Payments due by period | ||||||||||||||||||||
|
Less than
|
More than
|
|||||||||||||||||||
|
Total
|
1 year
|
1-3 years
|
3-5 years
|
5 years
|
||||||||||||||||
|
Long-term debt
(1)
|
$ | 1,804.2 | $ | 116.5 | $ | 232.2 | $ | 1,101.5 | $ | 354.0 | ||||||||||
|
Operating
leases
|
16.2 | 5.2 | 6.3 | 2.2 | 2.5 | |||||||||||||||
|
Purchase obligations
(2)
|
747.1 | 130.5 | 175.1 | 174.2 | 267.3 | |||||||||||||||
|
Other long-term liabilities
(3)
|
34.4 | 1.7 | 0.8 | 4.1 | 27.8 | |||||||||||||||
|
Total
|
$ | 2,601.9 | $ | 253.9 | $ | 414.4 | $ | 1,282.0 | $ | 651.6 | ||||||||||
|
(1)
|
Long-term debt includes principal
payments, commitment fees, and interest payable. A portion of interest
expense is at a variable rate and has been calculated using current LIBOR.
Actual payments could
vary.
|
|
(2)
|
Purchase obligations include
unconditional purchase obligations for power purchase agreements (gas and
electricity), machine clothing, and other commitments for advertising, raw
materials, or storeroom
inventory.
|
|
(3)
|
Other long-termliabilities reflected above
represent the gross amount of asset retirement
obligations.
|
We are
exposed to market risk from fluctuations in our paper prices, interest rates,
energy prices, and commodity prices for our inputs.
Paper Prices
Our sales, which we report net of
rebates, allowances, and discounts, are a function of the
number of tons of paper that we sell and the price at which we sell our
paper. The coated paper industry is cyclical,
which results in changes in both volume and price. Paper prices historically have been a
function of macro-economic factors, which influence supply and
demand. Price has historically been
substantially more variable than volume and can change significantly over
relatively short time periods.
We are primarily focused on serving two
end-user segments: catalogs and magazines. Coated paper demand is primarily driven
by advertising and print media usage. Advertising spending and magazine and
catalog circulation tend to correlate with GDP in the United States - they rise with a strong economy and contract with a weak
economy.
The majority of our products are sold
under contracts with our
customers; however,
coated freesheet paper is
sold without a contract
more often then coated
groundwood paper. Our contracts generally specify the
volumes to be sold to the customer over the contract term, as well as the
pricing parameters for those sales. Most of our
contracts are negotiated on an annual basis, with only a few having terms
extending beyond one year. Typically, our contracts provide for
quarterly price adjustments based on market price movements. The large portion of contracted sales
allows us to plan our production runs well in advance, optimizing production
over our integrated mill system and thereby reducing costs and increasing
overall efficiency.
We reach our end-users through several
channels, including printers, brokers, paper merchants, and direct sales to
end-users. We sell and market our products to
approximately 100
customers. In 2009, International Paper and its divisions and
subsidiaries (including xpedx and Central Lewmar LLC) accounted for approximately 10% of our
total net sales.
36
Interest Rates
We issued fixed- and floating-rate debt
to finance the Acquisition in order to manage our variability to cash flows from
interest rates. Borrowings under our revolving
credit facility and our floating rate notes accrue interest at variable rates,
but there were no amounts
outstanding under our revolving credit facility at December 31,
2009. A 100
basis point increase in quoted interest rates on our debt balances outstanding
as of December 31,
2009, under our
floating-rate notes would increase our annual interest expense by $2.5
million. While
we may enter into agreements limiting our exposure to higher interest rates, any
such agreements may not offer complete protection from this
risk.
Derivatives
In the normal course of business, we
utilize derivatives contracts as part of our risk management strategy to manage
our exposure to market fluctuations in energy prices and interest rates. These instruments are
subject to credit and market risks in excess of the amount recorded on the
balance sheet in accordance with generally accepted accounting
principles. Controls and monitoring procedures for
these instruments have been established and are routinely
reevaluated. We have an Energy Risk Management Policy which was adopted by our board of directors and is monitored by an Energy Risk Management
Committee composed of our senior
management. In
addition, we have an Interest Rate Risk Committee which was formed to monitor
our Interest Rate Risk Management Policy. Credit risk represents the potential
loss that may occur because a party to a transaction fails to perform according
to the terms of the contract. The measure of credit exposure is the
replacement cost of contracts with a positive fair value. We manage credit risk by entering into
financial instrument transactions only through approved
counterparties. Market risk represents the potential
loss due to the decrease in the value of a financial instrument caused primarily
by changes in commodity prices or interest
rates. We manage
market risk by establishing and monitoring limits on the types and degree of
risk that may be undertaken.
We do not hedge the entire exposure of
our operations from commodity price volatility for a variety of
reasons. To the extent that we do not hedge against commodity price
volatility, our results of operations may be affected either favorably or
unfavorably by a shift in the future price curve. As of December 31, 2009, we
had net unrealized losses of $1.6 million on open commodity contracts
with maturities of one to fifteen months. These derivative instruments involve the
exchange of net cash settlements, based on changes in the price of the
underlying commodity index compared to the fixed price offering, at specified
intervals without the exchange of any underlying principal. A 10% decrease in
commodity prices would have a negative impact of approximately $3.2 million on
the fair value of such instruments. This quantification of exposure
to market risk does not take into account the offsetting impact of changes in prices on anticipated
future energy purchases.
We entered into a $250 million notional
value receive-variable, pay-fixed interest rate swap in connection with
our outstanding floating rate notes that
mature in 2014. We are hedging the cash flow exposure on
our quarterly variable-rate interest
payments due to changes in the benchmark interest rate (three-month LIBOR). As of December 31,
2009, the fair value of this swap was an unrealized loss of $1.6
million. This
swap expired on February 1, 2010.
Commodity Prices
We are subject to changes in our cost of
sales caused by movements underlying commodity prices. The principal components of our cost of
sales are chemicals, wood, energy, labor, maintenance, and depreciation, amortization, and
depletion. Costs
for commodities, including chemicals, wood and energy, are the most variable
component of our cost of sales because their prices can fluctuate substantially,
sometimes within a relatively short period of time. In addition, our aggregate commodity
purchases fluctuate based on the volume of paper that we
produce.
37
Chemicals. Chemicals utilized in the manufacturing
of coated papers include latex, starch, calcium carbonate, and titanium dioxide. We purchase these chemicals from a
variety of suppliers and are not dependent on any single supplier to satisfy our
chemical needs. In the near term, we expect the rate of
inflation for our total chemical costs to be lower than that experienced over
the last two years. However, we expect imbalances in supply
and demand will drive higher prices for certain chemicals such as starch and
sodium chlorate.
Wood. Our costs to purchase wood are affected
directly by market costs of wood in our regional markets and indirectly by the
effect of higher fuel costs on logging and transportation of timber to our
facilities. While we have in place fiber supply
agreements that ensure a substantial portion of our wood requirements, purchases
under these agreements are typically at market rates. As we have begun to utilize wood
harvested from our 27,000-acre hybrid poplar woodlands located near Alexandria, Minnesota, our ongoing wood costs should be
positively impacted.
Energy. We produce a large portion of our energy
requirements, historically producing approximately 50%
of our energy needs for our coated paper mills
from sources such as waste wood and paper, hydroelectric facilities, chemicals from
our pulping process, our
own steam recovery boilers, and internal energy cogeneration
facilities. Our external energy purchases vary
across each of our mills and include fuel oil, natural gas, coal, and electricity. While our internal energy production
capacity mitigates the volatility of our overall energy expenditures, we expect
prices for energy to remain volatile for the foreseeable future and our energy costs to increase in a
high energy cost environment. As prices fluctuate, we have some
ability to switch between certain energy sources in order to minimize
costs. We
utilize derivatives contracts as part of our risk management strategy to
manage our exposure to market fluctuations in energy prices.
Off-Balance Sheet
Arrangements
None.
38
Verso
Paper Corp.
Consolidated
and Combined Financial Statements
For
the Years Ended December 31, 2009, 2008, and 2007
Index
to Financial Statements
|
Management’s
Report on Internal Control Over Financial Reporting
|
40 | |||
|
Reports
of Deloitte & Touche LLP, Independent Registered Public Accounting
Firm
|
41 | |||
|
Consolidated
and Combined Financial Statements
|
||||
|
Consolidated
Balance Sheets
|
43 | |||
|
Consolidated
and Combined Statements of Operations
|
44 | |||
|
Consolidated
and Combined Statements of Changes in Stockholders’ Equity
|
45 | |||
|
Consolidated
and Combined Statements of Cash Flows
|
46 | |||
|
Notes
to Consolidated and Combined Financial Statements of Verso Paper
Corp.
|
47 |
39
Our management is responsible for
establishing and maintaining adequate internal control over financial reporting,
as such term is defined in Rules 13a-15(f) and 15d-15(f) under the Securities
Exchange Act of 1934. Under the supervision and with the participation of our
management, including our Chief Executive Officer and Chief Financial Officer,
we conducted an evaluation of the effectiveness of our internal control over
financial reporting as of December 31, 2009, based upon the guidelines established
in Internal Control — Integrated Framework issued by the Committee of Sponsoring
Organizations of the Treadway Commission (COSO). Our internal control over
financial reporting includes policies and procedures that provide reasonable
assurance regarding the reliability of financial reporting and the preparation
of financial statements for external reporting purposes in accordance with
accounting principles generally accepted in the United States of America.
Based on the results of our evaluation,
our management concluded that our internal control over financial reporting was
effective as of December 31, 2009. We reviewed the results of management’s
assessment with our Audit Committee.
The effectiveness of our internal
control over financial reporting as of December 31, 2009, has been audited by Deloitte
& Touche LLP, an independent registered
public accounting firm, as stated in their attestation report which appears
below.
40
REPORT OF DELOITTE & TOUCHE LLP,
INDEPENDENT REGISTERED PUBLIC ACCOUNTING FIRM, ON CONSOLIDATED AND COMBINED
FINANCIAL STATEMENTS
To the Board of Directors and
Stockholders of Verso Paper Corp.:
We have audited the accompanying
consolidated balance sheets of Verso Paper Corp., (the “Company”), a
majority-owned subsidiary of Verso Paper Management LP, as of December 31, 2009
and 2008, and the related consolidated and combined statements of operations,
changes in stockholders’ equity, and cash flows for each of the three years in
the period ended December 31, 2009. These financial statements are the
responsibility of the Company’s management. Our responsibility is to
express an opinion on these financial statements based on our
audits.
We conducted our audits in accordance
with the standards of the Public Company Accounting Oversight Board
(United States). Those standards require that we plan
and perform the audit to obtain reasonable assurance about whether the financial
statements are free of material misstatement. An audit includes examining, on a
test basis, evidence supporting the amounts and disclosures in the financial
statements. An audit also includes assessing the accounting
principles used and significant estimates made by management, as well as
evaluating the overall financial statement presentation. We believe that our
audits provide a reasonable basis for our opinion.
In our opinion, such consolidated and
combined financial statements present fairly, in all material respects, the
financial position of the Company as of December 31, 2009 and 2008, and the
results of their operations and their cash flows for each of the three years in
the period ended December 31, 2009, in conformity with accounting principles
generally accepted in the United States of America.
We have also audited, in accordance with
the standards of the Public Company Accounting Oversight Board (United States),
the Company’s internal control over financial reporting as of December 31, 2009,
based on the criteria established in Internal Control ─ Integrated Framework
issued by the Committee of Sponsoring Organizations of the Treadway Commission
and our report dated March 2, 2010 expressed an unqualified opinion on the
Company’s internal control over financial reporting.
/s/ Deloitte & Touche
LLP
Memphis, Tennessee
March 2, 2010
41
REPORT OF DELOITTE & TOUCHE LLP,
INDEPENDENT REGISTERED PUBLIC ACCOUNTING FIRM, ON INTERNAL CONTROL OVER
FINANCIAL REPORTING
To the Board of Directors and
Stockholders of Verso Paper Corp.:
We have audited the internal control
over financial reporting of Verso Paper Corp. (the "Company"), a majority-owned
subsidiary of Verso Paper Management LP, as of December 31, 2009, based on
criteria established in Internal Control — Integrated Framework issued by the
Committee of Sponsoring Organizations of the Treadway Commission. The
Company's management is responsible for maintaining effective internal control
over financial reporting and for its assessment of the effectiveness of internal
control over financial reporting, included in the accompanying Report of
Management on Internal Control Over Financial Reporting. Our
responsibility is to express an opinion on the Company's internal control over
financial reporting based on our audit.
We conducted our audit in accordance
with the standards of the Public Company Accounting Oversight Board
(United States). Those standards require that we
plan and perform the audit to obtain reasonable assurance about whether
effective internal control over financial reporting was maintained in all
material respects. Our audit included obtaining an understanding of
internal control over financial reporting, assessing the risk that a material
weakness exists, testing and evaluating the design and operating effectiveness
of internal control based on the assessed risk, and performing such other
procedures as we considered necessary in the circumstances. We believe
that our audit provides a reasonable basis for our opinion.
A company's internal control over
financial reporting is a process designed by, or under the supervision of, the
company's principal executive and principal financial officers, or persons
performing similar functions, and effected by the company's board of directors,
management, and other personnel to provide reasonable assurance regarding the
reliability of financial reporting and the preparation of financial statements
for external purposes in accordance with generally accepted accounting
principles. A company's internal control over financial reporting includes
those policies and procedures that (1) pertain to the maintenance of records
that, in reasonable detail, accurately and fairly reflect the transactions and
dispositions of the assets of the company; (2) provide reasonable assurance that
transactions are recorded as necessary to permit preparation of financial
statements in accordance with generally accepted accounting principles, and that
receipts and expenditures of the company are being made only in accordance with
authorizations of management and directors of the company; and (3) provide
reasonable assurance regarding prevention or timely detection of unauthorized
acquisition, use, or disposition of the company's assets that could have a
material effect on the financial statements.
Because of the inherent limitations of
internal control over financial reporting, including the possibility of
collusion or improper management override of controls, material misstatements
due to error or fraud may not be prevented or detected on a timely basis.
Also, projections of any evaluation of the effectiveness of the internal control
over financial reporting to future periods are subject to the risk that the
controls may become inadequate because of changes in conditions, or that the
degree of compliance with the policies or procedures may
deteriorate.
In our opinion, the Company maintained,
in all material respects, effective internal control over financial reporting as
of December 31, 2009, based on the criteria established in Internal Control —
Integrated Framework issued by the Committee of Sponsoring Organizations of the
Treadway Commission.
We have also audited, in accordance with
the standards of the Public Company Accounting Oversight Board (United States), the consolidated financial statements
as of and for the year ended December 31, 2009 of the Company and our report
dated March 2, 2010 expressed an unqualified opinion on those financial
statements.
/s/ Deloitte & Touche
LLP
Memphis, Tennessee
March 2, 2010
42
VESO PAPER CORP.
CONSOLIDATED BALANCE SHEETS
|
December
31,
|
||||||||
|
(In thousands of U.S. dollars,
except share and per
share amounts)
|
2009
|
2008
|
||||||
|
ASSETS
|
||||||||
|
Current
Assets:
|
||||||||
|
Cash and cash
equivalents
|
$ | 152,097 | $ | 119,542 | ||||
|
Accounts
receivable - net
|
104,263 | 82,484 | ||||||
|
Inventories
|
162,401 | 195,934 | ||||||
|
Prepaid expenses
and other assets
|
11,292 | 2,512 | ||||||
|
Total Current
Assets
|
430,053 | 400,472 | ||||||
|
Property, plant, and equipment -
net
|
1,022,622 | 1,115,990 | ||||||
|
Reforestation
|
13,357 | 12,725 | ||||||
|
Intangibles and other assets -
net
|
88,006 | 88,513 | ||||||
|
Goodwill
|
18,695 | 18,695 | ||||||
|
Total
Assets
|
$ | 1,572,733 | $ | 1,636,395 | ||||
|
LIABILITIES AND STOCKHOLDERS'
EQUITY
|
||||||||
|
Current
Liabilities:
|
||||||||
|
Accounts
payable
|
$ | 103,253 | $ | 123,055 | ||||
|
Accrued
liabilities
|
116,225 | 125,565 | ||||||
|
Current
maturities of long-term debt
|
- | 2,850 | ||||||
|
Total Current
Liabilities
|
219,478 | 251,470 | ||||||
|
Long-term
debt
|
1,192,352 | 1,354,821 | ||||||
|
Other
liabilities
|
35,612 | 40,151 | ||||||
|
Total
Liabilities
|
1,447,442 | 1,646,442 | ||||||
|
Commitments and contingencies
(Note 18)
|
- | - | ||||||
|
Stockholders' Equity
(Deficit):
|
||||||||
|
Preferred stock -- par value $0.01 (20,000,000
shares authorized, no shares issued)
|
- | - | ||||||
|
Common stock -- par value $0.01
(250,000,000 shares authorized with 52,374,647
|
||||||||
|
shares issued and outstanding on
December 31, 2009, and 52,046,647 shares
|
||||||||
|
issued and
outstanding on December 31, 2008)
|
524 | 520 | ||||||
|
Paid-in-capital
|
212,381 | 211,752 | ||||||
|
Retained
deficit
|
(74,045 | ) | (180,048 | ) | ||||
|
Accumulated other
comprehensive loss
|
(13,569 | ) | (42,271 | ) | ||||
|
Total
Stockholders' Equity (Deficit)
|
125,291 | (10,047 | ) | |||||
|
Total Liabilities
and Stockholders' Equity
|
$ | 1,572,733 | $ | 1,636,395 | ||||
|
Included in the balance sheet line
items above are related-party balances as follows:
|
||||||||
|
Accounts
receivable
|
$ | 7,785 | $ | 8,312 | ||||
|
Accounts
payable
|
498 | 4,135 | ||||||
See notes to consolidated and combined financial statements.
43
VESO PAPER CORP.
CONSOLIDATED AND COMBINED STATEMENTS OF
OPERATIONS
|
Year Ended December
31,
|
||||||||||||
|
(In thousands of U.S. dollars,
except per share data)
|
2009
|
|
2008
|
2007
|
||||||||
|
Net sales
|
$ | 1,360,854 | $ | 1,766,813 | $ | 1,628,753 | ||||||
|
Costs and
expenses:
|
||||||||||||
|
Cost of
products sold -
(exclusive of
|
||||||||||||
|
depreciation,
amortization, and depletion)
|
1,242,743 | 1,463,169 | 1,403,013 | |||||||||
|
Depreciation,
amortization, and depletion
|
132,682 | 134,458 | 123,217 | |||||||||
|
Selling, general,
and administrative expenses
|
61,889 | 79,744 | 53,159 | |||||||||
|
Restructuring and
other charges
|
979 | 27,416 | 19,395 | |||||||||
|
Operating income
(loss)
|
(77,439 | ) | 62,026 | 29,969 | ||||||||
|
Interest
income
|
(246 | ) | (770 | ) | (1,544 | ) | ||||||
|
Interest
expense
|
123,365 | 125,622 | 142,976 | |||||||||
|
Other income,
net
|
(307,307 | ) | - | - | ||||||||
|
Income (loss)
before income taxes
|
106,749 | (62,826 | ) | (111,463 | ) | |||||||
|
Income tax
expense
|
746 | - | - | |||||||||
|
Net income
(loss)
|
$ | 106,003 | $ | (62,826 | ) | $ | (111,463 | ) | ||||
|
Earnings (loss)
per common share
|
||||||||||||
|
Basic
|
$ | 2.03 | $ | (1.35 | ) | $ | (2.93 | ) | ||||
|
Diluted
|
$ | 2.03 | $ | (1.35 | ) | $ | (2.93 | ) | ||||
|
Weighted average
common shares outstanding
|
||||||||||||
|
Basic
|
52,138,307 | 46,691,456 | 38,046,647 | |||||||||
|
Diluted
|
52,153,448 | 46,691,456 | 38,046,647 | |||||||||
|
Included in the financial
statement line items above are
|
||||||||||||
|
related-party
transactions as follows (Notes 15 and 16):
|
||||||||||||
|
Net sales
|
$ | 138,760 | $ | 165,799 | $ | 191,358 | ||||||
|
Purchases included in cost of
products sold
|
4,625 | 7,159 | 11,722 | |||||||||
|
Restructuring and other
charges
|
- | 23,281 | 8,399 | |||||||||
See notes to consolidated and
combined financial statements.
44
VESO PAPER CORP.
CONSOLIDATED AND COMBINED STATEMENTS OF CHANGES IN
STOCKHOLDERS’
EQUITY
FOR THE YEARS ENDED DECEMBER 31,
2009, 2008 AND 2007
|
Accumulated
|
||||||||||||||||||||||||
|
Other
|
||||||||||||||||||||||||
|
Common
|
Common
|
Paid-in-
|
Retained
|
Comprehensive
|
Total
|
|||||||||||||||||||
|
(In
thousands)
|
Shares
|
Stock
|
Capital
|
Deficit
|
Income (Loss)
|
Equity
|
||||||||||||||||||
|
Balance - December 31,
2006
|
38,046 | $ | 380 | $ | 290,017 | $ | (2,637 | ) | $ | (7,741 | ) | $ | 280,019 | |||||||||||
|
Net loss
|
- | - | - | (111,463 | ) | - | (111,463 | ) | ||||||||||||||||
|
Other comprehensive income
(loss):
|
||||||||||||||||||||||||
|
Net unrealized
losses on derivatives
|
- | (2,095 | ) | (2,095 | ) | |||||||||||||||||||
|
Defined
benefit pension
plan:
|
||||||||||||||||||||||||
|
Pension liability
adjustment
|
- | - | - | - | (819 | ) | (819 | ) | ||||||||||||||||
|
Prior service
cost amortization
|
- | - | - | - | 785 | 785 | ||||||||||||||||||
|
Total other
comprehensive loss
|
- | - | - | - | (2,129 | ) | (2,129 | ) | ||||||||||||||||
|
Comprehensive
loss
|
- | - | - | (111,463 | ) | (2,129 | ) | (113,592 | ) | |||||||||||||||
|
Cash
distributions
|
- | - | (242,153 | ) | - | - | (242,153 | ) | ||||||||||||||||
|
Equity award
expense
|
- | - | 625 | - | - | 625 | ||||||||||||||||||
|
Balance - December 31,
2007
|
38,046 | 380 | 48,489 | (114,100 | ) | (9,870 | ) | (75,101 | ) | |||||||||||||||
|
Net loss
|
- | - | - | (62,826 | ) | - | (62,826 | ) | ||||||||||||||||
|
Other comprehensive
loss:
|
||||||||||||||||||||||||
|
Net unrealized
losses on derivatives net of $1.9
|
||||||||||||||||||||||||
|
million of net gains reclassified
into net loss
|
- | - | - | - | (27,571 | ) | (27,571 | ) | ||||||||||||||||
|
Defined
benefit pension
plan:
|
||||||||||||||||||||||||
|
Pension liability
adjustment
|
- | - | - | - | (5,701 | ) | (5,701 | ) | ||||||||||||||||
|
Prior service
cost amortization
|
- | - | - | - | 871 | 871 | ||||||||||||||||||
|
Total other
comprehensive loss
|
- | - | - | - | (32,401 | ) | (32,401 | ) | ||||||||||||||||
|
Comprehensive
loss
|
- | - | - | (62,826 | ) | (32,401 | ) | (95,227 | ) | |||||||||||||||
|
Issuance of common stock, net
of
|
||||||||||||||||||||||||
|
issuance cost of
$15.8 million
|
14,000 | 140 | 152,064 | - | - | 152,204 | ||||||||||||||||||
|
Dividends paid
($.06/share)
|
- | - | - | (3,122 | ) | - | (3,122 | ) | ||||||||||||||||
|
Equity award
expense
|
- | - | 11,199 | - | - | 11,199 | ||||||||||||||||||
|
Balance - December 31,
2008
|
52,046 | 520 | 211,752 | (180,048 | ) | (42,271 | ) | (10,047 | ) | |||||||||||||||
|
Net income
|
- | - | - | 106,003 | - | 106,003 | ||||||||||||||||||
|
Other comprehensive
income:
|
||||||||||||||||||||||||
|
Net unrealized
losses on derivatives net of $40.2
|
||||||||||||||||||||||||
|
million of net losses reclassified into net
income
|
- | - | - | - | 27,773 | 27,773 | ||||||||||||||||||
|
Defined
benefit pension
plan:
|
||||||||||||||||||||||||
|
Pension liability
adjustment
|
- | - | - | - | (413 | ) | (413 | ) | ||||||||||||||||
|
Amortization of net loss and prior
service cost
|
- | - | - | - | 1,342 | 1,342 | ||||||||||||||||||
|
Total other
comprehensive income
|
- | - | - | - | 28,702 | 28,702 | ||||||||||||||||||
|
Comprehensive
income
|
- | - | - | 106,003 | 28,702 | 134,705 | ||||||||||||||||||
|
Common stock issued for restricted
stock
|
328 | 4 | (4 | ) | - | - | - | |||||||||||||||||
|
Equity award
expense
|
- | - | 633 | - | - | 633 | ||||||||||||||||||
|
Balance - December 31,
2009
|
52,374 | $ | 524 | $ | 212,381 | $ | (74,045 | ) | $ | (13,569 | ) | $ | 125,291 | |||||||||||
See notes to consolidated and combined
financial statements.
45
VESO PAPER CORP.
CONSOLIDATED AND COMBINED STATEMENTS OF CASH
FLOWS
|
Year Ended December
31,
|
||||||||||||
|
(In thousands of U.S.
dollars)
|
2009
|
2008
|
2007
|
|||||||||
|
Cash Flows From Operating
Activities:
|
||||||||||||
|
Net income
(loss)
|
$ | 106,003 | $ | (62,826 | ) | $ | (111,463 | ) | ||||
|
Adjustments to
reconcile net income (loss) to
|
||||||||||||
|
net cash provided
by operating activities:
|
||||||||||||
|
Depreciation,
amortization, and depletion
|
132,682 | 134,458 | 123,217 | |||||||||
|
Amortization of
debt issuance costs
|
5,748 | 9,924 | 6,721 | |||||||||
|
Accretion of
discount on long-term debt
|
2,081 | - | - | |||||||||
|
Gain on early
extinguishment of debt
|
(64,777 | ) | - | - | ||||||||
|
Loss on disposal
of fixed assets
|
533 | 722 | 942 | |||||||||
|
Equity award
expense
|
633 | 11,199 | 625 | |||||||||
|
Change in
unrealized losses on derivatives, net
|
27,378 | (27,571 | ) | (2,095 | ) | |||||||
|
Other -
net
|
533 | (6,238 | ) | (34 | ) | |||||||
|
Changes
in
assets and liabilities:
|
||||||||||||
|
Accounts
receivable
|
(21,725 | ) | 51,024 | (11,803 | ) | |||||||
|
Inventories
|
27,855 | (76,314 | ) | 20,171 | ||||||||
|
Prepaid expenses
and other assets
|
(18,270 | ) | (7,964 | ) | (8,226 | ) | ||||||
|
Accounts
payable
|
(17,357 | ) | (10,202 | ) | (14,194 | ) | ||||||
|
Accrued
liabilities
|
(4,161 | ) | 37,873 | 11,118 | ||||||||
|
Net cash provided by operating
activities
|
177,156 | 54,085 | 14,979 | |||||||||
|
Cash Flows From Investing
Activities:
|
||||||||||||
|
Proceeds from
sale of fixed assets
|
83 | 108 | 1,789 | |||||||||
|
Capital
expenditures
|
(34,216 | ) | (81,386 | ) | (70,864 | ) | ||||||
|
Net cash used in investing
activities
|
(34,133 | ) | (81,278 | ) | (69,075 | ) | ||||||
|
Cash Flows From Financing
Activities:
|
||||||||||||
|
Proceeds from
sale of common stock, net
|
||||||||||||
|
of issuance cost
of $14.8 million
|
- | 153,216 | - | |||||||||
|
Dividends
paid
|
- | (3,122 | ) | - | ||||||||
|
Proceeds from
long-term debt
|
352,838 | 92,083 | 250,000 | |||||||||
|
Repayments of
long-term debt
|
(453,036 | ) | (150,850 | ) | (2,850 | ) | ||||||
|
Short-term
borrowings (repayments)
|
- | (3,125 | ) | 3,125 | ||||||||
|
Debt issuance
costs
|
(10,270 | ) | - | (7,972 | ) | |||||||
|
Cash
distributions
|
- | - | (242,153 | ) | ||||||||
|
Net cash provided by (used in)
financing activities
|
(110,468 | ) | 88,202 | 150 | ||||||||
|
Change in cash and cash
equivalents
|
32,555 | 61,009 | (53,946 | ) | ||||||||
|
Cash and cash equivalents at
beginning of period
|
119,542 | 58,533 | 112,479 | |||||||||
|
Cash and cash equivalents at end
of period
|
$ | 152,097 | $ | 119,542 | $ | 58,533 | ||||||
|
Total interest
paid
|
$ | 90,713 | $ | 120,656 | $ | 132,206 | ||||||
|
Total income taxes
paid
|
1,759 | - | - | |||||||||
See notes to consolidated and combined
financial statements.
46
VERSO
PAPER CORP.
1. SUMMARY
OF BUSINESS AND SIGNIFICANT ACCOUNTING POLICIES
Nature of
Business — The accompanying financial statements include the accounts of
Verso Paper Corp., a Delaware corporation, and its
subsidiaries. Unless otherwise noted, the terms “Verso,” “Verso
Paper,” “Company,” “we,” “us,” and “our” refer collectively to Verso Paper Corp.
and its subsidiaries.
The
Company began operations on August 1, 2006, when it acquired the assets and
certain liabilities comprising the business of the Coated and Supercalendered
Papers Division of International Paper Company, or “International
Paper.” The Company was formed by affiliates of Apollo Management,
L.P., or “Apollo,” for the purpose of consummating the acquisition from
International Paper, or the “Acquisition.” Verso Paper Corp. went
public on May 14, 2008 with an initial public offering, or “IPO," of
14 million shares of common stock which generated $152.2 million in net
proceeds. Prior to the consummation of the IPO, the accompanying
financial statements include the accounts of Verso Paper One Corp., Verso Paper
Two Corp., Verso Paper Three Corp., Verso Paper Four Corp., and Verso Paper Five
Corp., legal entities under the common control of Verso Paper Management
LP.
Verso
Paper Corp. is the indirect parent of Verso Paper Finance Holdings LLC, or
“Verso Finance,” and Verso Paper Holdings LLC, or “Verso Holdings,” and is a
direct subsidiary of Verso Paper Management LP. Verso Paper Corp. is
a holding company whose subsidiaries operate in the following three segments:
coated and supercalendered papers; hardwood market pulp; and other, consisting
of specialty papers. The Company’s core business platform is as a
producer of coated freesheet, coated groundwood, and uncoated supercalendered
papers. These products serve customers in the catalog, magazine,
inserts, and commercial print markets.
Basis of
Presentation — Included in this report are the financial statements of
the Company as of December 31, 2009 and 2008, and for the years ended December
31, 2009, 2008, and 2007. All material intercompany balances and
transactions are eliminated.
Use of Estimates — The preparation of financial statements in conformity with accounting principles generally accepted in the United States of America requires management to make estimates and assumptions that affect the reported amounts of assets and liabilities, disclosure of contingent assets and liabilities at the date of the financial statements, and the reported amounts of revenues and expenses during the reporting periods. Actual results could differ from these estimates.
Revenue
Recognition — Sales are net of rebates, allowances, and
discounts. Revenue is recognized when the customer takes title and
assumes the risks and rewards of ownership. Revenue is recorded at
the time of shipment for terms designated f.o.b. (free on board) shipping
point. For sales transactions designated f.o.b. destination, which
include export sales, revenue is recorded when the product is delivered to the
customer’s site and when title and risk of loss are transferred.
Shipping and
Handling Costs — Shipping and handling costs, such as freight to customer
destinations, are included in cost of products sold in the accompanying
statements of operations. These costs, when included in the sales
price charged for the Company’s products, are recognized in net
sales.
47
Planned
Maintenance Costs — Maintenance costs for major planned maintenance
shutdowns in excess of $0.5 million are deferred over the period in which the
maintenance shutdowns occur and expensed ratably over the period until the next
major planned shutdown, since the Company believes that operations benefit
throughout that period from the maintenance work performed. Other
maintenance costs are expensed as incurred.
Environmental
Costs and Obligations — Costs associated with environmental obligations,
such as remediation or closure costs, are accrued when such costs are probable
and reasonably estimable. Such accruals are adjusted as further
information develops or circumstances change. Costs of future
expenditures for environmental obligations are discounted to their present value
when the expected cash flows are reliably determinable.
Equity
Compensation — The Company accounts for equity awards in accordance with
Financial Accounting Standards Board, or “FASB,” Accounting Standards
Codification, or “ASC,” 718, Compensation – Stock
Compensation. FASB ASC 718 requires employee equity awards to
be accounted for under the fair value method. Accordingly, share-based
compensation is measured at the grant date based on the fair value of the
award. The Company uses the straight-line attribution method to
recognize share-based compensation over the service period of the
award.
Income Taxes —
The Company accounts for income taxes using the liability method pursuant
to FASB ASC 740, Income
Taxes. Under this method, the Company recognizes deferred tax
assets and liabilities for the expected tax consequences of temporary
differences between the tax bases of assets and liabilities and their reported
amounts using enacted tax rates in effect for the year the differences are
expected to reverse. The Company records a valuation allowance to
reduce the deferred tax assets to the amount that is more likely than not to be
realized. The Company evaluates uncertain tax positions annually and
considers whether the amounts recorded for income taxes are adequate to address
the Company’s tax risk profile. The Company analyzes the potential tax
liabilities of specific transactions and tax positions based on management’s
judgment as to the expected outcome.
Earnings Per
Share — The Company computes earnings per share by dividing income
available to common stockholders by the weighted average number of common shares
outstanding for the period. Diluted earnings per share reflects the
potential dilution that could occur if securities or other contracts to issue
common stock were exercised. It is computed after giving
consideration to the weighted average dilutive effect of the Company’s stock
options.
Fair Value of
Financial Instruments — The carrying amounts for cash and cash
equivalents, restricted cash, accounts receivable, accounts payable and accrued
liabilities, and amounts receivable from or due to related parties approximates
fair value due to the short maturity of these instruments. The
Company determines the fair value of its long-term debt based on market
information and a review of prices and terms available for similar
obligations. See also Note 7, Note 13, and Note 14 for additional
information regarding the fair value of financial instruments.
Cash and Cash
Equivalents — Cash and cash equivalents include highly liquid investments
with a maturity of three months or less at the date of purchase.
Inventories and
Replacement Parts and Other Supplies — Inventory values include all costs
directly associated with manufacturing products: materials, labor, and
manufacturing overhead. These values are presented at the lower of
cost or market. Costs of raw materials, work-in-progress, and
finished goods are determined using the first-in, first-out
method. Replacement parts and other supplies are stated using the
average cost method and are reflected in inventory and intangibles and other
assets on the balance sheet (see also Note 3 and Note 5).
Property, Plant,
and Equipment — Property, plant, and equipment is stated at cost, net of
accumulated depreciation. Interest is capitalized on projects meeting certain
criteria and is included in the cost of the assets. The capitalized
interest is depreciated over the same useful lives as the related
assets. Expenditures for major repairs and improvements are
capitalized, whereas normal repairs and maintenance are expensed as
incurred. Interest cost of $0.4 million was capitalized in 2009 and
$1.4 million was capitalized 2008.
48
Depreciation
and amortization are computed using the straight-line method for all assets over
the assets’ estimated useful lives. Estimated useful lives are as
follows:
|
Years
|
|
|
Building
|
20 - 40
|
|
Machinery and
equipment
|
10 - 20
|
|
Furniture and office
equipment
|
3 - 10
|
|
Computer
hardware
|
3 - 6
|
|
Leasehold
improvements
|
Over the terms of the
lease
|
|
or the useful life of
the
|
|
|
improvements
|
Reforestation —
At December 31, 2009, the Company owned or leased approximately 27,000
acres of hybrid poplar plantations. Timberlands are stated at cost,
including capitalized costs attributable to reforestation efforts (i.e., costs for site
preparation, planting stock, labor, herbicide, fertilizer, and any other costs
required to establish timber on land that was previously not
forested). From August 1, 2006 (date of Acquisition) through December
31, 2009, the Company has been primarily engaged in developing its hybrid poplar
woodlands. Costs attributable to timberlands are charged against
income as trees are cut. The rate charged will be determined annually
based on the relationship of incurred costs to estimated current merchantable
volume.
Goodwill and
Intangible Assets — The Company accounts for goodwill and other
intangible assets in accordance with FASB ASC 350, Intangibles – Goodwill and
Other. Intangible assets primarily consist of trademarks,
customer-related intangible assets and patents obtained through business
acquisitions. The useful lives of trademarks were determined to be
indefinite and, therefore, these assets are not
amortized. Customer-related intangible assets are amortized over
their estimated useful lives of approximately twenty-five
years. Patents are amortized over their remaining legal lives of ten
years.
The
impairment evaluation of the carrying amount of goodwill and other intangible
assets with indefinite lives is conducted annually or more frequently if events
or changes in circumstances indicate that an asset might be
impaired. Goodwill is evaluated at the reporting unit
level. Goodwill has been allocated to the “Coated” segment.
The
evaluation for impairment is performed by comparing the carrying amount of these
assets to their estimated fair value. If the carrying amount exceeds
the reporting unit fair value, then the second step of the goodwill impairment
test is performed to determine the amount of the impairment loss.
Impairment of
Long-Lived Assets — Long-lived assets are reviewed for impairment upon
the occurrence of events or changes in circumstances that indicate that the
carrying value of the assets may not be recoverable, as measured by comparing
their net book value to the estimated undiscounted future cash flows generated
by their use. Impaired assets are recorded at estimated fair value,
determined principally using discounted cash flows.
Allowance for
Doubtful Accounts — The Company maintains an allowance for doubtful
accounts for estimated losses resulting from the inability of customers to make
required payments. The Company manages credit risk related to its
trade accounts receivable by continually monitoring the creditworthiness of its
customers to whom credit is granted in the normal course of
business. Trade accounts receivable balances for sales to
unaffiliated customers were approximately $74.5 million at December 31, 2009,
compared to $64.4 million at December 31, 2008.
49
The
Company establishes its allowance for doubtful accounts based upon factors
surrounding the credit risks of specific customers, historical trends, and other
information. Based on this assessment, an allowance is maintained
that represents what is believed to be ultimately uncollectible from such
customers. The allowance for doubtful accounts was approximately $1.0
million at December 31, 2009, compared to $1.9 million at December 31,
2008. Bad debt expense was $0.4 million for the year ended December
31, 2009, compared to $1.0 million for the year ended December 31, 2008, and was
negligible for the year ended December 31, 2007.
Deferred
Financing Costs — The Company capitalizes costs incurred in connection
with borrowings or establishment of credit facilities. These costs
are amortized as an adjustment to interest expense over the life of the
borrowing or life of the credit facility using the effective interest
method. In the case of early debt principal repayments, the Company
adjusts the value of the corresponding deferred financing costs with a charge to
interest expense, and similarly adjusts the future amortization
expense.
Asset Retirement
Obligations — In accordance with FASB ASC 410, Asset Retirement and Environmental
Obligations, a liability and an asset are recorded equal to the present
value of the estimated costs associated with the retirement of long-lived assets
where a legal or contractual obligation exists. The liability is
accreted over time, and the asset is depreciated over its useful
life. The Company’s asset retirement obligations under this standard
relate to closure and post-closure costs for landfills. Revisions to
the liability could occur due to changes in the estimated costs or timing of
closure or possible new federal or state regulations affecting the
closure.
On
December 31, 2009, the Company had $0.8 million of restricted cash included in
other assets in the accompanying consolidated balance sheet related to an asset
retirement obligation in the state of Michigan. This cash deposit is
required by the state and may only be used for the future closure of a
landfill. The following table presents an analysis related to the
Company’s asset retirement obligations included in Other liabilities in the
accompanying balance sheets:
|
Year
Ended December 31,
|
||||||||
|
(In thousands of U.S.
dollars)
|
2009
|
2008
|
||||||
|
Asset retirement obligations,
January 1
|
$ | 14,028 | $ | 11,614 | ||||
|
New liabilities
|
- | 1,091 | ||||||
|
Accretion
expense
|
779 | 599 | ||||||
|
Settlement of existing
liabilities
|
(1,348 | ) | (1,306 | ) | ||||
|
Adjustment to existing
liabilities
|
(159 | ) | 2,030 | |||||
|
Asset retirement obligations,
December 31
|
$ | 13,300 | $ | 14,028 | ||||
In
addition to the above obligations, the Company may be required to remove certain
materials from its facilities, or to remediate in accordance with current
regulations that govern the handling of certain hazardous or potentially
hazardous materials. At this time, any such obligations have an
indeterminate settlement date, and the Company believes that adequate
information does not exist to reasonably estimate any such potential
obligations. Accordingly, the Company will record a liability for
such remediation when sufficient information becomes available to estimate the
obligation.
Derivative
Financial Instruments — Derivative financial instruments are recognized
as assets or liabilities in the financial statements and measured at fair
value. The effective portion of the changes in the fair value of
derivative financial instruments that qualify and are designated as cash flow
hedges are recorded in other comprehensive income. Changes in the
fair value of derivative financial instruments that are entered into as economic
hedges are recognized in current earnings. The Company uses
derivative financial instruments to manage its exposure to energy prices and
interest rate risk.
50
Pension Benefits
— Pension plans cover substantially all of the Company’s
employees. The defined benefit plan is funded in conformity with the
funding requirements of applicable government regulations. Prior
service costs are amortized on a straight-line basis over the estimated
remaining service periods of employees. Certain employees are covered
by defined contribution plans. The Company’s contributions to these
plans are based on a percentage of employees’ compensation or employees’
contributions. These plans are funded on a current
basis.
Alternative Fuel
Tax Credit — Until December 31, 2009, the United States government
provided an excise tax credit to taxpayers for the use of alternative fuel
mixtures in their businesses equal to $0.50 per gallon of alternative fuel
contained in the mixture. In January and February 2009, the Internal
Revenue Service certified that the Company’s operations at its Androscoggin and
Quinnesec mills qualified for the alternative fuel mixture tax
credit. As a result of our use of an alternative fuel mixture
containing “black liquor,” a byproduct of pulp production, at our Androscoggin
and Quinnesec mills, we recognized $238.9 million of alternative fuel mixture
tax credits in the year ended December 31, 2009, including approximately $10
million for claims pending at December 31, 2009. The amount
recognized in fiscal 2009 includes amounts received for claims for use of the
alternative fuel mixture from September 2008 through December
2009. The tax credit, as it relates to liquid fuels derived from
biomass, expired on December 31, 2009. Therefore, we will not
recognize any proceeds from this tax credit in future periods.
2. RECENT
ACCOUNTING DEVELOPMENTS
Subsequent Events
— In February 2010, the FASB issued Accounting Standards Update, or
“ASU,” 2010-09, Subsequent
Events (Topic 855), to remove the requirement for SEC filers to disclose
the date through which an entity has evaluated subsequent events. This
change removes potential conflicts with current SEC guidance. ASU 2010-09
also clarifies the intended scope of the reissuance disclosure provisions.
ASU 2010-09 is effective upon issuance and had no impact on the Company’s
financial condition, results of operations, or cash flows. ASC 855, Subsequent Events,
establishes general standards of accounting for and disclosure of events that
occur after the balance sheet date but before financial statements are issued or
available to be issued. FASB ASC 855 defines (1) the period after the balance
sheet date during which a reporting entity’s management should evaluate events
or transactions that may occur for potential recognition or disclosure in the
financial statements, (2) the circumstances under which an entity should
recognize events or transactions occurring after the balance sheet date in its
financial statements, and (3) the disclosures an entity should make about events
or transactions that occurred after the balance sheet date. FASB ASC 855
is effective prospectively for interim and annual periods ending after June 15,
2009. The adoption of FASB ASC 855 had no impact on the Company’s
financial condition, results of operations, or cash flows.
Fair Value
Measurements and Disclosures — In January 2010, the FASB issued ASU
2010-06, Fair Value
Measurements and Disclosures (Topic 820) – Improving Disclosures about Fair
Value Measurements, which provides additional guidance relating to fair
value measurement disclosures. Specifically, companies will be required to
separately disclose significant transfers into and out of Level 1 and
Level 2 measurements in the fair value hierarchy and the reasons for those
transfers. For Level 3 fair value measurements, the new guidance requires a
gross presentation of activities within the Level 3 roll
forward. Additionally, the FASB also clarified existing fair value
measurement disclosure requirements relating to the level of disaggregation,
inputs, and valuation techniques. This ASU is effective for interim or annual
reporting periods beginning after December 15, 2009, except for the detailed
Level 3 disclosures, which are effective for interim or annual reporting
periods beginning after December 15, 2010. Since ASU 2010-06 only affects
disclosure requirements, the adoption of these provisions will have no impact on
the Company’s financial condition, results of operations, or cash
flows.
Accounting
Standards Codification — The FASB issued ASC 105, Generally Accepted Accounting
Principles, which establishes the FASB Accounting Standards
CodificationTM,
or the “Codification,” as the source of authoritative U.S. generally accepted
accounting principles recognized by the FASB to be applied by nongovernmental
entities. Rules and interpretive releases of the Securities and
Exchange Commission, or “SEC,” under authority of federal securities laws are
also sources of authoritative guidance for SEC registrants. All
guidance contained in the Codification carries an equal level of
authority. All non-grandfathered, non-SEC accounting literature not
included in the Codification is superseded and deemed non-authoritative. FASB
ASC 105 is effective for financial statements issued for interim and annual
periods ending after September 15, 2009. The adoption of FASB ASC 105
had no impact on the Company’s financial condition, results of operations, or
cash flows.
Measuring
Liabilities at Fair Value — In August 2009, the FASB issued ASU 2009-05,
Fair Value Measurements and
Disclosures (Topic 820) – Measuring Liabilities at Fair Value, which
provides clarification that in circumstances in which a quoted price in an
active market for the identical liabilities is not available, a reporting entity
is required to measure fair value using one or more of the techniques provided
for in this update. This ASU is effective for the first interim or
annual reporting period beginning after issuance, which for the Company was the
fourth quarter of 2009. The adoption of ASU 2009-05 did not have a material
impact on the Company’s financial condition, results of operations, or cash
flows.
51
Fair Value of
Financial Instruments — FASB ASC 825-10-65 updates FASB ASC 825, Financial Instruments, to
increase the frequency of fair value disclosures from an annual basis to a
quarterly basis. The guidance relates to fair value disclosures for
any financial instruments that are not currently reflected on the balance sheet
at fair value. These provisions of FASB ASC 825 are effective for
interim and annual periods ending after June 15, 2009. Since these provisions
only affect disclosure requirements, the adoption of these provisions under FASB
ASC 825 had no impact on the Company’s financial condition, results of
operations, or cash flows.
Postretirement
Benefit Plan Assets — FASB ASC 715-20-65 updates FASB ASC 715 to require
more detailed disclosures about employers’ pension plan assets. New
disclosures will include more information on investment strategies, major
categories of plan assets, concentrations of risk within plan assets and
valuation techniques used to measure the fair value of plan
assets. These provisions of FASB ASC 715 are effective for fiscal
years ending after December 15, 2009. Since these provisions only
affect disclosure requirements, the adoption of these provisions under FASB ASC
715 had no impact on the Company’s financial condition, results of operations,
or cash flows.
Intangible Assets
— FASB ASC
350-30-65 updates FASB ASC 350 and FASB ASC 275, Risks and Uncertainties, to
provide guidance on the renewal or extension assumptions used in the
determination of the useful life of a recognized intangible
asset. The intent is to better match the useful life of the
recognized intangible asset to the period of the expected cash flows used to
measure its fair value. This guidance is effective for fiscal years
and interim periods beginning after December 15, 2008. The adoption
of these provisions under FASB ASC 350 and FASB ASC 275 did not have a material
impact on the Company’s financial condition, results of operations, or cash
flows.
Derivatives and
Hedging Activities — FASB ASC 815-10-65 updates FASB ASC 815, Derivatives and Hedging, and
changes the disclosure requirements for derivative instruments and hedging
activities. Entities are required to provide enhanced disclosures
about (a) how and why an entity uses derivative instruments, (b) how derivative
instruments and related hedged items are accounted for under FASB ASC 815, and
(c) how derivative instruments and related hedged items affect an entity’s
financial position, financial performance, and cash flows. These
provisions of FASB ASC 815 were effective for fiscal years and interim periods
beginning after November 15, 2008. Since these provisions only affect
disclosure requirements, the adoption of these provisions under FASB ASC 815 had
no impact on the Company’s financial condition, results of operations, or cash
flows.
Business
Combinations —
FASB ASC 805-10-65 updates FASB ASC 805, Business Combinations,
to establish
principles and requirements for how an acquirer recognizes and measures
identifiable assets acquired, liabilities assumed and noncontrolling interests;
recognizes and measures goodwill acquired in a business combination or gain from
a bargain purchase; and establishes disclosure requirements. These
provisions of FASB ASC 805 are effective for business combinations for which the
acquisition date is on or after the beginning of the first annual reporting
period beginning on or after December 15, 2008. The Company will
apply these provisions of FASB ASC 805 to any future
acquisitions.
52
Noncontrolling
Interests — FASB
ASC 810-10-65, updates FASB ASC 810, Consolidation, to establish
accounting and reporting standards for the noncontrolling interest in a
subsidiary and for the deconsolidation of a subsidiary. These
provisions of FASB ASC 810 are effective, on a prospective basis, for fiscal
years and interim periods beginning on or after December 15,
2008. The presentation and disclosure requirements for existing
minority interests should be applied retrospectively for all periods
presented. The adoption of these provisions under FASB ASC 810 did
not have a material impact on the Company’s financial condition, results of
operations, or cash flows.
Fair Value
Measurements —
FASB ASC 820-10-65 updates FASB ASC 820 to define fair value, establish a
framework for measuring fair value, and expand disclosures about fair value
measurements. FASB ASC 820 establishes a fair value hierarchy, giving
the highest priority to quoted prices in active markets and the lowest priority
to unobservable data and requires new disclosures for assets and liabilities
measured at fair value based on their level in the hierarchy. These
provisions of FASB ASC 820 were effective for financial statements issued for
fiscal years beginning after November 15, 2007. However, FASB
ASC 820-10-65 delayed the implementation of FASB ASC 820 for nonfinancial assets
and nonfinancial liabilities, except for items that are recognized or disclosed
at fair value in the financial statements on a recurring basis, to fiscal years
beginning after November 15, 2008. The adoption of these provisions
of FASB ASC 820 did not have a material impact on the Company’s financial
condition, results of operations, or cash flows.
Fair Value Option
for Financial Assets and Financial Liabilities — Certain provisions of
FASB ASC 825, Financial
Instruments, were updated to permit an entity an irrevocable
election to
measure certain financial assets and financial liabilities at fair value on
an instrument-by-instrument basis, with unrealized gains and losses recognized
currently in earnings. The objective was to improve financial
reporting by allowing entities to mitigate volatility in reported earnings
caused by the measurement of related assets and liabilities using different
attributes, without having to apply complex hedge accounting
provisions. The update to the standard was effective as of the
beginning of an entity’s fiscal year beginning after November 15,
2007. The adoption of the updated provisions of FASB ASC 825 did not
have a material impact on the Company’s financial condition, results of
operations, or cash flows.
Other new
accounting pronouncements issued but not effective until after December 31,
2009, are not expected to have a significant effect on the Company’s financial
condition, results of operations, or cash flows.
3. INVENTORIES
Inventories
by major category included the following:
|
December
31,
|
||||||||
|
(In thousands of U.S.
dollars)
|
2009
|
2008
|
||||||
|
Raw
materials
|
$ | 28,923 | $ | 29,858 | ||||
|
Woodyard
logs
|
4,463 | 7,970 | ||||||
|
Work-in-process
|
27,472 | 19,001 | ||||||
|
Finished
goods
|
75,379 | 113,050 | ||||||
|
Replacement parts and other
supplies
|
26,164 | 26,055 | ||||||
|
Inventories
|
$ | 162,401 | $ | 195,934 | ||||
53
4. PROPERTY,
PLANT, AND EQUIPMENT
Property,
plant, and equipment were as follows:
|
December
31,
|
||||||||
|
(In thousands of U.S.
dollars)
|
2009
|
2008
|
||||||
|
Land and land
improvements
|
$ | 30,599 | $ | 30,141 | ||||
|
Building and leasehold
improvements
|
175,677 | 174,959 | ||||||
|
Machinery, equipment, and
other
|
1,214,863 | 1,172,334 | ||||||
|
Construction-in-progress
|
10,260 | 24,188 | ||||||
| 1,431,399 | 1,401,622 | |||||||
|
Less: accumulated
depreciation
|
(408,777 | ) | (285,632 | ) | ||||
|
Property, plant, and
equipment
|
$ | 1,022,622 | $ | 1,115,990 | ||||
Depreciation
expense was $125.2 million, $126.4 million, and $119.4 million for the years
ended December 31, 2009, 2008, and 2007, respectively.
5. INTANGIBLES
AND OTHER ASSETS
Intangibles
and other assets consist of the following:
|
December
31,
|
||||||||
|
(In thousands of U.S.
dollars)
|
2009
|
2008
|
||||||
|
Amortizable intangible
assets:
|
||||||||
|
Customer relationships - net of
accumulated amortization of $4.6 million and
|
||||||||
|
$3.3 million,
respectively
|
$ | 8,720 | $ | 10,020 | ||||
|
Patents - net of
accumulated
amortization of $0.4 million and $0.3 million,
|
||||||||
|
respectively
|
755 | 870 | ||||||
|
Total amortizable intangible
assets
|
9,475 | 10,890 | ||||||
|
Unamortizable intangible
assets:
|
||||||||
|
Trademarks
|
21,473 | 21,473 | ||||||
|
Other
assets:
|
||||||||
|
Financing costs-net of accumulated
amortization of $14.3
million and
|
||||||||
|
$14.3 million,
respectively
|
29,229 | 33,465 | ||||||
|
Deferred major
repair
|
8,787 | 9,543 | ||||||
|
Deferred software cost-net of
accumulated amortization of $2.9 million
|
||||||||
|
and $3.0 million,
respectively
|
1,354 | 2,746 | ||||||
|
Replacement parts-net
|
3,806 | 5,625 | ||||||
|
Other
|
13,882 | 4,771 | ||||||
|
Total other
assets
|
57,058 | 56,150 | ||||||
|
Intangibles and other
assets
|
$ | 88,006 | $ | 88,513 | ||||
54
Amounts
reflected in depreciation, amortization,
and depletion expense related to intangibles and other assets are as
follows:
|
Year Ended December
31,
|
||||||||||||
|
(In thousands of U.S.
dollars)
|
2009
|
2008
|
2007
|
|||||||||
|
Intangible
amortization
|
$ | 1,415 | $ | 1,565 | $ | 1,715 | ||||||
|
Software
amortization
|
1,880 | 1,723 | 1,318 | |||||||||
The
estimated future amortization expense for intangible assets over the next five
years is as follows:
|
(In thousands of U.S.
dollars)
|
||||
|
2010
|
$ | 1,265 | ||
|
2011
|
1,065 | |||
|
2012
|
915 | |||
|
2013
|
815 | |||
|
2014
|
715 | |||
6. ACCRUED
LIABILITIES
A summary
of accrued liabilities is as follows:
|
December
31,
|
||||||||
|
(In thousands of U.S.
dollars)
|
2009
|
2008
|
||||||
|
Accrued
interest
|
$ | 50,069 | $ | 33,702 | ||||
|
Payroll and employee benefit costs
|
41,200 | 48,024 | ||||||
|
Accrued sales
rebates
|
10,433 | 10,966 | ||||||
|
Derivatives
|
3,705 | 26,878 | ||||||
|
Accrued taxes - other than
income
|
1,675 | 1,777 | ||||||
|
Freight and
other
|
9,143 | 4,218 | ||||||
|
Accrued liabilities
|
$ | 116,225 | $ | 125,565 | ||||
55
7. LONG-TERM
DEBT
A summary
of long-term debt is as follows:
|
As of December 31,
2009
|
As of December 31,
2008
|
|||||||||||||||||||||
|
Effective
|
||||||||||||||||||||||
|
Original
|
Interest
|
Fair
|
|
Fair
|
||||||||||||||||||
|
(In thousands of U.S.
dollars)
|
Maturity
|
Rate
|
Balance
|
Value
|
|
Balance
|
Value
|
|||||||||||||||
|
Verso Paper Holdings
LLC
|
||||||||||||||||||||||
|
First Priority Revolving Credit
Facility
|
8/1/2012
|
- | - | $ | - | $ | 92,083 | $ | 66,760 | |||||||||||||
|
First Priority Term
Loan
|
8/1/2013
|
- | - | - | 253,588 | 183,851 | ||||||||||||||||
|
Senior Secured Notes -
Fixed
|
7/1/2014
|
13.75 | % | 300,977 | 357,500 | - | - | |||||||||||||||
|
Second Priority Senior Secured
Notes - Fixed
|
8/1/2014
|
9.13 | % | 337,080 | 321,911 | 350,000 | 141,750 | |||||||||||||||
|
Second Priority Senior Secured
Notes - Floating
|
8/1/2014
|
4.03 | % | 180,216 | 142,371 | 250,000 | 80,000 | |||||||||||||||
|
Senior Subordinated
Notes
|
8/1/2016
|
11.38 | % | 300,000 | 241,500 | 300,000 | 90,000 | |||||||||||||||
|
Verso Paper Finance Holdings
LLC
|
||||||||||||||||||||||
|
Senior Unsecured Term
Loan
|
2/1/2013
|
6.59 | % | 74,079 | 31,113 | 112,000 | 33,600 | |||||||||||||||
| 1,192,352 | 1,094,395 | 1,357,671 | 595,961 | |||||||||||||||||||
|
Less current
maturities
|
- | - | (2,850 | ) | (2,066 | ) | ||||||||||||||||
|
Long-term
debt
|
$ | 1,192,352 | $ | 1,094,395 | $ | 1,354,821 | $ | 593,895 | ||||||||||||||
The
Company determines the fair value of its long-term debt based on market
information and a review of prices and terms available for similar
obligations.
Amounts
included in interest expense related to long-term debt and amounts of cash
interest payments on long-term debt are as follows:
|
Year Ended December
31,
|
||||||||||||
|
(In thousands of U.S.
dollars)
|
2009
|
2008
|
2007
|
|||||||||
|
Interest
expense
|
$ | 118,013 | $ | 117,106 | $ | 137,019 | ||||||
|
Cash interest paid
|
90,713 | 120,656 | 132,206 | |||||||||
|
Debt issuance cost amortization
(1)
|
5,748 | 9,924 | 6,721 | |||||||||
(1) Amortization of debt issuance cost
is included in interest expense.
Verso
Finance has a senior unsecured term loan which matures on February 1,
2013. In May 2008, the Company used a portion of the net proceeds
from its IPO to repay $138 million of the outstanding principal of the term loan
and to pay a related $1.4 million prepayment penalty. During
2009, the Company repurchased $46.8 million of the term loan for a total price
of $12.4 million, which resulted in gains of $33.5 million, net of write-off of
unamortized debt issuance costs. The net gain is recognized in Other
income, net in the consolidated statement of operations. The term
loan allows Verso Finance to pay interest either in cash or in-kind through the
accumulation of the outstanding principal amount. Verso Finance has
elected to exercise the PIK option for $8.9 million of interest payments due in
2009.
During
2009, the Company repurchased and retired $69.8 million of the second priority
senior secured floating-rate notes due on August 1, 2014, for a total purchase
price of $35.1 million, which resulted in gains of $33.0 million, net of the
write-off of unamortized debt issuance costs. The Company also repurchased and
retired $12.9 million of the second priority senior secured fixed-rate notes due
on August 1, 2014, for a total purchase price of $7.9 million, which resulted in
gains of $4.7 million, net of the write-off of unamortized debt issuance
costs. In addition, the Company de-designated the interest rate swap
hedging interest payments on the floating-rate notes and recognized losses of
$0.3 million on the interest rate swap. The net gain resulting from
these transactions is recognized in Other income, net in the consolidated
statement of operations.
56
On
June 11, 2009, Verso Holdings issued $325.0 million aggregate principal
amount of 11.5% senior secured notes due July 1, 2014. The notes are
secured by substantially all of the property and assets of Verso Holdings and
each of its direct and indirect subsidiaries. The notes are secured
on a ratable and pari
passu basis with the revolving credit facility. The net
proceeds after deducting the discount, underwriting fees, and issuance costs
were $288.6 million, which funds were used to repay in full $252.9 million
outstanding on Verso Holdings’ first priority term loan and to temporarily
reduce the debt outstanding under the revolving credit facility by $35.0
million. The write-off of unamortized debt issuance costs related to
the term loan resulted in a loss of $5.9 million, which was recognized in Other
income, net in the consolidated statement of operations. On January
12, 2010, Verso Holdings issued an additional $25.0 million aggregate principal
amount of the 11.5% senior secured notes under the existing
indenture. These notes will be treated as a single series and have
the same terms as the existing notes issued under the indenture in June
2009. The net proceeds including premium, after deducting
underwriting fees and before deducting offering expenses, were $27.0
million. We intend to use the net proceeds for capital expenditures
and other general corporate purposes.
The
payments required under the long-term debt listed above during the years
following December 31, 2009, are set forth below:
|
2010
|
$ | - | ||
|
2011
|
- | |||
|
2012
|
- | |||
|
2013
|
74,079 | |||
|
2014
|
818,273 | |||
|
2015 and
thereafter
|
300,000 | |||
|
Total long-term
debt
|
$ | 1,192,352 |
At
December 31, 2009, we were in compliance with the covenants in our debt
agreements.
8. OTHER
LIABILITIES
Other
liabilities consist of the following:
|
December
31,
|
||||||||
|
(In thousands of U.S.
dollars)
|
2009
|
2008
|
||||||
|
Asset retirement
obligations
|
$ | 13,300 | $ | 14,028 | ||||
|
Pension benefit obligation
|
12,622 | 12,497 | ||||||
|
Deferred income
taxes
|
8,035 | 8,144 | ||||||
|
Derivatives
|
- | 3,677 | ||||||
|
Other
|
1,655 | 1,805 | ||||||
|
Other
liabilities
|
$ | 35,612 | $ | 40,151 | ||||
57
9. EARNINGS
PER SHARE
The
following table provides a reconciliation of basic and diluted earnings (loss)
per common share:
|
Year Ended December
31,
|
||||||||||||
|
(In thousands, except per share
data)
|
2009
|
2008
|
2007
|
|||||||||
|
Net income (loss) available to
common shareholders
|
$ | 106,003 | $ | (62,826 | ) | $ | (111,463 | ) | ||||
|
Weighted average common stock
outstanding
|
52,047 | 46,691 | 38,047 | |||||||||
|
Weighted average
restricted stock
|
91 | - | - | |||||||||
|
Weighted average common shares
outstanding - basic
|
52,138 | 46,691 | 38,047 | |||||||||
|
Dilutive shares
from stock options
|
15 | - | - | |||||||||
|
Weighted average common shares
outstanding - diluted
|
52,153 | 46,691 | 38,047 | |||||||||
|
Basic earnings (loss) per
share
|
$ | 2.03 | $ | (1.35 | ) | $ | (2.93 | ) | ||||
|
Diluted earnings (loss) per
share
|
$ | 2.03 | $ | (1.35 | ) | $ | (2.93 | ) | ||||
In
accordance with FASB ASC 260, Earnings Per Share, unvested
restricted stock awards issued in 2009 contain nonforfeitable rights to
dividends and qualify as participating securities. No dividends have
been declared or paid in 2009.
For 2009,
319,288 weighted average potentially dilutive shares from stock options with a
weighted average exercise price per share of $3.43 were excluded from the
diluted earnings per share calculation because including such shares would have
been antidilutive. Additionally, 15,864 weighted average potentially
dilutive shares from options with an exercise price per share of $1.11 were
excluded from the diluted earnings per share calculation because these
performance-based options are not expected to vest. At December 31,
2008, 2,374 weighted average potentially dilutive shares from options with a
weighted average exercise price per share of $1.43 were excluded from the
diluted earnings per share calculation due to the antidilutive effect such
shares would have on net loss per common share. There were no equity
awards outstanding in 2007.
10. RETIREMENT
PLANS
Defined
Benefit Plan
The
Company maintains a defined benefit pension plan that provides retirement
benefits to hourly employees at the Androscoggin, Bucksport, and Sartell mills
hired prior to July 1, 2004. These employees generally are eligible
to participate in the plan upon completion of one year of service and attainment
of age 21. Employees hired after June 30, 2004, who are not eligible
for this pension plan receive an additional company contribution to their
savings plan (see “Other Benefits” discussion below). The plan
provides defined benefits based on years of credited service times a specified
flat dollar benefit rate.
58
The
following table summarizes net periodic pension cost for the years ended
December 31, 2009, 2008, and 2007:
|
Year Ended December
31,
|
||||||||||||
|
(In thousands of U.S.
dollars)
|
2009
|
2008
|
2007
|
|||||||||
|
Components of net periodic pension
cost:
|
||||||||||||
|
Service
cost
|
$ | 6,328 | $ | 5,976 | $ | 5,278 | ||||||
|
Interest
cost
|
1,537 | 998 | 611 | |||||||||
|
Expected return
on plan assets
|
(1,234 | ) | (762 | ) | (229 | ) | ||||||
|
Amortization of
prior service cost
|
1,023 | 871 | 785 | |||||||||
|
Amortization of
actuarial loss
|
319 | - | - | |||||||||
|
Net periodic pension
cost
|
$ | 7,973 | $ | 7,083 | $ | 6,445 | ||||||
The
following table provides detail on prior service cost and net actuarial loss
recognized in accumulated other comprehensive income at December 31, 2009 and
2008.
|
(In thousands of U.S.
dollars)
|
2009
|
2008
|
||||||
|
Amounts recognized in accumulated
other comprehensive income:
|
||||||||
|
Prior service
cost
|
$ | 7,277 | $ | 6,931 | ||||
|
Net actuarial
loss
|
4,399 | 5,674 | ||||||
The
estimated net actuarial loss and prior service cost that will be amortized from
accumulated other comprehensive income into net periodic pension cost during
2010 is $0.1 million and $1.8 million, respectively. We expect no
plan assets to be returned to the company in 2010.
The
Company makes contributions that are sufficient to fully fund its actuarially
determined costs, generally equal to the minimum amounts required by the
Employee Retirement Income Security Act (ERISA). The Company made
contributions of $6.9 million in 2007, with $4.7 million attributable to the
2007 plan year and $2.2 attributable to the 2006 plan year. The
Company made contributions of $9.4 million in 2008, with $6.4 million
attributable to the 2008 plan year and $3.0 million attributable to the 2007
plan year. The Company made contributions of $6.9 million in 2009,
with $5.7 million attributable to the 2009 plan year and $1.2 million
attributable to the 2008 plan year. In 2010, the Company expects to
make contributions of $4.9 million.
59
The
following table sets forth a reconciliation of the plan’s benefit obligation,
plan assets and funded status at December 31, 2009 and 2008:
|
Year Ended December
31,
|
||||||||
|
(In thousands of U.S.
dollars)
|
2009
|
2008
|
||||||
|
Change in Projected Benefit
Obligation:
|
||||||||
|
Benefit obligation at beginning of
period
|
$ | 25,453 | $ | 16,708 | ||||
|
Service
cost
|
6,328 | 5,976 | ||||||
|
Interest cost
|
1,537 | 998 | ||||||
|
Plan
amendments
|
1,369 | - | ||||||
|
Actuarial
loss
|
703 | 1,872 | ||||||
|
Benefits
paid
|
(253 | ) | (101 | ) | ||||
|
Benefit obligation on December
31
|
$ | 35,137 | $ | 25,453 | ||||
|
Change in Plan
Assets:
|
||||||||
|
Plan assets at fair value,
beginning of fiscal year
|
$ | 12,956 | $ | 6,728 | ||||
|
Actual net return (loss) on plan
assets
|
2,894 | (3,068 | ) | |||||
|
Employer
contributions
|
6,918 | 9,397 | ||||||
|
Benefits
paid
|
(253 | ) | (101 | ) | ||||
|
Plan assets at fair value, end of
fiscal year
|
22,515 | 12,956 | ||||||
|
Unfunded projected benefit obligation
recognized on
the
|
||||||||
|
Consolidated
Balance Sheets in Other Liabilities
|
$ | (12,622 | ) | $ | (12,497 | ) | ||
The
accumulated benefit obligation at December 31, 2009 and 2008, is $35.1 million
and $25.5 million, respectively.
The
following table summarizes expected future pension benefit
payments:
|
(In thousands of U.S.
dollars)
|
||||
|
2010
|
$ | 654 | ||
|
2011
|
874 | |||
|
2012
|
1,171 | |||
|
2013
|
1,489 | |||
|
2014
|
1,803 | |||
|
2015-2019
|
15,936 | |||
The
Company evaluates its actuarial assumptions annually as of December 31 (the
measurement date) and considers changes in these long-term factors based upon
market conditions and the requirements of FASB ASC 715. These
assumptions are used to calculate benefit obligations as of December 31 of the
current year, and pension expense to be recorded for the following
year. The discount rate assumption reflects the yield on a portfolio
of high quality fixed-income instruments that have a similar duration to the
plan’s liabilities. The expected long-term rate of return assumption
reflects the average return expected on the assets invested to provide for the
plan’s liabilities.
60
The
actuarial assumptions used in the defined benefit pension plan were as
follows:
|
2009
|
2008
|
|
2007
|
|||||||||
|
Weighted average assumptions used
to determine
|
||||||||||||
|
benefit obligations as of December
31:
|
||||||||||||
|
Discount
rate
|
6.00 | % | 6.00 | % | 6.00 | % | ||||||
|
Rate of compensation
increase
|
N/A | N/A | N/A | |||||||||
|
Weighted average assumptions used
to determine
net
|
||||||||||||
|
periodic pension cost for the
fiscal year:
|
||||||||||||
|
Discount
rate
|
6.00 | 6.00 | 5.75 | |||||||||
|
Rate of compensation
increase
|
N/A | N/A | N/A | |||||||||
|
Expected long-term return on plan
assets
|
7.50 | 7.50 | 8.00 | |||||||||
The
Company’s primary investment objective is to ensure, over the long-term life of
the pension plan, an adequate pool of sufficiently liquid assets to support the
benefit obligations. In meeting this objective, the pension plan
seeks to achieve a high level of investment return through long-term stock and
bond investment strategies, consistent with a prudent level of portfolio
risk. Any volatility in investment performance compared to investment
objectives should be explainable in terms of general economic and market
conditions. It is not contemplated at this time that any derivative
instruments will be used to achieve investment objectives. The
expected return on plan assets assumption for 2010 will be 7.50
percent. The expected long-term rate of return on plan assets
reflects the weighted-average expected long-term rates of return for the broad
categories of investments currently held in the plans (adjusted for expected
changes), based on historical rates of return for each broad category, as well
as factors that may constrain or enhance returns in the broad categories in the
future. The expected long-term rate of return on plan assets is
adjusted when there are fundamental changes in expected returns in one or more
broad asset categories and when the weighted-average mix of assets in the plans
changes significantly.
The
following table provides the pension plan’s asset allocation on December 31,
2009:
|
Targeted
|
Allocation
of
Plan Assets on December
31,
|
|||||||||||
|
Allocation
|
2009
|
2008
|
||||||||||
|
Equity
securities:
|
||||||||||||
|
Large capital
equity
|
26.4 | % | 27.3 | % | 23.8 | % | ||||||
|
Small capital
equity
|
4.6 | 4.7 | 4.0 | |||||||||
|
International
equity
|
17.0 | 16.9 | 15.1 | |||||||||
|
Other
securities:
|
||||||||||||
|
Bond
fund
|
47.0 | 46.5 | 51.4 | |||||||||
|
Fixed income
fund
|
5.0 | 4.6 | 5.6 | |||||||||
FASB ASC
715-20-65, which is effective for fiscal years ending after December 15, 2009,
updates FASB ASC 715, Compensation – Retirement
Benefits, to require more detailed disclosures about employers’ pension
plan assets, including additional fair value disclosures about employers’
pension and postretirement benefit plan assets consistent with the guidance
contained in FASB ASC 820.
The
Company and the Plan adopted FASB ASC 820, effective January 1, 2008. FASB ASC
820 provides a common definition of fair value, establishes a framework for
measuring fair value, and expands disclosures about fair value
measurements. The adoption of these provisions of FASB ASC 820 had no
impact on the Plan’s financial statements, but the adoption did result in
additional required disclosures as set forth below.
61
The fair
value framework requires the categorization of assets and liabilities into three
levels based upon the assumptions used to value the assets or
liabilities. Level 1 provides the most reliable measure of fair
value, whereas Level 3 generally requires significant management
judgment. The three levels are defined as follows:
|
▪
Level 1:
|
Unadjusted
quoted prices in active markets for identical assets or liabilities at the
measurementdate.
|
|
▪
Level 2:
|
Observable
inputs other than those included in Level 1. For example,
quoted prices for similarassets
or liabilities in active markets or quoted prices for identical assets or
liabilities in inactive markets.
|
|
▪
Level 3:
|
Unobservable
inputs reflecting management’s own assumption about the inputs used in
pricingthe
asset or liability at the measurement
date.
|
The
following table sets forth by level, within the fair value hierarchy, the Plan’s
assets at fair value as of December 31, 2009.
|
(In thousands of U.S.
dollars)
|
Total
|
Level 1
|
Level 2 (1)
|
Level 3
|
||||||||||||
|
Assets
|
||||||||||||||||
|
Large capital
equity
|
$ | 6,149 | $ | - | $ | 6,149 | $ | - | ||||||||
|
Small capital
equity
|
1,061 | - | 1,061 | - | ||||||||||||
|
International
equity
|
3,817 | - | 3,817 | - | ||||||||||||
|
Corporate bond
fund
|
6,301 | - | 6,301 | - | ||||||||||||
|
Governmental bond
fund
|
4,158 | - | 4,158 | - | ||||||||||||
|
Fixed income
fund
|
1,029 | - | 1,029 | - | ||||||||||||
|
Total assets at fair value on
December 31, 2009
|
$ | 22,515 | $ | - | $ | 22,515 | $ | - | ||||||||
(1) Based on the net asset value of
units held by the plan at year end.
Defined
Contribution Plan
The
Company sponsors a defined contribution plan to provide salaried and Quinnesec
hourly employees an opportunity to accumulate personal funds and to provide
additional benefits for retirement.
As
determined by the provisions of the plan, the Company contributes annually a
percentage of employee earnings. The percentage is based on age and
years of credited service for employees hired prior to July 1, 2004 and a fixed
percentage of earnings to employees hired after June 30,
2004. Expense under this plan was $8.4 million, $6.9 million and $6.7
million for the years ended December 31, 2009, 2008, and 2007,
respectively.
Other
Benefits
The
Company sponsors a 401(k) plan to provide salaried and hourly employees an
opportunity to accumulate personal funds and to provide additional benefits for
retirement. Contributions may be made on a before-tax basis to the
plan. As determined by the provisions of the plan, the Company
matches the employees’ basic voluntary contributions; however, in response to
the challenging economic conditions, the Company suspended its matching
contributions to the 401(k) plan for exempt and non-exempt salaried employees
beginning April 3, 2009, which reduced expense by approximately $2.3 million in
2009. On December 23, 2009, the Company amended the plan to
reinstate, as of January 1, 2010, matching contributions under the plan in
accordance with the formula previously in effect (70% of the first 4% of the
participant’s compensation contributed to the plan, plus 60% of the next 4% of
the participant’s compensation contributed to the plan). Such
contributions to the plan totaled approximately $5.7 million, $8.4 million and
$8.1 million for the years ended December 31, 2009, 2008 and 2007,
respectively.
62
In 2009,
the Company offered a voluntary early retirement program to certain eligible
employees. The offer was accepted by 71 employees. The Company’s voluntary early
retirement program resulted in a charge of $4.2 million to cost of products
sold, consisting of separation and accrued medical and dental benefits, and is
expected to result in an annual cost savings of $7.1 million. The voluntary
early retirement program is expected to be completed by June 30,
2010.
The
Company also initiated a reduction in workforce resulting in the elimination of
eight positions in 2009. The reduction in workforce resulted in a charge of $0.5
million to selling, general, and administrative expense, consisting of
separation and accrued medical and dental benefits, and is expected to result in
annual cost savings of $0.8 million.
11. EQUITY
AWARDS
The Verso
Paper Corp. 2008 Incentive Award Plan, as amended, or the “Incentive Plan,”
authorizes the issuance of stock awards covering up to 4,250,000 shares of
common stock of the Company. Under the Incentive Plan, stock awards
may be granted to employees and non-employee directors upon approval by the
board of directors. The Company has issued non-qualified stock
options to certain non-employee directors that vest upon grant and expire 10
years from the date of grant. The Company also has issued both
time-based and performance-based non-qualified stock options to officers and
management employees in 2009. These time-based options vest one to
three years from the date of grant and expire seven years from the date of
grant. The performance-based options vest one to three years from the
date of grant based on the achievement of certain performance criteria tied to
Verso’s calculation of Adjusted EBITDA and expire seven years from the date of
grant. However, the performance period has not begun and performance
criteria have not been communicated to the participants for 41,998 of these
performance-based options, and thus no expense has been recognized related to
these options.
A summary
of stock option plan activity (including the performance-based options) for the
year ended December 31, 2009, is provided below:
|
Weighted
|
Weighted
|
Aggregate
|
||||||||||||||
|
Average
|
Average
|
Intrinsic
|
||||||||||||||
|
Options
|
Exercise
|
Fair Value
|
Value
|
|||||||||||||
|
Outstanding
|
Price
|
at Grant
Date
|
(in
thousands)
|
|||||||||||||
|
January 1,
2009
|
15,200 | $ | 1.43 | $ | 0.46 | |||||||||||
|
Options
granted
|
1,083,202 | 3.55 | 2.07 | |||||||||||||
|
Performance options granted
(1)
|
42,000 | 1.13 | 0.35 | |||||||||||||
|
December 31,
2009
|
1,140,402 | 3.43 | 1.99 | |||||||||||||
|
Options
exercisable
|
30,400 | $ | 1.07 | $ | 47 | |||||||||||
|
Options expected to
vest
|
1,088,998 | 3.54 | 93 | |||||||||||||
|
(1)
|
At December 31, 2009, there were
an additional 41,998 of performance-based options for which the
performance period has not begun.
These options are treated as
variable awards and had a weighted average fair value of $2.09 at December
31, 2009.
|
63
The Company used the Black-Scholes option pricing model to estimate the fair value of stock options granted in 2009 and 2008 with the following assumptions:
|
2009
|
2008
|
|||
|
Expected weighted-average life of
options granted
|
5.0 years
|
5.0 years
|
||
|
Range of volatility rates based on
historical industry volatility
|
31.82% -
87.28%
|
31.82%
|
||
|
Range of risk-free interest
rates
|
1.49% -
2.73%
|
2.50%
|
||
|
Expected dividend
yield
|
-
|
-
|
Expected
lives of options granted are determined using the simplified method of
calculating expected life per SEC Staff Accounting Bulletin Topic 14, Share-Based
Payment. Expected volatility is estimated using historical
industry volatility blended with Verso’s historical volatility. The
dividend yield is assumed to be zero since we have no current plans to declare
dividends. The risk-free interest rates are based on the market yield
of U.S. Treasury securities.
On
December 31, 2009, there was $2.0 million of unrecognized compensation cost
related to stock options which is expected to be recognized over a
weighted-average period of approximately 2.7 years.
Additionally,
on September 21, 2009, the Company issued 328,000 restricted stock awards to its
executives and certain senior managers with a grant date fair value of $3.69 per
share, which is equal to the closing market price of our common stock on the
date of grant. The restrictions lapse in equal annual installments on
each of the first three anniversaries of the date of grant. As of
December 31, 2009, there was $1.1 million of unrecognized compensation cost
related to restricted stock awards which is expected to be recognized over a
weighted-average period of approximately 2.7 years. The restrictions
on these shares automatically lapse in the event of a change of control as
defined in the Incentive Plan.
Simultaneously
with the consummation of the IPO, the limited partnership agreement of Verso
Paper Corp.’s parent, Verso Paper Management LP, or the “Partnership,” was
amended to, among other things, change its equity structure from multiple
classes of units representing limited partner interests in the Partnership to a
single class of units representing such interests. The conversion
from the prior multiple-class unit structure, or the “Legacy Units,” to a new
single class of units in the Partnership was designed to correlate the equity
structure of the Partnership with the post-IPO equity structure of Verso Paper
Corp.
In
connection with the IPO and the amendment of the limited partnership agreement
of the Partnership, the Legacy Class C Units of the Partnership previously
granted to certain members of our management were vested as of May 20,
2008. Prior to the amendment, the Legacy Class C Units were to vest
only if certain performance targets were met. As a result of the
accelerated vesting of the Legacy Class C Units, the Company recognized $10.8
million of equity compensation expense in 2008.
Certain
members of the Company’s management have been granted Legacy Class B Units,
which vest over a five-year period at the rate of 20% per year on each
anniversary of the grant date. The Company’s directors have been
granted Legacy Class D Units, which were vested upon grant. The fair
value of the restricted Legacy Class B Units granted to management and the
Legacy Class D Units granted to directors for the years ended December 31, 2008
and 2007, was approximately $0.1 million and $0.6 million,
respectively.
As of
December 31, 2009, there was $0.4 million of unrecognized compensation cost
related to unvested Legacy Class B Units. This cost is expected to be recognized
over a weighted-average period of approximately 1.6 years. A summary
of Legacy Class B Units activity for the years ended December 31, 2009 and 2008,
is presented below:
64
|
Weighted
|
||||||||
|
Average
Fair
|
||||||||
|
Value at
|
||||||||
|
Units
|
Grant Date
|
|||||||
|
Nonvested at December 31,
2007
|
339,955 | $ | 3.40 | |||||
|
Vested
|
(84,343 | ) | 3.40 | |||||
|
Nonvested at December 31,
2008
|
255,612 | 3.40 | ||||||
|
Vested
|
(92,443 | ) | 3.40 | |||||
|
Nonvested at December 31,
2009
|
163,169 | 3.40 | ||||||
Equity
award expense for the years ended December 31, 2009, 2008, and 2007, was $0.6
million; $11.2 million, which includes the $10.8 million related to the vesting
of the Legacy Class C Units; and $0.6 million, respectively.
The
Company estimates the fair value of management equity awards using the
Black-Scholes valuation model. Key input assumptions applied under
the Black-Scholes option pricing model for the Legacy Class C Units were as
follows: expected term of one year based on the lock-up period
following the IPO, volatility rate of 36.65% based on industry historical
volatility rate, expected dividend rate of 1%, and average risk free rate of
2.0%. Assumptions applied under the Black-Scholes option pricing
model for the Legacy Class B Units and the Legacy Class D Units were as
follows: expected term of five years based on the vesting period,
volatility rate of 36.65% based on industry historical volatility rate, no
expected dividends, and average risk free rates of 3.0% in 2008 and 4.2% to 4.7%
in 2007.
12. BUCKSPORT
ENERGY ASSET INVESTMENT
The
Company has a joint ownership interest with Bucksport Energy LLC, an unrelated
third party, in a cogeneration power plant producing steam and
electricity. The plant was built in 2000 and is located at and
supports the Bucksport mill. Each co-owner owns an undivided
proportional share of the plant’s assets and the Company accounts for this
investment under the proportional consolidation method. The Company
owns 28% of the steam and electricity produced by the plant. The
Company may purchase its remaining electrical needs from the plant at market
rates. The Company is obligated to purchase the remaining 72% of the
steam output from the plant at fuel cost plus a contractually fixed fee per unit
of steam. Power generation and operating expenses are divided on the
same basis as ownership. The Company has cash which is restricted in
its use and may be used only to fund the ongoing energy operations of this
investment. Approximately $0.2 million of restricted cash is included
in other assets in the balance sheet at December 31, 2009 and
2008. Balances included in the balance sheet at December 31, 2009 and
2008, related to this investment are as follows:
|
December
31,
|
||||||||
|
(In thousands of U.S.
dollars)
|
2009
|
2008
|
||||||
|
Other
receivables
|
$ | 63 | $ | 99 | ||||
|
Other current
assets
|
158 | 158 | ||||||
|
Total current
assets
|
$ | 221 | $ | 257 | ||||
|
Property, plant, and
equipment
|
$ | 10,671 | $ | 10,699 | ||||
|
Accumulated
depreciation
|
(2,012 | ) | (1,385 | ) | ||||
|
Net property, plant, and
equipment
|
$ | 8,659 | $ | 9,314 | ||||
|
Current
liabilities
|
$ | (48 | $ | (84 | ) | |||
65
|
13.
|
DERIVATIVE
INSTRUMENTS AND HEDGES
|
Effective
January 1, 2009, the Company adopted FASB ASC 815-10-50, which expands the
quarterly and annual disclosure requirements for derivative instruments and
hedging activities.
In the
normal course of business, the Company utilizes derivatives contracts as part of
its risk management strategy to manage our exposure to market fluctuations in
energy prices and interest rates. These instruments are subject to
credit and market risks in excess of the amount recorded on the balance sheet in
accordance with generally accepted accounting principles. Controls
and monitoring procedures for these instruments have been established and are
routinely reevaluated. Credit risk represents the potential loss that
may occur because a party to a transaction fails to perform according to the
terms of the contract. The measure of credit exposure is the
replacement cost of contracts with a positive fair value. The Company
manages credit risk by entering into financial instrument transactions only
through approved counterparties. Market risk represents the potential
loss due to the decrease in the value of a financial instrument caused primarily
by changes in commodity prices. The Company manages market risk by
establishing and monitoring limits on the types and degree of risk that may be
undertaken.
Derivative
instruments are recorded on the balance sheet as other assets or other
liabilities measured at fair value. Fair value is defined as the price that
would be received to sell an asset or paid to transfer a liability in an orderly
transaction between market participants at the measurement
date. Where available, fair value is based on observable market
prices or parameters or derived from such prices or parameters. Where
observable prices or inputs are not available, valuation models may be
applied. For a cash flow hedge accounted for under FASB ASC 815,
Derivatives and
Hedging, changes in the fair value of the derivative instrument, to the
extent that it is effective, are recorded in accumulated other comprehensive
income and subsequently reclassified to earnings as the hedged transaction
impacts net income. Any ineffective portion of a cash flow hedge is
recognized currently in earnings. Cash flows from derivative
contracts are reported as operating activities on the consolidated and combined
statements of cash flows.
The
Company enters into short-term, fixed-price energy swaps as hedges designed to
mitigate the risk of changes in commodity prices for future purchase
commitments. These fixed-price swaps involve the exchange of net cash
settlements, based on changes in the price of the underlying commodity index
compared to the fixed price offering, at specified intervals without the
exchange of any underlying principal. Effective November 1, 2007, the
Company designated its energy hedging relationships as cash flow hedges under
FASB ASC 815. For the period of time these hedge relationships were
not designated under FASB ASC 815, the swaps were measured at fair value with
gains or losses included in current earnings. Subsequent to
designation, net gains or losses attributable to effective hedging are recorded
in Accumulated other comprehensive income, and the ineffective portion continues
to be recognized in Cost of products sold. As of December 31, 2008,
certain commodity swaps hedging anticipated natural gas purchases for January
and February 2009 with unrealized losses of $1.0 million were de-designated due
to modifications in management’s expected usage.
In
addition to the hedges designated under FASB ASC 815, the Company has entered
into short-term energy swaps for the purpose of creating an economic hedge
designed to mitigate the risk of changes in commodity prices for future energy
purchase and sale commitments.
In
February 2008, the Company entered into a two-year, $250 million notional value
receive-variable, pay-fixed interest rate swap in connection with the Company’s
outstanding floating rate notes that mature in 2014. The notes pay
interest quarterly based on a three-month LIBOR. The Company is
hedging the cash flow exposure on its quarterly variable-rate interest payments
due to changes in the benchmark interest rate (three-month LIBOR) and designated
the interest rate swap as a cash flow hedge under FASB ASC
815. During 2009, the Company repurchased $69.8 million of the hedged
notes and de-designated the interest-rate swap hedging the interest payments on
the debt. During 2009, $0.3 million of losses have been recognized in
Other income, net in the consolidated statement of operations.
66
The
following table presents information about the volume and fair value amounts of
the Company’s derivative instruments:
|
At December 31,
2009
|
At December 31,
2008
|
||||||||||||||||||||||||
|
Fair Value
Measurements
|
Fair
Value Measurements
|
Balance
|
|||||||||||||||||||||||
|
Notional
|
Derivative
|
Derivative
|
Notional
|
Derivative
|
Derivative
|
Sheet
|
|||||||||||||||||||
|
(dollars in
thousands)
|
Amount
|
Asset
|
Liability
|
Amount
|
Asset
|
Liability
|
Location
|
||||||||||||||||||
|
Derivatives designated as
hedging
|
|||||||||||||||||||||||||
|
instruments
under FASB ASC 815
|
|||||||||||||||||||||||||
|
Short-term, fixed price energy
swaps - MMBtu's
|
5,430,707 | $ | 560 | $ | 2,132 | 7,242,456 | $ | - | $ | 26,878 |
Other
assets/
Accrued
liabilties
|
||||||||||||||
|
Interest rate swaps,
receive-variable, pay-fixed
|
$ | - | - | - | $ | 250,000 | - | 3,677 |
Other
liabilities
|
||||||||||||||||
|
Derivatives not designated as
hedging
|
|||||||||||||||||||||||||
|
instruments
under FASB ASC 815
|
|||||||||||||||||||||||||
|
Interest rate swaps,
receive-variable, pay-fixed
|
$ | 250,000 | - | 1,573 | $ | - | - | - |
Other
liabilities
|
||||||||||||||||
The
following tables present information about the effect of the Company’s
derivative instruments on Accumulated other comprehensive income and the
consolidated and combined statements of operations:
|
Gain (Loss)
Recognized
|
Gain (Loss)
Reclassified
|
||||||||||||||||
|
in Accumulated
OCI
|
from Accumulated
OCI
|
Location
of
|
|||||||||||||||
|
Year Ended
|
Gain
(Loss)
|
||||||||||||||||
|
At December
31,
|
December
31,
|
on
Statements
|
|||||||||||||||
|
(dollars in
thousands)
|
2009
|
2008
|
2009
|
2008
|
of
Operations
|
||||||||||||
|
Derivatives designated as
hedging
|
|||||||||||||||||
|
instruments
under FASB ASC 815
|
|||||||||||||||||
|
Short-term, fixed price energy
swaps (1)
|
$ | (1,514 | ) | $ | (25,852 | ) | $ | (36,723 | ) | $ | 1,375 |
Cost of products
sold
|
|||||
|
Interest rate swaps,
receive-variable, pay-fixed (1)
|
(281 | ) | (3,859 | ) | (3,511 | ) | 525 |
Interest expense / Other income,
net
|
|||||||||
(1) Net losses at December 31, 2009, are
expected to be reclassified from Accumulated other comprehensive income into
earnings within the next 15 months.
|
Gain (Loss)
Recognized
|
|||||||||||||||||
|
Gain (Loss)
Recognized
|
on Derivative
|
Location
of
|
|||||||||||||||
|
on
Derivative
|
(Ineffective
Portion)
|
Gain
(Loss)
|
|||||||||||||||
|
Year
Ended December 31,
|
on
Statements
|
||||||||||||||||
|
(dollars in
thousands)
|
|
2009
|
2008
|
|
2009
|
2008
|
of
Operations
|
||||||||||
|
Derivatives designated as
hedging
|
|||||||||||||||||
|
instruments
under FASB
ASC 815
|
|||||||||||||||||
|
Short-term, fixed price energy
swaps
|
$ | (4,652 | ) | $ | (4,446 | ) | $ | (92 | ) | $ | (22 | ) |
Cost of products
sold
|
||||
|
Derivatives not designated as
hedging
|
|||||||||||||||||
|
instruments
under FASB ASC 815
|
|||||||||||||||||
|
Short-term, fixed price energy
swaps
|
- | 837 |
Cost of products
sold
|
||||||||||||||
|
Interest rate swaps,
receive-variable, pay-fixed
|
(1,257 | ) | - |
Interest expense / Other income,
net
|
|||||||||||||
67
14. FAIR
VALUE OF FINANCIAL INSTRUMENTS
FASB ASC
820 defines fair
value, establishes a framework for measuring fair value, and expands disclosures
about fair value measurements. On January 1, 2008, the Company
adopted FASB ASC 820 as it relates to financial assets and liabilities and
nonfinancial assets and liabilities that are recognized or disclosed at fair
value in the financial statements on a recurring basis, and adopted FASB ASC 820
as it relates to nonfinancial assets and liabilities that are not remeasured at
fair value on a recurring basis as of January 1, 2009. The adoption
of these provisions of FASB ASC 820 did not have a material impact on the
Company’s financial condition, results of operations, or cash
flows.
The
Company uses fair value measurements for the initial recording of certain assets
and liabilities, periodic remeasurement of certain assets and liabilities, and
disclosures. Fair value is generally defined as the exit price at
which an asset or liability could be exchanged in a current transaction between
willing, unrelated parties, other than in a forced or liquidation
sale.
The fair
value framework requires the categorization of assets and liabilities into three
levels based upon the assumptions used to value the assets or
liabilities. Level 1 provides the most reliable measure of fair
value, whereas Level 3 generally requires significant management
judgment. The three levels are defined as follows:
|
▪
Level 1:
|
Unadjusted
quoted prices in active markets for identical assets or liabilities at the
measurement date.
|
|
▪
Level 2:
|
Observable
inputs other than those included in Level 1. For example,
quoted prices for similar assets
or liabilities in active markets or quoted prices for identical assets or
liabilities in inactive markets.
|
|
▪
Level 3:
|
Unobservable
inputs reflecting management’s own assumption about the inputs used in
pricing the
asset or liability at the measurement
date.
|
The
following table summarizes the balances of assets and liabilities measured at
fair value on a recurring basis:
|
(In thousands of U.S.
dollars)
|
Total
|
Level 1
|
Level 2
|
Level 3
|
||||||||||||
|
At December 31, 2009
|
||||||||||||||||
|
Assets:
|
||||||||||||||||
|
Deferred compensation assets
(1)
|
$ | 643 | $ | 643 | $ | - | $ | - | ||||||||
|
Regional Greenhouse Gas Initiative
carbon credits (1)
|
248 | - | 248 | - | ||||||||||||
|
Commodity swaps
(1)
|
560 | - | 560 | - | ||||||||||||
|
Liabilities:
|
||||||||||||||||
|
Commodity swaps
(1)
|
$ | 2,132 | $ | - | $ | 2,132 | $ | - | ||||||||
|
Interest rate swaps
(2)
|
1,573 | - | 1,573 | - | ||||||||||||
|
Deferred compensation liabilities
(1)
|
643 | 643 | - | - | ||||||||||||
|
At December 31,
2008
|
||||||||||||||||
|
Assets:
|
||||||||||||||||
|
Deferred compensation assets
(1)
|
$ | 177 | $ | 177 | $ | - | $ | - | ||||||||
|
Regional Greenhouse Gas
Initiative carbon
credits (1)
|
230 | - | 230 | - | ||||||||||||
|
Liabilities:
|
||||||||||||||||
|
Commodity swaps
(1)
|
$ | 26,878 | $ | - | $ | 26,878 | $ | - | ||||||||
|
Interest rate swaps
(2)
|
3,677 | - | 3,677 | - | ||||||||||||
|
Deferred compensation liabilities
(1)
|
177 | 177 | - | - | ||||||||||||
(1) Based on observable market
data.
(2) Based on observable inputs for the
liability (interest rates and yield curves observable at specific
intervals).
68
The
Company may also be required periodically to measure certain other assets at
fair value on a nonrecurring basis, including long-lived assets, goodwill and
other intangible assets. The Company did not record any impairment
charges on long-lived assets, goodwill, or other intangible assets as no
significant events requiring non-financial assets and liabilities to be measured
at fair value occurred during the years ended December 31, 2009, 2008, or
2007.
15.
RELATED PARTY TRANSACTIONS
In
conjunction with the Acquisition, the Company entered into a transition service
agreement with International Paper whereby International Paper agreed to
continue to provide certain services specified in the agreement that are
necessary for the Company to run as a stand-alone business. The
charges for the years ended December 31, 2008 and 2007, were $0.2 million and
$5.6 million, respectively. As of September 30, 2007, the Company
substantially discontinued the use of services under this
agreement.
The
Company had net sales to International Paper and its divisions and subsidiaries
(including xpedx and Central Lewmar LLC) of approximately $138.8 million, $165.8
million, and $191.4 million for the years ended December 31, 2009, 2008, and
2007, respectively. For the year ended December 31, 2009, sales to
International Paper equaled 10% of the Company’s net sales. The
Company had purchases included in cost of products sold from International Paper
of approximately $4.6 million, $7.2 million, and $11.7 million for the years
ended December 31, 2009, 2008, and 2007, respectively.
Subsequent
to the Acquisition, the Company entered into a management agreement with Apollo
relating to the provision of certain financial and strategic advisory services
and consulting services. Management fees to Apollo for these services
were $2.8 million for the year ended December 31, 2007. Upon
consummation of the IPO, Apollo terminated the annual fee arrangement under the
management agreement for its consulting and advisory services, in exchange for a
one-time payment of $23.1 million corresponding to the present value of all
future annual fee payments pursuant to the terms of the management
agreement. Although the annual fee arrangement was terminated in
connection with the IPO, the management agreement remains in effect and will
expire on August 1, 2018. Under the management agreement, at any time
prior to the expiration of the agreement, Apollo has the right to act, in return
for additional fees to be mutually agreed by the parties to the management
agreement, as the Company’s financial advisor or investment banker for any
merger, acquisition, disposition, financing or the like if the Company decides
that it needs to engage someone to fill such role. In the event the
Company is not able to come to an agreement with Apollo in connection with such
role, at the closing of any merger, acquisition, disposition or financing or any
similar transaction, the Company has agreed to pay Apollo a fee equal to 1% of
the aggregate enterprise value (including the aggregate value of equity
securities, warrants, rights and options acquired or retained; indebtedness
acquired, assumed or refinanced; and any other consideration or compensation
paid in connection with such transaction). The Company agreed to
indemnify Apollo and its affiliates and their directors, officers and
representatives for losses relating to the services contemplated by the
management agreement and the engagement of affiliates of Apollo pursuant to, and
the performance by them of the services contemplated by, the management
agreement.
16. RESTRUCTURING
AND OTHER CHARGES
Restructuring
and other charges are comprised of transition and other costs (i.e., technology
migration costs, consulting and legal fees, and other one-time costs), including
those associated with the Acquisition. The charges for the year ended
December 31, 2009, were $1.0 million. The charges for the year ended
December 31, 2008, were $27.4 million, which included a one-time payment of
$23.1 million to terminate the annual fee arrangement under the management
agreement with Apollo, and $0.2 million of transition service agreement costs
paid to International Paper. The charges for the year ended December
31, 2007, were $19.4 million, which included $5.6 million of transition service
agreement costs paid to International Paper and $2.8 million of charges under
the management agreement with Apollo. As of September 30, 2007, the
Company substantially discontinued the use of services under this
agreement.
69
17. INCOME
TAXES
The
following is a summary of the components of the provision (benefit) for income
taxes:
|
Year Ended December
31
|
||||||||
|
(In thousands of U.S.
dollars)
|
2009
|
2008
|
||||||
|
Current tax
provision:
|
||||||||
|
U.S. federal
|
$ | 76 | $ | - | ||||
|
U.S. state and
local
|
779 | - | ||||||
|
|
855 | - | ||||||
|
Deferred tax provision
(benefit):
|
||||||||
|
U.S. federal
|
36,507 | (15,617 | ) | |||||
|
U.S. state and
local
|
6,277 | (2,970 | ) | |||||
|
|
42,784 | (18,587 | ) | |||||
|
Valuation
allowance
|
(42,894 | ) | 18,587 | |||||
|
Income tax
provision
|
$ | 745 | $ | - | ||||
A
reconciliation of income tax expense using the statutory federal income tax rate
compared with actual income tax expense follows:
|
Year Ended December
31
|
||||||||
|
(In thousands of U.S.
dollars)
|
2009
|
2008
|
||||||
|
Tax at Statutory U.S. Rate of
34%
|
$ | 36,294 | $ | (21,361 | ) | |||
|
Increase resulting
from:
|
||||||||
|
Equity award
expense
|
101 | 3,808 | ||||||
|
Disallowed
interest
|
- | 730 | ||||||
|
Meals and
entertainment
|
171 | 171 | ||||||
|
Nondeductible lobbying
expenses
|
2 | 23 | ||||||
|
Other
|
2 | 2 | ||||||
|
Net permanent
differences
|
276 | 4,734 | ||||||
|
Return to
provision
|
13 | - | ||||||
|
State income taxes (benefit)
|
7,056 | (1,960 | ) | |||||
|
Valuation
allowance
|
(42,894 | ) | 18,587 | |||||
|
Total income tax
provision
|
$ | 745 | $ | - | ||||
70
The following is a
summary of the significant components of
our deferred tax position:
|
Year Ended December
31
|
||||||||
|
(In thousands of U.S.
dollars)
|
2009
|
2008
|
||||||
|
Deferred tax assets:
|
||||||||
|
Net operating
loss and credit carryforwards
|
$ | 150,762 | $ | 156,872 | ||||
|
Pension
|
4,866 | 4,780 | ||||||
|
Payment-in-kind
interest
|
4,083 | 1,099 | ||||||
|
Inventory
reserves
|
3,339 | 2,045 | ||||||
|
Compensation
reserves
|
2,949 | 2,031 | ||||||
|
Inventory
capitalization
|
2,632 | 1,841 | ||||||
|
Unrealized hedge
losses
|
1,571 | 9,182 | ||||||
|
Bad debt
reserves
|
1,234 | - | ||||||
|
Other
|
1,190 | 1,565 | ||||||
|
Gross deferred tax
assets
|
172,626 | 179,415 | ||||||
|
Less: valuation
allowance
|
(31,743 | ) | (84,881 | ) | ||||
|
Deferred tax
assets, net of allowance
|
$ | 140,883 | $ | 94,534 | ||||
|
Deferred tax
liabilities:
|
||||||||
|
Property, plant,
and equipment
|
$ | (105,829 | ) | $ | (86,650 | ) | ||
|
Intangible
assets
|
(11,581 | ) | (12,273 | ) | ||||
|
Cancellation of
debt income deferral
|
(25,920 | ) | - | |||||
|
Deferred repair
charges
|
(3,288 | ) | (3,619 | ) | ||||
|
Prepaid
expenses
|
(2,300 | ) | (136 | ) | ||||
|
Total deferred tax
liabilities
|
(148,918 | ) | (102,678 | ) | ||||
|
Net deferred tax
liabilities
|
$ | (8,035 | ) | $ | (8,144 | ) | ||
The
valuation allowance for deferred tax assets as of December 31, 2009 and
2008 was $31.7 million and $84.9 million, respectively. The change in
the valuation allowance of $53.2 million relates to the increase in net deferred
tax assets for federal income taxes and for some states, since it is more likely
than not that we will not recognize those benefits as defined in FASB ASC
740.
Income
tax benefits related to the pension prior service liability have been credited
to other comprehensive income. The benefits have been reduced by a valuation
allowance of $4.9 million. Income tax benefits related to hedging
activity have been credited to other comprehensive income, and the benefits have
been reduced by a valuation allowance of $0.7 million.
The
Company’s policy is to record interest paid with respect to income taxes as
interest expense or interest income, respectively, in the consolidated
statements of operations.
The
ultimate realization of deferred tax assets is dependent upon the generation of
future taxable income during the periods in which those temporary differences
become deductible. Based on the unique alternative fuels tax credit
income in 2009 and our lack of historical earnings, management believes it is
more likely than not that the Company will not realize the benefits of those
deductible differences.
The
Company has federal net operating loss carryforwards totaling approximately
$412.1 million on December 31, 2009, which begin to expire in
2026.
71
The
Company has state net operating loss carryforwards totaling approximately $204.9
million on December 31, 2009, which begin to expire in 2011.
The
Company is subject to various federal, state, and local income tax audits for
the tax years ended December 31, 2006 through 2009. As of the current
date there are two ongoing federal excise tax audits, both of which relate to
the alternative fuels tax credits.
18. COMMITMENTS
AND CONTINGENCIES
Operating Leases
— The Company has entered into operating lease agreements, which expire
at various dates through 2014, related to certain machinery and equipment used
in its manufacturing process. Rental expense under operating leases
amounted to $6.8 million, $6.6 million and $6.1 million for the years ended
December 31, 2009, 2008 and 2007, respectively.
The
following, as of December 31, 2009, represents the future minimum rental
payments due under non-cancelable operating leases that have initial or
remaining lease terms in excess of one year:
|
(In thousands of U.S.
dollars)
|
||||
|
2010
|
$ | 5,180 | ||
|
2011
|
3,647 | |||
|
2012
|
2,638 | |||
|
2013
|
1,361 | |||
|
2014
|
810 | |||
|
Thereafter
|
2,516 | |||
|
Total
|
$ | 16,152 | ||
Purchase
obligations — The Company has entered into unconditional purchase
obligations in the ordinary course of business for the purchase of certain raw
materials, energy, and services. At December 31, 2009, total
unconditional purchase obligations were $747.1 million, due as follows:
2010–$130.5 million; 2011–$88.5 million; 2012–$86.6 million;
2013–$86.6 million; 2014– $87.6; and thereafter–$267.3
million.
Employee
Severance Plan — Under the
employee severance plan, each of our named executive officers is eligible
to receive a termination allowance in the event of a termination of employment
due to certain events, including the executive’s job elimination, a facility
closing, the executive’s disability, or the executive’s inability to perform the
requisite duties of his position despite his reasonable efforts.
The
termination allowance is a lump sum amount equal to a factor based on the number
of years or partial years of applicable service with the company, multiplied by
the amount of two weeks of base salary. The termination allowance may
not be less than the amount of four weeks of base salary. In addition
to the termination allowance under the Verso Paper Employee Severance Plan, it
is our practice to provide a pro rata amount of annual VIP bonus compensation
that would have otherwise been paid to the executive officer if employment had
continued through the end of the applicable calendar year.
Thilmany, LLC
— In connection with the Acquisition, the
Company assumed a twelve-year supply agreement with Thilmany, LLC, or
“Thilmany,” for the specialty paper products manufactured on paper machine no. 5
at the Androscoggin mill. The agreement requires
Thilmany to pay the Company a variable charge for the paper purchased and a
fixed charge for the availability of the no. 5 paper machine. The
Company is responsible for the machine’s routine maintenance and Thilmany is
responsible for any capital expenditures specific to the
machine. Thilmany has the right to terminate the agreement if certain
events occur.
72
In October 2009, Thilmany (together with
its parent company, Packaging Dynamics Corporation) served the Company with a
lawsuit filed in circuit court in Outagamie County, Wisconsin. Thilmany alleges in the
lawsuit that the alternative fuel mixture tax credits that the Company has
received from the operation of the Androscoggin mill have had the effect of
reducing the Company’s costs associated with operating the Androscoggin mill and
producing the pulp that the Company uses to manufacture paper products for
Thilmany on paper machine
no. 5 under the supply
agreement between the parties. Thilmany seeks unspecified damages for
the Company’s alleged breach of contract for failing to provide Thilmany with a
prorated share of the purported cost savings attributable to the tax credits and
a declaration that Thilmany is entitled to a prorated share of any such future
costs savings attributable to the Company’s use of alternative fuel mixtures at
the Androscoggin mill. In
November 2009, the Company filed responsive pleadings with the court
in which it denied Thilmany’s claims and requested that Packaging Dynamics
Corporation be dismissed from the lawsuit.
The
Company is involved in legal proceedings incidental to the conduct of its
business. The Company does not believe that any liability that may
result from these proceedings will have a material adverse effect on its
financial statements.
73
19.
INFORMATION BY INDUSTRY SEGMENT
The
Company operates in three operating segments; coated and supercalendered papers;
hardwood market pulp; and other, consisting of specialty papers. The
Company operates in one geographic segment, the United States. The
Company’s core business platform is as a producer of coated freesheet, coated
groundwood, and uncoated supercalendered papers. These products serve
customers in the catalog, magazine, inserts, and commercial print
markets.
The
following table summarizes the industry segments for the years ended December
31, 2009, 2008, and 2007:
|
Year Ended December
31,
|
||||||||||||
|
(In thousands of U.S.
dollars)
|
2009
|
2008
|
2007
|
|||||||||
|
Net Sales:
|
||||||||||||
|
Coated and
supercalendered
|
$ | 1,198,758 | $ | 1,575,005 | $ | 1,443,170 | ||||||
|
Hardwood market
pulp
|
104,541 | 146,443 | 148,007 | |||||||||
|
Other
|
57,555 | 45,365 | 37,576 | |||||||||
|
Total
|
$ | 1,360,854 | $ | 1,766,813 | $ | 1,628,753 | ||||||
|
Operating Income
(Loss):
|
||||||||||||
|
Coated and
supercalendered
|
$ | (57,474 | ) | 36,885 | $ | (1,504 | ) | |||||
|
Hardwood market
pulp
|
(12,548 | ) | 29,931 | 35,808 | ||||||||
|
Other
|
(7,417 | ) | (4,790 | ) | (4,335 | ) | ||||||
|
Total
|
$ | (77,439 | ) | $ | 62,026 | $ | 29,969 | |||||
|
Depreciation, Amortization, and
Depletion:
|
||||||||||||
|
Coated and
supercalendered
|
$ | 110,415 | $ | 112,928 | $ | 102,161 | ||||||
|
Hardwood market
pulp
|
17,916 | 18,385 | 18,278 | |||||||||
|
Other
|
4,351 | 3,145 | 2,778 | |||||||||
|
Total
|
$ | 132,682 | $ | 134,458 | $ | 123,217 | ||||||
|
Capital
Spending:
|
||||||||||||
|
Coated and
supercalendered
|
$ | 28,604 | $ | 69,029 | $ | 65,179 | ||||||
|
Hardwood market
pulp
|
3,869 | 8,604 | 2,649 | |||||||||
|
Other
|
1,743 | 3,753 | 3,036 | |||||||||
|
Total
|
$ | 34,216 | $ | 81,386 | $ | 70,864 | ||||||
74
20.
QUARTERLY DATA
Our
quarterly financial data (unaudited) is as follows:
|
2009
|
2008
|
|||||||||||||||||||||||||||||||
|
(In millions
of U.S. dollars
|
Fourth
|
Third
|
Second
|
First
|
Fourth
|
Third
|
Second
|
First
|
||||||||||||||||||||||||
|
except per
share data)
|
Quarter
|
Quarter
|
Quarter
|
Quarter
|
Quarter
|
Quarter
|
Quarter
|
Quarter
|
||||||||||||||||||||||||
|
Summary Statement of Operations
Data:
|
||||||||||||||||||||||||||||||||
|
Net sales
|
$ | 381.0 | $ | 394.7 | $ | 298.1 | $ | 287.1 | $ | 375.9 | $ | 485.4 | $ | 451.6 | $ | 453.9 | ||||||||||||||||
|
Gross margin
(1)
|
44.3 | 56.2 | (0.4 | ) | 18.1 | 51.3 | 99.4 | 74.4 | 78.5 | |||||||||||||||||||||||
|
Cost of products
sold
|
368.8 | 371.8 | 331.5 | 303.3 | 358.4 | 419.8 | 411.9 | 407.6 | ||||||||||||||||||||||||
|
Selling,
general, and administrative expenses
|
16.5 | 15.1 | 14.9 | 15.4 | 20.9 | 18.3 | 26.3 | 14.2 | ||||||||||||||||||||||||
|
Restructuring and other
charges
|
0.3 | 0.4 | 0.1 | 0.2 | 0.9 | 1.1 | 23.7 | 1.7 | ||||||||||||||||||||||||
|
Interest
income
|
(0.1 | ) | (0.1 | ) | - | (0.1 | ) | (0.3 | ) | (0.2 | ) | (0.1 | ) | (0.2 | ) | |||||||||||||||||
|
Interest expense
|
33.5 | 34.3 | 28.5 | 27.1 | 29.6 | 27.8 | 34.5 | 33.7 | ||||||||||||||||||||||||
|
Other income,
net
|
(57.0 | ) | (70.3 | ) | (66.7 | ) | (113.3 | ) | - | - | - | - | ||||||||||||||||||||
|
Provision for income
taxes
|
0.8 | - | - | - | - | - | - | - | ||||||||||||||||||||||||
|
Net income
(loss)
|
18.2 | 43.5 | (10.2 | ) | 54.5 | (33.6 | ) | 18.6 | (44.7 | ) | (3.1 | ) | ||||||||||||||||||||
|
Share Data:
|
||||||||||||||||||||||||||||||||
|
Earnings (loss) per
share:
|
||||||||||||||||||||||||||||||||
|
Basic
|
$ | 0.35 | $ | 0.84 | $ | (0.20 | ) | $ | 1.05 | $ | (0.64 | ) | $ | 0.36 | $ | (1.00 | ) | $ | (0.08 | ) | ||||||||||||
|
Diluted
|
0.35 | 0.83 | (0.20 | ) | 1.05 | (0.64 | ) | 0.36 | (1.00 | ) | (0.08 | ) | ||||||||||||||||||||
|
Weighted
average common shares outstanding
(thousands):
|
||||||||||||||||||||||||||||||||
|
Basic
|
52,375 | 52,082 | 52,047 | 52,047 | 52,047 | 52,047 | 44,508 | 38,047 | ||||||||||||||||||||||||
|
Diluted
|
52,409 | 52,116 | 52,047 | 52,047 | 52,047 | 52,047 | 44,508 | 38,047 | ||||||||||||||||||||||||
|
Dividends declared per
share
|
$ | - | $ | - | $ | - | $ | - | $ | 0.03 | $ | 0.03 | $ | - | n/a | |||||||||||||||||
|
Closing price per
share:
|
||||||||||||||||||||||||||||||||
|
High
|
$ | 3.49 | $ | 3.69 | $ | 1.89 | $ | 1.30 | $ | 2.24 | $ | 7.84 | $ | 10.80 | n/a | |||||||||||||||||
|
Low
|
2.22 | 1.11 | 0.54 | 0.34 | 0.93 | 2.46 | 8.00 | n/a | ||||||||||||||||||||||||
|
Period-end
|
2.61 | 2.99 | 1.23 | 0.64 | 1.03 | 2.64 | 8.46 | n/a | ||||||||||||||||||||||||
(1) Gross margin represents net sales
less cost of products sold, excluding depreciation, amortization, and
depletion.
75
Item 9. Changes in and Disagreements with
Accountants on Accounting and Financial Disclosure
Not
applicable.
Item
9A. Controls and Procedures
Evaluation
of Disclosure Controls and Procedures
We
maintain disclosure controls and procedures that are designed to provide
reasonable assurance that information required to be disclosed in reports that
we file and submit under the Securities Exchange Act of 1934 is recorded,
processed, summarized and reported within the time periods specified in the
SEC’s rules and forms and is accumulated and communicated to our management,
including our Chief Executive Officer and Chief Financial Officer, as
appropriate to allow timely decisions regarding required
disclosure.
There are
inherent limitations to the effectiveness of any disclosure controls and
procedures, including the possibility of human error or the circumvention or
overriding of the controls and procedures, and even effective disclosure
controls and procedures can provide only reasonable assurance of achieving their
objectives. Our disclosure controls and procedures are designed to
provide reasonable assurance of achieving their objectives.
Our
management, with the participation of our Chief Executive Officer and Chief
Financial Officer, evaluated the effectiveness of the design and operation of
our disclosure controls and procedures as of December 31, 2009. Based
upon this evaluation, and subject to the foregoing, our Chief Executive Officer
and Chief Financial Officer concluded that our disclosure controls and
procedures were effective at the reasonable assurance level as of
December 31, 2009.
Management’s
Report on Internal Control Over Financial Reporting
Management’s
report on our internal control over financial reporting is included in Item 8,
Financial Statements and Supplementary Data, of this Annual Report on Form
10-K.
Changes
in Internal Control Over Financial Reporting
In Item
4T of our Quarterly Report on Form 10-Q for the fiscal quarter ended September
30, 2009, management reported that as of September 30, 2009, it did not maintain
operating effectiveness of certain internal controls over financial reporting
relating to the cash disbursement process, and as a result, a material weakness
in our internal control over financial reporting existed as of September
30, 2009.
In the
fourth quarter of 2009, the following controls were implemented to ensure the
accuracy of our consolidated financial statements and to prevent or detect
potential material misstatements on a timely basis:
· We
implemented enhanced controls over the cash disbursement process ensuring
validity of the transactions processed.
· We
implemented new controls over review of related journal entries.
· We
enhanced segregation of duty controls over the preparation and review of
accounts payable related account reconciliations.
Management
has evaluated the design of these new controls and procedures and subjected them
to appropriate testing, and concluded that they are operating
effectively.
There was
no other change in our internal control over financial reporting during the
fiscal quarter ended December 31, 2009, that has materially affected,
or is reasonably likely to materially affect, our internal control
over financial reporting.
Item
9B. Other Information
Not
applicable.
76
PART
III
Item 10. Directors, Executive
Officers and Corporate Governance
The
information required by this item is incorporated by reference from the
definitive proxy statement to be filed within 120 days after
December 31, 2009, pursuant to Regulation 14A under the Securities
Exchange Act of 1934 in connection with our 2010 annual meeting of
stockholders.
Item 11. Executive
Compensation
The
information required by this item is incorporated by reference from the
definitive proxy statement to be filed within 120 days after
December 31, 2009, pursuant to Regulation 14A under the Securities
Exchange Act of 1934 in connection with our 2010 annual meeting of
stockholders.
Item 12. Security Ownership
of Certain Beneficial Owners and Management and Related Stockholder
Matters
The
information required by this item is incorporated by reference from the
definitive proxy statement to be filed within 120 days after
December 31, 2009, pursuant to Regulation 14A under the Securities
Exchange Act of 1934 in connection with our 2010 annual meeting of
stockholders.
Item 13. Certain
Relationships and Related Transactions, and Director Independence
The
information required by this item is incorporated by reference from the
definitive proxy statement to be filed within 120 days after
December 31, 2009, pursuant to Regulation 14A under the Securities
Exchange Act of 1934 in connection with our 2010 annual meeting of
stockholders.
Item 14. Principal Accountant
Fees and Services
The
information required by this item is incorporated by reference from the
definitive proxy statement to be filed within 120 days after
December 31, 2009, pursuant to Regulation 14A under the Securities
Exchange Act of 1934 in connection with our 2010 annual meeting of
stockholders.
77
Part IV
Item 15. Exhibits and
Financial Statement Schedule
Financial
Statements
See the
Index to Financial Statements in “Financial Statements and Supplementary
Data.”
Financial
Statement Schedules
See
Schedule I – Valuation Accounts and the report thereon of Deloitte & Touche
LLP, Independent Registered Public Accounting Firm, on page S-1 of this annual
report.
Exhibits
The
following exhibits are included with this report:
|
Exhibit
Number
|
Description
of Exhibit
|
|
|
2.1
|
Agreement
of Purchase and Sale dated as of June 4, 2006, among International Paper
Company, Verso Paper Investments LP and Verso Paper LLC,(1) as amended by
Amendment No. 1 to Agreement of Purchase and Sale, dated as of August 1,
2006, among International Paper Company, Verso Paper Investments LP and
Verso Paper LLC,(2) and Amendment No. 2 to Agreement of Purchase and Sale,
dated as of May 31, 2007, among International Paper Company, Verso Paper
Investments LP and Verso Paper LLC.(2)
|
|
|
3.1
|
Amended
and Restated Certificate of Incorporation of Verso Paper
Corp.(2)
|
|
|
3.2
|
Amended
and Restated Bylaws of Verso Paper Corp.(2)
|
|
|
4.1
|
Specimen
common stock certificate of Verso Paper Corp.(2)
|
|
|
4.2
|
Indenture
relating to the 9⅛% Second Priority Senior Secured Fixed Rate Notes due
2014 and the Second Priority Senior Secured Floating Rate Notes due 2014,
dated as of August 1, 2006, among Verso Paper Holdings LLC, Verso Paper
Inc., the Guarantors named therein, and Wilmington Trust Company, as
Trustee.(1)
|
|
|
4.3
|
Indenture
relating to the 11⅜% Senior Subordinated Notes due 2016, dated as of
August 1, 2006, among Verso Paper Holdings LLC, Verso Paper Inc., the
Guarantors named therein, and Wilmington Trust Company, as
Trustee.(1)
|
|
|
4.4
|
Collateral
Agreement dated as of August 1, 2006, among Verso Paper Holdings LLC,
Verso Paper Inc., the Subsidiaries named therein, and Wilmington Trust
Company, as Collateral Agent.(3)
|
|
|
4.5
|
Indenture
dated as of June 11, 2009, among Verso Paper Holdings LLC, Verso Paper
Inc., the guarantors named therein, and Wilmington Trust FSB, as
trustee.(4)
|
|
|
4.6
|
Registration
Rights Agreement, dated as of June 11, 2009, among Verso Paper Holdings
LLC, Verso Paper Inc., the guarantors named therein, and Credit Suisse
Securities (USA) LLC and Citigroup Global Markets Inc., as initial
purchasers.(4)
|
|
|
4.7
|
Supplemental
Indenture, dated as of January 15, 2010, among Verso Paper Holdings LLC,
Verso Paper Inc., the guarantors named therein, and Wilmington Trust FSB,
as trustee.(5)
|
78
|
4.8
|
Registration
Rights Agreement, dated as of January 15, 2010, among Verso Paper Holdings
LLC, Verso Paper Inc., the guarantors named therein, and Credit Suisse
Securities (USA) LLC, as initial purchaser.(5)
|
|
|
10.1
|
Amended
and Restated Credit Agreement dated as of June 3, 2009, among Verso Paper
Finance Holdings LLC, Verso Paper Holdings LLC, the lenders party thereto,
Credit Suisse, Cayman Islands Branch, as administrative agent, Lehman
Brothers Inc., as syndication agent, Citigroup Global Markets Inc. and
Bank of America Securities LLC, as co-documentation agents, and Credit
Suisse Securities (USA) LLC and Lehman Brothers Inc., as joint bookrunners
and co-lead arrangers.(3)
|
|
|
10.2
|
Amended
and Restated Guarantee and Collateral Agreement dated as of June 11, 2009,
among Verso Paper Finance Holdings LLC, Verso Paper Holdings LLC, each
other Pledgor identified therein, Credit Suisse, Cayman Islands Branch, as
administrative agent for the secured parties, Credit Suisse, Cayman
Islands Branch, as credit agreement authorized representative, Wilmington
Trust FSB, as note authorized representative, and each additional
authorized representative from time to time party
thereto.(3)
|
|
|
10.3
|
Third
Amended and Restated Limited Partnership Agreement of Verso Paper
Management LP dated as of May 20, 2008 (form).(2)
|
|
|
10.4
|
Registration
Rights Agreement among Verso Paper Investments LP and the individual
limited partners of Verso Paper Management LP
(form).(2)
|
|
|
10.5
|
Intellectual
Property Security Agreement dated as of August 1, 2006, made by Verso
Paper Finance Holdings LLC, Verso Paper Holdings LLC, Verso Paper Inc.,
Verso Paper LLC, Verso Androscoggin LLC, Verso Bucksport LLC, Verso
Quinnesec LLC, Verso Sartell LLC and NexTier Solutions Corporation in
favor of Credit Suisse, Cayman Islands Branch, as Administrative
Agent.(1)
|
|
|
10.6
|
Intellectual
Property Security Agreement dated as of August 1, 2006, made by Verso
Paper Holdings LLC, Verso Paper Inc., Verso Paper LLC, Verso Androscoggin
LLC, Verso Bucksport LLC, Verso Quinnesec LLC, Verso Sartell LLC, and
Nextier Solutions Corporation in favor of Wilmington Trust Company, as
Collateral Agent.(1)
|
|
|
10.7
|
Intercreditor
Agreement dated as August 1, 2006, among Credit Suisse, Cayman Islands
Branch, as Intercreditor Agent, Wilmington Trust Company, as Trustee,
Verso Paper Finance Holdings LLC, Verso Paper Holdings LLC, and the
Subsidiaries named therein.(1)
|
|
|
10.8
|
Credit
Agreement dated January 31, 2007, among Verso Paper Finance Holdings LLC,
Verso Paper Finance Holdings Inc., the Lenders party thereto, Credit
Suisse, as Administrative Agent, and Citigroup Global Markets Inc., as
Syndication Agent.(2)
|
|
|
10.9
|
Management
and Transaction Fee Agreement dated as of August 1, 2006, among Verso
Paper LLC, Verso Paper Investments LP, Apollo Management V, L.P. and
Apollo Management VI, L.P.(1)
|
|
|
10.10*
|
Verso
Paper Corp. 2008 Incentive Award Plan (form),(2) as amended by the First
Amendment to Verso Paper Corp. 2008 Incentive Award
Plan.(6)
|
|
|
10.11*
|
Form
of Verso Paper Corp. 2008 Incentive Award Plan Stock Option Grant Notice
and Stock Option Agreement for Non-Employee
Directors.(6)
|
|
|
10.12*
|
Form
of Verso Paper Corp. 2008 Incentive Award Plan Stock Option Grant Notice
and Stock Option
Agreement.(7)
|
79
|
10.13*
|
Form
of Verso Paper Corp. 2008 Incentive Award Plan Restricted Stock Award
Grant Notice and Restricted Stock Award Agreement.(7)
|
|
|
10.14*
|
Verso
Paper Corp. Senior Executive Incentive Bonus Plan
(form).(2)
|
|
|
10.15*
|
2009
Long-Term Cash Award Program for Executives effective as of January 1,
2009, pursuant to the Verso Paper Corp. Senior Executive Bonus
Plan.(3)
|
|
|
10.16*
|
Employment
Agreement dated as of November 16, 2006, between Mike Jackson and Verso
Paper Holdings LLC,(1) as supplemented by the Letter Agreement dated as of
November 16, 2006, between Verso Paper Holdings LLC and Mike Jackson,(1)
and as amended by the First Amendment to Employment Agreement dated as of
January 1, 2008, between Mike Jackson and Verso Paper Holdings LLC,(2) and
the Second Amendment to Employment Agreement dated as of December 31,
2008, between Mike Jackson and Verso Paper Holdings
LLC.(8)
|
|
|
10.17*
|
Letter
Agreement dated as of February 16, 2007, between Verso Paper Management LP
and Mike Jackson.(1)
|
|
|
10.18*
|
Confidentiality
and Non-Competition Agreement dated as of January 1, 2008, between Verso
Paper Holdings LLC and Lyle J. Fellows,(2) as amended by the First
Amendment to Confidentiality and Non Competition Agreement dated as of
December 31, 2008, between Verso Paper Holdings LLC and Lyle J.
Fellows.(8)
|
|
|
10.19*
|
Confidentiality
and Non-Competition Agreement dated as of January 1, 2008, between Verso
Paper Holdings LLC and Michael A. Weinhold,(2) as amended by the First
Amendment to Confidentiality and Non Competition Agreement dated as of
December 31, 2008, between Verso Paper Holdings LLC and Michael A.
Weinhold.(8)
|
|
|
10.20*
|
Confidentiality
and Non-Competition Agreement dated as of January 1, 2008, between Verso
Paper Holdings LLC and Robert P. Mundy,(2) as amended by the First
Amendment to Confidentiality and Non Competition Agreement dated as of
December 31, 2008, between Verso Paper Holdings LLC and Robert P.
Mundy.(8)
|
|
|
10.21*
|
Confidentiality
and Non-Competition Agreement dated as of January 1, 2008, between Verso
Paper Holdings LLC and Peter H. Kesser,(2) as amended by the First
Amendment to Confidentiality and Non Competition Agreement dated as of
December 31, 2008, between Verso Paper Holdings LLC and Peter H.
Kesser.(8)
|
|
|
10.22*
|
Confidentiality
and Non-Competition Agreement dated as of January 1, 2008, between Verso
Paper Holdings LLC and Ricardo Moncada, as amended by the First Amendment
to Confidentiality and Non Competition Agreement dated as of December 31,
2008, between Verso Paper Holdings LLC and Ricardo
Moncada.
|
|
|
10.23*
|
Letter
Agreement dated as of November 1, 2006, between Verso Paper Management LP
and L.H. Puckett.(1)
|
|
|
10.24*
|
Indemnification
Agreement between Verso Paper Corp. and its directors and executive
officers (form).(2)
|
|
|
10.25*
|
Verso
Paper Deferred Compensation Plan, consisting of The CORPORATEplan for
RetirementSM Executive Plan, Basic Plan Document, effective as of February
15, 2007, as amended and restated by the Adoption Agreement effective as
of December 1, 2008, as further amended by the Verso Paper Deferred
Compensation Plan Amendment effective as of April 10, 2009, and as further
amended by the Second Amendment to Verso Paper Deferred Compensation Plan
effective as of December 23,
2009.(9)
|
80
|
10.26*
|
Executive
Retirement Program effective as of January 1, 2010.(9)
|
|
|
21
|
Subsidiaries
of Verso Paper Corp.
|
|
|
23.1
|
Consent
of Deloitte & Touche LLP, Independent Registered Public Accounting
Firm.
|
|
|
23.2
|
Consent
of Resource Information Systems, Inc.
|
|
|
31.1
|
Certification
of Principal Executive Officer pursuant to Rule 13a-14(a) under Securities
Exchange Act of 1934.
|
|
|
31.2
|
Certification
of Principal Financial Officer pursuant to Rule 13a-14(a) under Securities
Exchange Act of 1934.
|
|
|
32.1
|
Certification
of Principal Executive Officer pursuant to Rule 13a-14(b) under Securities
Exchange Act of 1934 and Section 1350 of Chapter 63 of Title 18 of United
States Code.
|
|
|
32.2
|
Certification
of Principal Financial Officer pursuant to Rule 13a-14(b) under Securities
Exchange Act of 1934 and Section 1350 of Chapter 63 of Title 18 of the
United States Code.
|
|
(1)
|
Incorporated
by reference to the Registration Statement of Verso Paper Holdings LLC on
Form S-4 (Registration No. 333-142283), as
amended.
|
|
(2)
|
Incorporated
by reference to our Registration Statement on Form S-1 (Registration No.
333-148201) filed with the Securities and Exchange Commission (the “SEC”)
on December 20, 2007, as amended.
|
|
(3)
|
Incorporated
by reference to our Quarterly Report on Form 10-Q for the fiscal quarter
ended June 30, 2009.
|
|
(4)
|
Incorporated
by reference to our Current Report on Form 8-K filed with the SEC on June
11, 2009.
|
|
(5)
|
Incorporated
by reference to our Current Report on Form 8-K filed with the SEC on
January 15, 2010.
|
|
(6)
|
Incorporated
by reference to our Annual Report on Form 10-K for the fiscal year ended
December 31, 2008.
|
|
(7)
|
Incorporated
by reference to our Current Report on Form 8-K filed with the SEC on
September 25, 2009.
|
|
(8)
|
Incorporated
by reference to our Current Report on Form 8-K filed with the SEC on
January 2, 2009.
|
|
(9)
|
Incorporated
by reference to our Current Report on Form 8-K filed with the SEC on
December 30, 2009.
|
|
*
|
An
asterisk denotes a management contract or compensatory plan or
arrangement.
|
81
SIGNATURES
Pursuant
to the requirements of Section 13 or 15(d) of the Securities Exchange Act of
1934, the registrant has duly caused this report to be signed on its behalf by
the undersigned thereunto duly authorized.
|
Date: March
3, 2010
|
||||
|
VERSO PAPER
CORP.
|
||||
|
By:
|
/s/
Michael A. Jackson
|
|||
|
Michael
A. Jackson
President
and Chief Executive Officer
|
||||
|
By:
|
/s/
Robert P. Mundy
|
|||
|
Robert
P. Mundy
Senior
Vice President and Chief Financial
Officer
|
Pursuant
to the requirements of the Securities Exchange Act of 1934, this report has been
signed below by the following persons on behalf of the registrant and in the
capacities and on the dates indicated.
|
Signature
|
Position
|
Date
|
|
|
/s/
Michael A. Jackson
|
March
3, 2010
|
||
|
Michael
A. Jackson
|
President,
Chief Executive Officer and Director
(Principal
Executive Officer)
|
||
|
/s/
Robert P. Mundy
|
March
3, 2010
|
||
|
Robert
P. Mundy
|
Senior
Vice President and Chief Financial
Officer
(Principal Financial and Accounting Officer)
|
||
|
/s/
Michael E. Ducey
|
March
3, 2010
|
||
|
Michael
E. Ducey
|
Director
|
||
|
/s/
Thomas Gutierrez
|
March
3, 2010
|
||
|
Thomas
Gutierrez
|
Director
|
||
|
/s/
Scott M. Kleinman
|
|||
|
Scott
M. Kleinman
|
Director
|
March
3, 2010
|
|
|
/s/
David W. Oskin
|
|||
|
David
W. Oskin
|
Director
|
March
3, 2010
|
|
|
/s/
Eric L. Press
|
|||
|
Eric
L. Press
|
Director
|
March
3, 2010
|
|
|
/s/
L.H. Puckett, Jr.
|
|||
|
L.H.
Puckett, Jr.
|
Director
|
March
3, 2010
|
|
|
/s/
David B. Sambur
|
|||
|
David
B. Sambur
|
Director
|
March
3, 2010
|
|
|
/s/
Jordan C. Zaken
|
March
3, 2010
|
||
|
Jordan
C. Zaken
|
Director
|
||
82
REPORT
OF DELOITTE & TOUCHE LLP, INDEPENDENT REGISTERED PUBLIC ACCOUNTING FIRM, ON
FINANCIAL STATEMENT SCHEDULE
To the
Board of Directors and Stockholders of Verso Paper Corp.:
We have
audited the consolidated and combined financial statements of Verso Paper Corp.
(the “Company”), a majority-owned subsidiary of Verso Paper Management LP, as of
December 31, 2009 and 2008, and for each of the three years in the period ended
December 31, 2009, and the Company's internal control over financial reporting
as of December 31, 2009, and have issued our reports thereon dated March 2,
2010; such consolidated and combined financial statements and reports are
included elsewhere in this Form 10-K. Our audits also included the financial
statement schedule of the Company listed in the accompanying index at Item 15.
This financial statement schedule is the responsibility of the Company's
management. Our responsibility is to express an opinion based on our audits. In
our opinion, such financial statement schedule, when considered in relation to
the basic consolidated and combined financial statements taken as a whole,
present fairly, in all material respects, the information set forth
therein.
/s/ Deloitte & Touche
LLP
Memphis, Tennessee
March 2,
2010
S-1
Schedule I – Valuation
Accounts
Verso Paper Corp.
For the Years Ended December 31,
2007, 2008, and 2009
|
Balance at
|
Charged to
|
Charge-off
|
Balance
|
|||||||||||||
|
Beginning
|
Cost and
|
Against
|
at End of
|
|||||||||||||
|
(in thousands of U.S.
dollars)
|
of Period
|
Expenses
|
Allowances
|
Period
|
||||||||||||
|
Allowance for uncollectible
accounts included under
|
||||||||||||||||
|
the balance sheet caption
"Accounts receivable"
|
||||||||||||||||
|
Year Ended December 31,
2007
|
$ | 1,937 | $ | (258 | ) | $ | (2 | ) | $ | 1,677 | ||||||
|
Year Ended December 31,
2008
|
$ | 1,677 | $ | 999 | $ | (783 | ) | $ | 1,893 | |||||||
|
Year Ended December 31,
2009
|
$ | 1,893 | $ | 432 | $ | (1,356 | ) | $ | 969 | |||||||
S-2