Attached files
| file | filename |
|---|---|
| EX-99.1 - EX-99.1 - ROYAL GOLD INC | rgld-20200506xex99d1.htm |
| 8-K - 8-K - ROYAL GOLD INC | rgld-20200507x8k.htm |
Exhibit 99.2
| NASDAQ: RGLD May 7, 2020 Fiscal Q3 2020 Results |
| 2 Cautionary Statement Cautionary “Safe Harbor” Statement Under the Private Securities Litigation Reform Act of 1995: This presentation includes “forward-looking statements” within the meaning of U.S. federal securities laws. Forward-looking statements are any statements other than statements of historical fact. Forward-looking statements are not guarantees of future performance, and actual results may differ materially from these statements. Forward-looking statements are often identified by words like “will,” “may,” “could,” “should,” “would,” “believe,” “estimate,” “expect,” “anticipate,” “plan,” “forecast,” “potential,” “intend,” “continue,” “project,” or negatives of these words or similar expressions. Forward-looking statements include, among others, the following: statements about our expected financial performance, including revenue, expenses, earnings or cash flow; operators’ expected operating and financial performance, including production, deliveries, mine plans and reserves, development, cash flows and capital expenditures; planned and potential acquisitions or dispositions, including funding schedules and conditions; liquidity, financing and dividends; our overall investment portfolio; macroeconomic and market conditions including the impacts of COVID-19; prices for gold, silver, copper, nickel and other metals; potential impairments; or tax changes. Factors that could cause actual results to differ materially from these forward-looking statements include, among others, the following: a low-price environment for gold, silver, copper, nickel or other metals; operating activities or financial performance of properties on which we hold stream or royalty interests, including variations between actual and forecasted performance, operators’ ability to complete projects on schedule and as planned, changes to mine plans and reserves, liquidity needs, mining and environmental hazards, labor disputes, distribution and supply chain disruptions, permitting and licensing issues, contractual issues involving our stream or royalty agreements; risks associated with doing business in foreign countries; our ability to identify, finance, value and complete acquisitions; adverse economic and market conditions; changes in laws or regulations governing us, operators or operating properties; changes in management and key employees; and other factors described in our reports filed with the Securities and Exchange Commission, including our Form 10-K for the fiscal year ended June 30, 2019, and subsequent Quarterly Reports on Form 10-Q. Most of these factors are beyond our ability to predict or control. Forward-looking statements speak only as of the date on which they are made. We disclaim any obligation to update any forward-looking statements, except as required by law. Readers are cautioned not to put undue reliance on forward-looking statements. Statement Regarding Third-party Information: Certain information provided in this presentation, including production estimates for calendar 2020, has been provided to us by the operators of the relevant properties or is publicly available information filed by these operators with applicable securities regulatory bodies, including the Securities and Exchange Commission. Royal Gold has not verified, and is not in a position to verify, and expressly disclaims any responsibility for the accuracy, completeness or fairness of any such third-party information and refers the reader to the public reports filed by the operators for information regarding those properties. Information in this presentation concerning the Khoemacau Copper Project mine life, construction completion, current staffing levels and activity focus, underground development, cost information and initial deliveries of silver under the streaming agreement was provided to the Company by Cupric Canyon Capital L.P., the privately-held owner and developer of Khoemacau. Such information may not have been prepared in accordance with applicable laws, stock exchange rules or international standards governing preparation and public disclosure of technical data and information relating to mineral properties. Royal Gold has not verified, and is not in a position to verify, and expressly disclaims any responsibility for the accuracy, completeness or fairness of this third-party information, and investors are cautioned not to rely upon this information. |
| Today’s Speakers 3 Bill Heissenbuttel President and CEO Paul Libner CFO and Treasurer Mark Isto Executive VP and COO |

| Q3 2020 Overview Highlights Revenue of $136.4M Volume of 86,200 GEOs1 $38.6M net income, or $0.59/share • $0.68/share, adjusted to exclude2: – $0.05/share loss on equity securities – $0.04/share one-time equity compensation expense $99.7M cash flow from operations $18.4M in dividends Balance sheet continues to strengthen Revolver balance reduced by $30.0M ~$1B of liquidity at March 31, 2020 (see slide 11) COVID-19 considerations • $200M drawn on revolver April 3 as precautionary measure • Revolver balance to be managed; focus remains on debt repayment 4 |
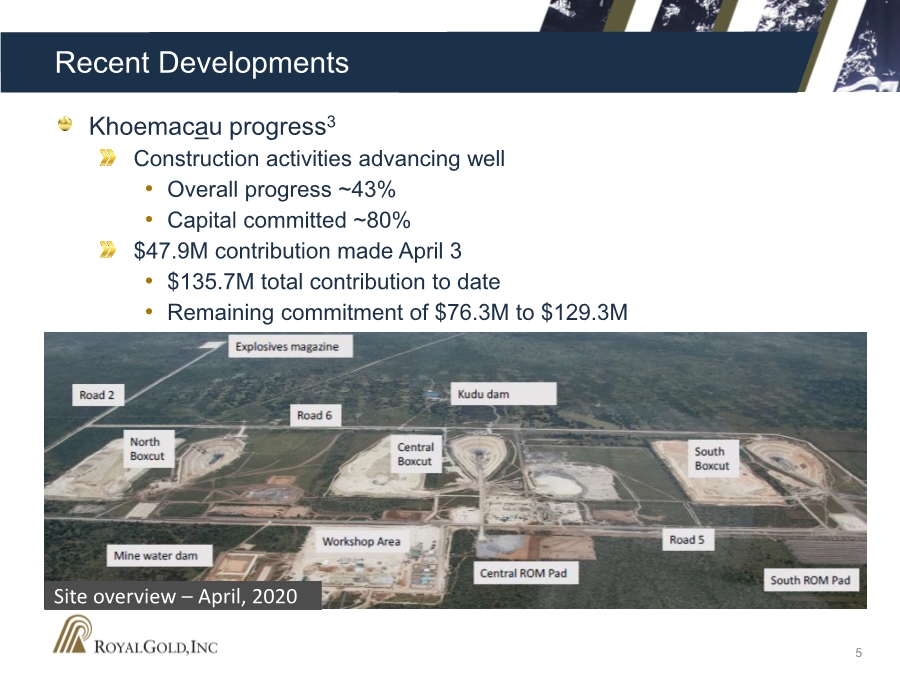
| Recent Developments Khoemacau progress3 Construction activities advancing well • Overall progress ~43% • Capital committed ~80% $47.9M contribution made April 3 • $135.7M total contribution to date • Remaining commitment of $76.3M to $129.3M 5 Site overview – April, 2020 |
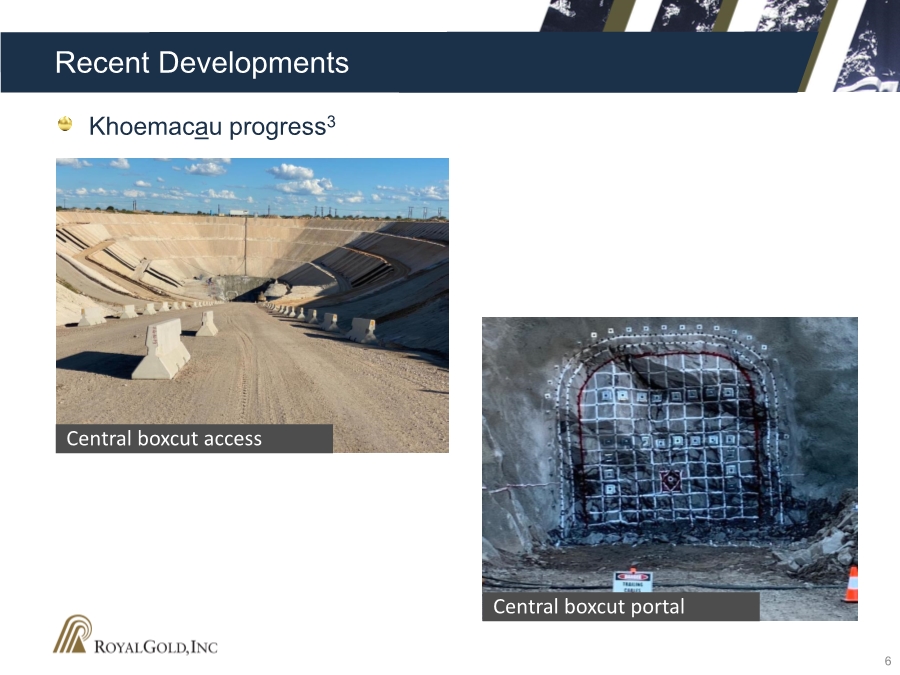
| Recent Developments Khoemacau progress3 6 Central boxcut access Central boxcut portal |
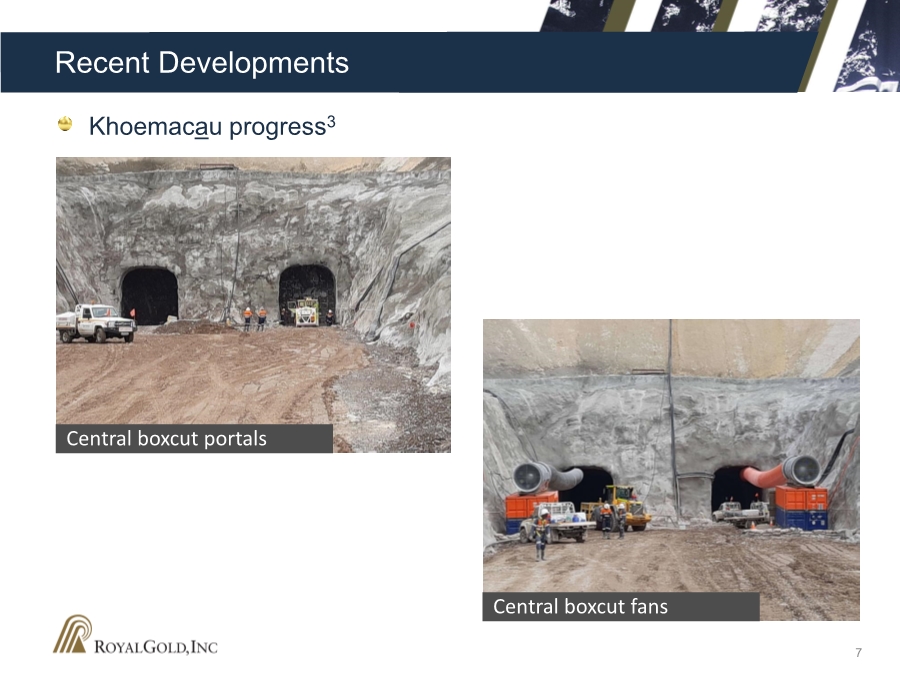
| Recent Developments Khoemacau progress3 7 Central boxcut portals Central boxcut fans |
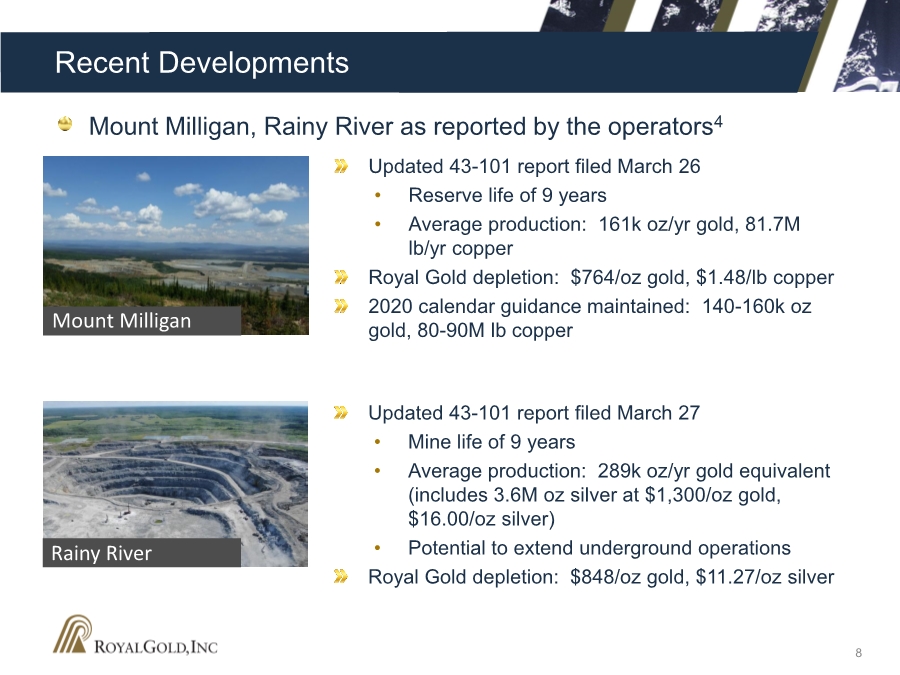
| Recent Developments Mount Milligan, Rainy River as reported by the operators4 8 Updated 43-101 report filed March 26 • Reserve life of 9 years • Average production: 161k oz/yr gold, 81.7M lb/yr copper Royal Gold depletion: $764/oz gold, $1.48/lb copper 2020 calendar guidance maintained: 140-160k oz gold, 80-90M lb copper Updated 43-101 report filed March 27 • Mine life of 9 years • Average production: 289k oz/yr gold equivalent (includes 3.6M oz silver at $1,300/oz gold, $16.00/oz silver) • Potential to extend underground operations Royal Gold depletion: $848/oz gold, $11.27/oz silver Mount Milligan Rainy River |
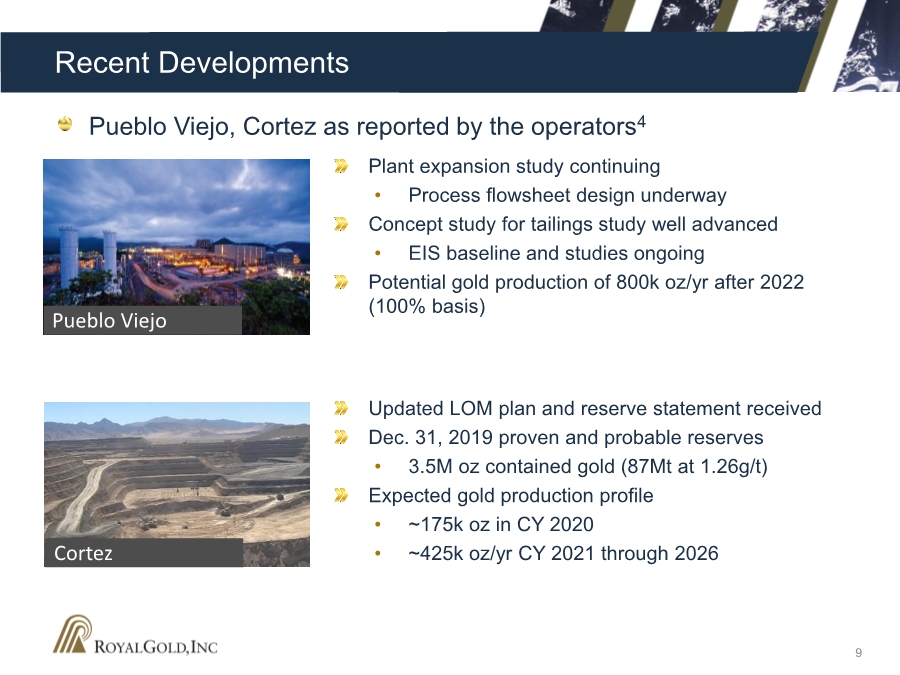
| Recent Developments Pueblo Viejo, Cortez as reported by the operators4 9 Plant expansion study continuing • Process flowsheet design underway Concept study for tailings study well advanced • EIS baseline and studies ongoing Potential gold production of 800k oz/yr after 2022 (100% basis) Updated LOM plan and reserve statement received Dec. 31, 2019 proven and probable reserves • 3.5M oz contained gold (87Mt at 1.26g/t) Expected gold production profile • ~175k oz in CY 2020 • ~425k oz/yr CY 2021 through 2026 Pueblo Viejo Cortez |
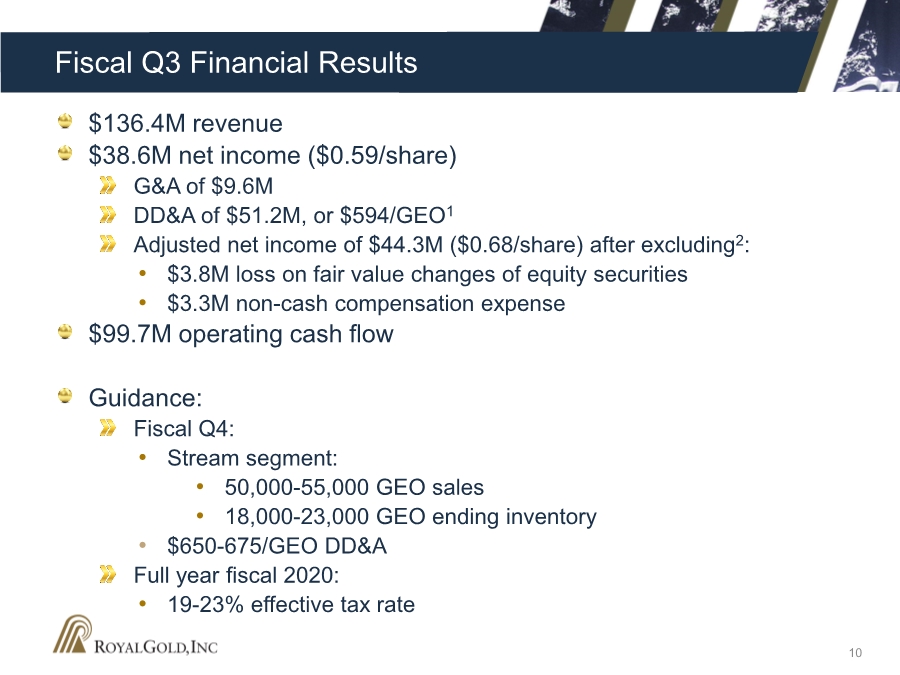
| Fiscal Q3 Financial Results 10 $136.4M revenue $38.6M net income ($0.59/share) G&A of $9.6M DD&A of $51.2M, or $594/GEO1 Adjusted net income of $44.3M ($0.68/share) after excluding2: • $3.8M loss on fair value changes of equity securities • $3.3M non-cash compensation expense $99.7M operating cash flow Guidance: Fiscal Q4: • Stream segment: • 50,000-55,000 GEO sales • 18,000-23,000 GEO ending inventory • $650-675/GEO DD&A Full year fiscal 2020: • 19-23% effective tax rate |
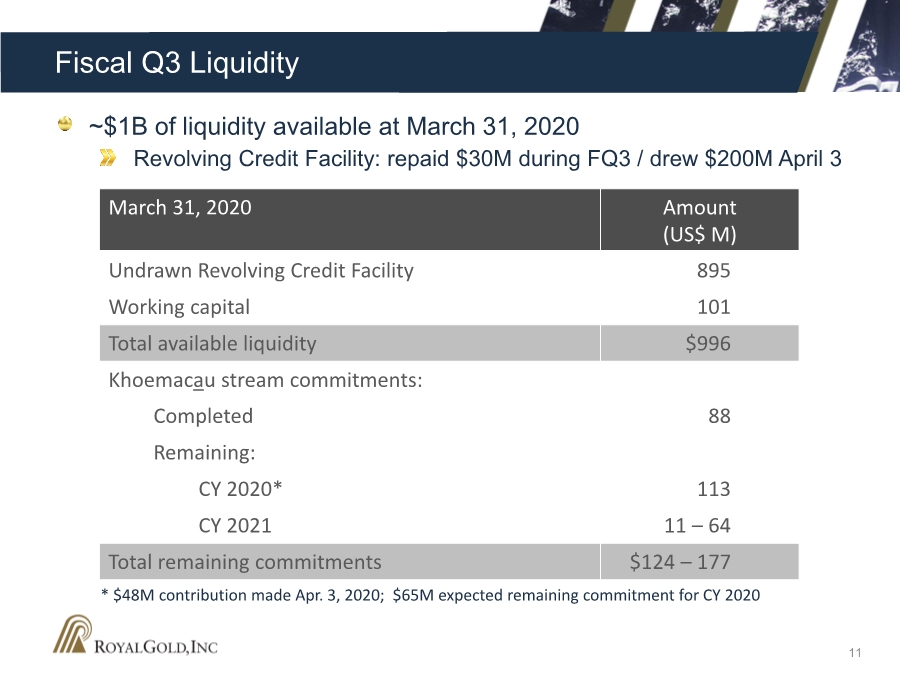
| Fiscal Q3 Liquidity ~$1B of liquidity available at March 31, 2020 Revolving Credit Facility: repaid $30M during FQ3 / drew $200M April 3 11 March 31, 2020 Amount (US$ M) Undrawn Revolving Credit Facility 895 Working capital 101 Total available liquidity $996 Khoemacau stream commitments: Completed 88 Remaining: CY 2020* 113 CY 2021 11 – 64 Total remaining commitments $124 – 177 * $48M contribution made Apr. 3, 2020; $65M expected remaining commitment for CY 2020 |
| Disciplined Strategy, Successful Results Solid operating and financial performance Strong balance sheet Excellent liquidity position Positioned to act on new business opportunities 12 |
| Endnotes |

| Endnotes 1. Gold Equivalent Ounces (“GEOs”) are calculated as reported revenue (in total or by reportable segment) for a period divided by the average gold price for that same period. DD&A per GEO is calculated as reported depreciation, depletion and amortization for a period divided by GEOs for that same period. 2. Adjusted net income and adjusted net income per share are non-GAAP financial measures. See Schedule A to the accompanying press release dated May 6, 2020 for more information. 3. Certain information on this slide was provided to the Company by Khoemacau Copper Mining (Pty.) Limited, the majority owner and developer of the Khoemacau Project. The production, design, engineering, construction and equipment information, and other technical and economic information provided to the Company and presented here, or forming the basis of information presented here, is not publicly available. This information may not have been prepared in accordance with applicable laws, stock exchange rules or international standards governing preparation and public disclosure of technical data and information relating to mineral properties. The Company has not verified, and is not in a position to verify, and expressly disclaims any responsibility for the accuracy, completeness, or fairness of this third- party information, and investors are cautioned not to rely on this information. 4. Except as noted with an asterisk, all information on this slide has been provided by the operators of these properties or is publicly available information disclosed by the operators. 14 |
| 1144 15th St, #2500 Denver, Colorado 80202 303.573.1660 www.royalgold.com NASDAQ: RGLD |