Attached files
| file | filename |
|---|---|
| EX-10.60 - EX-10.60 - ROYAL GOLD INC | a2229433zex-10_60.htm |
| EX-32.2 - EX-32.2 - ROYAL GOLD INC | a2229433zex-32_2.htm |
| EX-32.1 - EX-32.1 - ROYAL GOLD INC | a2229433zex-32_1.htm |
| EX-31.2 - EX-31.2 - ROYAL GOLD INC | a2229433zex-31_2.htm |
| EX-31.1 - EX-31.1 - ROYAL GOLD INC | a2229433zex-31_1.htm |
| EX-23.1 - EX-23.1 - ROYAL GOLD INC | a2229433zex-23_1.htm |
| EX-21.1 - EX-21.1 - ROYAL GOLD INC | a2229433zex-21_1.htm |
| EX-10.61 - EX-10.61 - ROYAL GOLD INC | a2229433zex-10_61.htm |
| EX-10.59 - EX-10.59 - ROYAL GOLD INC | a2229433zex-10_59.htm |
| EX-10.58 - EX-10.58 - ROYAL GOLD INC | a2229433zex-10_58.htm |
| EX-10.57 - EX-10.57 - ROYAL GOLD INC | a2229433zex-10_57.htm |
Use these links to rapidly review the document
TABLE OF CONTENTS
ITEM 8. FINANCIAL STATEMENTS AND SUPPLEMENTARY DATA
PART IV
UNITED STATES
SECURITIES AND EXCHANGE COMMISSION
Washington, D.C. 20549
Form 10-K
| (Mark One) | ||
ý |
ANNUAL REPORT PURSUANT TO SECTION 13 OR 15(d) OF THE SECURITIES EXCHANGE ACT OF 1934 |
|
For the Fiscal Year Ended June 30, 2016 |
||
or |
||
o |
TRANSITION REPORT PURSUANT TO SECTION 13 OR 15(d) OF THE SECURITIES EXCHANGE ACT OF 1934 |
|
For the Transition Period From to |
||
Commission File Number 001-13357
Royal Gold, Inc.
(Exact Name of Registrant as Specified in Its Charter)
| Delaware (State or Other Jurisdiction of Incorporation or Organization) |
84-0835164 (I.R.S. Employer Identification No.) |
|
1660 Wynkoop Street, Suite 1000 |
||
| Denver, Colorado (Address of Principal Executive Offices) |
80202 (Zip Code) |
(303) 573-1660
Registrant's telephone number, including area code:
Securities registered pursuant to Section 12(b) of the Act:
| Title of Each Class | Name of Each Exchange on Which Registered | |
|---|---|---|
| Common stock, $0.01 par value | NASDAQ Global Select Market |
Securities registered pursuant to Section 12(g) of the Act: None
Indicate by check mark if the registrant is a well-known seasoned issuer, as defined in Rule 405 of the Securities Act. Yes ý No o
Indicate by check mark if the registrant is not required to file reports pursuant to Section 13 or Section 15(d) of the Exchange Act. Yes o No ý
Indicate by check mark whether the registrant (1) has filed all reports required to be filed by Section 13 or 15 (d) of the Securities Exchange Act of 1934 during the preceding 12 months (or for such shorter period that the registrant was required to file such reports), and (2) has been subject to such filing requirements for the past 90 days. Yes ý No o
Indicate by check mark whether the registrant has submitted electronically and posted on its corporate Web site, if any, every Interactive Data File required to be submitted and posted pursuant to Rule 405 of Regulation S-T (§ 232.405 of this chapter) during the preceding 12 months (or for such shorter period that the registrant was required to submit and post such files). Yes ý No o
Indicate by check mark if disclosure of delinquent filers pursuant to Item 405 of Regulation S-K is not contained herein, and will not be contained, to the best of registrant's knowledge, in definitive proxy or information statements incorporated by reference in Part III of this Form 10-K or any amendment to this Form 10-K. ý
Indicate by check mark whether the registrant is a large accelerated filer, an accelerated filer, a non-accelerated filer, or a smaller reporting company. See definition of "accelerated filer", "large accelerated filer" and "smaller reporting company" in Rule 12b-2 of the Exchange Act.
| (Check one): | Large accelerated filer ý | Accelerated filer o | Non-accelerated filer o (Do not check if a smaller reporting company) |
Smaller reporting company o |
Indicate by check mark whether the registrant is a shell company (as defined in Rule 12b-2 of the Exchange Act). Yes o No ý
Aggregate market value of the voting common stock held by non-affiliates of the registrant, based upon the closing sale price of Royal Gold common stock on December 31, 2015, as reported on the NASDAQ Global Select Market was $2,361,359,998. There were 65,269,476 shares of the Company's common stock, par value $0.01 per share, outstanding as of July 28, 2016.
DOCUMENTS INCORPORATED BY REFERENCE
Portions of the Proxy Statement for the 2015 Annual Meeting of Stockholders scheduled to be held on November 16, 2016, and to be filed within 120 days after June 30, 2016, are incorporated by reference into Part III, Items 10, 11, 12, 13 and 14 of this Annual Report on Form 10-K.
ii
This document (including information incorporated herein by reference) contains "forward-looking statements" within the meaning of Section 27A of the Securities Act of 1933 and Section 21E of the Securities Exchange Act of 1934, which involve a degree of risk and uncertainty due to various factors affecting Royal Gold, Inc. and its subsidiaries. For a discussion of some of these factors, see the discussion in Item 1A, Risk Factors, of this report. In addition, please see our note about forward-looking statements included in Item 7, Management's Discussion and Analysis of Financial Condition and Results of Operations ("MD&A"), of this report.
Royal Gold does not own, develop, or mine the properties on which it holds stream or royalty interests. Certain information provided in this Annual Report on Form 10-K, including, without limitation, all reserves, historical production and production estimates, descriptions of properties and developments at properties included herein, has been provided to us by the operators of those properties or is publicly available information filed by these operators with applicable securities regulatory bodies, including the Securities and Exchange Commission. Royal Gold has not verified, and is not in a position to verify, and expressly disclaims any responsibility for the accuracy, completeness or fairness of, such third-party information and refers the reader to the public reports filed by the operators for information regarding those properties.
Overview
Royal Gold, Inc. ("Royal Gold", the "Company", "we", "us", or "our"), together with its subsidiaries, is engaged in the business of acquiring and managing precious metal streams, royalties, and similar interests. We seek to acquire existing stream and royalty interests or to finance projects that are in production or in the development stage in exchange for stream or royalty interests.
We manage our business under two segments:
Acquisition and Management of Stream Interests—A metal stream is a purchase agreement that provides, in exchange for an upfront deposit payment, the right to purchase all or a portion of one or more metals produced from a mine, at a price determined for the term of the agreement. As of June 30, 2016, we owned stream interests on four producing properties and three development stage properties. As discussed further below, we invested approximately $1.3 billion in stream interests in our fiscal year 2016, including stream interests relating to Pueblo Viejo, Carmen de Andacollo ("Andacollo"), Wassa and Prestea, and Rainy River. Our stream interests accounted for approximately 66% and 34% of our total revenue for the fiscal years ended June 30, 2016 and 2015, respectively. We expect stream interests to continue growing as a proportion of our total revenue.
Acquisition and Management of Royalty Interests—Royalties are non-operating interests in mining projects that provide the right to revenue or metals produced from the project after deducting specified costs, if any. As of June 30, 2016, we owned royalty interests on 34 producing properties, 21 development stage properties and 131 exploration stage properties, of which we consider 50 to be evaluation stage projects. We use "evaluation stage" to describe exploration stage properties that contain mineralized material and on which operators are engaged in the search for reserves. Royalties accounted for approximately 34% and 66% of our total revenue for the fiscal years ended June 30, 2016 and 2015, respectively.
We do not conduct mining operations on the properties in which we hold stream and royalty interests, and except for our interest in the Peak Gold, LLC joint venture ("Peak Gold"), we are not required to contribute to capital costs, exploration costs, environmental costs or other operating costs on those properties.
1
In the ordinary course of business, we engage in a continual review of opportunities to acquire existing stream and royalty interests, to establish new streams on operating mines, to create new stream and royalty interests through the financing of mine development or exploration, or to acquire companies that hold stream and royalty interests. We currently, and generally at any time, have acquisition opportunities in various stages of active review, including, for example, our engagement of consultants and advisors to analyze particular opportunities, analysis of technical, financial and other confidential information, submission of indications of interest and term sheets, participation in preliminary discussions and negotiations and involvement as a bidder in competitive processes.
As discussed in further detail throughout this report, some significant developments to our business during fiscal year 2016 were as follows:
- (1)
- Our
revenue increased 29% to $359.8 million, compared to $278.0 million during fiscal year 2015;
- (2)
- We
acquired a gold and silver stream on the Pueblo Viejo mine located in the Dominican Republic;
- (3)
- We
acquired a gold stream on the Andacollo copper-gold mine located in Chile and terminated the previously held royalty at Andacollo;
- (4)
- We
acquired a gold stream on the Wassa and Prestea mines located in Ghana;
- (5)
- We
acquired a gold and silver stream on the Rainy River Project located in Canada; and
- (6)
- We increased our calendar year dividend to $0.92 per basic share, which is paid in quarterly installments throughout calendar year 2016. This represents a 5% increase compared with the dividend paid during calendar year 2015.
Certain Definitions
Dollar or "$": Unless we have indicated otherwise, or the context otherwise requires, references in this Annual Report on Form 10-K to "$" or "dollar" are to the currency of the United States. We refer to Canadian dollars as C$.
Gross Smelter Return (GSR) Royalty: A defined percentage of the gross revenue from a resource extraction operation, less, if applicable, certain contract-defined costs paid by or charged to the operator.
Metal Stream: A purchase agreement that provides, in exchange for an upfront advance payment, the right to purchase all or a portion of one or more metals produced from a mine, at a price determined for the life of the transaction by the purchase agreement.
Mineralized Material: That part of a mineral system that have potential economic significance, but is not included in the proven and probably reserve estimates until further drilling and metallurgical work is completed, and until other economic and technical feasibility factors based on such work have been resolved.
Net Smelter Return (NSR) Royalty: A defined percentage of the gross revenue from a resource extraction operation, less a proportionate share of incidental transportation, insurance, refining and smelting costs.
Net Value Royalty (NVR): A defined percentage of the gross revenue from a resource extraction operation, less certain contract-defined costs.
Net Revenue: Net revenue is calculated as Royal Gold's Revenue minus Cost of sales.
2
Probable Reserves: Ore reserves for which quantity and grade are computed from information similar to that used for proven reserves, but the sites for inspection, sampling and measurement are farther apart or are otherwise less adequately spaced. The degree of assurance, although lower than that for proven reserves, is high enough to assume geological continuity between points of observation.
Proven Reserves: Ore reserves for which (a) the quantity is computed from dimensions revealed in outcrops, trenches, workings or drill holes, and grade is computed from the results of detailed sampling, and (b) the sites for inspection, sampling and measurement are spaced so closely and the geologic character is so well defined that the size, shape, depth and mineral content of reserves are well established.
Payable Metal: Ounces or pounds of metal in concentrate after deduction of a percentage of metal in concentrate by a third-party smelter pursuant to smelting contracts.
Reserve: That part of a mineral deposit which could be economically and legally extracted or produced at the time of the reserve determination.
Royalty: The right to receive a percentage or other denomination of mineral production from a mining operation.
Ton: A unit of weight equal to 2,000 pounds or 907.2 kilograms.
Tonne: A unit of weight equal to 2,204.6 pounds or 1,000 kilograms.
Recent Business Developments
Mount Milligan Commitment Letter
On July 5, 2016, we entered into a binding commitment letter with Centerra Gold Inc. ("Centerra") setting forth the key terms and conditions of a future amendment to our Mount Milligan streaming agreement in connection with the proposed acquisition by Centerra of Thompson Creek Metals Company Inc. ("Thompson Creek") by Plan of Arrangement under the Arrangement Agreement executed between Centerra and Thompson Creek, as announced on July 5, 2016 (the "Centerra Acquisition"). Thompson Creek is the parent company of Terrane Metals Corp. ("Terrane"), which owns and operates the Mount Milligan copper-gold mine. Our obligation to amend the Mount Milligan streaming agreement is subject to the consummation of the Centerra Acquisition and other customary conditions set forth in the commitment letter.
Under the commitment letter, we also agreed to an exclusivity arrangement with Centerra that prohibits us from negotiating and entering into any agreement with any person (other than Centerra) relating to Thompson Creek's obligations under the streaming agreement until the earliest of (i) the closing or abandonment of the Centerra Acquisition, (ii) the date, if any, on which shareholders of Thompson Creek decline to approve the Centerra Acquisition, or (iii) November 30, 2016.
Pursuant to the terms of the commitment letter, we and Centerra have agreed to amend the streaming agreement, effective on the closing of the Centerra Acquisition, as follows:
- •
- the existing 52.25% gold streaming interest will be amended to 35.00%;
- •
- we will obtain an 18.75% copper streaming interest at Mount Milligan at a price equal to 15% of the spot price for each metric tonne
of copper delivered;
- •
- the existing restriction of $400 million on senior secured debt covered by the Mount Milligan assets will be extended until we receive the full return of our $781.5 million deposit (the "Payment Deposit");
3
- •
- until we have received the full return of the Payment Deposit and an additional 35,000 metric tonnes of copper, Terrane will maintain
a leverage ratio of total consolidated indebtedness to its earnings before interest, taxes, depreciation and amortization of no greater than 3:1 (including intercompany debt that ranks parri passu
with or in priority to our streaming agreement);
- •
- Terrane will not make distributions of cash or property to any of its affiliates if Terrane or Thompson Creek is in default under the
streaming agreement; and
- •
- we will enter into an intercreditor agreement with lenders providing $325 million in senior secured debt financing to Centerra in connection with the Centerra Acquisition, pursuant to which we will (i) retain our first priority security interest in 35.00% of the payable gold produced from Mount Milligan and all proceeds thereof, (ii) obtain a first priority security interest in 18.75% of the payable copper produced from Mount Milligan and all proceeds thereof, and (iii) otherwise agree to subordinate our security interests on all other assets of Terrane on terms and conditions substantially similar to those contained in our existing intercreditor agreement with the security agent for the benefit of the holders of Thompson Creek's 9.75% Senior Secured First Priority Notes due 2017.
In connection with the closing of the Centerra Acquisition, Centerra will redeem all of Thompson Creek's secured and unsecured notes at their call price plus accrued and unpaid interest, which Centerra expects to finance through the combination of the $325 million senior secured debt referred to above and approximately C$185.7 million in net proceeds from a recent equity offering. The Centerra Acquisition will require the approval of the holders of two-thirds of Thompson Creek's outstanding common stock and will be subject to court and applicable regulatory approvals, in addition to other customary closing conditions. The Centerra Acquisition is expected to close in the fall of calendar 2016.
Fiscal 2016 Business Developments
Please refer to Item 7, MD&A, for discussion on recent liquidity and capital resource developments.
Acquisition of Gold and Silver Stream at Pueblo Viejo
On September 29, 2015, RGLD Gold AG ("RGLD Gold"), a wholly-owned subsidiary of the Company, closed a Precious Metals Purchase and Sale Agreement with Barrick Gold Corporation ("Barrick") and its wholly-owned subsidiary, BGC Holdings Ltd. ("BGC") for a percentage of the gold and silver production attributable to Barrick's 60% interest in the Pueblo Viejo mine located in the Dominican Republic. Pursuant to the Precious Metals Purchase and Sale Agreement, RGLD Gold made a single advance payment of $610 million to BGC as part of the closing. The transaction was effective as of July 1, 2015 for the gold stream and January 1, 2016 for the silver stream.
BGC will deliver gold to RGLD Gold in amounts equal to 7.50% of Barrick's interest in the gold produced at the Pueblo Viejo mine until 990,000 ounces of gold have been delivered, and 3.75% of Barrick's interest in gold produced thereafter. RGLD Gold will pay BGC 30% of the spot price per ounce of gold delivered until 550,000 ounces of gold have been delivered, and 60% of the spot price per ounce delivered thereafter. RGLD Gold received its first delivery of gold from Pueblo Viejo on December 15, 2015.
BGC will deliver silver to RGLD Gold in amounts equal to 75% of Barrick's interest in the silver produced at the Pueblo Viejo mine, subject to a minimum silver recovery of 70%, until 50.0 million ounces of silver have been delivered, and 37.50% of Barrick's interest in silver produced thereafter. RGLD Gold will pay BGC 30% of the spot price per ounce of silver delivered until 23.10 million ounces of silver have been delivered, and 60% of the spot price per ounce of silver delivered
4
thereafter. RGLD Gold received its first delivery of 209,800 ounces of silver from Pueblo Viejo on March 15, 2016 for the period January through February 2016.
The Pueblo Viejo mine is an open-pit mining operation located approximately 60 miles northwest of Santo Domingo, in the Dominican Republic, and is owned by a joint venture in which Barrick holds a 60% interest and is responsible for operations, and in which Goldcorp Inc. ("Goldcorp") holds a 40% interest. The mine began production in 2013. Barrick reported calendar 2016 production forecast, on a 60% basis, of 600,000-650,000 ounces of gold. Barrick also reported proven and probable gold reserves attributable to Barrick of 9.0 million contained ounces at 2.97 grams per tonne, and attributable proven and probable silver reserves of 54.1 million contained ounces grading 17.9 grams per tonne, in each case as of December 31, 2015.
Acquisition and Amendment of Gold Stream on Wassa and Prestea
On July 28, 2015, RGLD Gold closed a $130 million gold stream transaction with a wholly-owned subsidiary of Golden Star Resources Ltd. (together "Golden Star"). On December 30, 2015, the parties executed an amendment providing for an additional $15 million investment (for a total investment of $145 million) by RGLD Gold.
Funds will be used for ongoing development of Golden Star's Wassa and Prestea mines in Ghana. As of June 30, 2016, RGLD Gold has advanced $95 million. On July 1, 2016, RGLD Gold made an advance payment of $20 million and expects to advance the balance in two quarterly payments as follows: (i) $20 million on October 1, 2016, and (ii) $10 million on January 1, 2017; however this schedule may be modified based on the actual spending on the Wassa and Prestea underground projects and these funds are subject to satisfaction of certain conditions.
In return, Golden Star will deliver to RGLD Gold 9.25% of gold produced from the Wassa and Prestea mines, until the earlier of (i) December 31, 2017 or (ii) the date at which the Wassa and Prestea underground projects achieve commercial production. At that point, the stream percentage will increase to 10.5% of gold produced from the Wassa and Prestea mines until an aggregate 240,000 ounces have been delivered. Once the applicable delivery threshold is met, the stream percentage will decrease to 5.5% for the remaining term of the transaction.
RGLD Gold will pay Golden Star a cash price equal to 20% of the spot price for each ounce of gold delivered at the time of delivery until the applicable delivery threshold is met, and 30% of the spot price for each ounce of gold delivered thereafter.
The Wassa mine is located approximately 90 miles west of Accra and has operated continuously since 2005. Golden Star forecasts calendar 2016 production of 100,000 to 110,000 ounces of gold from the single Wassa open pit and 20,000 to 25,000 ounces of gold from pre-commercial production from the developing Wassa underground. Open pit proven and probable reserves are 878,000 ounces at 1.59 grams per tonne, as of December 31, 2015. RGLD Gold's investment will fund development of the Wassa underground deposit, which has 796,000 ounces of probable gold reserves at 4.59 grams per tonne. Once the underground deposit is in production, Golden Star expects average annual gold production of approximately 160,000 ounces of gold over the life of mine from the combined open pit and underground at Wassa.
Prestea is located approximately 125 miles west of Accra and has produced over 9 million ounces of gold from both open pit and underground sources over the last 100 years. Prestea underground probable gold reserves are 469,000 ounces at 14.02 grams per tonne as of December 31, 2015. Golden Star forecasts calendar 2016 production of 60,000 to 70,000 ounces of gold from the open pit operations. Underground development at Prestea is already well advanced. Golden Star expects to spend $36 million of capital investment on Prestea, which includes hoist and shaft upgrades, electrical infrastructure, ventilation and a process plant upgrade. Once in full production, Golden Star expects
5
annual production of approximately 90,000 ounces from Prestea, with estimated life of mine production of 450,000 ounces. Golden Star forecasts underground gold production from the Wassa and Prestea mines by mid-calendar 2016 and mid-calendar 2017, respectively.
Also on July 28, 2015 and separate from the stream transaction by RGLD Gold, the Company funded a $20 million, 4-year term loan to a wholly-owned subsidiary of Golden Star and received warrants to purchase 5 million shares of Golden Star common stock. Interest under the term loan is due quarterly at a rate equal to 62.5% of the average daily gold price for the relevant quarter divided by 10,000, but not to exceed 11.5%. The warrants have a term of four years and an exercise price of $0.27.
Acquisition of Gold and Silver Stream at Rainy River
On July 20, 2015, RGLD Gold entered into a $175 million Purchase and Sale Agreement with New Gold, Inc. ("New Gold"), for a percentage of the gold and silver production from the Rainy River Project located in Ontario, Canada ("Rainy River"). Pursuant to the Purchase and Sale Agreement, RGLD Gold made an advance payment to New Gold, consisting of $100 million on July 20, 2015, and will make an additional advance payment of $75 million once capital spending at Rainy River is 60% complete (currently expected during the second half of calendar 2016). Under the Purchase and Sale Agreement, New Gold will deliver to RGLD Gold 6.50% of the gold produced at Rainy River until 230,000 gold ounces have been delivered, and 3.25% thereafter. New Gold also will deliver to RGLD Gold 60% of the silver produced at Rainy River until 3.10 million silver ounces have been delivered, and 30% thereafter. RGLD Gold will pay New Gold 25% of the spot price per ounce of gold and silver at the time of delivery.
The Rainy River Project is located approximately 40 miles northwest of Fort Frances in western Ontario, Canada. Over its first nine years of full production, the 21,000 tonne per day, combined open pit-underground operation is scheduled to produce an average of 325,000 ounces of gold per year. Construction was initiated in calendar 2015 and at the end of June 2016, overall construction was over 40% complete. Rainy River has an estimated fourteen year mine life based on current reserves and is projected by New Gold to start-up in mid-calendar 2017.
Acquisition of Gold Stream at Carmen de Andacollo
On July 9, 2015, RGLD Gold entered into a Long Term Offtake Agreement (the "Andacollo Stream Agreement") with Compañía Minera Teck Carmen de Andacollo ("CMCA"), a 90% owned subsidiary of Teck Resources Limited ("Teck"). Pursuant to the Andacollo Stream Agreement, CMCA will sell and deliver to RGLD Gold 100% of payable gold from the Andacollo copper-gold mine until 900,000 ounces have been delivered, and 50% thereafter, subject to a fixed payable percentage of 89%. RGLD Gold made a $525 million advance payment in cash to CMCA upon entry into the Andacollo Stream Agreement, and RGLD Gold will also pay CMCA 15% of the monthly average gold price for the month preceding the delivery date for all gold purchased under the Andacollo Stream Agreement.
The transaction encompasses certain of CMCA's presently owned mining concessions on the Andacollo mine, as well as any other mining concessions presently owned or acquired by CMCA or any of its affiliates within a 1.5 kilometer area of interest, and certain other mining concessions that CMCA or its affiliates may acquire. The Andacollo Stream Agreement was effective as of July 1, 2015, and applies to all final settlements of gold received on or after that date.
Termination of Royalty Interest at Carmen de Andacollo
On July 9, 2015, Royal Gold Chile Limitada ("RG Chile"), a wholly owned subsidiary of the Company, entered into a Royalty Termination Agreement with CMCA. The Royalty Termination Agreement terminated an amended Royalty Agreement originally dated January 12, 2010, which
6
provided RG Chile with a royalty equivalent to 75% of the gold produced from the sulfide portion of the Andacollo mine until 910,000 payable ounces have been produced, and 50% of the gold produced thereafter. CMCA paid total consideration of $345 million to RG Chile in connection with the Royalty Termination Agreement. The royalty termination transaction was taxable in Chile and the United States.
Our Operational Information
Reportable Segments, Geographical and Financial Information
The Company manages its business under two reportable segments, consisting of the acquisition and management of stream interests and the acquisition and management of royalty interests. Royal Gold's long-lived assets (stream and royalty interests, net) are geographically distributed as shown in the following table:
| |
As of June 30, 2016 | As of June 30, 2015 | |||||||||||||||||
|---|---|---|---|---|---|---|---|---|---|---|---|---|---|---|---|---|---|---|---|
| |
Stream interest |
Royalty interest |
Total stream and royalty interests, net |
Stream interest |
Royalty interest |
Total stream and royalty interests, net |
|||||||||||||
Canada |
$ | 809,692 | $ | 228,566 | $ | 1,038,258 | $ | 823,091 | $ | 251,688 | $ | 1,074,779 | |||||||
Chile |
369,896 | 453,629 | 823,525 | — | 653,019 | 653,019 | |||||||||||||
Dominican Republic |
588,502 | — | 588,502 | — | — | — | |||||||||||||
Mexico |
— | 118,899 | 118,899 | — | 131,742 | 131,742 | |||||||||||||
United States |
— | 102,385 | 102,385 | — | 110,286 | 110,286 | |||||||||||||
Africa |
88,596 | 697 | 89,293 | — | 12,760 | 12,760 | |||||||||||||
Australia |
— | 42,547 | 42,547 | — | 50,119 | 50,119 | |||||||||||||
Other |
12,029 | 32,649 | 44,678 | 8,183 | 42,720 | 50,903 | |||||||||||||
| | | | | | | | | | | | | | | | | | | | |
Total |
$ | 1,868,715 | $ | 979,372 | $ | 2,848,087 | $ | 831,274 | $ | 1,252,334 | $ | 2,083,608 | |||||||
| | | | | | | | | | | | | | | | | | | | |
| | | | | | | | | | | | | | | | | | | | |
| | | | | | | | | | | | | | | | | | | | |
The Company's revenue, costs of sales and net revenue by reportable segment for our fiscal years ended June 30, 2016, 2015 and 2014 is geographically distributed as shown in the following table:
| |
Fiscal Year Ended June 30, 2016 | Fiscal Year Ended June 30, 2015 | |||||||||||||||||
|---|---|---|---|---|---|---|---|---|---|---|---|---|---|---|---|---|---|---|---|
| |
Revenue | Cost of sales | Net revenue | Revenue | Cost of sales | Net revenue | |||||||||||||
Streams: |
|||||||||||||||||||
Canada |
$ | 125,755 | $ | 47,417 | $ | 78,338 | $ | 94,104 | $ | 33,450 | $ | 60,654 | |||||||
Chile |
49,243 | 7,280 | 41,963 | — | — | — | |||||||||||||
Dominican Republic |
39,684 | 11,625 | 28,059 | — | — | — | |||||||||||||
Africa |
23,346 | 4,657 | 18,689 | — | — | — | |||||||||||||
| | | | | | | | | | | | | | | | | | | | |
Total streams |
$ | 238,028 | $ | 70,979 | $ | 167,049 | $ | 94,104 | $ | 33,450 | $ | 60,654 | |||||||
Royalties: |
|||||||||||||||||||
Mexico |
$ | 35,267 | $ | — | $ | 35,267 | $ | 43,008 | $ | — | $ | 43,008 | |||||||
United States |
35,483 | — | 35,483 | 42,675 | — | 42,675 | |||||||||||||
Canada |
30,676 | — | 30,676 | 37,496 | — | 37,496 | |||||||||||||
Chile |
84 | — | 84 | 39,508 | — | 39,508 | |||||||||||||
Australia |
10,462 | — | 10,462 | 8,494 | — | 8,494 | |||||||||||||
Africa |
1,868 | — | 1,868 | 3,075 | — | 3,075 | |||||||||||||
Other |
7,922 | — | 7,922 | 9,659 | — | 9,659 | |||||||||||||
| | | | | | | | | | | | | | | | | | | | |
Total royalties |
$ | 121,762 | $ | — | $ | 121,762 | $ | 183,915 | $ | — | $ | 183,915 | |||||||
| | | | | | | | | | | | | | | | | | | | |
Total royalties and streams |
$ | 359,790 | $ | 70,979 | $ | 288,811 | $ | 278,019 | $ | 33,450 | $ | 244,569 | |||||||
| | | | | | | | | | | | | | | | | | | | |
| | | | | | | | | | | | | | | | | | | | |
| | | | | | | | | | | | | | | | | | | | |
7
| |
Fiscal Year Ended June 30, 2015 | Fiscal Year Ended June 30, 2014 | |||||||||||||||||
|---|---|---|---|---|---|---|---|---|---|---|---|---|---|---|---|---|---|---|---|
| |
Revenue | Cost of sales | Net revenue | Revenue | Cost of sales | Net revenue | |||||||||||||
Streams: |
|||||||||||||||||||
Canada |
$ | 94,104 | $ | 33,450 | $ | 60,654 | $ | 27,209 | $ | 9,158 | $ | 18,051 | |||||||
Royalties: |
|||||||||||||||||||
Mexico |
$ | 43,008 | $ | — | $ | 43,008 | $ | 43,093 | $ | — | $ | 43,093 | |||||||
United States |
42,675 | — | 42,675 | 34,671 | — | 34,671 | |||||||||||||
Chile |
39,508 | — | 39,508 | 50,733 | — | 50,733 | |||||||||||||
Canada |
37,496 | — | 37,496 | 54,277 | — | 54,277 | |||||||||||||
Australia |
8,494 | — | 8,494 | 8,353 | — | 8,353 | |||||||||||||
Africa |
3,075 | — | 3,075 | 7,943 | — | 7,943 | |||||||||||||
Other |
9,659 | — | 9,659 | 10,883 | — | 10,883 | |||||||||||||
| | | | | | | | | | | | | | | | | | | | |
Total royalties |
$ | 183,915 | $ | — | $ | 183,915 | $ | 209,953 | $ | — | $ | 209,953 | |||||||
| | | | | | | | | | | | | | | | | | | | |
Total royalties and streams |
$ | 278,019 | $ | 33,450 | $ | 244,569 | $ | 237,162 | $ | 9,158 | $ | 228,004 | |||||||
| | | | | | | | | | | | | | | | | | | | |
| | | | | | | | | | | | | | | | | | | | |
| | | | | | | | | | | | | | | | | | | | |
Please see "Operations in foreign jurisdictions are subject to many risks, which could decrease our revenues," under Part I, Item 1A, Risk Factors, of this report for a description of the risks attendant to foreign operations.
Our financial results are primarily tied to the price of gold and, to a lesser extent, the price of silver and copper, together with the amounts of production from our producing stage stream and royalty interests. During the fiscal year ended June 30, 2016, Royal Gold derived approximately 91% of its revenue from precious metals (including 88% from gold and 3% from silver), 4% from copper and 5% from other minerals. The price of gold, silver, copper and other metals has fluctuated widely in recent years, having declined from highs experienced in the first half of our fiscal year 2013, with the price of gold and silver having rebounded during the second half of our fiscal 2016. The marketability and the price of metals are influenced by numerous factors beyond our control.
Competition
The mining industry in general and streaming and royalty segments in particular are competitive. We compete with other streaming and royalty companies, mine operators, and financial buyers in efforts to acquire existing royalty interests, and with the lenders, investors, and streaming and royalty companies providing financing to operators of mineral properties in our efforts to create new royalty interests. Our competitors in the lending and mining business may be larger than we are and may have greater resources and access to capital than we have. Key competitive factors in the stream and royalty acquisition and financing business include the ability to identify and evaluate potential opportunities, transaction structure and consideration, and access to capital.
Regulation
Operators of the mines that are subject to our stream and royalty interests must comply with numerous environmental, mine safety, land use, waste disposal, remediation and public health laws and regulations promulgated by federal, state, provincial and local governments in the United States, Canada, Chile, Mexico, Dominican Republic and other countries where we hold interests. Although we are not responsible as a stream and royalty interest owner for ensuring compliance with these laws and regulations, failure by the operators of the mines on which we have stream and royalty interests to comply with applicable laws, regulations and permits can result in injunctive action, damages and civil and criminal penalties on the operators.
8
Corporate Information
We were incorporated under the laws of the State of Delaware on January 5, 1981. Our executive offices are located at 1660 Wynkoop Street, Suite 1000, Denver, Colorado 80202. Our telephone number is (303) 573-1660.
Available Information
Royal Gold maintains an internet website at www.royalgold.com. Royal Gold makes available, free of charge, through the Investor Relations section of its website, its Annual Reports on Form 10-K, Quarterly Reports on Form 10-Q, Current Reports on Form 8-K, and all amendments to those reports filed or furnished pursuant to Section 13(a) or 15(d) of the Exchange Act, as soon as reasonably practicable after such material is electronically filed with, or furnished to, the Securities and Exchange Commission ("SEC"). Our SEC filings are available from the SEC's internet website at www.sec.gov which contains reports, proxy and information statements and other information regarding issuers that file electronically. These reports, proxy statements and other information may also be inspected and copied at the SEC's Public Reference Room at 100 F Street, NE, Washington, D.C. 20549. Please call the SEC at 1-800-SEC-0330 for further information on the operation of the Public Reference Room. The charters of Royal Gold's key committees of the Board of Directors and Royal Gold's Code of Business Conduct and Ethics are also available on the Company's website. Any of the foregoing information is available in print to any stockholder who requests it by contacting our Investor Relations Department at (303) 573-1660. The information on the Company's website is not, and shall not be deemed to be, a part hereof or incorporated into this or any of our other filings with the SEC.
Company Personnel
We currently have 21 employees, 18 of whom are located in Denver, Colorado, one who is located in Zug, Switzerland, and two who are located in Toronto, Canada. Our employees are not subject to a labor contract or a collective bargaining agreement. We consider our employee relations to be good.
We also retain independent contractors to provide consulting services, relating primarily to geologic and geophysical interpretations and also relating to such metallurgical, engineering, environmental, and other technical matters as may be deemed useful in the operation of our business.
You should carefully consider the risks described below before making an investment decision. Our business, financial condition, results of operations, and cash flows could be materially adversely affected by any of these risks. The market or trading price of our securities could decline due to any of these risks. In addition, please see our note about forward-looking statements included in Part II, Item 7, MD&A of this Annual Report on Form 10-K. Please note that additional risks not presently known to us or that we currently deem immaterial may also impair our business and operations.
Risks Related to Our Business
Volatility in gold, silver, copper, nickel and other metal prices may have an adverse impact on the value of our stream and royalty interests and may reduce our revenues. Certain contracts governing our royalty stream interests have features that may amplify the negative effects of a drop in metals prices.
The profitability of our stream and royalty interests is directly related to the market price of gold, silver, copper, nickel and other metals. Our revenue is particularly sensitive to changes in the price of gold, as we derive a majority of our revenue from gold stream and royalty interests. Market prices may fluctuate widely and are affected by numerous factors beyond the control of Royal Gold or any mining company, including metal supply, industrial and jewelry fabrication, investment demand, central banking
9
economic policy, expectations with respect to the rate of inflation, the relative strength of the dollar and other currencies, interest rates, gold purchases, sales and loans by central banks, forward sales by metal producers, global or regional political, economic or banking conditions, and a number of other factors.
Volatility in gold, silver, copper and nickel prices is demonstrated by the annual high and low prices for those metals over the past decade:
| |
Gold ($/ounce) |
Silver ($/ounce) |
Copper ($/pound) |
Nickel ($/pound) |
|||||||||||||||||||||
|---|---|---|---|---|---|---|---|---|---|---|---|---|---|---|---|---|---|---|---|---|---|---|---|---|---|
Calendar Year
|
High | Low | High | Low | High | Low | High | Low | |||||||||||||||||
2006 - 2007 |
$ | 841 | $ | 525 | $ | 15.82 | $ | 8.83 | $ | 4.29 | $ | 2.01 | $ | 23.41 | $ | 6.30 | |||||||||
2008 - 2009 |
$ | 1,213 | $ | 713 | $ | 20.92 | $ | 8.88 | $ | 4.08 | $ | 1.26 | $ | 15.10 | $ | 4.00 | |||||||||
2010 - 2011 |
$ | 1,895 | $ | 1,058 | $ | 48.70 | $ | 26.16 | $ | 4.60 | $ | 2.76 | $ | 13.17 | $ | 7.68 | |||||||||
2012 - 2013 |
$ | 1,792 | $ | 1,192 | $ | 37.23 | $ | 18.61 | $ | 3.93 | $ | 3.01 | $ | 9.90 | $ | 5.97 | |||||||||
2014 |
$ | 1,385 | $ | 1,142 | $ | 22.05 | $ | 15.28 | $ | 3.37 | $ | 2.86 | $ | 9.62 | $ | 6.06 | |||||||||
2015 |
$ | 1,296 | $ | 1,049 | $ | 18.23 | $ | 13.71 | $ | 2.92 | $ | 2.05 | $ | 7.01 | $ | 3.70 | |||||||||
2016 to-date |
$ | 1,366 | $ | 1,077 | $ | 20.47 | $ | 13.58 | $ | 2.31 | $ | 1.96 | $ | 3.50 | $ | 4.84 | |||||||||
Declines in market prices for gold, silver, copper, nickel and certain other metals such as those experienced during our fiscal year 2015 and first half of fiscal 2016, decreased our revenues. Declines in market prices could cause an operator to reduce, suspend or terminate production from an operating project or construction work at a development project, which may result in a temporary or permanent reduction or cessation of revenue from those projects, and we might not be able to recover the initial investment in our stream and royalty interests. Certain streaming agreements provide us the right to purchase metals at a specified percentage of the spot price. Our margin between the price at which we can purchase metals pursuant to streaming agreements and the price at which we sell metals in the market will vary as metal prices vary; in the event of metal price declines, we would generate lower cash flow or earnings, or possibly losses. Our Mount Milligan streams provide us the right to purchase gold at fixed prices of $435 per ounce. Further, our sliding-scale royalties, such as Cortez, Holt, Mulatos and other properties, amplify the effect of declines in market prices for gold, silver, copper, nickel and certain other metals, because when metal prices fall below certain thresholds in a sliding-scale royalty, a lower royalty rate will apply. A price decline may result in a material and adverse effect on our profitability, results of operations and financial condition.
Price fluctuations between the time that decisions about development and construction of a mine are made and the commencement of production can have a material adverse effect on the economics of a mine and can eliminate or have a material adverse impact on the value of stream and royalty interests on the property.
Where gold and silver are produced as by-product metals at the properties where we hold stream and royalty interests, such as at Mount Milligan and Andacollo, an operator's production decisions and the economic cut-off applied to its reporting of gold and silver reserves and resources may be influenced by changes in the commodity prices of the principal metals produced at the mines.
Moreover, certain agreements governing our royalty interests, such as those relating to our royalty interests in the Robinson, Peñasquito and Voisey's Bay properties, are based on the operator's concentrate sales to smelters, which include price adjustments between the operator and the smelter based on metals prices at a later date, typically three to five months after shipment to the smelter. In such cases, our payments from the operator include a component of these later price adjustments, which can result in decreased revenue in later periods if metals prices have fallen.
10
We own passive interests in mining properties, and it is difficult or impossible for us to ensure properties are developed or operated in our best interest.
All of our current revenue is derived from stream and royalty interests on properties operated by third parties. The holder of a stream or royalty interest typically has no authority regarding the development or operation of a mineral property. Therefore, we typically are not in control of decisions regarding development or operation of any of the properties on which we hold a stream or royalty interest, and we have limited legal rights to influence those decisions.
Our strategy of acquiring and holding stream and royalty interests on properties operated by third parties puts us generally at risk to the decisions of others regarding all operating matters, including permitting, feasibility analysis, mine design and operation, processing, plant and equipment matters and temporary or permanent suspension of operations, among others. As a result, our revenue is dependent upon the activities of third parties, which creates the risk that at any time those third parties may: (i) have business interests that are inconsistent with ours, (ii) take action contrary to our interests, policies or objectives, or (iii) be unable or unwilling to fulfill their obligations under their agreements with us. At any time, any of the operators of our mining properties may decide to suspend or discontinue operations. Except in limited circumstances, we will not be entitled to material compensation if operations are shut down, suspended or discontinued on a temporary or permanent basis. Although we attempt to secure contractual rights when we create new stream or royalty interests, such as audit or access rights, that will permit us to protect our interests to a degree, there can be no assurance that such rights will always be available or sufficient, or that our efforts will be successful in achieving timely or favorable results or in affecting the operation of the properties in which we have a stream or royalty interest in ways that would be beneficial to our stockholders.
Our revenues are subject to operational and other risks faced by operators of our mining properties.
Although we are not required to pay capital costs (except for our interest in the Peak Gold, LLC joint venture and for other transactions where we finance mine development or actively fund or participate ourselves in exploration or development projects or in certain other limited circumstances) or operating costs on projects on which we hold stream or royalty interests, our financial results are indirectly subject to hazards and risks normally associated with developing and operating mining properties where we hold stream and royalty interests. Some of these risks include:
- •
- insufficient ore reserves;
- •
- increases in production or capital costs incurred by operators or third parties that may impact the amount of reserves available to be
mined, cause an operator to delay or curtail mining development and operations, or render mining of ore uneconomical and cause an operator to close operations;
- •
- declines in the price of gold, silver, copper, nickel and other metals;
- •
- mine operating and ore processing facility problems;
- •
- economic downturns and operators' insufficient financing;
- •
- default by an operator on its obligations to us or its creditors;
- •
- insolvency, bankruptcy or other financial difficulty of the operator;
- •
- significant permitting, environmental and other regulatory requirements and restrictions and any changes in those regulations or their
enforcement;
- •
- challenges by non-mining interests to existing permits and mining rights, and to applications for permits and mining rights;
11
- •
- opposition by local communities, indigenous populations and non-governmental organizations;
- •
- community or civil unrest;
- •
- labor ; shortage of miners, geologists and mining experts, changes in labor laws, increased labor costs, and labor disputes, strikes
or work stoppages at mines
- •
- unavailability of mining, drilling and related equipment;
- •
- unanticipated geological conditions or metallurgical characteristics;
- •
- unanticipated ground or water conditions;
- •
- pit wall or tailings dam failures or any underground stability issues;
- •
- fires, explosions and other industrial accidents;
- •
- environmental hazards and natural catastrophes such as floods, earthquakes or inclement or hazardous weather conditions;
- •
- injury to persons, property or the environment;
- •
- the ability of operators to maintain or increase production or to replace reserves as properties are mined;
- •
- potential increased operating costs arising from climate change initiatives and their impact on energy costs in the U.S. and foreign
jurisdictions; and
- •
- uncertain domestic and foreign political and economic environments.
The occurrence of any of the above mentioned risks or hazards, among others, could result in an interruption, suspension or termination of operations or development work at any of the properties in which we hold a stream or royalty interest and have a material adverse effect on our business, results of operations, cash flows and financial condition.
Many of our stream and royalty interests are important to us and any adverse development related to these properties could adversely affect our revenues and financial condition.
Our investments in the Mount Milligan, Andacollo, Pueblo Viejo, Wassa and Presta and Peñasquito properties generated approximately $260.5 million in revenue in fiscal year 2016, or nearly 72% of our revenue for the period. We expect these properties and others to be important to us in fiscal year 2017 and beyond. Any adverse development affecting the operation of or production from any of these properties could have a material adverse effect on our results of operations, cash flows and financial condition. Any adverse decision made by the operators, such as changes to mine plans, production schedules, metallurgical processes or royalty calculation methodologies, may materially and adversely impact the timing and amount of revenue that we receive.
If Centerra's acquisition of Thompson Creek or the anticipated amendment to our Mount Milligan streaming agreement is not consummated, Thompson Creek may be unable to find another buyer and may experience liquidity issues or seek bankruptcy protection, and we may not be able to realize the benefits of our stream interest on the Mount Milligan mine.
There are a number of uncertainties relating to Centerra's proposed acquisition of Thompson Creek, including, among other things, those relating to Thompson Creek obtaining stockholder approval and the acquisition receiving court and applicable regulatory approvals. If Centerra's proposed acquisition of Thompson Creek is not consummated for any reason, there can be no assurance that Thompson Creek will be able to secure another buyer for itself or Mount Milligan, or that another buyer will seek to amend our Mount Milligan streaming agreement on terms we find acceptable. Any
12
failure of Centerra's proposed acquisition of Thompson Creek to close could result in Thompson Creek experiencing liquidity issues that impact operations at Mount Milligan or could result in Thompson Creek seeking bankruptcy protection, which could limit our ability to realize the future benefits from our stream interest on the Mount Milligan mine and could materially and adversely affect our business. Further, while we believe our proposed amendment to our stream interest at Mount Milligan will be value neutral on a discounted cash flow basis to our existing stream interest, we cannot guaranty that this will prove to be the case.
Problems concerning the existence, validity, enforceability, terms or geographic extent of our stream and royalty interests could adversely affect our business and revenues, and our interests may similarly be materially and adversely impacted by change of control, bankruptcy or the insolvency of operators.
Defects in or disputes relating to the stream and royalty interests we hold or acquire may prevent us from realizing the anticipated benefits from our stream and royalty interests, and could have a material adverse effect on our business, results of operations, cash flows and financial condition. Material changes could also occur that may adversely affect management's estimate of the carrying value of our stream and royalty interests and could result in impairment charges. While we seek to confirm the existence, validity, enforceability, terms and geographic extent of the stream and royalty interests we acquire, there can be no assurance that disputes or other problems concerning these and other matters or other problems will not arise. Confirming these matters is complex and is subject to the application of the laws of each jurisdiction to the particular circumstances of each parcel of mining property and to the documents reflecting the stream or royalty interest. Similarly, stream and royalty interests in many jurisdictions are contractual in nature, rather than interests in land, and therefore may be subject to change of control, bankruptcy or insolvency of operators, and our stream or royalty interests could be materially restricted or set aside through judicial or administrative proceedings. We often do not have the protection of security interests that could help us recover all or part of our investment in a stream or royalty interest.
We have limited access to data and disclosure regarding the operation of the properties on which we have stream and royalty interests, which may limit our ability to assess the performance of a stream or royalty interest.
Although certain agreements governing our stream and royalty interests require the operators to provide us with production, operating and other information, we do not have the contractual right to receive such information for all of our stream and royalty interests. As a result, we may have limited access to data about the operations and the properties themselves, which could affect our ability to assess the performance of a stream or royalty interest. This could result in delays in, or reductions of, our cash flow from the amounts that we anticipate based on the stage of development of or production from the properties which could have an adverse impact on our results of operations, and financial condition.
Acquired stream and royalty interests, particularly on development stage properties, are subject to the risk that they may not produce anticipated revenues.
The stream and royalty interests we acquire may not produce anticipated revenues. The success of our acquisitions of stream and royalty interests is based on our ability to make accurate assumptions regarding the valuation, timing and amount of revenues to be derived from our stream and royalty interests and, for development projects, the geological, metallurgical and other technical aspects of the project as well as the costs, timing and conduct of development. If an operator does not bring a property into production and operate in accordance with feasibility studies, technical or reserve reports or other plans due to lack of capital, inexperience, unexpected problems, delays, or otherwise, then the acquired stream or royalty interest may not yield sufficient revenues to be profitable for us.
13
Furthermore, operators of development stage properties must obtain and maintain all necessary environmental permits and access to water, power and other raw materials, as well as financing, necessary to begin or sustain production, and there can be no assurance that operators will be able to do so.
The failure of any of our principal properties to produce anticipated revenues on schedule or at all would have a material adverse effect on our asset carrying values and potentially our business, results of operations, financial condition or the other benefits we expect to realize from the acquisition of stream and royalty interests. For example, we experienced a write-down for the Phoenix Gold mining project in the third quarter of fiscal 2016 after examining updated technical reports prepared by Rubicon, the operator of the mining project.
Further, as mines on which we have stream and royalty interests mature, we can expect overall declines in production over the years from those operations unless operators are able to replace reserves that are mined through mine expansion or successful new exploration. There can be no assurance that the operators of properties where we hold stream and royalty interests will be able to maintain or increase production or replace reserves as they are mined.
Operators may interpret our stream and royalty interests in a manner adverse to us or otherwise may not abide by their contractual obligations, and we could be forced to take legal action to enforce our contractual rights.
Our stream and royalty interests generally are subject to uncertainties and complexities arising from the application of contract and property laws in the jurisdictions where the mining projects are located. Operators and other parties to the agreements governing our stream and royalty interests may interpret our interests in a manner adverse to us or otherwise may not abide by their contractual obligations, and we could be forced to take legal action to enforce our contractual rights. We may or may not be successful in enforcing our contractual rights, and our revenues relating to any challenged stream or royalty interests may be delayed, curtailed or eliminated during the pendency of any such dispute or in the event our position is not upheld, which could have a material adverse effect on our business, results of operations, cash flows and financial condition. Disputes could arise challenging, among other things, methods for calculating the stream or royalty interest, including whether certain operator costs may properly be deducted from gross proceeds when calculating royalties determined on a net basis; various rights of the operator or third parties in or to the stream or royalty interest or the underlying property; the obligations of a current or former operator to make payments on stream and royalty interests; and various defects or ambiguities in the agreement governing a stream and royalty interest.
For example, in December 2014, the Labrador Nickel Royalty Limited Partnership ("LNRLP"), of which the Company is the indirect majority owner, amended its October 2009 statement of claim against Vale and certain subsidiaries of Vale. LNRLP alleges that Vale has been calculating LNRLP's 3% NSR royalty on nickel, copper and cobalt produced from the Voisey's Bay mine incorrectly since production began in late 2005 and that Vale has breached its contractual duties of good faith and honest performance. One of the claims asserted by LNRLP relates to Vale's calculation of the royalty since Vale began processing nickel concentrates from Voisey's Bay at its new Long Harbour hydrometallurgical plant. Vale currently deducts full Long Harbour operating costs, depreciation and cost of capital from actual proceeds when calculating the net smelter return royalty, which has the effect of reducing or eliminating royalty payments to LNRLP. Royal Gold strongly disagrees with Vale's position that full operating costs, depreciation and cost of capital are permissible net smelter return deductions pursuant to the royalty agreement and is aggressively pursuing its legal remedies. For fiscal 2015, the Voisey's Bay royalty comprised 6% of our revenue. We did not receive any revenue from Vale for the fourth quarter of fiscal 2016. The Voisey's Bay royalty comprised 3% of our total revenue for fiscal 2016.
14
Potential litigation affecting the properties that we have stream and royalty interests in could have an adverse effect on us.
Potential litigation may arise between the operators of properties on which we have stream and royalty interests and third parties. For example, Barrick's Pascua-Lama mining project has been the subject of litigation by local farmers and indigenous communities alleging that the project's water management system is not in compliance with environmental permits and that the project has damaged glaciers located in the Pascua-Lama project area. As a holder of stream and royalty interests, we generally will not have any influence on litigation such as this and generally will not have access to non-public information concerning such litigation. Any such litigation that results in the reduction, cessation or termination of a project or production from a property, whether temporary or permanent, could have a material adverse effect on our business, results of operations, cash flows and financial condition.
We may enter into acquisitions or other material transactions at any time.
In the ordinary course of business, we engage in a continual review of opportunities to acquire existing stream and royalty interests, to establish new streams on operating mines, to create new stream and royalty interests through financing mine development or exploration, or to acquire companies that hold stream and royalty interests. We currently, and generally at any time, have acquisition opportunities in various stages of active review, including, for example, our engagement of consultants and advisors to analyze particular opportunities, analysis of technical, financial and other confidential information, submission of indications of interest and term sheets, participation in preliminary discussions and negotiations and involvement as a bidder in competitive processes. We also consider obtaining debt commitments for acquisition financing. In the event that we choose to raise debt capital to finance any acquisition, our leverage may be increased. We also could issue common stock or incur additional indebtedness to fund our acquisitions. Issuances of common stock could dilute existing stockholders and may reduce some or all of our per share financial measures.
Any such acquisition could be material to us. In pursuit of such opportunities, we may fail to select appropriate acquisition candidates or negotiate acceptable arrangements, including arrangements to finance acquisitions. In addition, any such acquisition or other transaction may have other transaction specific risks associated with it, including risks related to the completion of the transaction, the project, its operators, or the jurisdictions in which the project is located and other risks discussed in this Annual Report on Form 10-K. There can be no assurance that any acquisitions completed will ultimately benefit the Company.
In addition, we may consider opportunities to restructure our stream or royalty interests where we believe such restructuring would provide a long-term benefit to the Company, though such restructuring may reduce near-term revenues or result in the incurrence of transaction related costs. We could enter into one or more acquisition or restructuring transactions at any time.
We may be unable to successfully acquire additional stream or royalty interests at appropriate valuations.
Our future success largely depends upon our ability to acquire stream and royalty interests at appropriate valuations, including through royalty, stream and corporate acquisitions and other financing transactions. Most of our revenues are derived from stream and royalty interests that we acquire or finance. There can be no assurance that we will be able to identify and complete the acquisition of such stream and royalty interests or businesses that own desirable interests, at reasonable prices or on favorable terms, or, if necessary, that we will have or be able to obtain sufficient financing on reasonable terms to complete such acquisitions. Continued economic volatility or a credit crisis, or severe declines in market prices for gold, silver, copper, nickel and certain other metals, could adversely affect our ability to obtain debt or equity financing for acquisitions. In addition, changes to tax rules, accounting policies, or the treatment of stream interests by ratings agencies could make royalties, streams or other investments by the Company less attractive to counterparties. Such changes could adversely affect our ability to acquire new stream or royalty interests.
15
We face substantial competition, and we may not be able to compete successfully in acquiring new stream and royalty interests.
We have competitors that are engaged in the acquisition of stream and royalty interests and companies holding such interests, including competitors with greater financial resources, and we may not be able to compete successfully against these companies in new acquisitions. If we are unable to successfully acquire additional stream or royalty interests, the reserves subject to our stream and royalty interests may decline as the producing properties on which we have such stream and royalty interests are mined or payment or production caps on certain of our royalty interests are met. We also may experience negative reactions from the financial markets or operators of properties on which we seek stream and royalty interests if we are unable to successfully complete acquisitions of such interests or complete them at satisfactory rates of return. Each of these factors could have a material adverse effect on our business, results of operations, cash flows and financial condition.
We depend on our operators for the calculation of payments of our stream and royalty interests. We may not be able to detect errors and later payment calculations may call for retroactive adjustments.
The payments of our stream and royalty interests are calculated by the operators of the properties on which we have stream and royalty interests based on their reported production. Each operator's calculation of our payments is subject to and dependent upon the adequacy and accuracy of its production and accounting functions, and, given the complex nature of mining and ownership of mining interests, errors may occur from time to time in the allocation of production and the various other calculations made by an operator. Any of these errors may render calculations of such payments inaccurate. Certain agreements governing our stream and royalty interests require the operators to provide us with production and operating information that may, depending on the completeness and accuracy of such information, enable us to detect errors in deliveries under metal streams and in the calculation of payments of royalties. We do not, however, have the contractual right to receive production information for all of our stream and royalty interests. As a result, our ability to detect payment errors through our stream and royalty monitoring program and its associated internal controls and procedures is limited, and the possibility exists that we will need to make retroactive revenue adjustments. Some contracts governing our stream and royalty interests provide us the right to audit the operational calculations and production data for the associated royalty payments and metal stream deliveries; however, such audits may occur many months following our recognition of the revenue and we may be required to adjust our revenue in later periods, which could require us to restate our financial statements.
Development and operation of mines is very capital intensive and any inability of the operators of properties where we hold stream and royalty interests to meet liquidity needs, obtain financing or operate profitably could have material adverse effects on the value of and revenue from our stream and royalty interests.
If operators of properties where we hold stream and royalty interests do not have the financial strength or sufficient credit or other financing capability to cover the costs of developing or operating a mine, the operator may curtail, delay or cease development or operations at a mine site. For example, in 2015, Yukon Zinc shut down its Wolverine mine, on which we own a sliding-scale NSR royalty on all gold and silver produced, and later filed for and completed bankruptcy proceedings in the Supreme Court of British Columbia. Operators' ability to raise and service sufficient capital may be affected by, among other things, macroeconomic conditions, future commodity prices of metals to be mined, or further economic volatility in the U.S. and global financial markets as has been experienced in recent years. If certain of the operators of the properties on which we have stream and royalty interests suffer these material adverse effects, then our interests, including the value of and revenue from them, and the ability of operators to obtain debt or equity financing for the exploration, development and operation of their properties may be materially adversely affected.
16
Certain of the agreements governing our stream and royalty interests contain terms that reduce or cap the revenues generated from the interests.
Revenue from some of our stream and royalty interests will stop or decrease after threshold production, delivery or payment milestones are achieved. For example, our gold stream at Pueblo Viejo decreases from 7.5% of Barrick's interest in gold produced at Pueblo Viejo to 3.75% after 990,000 ounces of gold have been delivered. Similarly, our silver stream at Pueblo Viejo decreases from 75% of Barrick's interest in silver produced at Pueblo Viejo to 37.50% after 50.00 million ounces of silver have been delivered. Our streams at Wassa and Prestea, Andacollo and many other properties are subject to similar limitations contained in our stream and royalty agreements, and therefore current production and revenue results from our interests may not be indicative of future results.
Estimates of reserves and mineralization by the operators of mines in which we have stream and royalty interests are subject to significant revision.
There are numerous uncertainties inherent in estimating proven and probable reserves and mineralization, including many factors beyond our control and the control of the operators of properties in which we have stream and royalty interests. Reserve estimates for our stream and royalty interests are prepared by the operators of the mining properties. We do not participate in the preparation or verification of such reports and have not independently assessed or verified the accuracy of such information.
The estimation of reserves and of other mineralized material is a subjective process, and the accuracy of any such estimates is a function of the quality of available data and of engineering and geological interpretation and judgment. Results of drilling, metallurgical testing and production, and the evaluation of mine plans subsequent to the date of any estimate, may cause a revision of such estimates. The volume and grade of reserves recovered and rates of production may be less than anticipated. Assumptions about gold and other precious metal prices are subject to great uncertainty, and such prices have fluctuated widely in the past. Declines in the market price of gold, silver, copper, nickel or other metals also may render reserves or mineralized material containing relatively lower ore grades uneconomical to exploit. Changes in operating costs and other factors including short-term operating factors, the processing of new or different ore grades, geotechnical characteristics and metallurgical recovery, may materially and adversely affect reserves.
Mineral resources as reported by some operators do not constitute mineral reserves and do not have demonstrated economic viability. Due to the uncertainty of mineral resources, there can be no assurance that such resources will be upgraded to proven and probable mineral reserves as a result of continued exploration. It should not be assumed that any part or all of mineral resources on properties where we hold stream and royalty interests constitute or will be converted into mineral reserves.
Estimates of production by the operators of mines in which we have stream and royalty interests are subject to change, and actual production may vary materially from such estimates.
Production estimates are prepared by the operators of mining properties. There are numerous uncertainties inherent in estimating anticipated production attributable to our stream and royalty interests, including many factors beyond our control and the control of the operators of the properties in which we have stream and royalty interests. We do not participate in the preparation or verification of production estimates and have not independently assessed or verified the accuracy of such information. The estimation of anticipated production is a subjective process and the accuracy of any such estimates is a function of the quality of available data, reliability of production history, variability in grade encountered, mechanical or other problems encountered, engineering and geological interpretation and operator judgment. Rates of production may be less than expected. Results of drilling, metallurgical testing and production, changes in commodity prices, and the evaluation of mine
17
plans subsequent to the date of any estimate may cause actual production to vary materially from such estimates.
If title to or concessions, licenses or leases from governments on mine properties are not properly maintained by the operators, or are successfully challenged by third parties, our stream and royalty interests could be found to be invalid.
Our business includes the risk that operators of mining projects and holders of mining claims, tenements, concessions, mining licenses or other interests in land and mining rights may lose their exploration or mining rights, or have their rights to mining properties contested by private parties or the government. Internationally, mining tenures are subject to loss for many reasons, including expiration, failure of the holder to meet specific legal qualifications, failure to pay maintenance fees or meet expenditure requirements, reduction in geographic extent upon passage of time or upon conversion from an exploration tenure to a mining tenure, failure of title and similar risks. If title to unpatented mining claims or other mining tenures subject to our stream and royalty interests have not been properly established or not properly maintained, or are successfully contested, our stream and royalty interests could be adversely affected.
Operations in foreign countries or other sovereign jurisdictions are subject to many risks, which could decrease our revenues.
We derived approximately 90% of our revenues from foreign sources during fiscal year 2016, compared to approximately 85% in fiscal year 2015 and 2014. Our principal producing stream and royalty interests on properties outside of the United States are located in Canada, Chile, Mexico, the Dominican Republic and Ghana. We currently have stream and royalty interests in mines and projects in other countries, including Argentina, Australia, Bolivia, Brazil, Burkina Faso, Finland, Guatemala, Honduras, Macedonia, Nicaragua, Peru, Russia, Spain and Tunisia. Various indigenous peoples may be recognized as sovereign jurisdictions and may enforce their own laws and regulations within the United States, Canada and other countries. In addition, future acquisitions may expose us to new jurisdictions. Our foreign activities are subject to the risks normally associated with conducting business in foreign countries. These risks include, depending on the country, such things as:
- •
- expropriation or nationalization of mining property in foreign countries;
- •
- seizure of mineral production;
- •
- exchange and currency controls and fluctuations;
- •
- limitations on foreign exchange and repatriation of earnings;
- •
- increased foreign taxation or imposition of new or increased mining royalty interests;
- •
- restrictions on mineral production and price controls;
- •
- import and export regulations, including restrictions on the export of gold, silver, copper, nickel or other metals;
- •
- changes in legislation, including changes related to taxation, royalty interests, imports, exports, duties, currency, foreign
ownership, foreign trade and foreign investment;
- •
- high rates of inflation;
- •
- labor practices and disputes;
- •
- enforcement of unfamiliar or uncertain foreign real estate, mineral tenure, contract, water use, mine safety and environmental laws and policies;
18
- •
- challenges to mining, processing and related permits and licenses, or to applications for permits and licenses, by or on behalf of
regulatory authorities, indigenous populations, non-governmental organizations or other third parties;
- •
- renegotiation, nullification or forced modification of existing contracts, licenses, permits, approvals, concessions or the like;
- •
- war, crime, terrorism, sabotage, civil unrest and uncertain political and economic environments;
- •
- corruption;
- •
- exposure to liabilities under anti-corruption and anti-money laundering laws, including the U.S. Foreign Corrupt Practices Act and
similar laws and regulations in other jurisdictions to which we, but not necessarily our competitors, may be subject;
- •
- suspension of the enforcement of creditors' rights and stockholders' rights; and
- •
- loss of access to government controlled infrastructure, such as roads, bridges, rails, ports, power sources and water supply.
In addition, many of our operators are organized outside of the United States. Our stream and royalty interests may be subject to the application of foreign laws to our operators, and their stockholders, including laws relating to foreign ownership structures, corporate transactions, creditors' rights, bankruptcy and liquidation. Foreign operations also could be adversely impacted by laws and policies of the United States affecting foreign trade, investment and taxation.
These risks may limit or disrupt operating mines or projects on which we hold stream and royalty interests, restrict the movement of funds, or result in the deprivation of contract rights or the taking of property by nationalization or expropriation without fair compensation, and could have a material adverse effect on our business, results of operations, cash flows and financial condition.
Opposition from indigenous people may delay or suspend development or operations at the properties where we hold stream and royalty interests, which could decrease our revenues.
Various international and national, state and provincial laws, regulations and other materials relate to the rights of indigenous peoples. Some of the properties where we hold stream and royalty interests are located in areas presently or previously inhabited or used by indigenous peoples. Many of these laws impose obligations on government to respect the rights of indigenous people. Some mandate that government consult with indigenous people regarding government actions which may affect indigenous people, including actions to approve or grant mining rights or permits. One or more groups of indigenous people may oppose continued operation, further development, or new development of the properties where we hold stream and royalty interests. Such opposition may be directed through legal or administrative proceedings or protests, roadblocks or other forms of public expression, and claims and protests of indigenous peoples may disrupt or delay activities of the operators of the properties. For example, the Pascua-Lama and El Morro projects have been challenged by Chilean indigenous groups and other third parties. During the fourth calendar quarter of 2013, Barrick suspended construction activities at the Pascua-Lama project, except for those activities required for environmental and regulatory compliance, as discussed further in Part I, Item 2, Properties under the heading "Pascua-Lama Project (Region III, Chile)" in this Annual Report on Form 10-K. Similarly, construction activities at the El Morro project were suspended during the same period.
Changes in mining taxes and royalties payable to governments could decrease our revenues.
Changes in mining and tax laws in any of the United States, Canada, Chile, Dominican Republic, Mexico or any other country in which we have stream and royalty interests in mines or projects could affect mine development and expansion, significantly increase regulatory obligations and compliance
19
costs with respect to mine development and mine operations, increase the cost of holding mining tenures or impose additional taxes on mining operations, all of which could adversely affect our revenue from such properties. A number of properties where we hold royalty interests are located on U.S. public lands that are subject to federal mining and other public land laws. In recent years, the United States Congress has considered a number of proposed major revisions to the General Mining Law of 1872, and other laws, which govern the creation, maintenance and possession of mining claims and related activities on public lands in the United States. Congress also has recently considered bills, which if enacted, would impose a royalty payable to the government on hardrock production, increase land holding fees, impose federal reclamation fees and financial assurances, impose additional environmental operating standards and afford greater public involvement and regulatory discretion in the mine permitting process. Such legislation, if enacted, or similar legislation in other countries, could adversely affect the development of new mines and the expansion of existing mines, as well as increase the cost of all mining operations, and could materially and adversely affect mine operators and our revenue.
Changes in United States tax legislation or our plans regarding our foreign earnings could adversely impact our business.
We are subject to income taxes in the United States and various foreign jurisdictions. Currently, the majority of our revenue is generated from stream and royalty interests located outside the United States. Present U.S. income taxes and foreign withholding taxes have not been provided for on undistributed earnings for one of our non-U.S. subsidiaries, because such earnings are intended to be indefinitely reinvested in the operations of that subsidiary. The current Executive branch of the U.S. government has proposed various international tax measures, some of which, if enacted into law, would substantially reduce our ability to defer United States taxes on such indefinitely reinvested non-United States earnings, eliminate certain tax deductions until foreign earnings are repatriated to the United States and/or otherwise cause the total tax cost of U.S. multinational corporations to increase. If these or similar proposals are enacted in current or future years, they could have a negative impact on our financial position and results of operations.
In addition, the possibility exists that amounts determined to be indefinitely reinvested outside of the United States may ultimately be repatriated. Any repatriation of foreign earnings may require the accrual and payment of U.S. federal and certain state taxes, which could negatively impact our results of operations and/or the amount of available funds. While we currently have no intention to repatriate cash from our foreign subsidiaries, should the need arise domestically, there is no guarantee that we could do so without adverse consequences.
The mining industry is subject to environmental risks in the U.S. and in the foreign jurisdictions where our interests are located.
Mining is subject to potential risks and liabilities associated with pollution of the environment and the disposal of waste products occurring as a result of mineral exploration and production. Laws and regulations in the United States and abroad intended to ensure the protection of the environment are constantly changing and evolving in a manner expected to result in stricter standards and enforcement, larger fines and liability, and potentially increased capital expenditures and operating costs. Furthermore, mining may be subject to significant environmental and other permitting requirements regarding the use of raw materials needed for operations, particularly water and power. Compliance with such laws and regulations can require significant expenditures and a breach may result in the imposition of fines and penalties, which may be material. If an operator is forced to incur significant costs to comply with environmental regulations or becomes subject to environmental restrictions that limit its ability to continue or expand operations, or if an operator were to lose its right to use or access water or other raw materials necessary to operate a mine, our revenues could be reduced,
20
delayed or eliminated. These risks are most salient with regard to our development stage properties where permitting may not be complete and/or where new legislation and regulation can lead to delays, interruptions and significant unexpected cost burdens for mine operators. For example, Argentina passed a federal glacier protection law in 2010 that, if strictly applied, could restrict mining activities in areas on or near the nation's glaciers. We have royalties on the Chilean side of the Pascua-Lama project, which straddles the border between Chile and Argentina, and the glacier law, if and when it becomes effective, could affect some aspects of the design, development and operation of the Pascua-Lama project. In July 2012, the National Supreme Court of Justice of Argentina overturned preliminary injunctions suspending the application of the glacier law in the San Juan Province, where a portion of the Pascua-Lama project is located, but the Supreme Court must still rule on the constitutionality of the glacier law. Further, to the extent that we become subject to environmental liabilities for any time period during which we operated properties, the satisfaction of any liabilities would reduce funds otherwise available to us and could have a material adverse effect on our business, results of operations, cash flows and financial condition.
We are dependent upon information technology systems, which are subject to cyber threats, disruption, damage and failure.
Information systems and other technologies, including those related to our financial and operational management, are an integral part of our business activities. Network and information systems-related events, such as computer hackings, cyber-attacks, computer viruses, worms or other destructive or disruptive software, process breakdowns, denial of service attacks, malicious social engineering or other malicious activities, or any combination of the foregoing, or power outages, natural disasters, terrorist attacks or other similar events, could result in damage to our property, equipment and data. These events also could result in significant expenditures to repair or replace the damaged property or information systems or to protect them from similar events in the future. Further, any security breaches, such as misappropriation, misuse, leakage, falsification or accidental release or loss of information maintained in our information technology systems, including personnel and other data, could damage our reputation and require us to expend significant capital and other resources to remedy any such security breach. There can be no assurance that these events and security breaches will not occur in the future or not have an adverse effect on our business.
We depend on the services of our President and Chief Executive Officer and other key employees.
We believe that our success depends on the continued service of our key executive management personnel. Tony Jensen has served as our President and Chief Executive Officer since July 2006. Mr. Jensen's extensive commercial experience, mine operations background and industry contacts give us an important competitive advantage. The loss of the services of Mr. Jensen, other key members of management or other key employees could jeopardize our ability to maintain our competitive position in the industry. From time to time, we may also need to identify and retain additional skilled management and specialized technical personnel to efficiently operate our business. The number of persons skilled in the acquisition, exploration and development of stream and royalty interests is limited and there is competition for such persons. Recruiting and retaining qualified personnel is critical to our success and there can be no assurance of such success. If we are not successful in attracting and retaining qualified personnel, our ability to execute our business model and growth strategy could be affected, which could have a material adverse effect on our business, results of operations, cash flows and financial condition. We currently do not have key person life insurance for any of our officers or directors.
21
Our disclosure controls and internal control over our financial reporting are subject to inherent limitations.
Management has concluded that as of June 30, 2016, our disclosure controls and procedures and our internal control over financial reporting were effective. Such controls and procedures, however, may not be adequate to prevent or identify existing or future internal control weaknesses due to inherent limitations therein, which may be beyond our control, including, but not limited to, our dependence on operators for the calculation of royalty payments and deliveries of metal streams that translate to our revenues as discussed above in "We depend on our operators for the calculation of payments of our stream and royalty interests. We may not be able to detect errors and later payment calculations may call for retroactive adjustments". Given our dependence on third party calculations, there is a risk that material misstatements in results of operations and financial condition may not be prevented or detected on a timely basis by our internal controls over financial reporting and may require us to restate our financial statements.
We have incurred indebtedness in connection with our business and may in the future incur additional indebtedness that could limit cash flow available for our operations, limit our ability to borrow additional funds and, if we were unable to repay our debt when due, would have a material adverse effect on our business, results of operations, cash flows and financial condition.
As of June 30, 2016, we had $370 million aggregate principal amount of our 2.875% convertible senior notes due 2019 (the "2019 Notes") outstanding, which we incurred in June 2012. In addition, we may incur additional indebtedness in connection with financing acquisitions, strategic transactions or for other purposes. Since June 30, 2015, we entered into several transactions that resulted in drawing down our revolving credit facility and reducing our availability under the facility. As of June 30, 2016 there was $275 million outstanding on the revolving credit facility, resulting in $375 million of available revolver capacity. We are also subject to the risks normally associated with debt obligations, including the risk that our cash flows may be insufficient to meet required principal and interest payments and the risk that we will be unable to refinance our indebtedness when it becomes due, or that the terms of such refinancing will not be as favorable as the terms of our indebtedness. We may seek additional debt or equity financing if we deem it available.
Our indebtedness could have a material adverse effect on our business, results of operations, cash flows and financial condition. For example, it could:
- •
- increase our vulnerability to general adverse economic and industry conditions;
- •
- require us to dedicate a substantial portion of our cash flow from operations to service our indebtedness, thereby reducing the
availability of our cash flow to fund acquisitions of stream and royalty interests, working capital, pay dividends and other general corporate purposes;
- •
- limit our flexibility in planning for, or reacting to, changes in our business and the industry in which we operate;
- •
- restrict us from exploiting business opportunities;
- •
- place us at a competitive disadvantage compared to our competitors that have less indebtedness;
- •
- dilute our existing stockholders if we elect to issue common stock instead of paying cash in the event the holders convert the 2019
Notes, or any other convertible securities issued in the future;
- •
- require the consent of our existing lenders to borrow additional funds, as was required in connection with the issuance of the 2019 Notes; and
22
- •
- limit our ability to borrow additional funds for working capital, capital expenditures, acquisitions, debt service requirements, execution of our business strategy or other general corporate purposes.
In addition, the agreement governing our revolving credit facility contains, and the agreements that may govern any future indebtedness that we may incur may contain, financial and other restrictive covenants that will limit our ability to engage in activities that may be in our long-term best interests. Among other restrictions, the agreement governing our revolving credit facility contains covenants limiting our ability to make certain investments, consummate certain mergers, incur certain debt or liens and dispose of assets.
If we are unable to maintain cash reserves or generate sufficient cash flow or otherwise obtain funds necessary to make required payments, or if we fail to comply with the various covenants and requirements of the 2019 Notes, our revolving credit facility or any indebtedness which we may incur in the future, an event of default could occur that, if not cured or waived, could result in the acceleration of all of our debt. Any default under the 2019 Notes, our revolving credit facility or any indebtedness which we may incur in the future could have a material adverse effect on our business, results of operations, cash flows and financial condition.
The results of the United Kingdom's referendum on withdrawal from the European Union may have a negative effect on global economic conditions, financial markets and our business.
In June 2016, a majority of voters in the United Kingdom elected to withdraw from the European Union in a national referendum. The referendum was advisory, and the terms of any withdrawal are subject to a negotiation period that could last at least two years after the government of the United Kingdom formally initiates a withdrawal process. Nevertheless, the referendum has created significant uncertainty about the future relationship between the United Kingdom and the European Union, including with respect to the laws and regulations that will apply as the United Kingdom determines which European Union laws to replace or replicate in the event of a withdrawal. The referendum has also given rise to calls for the governments of other European Union member states to consider withdrawal. These developments, or the perception that any of them could occur, have had and may continue to have a material adverse effect on global economic conditions and the stability of global financial markets, and may significantly reduce global market liquidity and restrict the ability of key market participants to operate in certain financial markets. Any of these factors could depress economic activity and restrict our access to capital, which could have a material adverse effect on our business, financial condition and results of operations and reduce the price of our securities.
Risks Related to our Common Stock
Our stock price may continue to be volatile and could decline.
The market price of our common stock has fluctuated and may decline in the future. The high and low sale prices of our common stock on the Nasdaq Global Select Market were $76.85 and $40.45 for the fiscal year ended June 30, 2014, $82.84 and $55.55 for the fiscal year ending June 30, 2015, and $72.04 and $24.68 for the fiscal year ending June 30, 2016. The fluctuation of the market price of our common stock has been affected by many factors that are beyond our control, including:
- •
- market prices of gold, silver, copper, nickel and other metals;
- •
- Central Bank interest rates;
- •
- expectations regarding inflation;
- •
- ability of operators to service their financial obligations, advance development projects, produce precious metals and develop new reserves;
23
- •
- currency values;
- •
- credit market conditions;
- •
- general stock market conditions; and
- •
- global and regional political and economic conditions.
Additional issuances of equity securities by us could dilute our existing stockholders, reduce some or all of our per share financial measures, reduce the trading price of our common stock or impede our ability to raise future capital. Substantial sales of shares may negatively impact the market price of our common stock.
We may issue additional equity in the future in connection with acquisitions, strategic transactions or for other purposes. To the extent we issue additional equity securities, our existing stockholders could be diluted and some or all of our per share financial measures could be reduced. In addition, the shares of common stock that we issue in connection with an acquisition may not be subject to resale restrictions. The market price of our common stock could decline if our stockholders sell substantial amounts of our common stock, including shares issued upon the conversion of the outstanding 2019 Notes or are perceived by the market as intending to sell these shares other than in an orderly manner.
Conversion of the 2019 Notes may dilute the ownership interest of existing stockholders.
At our election, we may settle the 2019 Notes tendered for conversion entirely or partly in shares of our common stock. An aggregate of approximately 3.5 million shares of our common stock are issuable upon conversion of the outstanding 2019 Notes at the initial conversion rate of 9.4955 shares of common stock per $1,000 principal amount of notes (equivalent to an initial conversion price of approximately $105.31 per share of common stock). In addition, the number of shares of common stock issuable upon conversion of the 2019 Notes, and therefore the dilution of existing common stockholders, could increase under certain circumstances described in the indenture under which the 2019 Notes are governed. We may issue all of these shares without any action or approval by our stockholders. As a result, the conversion of some or all of the 2019 Notes may dilute the ownership interests of existing stockholders. Any sales in the public market of the common stock issuable upon such conversion could adversely affect prevailing market prices of our common stock.
We may change our practice of paying dividends.
We have paid a cash dividend on our common stock for each fiscal year beginning in fiscal year 2000. Our board of directors has discretion in determining whether to declare a dividend based on a number of factors, including prevailing gold prices, economic market conditions, future earnings, cash flows, financial condition, and funding requirements for future opportunities or operations. In addition, there may be corporate law limitations or future contractual restrictions on our ability to pay dividends. If our board of directors declines or is unable to declare dividends in the future or reduces the current dividend level, our stock price could fall, and the success of an investment in our common stock would depend largely upon any future stock price appreciation. We have increased our dividends in prior years. There can be no assurance, however, that we will continue to do so or that we will pay any dividends at all.
Certain provisions of Delaware law, our organizational documents, our rights plan and the indenture governing the 2019 Notes could impede, delay or prevent an otherwise beneficial takeover or takeover attempt of us.
Certain provisions of Delaware law, our organizational documents, our rights plans and the indenture governing the 2019 Notes could make it more difficult or more expensive for a third party to acquire us, even if a change of control would be beneficial to our stockholders. Delaware law prohibits,
24
subject to certain exceptions, a Delaware corporation from engaging in any business combination with any "interested stockholder," which is generally defined as a stockholder who becomes a beneficial owner of 15% or more of a Delaware corporation's voting stock, for a period of three years following the date that the stockholder became an interested stockholder. Additionally, our certificate of incorporation and bylaws contain provisions that could similarly delay, defer or discourage a change in control of us or management. These provisions could also discourage a proxy contest and make it more difficult for stockholders to elect directors and take other corporate actions. Such provisions provide for the following, among other things: (i) the ability of our board of directors to issue shares of common stock and preferred stock without stockholder approval, (ii) the ability of our board of directors to establish the rights and preferences of authorized and unissued preferred stock, (iii) a board of directors divided into three classes of directors serving staggered three year terms, (iv) permitting only the chairman of the board of directors, chief executive officer, president or board of directors to call a stockholders' meeting and (v) requiring advance notice of stockholder proposals and related information. Furthermore, we have a stockholder rights plan that may have the effect of discouraging unsolicited takeover proposals. The rights issued under the stockholder rights plan could cause significant dilution to a person or group that attempts to acquire us on terms not approved in advance by our board of directors. In addition, if an acquisition event constitutes a fundamental change, holders of the 2019 Notes will have the right to require us to purchase their 2019 Notes in cash. If an acquisition event constitutes a make-whole fundamental change, we may be required to increase the conversion rate for holders who convert their 2019 Notes in connection with such make-whole fundamental change. These provisions could increase the cost of acquiring us or otherwise discourage a third party from acquiring us or removing incumbent management, which may cause the market price of our common stock to decline.
ITEM 1B. UNRESOLVED STAFF COMMENTS
None.
We do not own or operate the properties in which we have stream or royalty interests, except for our interest in Peak Gold, and therefore much of the information disclosed in this Form 10-K regarding these properties is provided to us by the operators. For example, the operators of the various properties provide us information regarding metals production, estimates of mineral reserves and additional mineralized material and production estimates. A list of our producing and development stage streams and royalties, as well their respective reserves, are summarized below in Table 1 within this Item 2. More information is available to the public regarding certain properties in which we have royalties, including reports filed with the SEC or with the Canadian securities regulatory agencies available at www.sec.gov or www.sedar.com, respectively.
The Company manages its business under two reportable segments, consisting of the acquisition and management of stream interests and the acquisition and management of royalty interests. The description of our principal streams and royalties set forth below includes the location, operator, stream or royalty rate, access and any material current developments at the property. For any reported production amounts discussed below, the Company considers reported production to relate to the amount of metal sales subject to our stream and royalty interests. Please refer to Item 7, MD&A, for discussion on production estimates, historical production and revenue for our principal properties. The map below illustrates the location of our principal producing and development stage properties.
Principal Producing Properties
The Company considers both historical and future potential revenues in determining which stream and royalty interests in our portfolio are principal to our business. Estimated future potential revenues
25
from both producing and development properties are based on a number of factors, including reserves subject to our stream and royalty interests, production estimates, feasibility studies, metal price assumptions, mine life, legal status and other factors and assumptions, any of which could change and could cause the Company to conclude that one or more of such stream and royalty interests are no longer principal to our business. Currently, the Company considers the properties discussed below (listed alphabetically by stream and royalty interest) to be principal to our business.
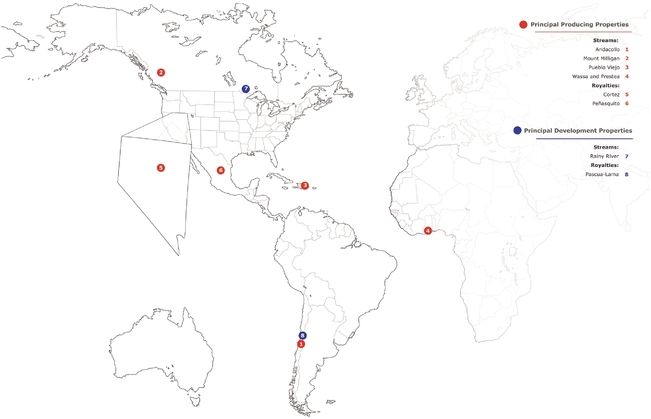
Stream Interests
Andacollo (Region IV, Chile)
As discussed in further detail in Item 1, Business, Fiscal 2016 Business Developments, RGLD Gold owns the right to purchase 100% of the gold produced from the Andacollo copper-gold mine until 900,000 ounces of payable gold have been delivered, 50% thereafter. The cash purchase price equals 15% of the monthly average gold price for the month preceding the delivery date for all gold purchased.
Andacollo is an open-pit mine and milling operation located in central Chile, Region IV in the Coquimbo Province and is operated by CMCA. The Andacollo mine is located in the foothills of the Andes Mountains approximately 1.5 miles southwest of the town of Andacollo. The regional capital of La Serena and the coastal city of Coquimbo are approximately 34 miles northwest of the Andacollo mine by road, and Santiago is approximately 215 miles south by air. Access to the mine is provided by Route 43 (R-43) south from La Serena to El Peñon. From El Peñon, D-51 is followed east and eventually curves to the south to Andacollo. Both R-43 and D-51 are paved roads.
Stream deliveries from Andacollo were 41,700 ounces of gold during the fiscal year ended June 30, 2016. Production attributable to our royalty interest at Andacollo during the fiscal year ended June 30, 2015, was 41,500 ounces of gold. Teck has indicated that they expect calendar 2016 gold grade and production to exceed calendar 2015.
26
Mount Milligan (British Columbia, Canada)
As of June 30, 2016, RGLD Gold owns the right to purchase 52.25% of the payable gold produced from the Mount Milligan copper-gold project in British Columbia, Canada, which is operated by Terrane, a subsidiary of Thompson Creek. The cash purchase price is equal to the lesser of $435 per ounce, with no inflation adjustment, or the prevailing market price. Please refer to Item 1, Business, Recent Business Developments, for a description of a proposed amendment to our stream interest at Mount Milligan in connection with the sale of Thompson Creek to Centerra.
The Mount Milligan project is an open-pit mine and is located within the Omenica Mining Division in North Central British Columbia, approximately 96 miles northwest of Prince George, 53 miles north of Fort St. James, and 59 miles west of Mackenzie. The Mount Milligan project is accessible by commercial air carrier to Prince George, British Columbia, then by vehicle from the east via Mackenzie on the Finlay Philip Forest Service Road and the North Philip Forest Service Road, and from the west via Fort St. James on the North Road and Rainbow Forest Service Road. Road travel to the Mount Milligan property site is 482 miles from Prince Rupert and 158 miles from Prince George.
Stream deliveries from Mount Milligan were 111,000 ounces of gold during the fiscal year ended June 30, 2016, an increase of approximately 50% when compared to the fiscal year ended June 30, 2015. The increase was due to higher mill throughput and gold grade.
Thompson Creek estimates that Mount Milligan gold production will be at the lower end of their calendar 2016 production guidance of 240,000 to 270,000 ounces.
Pueblo Viejo (Sanchez Ramirez, Dominican Republic)
On September 29, 2015, RGLD Gold acquired the right to purchase 7.5% of Barrick's interest in the gold produced from the Pueblo Viejo mine until 990,000 ounces of gold have been delivered, and 3.75% thereafter. The cash purchase price of the gold is 30% of the spot price of gold delivered until 550,000 ounces of gold have been delivered, and 60% of the spot price of gold per ounce delivered thereafter. RGLD Gold also owns the right to purchase 75% of Barrick's interest in the silver produced from the Pueblo Viejo mine, subject to a minimum silver recovery of 70%, until 50 million ounces of silver have been delivered, and 37.5% thereafter. The cash purchase price of the silver is 30% of the spot price of silver delivered until 23.1 million ounces of silver have been delivered, and 60% of the spot price per ounce of silver delivered thereafter.
The Pueblo Viejo mine is located in the province of Sanchez Ramirez, Dominican Republic, approximately 60 miles northwest of Santo Domingo, and is owned by a joint venture in which Barrick holds a 60% interest and is responsible for operations, and in which Goldcorp holds a 40% interest. Pueblo Viejo is accessed from Santo Domingo by traveling northwest on Autopista Duarte, Highway #1, approximately 48 miles to Piedra Blanca and proceeding east for approximately 14 miles on Highway #17 to the gatehouse for Pueblo Viejo. Both Highway #1 and Highway #17 are paved.
Stream deliveries from Pueblo Viejo were 42,200 ounces of gold and 532,600 ounces of silver during the fiscal year ended June 30, 2016. In November 2015, Barrick announced that two of three electric motors at the Pueblo Viejo oxygen plant experienced unexpected failures and that a comprehensive plan to mitigate the impact of the motor failure was implemented in December 2015, which involved installing a number of portable compressors. Barrick was able to restore capacity to 100% by mid-January 2016 with portable compressor motors. The first repaired motor was reinstalled and commissioned in late January 2016 and the second motor was repaired and reinstalled early February 2016.
In calendar 2016, Barrick expects improved throughput and plant availability as compared to calendar 2015 primarily due to overcoming the issues related to the oxygen plant motor failures which negatively impacted 2015 throughput. In addition, Barrick is focused on improving efficiency and
27
throughput through ore blending optimization, increasing autoclave availability, and optimization of maintenance strategies. A prefeasibility study is expected to be commissioned in the second half of calendar 2016 to evaluate a possible increase in tailings storage capacity, giving the potential to move a significant portion of the mine's 7.7 million ounces of gold and 44.7 million ounces of silver in measured and indicated resources to reserves.
Barrick delivers gold and silver to RGLD Gold on a quarterly basis (mid-March, June, September and December) based on Barrick's 60% indirect share of any provisional and final offtake settlements in the prior three calendar month period, subject to certain specific terms of the agreement (including a fixed silver recovery assumption of 70%). RGLD Gold usually sells gold and silver ounces over the three month period following physical receipt. All of these factors may result in a difference of produced ounces reported by Barrick and those reported as sold by Royal Gold for each quarter.
Wassa and Prestea (Western Region, Ghana)
As discussed in further detail in Item 1, Business, Fiscal 2016 Business Developments, on July 28, 2015, RGLD Gold acquired the right to purchase 9.25% of the gold produced from the Wassa and Prestea projects, operated by Golden Star, until the earlier of (i) December 31, 2017 or (ii) the date at which the Wassa and Prestea underground projects achieve commercial production. At that point, the stream percentage will increase to 10.5% of gold produced from the Wassa and Prestea mines until an aggregate 240,000 ounces have been delivered. Once the applicable delivery threshold is met, the stream percentage will decrease to 5.5% for the remaining term of the transaction.
The Wassa open pit mine and oxide ore mill are located near the village of Akyempim in the Wassa East District, in the Western Region of Ghana, approximately 50 miles north of Cape Coast and 93 miles west of the capital Accra. The main access to the site is from the east, via the Cape Coast to Twifo-Praso road, then over the combined road-rail bridge on the Pra River. There is also an access road from Takoradi in the south via Mpohor. An airport at Takoradi is capable of handling jet aircraft and is serviced by several commercial flights each day. Future Wassa production will come from both open pit and underground operations.
Prestea is currently an open pit operation producing oxide ore located in the Ashanti gold district in the central eastern section of the Western Region of Ghana, approximately 6 miles south of the town of Bogoso. Access to the property is by commercial air carrier to Accra and then by vehicle on a paved and gravel road.
Stream deliveries from Wassa and Prestea were 21,500 ounces of gold during the fiscal year ended June 30, 2016. Golden Star's total production in calendar 2016 is expected to be between 180,000 - 205,000 ounces of gold.
On July 12, 2016, Golden Star announced pre-commercial production commenced at Wassa underground gold mine, as scheduled. Wassa underground is expected to achieve commercial production in early calendar 2017, at which time it is expected to deliver 2,000 to 2,500 tonnes of ore per day. The Prestea underground project is currently in development with a planned average annual gold production of 90,000 ounces at a cash operating cost of $468 per ounce. Golden Star expects first production from the Prestea underground project in mid-calendar 2017.
Royalty Interests
Cortez (Nevada, USA)
Cortez is a series of large open-pits and underground mines, utilizing mill and heap leach processing, and is operated by Barrick. The operation is located approximately 60 air miles southwest of Elko, Nevada, in Lander County. The site is reached by driving west from Elko on Interstate 80 approximately 46 miles, and proceeding south on State Highway 306 approximately 23 miles. Our
28
royalty interest at Cortez applies to the Pipeline, South Pipeline, part of the Gap pit and the Crossroads deposit, which are operated by subsidiaries of Barrick.
The royalty interests we hold at Cortez include:
- (a)
- Reserve
Claims ("GSR1"). This is a sliding-scale GSR royalty for all products from an area originally known as the
"Reserve Claims," which includes the majority of the Pipeline and South Pipeline deposits. The GSR royalty rate on the Reserve Claims is tied to the gold price as shown in the table below and does not
include indexing for inflation or deflation.
- (b)
- GAS
Claims ("GSR2"). This is a sliding-scale GSR royalty for all products from an area outside of the Reserve
Claims, originally known as the "GAS Claims," which encompasses approximately 50% of the Gap deposit and all of the Crossroads deposit. The GSR royalty rate on the GAS Claims, as shown in the table
below, is tied to the gold price, without indexing for inflation or deflation.
- (c)
- Reserve
and GAS Claims Fixed Royalty ("GSR3"). The GSR3 royalty is a fixed rate GSR royalty of 0.7125% and covers
the same cumulative area as is covered by our two sliding-scale GSR royalties, GSR1 and GSR2, except mining claims that comprise the undeveloped Crossroads deposit.
- (d)
- Net Value Royalty ("NVR1"). This is a fixed 1.25% NVR on production from the GAS Claims located on a portion of Cortez that excludes the Pipeline open pit. The Company owns 81.098% of the 1.25% NVR (or 1.014%) while limited partners in Crescent Valley Partners, L.P., which is consolidated in our financial statements, own the remaining portion of the 1.25% NVR. A 0.618% portion of our NVR1 royalty covers the mining claims that comprise the Crossroads deposit.
We also own three other royalties in the Cortez area where there is currently no production and no reserves attributed to these royalty interests.
The following shows the current sliding-scale GSR1 and GSR2 royalty rates under our royalty agreement with Cortez:
London P.M. Quarterly Average Price of Gold Per Ounce ($U.S.) |
GSR1 and GSR2 Royalty Percentage |
|||
|---|---|---|---|---|
Below $210 |
0.40 | % | ||
$210.00 - $229.99 |
0.50 | % | ||
$230.00 - $249.99 |
0.75 | % | ||
$250.00 - $269.99 |
1.30 | % | ||
$270.00 - $309.99 |
2.25 | % | ||
$310.00 - $329.99 |
2.60 | % | ||
$330.00 - $349.99 |
3.00 | % | ||
$350.00 - $369.99 |
3.40 | % | ||
$370.00 - $389.99 |
3.75 | % | ||
$390.00 - $409.99 |
4.00 | % | ||
$410.00 - $429.99 |
4.25 | % | ||
$430.00 - $449.99 |
4.50 | % | ||
$450.00 - $469.99 |
4.75 | % | ||
$470.00 and above |
5.00 | % | ||
Production attributable to our royalty interest at Cortez decreased approximately 68% during our fiscal year ended June 30, 2016, when compared to the fiscal year ended June 30, 2015. The decrease was primarily due to Barrick's production focus on Cortez Hills, where we do not have a royalty interest, and reduced production from the Pipeline, South Pipeline and Gap pits, where our royalty applies, compared to the prior fiscal year. Barrick expects calendar 2016 gold production at Cortez,
29
subject to our royalty interests to be down compared to calendar 2015 production. Waste stripping at Crossroads, which is subject to our royalty interest, is expected to restart later in calendar 2016.
Peñasquito (Zacatecas, Mexico)
We own a production payment equivalent to a 2.0% NSR royalty on all metal production from the Peñasquito open-pit mine, located in the State of Zacatecas, Mexico, and operated by a subsidiary of Goldcorp Inc. ("Goldcorp"). The Peñasquito project is located approximately 17 miles west of the town of Concepción del Oro, Zacatecas, Mexico. The project, composed of two main deposits called Peñasco and Chile Colorado, hosts large gold, silver, zinc and lead reserves. The deposits contain both oxide and sulfide material, resulting in heap leach and mill processing. There are two access routes to the site. The first is via a turnoff from Highway 54 onto the State La Pardita road, then onto the Mazapil to Cedros State road. The second access is via the Salaverna by-pass road from Highway 54 approximately 16 miles south of Concepción del Oro. There is a private airport on site and commercial airports in the cities of Saltillo, Zacatecas and Monterrey.
Gold, silver, lead and zinc production attributable to our royalty interest at Peñasquito decreased approximately 21%, 13%, 15% and 2%, respectively, during the fiscal year ended June 30, 2016, when compared to the fiscal year ended June 30, 2015. The decrease in production is attributable to lower throughput, grades and recovery. Additionally, production decreased as a result of a 10-day shutdown during the June 2016 quarter for planned mill maintenance. By July 2016, the mill returned to normal operations. Over the next three calendar years, Goldcorp expects mining activities in the pit to be focused on lower grade ore in the upper parts of the Peñasco pit while stripping is emphasized to ensure an economically optimal pit shell design to maximize the net asset value of the operation. By calendar 2019, Goldcorp expects Peñasquito's gold production to benefit from mining higher grades at the bottom of the Peñasco pit and significantly enhanced metallurgical recoveries with the planned completion of the approval of the Pyrite Leach Project ("PLP") in July 2016. The PLP is expected to increase overall gold and silver recovery by treating the zinc tailings before discharge to the tailings storage facility. Construction activities continued on the Northern Well Field ("NWF") project with 15% of the total water production commissioned by June 30, 2016. The NWF remains on schedule for completion by the end of the September 2016 quarter.
Principal Development Stage Properties
The following is a description of our principal development stage properties. Reserves for our development stage properties are summarized below in Table 1 as part of this Item 2, Properties.
Pascua-Lama Project (Region III, Chile)
We own a 0.78% to 5.45% sliding-scale NSR royalty on the Pascua-Lama project, which straddles the border between Argentina and Chile, and is being developed by Barrick. The Company owns an additional royalty equivalent to 1.09% of proceeds from copper produced from the Chilean portion of the project, net of allowable deductions, sold on or after January 1, 2017. The Pascua-Lama project is located within 7 miles of Barrick's operating Veladero mine. Access to the project is from the city of Vallenar, Region III, Chile, via secondary roads C-485 to Alto del Carmen, Chile, and C-489 from Alto del Carmen to El Corral, Chile.
Our royalty interests are applicable to all gold and copper production from the portion of the Pascua-Lama project lying on the Chilean side of the border. In addition, our interest at Pascua-Lama contains certain contingent rights and obligations. Specifically, (i) if gold prices exceed $600 per ounce for any six month period during the first 36 months of commercial production from the project, the Company would make a one-time payment of $8.4 million; (ii) approximately 20% of the royalty is limited to 14.0 million ounces of gold produced from the project, while 24% of the royalty can be
30
extended beyond 14.0 million ounces of gold produced for a one-time payment of $4.4 million; and (iii) we also increased our interest in two one-time payments from $0.5 million to $1.5 million, which are payable by Barrick upon the achievement of certain production thresholds at Pascua-Lama.
The sliding-scale NSR royalty is based upon the gold price as shown in the following table:
London Bullion Market Association P.M. Monthly Average Price of Gold per Ounce (US$) |
NSR Royalty Percentage |
|||
|---|---|---|---|---|
less than $325 |
0.78 | % | ||
$400 |
1.57 | % | ||
$500 |
2.72 | % | ||
$600 |
3.56 | % | ||
$700 |
4.39 | % | ||
$800 or greater |
5.45 | % | ||
Note: Royalty rate is interpolated between the upper and lower endpoints.
Pascua-Lama is one of the world's largest gold and silver deposits with nearly 18 million ounces of proven and probable gold reserves, 676 million ounces of silver contained within the gold reserves, and an expected mine life of 25 years. Barrick expects Pascua-Lama to produce an average of 800,000 to 850,000 ounces of gold and 35 million ounces of silver annually during its first full five years of operation.
During the fourth quarter of calendar 2013, Barrick announced the temporary suspension of construction at Pascua-Lama, except for activities required for environmental and regulatory compliance. A decision to restart development will depend on improved economics and reduced uncertainty related to legal and regulatory requirements. Accordingly, the timing of any such decision to restart, permitting timelines, construction schedule and timing of first production are uncertain.
Rainy River (Ontario, Canada)
As discussed in further detail in Item 1, Business, Fiscal 2016 Business Developments, RGLD Gold owns the right to purchase 6.50% of the gold produced from the Rainy River project until 230,000 gold ounces have been delivered, and 3.25% thereafter; and 60% of the silver produced from the Rainy River project until 3.1 million silver ounces have been delivered, and 30% thereafter. The cash purchase price for the gold and silver ounces is 25% of the spot price per ounce of gold or silver at the time of delivery.
The Rainy River project is centered within the Richardson Township in northwestern Ontario, Canada, and is operated by New Gold. The project is approximately 40 miles northwest of Fort Frances and approximately 100 miles south of Kenora and approximately 260 miles west of Thunder Bay. The project site is easily accessible by a network of secondary all-weather roads that branch off the well-maintained Trans-Canada Highways 11 and 71.
Construction was initiated in calendar 2015. In July 2016, New Gold reported that overall construction was approximately 40%. During the June 2016 quarter, installation of the mechanical, piping, electrical and instrumentation equipment commenced in the grinding building and the primary crusher, and the first ball mill shell was installed. During the course of the construction of the water management facility earlier in calendar 2016, New Gold identified areas where the strength of the foundation is less than was estimated for the original designs. As a result, during the June 2016 quarter, New Gold submitted revised construction designs for regulatory review. New Gold anticipates receipt of the requisite permit amendments to begin remediation work on the water management facility within the September 2016 quarter. New Gold also is finalizing its review of the tailings management facility design, parts of which are similarly impacted by the foundation conditions, and plans to submit its proposed redesigns for regulatory review by mid-August 2016. With construction of the processing facilities and other components of the project on schedule, and the process of amending the water and tailings management facilities advancing as planned, New Gold continues to target first production at Rainy River in mid-2017.
31
Reserve Information
Table 1 below summarizes proven and probable reserves for gold, silver, copper, nickel, zinc, lead, cobalt and molybdenum that are subject to our stream and royalty interests as of December 31, 2015, as reported to us by the operators of the mines. Properties are currently in production unless noted as development ("DEV") within the table. The exploration royalties we own do not contain proven and probable reserves as of December 31, 2015. Please refer to pages 35-36 for the footnotes to Table 1.
Proven and Probable Gold Reserves
As of December 31, 2015(1)
| Gold(2) | ||||||||||||||||
|---|---|---|---|---|---|---|---|---|---|---|---|---|---|---|---|---|
| |
|
|
|
PROVEN + PROBABLE |
RESERVES(3)(4)(5) | |||||||||||
PROPERTY
|
ROYALTY | OPERATOR | LOCATION | Tons of Ore (M) |
Average Gold Grade (opt) |
Gold Contained Ozs(6) (M) |
||||||||||
Bald Mountain |
1.75% - 2.5% NSR(7) | Kinross | United States | 15.911 | 0.027 | 0.423 | ||||||||||
Cortez (Pipeline) GSR1 |
0.40 - 5.0% GSR(8) | Barrick | United States | 22.370 | 0.026 | 0.591 | ||||||||||
Cortez (Pipeline) GSR2 |
0.40 - 5.0% GSR(8) | Barrick | United States | 91.607 | 0.034 | 3.116 | ||||||||||
Cortez (Pipeline) GSR3 |
0.71% GSR | Barrick | United States | 32.641 | 0.023 | 0.744 | ||||||||||
Cortez (Pipeline) NVR1 |
1.01% NVR | Barrick | United States | 17.383 | 0.026 | 0.457 | ||||||||||
Cortez (Pipeline) NVR1C |
0.62% NVR | Barrick | United States | 81.336 | 0.036 | 2.963 | ||||||||||
Gold Hill(9) |
1.0 - 2.0% NSR(10) | Kinross | United States | 6.552 | 0.019 | 0.124 | ||||||||||
|
0.6 - 0.9% NSR(11) | |||||||||||||||
Goldstrike (SJ Claims) |
0.9% NSR | Barrick | United States | 0.000 | 0.000 | 0.000 | ||||||||||
Hasbrouck (DEV) |
1.5% NSR | West Kirkland/Clover Nevada | United States | 35.616 | 0.017 | 0.588 | ||||||||||
Leeville |
1.8% NSR | Newmont | United States | 4.614 | 0.218 | 1.005 | ||||||||||
Marigold (DEV) |
2.0% NSR | Silver Standard | United States | 148.220 | 0.013 | 1.867 | ||||||||||
Pinson |
3.0% NSR(12) | Waterton Precious Metals Fund | United States | 7.557 | 0.064 | 0.483 | ||||||||||
|
2.94% NSR(13) | |||||||||||||||
Robinson |
3.0% NSR | KGHM | United States | 159.465 | 0.005 | 0.827 | ||||||||||
Ruby Hill |
3.0% NSR | Waterton Precious Metals Fund | United States | 1.726 | 0.014 | 0.024 | ||||||||||
Soledad Mountain (DEV) |
3.0% NSR(14) | Golden Queen/Gauss LLC | United States | 51.052 | 0.019 | 0.984 | ||||||||||
Twin Creeks |
2.0% GPR | Newmont | United States | 0.932 | 0.080 | 0.075 | ||||||||||
Wharf |
0.0 - 2.0% NSR(15) | Coeur | United States | 28.670 | 0.027 | 0.763 | ||||||||||
Back River - Goose Lake (DEV) |
1.95% NSR(16) | Sabina Gold & Silver | Canada | 13.623 | 0.184 | 2.503 | ||||||||||
Canadian Malartic |
1.0 - 1.5% NSR(17) | Agnico Eagle/Yamana | Canada | 100.267 | 0.030 | 3.035 | ||||||||||
Holt |
0.00013 × quarterly avg. gold price | Kirkland Lake | Canada | 3.109 | 0.141 | 0.439 | ||||||||||
Kutcho Creek (DEV) |
2.0% NSR | Capstone Mining | Canada | 11.509 | 0.011 | 0.124 | ||||||||||
Mount Milligan |
52.25% of gold produced(18) | Thompson Creek | Canada | 558.219 | 0.010 | 5.689 | ||||||||||
Rainy River (DEV) |
6.5% of gold produced(19) | New Gold | Canada | 114.945 | 0.033 | 3.772 | ||||||||||
Pine Cove (DEV) |
7.5% NPI | Anaconda Mining | Canada | 2.905 | 0.060 | 0.175 | ||||||||||
Schaft Creek (DEV) |
3.5% NPI | Copper Fox/Teck | Canada | 1037.054 | 0.006 | 5.775 | ||||||||||
Williams |
0.97% NSR | Barrick | Canada | 8.847 | 0.055 | 0.483 | ||||||||||
Dolores |
3.25% NSR | Pan American | Mexico | 57.541 | 0.027 | 1.570 | ||||||||||
Mulatos |
1.0 - 5.0% NSR(20) | Alamos | Mexico | 49.287 | 0.031 | 1.543 | ||||||||||
Peñasquito(21) |
2.0% NSR (Oxide) | Goldcorp | Mexico | 24.008 | 0.013 | 0.310 | ||||||||||
|
2.0% NSR (Sulfide) | 646.704 | 0.015 | 9.870 | ||||||||||||
Andacollo |
100% of gold produced(22) | Teck | Chile | 459.664 | 0.004 | 1.609 | ||||||||||
El Morro |
1.4% NSR(23) | Goldcorp | Chile | 198.103 | 0.013 | 2.674 | ||||||||||
El Toqui |
0.0 - 3.0% NSR(24) | Nyrstar | Chile | 4.145 | 0.047 | 0.194 | ||||||||||
Pascua-Lama (DEV)(25) |
0.78 - 5.23% NSR(26) | Barrick | Chile | 320.645 | 0.046 | 14.680 | ||||||||||
Don Mario |
3.0% NSR | Orvana | Bolivia | 0.638 | 0.029 | 0.018 | ||||||||||
Don Nicolas (DEV) |
2.0% NSR | Compañía Inversora en Minas | Argentina | 1.327 | 0.148 | 0.196 | ||||||||||
Pueblo Viejo |
7.5% of gold produced(27) | Barrick (60%) | Dominican Republic | 103.481 | 0.087 | 8.960 | ||||||||||
El Limon |
3.0% NSR | B2Gold | Nicaragua | 1.378 | 0.126 | 0.173 | ||||||||||
La India (DEV) |
3.0% NSR | Condor Gold | Nicaragua | 7.606 | 0.089 | 0.675 | ||||||||||
Mara Rosa (DEV) |
1.0% NSR | Amarillo Gold | Brazil | 18.868 | 0.050 | 0.946 | ||||||||||
Balcooma (DEV) |
1.5% NSR | Consolidated Tin | Australia | 0.762 | 0.002 | 0.001 | ||||||||||
Celtic/Wonder North (DEV) |
1.5% NSR | Bligh Resources | Australia | 1.507 | 0.064 | 0.097 | ||||||||||
Gwalia Deeps |
1.5% NSR | St . Barbara | Australia | 8.666 | 0.219 | 1.900 | ||||||||||
Kundip (DEV) |
1.0 - 1.5% GSR(28) | ACH Minerals/Silver Lake | Australia | 3.097 | 0.099 | 0.307 | ||||||||||
Meekatharra (Nannine) (DEV) |
1.5% NSR | Metals X | Australia | 0.000 | 0.000 | 0.000 | ||||||||||
32
| Gold(2) | ||||||||||||||||
|---|---|---|---|---|---|---|---|---|---|---|---|---|---|---|---|---|
| |
|
|
|
PROVEN + PROBABLE |
RESERVES(3)(4)(5) | |||||||||||
PROPERTY
|
ROYALTY | OPERATOR | LOCATION | Tons of Ore (M) |
Average Gold Grade (opt) |
Gold Contained Ozs(6) (M) |
||||||||||
Meekatharra (Paddy's Flat) (DEV) |
1.5% NSR | Metals X | Australia | 3.858 | 0.125 | 0.483 | ||||||||||
|
A$10 per gold ounce produced(29) | |||||||||||||||
Meekatharra (Reedys) (DEV) |
1.5%, 1.5 - 2.5%, 1% NSR(30) | Metals X | Australia | 0.992 | 0.092 | 0.092 | ||||||||||
Meekatharra (Yaloginda) |
0.45% NSR | Metals X | Australia | 3.858 | 0.007 | 0.028 | ||||||||||
Red Dam |
2.5% NSR | Evolution Mining | Australia | 1.764 | 0.063 | 0.111 | ||||||||||
South Laverton |
1.5% NSR | Saracen | Australia | 7.961 | 0.065 | 0.516 | ||||||||||
Southern Cross |
1.5% NSR | China Hanking Holding | Australia | 3.286 | 0.070 | 0.229 | ||||||||||
Inata |
2.5% GSR | Avocet | Burkina Faso | 5.820 | 0.056 | 0.326 | ||||||||||
Taparko(31) |
2.0% GSR | Nord Gold | Burkina Faso | 5.978 | 0.084 | 0.502 | ||||||||||
Wassa and Prestea |
10.5% of gold produced(32) | Golden Star Resources | Ghana | 26.044 | 0.082 | 2.143 | ||||||||||
Svetloye (DEV) |
1.0% NSR | Polymetal | Russia | 8.069 | 0.082 | 0.664 | ||||||||||
Proven and Probable Silver Reserves
As of December 31, 2015(1)
| Silver(33) | ||||||||||||||||
|---|---|---|---|---|---|---|---|---|---|---|---|---|---|---|---|---|
| |
|
|
|
PROVEN + PROBABLE |
RESERVES(3)(4)(5) | |||||||||||
PROPERTY
|
ROYALTY | OPERATOR | LOCATION | Tons of Ore (M) |
Average Silver Grade (opt) |
Silver Contained Ozs(6) (M) |
||||||||||
Gold Hill |
1.0 - 2.0% NSR(10) | Kinross | United States | 6.552 | 0.278 | 1.823 | ||||||||||
|
0.6 - 0.9% NSR(11) | |||||||||||||||
Hasbrouck (DEV) |
1.5% NSR | West Kirkland/Clover Nevada | United States | 35.616 | 0.297 | 10.569 | ||||||||||
Soledad Mountain (DEV) |
3.0% NSR(14) | Golden Queen/Gauss LLC | United States | 51.052 | 0.324 | 16.516 | ||||||||||
Kutcho Creek (DEV) |
2.0% NSR | Capstone Mining | Canada | 11.509 | 1.009 | 11.618 | ||||||||||
Rainy River (DEV) |
60% Stream | New Gold | Canada | 114.945 | 0.082 | 9.410 | ||||||||||
Schaft Creek (DEV) |
3.5% NPI | Copper Fox/Teck | Canada | 1037.054 | 0.050 | 51.895 | ||||||||||
Dolores |
2.0% NSR | Pan American | Mexico | 57.541 | 0.923 | 53.100 | ||||||||||
Peñasquito(21) |
2.0% NSR (Oxide) | Goldcorp | Mexico | 24.008 | 0.642 | 15.410 | ||||||||||
|
2.0% NSR (Sulfide) | 646.704 | 0.876 | 566.550 | ||||||||||||
El Toqui |
0.0 - 3.0% NSR(24) | Nyrstar | Chile | 7.606 | 0.156 | 1.185 | ||||||||||
Don Mario |
3.0% NSR | Orvana | Bolivia | 0.638 | 0.740 | 0.472 | ||||||||||
Don Nicolas (DEV) |
2.0% NSR | Compañía Inversora en Minas | Argentina | 1.327 | 0.302 | 0.401 | ||||||||||
Pueblo Viejo |
75% of silver produced(27) | Barrick (60%) | Dominican Republic | 103.481 | 0.523 | 54.145 | ||||||||||
La India (DEV) |
3.0% NSR | Condor Gold | Nicaragua | 7.606 | 0.156 | 1.185 | ||||||||||
Balcooma (DEV) |
1.5% NSR | Consolidated Tin | Australia | 0.762 | 0.498 | 0.380 | ||||||||||
Svetloye (DEV) |
1.0% NSR | Polymetal | Russia | 8.069 | 0.095 | 0.765 | ||||||||||
33
Proven and Probable Base Metal Reserves
As of December 31, 2015(1)
| Copper(34) | ||||||||||||||||
|---|---|---|---|---|---|---|---|---|---|---|---|---|---|---|---|---|
| |
|
|
|
PROVEN + PROBABLE | RESERVES(3)(4)(5) | |||||||||||
PROPERTY
|
ROYALTY | OPERATOR | LOCATION | Tons of Ore (M) |
Average Base Metal Grade (%) |
Base Metal Contained Lbs(6) (M) |
||||||||||
Johnson Camp |
2.5% NSR | Excelsior Mining | United States | 111.200 | 0.295 | % | 656.000 | |||||||||
Robinson |
3.0% NSR | KGHM | United States | 159.465 | 0.431 | % | 1375.670 | |||||||||
Caber (DEV) |
1.0% NSR | Nyrstar | Canada | 0.676 | 0.839 | % | 11.355 | |||||||||
Kutcho Creek (DEV) |
2.0% NSR | Capstone Mining | Canada | 11.509 | 2.010 | % | 462.678 | |||||||||
Schaft Creek (DEV) |
3.5% NPI | Copper Fox/Teck | Canada | 1037.054 | 0.271 | % | 5630.715 | |||||||||
Voisey's Bay |
2.7% NSR | Vale | Canada | 39.793 | 1.048 | % | 834.075 | |||||||||
Don Mario |
3.0% NSR | Orvana | Bolivia | 0.638 | 0.887 | % | 11.319 | |||||||||
El Morro (DEV) |
1.4% NSR | Goldcorp | Chile | 198.103 | 0.494 | % | 1959.099 | |||||||||
Pascua-Lama (DEV)(35) |
1.05% NSR | Barrick | Chile | 320.645 | 0.085 | % | 548.177 | |||||||||
Balcooma (DEV) |
1.5% NSR | Consolidated Tin | Australia | 0.762 | 2.130 | % | 32.466 | |||||||||
Las Cruces |
1.5% NSR | First Quantum | Spain | 8.047 | 4.996 | % | 804.026 | |||||||||
| Lead(36) | ||||||||||||||||
|---|---|---|---|---|---|---|---|---|---|---|---|---|---|---|---|---|
| |
|
|
|
PROVEN + PROBABLE | RESERVES(3)(4)(5) | |||||||||||
PROPERTY
|
ROYALTY | OPERATOR | LOCATION | Tons of Ore (M) |
Average Base Metal Grade (%) |
Base Metal Contained Lbs(6) (M) |
||||||||||
Peñasquito(21) |
2.0% NSR (Sulfide) | Goldcorp | Mexico | 646.704 | 0.261 | % | 3701.260 | |||||||||
El Toqui |
0.0 - 3.0% NSR(24) | Nyrstar | Chile | 4.145 | 0.272 | % | 22.509 | |||||||||
Balcooma (DEV) |
1.5% NSR | Consolidated Tin | Australia | 0.762 | 0.517 | % | 7.879 | |||||||||
| Zinc(37) | ||||||||||||||||
|---|---|---|---|---|---|---|---|---|---|---|---|---|---|---|---|---|
| |
|
|
|
PROVEN + PROBABLE | RESERVES(3)(4)(5) | |||||||||||
PROPERTY
|
ROYALTY | OPERATOR | LOCATION | Tons of Ore (M) |
Average Base Metal Grade (%) |
Base Metal Contained Lbs(6) (M) |
||||||||||
Caber (DEV) |
1.0% NSR | Nyrstar | Canada | 0.676 | 8.577 | % | 116.036 | |||||||||
Kutcho Creek (DEV) |
2.0% NSR | Capstone Mining | Canada | 11.509 | 3.190 | % | 734.300 | |||||||||
Peñasquito(21) |
2.0% NSR (Sulfide) | Goldcorp | Mexico | 646.704 | 0.626 | % | 8885.920 | |||||||||
El Toqui |
0.0 - 3.0% NSR(24) | Nyrstar | Chile | 4.145 | 5.956 | % | 493.712 | |||||||||
Balcooma (DEV) |
1.5% NSR | Consolidated Tin | Australia | 0.762 | 1.921 | % | 29.274 | |||||||||
| NICKEL(38) | ||||||||||||||||
|---|---|---|---|---|---|---|---|---|---|---|---|---|---|---|---|---|
| |
|
|
|
PROVEN + PROBABLE | RESERVES(3)(4)(5) | |||||||||||
PROPERTY
|
ROYALTY | OPERATOR | LOCATION | Tons of Ore (M) |
Average Base Metal Grade (%) |
Base Metal Contained Lbs(6) (M) |
||||||||||
Voisey's Bay |
2.7% NSR | Vale | Canada | 39.793 | 2.237 | % | 1779.968 | |||||||||
| COBALT(39) | ||||||||||||||||
|---|---|---|---|---|---|---|---|---|---|---|---|---|---|---|---|---|
| |
|
|
|
PROVEN + PROBABLE | RESERVES(3)(4)(5) | |||||||||||
PROPERTY
|
ROYALTY | OPERATOR | LOCATION | Tons of Ore (M) |
Average Base Metal Grade (%) |
Base Metal Contained Lbs(6) (M) |
||||||||||
Voisey's Bay |
2.7% NSR | Vale | Canada | 39.793 | 0.130 | % | 103.331 | |||||||||
34
| MOLYBDENUM(40) | ||||||||||||||||
|---|---|---|---|---|---|---|---|---|---|---|---|---|---|---|---|---|
| |
|
|
|
PROVEN + PROBABLE | RESERVES(3)(4)(5) | |||||||||||
PROPERTY
|
ROYALTY | OPERATOR | LOCATION | Tons of Ore (M) |
Average Base Metal Grade (%) |
Base Metal Contained Lbs(6) (M) |
||||||||||
Schaft Creek (DEV) |
3.5% NPI | Copper Fox/Teck | Canada | 1037.054 | 0.018 | % | 373.340 | |||||||||
- (1)
- Reserves
have been reported by the operators of record as of December 31, 2015, with the exception of the following properties: Don
Mario—September 30, 2015; Gwalia Deeps, South Laverton—June 30, 2015; Hasbrouck Mountain—June 3, 2015; Wharf—June 1, 2015;
Svetloye—January 1, 2015; Bald Mountain, El Morro, El Toqui, Gold Hill, Holt, Inata, La India, Meekatharra (Nannine, Paddy's Flat, Reedys and Yaloginda), Pinson, Rainy River, Ruby
Hill and Soledad Mountain—December 31, 2014; Back River—October 21, 2014; Kundip—June 30, 2014; Celtic/Wonder
North—November 21, 2013; Schaft Creek—December 31, 2012; Don Nicolas, Johnson Camp and Pascua-Lama—December 31, 2011; Mara
Rosa—October 28, 2011; Balcooma—June 30, 2011; Kutcho Creek—February 15, 2011; Pine Cove—June 30, 2010; and
Caber—July 18, 2007.
- (2)
- Gold
reserves were calculated by the operators at the following per ounce prices: A$1,500—South Laverton;
A$1,474—Southern Cross $1,450—Kundip; A$1,400—Celtic/Wonder North and Meekatharra (Nannine, Paddy's Flat, Reedys and Yaloginda); $1,366—Schaft Creek;
$1,350—El Toqui; A$1,310—Red Dam; $1,300—El Morro, Pinson and Svetloye; $1,275—Wharf; $1,250—Back River, Holt, Inata, La India, Mount
Milligan, Mulatos and Soledad Mountain; A$1,250—Gwalia Deeps; $1,225—Hasbrouck Mountain; $1,200—Andacollo, El Limon, Gold Hill, Leeville, Pascua-Lama, Robinson,
Taparko and Twin Creeks; $1,180—Dolores; $1,150—Canadian Malartic; $1,100—Bald Mountain, Don Mario, Don Nicolas, Mara Rosa, Marigold, Peñasquito,
Ruby Hill, Wassa, Bogoso and Prestea and Williams; $1,000—Cortez, Goldstrike and Pueblo Viejo; and $983—Pine Cove. No gold price was reported for Balcooma, Caber or Kutcho
Creek.
- (3)
- Set
forth below are the definitions of proven and probable reserves used by the U.S. Securities and Exchange Commission. "Reserve" is that
part of a mineral deposit which could be economically and legally extracted or produced at the time of the reserve determination. "Proven (Measured) Reserves" are reserves for which
(a) quantity is computed from dimensions revealed in outcrops, trenches, workings or drill holes, and the grade is computed from the results of detailed sampling, and (b) the sites for
inspection, sampling and measurement are spaced so closely and the geologic character is so well defined that the size, shape, depth and mineral content of the reserves are well established.
"Probable (Indicated) Reserves" are reserves for which the quantity and grade are computed from information similar to that used for proven (measured) reserves, but the sites for inspection, sampling and measurement are farther apart or are otherwise less adequately spaced. The degree of assurance of probable (indicated) reserves, although lower than that for proven (measured) reserves, is high enough to assume geological continuity between points of observation.
- (4)
- Royal
Gold has disclosed a number of reserve estimates that are provided by operators that are foreign issuers and are not based on the U.S.
Securities and Exchange Commission's definitions for proven and probable reserves. For Canadian issuers, definitions of "mineral reserve," "proven mineral reserve," and "probable mineral reserve"
conform to the Canadian Institute of Mining, Metallurgy and Petroleum definitions of these terms as of the effective date of estimation as required by National Instrument 43-101 of the Canadian
Securities Administrators. For Australian issuers, definitions of "mineral reserve," "proven mineral reserve," and "probable mineral reserve" conform with the Australasian Code for Reporting of
Mineral Resources and Ore Reserves prepared by the Joint Ore Reserves Committee of the Australasian Institute of Mining and Metallurgy, Australian Institute of Geoscientists and Minerals Council of
Australia, as amended ("JORC Code"). Royal Gold does not reconcile the reserve estimates provided by the operators with definitions of reserves used by the U.S. Securities and Exchange Commission.
- (5)
- The
reserves reported are either estimates received from the various operators or are based on documentation material provided to Royal Gold
or which is derived from recent publicly-available information from the operators of the various properties or various recent National Instrument 43-101 or JORC Code reports filed by operators.
Royal Gold did not prepare reserve or feasibility studies and does not have the ability to independently confirm any reserve information presented. Accordingly, Royal Gold is not able to reconcile the
reserve estimates prepared in reliance on National Instrument 43-101 or JORC Code with definitions of the U.S. Securities and Exchange Commission.
- (6)
- "Contained
ounces" or "contained pounds" do not take into account recovery losses in mining and processing the ore.
- (7)
- NSR
sliding-scale schedule (price of gold per ounce—royalty rate): Below $375 - 1.75%; >$375 to
$400 - 2.0%; >$400 to $425 - 2.25%; >$425 - 2.5%. All price points are stated in 1986 dollars and are subject to adjustment in accordance with a blended index
comprised of labor, diesel fuel, industrial commodities and mining machinery.
- (8)
- GSR
sliding-scale schedule (price of gold per ounce—royalty rate): Below $210 - 0.40%; $210 to $229.99 - 0.50%; $230 to $249.99 -
0.75%; $250 to $269.99 - 1.30%; $270 to $309.99 - 2.25%; $310 to $329.99 - 2.60%; $330 to $349.99 - 3.00%; $350 to $369.99 - 3.40%; $370 to $389.99—$3.75%; $390 to $409.99 - 4.0%; $410 to
$429.99 - 4.25%; $430 to $449.99 - 4.50%; $450 to $469.99 - 4.75%; $470 and higher—5.00%.
- (9)
- The
royalty is capped at $10 million. As of June 30, 2016, royalty payments of approximately $4.2 million have been
received.
- (10)
- The
1.0% to 2.0% sliding-scale NSR royalty will pay 2.0% when the price of gold is above $350 per ounce and 1.0% when the price of gold
falls to $350 per ounce or below. The 0.6% to 0.9% NSR sliding-scale schedule (price of gold per ounce—royalty rate): Below $300 - 0.6%; $300 to $350 - 0.7%; > $350 to $400 - 0.8%; > $400
-0.9%. The silver royalty rate is based on the price of gold.
- (11)
- The
0.6% to 0.9% sliding-scale NSR applies to the M-ACE claims. The operator did not break out reserves or resources subject to the M-ACE
claims royalty.
- (12)
- Royalty
only applies to Section 29 which currently holds about 95% of the reserves reported for the property. An additional
Cordilleran royalty applies to a portion of Section 28.
- (13)
- Additional Rayrock royalties apply to Sections 28, 32 and 33; these royalty rates vary depending on pre-existing royalties. The Rayrock royalties take effect once 200,000 ounces of gold have been produced from open pit mines on the property. As of June 30, 2016, approximately 103,000 ounces have been produced.
35
- (14)
- Royalty
is capped at $300,000 plus simple interest.
- (15)
- NSR
sliding-scale schedule (price of gold per ounce—royalty rate): $0.00 to under $350 - 0.0%; $350 to under
$400 - 0.5%; $400 to under $500 - 1.0%; $500 or higher—2.0%.
- (16)
- Goose
Lake royalty applies to production above 400,000 ounces.
- (17)
- NSR
sliding-scale schedule (price of gold per ounce—royalty rate): $0.00 to $350 - 1.0%; above $350 - 1.5%.
- (18)
- Thompson
Creek will deliver 52.25% of gold produced, at a purchase price equal to the lesser of $435 per ounce delivered or the prevailing
spot price.
- (19)
- New
Gold will deliver: (a) gold in amounts equal to 6.50% of gold produced until 230,000 ounces have been delivered, and 3.25% of
gold produced thereafter, and (b) silver in amounts equal to 60% of silver produced until 3.10 million ounces have been delivered, and 30% of silver produced thereafter, in each case at
a purchase price equal to 25% of the spot price per ounce delivered.
- (20)
- The
Company's royalty is subject to a 2.0 million ounce cap on gold production. There have been approximately 1.55 million
ounces of cumulative production as of June 30, 2016. NSR sliding-scale schedule (price of gold per ounce—royalty rate): $0.00 to $299.99 - 1.0%; $300 to $324.99 - 1.50%; $325 to
$349.99 - 2.0%; $350 to $374.99 - 3.0%; $375 to $399.99 - 4.0%; $400 or higher—5.0%.
- (21)
- Operator
reports reserves by material type. The sulfide material will be processed by milling. The oxide material will be processed by heap
leaching.
- (22)
- Teck
will deliver gold in amounts equal to 100% of payable gold until 900,000 ounces have been delivered, and 50% of payable gold
thereafter, subject to a fixed payable percentage of 89%, at a purchase price equal to 15% of the monthly average gold price for the month preceding the delivery date for each ounce delivered.
- (23)
- The
royalty covers approximately 30% of the La Fortuna deposit. Reserves attributable to Royal Gold's royalty represent 3/7 of Goldcorp's
reporting of 70% of the total reserve.
- (24)
- All
metals are paid based on zinc prices. NSR sliding-scale schedule (price of zinc per pound—royalty rate): Below $0.50 - 0.0%;
$0.50 to below $0.55 - 1.0%; $0.55 to below $0.60 - 2.0%; $0.60 or higher—3.0%.
- (25)
- Royalty
applies to all gold production from an area of interest in Chile. Only that portion of the reserves pertaining to our royalty
interest in Chile is reflected here. Approximately 20% of the royalty is limited to the first 14.0 million ounces of gold produced from the project. Also, 24% of the royalty can be extended
beyond 14.0 million ounces produced for $4.4 million. In addition, a one-time payment totaling $8.4 million will be made if gold prices exceed $600 per ounce for any six-month
period within the first 36 months of commercial production.
- (26)
- NSR
sliding-scale schedule (price of gold per ounce—royalty rate): less than or equal to $325 - 0.78%; $400 - 1.57%;
$500—$2.72%; $600 - 3.56%; $700 - 4.39%; greater than or equal to $800 - 5.23%. Royalty is interpolated between lower and upper endpoints.
- (27)
- Barrick
will deliver: (a) gold in amounts equal to 7.50% of Barrick's 60% interest in gold produced until 990,000 ounces have been
delivered, and 3.75% of Barrick's 60% interest in gold produced thereafter, at a purchase price equal to 30% of the spot price per ounce delivered until 550,000 ounces have been delivered, and 60% of
the spot price per ounce delivered thereafter; and (b) silver in amounts equal to 75% of Barrick's 60% interest in silver produced, subject to a minimum silver recovery of 70%, until
50 million ounces have been delivered, and 37.50% of Barrick's 60% interest in silver produced thereafter, at a purchase price equal to 30% of the spot price per ounce delivered until
23.10 million ounces of silver have been delivered, and 60% of the spot price per ounce delivered thereafter.
- (28)
- Royalty
pays 1.0% for the first 250,000 ounces of production and then 1.5% for production above 250,000 ounces.
- (29)
- The
A$10 per ounce royalty applies on production above 50,000 ounces.
- (30)
- The
1.5% to 2.5% NSR sliding-scale royalty pays at a rate of 1.5% for the first 75,000 ounces produced in any 12 month period and at
a rate of 2.5% on production above 75,000 ounces during that 12 month period. The 1.0% NSR royalty applies to the Rand area only.
- (31)
- There
is a 0.75% GSR milling royalty that applies to ore that is mined outside of the defined area of the Taparko-Bouroum project that is
processed through the Taparko facilities up to a maximum of 1.1 million tons per year.
- (32)
- Golden
Star will deliver 9.25% of gold produced, until the earlier of (a) December 31, 2017 or (b) the date at which
the Wassa and Prestea underground projects achieve commercial production, at which point Golden Star will deliver 10.5% (or 10.9% if Royal Gold's total investment increases from $145 million to
$150 million) of gold produced until 240,000 ounces have been delivered (or 250,000 ounces if the total investment increases from $145 million to $150 million), at a purchase
price equal to 20% of the spot price per ounce delivered. Thereafter Golden Star will deliver 5.5% of gold produced, at a purchase price equal to 30% of the spot price per ounce delivered.
- (33)
- Silver
reserves were calculated by the operators at the following prices per ounce: $25.96—Schaft Creek; $25.00—Don
Nicolas; $23.00—El Toqui; $22.50—Svetloye; $20.00—Gold Hill; $17.50—Hasbrouck Mountain; $17.00—Dolores and Soledad; $16.50—Don
Mario and Peñasquito; and $15.00—Pueblo Viejo. No silver price was reported for Balcooma or Kutcho Creek.
- (34)
- Copper
reserves were calculated by the operators at the following prices per pound: $3.52—Schaft Creek;
$3.21—Robinson $3.00—El Morro; $2.98—Voisey's Bay; $2.75—Don Mario; $2.70—Las Cruces; $2.50—Johnson Camp; and
$2.00—Pascua-Lama. No copper reserve price was reported for Balcooma, Caber or Kutcho Creek.
- (35)
- Royalty
applies to all copper production from an area of interest in Chile. Only that portion of the reserves pertaining to our royalty
interest in Chile is reflected here. This royalty will take effect after January 1, 2017.
- (36)
- Lead
reserve price was calculated by the operators at the following prices per pound: $1.04—El Toqui; and
$0.90—Peñasquito. No lead reserve price was reported for Balcooma.
- (37)
- Zinc
reserve price was calculated by the operators at the following prices per pound: $1.13—El Toqui; and
$0.95—Peñasquito. No zinc reserve price was reported for Balcooma, Caber or Kutcho Creek.
- (38)
- Nickel
reserve price was calculated by the operator at the following price per pound: $6.61—Voisey's Bay.
- (39)
- Cobalt
reserve price was calculated by the operator at the following price per pound: $12.81—Voisey's Bay.
- (40)
- Molybdenum reserve price was calculated by the operator at the following price per pound: $15.30—Schaft Creek.
36
Refer to Note 15 of the notes to consolidated financial statements for a discussion on litigation associated with our Voisey's Bay royalty.
ITEM 4. MINE SAFETY DISCLOSURE
Not applicable.
ITEM 5. MARKET FOR REGISTRANT'S COMMON EQUITY, RELATED STOCKHOLDER MATTERS AND ISSUER PURCHASES OF EQUITY SECURITIES
Market Information and Current Stockholders
Our common stock is traded on the NASDAQ Global Select Market ("NASDAQ") under the symbol "RGLD" on the TSX under the symbol "RGL" until July 8, 2016, when we voluntarily delisted from the TSX. The following table sets forth, for each of the quarterly periods indicated, the range of high and low sales prices, in U.S. dollars, for our common stock on NASDAQ for each quarter since July 1, 2014.
As of July 28, 2016, there were 884 stockholders of record of our common stock.
| |
|
Sales Prices | |||||||
|---|---|---|---|---|---|---|---|---|---|
Fiscal Year:
|
High | Low | |||||||
| 2016 | First Quarter (July, Aug., Sept.—2015) | $ | 63.99 | $ | 42.21 | ||||
| Second Quarter (Oct., Nov., Dec.—2015) | $ | 53.47 | $ | 34.42 | |||||
| Third Quarter (Jan., Feb., Mar.—2016) | $ | 53.32 | $ | 24.68 | |||||
| Fourth Quarter (April, May, June—2016) | $ | 72.04 | $ | 49.50 | |||||
2015 |
First Quarter (July, Aug., Sept.—2014) |
$ |
82.84 |
$ |
63.86 |
||||
| Second Quarter (Oct., Nov., Dec.—2014) | $ | 72.81 | $ | 55.55 | |||||
| Third Quarter (Jan., Feb., Mar.—2015) | $ | 77.20 | $ | 57.55 | |||||
| Fourth Quarter (April, May, June—2015) | $ | 67.99 | $ | 61.00 | |||||
Dividends
We have paid a cash dividend on our common stock for each year beginning in calendar year 2000. Our board of directors has discretion in determining whether to declare a dividend based on a number of factors including prevailing gold prices, economic market conditions and funding requirements for future opportunities or operations.
For calendar year 2016, our annual dividend is $0.92 per share of common stock. We paid the first payment of $0.23 per share on January 22, 2016, to common stockholders of record at the close of business on January 8, 2016. We paid the second payment of $0.23 per share on April 15, 2016, to common stockholders of record at the close of business on April 1, 2016. We paid the third payment of $0.23 per share on July 15, 2016 to common stockholders of record at the close of business on July 1, 2016. Subject to board approval, we anticipate paying the fourth payment of $0.23 per share on October 14, 2016, to common shareholders of record at the close of business on September 30, 2016.
For calendar year 2015, our annual dividend was $0.88 per share of common stock and exchangeable shares (for April 2015 and July 2015 dividend payments only), paid on a quarterly basis of $0.22 per share. For calendar year 2014, we paid an annual dividend of $0.84 per share of common stock and exchangeable shares in four quarterly payments of $0.21 each.
37
ITEM 6. SELECTED FINANCIAL DATA
| |
Fiscal Years Ended June 30, | |||||||||||||||
|---|---|---|---|---|---|---|---|---|---|---|---|---|---|---|---|---|
| |
2016 | 2015 | 2014 | 2013 | 2012 | |||||||||||
| |
(Amounts in thousands, except per share data) |
|||||||||||||||
Revenue(1) |
$ | 359,790 | $ | 278,019 | $ | 237,162 | $ | 289,224 | $ | 263,054 | ||||||
Operating income |
$ | 4,816 | $ | 87,235 | $ | 108,720 | $ | 171,167 | $ | 156,634 | ||||||
Net (loss) income |
$ | (82,438 | ) | $ | 52,678 | $ | 63,472 | $ | 73,409 | $ | 98,309 | |||||
Net (loss) income available to Royal Gold common stockholders |
$ | (77,149 | ) | $ | 51,965 | $ | 62,641 | $ | 69,153 | $ | 92,476 | |||||
Net (loss) income per share available to Royal Gold common stockholders: |
||||||||||||||||
Basic |
$ | (1.18 | ) | $ | 0.80 | $ | 0.96 | $ | 1.09 | $ | 1.61 | |||||
Diluted |
$ | (1.18 | ) | $ | 0.80 | $ | 0.96 | $ | 1.09 | $ | 1.61 | |||||
Dividends declared per common share(2) |
$ | 0.91 | $ | 0.87 | $ | 0.83 | $ | 0.75 | $ | 0.56 | ||||||
| |
As of June 30, | |||||||||||||||
|---|---|---|---|---|---|---|---|---|---|---|---|---|---|---|---|---|
| |
2016 | 2015 | 2014 | 2013 | 2012 | |||||||||||
| |
(Amounts in thousands) |
|||||||||||||||
Stream and royalty interests, net |
$ | 2,848,087 | $ | 2,083,608 | $ | 2,109,067 | $ | 2,120,268 | $ | 1,890,988 | ||||||
Total assets |
$ | 3,066,552 | $ | 2,917,191 | $ | 2,882,316 | $ | 2,895,747 | $ | 2,365,290 | ||||||
Debt |
$ | 600,685 | $ | 313,869 | $ | 302,632 | $ | 292,669 | $ | 282,172 | ||||||
Total liabilities |
$ | 780,667 | $ | 501,264 | $ | 509,759 | $ | 525,111 | $ | 501,861 | ||||||
Total Royal Gold stockholders' equity |
$ | 2,229,016 | $ | 2,353,122 | $ | 2,354,725 | $ | 2,348,887 | $ | 1,838,459 | ||||||
- (1)
- Please
refer to Item 7, MD&A, of this report for a discussion of recent developments that contributed to our 29% increase in revenue
during fiscal year 2016 when compared to fiscal year 2015 and the 17% increase in revenue during fiscal year 2015 when compared to fiscal year 2014.
- (2)
- The 2016, 2015, 2014, 2013 and 2012 calendar year dividends were $0.92, $0.88, $0.84, $0.80 and $0.60, respectively, as approved by our board of directors. Please refer to Item 5 of this report for further information on our dividends.
ITEM 7. MANAGEMENT'S DISCUSSION AND ANALYSIS OF FINANCIAL CONDITION AND RESULTS OF OPERATIONS
Overview
Royal Gold, Inc. ("Royal Gold", the "Company", "we", "us", or "our"), together with its subsidiaries, is engaged in the business of acquiring and managing precious metal streams, royalties, and similar interests. We seek to acquire existing stream and royalty interests or to finance projects that are in production or in the development stage in exchange for stream or royalty interests.
We manage our business under two segments:
Acquisition and Management of Stream Interests—A metal stream is a purchase agreement that provides, in exchange for an upfront deposit payment, the right to purchase all or a portion of one or more metals produced from a mine, at a price determined for the term of the agreement. As of June 30, 2016, we owned stream interests on four producing properties and three development stage properties. As discussed further in Item 1, Business, Fiscal 2016 Business Developments, we invested approximately $1.3 billion in stream interests in our fiscal year 2016, including stream interests relating to Pueblo Viejo, Andacollo, Wassa and Prestea, and Rainy River. Stream interests accounted for
38
approximately 66% and 34% of our total revenue for the fiscal years ended June 30, 2016 and 2015, respectively. We expect stream interests to continue growing as a proportion of our total revenue.
Acquisition and Management of Royalty Interests—Royalties are non-operating interests in mining projects that provide the right to revenue or metals produced from the project after deducting specified costs, if any. As of June 30, 2016, we owned royalty interests on 34 producing properties, 21 development stage properties and 131 exploration stage properties, of which we consider 50 to be evaluation stage projects. We use "evaluation stage" to describe exploration stage properties that contain mineralized material and on which operators are engaged in the search for reserves. Royalties accounted for approximately 34% and 66% of our total revenue for the fiscal years ended June 30, 2016 and 2015, respectively.
We do not conduct mining operations on the properties in which we hold stream and royalty interests, and except for our interest in the Peak Gold, LLC joint venture, we are not required to contribute to capital costs, exploration costs, environmental costs or other operating costs on those properties.
In the ordinary course of business, we engage in a continual review of opportunities to acquire existing stream and royalty interests, to establish new streams on operating mines, to create new stream and royalty interests through the financing of mine development or exploration, or to acquire companies that hold stream and royalty interests. We currently, and generally at any time, have acquisition opportunities in various stages of active review, including, for example, our engagement of consultants and advisors to analyze particular opportunities, analysis of technical, financial and other confidential information, submission of indications of interest and term sheets, participation in preliminary discussions and negotiations and involvement as a bidder in competitive processes.
Our financial results are primarily tied to the price of gold and, to a lesser extent, the price of silver and copper, together with the amounts of production from our producing stage stream and royalty interests. For the fiscal years ended June 30, 2016, 2015 and 2014, gold, silver, and copper price averages and percentage of revenue by metal were as follows:
| |
Fiscal Year Ended | ||||||||||||||||||
|---|---|---|---|---|---|---|---|---|---|---|---|---|---|---|---|---|---|---|---|
| |
June 30, 2016 | June 30, 2015 | June 30, 2014 | ||||||||||||||||
Metal
|
Average Price |
Percentage of Revenue |
Average Price |
Percentage of Revenue |
Average Price |
Percentage of Revenue |
|||||||||||||
Gold ($/ounce |
$ | 1,168 | 88 | % | $ | 1,224 | 81 | % | $ | 1,296 | 72 | % | |||||||
Silver ($/ounce) |
$ | 15.32 | 3 | % | $ | 17.36 | 3 | % | $ | 20.57 | 6 | % | |||||||
Copper ($/pound) |
$ | 2.22 | 4 | % | $ | 2.89 | 7 | % | $ | 3.18 | 8 | % | |||||||
Other |
N/A | 5 | % | N/A | 9 | % | N/A | 14 | % | ||||||||||
Operators' Production Estimates by Stream and Royalty Interest for Calendar 2016
We received annual production estimates from many of the operators of our producing mines during the first calendar quarter of 2016. The following table shows such production estimates for our principal producing properties for calendar 2016 as well as the actual production reported to us by the various operators through June 30, 2016. The estimates and production reports are prepared by the operators of the mining properties. We do not participate in the preparation or calculation of the operators' estimates or production reports and have not independently assessed or verified the accuracy of such information. Please refer to Part I, Item 2, Properties, of this report for further discussion on any updates at our principal producing and development properties.
39
Operators' Estimated and Actual Production by Stream and Royalty Interest for Calendar 2016
Principal Producing Properties
| |
Calendar 2016 Operator's Production Estimate(1) | Calendar 2016 Operator's Production Actual(2)(3) |
|||||||||||
|---|---|---|---|---|---|---|---|---|---|---|---|---|---|
Stream/Royalty
|
Gold (oz.) |
Silver (oz.) |
Base Metals (lbs.) |
Gold (oz.) |
Silver (oz.) |
Base Metals (lbs.) |
|||||||
Stream: |
|||||||||||||
Andacollo(4) |
57,600 | — | — | 25,300 | — | — | |||||||
Mount Milligan(5) |
240,000 - 270,000 | — | — | 99,700 | — | — | |||||||
Pueblo Viejo(6) |
600,000 - 650,000 | Not provided | 321,900 | Not provided | — | ||||||||
Wassa and Prestea(7) |
180,000 - 205,000 | 95,700 | |||||||||||
Royalty: |
|
|
|
|
|
||||||||
Cortez GSR1 |
119,200 | — | — | 31,800 | — | — | |||||||
Cortez GSR2 |
1,300 | — | — | 2,700 | — | — | |||||||
Cortez GSR3 |
120,500 | — | — | 34,400 | — | — | |||||||
Cortez NVR1 |
68,900 | — | — | 23,700 | — | — | |||||||
Peñasquito(8)(9) |
520,000 - 580,000 | 22 - 24 million | — | 161,000 | 7.8 million | — | |||||||
Lead(8)(9) |
145 - 155 million | 46.1 million | |||||||||||
Zinc(8)(9) |
375 - 400 million | 109.4 million | |||||||||||
- (1)
- Production
estimates received from our operators are for calendar 2016. There can be no assurance that production estimates received from our
operators will be achieved. Please refer to our cautionary language regarding forward-looking statements following this MD&A, as well as the Risk Factors identified in Part I, Item 1A,
of this report for information regarding factors that could affect actual results.
- (2)
- Actual
production figures shown are for the period January 1, 2016 through June 30, 2016, unless otherwise noted.
- (3)
- Actual
production figures for Cortez are based on information provided to us by the operators, and actual production figures for Andacollo,
Mount Milligan, Peñasquito (gold) and Wassa and Prestea are the operators' publicly reported figures.
- (4)
- The
estimated and actual production figures shown for Andacollo are contained gold in concentrate.
- (5)
- The
estimated and actual production figures shown for Mount Milligan are payable gold in concentrate.
- (6)
- The
estimated and actual production figures shown are payable gold in doré and represent Barrick's 60% interest in Pueblo
Viejo.
- (7)
- The
estimated production figure shown is payable gold in doré.
- (8)
- The
estimated gold and silver production figures reflect payable gold and silver in concentrate and doré, while the estimated
lead and zinc production figures reflect payable metal in concentrate.
- (9)
- The Company's royalty interest at Peñasquito includes gold, silver, lead and zinc. Actual production for the quarter ended March 31, 2016, was not available from the operator as of the date of this report.
40
Historical Production
The following table discloses historical production for the past three fiscal years for the principal producing properties that are subject to our stream and royalty interests, as reported to us by the operators of the mines:
Historical Production(1) by Stream and Royalty Interest
Principal Producing Properties
For the Fiscal Years Ended June 30, 2016, 2015 and 2014
Stream/Royalty
|
Metal | 2016 | 2015 | 2014 | ||||||||
|---|---|---|---|---|---|---|---|---|---|---|---|---|
Stream: |
||||||||||||
Mount Milligan |
Gold | 108,800 oz. | 76,900 oz. | 21,100 oz. | ||||||||
Andacollo |
Gold | 41,600 oz. | N/A | N/A | ||||||||
Pueblo Viejo |
Gold | 31,200 oz. | N/A | N/A | ||||||||
|
Silver | 208,900 oz. | N/A | N/A | ||||||||
Wassa and Prestea |
Gold | 20,100 oz. | N/A | N/A | ||||||||
Royalty: |
|
|||||||||||
Peñasquito |
Gold | 584,000 oz. | 742,100 oz. | 534,200 oz. | ||||||||
|
Silver | 21.4M oz. | 24.6M oz. | 27.7M oz. | ||||||||
|
Lead | 134.2 Mlbs. | 158.4 Mlbs. | 175.5 Mlbs. | ||||||||
|
Zinc | 333.0 Mlbs. | 340.8 Mlbs. | 310.9 Mlbs. | ||||||||
Cortez GSR1 |
Gold | 62,600 oz. | 153,000 oz. | 7,600 oz. | ||||||||
Cortez GSR2 |
Gold | 11,400 oz. | 76,000 oz. | 87,800 oz. | ||||||||
Cortez GSR3 |
Gold | 74,000 oz. | 229,000 oz. | 95,400 oz. | ||||||||
Cortez NVR1 |
Gold | 52,100 oz. | 167,000 oz. | 84,400 oz. | ||||||||
Holt(2) |
Gold | 58,300 oz. | 61,500 oz. | 63,100 oz. | ||||||||
Voisey's Bay(2) |
Nickel | 78.6 Mlbs. | 62.8 Mlbs. | 123.7 Mlbs. | ||||||||
|
Copper | 56.2 Mlbs. | 64.8 Mlbs. | 80.5 Mlbs. | ||||||||
Andacollo |
Gold | — oz. | 41,500 oz. | 50,400 oz. | ||||||||
- (1)
- Historical
production relates to the amount of metal sales, subject to our stream and royalty interests for each fiscal year presented, as
reported to us by the operators of the mines, and may differ from stream deliveries discussed in Item 2, Properties, or from the operators' public reporting.
- (2)
- Royalty no longer considered principal to our business as of June 30, 2016.
Critical Accounting Policies
Listed below are the accounting policies that the Company believes are critical to its financial statements due to the degree of uncertainty regarding the estimates or assumptions involved and the magnitude of the asset, liability, revenue or expense being reported. Please refer to Note 2 of the notes to consolidated financial statements for a discussion on recently issued accounting pronouncements.
Use of Estimates
The preparation of our financial statements, in conformity with accounting principles generally accepted in the United States of America, requires management to make estimates and assumptions. These estimates and assumptions affect the reported amounts of assets and liabilities, at the date of the financial statements, as well as the reported amounts of revenues and expenses during the reporting period.
41
Our most critical accounting estimates relate to our assumptions regarding future gold, silver, copper, nickel and other metal prices and the estimates of reserves, production and recoveries of third-party mine operators. We rely on reserve estimates reported by the operators on the properties in which we have stream and royalty interests. These estimates and the underlying assumptions affect the potential impairments of long-lived assets and the ability to realize income tax benefits associated with deferred tax assets. These estimates and assumptions also affect the rate at which we recognize revenue or charge depreciation, depletion and amortization to earnings. On an ongoing basis, management evaluates these estimates and assumptions; however, actual amounts could differ from these estimates and assumptions. Differences between estimates and actual amounts are adjusted and recorded in the period that the actual amounts are known.
Stream and Royalty Interests
Stream and royalty interests include acquired stream and royalty interests in production, development and exploration stage properties. The costs of acquired stream and royalty interests are capitalized as tangible assets as such interests do not meet the definition of a financial asset under the Accounting Standards Codification ("ASC") guidance.
Acquisition costs of production stage stream and royalty interests are depleted using the units of production method over the life of the mineral property (as sales occur under stream interests or royalty payments are recognized), which are estimated using proven and probable reserves as provided by the operator. Acquisition costs of stream and royalty interests on development stage mineral properties, which are not yet in production, are not amortized until the property begins production. Acquisition costs of stream or royalty interests on exploration stage mineral properties, where there are no proven and probable reserves, are not amortized. At such time as the associated exploration stage mineral interests are converted to proven and probable reserves, the cost basis is amortized over the remaining life of the mineral property, using proven and probable reserves. Exploration costs are expensed when incurred.
Asset Impairment
We evaluate long-lived assets for impairment whenever events or changes in circumstances indicate that the related carrying amounts of an asset or group of assets may not be recoverable. The recoverability of the carrying value of stream and royalty interests in production and development stage mineral properties is evaluated based upon estimated future undiscounted net cash flows from each stream and royalty interest using estimates of proven and probable reserves and other relevant information received from the operators. We evaluate the recoverability of the carrying value of royalty interests in exploration stage mineral properties in the event of significant decreases in the price of gold, silver, copper and other metals, and whenever new information regarding the mineral properties is obtained from the operator indicating that production will not likely occur or may be reduced in the future, thus potentially affecting the future recoverability of our stream or royalty interests. Impairments in the carrying value of each property are measured and recorded to the extent that the carrying value in each property exceeds its estimated fair value, which is generally calculated using estimated future discounted cash flows.
Estimates of gold, silver, copper, nickel and other metal prices, operators' estimates of proven and probable reserves or mineralized material related to our stream or royalty properties, and operators' estimates of operating and capital costs are subject to certain risks and uncertainties which may affect the recoverability of our investment in these stream and royalty interests in mineral properties. It is possible that changes could occur to these estimates, which could adversely affect the net cash flows expected to be generated from these stream and royalty interests. Refer to Note 4 of the notes to consolidated financial statements for discussion and the results of our impairment assessments for the fiscal years ended June 30, 2016 and 2015.
42
Revenue
Revenue is recognized pursuant to guidance in ASC 605 and based upon amounts contractually due pursuant to the underlying streaming or royalty agreement. Specifically, revenue is recognized in accordance with the terms of the underlying stream or royalty agreements subject to (i) the pervasive evidence of the existence of the arrangements; (ii) the risks and rewards having been transferred; (iii) the stream or royalty being fixed or determinable; and (iv) the collectability being reasonably assured. For our streaming agreements, we recognize revenue when the metal is sold.
Metal Sales
Gold and silver received under our metal streaming agreements is taken into inventory and then is sold primarily using average spot rate gold and silver forward contracts. The sales price for our gold and silver sold in average spot rate forward contracts is determined by the average daily gold or silver spot prices under the term of the contract, typically over a consecutive number of trading days between 10 days and three months (depending on the frequency of deliveries under the respective streaming agreement and our sales policy in effect at the time) commencing shortly after receipt and purchase of the metal. Revenue from gold and silver sales is recognized on the date of the settlement, which is also the date that title to the gold or silver passes to the purchaser.
Cost of Sales
Cost of sales is specific to our stream agreements and is the result of our purchase of gold and silver for a cash payment. The cash payment at Mount Milligan is the lesser of $435 per ounce or the prevailing market price of gold when purchased, while the cash payment for our other streams is a set contractual percentage of the gold or silver spot price near the date of metal delivery.
Exploration Costs
Exploration costs are specific to our Peak Gold joint venture for exploration and advancement of the Tetlin gold project, as discussed further in Note 3 of our notes to consolidated financial statements. Exploration costs associated with Peak Gold's exploration and advancement of the Tetlin gold project are expensed when incurred.
Income Taxes
The Company accounts for income taxes in accordance with the guidance of ASC 740. The Company's annual tax rate is based on income, statutory tax rates in effect and tax planning opportunities available to us in the various jurisdictions in which the Company operates. Significant judgment is required in determining the annual tax expense, current tax assets and liabilities, deferred tax assets and liabilities, and our future taxable income, both as a whole and in various tax jurisdictions, for purposes of assessing our ability to realize future benefit from our deferred tax assets. Actual income taxes could vary from these estimates due to future changes in income tax law, significant changes in the jurisdictions in which we operate or unpredicted results from the final determination of each year's liability by taxing authorities.
The Company's deferred income taxes reflect the impact of temporary differences between the reported amounts of assets and liabilities for financial reporting purposes and such amounts measured by tax laws and regulations. In evaluating the realizability of the deferred tax assets, management considers both positive and negative evidence that may exist, such as earnings history, reversal of taxable temporary differences, forecasted operating earnings and available tax planning strategies in each tax jurisdiction. A valuation allowance may be established to reduce our deferred tax assets to the amount that is considered more likely than not to be realized through the generation of future taxable income and other tax planning strategies.
43
The Company has asserted the indefinite reinvestment of certain foreign subsidiary earnings as determined by management's judgment about and intentions concerning the future operations of the Company. As a result, the Company does not record a U.S. deferred tax liability for the excess of the book basis over the tax basis of its investments in foreign corporations to the extent that the basis difference results from earnings that meet the indefinite reversal criteria. Refer to Note 11 for further discussion on our assertion.
The Company's operations may involve dealing with uncertainties and judgments in the application of complex tax regulations in multiple jurisdictions. The final taxes paid are dependent upon many factors, including negotiations with taxing authorities in various jurisdictions and resolution of disputes arising from federal, state, and international tax audits. The Company recognizes potential liabilities and records tax liabilities for anticipated tax audit issues in the United States and other tax jurisdictions based on its estimate of whether, and the extent to which, additional taxes will be due. The Company adjusts these reserves in light of changing facts and circumstances, such as the progress of a tax audit; however, due to the complexity of some of these uncertainties, the ultimate resolution could result in a payment that is materially different from our current estimate of the tax liabilities. These differences will be reflected as increases or decreases to income tax expense in the period which they are determined. The Company recognizes interest and penalties, if any, related to unrecognized tax benefits in income tax expense.
Liquidity and Capital Resources
Overview
At June 30, 2016, we had current assets of $164.8 million compared to current liabilities of $22.7 million resulting in a working capital surplus of $142.1 million and a current ratio of 7 to 1. This compares to current assets of $797.0 million and current liabilities of $25.0 million at June 30, 2015, resulting in a working capital surplus of $772.0 million and a current ratio of approximately 32 to 1. The decrease in our working capital was primarily attributable to a decrease in our cash and equivalents as a result of the recent stream acquisitions, as discussed earlier under Item 1, Business, Fiscal 2016 Business Developments. Please refer to "Summary of Cash Flows" below for further discussion on changes to our cash and equivalents during the period.
During the fiscal year ended June 30, 2016, liquidity needs were met from $288.8 million in net revenue and our available cash resources. As of June 30, 2016, the Company had $375 million available and $275 million outstanding under its revolving credit facility. Working capital, combined with the Company's undrawn revolving credit facility, resulted in $517.1 million of total liquidity at June 30, 2016. The Company was in compliance with each financial covenant under its revolving credit facility as of June 30, 2016. Refer to Note 6 of our notes to consolidated financial statements and below ("Recent Liquidity and Capital Resource Developments") for further discussion on our debt.
We believe that our current financial resources and funds generated from operations will be adequate to cover anticipated expenditures for debt service, general and administrative expense costs and capital expenditures for the foreseeable future. Our current financial resources are also available to fund dividends and for acquisitions of stream and royalty interests, including the remaining conditional commitments incurred in connection with the Ilovica, Golden Star and Rainy River stream acquisitions and the Peak Gold joint venture. Our long-term capital requirements are primarily affected by our ongoing acquisition activities. The Company currently, and generally at any time, has acquisition opportunities in various stages of active review. In the event of one or more substantial stream and royalty interest or other acquisitions, we may seek additional debt or equity financing as necessary.
Please refer to our risk factors included in Part I, Item 1A of this report for a discussion of certain risks that may impact the Company's liquidity and capital resources.
44
Recent Liquidity and Capital Resource Developments
Amendment to Revolving Credit Facility
On March 16, 2016, the Company entered into Amendment No. 2 (the "Amendment") to the Sixth Amended and Restated Revolving Credit Agreement, dated as of January 29, 2014 (as amended by Amendment No. 1 thereto as of April 29, 2015, the "Revolving Credit Agreement"), by and among the Company, certain subsidiaries of the Company as guarantors, certain lenders from time to time party thereto, and HSBC Bank USA, National Association, as administrative agent for the lenders. The Amendment revises the Revolving Credit Agreement to extend the scheduled maturity date from January 29, 2019 to March 16, 2021. As of June 30, 2016, the Company had $275.0 million outstanding under the Revolving Credit Agreement.
Dividend Increase
On November 10, 2015, we announced an increase in our annual dividend for calendar 2016 from $0.88 to $0.92, payable on a quarterly basis of $0.23 per share. The newly declared dividend is 5% higher than the dividend paid during calendar 2015. Royal Gold has steadily increased its annual dividend since calendar 2001.
Summary of Cash Flows
Operating Activities
Net cash provided by operating activities totaled $169.9 million for the fiscal year ended June 30, 2016, compared to $192.1 million for the fiscal year ended June 30, 2015. The decrease was primarily due to an increase in income taxes paid of approximately $55.8 million primarily related to the sale of the Andacollo royalty, an increase in exploration costs of approximately $6.4 million and an increase in interest paid of approximately $7.3 million. These decreases in net cash provided by operating activities were partially offset by an increase in proceeds received from our stream and royalty interest interests, net of production taxes and cost of sales, of $47.5 million.
Net cash provided by operating activities totaled $192.1 million for the fiscal year ended June 30, 2015, compared to $147.2 million for the fiscal year ended June 30, 2014. The increase was primarily due to an increase in proceeds received from our stream and royalty interests, net of production taxes and cost of sales, of approximately $31.2 million. The increase was also due to a decrease in income tax payments, net of refunds, of approximately $7.1 million.
Investing Activities
Net cash used in investing activities totaled $1.0 billion for the fiscal year ended June 30, 2016, compared to $51.2 million for the fiscal year ended June 30, 2015. The increase in cash used in investing activities is primarily due to an increase in acquisitions of stream and royalty interests in mineral properties (primarily the Pueblo Viejo and Andacollo stream acquisitions) compared to the prior year period. Please refer to Item 1, Business, Fiscal 2016 Business Developments, for further discussion on our recently acquired streams.
Net cash used in investing activities totaled $51.2 million for the fiscal year ended June 30, 2015, compared to $84.8 million for the fiscal year ended June 30, 2014. The decrease in cash used in investing activities was primarily due to a decrease in funding for stream or royalty acquisitions and the termination of the Tulsequah streaming agreement, resulting in the return of the original $10.0 million advance payment. The Company made approximately $52.5 million in commitment payments during the fiscal year ended June 30, 2015, as part of the Phoenix Gold and Ilovica stream acquisitions.
45
Financing Activities
Net cash provided by financing activities totaled $213.4 million for the fiscal year ended June 30, 2016, compared to cash used in financing activities of $57.6 million for the fiscal year ended June 30, 2015. The increase in cash provided by financing activities is primarily due to the Company's $275 million borrowing (net of repayment) under its revolving credit facility to fund stream acquisitions during the current period. Refer to Item 1, Business, Fiscal 2016 Business Developments, for further discussion on our recently acquired streams.
Net cash used in financing activities totaled $57.6 million for the fiscal year ended June 30, 2015, compared to cash provided by financing activities of $66.9 million for the fiscal year ended June 30, 2014. The decrease was the result of a purchase of an additional royalty interest from a non-controlling interest of approximately $11.5 million during fiscal year 2014. This decrease was partially offset by an increase in the common stock dividend payment, which was the result of an increase in the dividend rate when compared to fiscal year 2014.
Contractual Obligations
Our contractual obligations as of June 30, 2016, are as follows:
| |
Payments Due by Period (in thousands) | |||||||||||||||
|---|---|---|---|---|---|---|---|---|---|---|---|---|---|---|---|---|
Contractual Obligations
|
Total | Less than 1 Year |
1 - 3 Years | 3 - 5 Years | More than 5 Years |
|||||||||||
2019 Notes(1) |
$ | 401,913 | $ | 10,638 | $ | 391,275 | $ | — | $ | — | ||||||
Revolving credit facility(2) |
$ | 320,458 | $ | 7,960 | $ | 15,919 | $ | 296,579 | $ | — | ||||||
| | | | | | | | | | | | | | | | | |
Total |
$ | 722,371 | $ | 18,598 | $ | 407,194 | $ | 296,579 | $ | — | ||||||
| | | | | | | | | | | | | | | | | |
| | | | | | | | | | | | | | | | | |
| | | | | | | | | | | | | | | | | |
- (1)
- Amounts
represent principal ($370 million) and estimated interest payments ($31.9 million) assuming no early extinguishment.
- (2)
- Amounts represent principal ($275 million) and estimated interest payments ($45.5 million) assuming no early extinguishment.
For information on our contractual obligations, see Note 6 of the notes to consolidated financial statements under Part II, Item 8, "Financial Statements and Supplementary Data" of this report. The above table does not include stream or royalty commitments as discussed in Note 15 of the notes to consolidated financial statements. The Company believes it will be able to fund all existing obligations from net cash provided by operating activities.
Off-Balance Sheet Arrangements
We do not have any off-balance sheet arrangements that have or are reasonably likely to have a current or future effect on our financial condition, changes in financial condition, revenues or expenses, results of operations, liquidity, capital expenditures or capital resources that are material to investors.
Results of Operations
Fiscal Year Ended June 30, 2016, Compared with Fiscal Year Ended June 30, 2015
For the fiscal year ended June 30, 2016, we recorded a net loss available to Royal Gold common stockholders of $77.1 million, or ($1.18) per basic share and diluted share, compared to net income available to Royal Gold common stockholders of $52.0 million, or $0.80 per basic share and diluted share, for the fiscal year ended June 30, 2015. The decrease in our earnings per share was primarily attributable to impairment charges of approximately $98.6 million (including a royalty receivable write
46
down of approximately $2.9 million) on our stream interest at the Phoenix Gold Project and certain other non-principal royalty interests during our quarter ended March 31, 2016, as discussed further below. The decrease in our earnings per share was also attributable to an increase in tax expense of approximately $56.0 million due to the Company's termination of the Andacollo royalty interest, as discussed below, and the planned liquidation of our Chilean subsidiary during the quarter ended September 30, 2015. These decreases were partially offset by an increase in our revenue, which is also discussed below. The effect of the impairment charges during our fiscal year ended June 30, 2016, was $1.33 per basic share, after taxes, while the effect of the tax expense attributable to the termination of the Andacollo royalty interest during the current period, was $0.86 per basic share. During the prior year period, our earnings per share were negatively impacted by impairment charges of approximately $31.3 million (including a royalty receivable write down of $3.0 million) on certain non-principal royalty interests. The effect of the impairment charges during the fiscal year ended June 30, 2015, was $0.37 per basic share, after taxes.
For the fiscal year ended June 30, 2016, we recognized total revenue of $359.8 million, which is comprised of stream revenue of $238.0 million and royalty revenue of $121.8 million, at an average gold price of $1,168 per ounce, an average silver price of $15.32 per ounce and an average copper price of $2.22 per pound, compared to total revenue of $278.0 million, which is comprised of stream revenue of $94.1 million and royalty revenue of $183.9 million, at an average gold price of $1,224 per ounce, an average silver price of $17.36 per ounce and an average copper price of $2.89 per pound, for the fiscal year ended June 30, 2015. Revenue and the corresponding production, attributable to our stream and
47
royalty interests, for the fiscal year ended June 30, 2016 compared to the fiscal year ended June 30, 2015 is as follows:
Revenue and Reported Production Subject to our Stream and Royalty Interests
Fiscal Years Ended June 30, 2016 and 2015
(In thousands, except reported production in ozs. and lbs.)
| |
|
Fiscal Year Ended June 30, 2016 |
Fiscal Year Ended June 30, 2015 |
||||||||||||
|---|---|---|---|---|---|---|---|---|---|---|---|---|---|---|---|
Stream/Royalty
|
Metal(s) | Revenue | Reported Production(1) |
Revenue | Reported Production(1) |
||||||||||
Stream(2): |
|||||||||||||||
Mount Milligan |
Gold | $ | 125,438 | 108,800 oz. | $ | 94,104 | 76,900 oz. | ||||||||
Andacollo |
Gold | $ | 49,243 | 41,600 oz. | N/A | N/A | |||||||||
Pueblo Viejo |
Gold | $ | 39,683 | 31,200 oz. | N/A | N/A | |||||||||
|
Silver | 208,900 oz. | N/A | N/A | |||||||||||
Wassa and Prestea |
Gold | $ | 23,346 | 20,100 oz. | N/A | N/A | |||||||||
Other(5) |
Gold | $ | 318 | 300 oz. | N/A | N/A | |||||||||
| | | | | | | | | | | | | | | | |
Total stream revenue |
$ | 238,028 | $ | 94,104 | |||||||||||
Royalty: |
|||||||||||||||
Peñasquito |
$ | 22,760 | $ | 30,306 | |||||||||||
|
Gold | 584,000 oz. | 742,100 oz. | ||||||||||||
|
Silver | 21.4 Moz. | 24.6 Moz. | ||||||||||||
|
Lead | 134.2 Mlbs. | 158.4 Mlbs. | ||||||||||||
|
Zinc | 333.0 Mlbs. | 340.8 Mlbs. | ||||||||||||
Voisey's Bay(3) |
$ | 11,044 | $ | 16,665 | |||||||||||
|
Nickel | 78.6 Mlbs. | 62.8 Mlbs. | ||||||||||||
|
Copper | 56.2 Mlbs. | 64.8 Mlbs. | ||||||||||||
Holt(3) |
Gold | $ | 10,295 | 58,300 oz. | $ | 11,954 | 61,500 oz. | ||||||||
Cortez |
Gold | $ | 6,107 | 74,000 oz. | $ | 18,044 | 229,000 oz. | ||||||||
Andacollo(4) |
Gold | $ | — | — oz. | $ | 38,033 | 41,500 oz. | ||||||||
Other(5) |
Various | $ | 71,556 | N/A | $ | 68,913 | N/A | ||||||||
| | | | | | | | | | | | | | | | |
Total royalty revenue |
$ | 121,762 | $ | 183,915 | |||||||||||
| | | | | | | | | | | | | | | | |
Total Revenue |
$ | 359,790 | $ | 278,019 | |||||||||||
| | | | | | | | | | | | | | | | |
| | | | | | | | | | | | | | | | |
| | | | | | | | | | | | | | | | |
- (1)
- Reported
production relates to the amount of metal sales, subject to our stream and royalty interests, for the twelve months ended
June 30, 2016 and 2015, and may differ from the operators' public reporting.
- (2)
- Refer
to Item 2, Properties, for further discussion on our principal stream interests. Our streams at Andacollo, Pueblo Viejo and Wassa
and Prestea were acquired during the quarter ended September 30, 2015. Refer to Item 1, Business, Fiscal 2016 Business Developments, for further discussion on the recent stream
acquisitions.
- (3)
- Royalty
no longer considered principal to our business as of June 30, 2016.
- (4)
- Refer to Item 1, Business, Fiscal 2016 Business Developments, for further discussion on the recent Andacollo royalty sale.
48
- (5)
- Individually, no stream or royalty included within the "Other" category contributed greater than 5% of our total revenue for either period.
The increase in our total revenue for the fiscal year ended June 30, 2016, compared with the fiscal year ended June 30, 2015, resulted primarily from an increase in our stream revenue, which was a result of increased production at Mount Milligan and new production from our recently acquired streams, Wassa and Prestea, Pueblo Viejo, and Andacollo. Gold and silver ounces purchased and sold during the fiscal year ended June 30, 2016 and 2015, and gold and silver ounces in inventory as of June 30, 2016 and 2015, for our streaming interests were as follows:
| |
Fiscal Year Ended June 30, 2016 |
Fiscal Year Ended June 30, 2015 |
As of June 30, 2016 |
As of June 30, 2015 |
|||||||||||||||
|---|---|---|---|---|---|---|---|---|---|---|---|---|---|---|---|---|---|---|---|
Gold Stream
|
Purchases (oz.) | Sales (oz.) | Purchases (oz.) | Sales (oz.) | Ounces in inventory |
Ounces in inventory |
|||||||||||||
Mount Milligan |
111,000 | 108,800 | 74,400 | 76,900 | 7,500 | 5,300 | |||||||||||||
Andacollo |
41,700 | 41,600 | N/A | N/A | — | N/A | |||||||||||||
Wassa and Prestea |
21,400 | 20,100 | N/A | N/A | 1,300 | N/A | |||||||||||||
Pueblo Viejo |
42,200 | 31,200 | N/A | N/A | 11,000 | N/A | |||||||||||||
Phoenix Gold |
300 | 300 | N/A | N/A | — | N/A | |||||||||||||
| | | | | | | | | | | | | | | | | | | | |
Total |
216,600 | 202,000 | 74,400 | 76,900 | 19,800 | 5,300 | |||||||||||||
| |
Fiscal Year Ended June 30, 2016 |
Fiscal Year Ended June 30, 2015 |
As of June 30, 2016 |
As of June 30, 2015 |
|||||||||||||||
|---|---|---|---|---|---|---|---|---|---|---|---|---|---|---|---|---|---|---|---|
Silver Stream
|
Purchases (oz.) | Sales (oz.) | Purchases (oz.) | Sales (oz.) | Ounces in inventory |
Ounces in inventory |
|||||||||||||
Pueblo Viejo |
532,600 | 208,900 | N/A | N/A | 323,700 | N/A | |||||||||||||
Our royalty revenue decreased during the fiscal year ended June 30, 2016, compared with the fiscal year ended June 30, 2015, due to decreases in the average metal prices, the recent sale of the Andacollo royalty, and production decreases at Peñasquito and Cortez. Refer to Part I, Item 2, Properties, for discussion and any updates on our principal producing properties.
Cost of sales were approximately $71.0 million for the fiscal year ended June 30, 2016, compared to $33.5 million for the fiscal year ended June 30, 2015. The increase is primarily attributable to an increase in production at Mount Milligan and new stream production at Andacollo, Pueblo Viejo, and Wassa and Prestea. Cost of sales is specific to our stream agreements and is the result of RGLD Gold's purchase of gold and silver for a cash payment. The cash payment for Mount Milligan is the lesser of $435 per ounce or the prevailing market price of gold when purchased, while the cash payment for our other streams is a set contractual percentage of the gold or silver spot price near the date of metal delivery.
General and administrative expenses increased to $31.7 million for the fiscal year ended June 30, 2016, from $24.9 million for the fiscal year ended June 30, 2015. The increase during the current period was primarily due to an increase in non-cash stock based compensation of approximately $4.9 million as a result of management's change in estimate for the number of performance shares that are expected to vest.
Depreciation, depletion and amortization expense increased to $141.1 million for the fiscal year ended June 30, 2016, from $93.5 million for the fiscal year ended June 30, 2015. The increase was primarily attributable to the ramp-up in production at Mount Milligan ($11.4 million) and new production from the recently acquired streams at Pueblo Viejo ($21.9 million), Wassa and Prestea ($7.8 million) and Andacollo ($9.0 million).
49
Exploration costs increased to $8.6 million for the fiscal year ended June 30, 2016, from $2.2 million for the fiscal year ended June 30, 2015. Exploration costs are specific to our Peak Gold joint venture for exploration and advancement of the Tetlin gold project, as discussed further in Note 3 of the notes to consolidated financial statements.
Impairment of stream and royalty interests and royalty receivables was $98.6 million for the fiscal year ended June 30, 2016 compared to $31.3 million for the fiscal year end June 30, 2015. The impairment of stream and royalty interests ($96.1 million) was the result of our regular impairment analysis conducted during the quarter ended March 31, 2016, and was primarily due to the presence of impairment indicators on our stream interest at the Phoenix Gold Project and two non-principal producing royalty interests, Inata and Wolverine. Also during the current fiscal year, the Company recognized an allowance of approximately $2.9 million on the entire outstanding royalty receivable associated with the Inata interest. The Company will continue to pursue collection efforts of all past due payments. Refer to Note 4 of our notes to consolidated financial statements for further discussion on the impairments recognized during fiscal year 2016.
During the fiscal year ended June 30, 2016, we recognized income tax expense totaling $60.7 million compared with $9.6 million during the fiscal year ended June 30, 2015. This resulted in an effective tax rate of (278.9%) during the current period, compared with 15.4% in the prior period. The increase in the effective tax rate for the year ending June 30, 2016 is primarily related to the impacts attributable to the Company's Andacollo transactions, the liquidation of our Chilean subsidiary, and impairment charges during the current fiscal year.
Fiscal Year Ended June 30, 2015, Compared with Fiscal Year Ended June 30, 2014
For the fiscal year ended June 30, 2015, we recorded net income available to Royal Gold common stockholders of $52.0 million, or $0.80 per basic share and diluted share, compared to net income available to Royal Gold common stockholders of $62.6 million, or $0.96 per basic share and diluted share, for the fiscal year ended June 30, 2014. The decrease in our earnings per share was primarily attributable to impairment charges of approximately $31.3 million (including a royalty receivable write down of $3.0 million) on certain non-principal royalty interests during our quarter ended December 31, 2014, as discussed further below. This decrease was partially offset by an increase in our revenue and a decrease in our income tax expense, which are also discussed below. The effect of the impairment charges on our fiscal year ended June 30, 2015, earnings per share was $0.37 per basic share, after taxes.
For the fiscal year ended June 30, 2015, we recognized total revenue of $278.0 million, at an average gold price of $1,224 per ounce, an average silver price of $17.36 per ounce, an average copper price of $2.89 per pound and an average nickel price of $7.02 per pound, compared to total revenue of $237.2 million, at an average gold price of $1,296 per ounce, an average silver price of $20.57 per ounce, an average nickel price of $6.89 per pound and an average copper price of $3.18 per pound, for the fiscal year ended June 30, 2014. Revenue and the corresponding production, attributable to our
50
stream and royalty interests, for the fiscal year ended June 30, 2015 compared to the fiscal year ended June 30, 2014 is as follows:
Revenue and Reported Production Subject to our Stream and Royalty Interests
Fiscal Years Ended June 30, 2015 and 2014
(In thousands, except reported production in ozs. and lbs.)
| |
|
Fiscal Year Ended June 30, 2015 |
Fiscal Year Ended June 30, 2014 |
||||||||||||
|---|---|---|---|---|---|---|---|---|---|---|---|---|---|---|---|
Stream/Royalty
|
Metal(s)
|
Revenue | Reported Production(1) |
Revenue | Reported Production(1) |
||||||||||
Stream: |
|||||||||||||||
Mount Milligan |
Gold | $ | 94,104 | 76,900 oz. | $ | 27,209 | 21,100 oz. | ||||||||
| | | | | | | | | | | | | | | | |
Total stream revenue |
$ | 94,104 | $ | 27,209 | |||||||||||
Royalty: |
|||||||||||||||
Andacollo |
Gold | $ | 38,033 | 41,500 oz. | $ | 48,777 | 50,400 oz. | ||||||||
Peñasquito |
$ | 30,306 | $ | 29,281 | |||||||||||
|
Gold | 742,100 oz. | 534,200 oz. | ||||||||||||
|
Silver | 24.6 Moz. | 27.7 Moz. | ||||||||||||
|
Lead | 158.4 Mlbs. | 175.5 Mlbs. | ||||||||||||
|
Zinc | 340.8 Mlbs. | 310.9 Mlbs. | ||||||||||||
Cortez |
Gold | $ | 18,044 | 229,000 oz. | $ | 8,138 | 95,400 oz. | ||||||||
Voisey's Bay |
$ | 16,665 | $ | 25,128 | |||||||||||
|
Nickel | 62.8 Mlbs. | 123.7 Mlbs. | ||||||||||||
|
Copper | 64.8 Mlbs. | 80.5 Mlbs. | ||||||||||||
Holt |
Gold | $ | 11,954 | 61,500 oz. | $ | 13,813 | 63,100 oz. | ||||||||
Other(2) |
Various | $ | 68,913 | N/A | $ | 84,816 | N/A | ||||||||
| | | | | | | | | | | | | | | | |
Total royalty revenue |
$ | 183,915 | $ | 209,953 | |||||||||||
| | | | | | | | | | | | | | | | |
Total Revenue |
$ | 278,019 | $ | 237,162 | |||||||||||
| | | | | | | | | | | | | | | | |
| | | | | | | | | | | | | | | | |
| | | | | | | | | | | | | | | | |
- (1)
- Reported
production relates to the amount of metal sales, subject to our stream and royalty interests, for the twelve months ended
June 30, 2015 and 2014, as reported to us by the operators of the mines, and may differ from the operators' public reporting.
- (2)
- Individually, no royalty included within the "Other" category contributed greater than 5% of our total revenue for either period.
The increase in our total revenue for the fiscal year ended June 30, 2015, compared with the fiscal year ended June 30, 2014, resulted primarily from an increase in our stream revenue, which was a result of increased production at Mount Milligan. Gold ounces purchased and sold during the fiscal year ended June 30, 2015 and 2014, and gold ounces in inventory as of June 30, 2015 and 2014, for our streaming interests were as follows:
| |
Fiscal Year Ended June 30, 2015 |
Fiscal Year Ended June 30, 2014 |
As of June 30, 2015 |
As of June 30, 2014 |
|||||||||||||||
|---|---|---|---|---|---|---|---|---|---|---|---|---|---|---|---|---|---|---|---|
Gold Stream
|
Purchases (oz.) | Sales (oz.) | Purchases (oz.) | Sales (oz.) | Ounces in inventory |
Ounces in inventory |
|||||||||||||
Mount Milligan |
74,400 | 76,900 | 28,900 | 21,100 | 5,300 | N/A | |||||||||||||
51
Our royalty revenue decreased during the fiscal year ended June 30, 2015, compared with the fiscal year ended June 30, 2014, due to decreases in the average gold, silver and copper prices and due to production decreases primarily at Andacollo and Voisey's Bay. These decreases were partially offset by increased production at Cortez. Refer to Part I, Item 2, Properties, for discussion and any updates on our principal producing properties.
Cost of sales were approximately $33.5 million for the fiscal year ended June 30, 2015, compared to $9.2 million for the fiscal year ended June 30, 2014. The increase is attributable to an increase in production at Mount Milligan. During fiscal 2015, cost of sales was specific to our stream agreement for Mount Milligan and is the result of the Company's purchases of gold for a cash payment of the lesser of $435 per ounce, or the prevailing market price of gold when purchased.
General and administrative expenses increased to $24.9 million for the fiscal year ended June 30, 2015, from $21.2 million for the fiscal year ended June 30, 2014. The increase was primarily due an increase in non-cash stock based compensation expense of approximately $2.6 million as a result of management's change in estimate for the number of performance shares that are expected to vest.
Depreciation, depletion and amortization expense increased to $93.5 million for the fiscal year ended June 30, 2015, from $91.3 million for the fiscal year ended June 30, 2014. The increase was primarily attributable to the ramp-up in production at Mount Milligan.
Impairment of stream and royalty interests was $31.3 million for the fiscal year ended June 30, 2015. The impairment charges were the result of our regular impairment analysis and were primarily due to the presence of impairment indicators on a non-principal producing royalty interest, Wolverine, during the three months ended December 31, 2014. The Company also determined during the three months ended September 30, 2014, that a non-principal production stage royalty interest and one exploration stage royalty interest should be written down to zero for an impairment charge of $1.8 million. Refer to Note 4 of our notes to consolidated financial statements for further discussion on the impairments recognized during fiscal year 2015.
During the fiscal year ended June 30, 2015, we recognized income tax expense totaling $9.6 million compared with $19.5 million during the fiscal year ended June 30, 2014. This resulted in an effective tax rate of 15.4% during fiscal year 2015, compared with 23.5% during fiscal year 2014. The decrease in the effective tax rate for the fiscal year ended June 30, 2015, is primarily attributable to (i) a decrease in tax expense relating to a decrease in unrealized taxable foreign currency exchange gains, (ii) a favorable tax rate associated with certain operations in lower-tax jurisdictions, (iii) a valuation allowance release as a result of the strengthening U.S. dollar, (iv) a decrease in tax expense due to the Chilean tax legislation enacted in the quarter ended September 30, 2014, and the corresponding re-measurement of the Chilean long term deferred tax asset to the higher corporate income tax rate, and (v) the impairment charge on the Wolverine royalty interest and the corresponding tax benefit recorded in the quarter ended December 31, 2014, and (vi) net of the effect of an increase in tax expense due to Canadian tax legislation enacted in the quarter ended June 30, 2015, which resulted in the re-measurement of Canadian deferred tax liabilities at the higher tax rate. Excluding the enactment of the Chilean tax legislation during the quarter ended September 30, 2014, the impairment charge on the Wolverine royalty interest during the quarter ended December 31, 2014, and the enactment of Canadian tax legislation during the quarter ended June 30, 2015, the effective tax rate for the twelve months ended June 30, 2015, would have been 19.6%.
Forward-Looking Statements
Cautionary "Safe Harbor" Statement under the Private Securities Litigation Reform Act of 1995: With the exception of historical matters, the matters discussed in this Annual Report on Form 10-K are forward-looking statements that involve risks and uncertainties that could cause actual results to differ materially from projections or estimates contained herein. Such forward-looking statements include,
52
without limitation, statements regarding projected production estimates and estimates pertaining to timing and commencement of production from the operators of properties where we hold stream and royalty interests; effective tax rate estimates; the adequacy of financial resources and funds to cover anticipated expenditures for general and administrative expenses as well as costs associated with exploration and business development and capital expenditures, and our expectation that substantially all our revenues will be derived from stream and royalty interests. Words such as "may," "could," "should," "would," "believe," "estimate," "expect," "anticipate," "plan," "forecast," "potential," "intend," "continue," "project" and variations of these words, comparable words and similar expressions generally indicate forward-looking statements, which speak only as of the date the statement is made. Do not unduly rely on forward-looking statements. Actual results may differ materially from those expressed or implied by these forward-looking statements. Factors that could cause actual results to differ materially from these forward-looking statements include, among others:
- •
- a low price environment for gold and other metal prices on which our stream and royalty interests are paid or a low price environment
for the primary metals mined at properties where we hold stream and royalty interests;
- •
- the production at or performance of properties where we hold stream and royalty interests, and variation of actual performance from
the production estimates and forecasts made by the operators of these properties;
- •
- the successful closing of Centerra's acquisition of Thompson Creek and simultaneous redemption and pay down of Thompson Creek's 9.75%
secured notes due in 2017, 7.375% unsecured notes due in 2018, and 12.5% unsecured notes due in 2019;
- •
- the ability of operators to bring projects, particularly development stage properties, into production on schedule or operate in
accordance with feasibility studies;
- •
- acquisition and maintenance of permits and authorizations, completion of construction and commencement and continuation of production
at the properties where we hold stream and royalty interests;
- •
- challenges to mining, processing and related permits and licenses, or to applications for permits and licenses, by or on behalf of
indigenous populations, non-governmental organizations or other third parties;
- •
- liquidity or other problems our operators may encounter, including shortfalls in the financing required to complete construction and a
bring a mine into production;
- •
- decisions and activities of the operators of properties where we hold stream and royalty interests;
- •
- hazards and risks at the properties where we hold stream and royalty interests that are normally associated with developing and mining
properties, including unanticipated grade, continuity and geological, metallurgical, processing or other problems, mine operating and ore processing facility problems, pit wall or tailings dam
failures, industrial accidents, environmental hazards and natural catastrophes such as floods or earthquakes and access to raw materials, water and power;
- •
- changes in operators' mining, processing and treatment techniques, which may change the production of minerals subject to our stream
and royalty interests;
- •
- changes in the methodology employed by our operators to calculate our stream and royalty interests in accordance with the agreements
that govern them;
- •
- changes in project parameters as plans of the operators of properties where we hold stream and royalty interests are refined;
53
- •
- accuracy of and decreases in estimates of reserves and mineralization by the operators of properties where we hold stream and royalty
interests;
- •
- contests to our stream and royalty interests and title and other defects to the properties where we hold stream and royalty interests;
- •
- adverse effects on market demand for commodities, the availability of financing, and other effects from adverse economic and market
conditions;
- •
- future financial needs of the Company and the operators of properties where we hold stream or royalty interests;
- •
- federal, state and foreign legislation governing us or the operators of properties where we hold stream and royalty interests;
- •
- the availability of stream and royalty interests for acquisition or other acquisition opportunities and the availability of debt or
equity financing necessary to complete such acquisitions;
- •
- our ability to make accurate assumptions regarding the valuation, timing and amount of revenue to be derived from our stream and
royalty interests when evaluating acquisitions;
- •
- risks associated with conducting business in foreign countries, including application of foreign laws to contract and other disputes,
validity of security interests, environmental, governmental consents for granting interests in exploration and exploration licenses, real estate, contract and permitting laws, currency fluctuations,
expropriation of property, repatriation of earnings, taxation, price controls, inflation, import and export regulations, community unrest and labor disputes, endemic health issues, corruption,
enforcement and uncertain political and economic environments;
- •
- changes in laws governing us, the properties where we hold stream and royalty interests or the operators of such properties;
- •
- risks associated with issuances of additional common stock or incurrence of indebtedness in connection with acquisitions or otherwise
including risks associated with the issuance and conversion of convertible notes;
- •
- changes in management and key employees; and
- •
- failure to complete future acquisitions or the failure of transactions involving the operators to close;
as well as other factors described elsewhere in this report and our other reports filed with the SEC. Most of these factors are beyond our ability to predict or control. Future events and actual results could differ materially from those set forth in, contemplated by or underlying the forward-looking statements. Forward-looking statements speak only as of the date on which they are made. We disclaim any obligation to update any forward-looking statements made herein, except as required by law. Readers are cautioned not to put undue reliance on forward-looking statements.
54
ITEM 7A. QUANTITATIVE AND QUALITATIVE DISCLOSURE ABOUT MARKET RISK
Our earnings and cash flows are significantly impacted by changes in the market price of gold and other metals. Gold, silver, copper, nickel and other metal prices can fluctuate significantly and are affected by numerous factors, such as demand, production levels, economic policies of central banks, producer hedging, world political and economic events and the strength of the U.S. dollar relative to other currencies.
During the fiscal year ended June 30, 2016, we reported revenue of $359.8 million, with an average gold price for the period of $1,168 per ounce, an average silver price for the period of $15.32 per ounce and an average copper price of $2.22 per pound. Approximately 88% of our total recognized revenues for the fiscal year ended June 30, 2016 were attributable to gold sales from our gold producing interests, as shown within the MD&A. For the fiscal year ended June 30, 2016, if the price of gold had averaged 10% higher or lower per ounce, we would have recorded an increase or decrease in revenue of approximately $33 million.
Approximately 3% of our total reported revenue for the fiscal year ended June 30, 2016 was attributable to silver sales from our silver producing interests. For the fiscal year ended June 30, 2016, if the price of silver had averaged 10% higher or lower per ounce, we would have recorded an increase or decrease in revenues of approximately $1.1 million.
Approximately 4% of our total reported revenue for the fiscal year ended June 30, 2016 was attributable to copper sales from our copper producing interests. For the fiscal year ended June 30, 2016, if the price of copper had averaged 10% higher or lower per pound, we would have recorded an increase or decrease in revenues of approximately $1.9 million.
55
ITEM 8. FINANCIAL STATEMENTS AND SUPPLEMENTARY DATA
56
REPORT OF INDEPENDENT REGISTERED PUBLIC ACCOUNTING FIRM
The Board of Directors and Shareholders of Royal Gold, Inc.
We have audited the accompanying consolidated balance sheets of Royal Gold, Inc. as of June 30, 2016 and 2015, and the related consolidated statements of operations and comprehensive (loss) income, changes in equity and cash flows for each of the three years in the period ended June 30, 2016. These financial statements are the responsibility of the Company's management. Our responsibility is to express an opinion on these financial statements based on our audits.
We conducted our audits in accordance with the standards of the Public Company Accounting Oversight Board (United States). Those standards require that we plan and perform the audit to obtain reasonable assurance about whether the financial statements are free of material misstatement. An audit includes examining, on a test basis, evidence supporting the amounts and disclosures in the financial statements. An audit also includes assessing the accounting principles used and significant estimates made by management, as well as evaluating the overall financial statement presentation. We believe that our audits provide a reasonable basis for our opinion.
In our opinion, the financial statements referred to above present fairly, in all material respects, the consolidated financial position of Royal Gold, Inc. at June 30, 2016 and 2015, and the consolidated results of its operations and its cash flows for each of the three years in the period ended June 30, 2016, in conformity with U.S. generally accepted accounting principles.
We also have audited, in accordance with the standards of the Public Company Accounting Oversight Board (United States), Royal Gold Inc.'s internal control over financial reporting as of June 30, 2016, based on criteria established in Internal Control—Integrated Framework issued by the Committee of Sponsoring Organizations of the Treadway Commission (2013 framework) and our report dated August 11, 2016 expressed an unqualified opinion thereon.
/s/
Ernst & Young LLP
Denver, Colorado
August 11, 2016
57
ROYAL GOLD, INC.
Consolidated Balance Sheets
As of June 30,
(In thousands except share data)
| |
2016 | 2015 | |||||
|---|---|---|---|---|---|---|---|
ASSETS |
|||||||
Cash and equivalents |
$ | 116,633 | $ | 742,849 | |||
Royalty receivables |
17,990 | 37,681 | |||||
Income tax receivable |
20,043 | 6,422 | |||||
Stream inventory |
9,489 | 2,287 | |||||
Available-for-sale securities (Note 5) |
— | 6,273 | |||||
Prepaid expenses and other |
614 | 1,511 | |||||
| | | | | | | | |
Total current assets |
164,769 | 797,023 | |||||
Stream and royalty interests, net (Note 4) |
2,848,087 |
2,083,608 |
|||||
Other assets |
53,696 | 36,560 | |||||
| | | | | | | | |
Total assets |
$ | 3,066,552 | $ | 2,917,191 | |||
| | | | | | | | |
| | | | | | | | |
| | | | | | | | |
LIABILITIES |
|||||||
Accounts payable |
$ | 4,114 | $ | 4,911 | |||
Dividends payable |
15,012 | 14,341 | |||||
Other current liabilities |
3,554 | 5,721 | |||||
| | | | | | | | |
Total current liabilities |
22,680 | 24,973 | |||||
Debt (Note 6) |
600,685 | 313,869 | |||||
Deferred tax liabilities |
133,867 | 146,603 | |||||
Uncertain tax positions (Note 11) |
16,996 | 15,130 | |||||
Other long-term liabilities |
6,439 | 689 | |||||
| | | | | | | | |
Total liabilities |
780,667 | 501,264 | |||||
| | | | | | | | |
Commitments and contingencies (Note 15) |
|||||||
EQUITY |
|||||||
Preferred stock, $.01 par value, authorized 10,000,000 shares authorized; and 0 shares issued |
— | — | |||||
Common stock, $.01 par value, 100,000,000 shares authorized; and 65,093,950 and 65,033,547 shares outstanding, respectively |
651 | 650 | |||||
Additional paid-in capital |
2,179,781 | 2,170,643 | |||||
Accumulated other comprehensive loss |
— | (3,292 | ) | ||||
Accumulated earnings |
48,584 | 185,121 | |||||
| | | | | | | | |
Total Royal Gold stockholders' equity |
2,229,016 | 2,353,122 | |||||
Non-controlling interests |
56,869 | 62,805 | |||||
| | | | | | | | |
Total equity |
2,285,885 | 2,415,927 | |||||
| | | | | | | | |
Total liabilities and equity |
$ | 3,066,552 | $ | 2,917,191 | |||
| | | | | | | | |
| | | | | | | | |
| | | | | | | | |
The accompanying notes are an integral part of these consolidated financial statements.
58
ROYAL GOLD, INC.
Consolidated Statements of Operations and Comprehensive (Loss) Income
For the Years Ended June 30,
(In
thousands except share data)
| |
2016 | 2015 | 2014 | |||||||
|---|---|---|---|---|---|---|---|---|---|---|
Revenue |
$ | 359,790 | $ | 278,019 | $ | 237,162 | ||||
Costs and expenses |
||||||||||
Cost of sales |
70,979 | 33,450 | 9,158 | |||||||
General and administrative |
31,720 | 24,873 | 21,186 | |||||||
Production taxes |
3,978 | 5,446 | 6,756 | |||||||
Exploration costs |
8,601 | 2,194 | — | |||||||
Depreciation, depletion and amortization |
141,108 | 93,486 | 91,342 | |||||||
Impairments of stream and royalty interests and royalty receivables (Note 4) |
98,588 | 31,335 | — | |||||||
| | | | | | | | | | | |
Total costs and expenses |
354,974 | 190,784 | 128,442 | |||||||
| | | | | | | | | | | |
Operating income |
4,816 | 87,235 | 108,720 | |||||||
Gain (loss) on available-for-sale securities |
2,340 | (183 | ) | (4,499 | ) | |||||
Interest and other income |
3,711 | 883 | 2,050 | |||||||
Interest and other expense |
(32,625 | ) | (25,691 | ) | (23,344 | ) | ||||
| | | | | | | | | | | |
(Loss) income before income taxes |
(21,758 | ) | 62,244 | 82,927 | ||||||
Income tax expense |
(60,680 |
) |
(9,566 |
) |
(19,455 |
) |
||||
| | | | | | | | | | | |
Net (loss) income |
(82,438 | ) | 52,678 | 63,472 | ||||||
Net loss (income) attributable to non-controlling interests |
5,289 | (713 | ) | (831 | ) | |||||
| | | | | | | | | | | |
Net (loss) income attributable to Royal Gold common stockholders |
$ | (77,149 | ) | $ | 51,965 | $ | 62,641 | |||
| | | | | | | | | | | |
| | | | | | | | | | | |
| | | | | | | | | | | |
Net (loss) income |
$ | (82,438 | ) | $ | 52,678 | $ | 63,472 | |||
Adjustments to comprehensive (loss) income, net of tax |
||||||||||
Unrealized change in market value of available-for-sale securities |
5,632 | (3,292 | ) | (98 | ) | |||||
Reclassification adjustment for (gains) losses included in net (loss) income |
(2,340 | ) | 160 | 4,510 | ||||||
| | | | | | | | | | | |
Comprehensive (loss) income |
(79,146 | ) | 49,546 | 67,884 | ||||||
Comprehensive loss (income) attributable to non-controlling interests |
5,289 | (713 | ) | (831 | ) | |||||
| | | | | | | | | | | |
Comprehensive (loss) income attributable to Royal Gold stockholders |
$ | (73,857 | ) | $ | 48,833 | $ | 67,053 | |||
| | | | | | | | | | | |
| | | | | | | | | | | |
| | | | | | | | | | | |
Net (loss) income per share available to Royal Gold common stockholders: |
||||||||||
Basic (loss) earnings per share |
$ | (1.18 | ) | $ | 0.80 | $ | 0.96 | |||
| | | | | | | | | | | |
| | | | | | | | | | | |
| | | | | | | | | | | |
Basic weighted average shares outstanding |
65,074,455 | 65,007,861 | 64,909,149 | |||||||
| | | | | | | | | | | |
| | | | | | | | | | | |
| | | | | | | | | | | |
Diluted (loss) earnings per share |
$ | (1.18 | ) | $ | 0.80 | $ | 0.96 | |||
| | | | | | | | | | | |
| | | | | | | | | | | |
| | | | | | | | | | | |
Diluted weighted average shares outstanding |
65,074,455 | 65,125,173 | 65,026,256 | |||||||
| | | | | | | | | | | |
| | | | | | | | | | | |
| | | | | | | | | | | |
Cash dividends declared per common share |
$ | 0.91 | $ | 0.87 | $ | 0.83 | ||||
| | | | | | | | | | | |
| | | | | | | | | | | |
| | | | | | | | | | | |
The accompanying notes are an integral part of these consolidated financial statements.
59
Consolidated Statements of Changes in Equity
For the Years Ended June 30, 2016, 2015 and 2014
(In thousands except share data)
| |
Royal Gold Stockholders | |
|
|||||||||||||||||||||||||
|---|---|---|---|---|---|---|---|---|---|---|---|---|---|---|---|---|---|---|---|---|---|---|---|---|---|---|---|---|
| |
|
|
Exchangeable Shares |
|
|
|
|
|
||||||||||||||||||||
| |
Common Shares | |
Accumulated Other Comprehensive Income (Loss) |
|
|
|
||||||||||||||||||||||
| |
Additional Paid-In Capital |
Accumulated Earnings |
Non-controlling interests |
Total Equity |
||||||||||||||||||||||||
| |
Shares | Amount | Shares | Amount | ||||||||||||||||||||||||
Balance at June 30, 2013 |
64,184,036 | $ | 642 | 667,229 | $ | 29,365 | $ | 2,142,173 | $ | (4,572 | ) | $ | 181,279 | $ | 21,749 | $ | 2,370,636 | |||||||||||
Issuance of common stock for: |
||||||||||||||||||||||||||||
Exchange of exchangeable shares |
287,372 | 3 | (287,372 | ) | (12,647 | ) | 12,644 | — | — | — | — | |||||||||||||||||
Non-controlling interest assignment |
— | — | — | — | (11,463 | ) | — | — | (2,250 | ) | (13,713 | ) | ||||||||||||||||
Stock-based compensation and related share issuances |
106,993 | 1 | — | — | 4,296 | — | — | — | 4,297 | |||||||||||||||||||
Net income |
— | — | — | — | — | — | 62,641 | 831 | 63,472 | |||||||||||||||||||
Other comprehensive income |
— | — | — | — | — | 4,412 | — | — | 4,412 | |||||||||||||||||||
Distribution to non-controlling interests |
— | — | — | — | — | — | — | (2,498 | ) | (2,498 | ) | |||||||||||||||||
Dividends declared |
— | — | — | — | — | — | (54,049 | ) | — | (54,049 | ) | |||||||||||||||||
| | | | | | | | | | | | | | | | | | | | | | | | | | | | | |
Balance at June 30, 2014 |
64,578,401 | $ | 646 | 379,857 | $ | 16,718 | $ | 2,147,650 | $ | (160 | ) | $ | 189,871 | $ | 17,832 | $ | 2,372,557 | |||||||||||
| | | | | | | | | | | | | | | | | | | | | | | | | | | | | |
| | | | | | | | | | | | | | | | | | | | | | | | | | | | | |
| | | | | | | | | | | | | | | | | | | | | | | | | | | | | |
Issuance of common stock for: |
||||||||||||||||||||||||||||
Exchange of exchangeable shares |
379,857 | 3 | (379,857 | ) | (16,718 | ) | 16,715 | — | — | — | — | |||||||||||||||||
Peak Gold joint venture |
— | — | — | — | — | — | — | 45,700 | 45,700 | |||||||||||||||||||
Stock-based compensation and related share issuances |
75,289 | 1 | — | — | 6,278 | — | — | — | 6,279 | |||||||||||||||||||
Net income |
— | — | — | — | — | — | 51,965 | 713 | 52,678 | |||||||||||||||||||
Other comprehensive loss |
— | — | — | — | — | (3,132 | ) | — | — | (3,132 | ) | |||||||||||||||||
Distribution to non-controlling interests |
— | — | — | — | — | — | — | (1,440 | ) | (1,440 | ) | |||||||||||||||||
Dividends declared |
— | — | — | — | — | — | (56,715 | ) | — | (56,715 | ) | |||||||||||||||||
| | | | | | | | | | | | | | | | | | | | | | | | | | | | | |
Balance at June 30, 2015 |
65,033,547 | $ | 650 | — | $ | — | $ | 2,170,643 | $ | (3,292 | ) | $ | 185,121 | $ | 62,805 | $ | 2,415,927 | |||||||||||
| | | | | | | | | | | | | | | | | | | | | | | | | | | | | |
| | | | | | | | | | | | | | | | | | | | | | | | | | | | | |
| | | | | | | | | | | | | | | | | | | | | | | | | | | | | |
Stock-based compensation and related share issuances |
60,403 | 1 | — | — | 9,138 | — | — | — | 9,139 | |||||||||||||||||||
Net loss |
— | — | — | — | — | — | (77,149 | ) | (5,289 | ) | (82,438 | ) | ||||||||||||||||
Other comprehensive income |
— | — | — | — | — | 3,292 | — | — | 3,292 | |||||||||||||||||||
Distribution to non-controlling interests |
— | — | — | — | — | — | — | (647 | ) | (647 | ) | |||||||||||||||||
Dividends declared |
— | — | — | — | — | — | (59,388 | ) | — | (59,388 | ) | |||||||||||||||||
| | | | | | | | | | | | | | | | | | | | | | | | | | | | | |
Balance at June 30, 2016 |
65,093,950 | $ | 651 | — | $ | — | $ | 2,179,781 | $ | — | $ | 48,584 | $ | 56,869 | $ | 2,285,885 | ||||||||||||
| | | | | | | | | | | | | | | | | | | | | | | | | | | | | |
| | | | | | | | | | | | | | | | | | | | | | | | | | | | | |
| | | | | | | | | | | | | | | | | | | | | | | | | | | | | |
The accompanying notes are an integral part of these consolidated financial statements.
60
ROYAL GOLD, INC.
Consolidated Statements of Cash Flows
For the Years Ended June 30,
(In thousands)
| |
2016 | 2015 | 2014 | |||||||
|---|---|---|---|---|---|---|---|---|---|---|
Cash flows from operating activities: |
||||||||||
Net (loss) income |
$ | (82,438 | ) | $ | 52,678 | $ | 63,472 | |||
Adjustments to reconcile net (loss) income to net cash provided by operating activities: |
||||||||||
Depreciation, depletion and amortization |
141,108 | 93,486 | 91,342 | |||||||
Impairment of stream and royalty interests |
98,588 | 31,335 | — | |||||||
Amortization of debt discount and issuance costs |
12,985 | 12,100 | 11,332 | |||||||
Non-cash employee stock compensation expense |
10,039 | 5,141 | 2,580 | |||||||
Tax benefit of stock-based compensation exercises |
548 | (364 | ) | (597 | ) | |||||
(Gain) loss on available-for-sale securities |
(2,340 | ) | 183 | 4,499 | ||||||
Deferred tax benefit |
(4,983 | ) | (27,651 | ) | (8,166 | ) | ||||
Other |
(390 | ) | (46 | ) | (259 | ) | ||||
Changes in assets and liabilities: |
||||||||||
Royalty receivables |
17,221 | 5,977 | 3,731 | |||||||
Stream inventory |
(7,203 | ) | 1,110 | (3,396 | ) | |||||
Income taxes receivable |
(14,177 | ) | 15,525 | (6,183 | ) | |||||
Prepaid expenses and other assets |
(153 | ) | 2,527 | 11,417 | ||||||
Accounts payable |
(849 | ) | 150 | 1,105 | ||||||
Foreign withholding taxes payable |
(199 | ) | (2,000 | ) | (13,319 | ) | ||||
Uncertain tax positions |
1,867 | 1,405 | (7,441 | ) | ||||||
Other liabilities |
235 | 543 | (2,915 | ) | ||||||
| | | | | | | | | | | |
Net cash provided by operating activities |
$ | 169,859 | $ | 192,099 | $ | 147,202 | ||||
| | | | | | | | | | | |
Cash flows from investing activities: |
||||||||||
Acquisition of stream and royalty interests |
(1,346,109 | ) | (60,429 | ) | (80,019 | ) | ||||
Andacollo royalty termination |
345,000 | — | — | |||||||
Golden Star term loan |
(20,000 | ) | — | — | ||||||
Proceeds from sale of available-for-sale securities |
11,905 | — | — | |||||||
Tulsequah stream termination |
— | 10,000 | — | |||||||
Other |
(309 | ) | (773 | ) | (4,782 | ) | ||||
| | | | | | | | | | | |
Net cash used in investing activities |
$ | (1,009,513 | ) | $ | (51,202 | ) | $ | (84,801 | ) | |
| | | | | | | | | | | |
Cash flows from financing activities: |
||||||||||
Borrowings from revolving credit facility |
350,000 | — | — | |||||||
Repayment of revolving credit facility |
(75,000 | ) | — | — | ||||||
Net (payments) proceeds from issuance of common stock |
(353 | ) | 775 | 1,120 | ||||||
Common stock dividends |
(58,720 | ) | (56,054 | ) | (53,380 | ) | ||||
Purchase of additional royalty interest from non-controlling interest |
— | — | (11,522 | ) | ||||||
Debt issuance costs |
(1,111 | ) | (864 | ) | (1,284 | ) | ||||
Distribution to non-controlling interests |
(830 | ) | (1,805 | ) | (2,431 | ) | ||||
Tax (benefit) expense of stock-based compensation exercises |
(548 | ) | 364 | 597 | ||||||
| | | | | | | | | | | |
Net cash provided by (used in) financing activities |
$ | 213,438 | $ | (57,584 | ) | $ | (66,900 | ) | ||
| | | | | | | | | | | |
Net (decrease) increase in cash and equivalents |
(626,216 | ) | 83,313 | (4,499 | ) | |||||
Cash and equivalents at beginning of period |
742,849 | 659,536 | 664,035 | |||||||
| | | | | | | | | | | |
Cash and equivalents at end of period |
$ | 116,633 | $ | 742,849 | $ | 659,536 | ||||
| | | | | | | | | | | |
| | | | | | | | | | | |
| | | | | | | | | | | |
See Note 12 for supplemental cash flow information.
The accompanying notes are an integral part of these consolidated financial statements.
61
ROYAL GOLD, INC.
NOTES TO CONSOLIDATED FINANCIAL STATEMENTS
1. THE COMPANY
Royal Gold, Inc. ("Royal Gold", the "Company", "we", "us", or "our"), together with its subsidiaries, is engaged in the business of acquiring and managing precious metals royalties, metal streams, and similar interests. Royalties are non-operating interests in mining projects that provide the right to revenue or metals produced from the project after deducting specified costs, if any. A metal stream is a purchase agreement that provides, in exchange for an upfront deposit payment, the right to purchase all or a portion of one or more metals produced from a mine, at a price determined for the life of the transaction by the purchase agreement.
2. SUMMARY OF SIGNIFICANT ACCOUNTING POLICIES AND RECENTLY ADOPTED AND ISSUED ACCOUNTING PRONOUNCEMENTS
Summary of Significant Accounting Policies
Use of Estimates
The preparation of our financial statements in conformity with accounting principles generally accepted in the United States of America requires the Company to make estimates and assumptions that affect the reported amounts of assets and liabilities, and disclosure of contingent assets and liabilities at the dates of the financial statements, and the reported amounts of revenues and expenses during the reporting periods. Actual results could differ significantly from those estimates.
Our most critical accounting estimates relate to our assumptions regarding future gold, silver, copper, nickel and other metal prices and the estimates of reserves, production and recoveries of third-party mine operators. We rely on reserve estimates reported by the operators on the properties in which we have stream and royalty interests. These estimates and the underlying assumptions affect the potential impairments of long-lived assets and the ability to realize income tax benefits associated with deferred tax assets. These estimates and assumptions also affect the rate at which we recognize revenue or charge depreciation, depletion and amortization to earnings. On an ongoing basis, management evaluates these estimates and assumptions; however, actual amounts could differ from these estimates and assumptions. Differences between estimates and actual amounts could differ significantly and are recorded in the period that the actual amounts are known.
Basis of Consolidation
The consolidated financial statements include the accounts of Royal Gold, Inc., its wholly-owned subsidiaries and an entity over which control is achieved through means other than voting right (see Note 3). The Company follows the Accounting Standards Codification ("ASC") guidance for identification and reporting for entities over which control is achieved through means other than voting rights. All intercompany accounts, transactions, income and expenses, and profits or losses have been eliminated on consolidation.
Cash and Equivalents
Cash and equivalents consist of all cash balances and highly liquid investments with an original maturity of three months or less. Cash and equivalents were primarily held in cash deposit accounts as of June 30, 2016 and 2015.
62
ROYAL GOLD, INC.
NOTES TO CONSOLIDATED FINANCIAL STATEMENTS (Continued)
2. SUMMARY OF SIGNIFICANT ACCOUNTING POLICIES AND RECENTLY ADOPTED AND ISSUED ACCOUNTING PRONOUNCEMENTS (Continued)
Stream and Royalty Interests
Stream and royalty interests include acquired stream and royalty interests in production, development and exploration stage properties. The costs of acquired stream and royalty interests are capitalized as tangible assets as such interests do not meet the definition of a financial asset under the Accounting Standards Codification ("ASC") guidance.
Acquisition costs of production stage stream and royalty interests are depleted using the units of production method over the life of the mineral property (as sales occur under stream interests or royalty payments are recognized), which are estimated using proven and probable reserves as provided by the operator. Acquisition costs of stream and royalty interests on development stage mineral properties, which are not yet in production, are not amortized until the property begins production. Acquisition costs of stream or royalty interests on exploration stage mineral properties, where there are no proven and probable reserves, are not amortized. At such time as the associated exploration stage mineral interests are converted to proven and probable reserves, the cost basis is amortized over the remaining life of the mineral property, using proven and probable reserves. The carrying values of exploration stage mineral interests are evaluated for impairment at such time as information becomes available indicating that the production will not occur in the future. Exploration costs are expensed when incurred.
Available-for-Sale Securities
Investments in securities that management does not have the intent to sell in the near term and that have readily determinable fair values are classified as available-for-sale securities. Unrealized gains and losses on these investments are recorded in accumulated other comprehensive (loss) income as a separate component of stockholders' equity, except that declines in market value judged to be other than temporary are recognized in determining net income. When investments are sold, the realized gains and losses on these investments, determined using the specific identification method, are included in determining net income.
The Company's policy for determining whether declines in fair value of available-for-sale securities are other than temporary includes a quarterly analysis of the investments and a review by management of all investments for which the cost exceeds the fair value. Any temporary declines in fair value are recorded as a charge to other comprehensive (loss) income. This evaluation considers a number of factors including, but not limited to, the length of time and extent to which the fair value has been less than cost, the financial condition and near term prospects of the issuer, and management's ability and intent to hold the securities until fair value recovers. If such impairment is determined by the Company to be other-than-temporary, the investment's cost basis is written down to fair value and recorded in net income during the period the Company determines such impairment to be other-than-temporary. The new cost basis is not changed for subsequent recoveries in fair value. Refer to Note 5 for further discussion on our available-for-sale securities.
Asset Impairment
We evaluate long-lived assets for impairment whenever events or changes in circumstances indicate that the related carrying amounts of an asset or group of assets may not be recoverable. The recoverability of the carrying value of stream and royalty interests in production and development stage
63
ROYAL GOLD, INC.
NOTES TO CONSOLIDATED FINANCIAL STATEMENTS (Continued)
2. SUMMARY OF SIGNIFICANT ACCOUNTING POLICIES AND RECENTLY ADOPTED AND ISSUED ACCOUNTING PRONOUNCEMENTS (Continued)
mineral properties is evaluated based upon estimated future undiscounted net cash flows from each stream and royalty interest using estimates of proven and probable reserves and other relevant information received from the operators. We evaluate the recoverability of the carrying value of royalty interests in exploration stage mineral properties in the event of significant decreases in the price of gold, silver, copper, nickel and other metals, and whenever new information regarding the mineral properties is obtained from the operator indicating that production will not likely occur or may be reduced in the future, thus potentially affecting the future recoverability of our stream or royalty interests. Impairments in the carrying value of each property are measured and recorded to the extent that the carrying value in each property exceeds its estimated fair value, which is generally calculated using estimated future discounted cash flows.
Estimates of gold, silver, copper, nickel and other metal prices, operators' estimates of proven and probable reserves or mineralized material related to our stream or royalty properties, and operators' estimates of operating and capital costs are subject to certain risks and uncertainties which may affect the recoverability of our investment in these stream and royalty interests in mineral properties. It is possible that changes could occur to these estimates, which could adversely affect the net cash flows expected to be generated from these stream and royalty interests. Refer to Note 4 for discussion and the results of our impairment assessments for the fiscal years ended June 30, 2016 and 2015.
Revenue
Revenue is recognized pursuant to guidance in ASC 605 and based upon amounts contractually due pursuant to the underlying streaming or royalty agreement. Specifically, revenue is recognized in accordance with the terms of the underlying stream or royalty agreements subject to (i) the pervasive evidence of the existence of the arrangements; (ii) the risks and rewards having been transferred; (iii) the stream or royalty being fixed or determinable; and (iv) the collectability being reasonably assured. For our streaming agreements, we recognize revenue when the metal is sold.
Metal Sales
Gold and silver received under our metal streaming agreements is taken into inventory, and this is sold primarily using average spot rate gold and silver forward contracts. The sales price for our gold and silver sold in average spot rate forward contracts is determined by the average daily gold or silver spot prices under the term of the contract, typically over a consecutive number of trading days between 10 days and three months (depending on the frequency of deliveries under the respective streaming agreement and our sales policy in effect at the time) commencing shortly after receipt and purchase of the metal. Revenue from gold and silver sales is recognized on the date of the settlement, which is also the date that title to the gold or silver passes to the purchaser.
Cost of Sales
Cost of sales is specific to our stream agreements and is the result of our purchase of gold and silver for a cash payment. The cash payment at Mount Milligan is the lesser of $435 per ounce or the prevailing market price of gold when purchased, while the cash payment for our other streams is a set contractual percentage of the gold or silver spot price near the date of metal delivery.
64
ROYAL GOLD, INC.
NOTES TO CONSOLIDATED FINANCIAL STATEMENTS (Continued)
2. SUMMARY OF SIGNIFICANT ACCOUNTING POLICIES AND RECENTLY ADOPTED AND ISSUED ACCOUNTING PRONOUNCEMENTS (Continued)
Production taxes
Certain royalty payments are subject to production taxes (or mining proceeds taxes), which are recognized at the time of revenue recognition. Production taxes are not income taxes and are included within the costs and expenses section in the Company's consolidated statements of operations and comprehensive (loss) income.
Exploration Costs
Exploration costs are specific to the Peak Gold LLC ("Peak Gold") joint venture for exploration and advancement of the Tetlin gold project, as discussed further in Note 3. Exploration costs associated with Peak Gold for the exploration and advancement of the Tetlin gold project are expensed when incurred.
Stock-Based Compensation
The Company accounts for stock-based compensation in accordance with the guidance of ASC 718. The Company recognizes all share-based payments to employees, including grants of employee stock options, stock-settled stock appreciation rights ("SSARs"), restricted stock and performance shares, in its financial statements based upon their fair values.
Reportable Segments and Geographical Information
The Company manages its business under two reportable segments, consisting of the acquisition and management of stream interests and the acquisition and management of royalty interests. Royal Gold's long-lived assets (stream and royalty interests, net) as of June 30, 2016 and 2015 are geographically distributed as shown in the following table:
| |
As of June 30, 2016 | As of June 30, 2015 | |||||||||||||||||
|---|---|---|---|---|---|---|---|---|---|---|---|---|---|---|---|---|---|---|---|
| |
Stream interest |
Royalty interest |
Total stream and royalty interests, net |
Stream interest |
Royalty interest |
Total stream and royalty interests, net |
|||||||||||||
Canada |
$ | 809,692 | $ | 228,566 | $ | 1,038,258 | $ | 823,091 | $ | 251,688 | $ | 1,074,779 | |||||||
Chile |
369,896 | 453,629 | 823,525 | — | 653,019 | 653,019 | |||||||||||||
Dominican Republic |
588,502 | — | 588,502 | — | — | — | |||||||||||||
Mexico |
— | 118,899 | 118,899 | — | 131,742 | 131,742 | |||||||||||||
United States |
— | 102,385 | 102,385 | — | 110,286 | 110,286 | |||||||||||||
Africa |
88,596 | 697 | 89,293 | — | 12,760 | 12,760 | |||||||||||||
Australia |
— | 42,547 | 42,547 | — | 50,119 | 50,119 | |||||||||||||
Other |
12,029 | 32,649 | 44,678 | 8,183 | 42,720 | 50,903 | |||||||||||||
| | | | | | | | | | | | | | | | | | | | |
Total |
$ | 1,868,715 | $ | 979,372 | $ | 2,848,087 | $ | 831,274 | $ | 1,252,334 | $ | 2,083,608 | |||||||
| | | | | | | | | | | | | | | | | | | | |
| | | | | | | | | | | | | | | | | | | | |
| | | | | | | | | | | | | | | | | | | | |
65
ROYAL GOLD, INC.
NOTES TO CONSOLIDATED FINANCIAL STATEMENTS (Continued)
2. SUMMARY OF SIGNIFICANT ACCOUNTING POLICIES AND RECENTLY ADOPTED AND ISSUED ACCOUNTING PRONOUNCEMENTS (Continued)
The Company's revenue, cost of sales and net revenue by reportable segment for our fiscal year's ended June 30, 2016, 2015 and 2014 is geographically distributed as show in the following table:
| |
Fiscal Year Ended June 30, 2016 | Fiscal Year Ended June 30, 2015 | |||||||||||||||||
|---|---|---|---|---|---|---|---|---|---|---|---|---|---|---|---|---|---|---|---|
| |
Revenue | Cost of sales |
Net revenue |
Revenue | Cost of sales |
Net revenue |
|||||||||||||
Streams: |
|||||||||||||||||||
Canada |
$ | 125,755 | $ | 47,417 | $ | 78,338 | $ | 94,104 | $ | 33,450 | $ | 60,654 | |||||||
Chile |
49,243 | 7,280 | 41,963 | — | — | — | |||||||||||||
Dominican Republic |
39,684 | 11,625 | 28,059 | — | — | — | |||||||||||||
Africa |
23,346 | 4,657 | 18,689 | — | — | — | |||||||||||||
| | | | | | | | | | | | | | | | | | | | |
Total streams |
$ | 238,028 | $ | 70,979 | $ | 167,049 | $ | 94,104 | $ | 33,450 | $ | 60,654 | |||||||
Royalties: |
|||||||||||||||||||
Mexico |
$ | 35,267 | $ | — | $ | 35,267 | $ | 43,008 | $ | — | $ | 43,008 | |||||||
United States |
35,483 | — | 35,483 | 42,675 | — | 42,675 | |||||||||||||
Canada |
30,676 | — | 30,676 | 37,496 | — | 37,496 | |||||||||||||
Chile |
84 | — | 84 | 39,508 | — | 39,508 | |||||||||||||
Australia |
10,462 | — | 10,462 | 8,494 | — | 8,494 | |||||||||||||
Africa |
1,868 | — | 1,868 | 3,075 | — | 3,075 | |||||||||||||
Other |
7,922 | — | 7,922 | 9,659 | — | 9,659 | |||||||||||||
| | | | | | | | | | | | | | | | | | | | |
Total royalties |
$ | 121,762 | $ | — | $ | 121,762 | $ | 183,915 | $ | — | $ | 183,915 | |||||||
| | | | | | | | | | | | | | | | | | | | |
Total royalties and streams |
$ | 359,790 | $ | 70,979 | $ | 288,811 | $ | 278,019 | $ | 33,450 | $ | 244,569 | |||||||
| | | | | | | | | | | | | | | | | | | | |
| | | | | | | | | | | | | | | | | | | | |
| | | | | | | | | | | | | | | | | | | | |
| |
Fiscal Year Ended June 30, 2015 | Fiscal Year Ended June 30, 2014 | |||||||||||||||||
|---|---|---|---|---|---|---|---|---|---|---|---|---|---|---|---|---|---|---|---|
| |
Revenue | Cost of sales |
Net revenue |
Revenue | Cost of sales |
Net revenue |
|||||||||||||
Streams: |
|||||||||||||||||||
Canada |
$ | 94,104 | $ | 33,450 | $ | 60,654 | $ | 27,209 | $ | 9,158 | $ | 18,051 | |||||||
Royalties: |
|||||||||||||||||||
Mexico |
$ | 43,008 | $ | — | $ | 43,008 | $ | 43,093 | $ | — | $ | 43,093 | |||||||
United States |
42,675 | — | 42,675 | 34,671 | — | 34,671 | |||||||||||||
Chile |
39,508 | — | 39,508 | 50,733 | — | 50,733 | |||||||||||||
Canada |
37,496 | — | 37,496 | 54,277 | — | 54,277 | |||||||||||||
Australia |
8,494 | — | 8,494 | 8,353 | — | 8,353 | |||||||||||||
Africa |
3,075 | — | 3,075 | 7,943 | — | 7,943 | |||||||||||||
Other |
9,659 | — | 9,659 | 10,883 | — | 10,883 | |||||||||||||
| | | | | | | | | | | | | | | | | | | | |
Total royalties |
$ | 183,915 | $ | — | $ | 183,915 | $ | 209,953 | $ | — | $ | 209,953 | |||||||
| | | | | | | | | | | | | | | | | | | | |
Total royalties and streams |
$ | 278,019 | $ | 33,450 | $ | 244,569 | $ | 237,162 | $ | 9,158 | $ | 228,004 | |||||||
| | | | | | | | | | | | | | | | | | | | |
| | | | | | | | | | | | | | | | | | | | |
| | | | | | | | | | | | | | | | | | | | |
66
ROYAL GOLD, INC.
NOTES TO CONSOLIDATED FINANCIAL STATEMENTS (Continued)
2. SUMMARY OF SIGNIFICANT ACCOUNTING POLICIES AND RECENTLY ADOPTED AND ISSUED ACCOUNTING PRONOUNCEMENTS (Continued)
Income Taxes
The Company accounts for income taxes in accordance with the guidance of ASC 740. The Company's annual tax rate is based on income, statutory tax rates in effect and tax planning opportunities available to us in the various jurisdictions in which the Company operates. Significant judgment is required in determining the annual tax expense, current tax assets and liabilities, deferred tax assets and liabilities, and our future taxable income, both as a whole and in various tax jurisdictions, for purposes of assessing our ability to realize future benefit from our deferred tax assets. Actual income taxes could vary from these estimates due to future changes in income tax law, significant changes in the jurisdictions in which we operate or unpredicted results from the final determination of each year's liability by taxing authorities.
The Company's deferred income taxes reflect the impact of temporary differences between the reported amounts of assets and liabilities for financial reporting purposes and such amounts measured by tax laws and regulations. In evaluating the realizability of the deferred tax assets, management considers both positive and negative evidence that may exist, such as earnings history, reversal of taxable temporary differences, forecasted operating earnings and available tax planning strategies in each tax jurisdiction. A valuation allowance may be established to reduce our deferred tax assets to the amount that is considered more likely than not to be realized through the generation of future taxable income and other tax planning strategies.
The Company has asserted the indefinite reinvestment of certain foreign subsidiary earnings as determined by management's judgment about and intentions concerning the future operations of the Company. As a result, the Company does not record a U.S. deferred tax liability for the excess of the book basis over the tax basis of its investments in foreign corporations to the extent that the basis difference results from earnings that meet the indefinite reversal criteria. Refer to Note 11 for further discussion on our assertion.
The Company's operations may involve dealing with uncertainties and judgments in the application of complex tax regulations in multiple jurisdictions. The final taxes paid are dependent upon many factors, including negotiations with taxing authorities in various jurisdictions and resolution of disputes arising from federal, state, and international tax audits. The Company recognizes potential liabilities and records tax liabilities for anticipated tax audit issues in the United States and other tax jurisdictions based on its estimate of whether, and the extent to which, additional taxes will be due. The Company adjusts these reserves in light of changing facts and circumstances, such as the progress of a tax audit; however, due to the complexity of some of these uncertainties, the ultimate resolution could result in a payment that is materially different from our current estimate of the tax liabilities. These differences will be reflected as increases or decreases to income tax expense in the period which they are determined. The Company recognizes interest and penalties, if any, related to unrecognized tax benefits in income tax expense.
Comprehensive (Loss) Income
In addition to net income, comprehensive (loss) income includes changes in equity during a period associated with cumulative unrealized changes in the fair value of marketable securities held for sale, net of tax effects.
67
ROYAL GOLD, INC.
NOTES TO CONSOLIDATED FINANCIAL STATEMENTS (Continued)
2. SUMMARY OF SIGNIFICANT ACCOUNTING POLICIES AND RECENTLY ADOPTED AND ISSUED ACCOUNTING PRONOUNCEMENTS (Continued)
Earnings per Share
Basic earnings per share is computed by dividing net income available to Royal Gold common stockholders by the weighted average number of outstanding common shares for the period, considering the effect of participating securities, and include the outstanding exchangeable shares. Diluted earnings per share reflect the potential dilution that could occur if securities or other contracts that may require issuance of common shares were converted. Diluted earnings per share is computed by dividing net income available to common stockholders by the diluted weighted average number of common shares outstanding, including outstanding exchangeable shares, during each fiscal year.
Reclassification
Certain amounts in the prior period financial statements have been reclassified for comparative purposes to conform with the presentation in the current period financial statements. Reclassified amounts were not material to the financial statements.
Recently Adopted Accounting Standards
In April 2015, the Financial Accounting Standards Board ("FASB") issued Accounting Standards Update ("ASU") guidance related to debt issuance costs. This update simplifies the presentation of debt issuance costs by requiring debt issuance costs to be presented as a deduction from the corresponding debt liability. The recognition and measurement guidance for debt issuance costs are not affected by the updated guidance. Early adoption is permitted and the Company elected to early adopt this guidance as of June 30, 2016, and the effects of the updated guidance were applied retrospectively to our fiscal year ended June 30, 2015. The effect of the change in accounting principle as of June 30, 2016 and 2015, was that $7.4 million and $8.2 million, respectively, of our debt issuance costs have been reclassified from Other assets to Debt on the Company's consolidated financial statements.
In February 2015, ASU guidance was issued related to consolidations. This update affects reporting entities that are required to evaluate whether they should consolidate certain legal entities. This update makes some targeted changes to current consolidation guidance and impacts both the voting and the variable interest consolidation models. In particular, the update will change how companies determine whether limited partnerships or similar entities are variable interest entities ("VIEs"). The Company adopted the updated guidance as of June 30, 2016. The effects of the adoption had no impact on the Company's consolidated financial statements.
In November 2015, the FASB issued guidance on the presentation of deferred income taxes that requires deferred tax assets and liabilities, along with related valuation allowances, to be classified as non-current on the balance sheet. As a result, each tax jurisdiction will now only have one net non-current deferred tax asset or liability. The new guidance does not change the existing requirement that prohibits offsetting deferred tax liabilities from one jurisdiction against deferred tax assets of another jurisdiction. The Company adopted the updated guidance as of June 30, 2016, on a prospective basis and it only resulted in a change of presentation of the deferred taxes on our consolidated balances sheet. The change in accounting principle was not retrospectively applied to prior period balances.
68
ROYAL GOLD, INC.
NOTES TO CONSOLIDATED FINANCIAL STATEMENTS (Continued)
2. SUMMARY OF SIGNIFICANT ACCOUNTING POLICIES AND RECENTLY ADOPTED AND ISSUED ACCOUNTING PRONOUNCEMENTS (Continued)
Recently Issued Accounting Standards
In March 2016, the FASB issued ASU guidance to simplify several aspects of accounting for share-based payment transactions, including income tax consequences, classification of awards as either equity or liabilities, an option to recognize gross stock compensation with actual forfeitures as they occur, as well as certain classifications on the statement of cash flows. The new guidance is effective for the Company's fiscal year beginning July 1, 2017. Early adoption is permitted, as long as all of the amendments are adopted in the same period. We are currently evaluating the impact this guidance will have on our consolidated financial statements and footnote disclosures.
In February 2016, the FASB issued ASU guidance which changes the accounting for leases. The new guidance is effective for the Company's fiscal year beginning July 1, 2019, and early adoption is permitted. We are currently evaluating the impact, if any, this guidance will have on our consolidated financial statements and footnote disclosures.
In January 2016, the FASB issued ASU guidance on the recognition and measurement of financial instruments. The amended guidance requires, among other things that equity securities classified as available-for-sale be measured at fair value with changes in fair value recognized in net income rather than other comprehensive (loss) income as required under previous guidance. The new guidance is effective for the Company's fiscal year beginning July 1, 2018. We are currently evaluating the impact this guidance will have on our consolidated financial statements.
In May 2014, the FASB issued ASU guidance for the recognition of revenue from contracts with customers. Subsequent to the issuance of this ASU guidance, the FASB issued additional related ASU's on revenue recognition. The effective date and transition requirements for all of these ASU's are the same. Specifically, the guidance under these ASU's is to be applied using a full retrospective method or a modified retrospective method, as described in the guidance, and is effective for the Company's fiscal year beginning July 1, 2018. The Company is currently evaluating the level of effort needed to implement the guidance, evaluating the provisions of each new guidance, and assessing their impact on the Company's consolidated financial statements and disclosures, as well as which transitions method we intend to use.
3. ACQUISITIONS
Acquisition of Gold and Silver Stream at Pueblo Viejo
On September 29, 2015, RGLD Gold AG ("RGLD Gold") closed its Precious Metals Purchase and Sale Agreement with Barrick Gold Corporation ("Barrick") and its wholly-owned subsidiary, BGC Holdings Ltd. ("BGC") for a percentage of the gold and silver production attributable to Barrick's 60% interest in the Pueblo Viejo mine located in the Dominican Republic. Pursuant to the Precious Metals Purchase and Sale Agreement, RGLD Gold made a single advance payment of $610 million to BGC as part of the closing. The transaction is effective as of July 1, 2015 for the gold stream and January 1, 2016 for the silver stream.
BGC will deliver gold to RGLD Gold in amounts equal to 7.50% of Barrick's interest in the gold produced at the Pueblo Viejo mine until 990,000 ounces of gold have been delivered, and 3.75% of Barrick's interest in gold produced thereafter. RGLD Gold will pay BGC 30% of the spot price per ounce of gold delivered until 550,000 ounces of gold have been delivered, and 60% of the spot price
69
ROYAL GOLD, INC.
NOTES TO CONSOLIDATED FINANCIAL STATEMENTS (Continued)
3. ACQUISITIONS (Continued)
per ounce delivered thereafter. RGLD Gold began receiving gold deliveries during the quarter ended December 31, 2015.
BGC will deliver silver to RGLD Gold in amounts equal to 75% of Barrick's interest in the silver produced at the Pueblo Viejo mine, subject to a minimum silver recovery of 70%, until 50 million ounces of silver have been delivered, and 37.50% of Barrick's interest in silver produced thereafter. RGLD Gold will pay BGC 30% of the spot price per ounce of silver delivered until 23.10 million ounces of silver have been delivered, and 60% of the spot price per ounce of silver delivered thereafter. RGLD Gold began receiving silver deliveries during the quarter ended March 31, 2016.
The Pueblo Viejo gold and silver stream acquisition has been accounted for as an asset acquisition. The advance payment of $610 million, plus direct transaction costs, have been recorded as a production stage stream interest within Stream and royalty interests, net on our consolidated balance sheets. The acquisition cost of the Pueblo Viejo gold and silver stream interest will be depleted using the units of production method, which is estimated using aggregate proven and probable reserves, as provided by Barrick.
Acquisition and Amendment of Gold Stream on Wassa and Prestea
On July 28, 2015, RGLD Gold, a wholly-owned subsidiary of the Company, closed a $130 million gold stream transaction with a wholly-owned subsidiary of Golden Star Resources Ltd. (together "Golden Star"). On December 30, 2015, the parties executed an amendment providing for an additional $15 million investment (for a total investment of $145 million) by RGLD Gold.
Also on July 28, 2015 and separate from the stream transaction by RGLD Gold, the Company also funded a $20 million, 4-year term loan to Golden Star and received warrants to purchase 5 million shares of Golden Star common stock, with a grant date fair value of approximately $0.8 million. Interest under the term loan is due quarterly at a rate equal to 62.5% of the average daily gold price for the relevant quarter divided by 10,000, but not to exceed 11.5%. The warrants have a term of four years and an exercise price of $0.27.
Funds will be used for ongoing development of Golden Star's Wassa and Prestea mines in Ghana. As of June 30, 2016, RGLD Gold has advanced $95 million. On July 1, 2016, RGLD Gold made an advance payment of $20 million and expects to advance the balance in two quarterly payments as follows: (i) $20 million on October 1, 2016, and (ii) $10 million on January 1, 2017; however this schedule may be modified based on the actual spending on the Wassa and Prestea underground projects and these funds are subject to satisfaction of certain conditions.
In return, Golden Star will deliver to RGLD Gold 9.25% of gold produced from the Wassa and Prestea mines, until the earlier of (i) December 31, 2017 or (ii) the date at which the Wassa and Prestea underground projects achieve commercial production. At that point, the stream percentage will increase to 10.5% of gold produced from the Wassa and Prestea projects until an aggregate 240,000 ounces have been delivered. Once the applicable delivery threshold is met, the stream percentage will decrease to 5.5% for the remaining life of the mines.
RGLD Gold will pay Golden Star a cash price equal to 20% of the spot price for each ounce of gold delivered at the time of delivery until the applicable delivery threshold is met, and 30% of the spot price for each ounce of gold delivered thereafter.
70
ROYAL GOLD, INC.
NOTES TO CONSOLIDATED FINANCIAL STATEMENTS (Continued)
3. ACQUISITIONS (Continued)
The Wassa and Prestea gold stream acquisition has been accounted for as an asset acquisition. The $95 million paid as part of the aggregate advance payments of $145 million, plus direct acquisition costs, have been recorded as a production stage stream interest within Stream and royalty interests, net on our consolidated balance sheets. Future advance payments, plus any direct acquisition costs incurred, will be recorded as a production stage interest accordingly. The acquisition cost of the Wassa and Prestea gold stream interest will be depleted using the units of production method, which is estimated using aggregate proven and probable reserves, as provided by Golden Star.
The $20 million four-year term loan and the received warrants have been recorded within Other assets on our consolidated balance sheets. The warrants have been classified as a financial asset instrument and are recorded at fair value at each reporting period using the Black-Scholes model. Any change in the fair value of the warrants at subsequent reporting periods will be recorded within Interest and other income on our consolidated statements of operations and comprehensive (loss) income.
Acquisition of Gold and Silver Stream at Rainy River
On July 20, 2015, RGLD Gold entered into a $175 million Purchase and Sale Agreement with New Gold, Inc. ("New Gold"), for a percentage of the gold and silver production from the Rainy River Project located in Ontario, Canada ("Rainy River"). Pursuant to the Purchase and Sale Agreement, RGLD Gold made an advance payment to New Gold, consisting of $100 million on July 20, 2015, and will make an additional advance payment of $75 million once capital spending at Rainy River is 60% complete (currently expected during the second half of calendar 2016). Under the Purchase and Sale Agreement, New Gold will deliver to RGLD Gold 6.50% of the gold produced at Rainy River until 230,000 gold ounces have been delivered, and 3.25% thereafter. New Gold also will deliver to RGLD Gold 60% of the silver produced at Rainy River until 3.10 million silver ounces have been delivered, and 30% thereafter. RGLD Gold will pay New Gold 25% of the spot price per ounce of gold and silver at the time of delivery.
The Rainy River gold and silver stream acquisition has been accounted for as an asset acquisition. The $100 million paid as part of the aggregate advance payments of $175 million, plus direct transaction costs, have been recorded as a development stage stream interest within Stream and royalty interests, net on our consolidated balance sheets.
Acquisition of Gold Stream at Carmen de Andacollo
On July 9, 2015, RGLD Gold entered into a Long Term Offtake Agreement (the "Andacollo Stream Agreement") with Compañía Minera Teck Carmen de Andacollo ("CMCA"), a 90% owned subsidiary of Teck Resources Limited ("Teck"). Pursuant to the Andacollo Stream Agreement, CMCA will sell and deliver to RGLD Gold 100% of payable gold from the Carmen de Andacollo ("Andacollo") copper-gold mine located in Chile until 900,000 ounces have been delivered, and 50% thereafter, subject to a fixed payable percentage of 89%. RGLD Gold made a $525 million advance payment in cash to CMCA upon entry into the Andacollo Stream Agreement, and RGLD Gold will also pay CMCA 15% of the monthly average gold price for the month preceding the delivery date for all gold purchased under the Andacollo Stream Agreement.
The transaction encompasses certain of CMCA's presently owned mining concessions on the Andacollo mine, as well as any other mining concessions presently owned or acquired by CMCA or any of its affiliates within an approximate 1.5 kilometer area of interest, and certain other mining
71
ROYAL GOLD, INC.
NOTES TO CONSOLIDATED FINANCIAL STATEMENTS (Continued)
3. ACQUISITIONS (Continued)
concessions that CMCA or its affiliates may acquire. The Andacollo Stream Agreement was effective July 1, 2015, and applies to all final settlements of gold received on or after that date. Deliveries to RGLD Gold will be made monthly, and RGLD Gold began receiving gold deliveries during the quarter ended September 30, 2015.
The Company accounted for the acquisition of the stream interest at Andacollo as an asset acquisition. For US GAAP financial reporting purposes on the date of acquisition, the Company's new consolidated carrying value in its stream interest at Andacollo was approximately $388.2 million, which included direct acquisition costs, and has been recorded as a production stage stream interest within Stream and royalty interests, net on our consolidated balance sheets. The Andacollo gold stream interest will be depleted using the units of production method, which is estimated using aggregate proven and probable reserves, as provided by Teck.
Termination of Royalty Interest at Carmen de Andacollo
On July 9, 2015, Royal Gold Chile Limitada ("RG Chile"), a wholly owned subsidiary of the Company, entered into a Royalty Termination Agreement with CMCA. The Royalty Termination Agreement terminated an amended Royalty Agreement originally dated January 12, 2010, which provided RG Chile with a royalty equivalent to 75% of the gold produced from the sulfide portion of the Andacollo mine until 910,000 payable ounces have been produced, and 50% of the gold produced thereafter. CMCA paid total consideration of $345 million to RG Chile in connection with the Royalty Termination Agreement. The net carrying value of the Andacollo royalty on the date of termination was approximately $207.5 million. The royalty termination transaction was taxable in Chile and the United States.
Acquisition of Gold Stream on Euromax's Ilovica Project
On October 20, 2014, RGLD Gold, a wholly owned subsidiary of the Company, entered into a $175.0 million gold stream transaction with Euromax Resources Ltd ("Euromax") that will finance a definitive feasibility study, permitting work, early stage engineering and a significant portion of the construction at Euromax's Ilovica gold-copper project located in southeast Macedonia. RGLD Gold will make two advance deposit payments to Euromax totaling $15.0 million, which are to be used for completion of the definitive feasibility study and permitting of the project, followed by payments aggregating $160 million towards project construction, in each case subject to certain conditions. Payment of the first $7.5 million deposit was completed in March 2015. RGLD Gold advanced $3.75 million of the second $7.5 million deposit in November 2015 and a decision to proceed with the remaining portion of the second deposit ($3.75 million) and the construction payments is conditioned upon, among other things, its satisfaction with the progress of definitive feasibility study and environmental evaluations, demonstrated project viability, and, in the case of the construction payments, sufficient project financing and permits to construct and operate the mine. The construction payments would be paid pro-rata with the balance of the project funding. In exchange, Euromax will deliver physical gold equal to 25% of gold produced from the Ilovica project until 525,000 ounces have been delivered, and 12.5% thereafter (in each case subject to adjustment). RGLD Gold's purchase price per ounce will be 25% of the spot price at the time of delivery.
The Ilovica gold stream acquisition has been accounted for as an asset acquisition. The $11.25 million paid as part of the aggregate pre-production commitment of $175 million, plus direct
72
ROYAL GOLD, INC.
NOTES TO CONSOLIDATED FINANCIAL STATEMENTS (Continued)
3. ACQUISITIONS (Continued)
transaction costs, have been recorded as a development stage stream interest within Stream and royalty interests, net on our consolidated balance sheets.
Tetlin Royalty Acquisitions and Peak Gold Joint Venture
On September 30, 2014, Royal Gold acquired a 2.0% net smelter return ("NSR") royalty and a 3.0% NSR royalty held by private parties over areas comprising the Tetlin gold project located near Tok, Alaska, for total consideration of $6.0 million. As discussed below, the Tetlin gold project is now held by Peak Gold LLC ("Peak Gold"), a joint venture between subsidiaries of Royal Gold and Contango ORE Inc.
The acquisition of the Tetlin royalties has been accounted for as an asset acquisition. The total purchase price of $6.0 million, plus direct transaction costs, has been recorded as an exploration stage royalty interest within Stream and royalty interests, net on our consolidated balance sheets.
On January 8, 2015, Royal Gold, through its wholly-owned subsidiary, Royal Alaska, LLC ("Royal Alaska"), and Contango ORE, Inc., through its wholly-owned subsidiary CORE Alaska, LLC (together, "Contango"), entered into a limited liability company agreement for Peak Gold, a joint venture for exploration and advancement of the Tetlin gold project located near Tok, Alaska (the "Tetlin Project"). Contango contributed all of its assets relating to the Tetlin Project to Peak Gold, including a mining lease and certain state of Alaska mining claims. Royal Alaska contributed $5.0 million in cash to Peak Gold. Contango will initially hold a 100% membership interest in Peak Gold. Royal Alaska has the right to obtain up to 40% of the membership interest in Peak Gold by making contributions of up to $30.0 million (including Royal Alaska's initial $5.0 million contribution) in cash to Peak Gold by October 31, 2018. As of June 30, 2016, Royal Alaska has contributed $5.7 million and has obtained an 11% membership interest in Peak Gold.
Royal Alaska will act as the manager of Peak Gold. As manager of Peak Gold, Royal Alaska is responsible for managing, directing and controlling the overall operations during the earn-in period, and thereafter, provided Royal Alaska holds at least a 40% interest. Royal Alaska will act as manager unless and until it is unanimously removed or resigns that position in the manner provided in Peak Gold's limited liability company agreement.
The Company follows the ASC guidance for identification and reporting of entities for which control is achieved through means other than voting rights. The guidance defines such entities as VIEs. The Company has identified Peak Gold as a VIE, with Royal Alaska as the primary beneficiary, due to the legal structure and certain related factors of the limited liability company agreement for Peak Gold. The Company determined that Peak Gold should be fully consolidated at fair value initially. The fair value of the Company's non-controlling interest is $45.7 million and is based on the underlying value of the mineral property assigned to Peak Gold, which is recorded as an exploration stage property within Stream and royalty interests, net on our consolidated balance sheets.
73
ROYAL GOLD, INC.
NOTES TO CONSOLIDATED FINANCIAL STATEMENTS (Continued)
4. STREAM AND ROYALTY INTERESTS, NET
The following summarizes the Company's stream and royalty interests as of June 30, 2016 and 2015:
As of June 30, 2016 (Amounts in thousands):
|
Cost | Accumulated Depletion |
Impairments | Net | |||||||||
|---|---|---|---|---|---|---|---|---|---|---|---|---|---|
Production stage stream interests: |
|||||||||||||
Mount Milligan |
$ | 783,046 | $ | (74,060 | ) | $ | — | $ | 708,986 | ||||
Pueblo Viejo |
610,404 | (21,902 | ) | — | 588,502 | ||||||||
Andacollo |
388,182 | (18,286 | ) | — | 369,896 | ||||||||
Wassa and Prestea |
96,413 | (7,816 | ) | — | 88,597 | ||||||||
| | | | | | | | | | | | | | |
Total production stage stream interests |
1,878,045 | (122,064 | ) | — | 1,755,981 | ||||||||
Production stage royalty interests: |
|||||||||||||
Voisey's Bay |
205,724 | (85,671 | ) | — | 120,053 | ||||||||
Peñasquito |
99,172 | (29,898 | ) | — | 69,274 | ||||||||
Holt |
34,612 | (17,124 | ) | — | 17,488 | ||||||||
Cortez |
10,630 | (10,000 | ) | — | 630 | ||||||||
Other |
531,735 | (342,460 | ) | (18,605 | ) | 170,670 | |||||||
| | | | | | | | | | | | | | |
Total production stage royalty interests |
881,873 | (485,153 | ) | (18,605 | ) | 378,115 | |||||||
| | | | | | | | | | | | | | |
Production stage stream and royalty interests |
2,759,918 | (607,217 | ) | (18,605 | ) | 2,134,096 | |||||||
Development stage stream interests: |
|||||||||||||
Rainy River |
100,706 | — | — | 100,706 | |||||||||
Other |
87,883 | (153 | ) | (75,702 | ) | 12,028 | |||||||
| | | | | | | | | | | | | | |
Total development stage stream interests |
188,589 | (153 | ) | (75,702 | ) | 112,734 | |||||||
Development stage royalty interests: |
|||||||||||||
Pascua-Lama |
380,657 | — | — | 380,657 | |||||||||
Other |
66,414 | — | — | 66,414 | |||||||||
| | | | | | | | | | | | | | |
Total development stage royalty interests |
447,071 | — | — | 447,071 | |||||||||
| | | | | | | | | | | | | | |
Development stage stream and royalty interests |
635,660 | (153 | ) | (75,702 | ) | 559,805 | |||||||
Exploration stage royalty interests |
155,997 | — | (1,811 | ) | 154,186 | ||||||||
| | | | | | | | | | | | | | |
Total stream and royalty interests |
$ | 3,551,575 | $ | (607,370 | ) | $ | (96,118 | ) | $ | 2,848,087 | |||
| | | | | | | | | | | | | | |
| | | | | | | | | | | | | | |
| | | | | | | | | | | | | | |
74
ROYAL GOLD, INC.
NOTES TO CONSOLIDATED FINANCIAL STATEMENTS (Continued)
4. STREAM AND ROYALTY INTERESTS, NET (Continued)
As of June 30, 2015 (Amounts in thousands):
|
Cost | Accumulated Depletion |
Impairments | Net | |||||||||
|---|---|---|---|---|---|---|---|---|---|---|---|---|---|
Production stage stream interests: |
|||||||||||||
Mount Milligan |
$ | 783,046 | $ | (35,195 | ) | $ | — | $ | 747,851 | ||||
Production stage royalty interests: |
|||||||||||||
Andacollo |
272,998 | (65,467 | ) | — | 207,531 | ||||||||
Voisey's Bay |
150,138 | (76,141 | ) | — | 73,997 | ||||||||
Peñasquito |
99,172 | (24,555 | ) | — | 74,617 | ||||||||
Mulatos |
48,092 | (32,313 | ) | 15,779 | |||||||||
Holt |
34,612 | (13,950 | ) | — | 20,662 | ||||||||
Robinson |
17,825 | (12,748 | ) | 5,077 | |||||||||
Cortez |
10,630 | (9,933 | ) | — | 697 | ||||||||
Other |
495,763 | (265,727 | ) | (27,586 | ) | 202,450 | |||||||
| | | | | | | | | | | | | | |
Total production stage royalty interests |
1,129,230 | (500,834 | ) | (27,586 | ) | 600,810 | |||||||
| | | | | | | | | | | | | | |
Production stage stream and royalty interests |
1,912,276 | (536,029 | ) | (27,586 | ) | 1,348,661 | |||||||
Development stage stream interests: |
|||||||||||||
Phoenix Gold |
75,843 | — | — | 75,843 | |||||||||
Other |
8,183 | — | (603 | ) | 7,580 | ||||||||
| | | | | | | | | | | | | | |
Total development stage stream interests |
84,026 | — | (603 | ) | 83,423 | ||||||||
Development stage royalty interests: |
|||||||||||||
Pascua-Lama |
372,105 | — | — | 372,105 | |||||||||
Other |
67,017 | — | — | 67,017 | |||||||||
| | | | | | | | | | | | | | |
Total development stage royalty interests |
439,122 | — | — | 439,122 | |||||||||
| | | | | | | | | | | | | | |
Development stage stream and royalty interests |
523,148 | — | (603 | ) | 522,545 | ||||||||
Exploration stage royalty interests |
212,552 |
— |
(150 |
) |
212,402 |
||||||||
| | | | | | | | | | | | | | |
Total stream and royalty interests |
$ | 2,647,976 | $ | (536,029 | ) | $ | (28,339 | ) | $ | 2,083,608 | |||
| | | | | | | | | | | | | | |
| | | | | | | | | | | | | | |
| | | | | | | | | | | | | | |
Impairment of stream and royalty interests and royalty receivables
In accordance with our impairment accounting policy discussed in Note 1, impairments in the carrying value of each stream or royalty interest are measured and recorded to the extent that the carrying value in each stream or royalty interest exceeds its estimated fair value, which is generally calculated using estimated future discounted cash-flows. As part of the Company's regular asset impairment analysis, which included the presence of impairment indicators, the Company recorded
75
ROYAL GOLD, INC.
NOTES TO CONSOLIDATED FINANCIAL STATEMENTS (Continued)
4. STREAM AND ROYALTY INTERESTS, NET (Continued)
impairment charges for the fiscal years ended June 30, 2016, 2015 and 2014, as summarized in the following table:
| |
Fiscal Years Ended June 30, | |||||||||
|---|---|---|---|---|---|---|---|---|---|---|
| |
2016 | 2015 | 2014 | |||||||
| |
(Amounts in thousands) |
|||||||||
Phoenix Gold(1) |
$ | 75,702 | $ | — | $ | — | ||||
Inata(2) |
11,982 | — | — | |||||||
Wolverine(2) |
5,307 | 25,967 | — | |||||||
Other |
3,127 | 2,372 | — | |||||||
| | | | | | | | | | | |
Total impairment of stream and royalty interests |
$ | 96,118 | $ | 28,339 | $ | — | ||||
Inata royalty receivable |
2,855 | — | — | |||||||
Wolverine royalty receivable |
(385 | ) | 2,996 | — | ||||||
| | | | | | | | | | | |
Total impairment of stream and royalty interests and royalty receivables |
$ | 98,588 | $ | 31,335 | $ | — | ||||
| | | | | | | | | | | |
| | | | | | | | | | | |
| | | | | | | | | | | |
- (1)
- Included
in Other development stage stream interests in the above stream and royalty interests
table.
- (2)
- Included in Other production stage royalty interests in the above stream and royalty interests table.
Phoenix Gold
RGLD Gold owns the right to purchase 6.30% of any gold produced from the Phoenix Gold Project until 135,000 ounces have been delivered, and 3.15% thereafter. The Phoenix Gold Project is located in Red Lake, Ontario, Canada, and operated by Rubicon Minerals Corporation ("Rubicon"). On January 11, 2016, Rubicon provided an updated geologic model and mineralized material statement for the Phoenix Gold Project, which included a significant reduction in mineralized material compared to previous statements provided by Rubicon. Rubicon also announced that they were evaluating strategic alternatives, including merger and divestiture opportunities either at the corporate or asset level, obtaining new financing or capital restructurings. A significant reduction in mineralized material, along with recent decreases in the long-term metal price assumptions used by the industry, are indicators of impairment.
During the quarter ended March 31, 2016, the Company independently evaluated the updated geologic model and mineralized material statement in an effort to properly assess the recoverability of our carrying value. The Company's technical evaluation was completed by internal and external personnel and included an econcomic analysis of the Phoenix Gold Project and a detailed review of the geological model and mineralized material statement.
Based upon the results of the Company's review of the updated geological model and mineralized material statement, and other factors, it was determined that our stream interest at the Phoenix Gold Project should be written down to zero as of March 31, 2016. The Company will continue to pursue commercial alternatives for potential recovery of our investment.
76
ROYAL GOLD, INC.
NOTES TO CONSOLIDATED FINANCIAL STATEMENTS (Continued)
4. STREAM AND ROYALTY INTERESTS, NET (Continued)
Inata
The Company owns a 2.5% gross smelter return royalty on all gold and silver produced from the Inata mine, located in Burkina Faso, West Africa, and operated by a subsidiary of Avocet Mining PLC ("Avocet"). The Company's carrying value for its royalty interest at Inata was approximately $12.0 million as of December 31, 2015. As part of the Company's impairment assessment for the three months ended March 31, 2016, the Company was notified of an updated mine plan at Inata, which included a significant reduction in the life of the mine. Based upon our review of the updated mine plan, our royalty interest was written down to zero as of March 31, 2016.
The Company also had a royalty receivable of approximately $2.8 million associated with past due royalty payments on the Inata interest. As a result of Avocet's financial and operational difficulties and our review of the updated mine plan at Inata, the Company believes payment of the receivable is uncertain and provided for an allowance against the entire royalty receivable as of March 31, 2016. The Company will continue to pursue collection of all past due payments.
Wolverine
The Company owns a 0.00% to 9.445% sliding-scale NSR royalty on all gold and silver produced from the Wolverine underground mine and milling operation located in Yukon Territory, Canada, and operated by Yukon Zinc Corporation ("Yukon Zinc"). As part of the Company's impairment assessment for the three months ended December 31, 2014, the Company was notified of an updated mine plan at Wolverine, which included a significant reduction in reserves and resources when compared to the previous mine plan. A significant reduction in reserves and resources, along with decreases in the long-term metal price assumptions used by the industry, are indicators of impairment.
As part of the impairment determination, the fair value for Wolverine was estimated by calculating the net present value of the estimated future cash-flows expected to be generated by the mining of the Wolverine deposits subject to our royalty interest. The estimates of future cash-flows were derived from a life-of-mine model developed by the Company using Yukon Zinc's updated mine plan information. The metal price assumptions used in the Company's model were supported by consensus price estimates obtained from a number of industry analysts. The future cash-flows were discounted using a discount rate which reflects specific market risk factors the Company associates with the Wolverine royalty interest. Following the impairment charge during the three months ended December 31, 2014, the Wolverine royalty interest has a carrying value of $5.3 million as of June 30, 2015.
The Company had a royalty receivable of approximately $3.0 million associated with past due royalty payments on the Wolverine interest. As a result of recent financial and operational results experienced by Yukon Zinc and their decision to put the mine on care and maintenance, the Company believes payment of the receivable is uncertain and provided for an allowance against the entire receivable as of June 30, 2015. The expense associated with the allowance is recorded within General and administrative expense on the Company's consolidated statements of operations and comprehensive (loss) income.
During the second half of calendar 2015, Yukon Zinc completed bankruptcy proceedings in the Supreme Court of British Columbia and during the quarter ended March 31, 2016, we were made aware of no further intentions to recommission the mine. Based upon the updated developments and
77
ROYAL GOLD, INC.
NOTES TO CONSOLIDATED FINANCIAL STATEMENTS (Continued)
4. STREAM AND ROYALTY INTERESTS, NET (Continued)
limited remaining mineralized material at Wolverine, the Company wrote down the remaining carrying value at Wolverine to zero as of March 31, 2016.
Other
As part of the Company's regular asset impairment analysis during the three months ended March 31, 2016, including consideration of recent operator/property updates and developments, the Company determined that one production stage royalty interest and three exploration stage royalty interests should be written down to zero for a total impairment of approximately $3.1 million.
As part of the Company's regular asset impairment analysis during the three months ended September 30, 2014, the Company determined that one production stage royalty interest and one exploration stage royalty interest should be written down to zero for a total impairment of $1.8 million. As part of the termination of the Tulsequah Chief gold and silver stream, as discussed below, the Company wrote-off approximately $0.6 million of direct acquisition costs during the three months ended December 31, 2014.
Termination of the Tulsequah Chief Gold and Silver Stream
On December 22, 2014, RGLD Gold terminated the Amended and Restated Gold and Silver Purchase and Sale Agreement (the "Tulsequah Agreement"), between RGLD Gold, the Company, Chieftain Metals Inc. and Chieftain Metals Corp. (together, "Chieftain"), relating to Chieftain's Tulsequah Chief mining project located in British Columbia, Canada. Pursuant to the terms of the Agreement, Chieftain repaid RGLD Gold's original $10.0 million advance payment. As a result of the termination of the Tulsequah Agreement and repayment of our investment, the carrying value of the Tulsequah Chief gold and silver stream, which included our $10.0 million investment and approximately $0.6 million of direct acquisition costs, was reduced to zero during the three months ended December 31, 2014.
5. AVAILABLE-FOR-SALE SECURITIES
The Company's available-for-sale securities as of June 30, 2016 and 2015 consist of the following:
| |
As of June 30, 2016 | ||||||||||||
|---|---|---|---|---|---|---|---|---|---|---|---|---|---|
| |
(Amounts in thousands) |
||||||||||||
| |
|
Unrealized | |
||||||||||
| |
Cost Basis | Fair Value | |||||||||||
| |
Gain | Loss | |||||||||||
Non-current: |
|||||||||||||
Seabridge |
$ | — | — | — | $ | — | |||||||
| | | | | | | | | | | | | | |
|
$ | — | $ | — | $ | — | $ | — | |||||
| | | | | | | | | | | | | | |
| | | | | | | | | | | | | | |
| | | | | | | | | | | | | | |
78
ROYAL GOLD, INC.
NOTES TO CONSOLIDATED FINANCIAL STATEMENTS (Continued)
5. AVAILABLE-FOR-SALE SECURITIES (Continued)
| |
As of June 30, 2015 | ||||||||||||
|---|---|---|---|---|---|---|---|---|---|---|---|---|---|
| |
(Amounts in thousands) |
||||||||||||
| |
|
Unrealized | |
||||||||||
| |
Cost Basis | Gain | Loss | Fair Value | |||||||||
Non-current: |
|||||||||||||
Seabridge |
$ | 9,565 | — | (3,292 | ) | $ | 6,273 | ||||||
| | | | | | | | | | | | | | |
|
$ | 9,565 | $ | — | $ | (3,292 | ) | $ | 6,273 | ||||
| | | | | | | | | | | | | | |
| | | | | | | | | | | | | | |
| | | | | | | | | | | | | | |
Our only significant available-for-sale security was the investment in Seabridge Gold, Inc. ("Seabridge") common stock, acquired in June 2011. During the fiscal year ended June 30, 2016, the Company sold all of its Seabridge common stock, resulting in a realized gain of approximately $2.3 million.
6. DEBT
The Company's debt as of June 30, 2016 and 2015 consists of the following:
| |
As of June 30, 2016 | As of June 30, 2015 | |||||||||||||||||||||||
|---|---|---|---|---|---|---|---|---|---|---|---|---|---|---|---|---|---|---|---|---|---|---|---|---|---|
| |
Principal | Unmortized Discount |
Debt Issuance Costs |
Total | Principal | Unmortized Discount |
Debt Issuance Costs |
Total | |||||||||||||||||
| |
(Amounts in thousands) |
(Amounts in thousands) |
|||||||||||||||||||||||
Convertible notes due 2019 |
$ | 370,000 | $ | (36,943 | ) | $ | (3,934 | ) | $ | 329,123 | $ | 370,000 | $ | (47,890 | ) | $ | (5,180 | ) | $ | 316,930 | |||||
Revolving credit facility |
275,000 | — | (3,438 | ) | 271,562 | — | — | (3,061 | ) | (3,061 | ) | ||||||||||||||
| | | | | | | | | | | | | | | | | | | | | | | | | | |
Total debt |
$ | 645,000 | $ | (36,943 | ) | $ | (7,372 | ) | $ | 600,685 | $ | 370,000 | $ | (47,890 | ) | $ | (8,241 | ) | $ | 313,869 | |||||
| | | | | | | | | | | | | | | | | | | | | | | | | | |
| | | | | | | | | | | | | | | | | | | | | | | | | | |
| | | | | | | | | | | | | | | | | | | | | | | | | | |
Convertible Senior Notes Due 2019
In June 2012, the Company completed an offering of $370 million aggregate principal amount of convertible senior notes due 2019 ("2019 Notes"). The 2019 Notes bear interest at the rate of 2.875% per annum, and the Company is required to make semi-annual interest payments on the outstanding principal balance of the 2019 Notes on June 15 and December 15 of each year, beginning December 15, 2012. The 2019 Notes mature on June 15, 2019. Interest expense recognized on the 2019 Notes for the fiscal years ended June 30, 2016, 2015 and 2014 was approximately $22.8 million, $22.1 million and $21.4 million, respectively. Interest expense recognized includes the contractual coupon interest, the accretion of the debt discount and amortization of the debt issuance costs, and is recorded in Interest and other expense consolidated statements of operations and comprehensive income. During the fiscal years ended June 30, 2016 and 2015, the Company made $10.6 million in interest payments on our 2019 Notes.
Revolving credit facility
The Company maintains a $650 million revolving credit facility. As of June 30, 2016, the Company had $275.0 million outstanding and $375.0 million available under the revolving credit facility. The Company had no amount outstanding under the revolving credit facility as of June 30, 2015.
79
ROYAL GOLD, INC.
NOTES TO CONSOLIDATED FINANCIAL STATEMENTS (Continued)
6. DEBT (Continued)
Borrowings under the revolving credit facility bear interest at a floating rate of LIBOR plus a margin of 1.25% to 3.0%, based on Royal Gold's leverage ratio. As of June 30, 2016, the interest rate on borrowings under the revolving credit facility was LIBOR plus 2.25% for an all-in rate of 2.89%. Royal Gold may repay any borrowings under the revolving credit facility at any time without premium or penalty.
On March 16, 2016, the Company entered into Amendment No. 2 (the "Amendment") to the Sixth Amended and Restated Revolving Credit Agreement, dated as of January 29, 2014 (as amended by Amendment No. 1 thereto as of April 29, 2015, the "Revolving Credit Agreement"), by and among the Company, certain subsidiaries of the Company as guarantors, certain lenders from time to time party thereto, and HSBC Bank USA, National Association, as administrative agent for the lenders. The Amendment revises the Revolving Credit Agreement to extend the scheduled maturity date from January 29, 2019 to March 16, 2021.
At June 30, 2016, the Company was in compliance with each financial covenant (leverage ratio and consolidated net worth, as defined therein).
7. REVENUE
Revenue is comprised of the following:
| |
Fiscal Years Ended June 30, | |||||||||
|---|---|---|---|---|---|---|---|---|---|---|
| |
2016 | 2015 | 2014 | |||||||
| |
(Amounts in thousands) |
|||||||||
Stream interests |
$ | 238,028 | $ | 94,104 | $ | 27,209 | ||||
Royalty interests |
121,762 | 183,915 | 209,953 | |||||||
| | | | | | | | | | | |
Total revenue |
$ | 359,790 | $ | 278,019 | $ | 237,162 | ||||
| | | | | | | | | | | |
| | | | | | | | | | | |
| | | | | | | | | | | |
8. STOCK-BASED COMPENSATION
In November 2015, shareholders of the Company approved the 2015 Omnibus Long-Term Incentive Plan ("2015 LTIP"). Under the 2015 LTIP, 2,500,000 shares of common stock have been authorized for future grants to officers, directors, key employees and other persons. The 2015 LTIP provides for the grant of stock options, unrestricted stock, restricted stock, dividend equivalent rights, SSARs and cash awards. Any of these awards may, but need not, be made as performance incentives. Stock options granted under the 2015 LTIP may be non-qualified stock options or incentive stock options.
80
ROYAL GOLD, INC.
NOTES TO CONSOLIDATED FINANCIAL STATEMENTS (Continued)
8. STOCK-BASED COMPENSATION (Continued)
The Company recognized stock-based compensation expense as follows:
| |
For the Fiscal Years Ended June 30, |
|||||||||
|---|---|---|---|---|---|---|---|---|---|---|
| |
2016 | 2015 | 2014 | |||||||
| |
(Amounts in thousands) |
|||||||||
Stock options |
$ | 454 | $ | 417 | $ | 468 | ||||
Stock appreciation rights |
1,687 | 1,422 | 1,305 | |||||||
Restricted stock |
3,686 | 2,511 | 3,110 | |||||||
Performance stock |
4,212 | 791 | (2,303 | ) | ||||||
| | | | | | | | | | | |
Total stock-based compensation expense |
$ | 10,039 | $ | 5,141 | $ | 2,580 | ||||
| | | | | | | | | | | |
| | | | | | | | | | | |
| | | | | | | | | | | |
Stock-based compensation expense is included within General and administrative expense on the consolidated statements of operations and comprehensive (loss) income.
Stock Options and Stock Appreciation Rights
Stock option and SSARs awards are granted with an exercise price equal to the closing market price of the Company's stock at the date of grant. Stock option and SSARs awards granted to officers, key employees and other persons vest based on one to three years of continuous service. Stock option and SSARs awards have 10 year contractual terms.
To determine stock-based compensation expense for stock options and SSARs, the fair value of each stock option and SSAR is estimated on the date of grant using the Black-Scholes-Merton ("Black-Scholes") option pricing model for all periods presented. The Black-Scholes model requires key assumptions in order to determine fair value. Those key assumptions during the fiscal year 2016, 2015 and 2014 grants are noted in the following table:
| |
Stock Options | SSARs | |||||||||||||||||
|---|---|---|---|---|---|---|---|---|---|---|---|---|---|---|---|---|---|---|---|
| |
2016 | 2015 | 2014 | 2016 | 2015 | 2014 | |||||||||||||
Weighted-average expected volatility |
36.9 | % | 37.3 | % | 43.6 | % | 36.9 | % | 36.6 | % | 41.3 | % | |||||||
Weighted-average expected life in years |
5.5 | 5.5 | 5.5 | 5.4 | 5.3 | 4.8 | |||||||||||||
Weighted-average dividend yield |
1.06 | % | 1.00 | % | 1.00 | % | 1.00 | % | 1.00 | % | 1.00 | % | |||||||
Weighted-average risk free interest rate |
1.6 | % | 1.7 | % | 1.7 | % | 1.6 | % | 1.7 | % | 1.5 | % | |||||||
The Company's expected volatility is based on the historical volatility of the Company's stock over the expected option term. The Company's expected option term is determined by historical exercise patterns along with other known employee or company information at the time of grant. The risk free interest rate is based on the zero-coupon U.S. Treasury bond at the time of grant with a term approximate to the expected option term.
81
ROYAL GOLD, INC.
NOTES TO CONSOLIDATED FINANCIAL STATEMENTS (Continued)
8. STOCK-BASED COMPENSATION (Continued)
Stock Options
A summary of stock option activity for the fiscal year ended June 30, 2016, is presented below.
| |
Number of Shares |
Weighted- Average Exercise Price |
Weighted- Average Remaining Contractual Life (Years) |
Aggregate Intrinsic Value (in thousands) |
|||||||||
|---|---|---|---|---|---|---|---|---|---|---|---|---|---|
Outstanding at July 1, 2015 |
96,155 | $ | 59.28 | ||||||||||
Granted |
25,437 | $ | 55.71 | ||||||||||
Exercised |
(2,500 | ) | $ | 28.78 | |||||||||
Forfeited |
(1,269 | ) | $ | 69.94 | |||||||||
| | | | | | | | | | | | | | |
Outstanding at June 30, 2016 |
117,823 | $ | 59.04 | 6.4 | $ | 1,632 | |||||||
| | | | | | | | | | | | | | |
| | | | | | | | | | | | | | |
| | | | | | | | | | | | | | |
Exercisable at June 30, 2016 |
73,366 | $ | 57.46 | 5.1 | $ | 1,129 | |||||||
| | | | | | | | | | | | | | |
| | | | | | | | | | | | | | |
| | | | | | | | | | | | | | |
The weighted-average grant date fair value of options granted during the fiscal years ended June 30, 2016, 2015 and 2014, was $18.05, $24.86 and $22.78, respectively. The total intrinsic value of options exercised during the fiscal years ended June 30, 2016, 2015 and 2014, were $0.1 million, $0.7 million, and $1.1 million, respectively.
As of June 30, 2016, there was approximately $0.5 million of total unrecognized stock-based compensation expense related to non-vested stock options, which is expected to be recognized over a weighted-average period of 1.7 years.
SSARs
A summary of SSARs activity for the fiscal year ended June 30, 2016, is presented below.
| |
Number of Shares |
Weighted- Average Exercise Price |
Weighted- Average Remaining Contractual Life (Years) |
Aggregate Intrinsic Value (in thousands) |
|||||||||
|---|---|---|---|---|---|---|---|---|---|---|---|---|---|
Outstanding at July 1, 2015 |
277,118 | $ | 63.91 | ||||||||||
Granted |
97,817 | $ | 56.54 | ||||||||||
Exercised |
(7,000 | ) | $ | 30.96 | |||||||||
Forfeited |
(130 | ) | $ | 62.14 | |||||||||
| | | | | | | | | | | | | | |
Outstanding at June 30, 2016 |
367,805 | $ | 62.58 | 7.1 | $ | 3,861 | |||||||
| | | | | | | | | | | | | | |
| | | | | | | | | | | | | | |
| | | | | | | | | | | | | | |
Exercisable at June 30, 2016 |
194,863 | $ | 62.24 | 5.7 | $ | 2,106 | |||||||
| | | | | | | | | | | | | | |
| | | | | | | | | | | | | | |
| | | | | | | | | | | | | | |
The weighted-average grant date fair value of SSARs granted during the fiscal years ended June 30, 2016, 2015 and 2014 was $18.35, $24.42 and $21.15, respectively. The total intrinsic value of SSARs exercised during the fiscal years ended June 30, 2016, 2015 and 2014, were $0.3 million, $0.2 million, and $0.1 million, respectively.
82
ROYAL GOLD, INC.
NOTES TO CONSOLIDATED FINANCIAL STATEMENTS (Continued)
8. STOCK-BASED COMPENSATION (Continued)
As of June 30, 2016, there was approximately $1.9 million of total unrecognized stock-based compensation expense related to non-vested SSARs, which is expected to be recognized over a weighted-average period of 1.7 years.
Other Stock-based Compensation
Performance Shares
During fiscal 2016, officers and certain employees were granted 48,422 shares of restricted common stock that can be earned only upon the Company's achievement of certain pre-defined performance measures. Specifically, for performance shares granted in fiscal 2016, one-half of the shares awarded may vest upon the Company's achievement of annual growth in Net Gold Equivalent Ounces ("Net GEOs") ("GEO Shares"). The second one-half of performance shares granted in fiscal 2016 may vest based on the Company's total shareholder return ("TSR") compared to the TSRs of other members of the Market Vectors Gold Miners ETF (GDX) ("TSR Shares"). GEO Shares and TSR Shares may vest by linear interpolation in a range between zero shares if neither threshold Net GEO and TSR metric is met; to 100% of GEO Shares and TSR Shares awarded if both target Net GEO and TSR metrics are met; to 200% of the Net GEO and TSR shares awarded if both the maximum Net GEO and TSR metrics are met. The GEO Shares will expire in five years from the date of grant if the performance measure is not met, while the TSR Shares will expire in three years from the date of grant if the TSR market condition and three year service condition are not met.
Performance shares granted prior to fiscal 2016 can be earned only if a single pre-defined performance goal (growth of adjusted free cash flow on a per share, trailing twelve month basis) is met within five years of the date of grant. If the performance goal is not earned by the end of this five year period, the fiscal 2015 Performance Shares will be forfeited. Vesting of the fiscal 2015 performance shares is subject to certain performance measures being met and can be based on an interim earn out of 25%, 50%, 75% or 100%.
The Company measures the fair value of the GEO Shares and performance shares granted prior to fiscal 2016 based upon the market price of our common stock as of the date of grant. In accordance with ASC 718, the measurement date for the GEO Shares and performance shares granted prior to fiscal 2016 will be determined at such time that the performance goals are attained or that it is probable they will be attained. At such time that it is probable that a performance condition will be achieved, compensation expense will be measured by the number of shares that will ultimately be earned based on the grant date market price of our common stock. For shares that were previously estimated to be probable of vesting and are no longer deemed to be probable of vesting, compensation expense is reversed during the period in which it is determined they are no longer probable of vesting. Interim recognition of compensation expense will be made at such time as management can reasonably estimate the number of shares that will be earned.
In accordance with ASC 718, provided the market condition within the TSR Shares, the Company measured the grant date fair value using a Monte Carlo valuation model. The fair value of the TSR Shares ($35.15 per share) is multiplied by the target number of TSR Shares granted to determine total stock-based compensation expense. Total stock-based compensation expense of the TSR Shares is amortized on a straight-line basis over the requisite service period, or three years. Stock-based compensation expense for the TSR Shares is recognized provided the requisite service period is rendered, regardless of when, if ever, the TSR market condition is satisfied. The Company will reverse
83
ROYAL GOLD, INC.
NOTES TO CONSOLIDATED FINANCIAL STATEMENTS (Continued)
8. STOCK-BASED COMPENSATION (Continued)
previously recognized stock-based compensation expense attributable to the TSR Shares only if the requisite service period is not rendered.
A summary of the status of the Company's non-vested Performance Shares for the fiscal year ended June 30, 2016, is presented below:
| |
Number of Shares |
Weighted- Average Grant Date Fair Value |
|||||
|---|---|---|---|---|---|---|---|
Non-vested at July 1, 2015 |
200,325 | $ | 66.52 | ||||
Granted |
48,422 | $ | 45.63 | ||||
Vested |
(10,781 | ) | $ | 75.06 | |||
Expired |
(23,750 | ) | $ | 49.66 | |||
Forfeited |
(4,038 | ) | $ | 35.15 | |||
| | | | | | | | |
Non-vested at June 30, 2016 |
210,178 | $ | 63.78 | ||||
| | | | | | | | |
| | | | | | | | |
| | | | | | | | |
As of June 30, 2016, total unrecognized stock-based compensation expense related to Performance Shares was approximately $2.3 million, which is expected to be recognized over the average remaining vesting period of 1.5 years.
Restricted Stock
Officers, non-executive directors and certain employees may be granted shares of restricted stock that vest on continued service alone ("Restricted Stock"). During fiscal 2016, officers and certain employees were granted 50,507 shares of Restricted Stock. Restricted Stock awards granted to officers and certain employees vest over three years beginning after a two-year holding period from the date of grant with one-third of the shares vesting in years three, four and five, respectively. Also during fiscal year 2016, our non-executive directors were granted 22,680 shares of Restricted Stock. The non-executive directors' shares of Restricted Stock vest 50% immediately and 50% one year after the date of grant.
Shares of Restricted Stock represent issued and outstanding shares of common stock, with dividend and voting rights. The Company measures the fair value of the Restricted Stock based upon the market price of our common stock as of the date of grant. Restricted Stock is amortized over the applicable vesting period using the straight-line method. Unvested shares of Restricted Stock are subject to forfeiture upon termination of employment or service with the Company.
84
ROYAL GOLD, INC.
NOTES TO CONSOLIDATED FINANCIAL STATEMENTS (Continued)
8. STOCK-BASED COMPENSATION (Continued)
A summary of the status of the Company's non-vested Restricted Stock for the fiscal year ended June 30, 2016, is presented below:
| |
Number of Shares |
Weighted- Average Grant Date Fair Value |
|||||
|---|---|---|---|---|---|---|---|
Non-vested at July 1, 2015 |
154,807 | $ | 66.23 | ||||
Granted |
73,187 | $ | 56.25 | ||||
Vested |
(51,472 | ) | $ | 61.54 | |||
Forfeited |
— | $ | — | ||||
| | | | | | | | |
Non-vested at June 30, 2016 |
176,522 | $ | 63.46 | ||||
| | | | | | | | |
| | | | | | | | |
| | | | | | | | |
As of June 30, 2016, total unrecognized stock-based compensation expense related to Restricted Stock was approximately $5.5 million, which is expected to be recognized over the weighted-average vesting period of 3.0 years.
9. STOCKHOLDERS' EQUITY
Preferred Stock
The Company has 10,000,000 authorized and unissued shares of $.01 par value Preferred Stock as of June 30, 2016 and 2015.
Common Stock Issuances
During the fiscal years ended June 30, 2016, 2015 and 2014, options to purchase 2,500, 20,488 and 34,495 shares, respectively, were exercised, resulting in proceeds of approximately $0.1 million, $0.8 million and $1.1 million, respectively.
Stockholders' Rights Plan
On September 10, 2007, the Company entered into the First Amended and Restated Rights Agreement, dated September 10, 2007 (the "Rights Agreement"). The Rights Agreement expires on September 10, 2017. The Rights Agreement was approved by the Company's board of directors (the "Board").
The Rights Agreement is intended to deter coercive or abusive tender offers and market accumulations. The Rights Agreement is designed to encourage an acquirer to negotiate with the Board and to enhance the Board's ability to act in the best interests of all the Company's stockholders.
Under the Rights Agreement, each stockholder of the Company holds one preferred stock purchase right (a "Right") for each share of Company common stock held. The Rights generally become exercisable only in the event that an acquiring party accumulates 15 percent or more of the Company's outstanding shares of common stock. If this were to occur, subject to certain exceptions, each Right (except for the Rights held by the acquiring party) would allow its holders to purchase one one-thousandth of a newly issued share of Series A junior participating preferred stock of Royal Gold or the Company's common stock with a value equal to twice the exercise price of the Right, initially set at $175 under the terms and conditions set forth in the Rights Agreement.
85
ROYAL GOLD, INC.
NOTES TO CONSOLIDATED FINANCIAL STATEMENTS (Continued)
10. EARNINGS PER SHARE ("EPS")
Basic earnings (loss) per common share were computed using the weighted average number of shares of common stock outstanding during the period, considering the effect of participating securities. Unvested stock-based compensation awards that contain non-forfeitable rights to dividends or dividend equivalents are considered participating securities and are included in the computation of earnings per share pursuant to the two-class method. The Company's unvested restricted stock awards contain non-forfeitable dividend rights and participate equally with common stock with respect to dividends issued or declared. The Company's unexercised stock options, unexercised SSARs and unvested performance stock do not contain rights to dividends. Under the two-class method, the earnings (loss) used to determine basic earnings (loss) per common share are reduced by an amount allocated to participating securities. Use of the two-class method has an immaterial impact on the calculation of basic and diluted earnings (loss) per common share.
The following table summarizes the effects of dilutive securities on diluted EPS for the period:
| |
Fiscal Years Ended June 30, | |||||||||
|---|---|---|---|---|---|---|---|---|---|---|
| |
2016 | 2015 | 2014 | |||||||
| |
(in thousands, except share data) |
|||||||||
Net (loss) income available to Royal Gold common stockholders |
$ | (77,149 | ) | $ | 51,965 | $ | 62,641 | |||
| | | | | | | | | | | |
Weighted-average shares for basic EPS |
65,074,455 | 65,007,861 | 64,909,149 | |||||||
Effect of other dilutive securities |
— | 117,312 | 117,107 | |||||||
| | | | | | | | | | | |
Weighted-average shares for diluted EPS |
65,074,455 | 65,125,173 | 65,026,256 | |||||||
| | | | | | | | | | | |
| | | | | | | | | | | |
| | | | | | | | | | | |
Basic (loss) earnings per share |
$ | (1.18 | ) | $ | 0.80 | $ | 0.96 | |||
| | | | | | | | | | | |
| | | | | | | | | | | |
| | | | | | | | | | | |
Diluted (loss) earnings per share |
$ | (1.18 | ) | $ | 0.80 | $ | 0.96 | |||
| | | | | | | | | | | |
| | | | | | | | | | | |
| | | | | | | | | | | |
The calculation of weighted average shares includes all of our outstanding common stock. The Company intends to settle the principal amount of the 2019 Notes in cash. As a result, there will be no impact to diluted earnings per share unless the share price of the Company's common stock exceeds the conversion price of $105.31.
11. INCOME TAXES
For financial reporting purposes, Income before income taxes includes the following components:
| |
Fiscal Years Ended June 30, | |||||||||
|---|---|---|---|---|---|---|---|---|---|---|
| |
2016 | 2015 | 2014 | |||||||
| |
(Amounts in thousands) |
|||||||||
United States |
$ | (230 | ) | $ | 17,569 | $ | 17,033 | |||
Foreign |
(21,528 | ) | 44,675 | 65,894 | ||||||
| | | | | | | | | | | |
|
$ | (21,758 | ) | $ | 62,244 | $ | 82,927 | |||
| | | | | | | | | | | |
| | | | | | | | | | | |
| | | | | | | | | | | |
86
ROYAL GOLD, INC.
NOTES TO CONSOLIDATED FINANCIAL STATEMENTS (Continued)
11. INCOME TAXES (Continued)
The Company's Income tax expense consisted of:
| |
Fiscal Years Ended June 30, | |||||||||
|---|---|---|---|---|---|---|---|---|---|---|
| |
2016 | 2015 | 2014 | |||||||
| |
(Amounts in thousands) |
|||||||||
Current: |
||||||||||
Federal |
$ | 45,878 | $ | 22,418 | $ | (3,663 | ) | |||
State |
135 | (36 | ) | 334 | ||||||
Foreign |
19,650 | 14,835 | 30,950 | |||||||
| | | | | | | | | | | |
|
$ | 65,663 | $ | 37,217 | $ | 27,621 | ||||
| | | | | | | | | | | |
| | | | | | | | | | | |
| | | | | | | | | | | |
Deferred and others: |
||||||||||
Federal |
$ | (6,986 | ) | $ | (5,506 | ) | $ | (4,122 | ) | |
State |
(78 | ) | (49 | ) | (26 | ) | ||||
Foreign |
2,081 | (22,096 | ) | (4,018 | ) | |||||
| | | | | | | | | | | |
|
$ | (4,983 | ) | $ | (27,651 | ) | $ | (8,166 | ) | |
| | | | | | | | | | | |
Total income tax expense |
$ | 60,680 | $ | 9,566 | $ | 19,455 | ||||
| | | | | | | | | | | |
| | | | | | | | | | | |
| | | | | | | | | | | |
The provision for income taxes for the fiscal years ended June 30, 2016, 2015 and 2014, differs from the amount of income tax determined by applying the applicable United States statutory federal income tax rate to pre-tax income (net of non-controlling interest in income of consolidated subsidiary and loss from equity investment) from operations as a result of the following differences:
| |
Fiscal Years Ended June 30, | |||||||||
|---|---|---|---|---|---|---|---|---|---|---|
| |
2016 | 2015 | 2014 | |||||||
| |
(Amounts in thousands) |
|||||||||
Total expense computed by applying federal rates |
$ | (7,615 | ) | $ | 21,786 | $ | 29,024 | |||
State and provincial income taxes, net of federal benefit |
(1 | ) | 25 | 334 | ||||||
Excess depletion |
(882 | ) | (1,429 | ) | (1,114 | ) | ||||
Estimates for uncertain tax positions |
1,866 | 1,404 | (7,386 | ) | ||||||
Statutory tax attributable to non-controlling interest |
1,838 | (211 | ) | (293 | ) | |||||
Effect of foreign earnings |
61,576 | 6,536 | 1,141 | |||||||
Effect of foreign earnings indefinitely reinvested |
3,406 | (7,601 | ) | (1,700 | ) | |||||
Canadian rate adjustment |
— | 4,070 | — | |||||||
Chilean tax reform |
— | (2,481 | ) | — | ||||||
Unrealized foreign exchange gains |
(2,439 | ) | (10,949 | ) | (367 | ) | ||||
Changes in estimates |
1,641 | (359 | ) | (594 | ) | |||||
Other |
1,290 | (1,225 | ) | 410 | ||||||
| | | | | | | | | | | |
|
$ | 60,680 | $ | 9,566 | $ | 19,455 | ||||
| | | | | | | | | | | |
| | | | | | | | | | | |
| | | | | | | | | | | |
The effective tax rate includes the impact of certain undistributed foreign subsidiary earnings for which we have not provided U.S. taxes because we plan to reinvest such earnings indefinitely outside the United States. The Company has the ability and intent to indefinitely reinvest these foreign earnings based on revenue and cash projections of our other investments, current cash on hand, and availability under our revolving credit facility. No deferred tax has been provided on the difference
87
ROYAL GOLD, INC.
NOTES TO CONSOLIDATED FINANCIAL STATEMENTS (Continued)
11. INCOME TAXES (Continued)
between the tax basis in the stock of the consolidated subsidiary and the amount of the subsidiary's net equity determined for financial reporting purposes.
The tax effects of temporary differences and carryforwards, which give rise to our deferred tax assets and liabilities at June 30, 2016 and 2015, are as follows:
| |
2016 | 2015 | |||||
|---|---|---|---|---|---|---|---|
| |
(Amounts in thousands) |
||||||
Deferred tax assets: |
|||||||
Stock-based compensation |
$ | 5,691 | $ | 4,393 | |||
Net operating losses |
12,385 | 16,087 | |||||
Other |
4,610 | 3,904 | |||||
| | | | | | | | |
Total deferred tax assets |
22,686 | 24,384 | |||||
Valuation allowance |
(2,100 | ) | (4,262 | ) | |||
| | | | | | | | |
Net deferred tax assets |
$ | 20,586 | $ | 20,122 | |||
| | | | | | | | |
Deferred tax liabilities: |
|||||||
Mineral property basis |
$ | (127,337 | ) | $ | (133,646 | ) | |
Unrealized foreign exchange gains |
(1,273 | ) | 936 | ||||
2019 Notes |
(12,639 | ) | (16,384 | ) | |||
Other |
(124 | ) | (1,658 | ) | |||
| | | | | | | | |
Total deferred tax liabilities |
(141,373 | ) | (150,752 | ) | |||
| | | | | | | | |
Total net deferred taxes |
$ | (120,787 | ) | $ | (130,630 | ) | |
| | | | | | | | |
| | | | | | | | |
| | | | | | | | |
The Company reviews the measurement of its deferred tax assets at each balance sheet date. All available evidence, both positive and negative, is considered in determining whether, based upon the weight of the evidence, it is more likely than not that some portion or all of the deferred tax asset will not be realized. As of June 30, 2016 and 2015, the Company had $2.1 million and $4.3 million of valuation allowances recorded, respectively. The valuation allowance remaining at June 30, 2016 is attributable to capital loss carryforwards in non-US subsidiaries.
At June 30, 2016 and 2015, the Company had $59.5 million and $55 million of net operating loss carry forwards, respectively. The increase in the net operating loss carry forwards is primarily attributable to the impairment charges in non-U.S. subsidiaries. The majority of the tax loss carry forwards are in jurisdictions that allow a twenty year carry forward period. As a result, these losses do not begin to expire until the 2028 tax year, and the Company anticipates the losses will be fully utilized.
As of June 30, 2016 and 2015, the Company had $16.9 million and $15.1 million of unrecognized tax benefits, respectively. If recognized, these unrecognized tax benefits would positively impact the
88
ROYAL GOLD, INC.
NOTES TO CONSOLIDATED FINANCIAL STATEMENTS (Continued)
11. INCOME TAXES (Continued)
Company's effective income tax rate. A reconciliation of the beginning and ending amount of gross unrecognized tax benefits is as follows:
| |
2016 | 2015 | 2014 | |||||||
|---|---|---|---|---|---|---|---|---|---|---|
| |
(Amounts in thousands) |
|||||||||
Total gross unrecognized tax benefits at beginning of year |
$ | 15,130 | $ | 13,725 | $ | 21,166 | ||||
Additions / Reductions for tax positions of current year |
1,866 | 1,662 | (1,052 | ) | ||||||
Reductions due to settlements with taxing authorities |
— | (257 | ) | (296 | ) | |||||
Reductions due to lapse of statute of limitations |
— | — | (6,093 | ) | ||||||
| | | | | | | | | | | |
Total amount of gross unrecognized tax benefits at end of year |
$ | 16,996 | $ | 15,130 | $ | 13,725 | ||||
| | | | | | | | | | | |
| | | | | | | | | | | |
| | | | | | | | | | | |
The Company or one of its subsidiaries files income tax returns in the U.S. federal jurisdiction, and various state and foreign jurisdictions. With few exceptions, the Company is no longer subject to U.S. Federal, state and local, and non-U.S. income tax examinations by tax authorities for fiscal years before 2010. As a result of (i) statutes of limitation that will begin to expire within the next 12 months in various jurisdictions, (ii) possible settlements of audit-related issues with taxing authorities in various jurisdictions with respect to which none of the issues are individually significant, and (iii) additional accrual of exposure and interest on existing items, the Company believes that it is reasonably possible that the total amount of its net unrecognized income tax benefits will not decrease in the next 12 months.
The Company's continuing practice is to recognize interest and/or penalties related to unrecognized tax benefits as part of its income tax expense. At June 30, 2016 and 2015, the amount of accrued income-tax-related interest and penalties was $5.7 million and $4.6 million, respectively.
12. SUPPLEMENTAL CASH FLOW INFORMATION
The Company's supplemental cash flow information for the fiscal years ending June 30, 2016, 2015 and 2014 is as follows:
| |
2016 | 2015 | 2014 | |||||||
|---|---|---|---|---|---|---|---|---|---|---|
| |
(Amounts in thousands) |
|||||||||
Cash paid during the period for: |
||||||||||
Interest |
$ | 17,691 | $ | 10,638 | $ | 10,638 | ||||
Income taxes, net of refunds |
$ | 76,072 | $ | 20,272 | $ | 27,322 | ||||
Non-cash investing and financing activities: |
||||||||||
Dividends declared |
$ | 59,388 | $ | 56,715 | $ | 54,049 | ||||
89
ROYAL GOLD, INC.
NOTES TO CONSOLIDATED FINANCIAL STATEMENTS (Continued)
13. FAIR VALUE MEASUREMENTS
ASC 820 establishes a fair value hierarchy that prioritizes the inputs to valuation techniques used to measure fair value. The hierarchy gives the highest priority to unadjusted quoted prices in active markets for identical assets or liabilities (Level 1 measurements) and the lowest priority to unobservable inputs (Level 3 measurements). The three levels of the fair value hierarchy under ASC 820 are described below:
Level 1: Quoted prices for identical instruments in active markets;
Level 2: Quoted prices for similar instruments in active markets; quoted prices for identical or similar instruments in markets that are not active; and model-derived valuations in which all significant inputs and significant value drivers are observable in active markets; and
Level 3: Prices or valuation techniques requiring inputs that are both significant to the fair value measurement and unobservable (supported by little or no market activity).
The following table sets forth the Company's financial assets measured at fair value on a recurring basis (at least annually) by level within the fair value hierarchy.
| |
At June 30, 2016 | |||||||||||||||
|---|---|---|---|---|---|---|---|---|---|---|---|---|---|---|---|---|
| |
|
Fair Value | ||||||||||||||
| |
Carrying Amount |
|||||||||||||||
| |
Total | Level 1 | Level 2 | Level 3 | ||||||||||||
Assets (In thousands): |
||||||||||||||||
Warrants(1) |
$ | 2,438 | $ | 2,438 | $ | — | $ | 2,438 | $ | — | ||||||
| | | | | | | | | | | | | | | | | |
Total assets |
$ | 2,438 | $ | — | $ | 2,438 | $ | — | ||||||||
| | | | | | | | | | | | | | | | | |
| | | | | | | | | | | | | | | | | |
| | | | | | | | | | | | | | | | | |
Liabilities (In thousands): |
||||||||||||||||
Debt(2) |
$ | 410,057 | $ | 390,813 | $ | 390,813 | $ | — | $ | — | ||||||
| | | | | | | | | | | | | | | | | |
Total liabilities |
$ | 390,813 | $ | 390,813 | $ | — | $ | — | ||||||||
| | | | | | | | | | | | | | | | | |
| | | | | | | | | | | | | | | | | |
| | | | | | | | | | | | | | | | | |
- (1)
- Included
in Other assets on the Company's consolidated balance sheets.
- (2)
- Included in the carrying amount is the equity component of our 2019 Notes in the amount of $77 million, which is included within Additional paid-in capital in the Company's consolidated balance sheets.
The Company's debt classified within Level 1 of the fair value hierarchy is valued using quoted prices in an active market. The carrying value of the Company's revolving credit facility (Note 6) approximates fair value as of June 30, 2016. During the fiscal year ended June 30, 2016, the warrants issued by Golden Star (Note 3) were added to the Level 2 fair value hierarchy.
As of June 30, 2016, the Company also had assets that, under certain conditions, are subject to measurement at fair value on a non-recurring basis like those associated with stream and royalty interests, intangible assets and other long-lived assets. For these assets, measurement at fair value in periods subsequent to their initial recognition is applicable if any of these assets are determined to be impaired. If recognition of these assets at their fair value becomes necessary, such measurements will be determined utilizing Level 3 inputs. Refer to Note 4 for discussion of inputs used to develop fair value for those stream and royalty interests that were determined to be impaired during the twelve months ended June 30, 2016 and 2015.
90
ROYAL GOLD, INC.
NOTES TO CONSOLIDATED FINANCIAL STATEMENTS (Continued)
14. MAJOR SOURCES OF REVENUE
Operators that contributed greater than 10% of the Company's total revenue for any of fiscal years 2016, 2015 or 2014 were as follows (revenue amounts in thousands):
| |
Fiscal Year 2016 | Fiscal Year 2015 | Fiscal Year 2014 | ||||||||||||||||
|---|---|---|---|---|---|---|---|---|---|---|---|---|---|---|---|---|---|---|---|
Operator
|
Revenue | Percentage of total revenue |
Revenue | Percentage of total revenue |
Revenue | Percentage of total revenue |
|||||||||||||
Thompson Creek |
$ | 125,438 | 34.9 | % | $ | 94,104 | 33.8 | % | $ | 27,209 | 11.5 | % | |||||||
Barrick |
49,683 | 13.8 | % | 24,849 | 8.9 | % | 19,456 | 8.2 | % | ||||||||||
Teck |
49,243 | 13.7 | % | 38,033 | 13.7 | % | 48,777 | 20.6 | % | ||||||||||
15. COMMITMENTS AND CONTINGENCIES
Rainy River Gold and Silver Stream Acquisition
As of June 30, 2016, the Company has a remaining commitment, subject to certain conditions, of $75.0 million as part of its Rainy River gold and silver stream acquisition in August 2015 (Note 3).
Wassa and Prestea Gold Stream Acquisition and Amendment
As of June 30, 2016, the Company has a remaining commitment, subject to certain conditions, of $50.0 million as part of its Wassa and Prestea gold stream acquisition (July 2015) and amendment (December 2015) as discussed further in Note 3.
Ilovica Gold Stream Acquisition
As of June 30, 2016, the Company has a remaining commitment, subject to certain conditions, of $163.75 million as part of its Ilovica gold stream acquisition in October 2014.
Voisey's Bay
The Company indirectly owns a royalty on the Voisey's Bay mine in Newfoundland and Labrador owned by Vale Newfoundland & Labrador Limited ("VNL"). The royalty is directly owned by the Labrador Nickel Royalty Limited Partnership ("LNRLP"), in which the Company's wholly-owned indirect subsidiary, Voisey's Bay Holding Corporation, is the general partner and 90% owner. The remaining 10% interest in LNRLP is owned by Altius Investments Limited, a company unrelated to Royal Gold.
On December 5, 2014, LNRLP filed amendments to its October 16, 2009 Statement of Claim in the Supreme Court of Newfoundland and Labrador Trial Division against Vale Inco Limited, now known as Vale Canada Limited ("Vale Canada") and its wholly-owned subsidiaries, Vale Inco Atlantic Sales Limited and VNL, related to calculation of the NSR on the sale of concentrates, including nickel concentrates, from the Voisey's Bay mine. LNRLP asserts that the defendants have incorrectly calculated the NSR since production at Voisey's Bay began in late 2005, have indicated an intention to calculate the NSR in a manner LNRLP believes will violate the royalty agreement as Voisey's Bay concentrates are processed at Vale's new Long Harbour processing facility, and have breached their contractual duties of good faith and honest performance in several ways. LNRLP requests an order in respect of the correct calculation of future payments, and unspecified damages for non-payment and
91
ROYAL GOLD, INC.
NOTES TO CONSOLIDATED FINANCIAL STATEMENTS (Continued)
15. COMMITMENTS AND CONTINGENCIES (Continued)
underpayment of past royalties to the date of the claim, together with additional damages until the date of trial, interest, costs and other damages. The litigation is in the discovery phase.
16. QUARTERLY RESULTS OF OPERATIONS (UNAUDITED)
The following is a summary of selected quarterly financial information (unaudited). Some amounts in the below table may not sum-up in total as a result of rounding.
| |
Revenue | Operating income (loss) |
Net (loss) income attributable to Royal Gold stockholders |
Basic (loss) earnings per share |
Diluted (loss) earnings per share |
|||||||||||
|---|---|---|---|---|---|---|---|---|---|---|---|---|---|---|---|---|
| |
(Amounts in thousands except per share data) |
|||||||||||||||
Fiscal year 2016 quarter-ended: |
||||||||||||||||
September 30 |
$ | 74,056 | $ | 21,185 | $ | (45,046 | ) | $ | (0.69 | ) | $ | (0.69 | ) | |||
December 31 |
98,118 | 27,173 | 15,114 | 0.23 | 0.23 | |||||||||||
March 31 |
93,487 | (72,058 | ) | (67,656 | ) | (1.04 | ) | (1.04 | ) | |||||||
June 30 |
94,129 | 28,516 | 20,439 | 0.32 | 0.32 | |||||||||||
| | | | | | | | | | | | | | | | | |
|
$ | 359,790 | $ | 4,816 | $ | (77,149 | ) | $ | (1.18 | ) | $ | (1.18 | ) | |||
| | | | | | | | | | | | | | | | | |
| | | | | | | | | | | | | | | | | |
| | | | | | | | | | | | | | | | | |
(Amounts in thousands except per share data) |
||||||||||||||||
Fiscal year 2015 quarter-ended: |
||||||||||||||||
September 30 |
$ | 69,026 | $ | 29,539 | $ | 18,680 | $ | 0.29 | $ | 0.29 | ||||||
December 31 |
61,304 | (2,022 | ) | (6,548 | ) | (0.10 | ) | (0.10 | ) | |||||||
March 31 |
74,110 | 32,150 | 25,014 | 0.38 | 0.38 | |||||||||||
June 30 |
73,579 | 27,568 | 14,819 | 0.23 | 0.23 | |||||||||||
| | | | | | | | | | | | | | | | | |
|
$ | 278,019 | $ | 87,235 | $ | 51,965 | $ | 0.80 | $ | 0.80 | ||||||
| | | | | | | | | | | | | | | | | |
| | | | | | | | | | | | | | | | | |
| | | | | | | | | | | | | | | | | |
17. SUBSEQUENT EVENTS
Mount Milligan Commitment Letter
On July 5, 2016, we entered into a binding commitment letter with Centerra Gold Inc. ("Centerra") setting forth the key terms and conditions of a future amendment to our Mount Milligan streaming agreement in connection with the proposed acquisition by Centerra of Thompson Creek Metals Company Inc. ("Thompson Creek") by Plan of Arrangement under the Arrangement Agreement executed between Centerra and Thompson Creek, as announced on July 5, 2016 (the "Centerra Acquisition"). Thompson Creek is the parent company of Terrane Metals Corp. ("Terrane"), which owns and operates the Mount Milligan copper-gold mine. Our obligation to amend the Mount Milligan streaming agreement is subject to the consummation of the Centerra Acquisition and other customary conditions set forth in the commitment letter.
Pursuant to the terms of the commitment letter, we and Centerra have agreed to amend the existing streaming agreement, whereby, among other things, the existing 52.25% gold streaming interest will be amended to 35.00% and we will obtain an 18.75% copper streaming interest at Mount Milligan at a price equal to 15% of the spot price for each metric tonne of copper delivered. The Centerra Acquisition is expected to close in our first or second quarter of fiscal 2017.
92
ITEM 9. CHANGES IN AND DISAGREEMENTS WITH ACCOUNTANTS ON ACCOUNTING AND FINANCIAL DISCLOSURE
None.
ITEM 9A. CONTROLS AND PROCEDURES
(a) Evaluation of Disclosure Controls and Procedures
As of June 30, 2016, the Company's management, with the participation of the President and Chief Executive Officer (the principal executive officer) and Chief Financial Officer and Treasurer (the principal financial and accounting officer) of the Company, carried out an evaluation of the effectiveness of the design and operation of the Company's disclosure controls and procedures (as defined in Rules 13a-15(e) and 15d-15(e) of the Securities Exchange Act of 1934, as amended (the "Exchange Act")). Based on such evaluation, the Company's President and Chief Executive Officer and its Chief Financial Officer and Treasurer have concluded that, as of June 30, 2016, the Company's disclosure controls and procedures were effective to provide reasonable assurance that information required to be disclosed by the Company in reports that it files or submits under the Exchange Act is recorded, processed, summarized and reported within the required time periods and that such information is accumulated and communicated to the Company's management, including the President and Chief Executive Officer and its Chief Financial Officer and Treasurer, as appropriate to allow timely decisions regarding required disclosure.
Disclosure controls and procedures involve human diligence and compliance and are subject to lapses in judgment and breakdowns resulting from human failures. As a result, a control system, no matter how well conceived and operated, can provide only reasonable, not absolute, assurance that the objectives of the control system are met. Further, the design of a control system must reflect the fact that there are resource constraints and the benefits of controls must be considered relative to their costs. Because of the inherent limitations in all control systems, no evaluation of controls can provide absolute assurance that all control issues and instances of fraud, if any, within the Company have been detected.
(b) Management's Report on Internal Control over Financial Reporting
Our management is responsible for establishing and maintaining adequate internal control over financial reporting as defined in Rules 13a-15(f) and 15d-15(f) under the Exchange Act. Our internal control over financial reporting is designed to provide reasonable assurance regarding the reliability of financial reporting and the preparation of financial statements for external purposes in accordance with generally accepted accounting principles.
Management assessed the effectiveness of our internal control over financial reporting as of June 30, 2016. In making this assessment, management used the criteria set forth by the Committee of Sponsoring Organizations of the Treadway Commission (COSO) in Internal Control—Integrated Framework (2013 Framework). Based on management's assessment and those criteria, management concluded that, as of June 30, 2016, our internal control over financial reporting is effective.
Our management, including our President and Chief Executive Office (the principal executive officer) and Chief Financial Officer and Treasurer (the principal financial and accounting officer), does not expect that our disclosure controls and procedures or our internal controls will prevent all error and all fraud. A control system, no matter how well conceived and operated, can provide only reasonable, not absolute, assurance that the objectives of the control system are met. Further, the design of a control system must reflect the fact that there are resource constraints and the benefits of controls must be considered relative to their costs. Because of the inherent limitations in all control
93
systems, no evaluation of controls can provide absolute assurance that all control issues and instances of fraud, if any, within the Company have been detected.
Our independent registered public accounting firm, Ernst & Young LLP, has issued an attestation report on our internal control over financial reporting as of June 30, 2016.
(c) Changes in Internal Control over Financial Reporting
There was no change in the Company's internal control over financial reporting (as defined in Rule 13a-15(f) under the Exchange Act during our fourth fiscal quarter ended June 30, 2016, that has materially affected, or is reasonably likely to materially affect, our internal control over financial reporting.
(d) Report of Independent Registered Public Accounting Firm
The Board of Directors and Shareholders of Royal Gold, Inc.
We have audited Royal Gold Inc.'s internal control over financial reporting as of June 30, 2016, based on criteria established in Internal Control—Integrated Framework issued by the Committee of Sponsoring Organizations of the Treadway Commission (2013 framework) (the COSO criteria). Royal Gold, Inc.'s management is responsible for maintaining effective internal control over financial reporting, and for its assessment of the effectiveness of internal control over financial reporting included in the accompanying Management's Report on Internal Control over Financial Reporting. Our responsibility is to express an opinion on the company's internal control over financial reporting based on our audit.
We conducted our audit in accordance with the standards of the Public Company Accounting Oversight Board (United States). Those standards require that we plan and perform the audit to obtain reasonable assurance about whether effective internal control over financial reporting was maintained in all material respects. Our audit included obtaining an understanding of internal control over financial reporting, assessing the risk that a material weakness exists, testing and evaluating the design and operating effectiveness of internal control based on the assessed risk, and performing such other procedures as we considered necessary in the circumstances. We believe that our audit provides a reasonable basis for our opinion.
A company's internal control over financial reporting is a process designed to provide reasonable assurance regarding the reliability of financial reporting and the preparation of financial statements for external purposes in accordance with generally accepted accounting principles. A company's internal control over financial reporting includes those policies and procedures that (1) pertain to the maintenance of records that, in reasonable detail, accurately and fairly reflect the transactions and dispositions of the assets of the company; (2) provide reasonable assurance that transactions are recorded as necessary to permit preparation of financial statements in accordance with generally accepted accounting principles, and that receipts and expenditures of the company are being made only in accordance with authorizations of management and directors of the company; and (3) provide reasonable assurance regarding prevention or timely detection of unauthorized acquisition, use, or disposition of the company's assets that could have a material effect on the financial statements.
Because of its inherent limitations, internal control over financial reporting may not prevent or detect misstatements. Also, projections of any evaluation of effectiveness to future periods are subject to the risk that controls may become inadequate because of changes in conditions, or that the degree of compliance with the policies or procedures may deteriorate.
In our opinion, Royal Gold, Inc. maintained, in all material respects, effective internal control over financial reporting as of June 30, 2016, based on the COSO criteria.
94
We also have audited, in accordance with the standards of the Public Company Accounting Oversight Board (United States), the consolidated balance sheets of Royal Gold, Inc. as of June 30, 2016 and 2015, and the related consolidated statements of operations and comprehensive (loss) income, changes in equity and cash flows for each of the three years in the period ended June 30, 2016 of Royal Gold, Inc. and our report dated August 11, 2016 expressed an unqualified opinion thereon.
/s/
Ernst & Young LLP
Denver, Colorado
August 11, 2016
None.
ITEM 10. DIRECTORS, EXECUTIVE OFFICERS AND CORPORATE GOVERNANCE
The information required by this item is included in the Company's Proxy Statement for its 2016 Annual Stockholders Meeting to be filed with the SEC within 120 days after June 30, 2016, and is incorporated by reference in this Annual Report on Form 10-K.
The Company's Code of Business Conduct and Ethics within the meaning of Item 406 of Regulation S-K adopted by the SEC under the Exchange Act that applies to our principal executive officer and principal financial and accounting officer is available on the Company's website at www.royalgold.com and in print without charge to any stockholder who requests a copy. Requests for copies should be directed to Royal Gold, Inc., Attention: General Counsel and Secretary, 1660 Wynkoop Street, Suite 1000, Denver, Colorado, 80202. The Company intends to satisfy the disclosure requirements of Item 5.05 of Form 8-K regarding any amendment to, or a waiver from, a provision of the Company's Code of Business Conduct and Ethics by posting such information on the Company's website.
ITEM 11. EXECUTIVE COMPENSATION
The information required by this item is included in the Company's Proxy Statement for its 2016 Annual Stockholders Meeting to be filed with the SEC within 120 days after June 30, 2016, and is incorporated by reference in this Annual Report on Form 10-K.
ITEM 12. SECURITY OWNERSHIP OF CERTAIN BENEFICIAL OWNERS AND MANAGEMENT AND RELATED STOCKHOLDER MATTERS
The information required by this item is included in the Company's Proxy Statement for its 2016 Annual Stockholders Meeting to be filed with the SEC within 120 days after June 30, 2016, and is incorporated by reference in this Annual Report on Form 10-K.
ITEM 13. CERTAIN RELATIONSHIPS AND RELATED TRANSACTIONS AND DIRECTOR INDEPENDENCE
The information required by this item is included in the Company's Proxy Statement for its 2016 Annual Stockholders Meeting to be filed with the SEC within 120 days after June 30, 2016, and is incorporated by reference in this Annual Report on Form 10-K.
ITEM 14. PRINCIPAL ACCOUNTANT FEES AND SERVICES
The information required by this item is included in the Company's Proxy Statement for its 2016 Annual Stockholders Meeting to be filed with the SEC within 120 days after June 30, 2016, and is incorporated by reference in this Annual Report on Form 10-K.
95
ITEM 15. EXHIBITS AND FINANCIAL STATEMENT SCHEDULES
(a) Financial Statements
(b) Exhibits
Reference is made to the Exhibit Index beginning on page 99 hereof.
96
Pursuant to the requirements of Section 13 or 15 (d) of the Securities Exchange Act of 1934, the registrant has duly caused this report to be signed on its behalf by the undersigned, thereunto duly authorized.
| ROYAL GOLD, INC. | ||||
Date: August 11, 2016 |
By: |
/s/ TONY JENSEN Tony Jensen President, Chief Executive Officer and Director (Principal Executive Officer) |
||
Pursuant to the requirements of the Securities Exchange Act of 1934, this report has been signed below by the following persons on behalf of the registrant and in the capacities and on the dates indicated.
| Date: August 11, 2016 | By: | /s/ TONY JENSEN Tony Jensen President, Chief Executive Officer and Director (Principal Executive Officer) |
||
Date: August 11, 2016 |
By: |
/s/ STEFAN L. WENGER Stefan Wenger Chief Financial Officer and Treasurer (Principal Financial and Accounting Officer) |
||
Date: August 11, 2016 |
By: |
/s/ WILLIAM M. HAYES William M. Hayes Chairman |
||
Date: August 11, 2016 |
By: |
/s/ GORDON J. BOGDEN Gordon J. Bogden Director |
||
Date: August 11, 2016 |
By: |
/s/ M. CRAIG HAASE M. Craig Haase Director |
||
Date: August 11, 2016 |
By: |
/s/ KEVIN MCARTHUR Kevin McArthur Director |
97
| Date: August 11, 2016 | By: | /s/ JAMIE SOKALSKY Jamie Sokalsky Director |
||
Date: August 11, 2016 |
By: |
/s/ CHRIS M.T. THOMPSON Chris M. T. Thompson Director |
||
Date: August 11, 2016 |
By: |
/s/ RONALD J. VANCE Ronald J. Vance Director |
98
| Exhibit Number |
Description | ||
|---|---|---|---|
| 2.1 | Amended and Restated Arrangement Agreement, dated January 15, 2010, among Royal Gold, Inc., RG Exchangeco Inc. (formerly, 7296355 Canada Ltd.) and International Royalty Corporation (filed as Exhibit 2.1 to the Company's Current Report on Form 8-K on January 22, 2010 and incorporated herein by reference) | ||
| 3.1 | Restated Certificate of Incorporation, as amended (filed as Exhibit 3.1 to the Company's Quarterly Report on February 8, 2008 and incorporated herein by reference) | ||
| 3.2 | Amended and Restated Bylaws, as amended on August 28, 2014 (filed as Exhibit 3.1 to the Company's Current Report on Form 8-K on September 4, 2014 and incorporated herein by reference) | ||
| 3.3 | Amended and Restated Certificate of Designations of Series A Junior Participating Preferred Stock of Royal Gold, Inc. (filed as Exhibit 3.1 to the Company's Current Report on Form 8-K on September 10, 2007 and incorporated herein by reference) | ||
| 3.4 | Certificate of Designations, Preferences and Rights of the Special Voting Preferred Stock of Royal Gold, Inc. (filed as Exhibit 4.1 to the Company's Current Report on Form 8-K on February 23, 2010 and incorporated herein by reference) | ||
| 4.1 | First Amended and Restated Rights Agreement dated September 10, 2007 between Royal Gold, Inc. and Computershare Trust Company, N.A. (filed as Exhibit 4.1 to the Company's Registration Statement on Form 8-A on September 10, 2007 and incorporated herein by reference) | ||
| 4.2 | Stockholder Agreement dated April 3, 2009 by and among Royal Gold, Inc., Compañía Minera Carmen de Andacollo and Teck Cominco Limited (filed as Exhibit 4.1 to the Company's Current Report on Form 8-K filed on April 6, 2009 and incorporated herein by reference) | ||
| 4.3 | Amendment No. 1 to the Stockholder Agreement, dated January 12, 2010 (filed as Exhibit 4.1 to the Company's Current Report on Form 8-K on January 15, 2010 and incorporated herein by reference) | ||
| 4.4 | Appendix I to Schedule B of the Amended and Restated Arrangement Agreement, dated January 15, 2010, among Royal Gold, Inc., RG Exchangeco Inc. (formerly, 7296355 Canada Ltd.) and International Royalty Corporation (filed as Exhibit 2.1 to the Company's Current Report on Form 8-K on January 22, 2010 and incorporated herein by reference) | ||
| 4.5 | Indenture among Royal Gold, Inc., Wells Fargo Bank, National Association and Computershare Trust Company of Canada, dated June 20, 2012 (filed as Exhibit 4.1 to the Company's Current Report on Form 8-K on June 20, 2012 and incorporated herein by reference) | ||
| 4.6 | Supplemental Indenture among Royal Gold, Inc., Wells Fargo Bank, National Association and Computershare Trust Company of Canada, dated June 20, 2012 (filed as Exhibit 4.2 to the Company's Current Report on Form 8-K on June 20, 2012 and incorporated herein by reference) | ||
| 10.1 | ▲ | 2004 Omnibus Long-Term Incentive Plan, as amended (filed as Exhibit 10.1 to Royal Gold's Current Report on Form 8-K filed on September 3, 2013 and incorporated herein by reference) | |
99
| Exhibit Number |
Description | ||
|---|---|---|---|
| 10.2 | ▲ | 2015 Omnibus Long-Term Incentive Plan (filed as Exhibit 10.1 to Royal Gold's Current Report on Form 8-K filed on November 16, 2015 and incorporated herein by reference) | |
| 10.3 | ▲ | Form of Incentive Stock Option Agreement under Royal Gold's 2004 Omnibus Long-Term Incentive Plan (filed as Exhibit 10.2 to Royal Gold's Current Report on Form 8-K filed on November 7, 2008 and incorporated herein by reference) | |
| 10.4 | ▲ | Form of Incentive Stock Option Agreement (Officer) under Royal Gold's 2004 Omnibus Long-Term Incentive Plan (filed as Exhibit 10.2 to Royal Gold's Current Report on Form 8-K filed on September 3, 2013 and incorporated herein by reference) | |
| 10.5 | ▲ | Form of Non-qualified Stock Option Agreement under Royal Gold's 2004 Omnibus Long-Term Incentive Plan (filed as Exhibit 10.3 to Royal Gold's Current Report on Form 8-K filed on November 7, 2008 and incorporated herein by reference) | |
| 10.6 | ▲ | Form of Restricted Stock Agreement under Royal Gold's 2004 Omnibus Long-Term Incentive Plan (filed as Exhibit 10.4 to Royal Gold's Current Report on Form 8-K filed on November 7, 2008 and incorporated herein by reference) | |
| 10.7 | ▲ | Form of Restricted Stock Agreement under Royal Gold's 2004 Omnibus Long-Term Incentive Plan (filed as Exhibit 10.1 to Royal Gold's Current Report on Form 8-K filed on August 17, 2012 and incorporated herein by reference) | |
| 10.8 | ▲ | Form of Director Restricted Stock Agreement under Royal Gold's 2004 Omnibus Long-Term Incentive Plan (filed as Exhibit 10.3 to Royal Gold's Current Report on Form 8-K filed on September 3, 2013 and incorporated herein by reference) | |
| 10.9 | ▲ | Form of Restricted Stock Agreement (Officer) under Royal Gold's 2004 Omnibus Long-Term Incentive Plan (filed as Exhibit 10.4 to Royal Gold's Current Report on Form 8-K filed on September 3, 2013 and incorporated herein by reference) | |
| 10.10 | ▲ | Form of Performance Share Agreement under Royal Gold's 2004 Omnibus Long-Term Incentive Plan (filed as Exhibit 10.5 to Royal Gold's Current Report on Form 8-K filed on November 7, 2008 and incorporated herein by reference) | |
| 10.11 | ▲ | Form of Performance Share Agreement under Royal Gold's 2004 Omnibus Long-Term Incentive Plan (1) (filed as Exhibit 10.1 to Royal Gold's Current Report on Form 8-K filed on August 24, 2011 and incorporated herein by reference) | |
| 10.12 | ▲ | Form of Performance Share Agreement under Royal Gold's 2004 Omnibus Long-Term Incentive Plan (2) (filed as Exhibit 10.2 to Royal Gold's Current Report on Form 8-K filed on August 24, 2011 and incorporated herein by reference) | |
| 10.13 | ▲ | Form of Performance Share Agreement (Officer) under Royal Gold's 2004 Omnibus Long-Term Incentive Plan (filed as Exhibit 10.5 to Royal Gold's Current Report on Form 8-K filed on September 3, 2013 and incorporated herein by reference) | |
| 10.14 | ▲ | Form of Stock Appreciation Rights Agreement under Royal Gold's 2004 Omnibus Long-Term Incentive Plan (filed as Exhibit 10.6 to Royal Gold's Current Report on Form 8-K filed on November 7, 2008 and incorporated herein by reference) | |
| 10.15 | ▲ | Form of Stock Appreciation Rights Agreement—Stock Settled (Officer) under Royal Gold's 2004 Omnibus Long-Term Incentive Plan (filed as Exhibit 10.6 to Royal Gold's Current Report on Form 8-K filed on September 3, 2013 and incorporated herein by reference) | |
100
| Exhibit Number |
Description | ||
|---|---|---|---|
| 10.16 | ▲ | Form of Amended and Restated Indemnification Agreement (filed as Exhibit 10.1 to the Company's Current Report on Form 8-K on September 4, 2014 and incorporated herein by reference) | |
| 10.17 | ▲ | Form of Employment Agreement by and between Royal Gold, Inc. and Tony Jensen (filed as Exhibit 10.1 to Royal Gold's Current Report on Form 8-K filed on July 8, 2016 and incorporated herein by reference) | |
| 10.18 | ▲ | Form of Employment Agreement by and between Royal Gold, Inc. and each of the following: Karli Anderson, William Heissenbuttel, Mark Isto, Bruce Kirchhoff and Stefan Wenger (filed as Exhibit 10.2 to Royal Gold's Current Report on Form 8-K filed on July 8, 2016 and incorporated herein by reference) | |
| 10.19 | ▲ | Form of Award Modification Agreement by and between Royal Gold, Inc. and each of the following: Stanley Dempsey, Tony Jensen, Karen Gross and Bruce Kirchhoff (filed as Exhibit 10.3 to Royal Gold's Current Report on Form 8-K filed on September 19, 2008 and incorporated herein by reference) | |
| 10.20 | Sixth Amended and Restated Revolving Credit Agreement among Royal Gold, Inc., High Desert Mineral Resources, Inc., RG Exchangeco Inc., RG Mexico, Inc., the additional guarantors from time to time party thereto, the lenders from time to time party thereto, and HSBC Bank USA, National Association, as administrative agent for the lenders, dated January 29, 2014 (filed as Exhibit 10.1 to the Company's Current Report on Form 8-K on January 30, 2014 and incorporated herein by reference) | ||
| 10.21 | Amendment No. 1 to Sixth Amended and Restated Revolving Credit Agreement, among Royal Gold, Inc., High Desert Mineral Resources, Inc., RG Exchangeco Inc., RG Mexico, Inc., the additional guarantors from time to time party thereto, the lenders from time to time party thereto, and HSBC Bank USA, National Association, as administrative agent for the lenders, dated April 29, 2015. (filed as Exhibit 10.1 to the Company's Current Report on Form 8-K on April 30, 2015 and incorporated herein by reference) | ||
| 10.22 | Amendment No. 2 to Sixth Amended and Restated Revolving Credit Agreement, among Royal Gold, Inc., High Desert Mineral Resources, Inc., RG Exchangeco Inc., RG Mexico, Inc., the additional guarantors from time to time party thereto, the lenders from time to time party thereto, and HSBC Bank USA, National Association, as administrative agent for the lenders, dated April 29, 2015. (filed as Exhibit 10.1 to the Company's Current Report on Form 8-K on March 21, 2016 and incorporated herein by reference) | ||
| 10.23 | Amended and Restated Security Agreement by and among Royal Gold, Inc., High Desert Mineral Resources, Inc., RG Mexico, Inc. and HSBC Bank USA, National Association dated February 1, 2011 (filed as Exhibit 10.8 to the Company's Quarterly Report on Form 10-Q on February 4, 2011 and incorporated herein by reference) | ||
| 10.24 | Amended and Restated Pledge Agreement by Royal Gold, Inc. in favor of HSBC Bank USA, National Association dated February 1, 2011 (filed as Exhibit 10.9 to the Company's Quarterly Report on Form 10-Q on February 4, 2011 and incorporated herein by reference) | ||
| 10.25 | Royalty Agreement between Royal Gold, Inc. and the Cortez Joint Venture dated April 1, 1999 (filed as part of Item 5 of the Company's Current Report on Form 8-K on April 12, 1999 and incorporated herein by reference) | ||
101
| Exhibit Number |
Description | ||
|---|---|---|---|
| 10.26 | Firm offer to purchase royalty interest of "Idaho Group" between Royal Gold, Inc. and Idaho Group dated July 22, 1999 (filed as Attachment A to the Company's Current Report on Form 8-K on September 2, 1999 and incorporated herein by reference) | ||
| 10.27 | Royalty Deed and Agreement, dated effective as of April 15, 1991, between ECM, Inc. and Royal Crescent Valley, Inc. (filed as Exhibit 10(1) to the Company's Annual Report on Form 10-K for the year ended June 30, 1991 and incorporated herein by reference) | ||
| 10.28 | Assignment and Assumption Agreement, dated December 6, 2002 (filed as Exhibit 10.2 to the Company's Current Report on Form 8-K on December 23, 2002 and incorporated herein by reference) | ||
| 10.29 | Royalty Assignment and Agreement, effective as of December 26, 2002, between High Desert Mineral Resources, Inc. and High Desert Gold Corporation (filed as Exhibit 99.4 to the Company's Current Report on Form 8-K on September 22, 2005 and incorporated herein by reference) | ||
| 10.30 | Royalty Assignment, Confirmation, Amendment, and Restatement of Royalty, and Agreement, dated as of November 30, 1995, among Barrick Bullfrog Inc., Barrick Goldstrike Mines Inc. and Royal Hal Co. (filed as Exhibit 99.5 to the Company's Current Report on Form 8-K on September 22, 2005 and incorporated herein by reference) | ||
| 10.31 | Amendment to Royalty Assignment, Confirmation, Amendment, and Restatement of Royalty, and Agreement, effective as of October 1, 2004, among Barrick Bullfrog Inc., Barrick Goldstrike Mines Inc. and Royal Hal Co. (filed as Exhibit 99.6 to the Company's Current Report on Form 8-K on September 22, 2005 and incorporated herein by reference) | ||
| 10.32 | Purchase and Sale Agreement for Peñasquito and Other Royalties among Minera Kennecott S.A. DE C.V., Kennecott Exploration Company and Royal Gold, Inc., dated December 28, 2006 (filed as Exhibit 10.2 to the Company's Quarterly Report on Form 10-Q on February 9, 2007 and incorporated herein by reference) | ||
| 10.33 | Contract for Assignment of Rights Granted, by Minera Kennecott, S.A. de C.V. Represented in this Agreement by Mr. Dave F. Simpson, and Minera Peñasquito, S.A. de C.V., Represented in this Agreement by Attorney, Jose Maria Gallardo Tamayo (filed as Exhibit 10.4 to the Company's Quarterly Report on Form 10-Q on February 9, 2007 and incorporated herein by reference) | ||
| 10.34 | Amended and Restated Master Agreement by and between Royal Gold, Inc. and Compañía Minera Teck Carmen de Andacollo, dated as of January 12, 2010, along with the related Form of Royalty Agreement attached thereto as Exhibit C (filed as Exhibit 10.1 to the Company's Current Report on Form 8-K on January 15, 2010 and incorporated herein by reference) | ||
| 10.35 | Support Agreement, dated as of February 22, 2010, among Royal Gold, Inc., RG Callco Inc., and RG Exchangeco Inc. (filed as Exhibit 10.1 to the Company's Current Report on Form 8-K/A on February 23, 2010 and incorporated herein by reference) | ||
102
| Exhibit Number |
Description | ||
|---|---|---|---|
| 10.36 | Voting and Exchange Trust Agreement, dated as of February 22, 2010, among Royal Gold, Inc., RG Exchangeco Inc. and Computershare Trust Company of Canada (filed as Exhibit 10.2 to the Company's Current Report on Form 8-K/A on February 23, 2010 and incorporated herein by reference) | ||
| 10.37 | Labrador Option Agreement, dated May 18, 1993, between Diamond Fields Resources Inc. and Archean Resources Ltd., as amended (filed as Exhibit 10.13 to the Company's Quarterly Report on Form 10-Q on May 7, 2010 and incorporated herein by reference) | ||
| 10.38 | Robinson Property Trust Ancillary Agreement by and between Kennecott Holdings Corporation, Kennecott Rawhide Mining Company and Kennecott Nevada Copper Company and BHP Nevada Mining Company, dated September 12, 2003 (filed as Exhibit 10.60 to the Company's Annual Report on Form 10-K on August 26, 2010 and incorporated herein by reference) | ||
| 10.39 | Shares Purchase and Sale Agreement by Jaime Ugarte Lee and others to Compañia Minera Barrick Chile Limitada, dated as of March 23, 2001 (English Translation) (filed as Exhibit 10.61 to the Company's Annual Report on Form 10-K on August 26, 2010 and incorporated herein by reference) | ||
| 10.40 | Royalty Deed between St Barbara Mines Limited and Resource Capital Funds III L.P., dated March 29, 2005, as supplemented and amended by the Supplemental Deed between St Barbara Mines Limited and Resource Capital Funds III L.P., dated May 20, 2005 (filed as Exhibit 10.64 to the Company's Annual Report on Form 10-K on August 26, 2010 and incorporated herein by reference) | ||
| 10.41 | Net Smelter Return Royalty Agreement by and between Newmont Canada Limited and Barrick Gold Corporation, dated October 8, 2004 (filed as Exhibit 10.65 to the Company's Annual Report on Form 10-K on August 26, 2010 and incorporated herein by reference) | ||
| 10.42 | Royalty for Technical Expertise Agreement by and between Tenedoramex S. A. de C. V. and Kennecott Minerals Company, dated as of March 23, 2001 (filed as Exhibit 10.2 to the Company's Current Report on Form 8-K on January 6, 2006 and incorporated herein by reference) | ||
| 10.43 | Agreement for Amendment and Restatement of Royalty for Technical Expertise between Minas de Oro Nacional S.A. de C.V. and RG Mexico, Inc. dated May 27, 2011 (filed as Exhibit 10.51 to the Company's Annual Report on Form 10-K on August 18, 2011 and incorporated herein by reference) | ||
| 10.44 | † | Amended and Restated Purchase and Sale Agreement by and among Royal Gold, Inc., RGL Gold AG, Thompson Creek Metals Company Inc. and Terrane Metals Corp. dated as of December 14, 2011 (filed as Exhibit 10.1 to the Company's Current Report on Form 8-K on December 15, 2011 and incorporated herein by reference) | |
| 10.45 | † | First Amendment to Amended and Restated Purchase and Sale Agreement by and among Royal Gold, Inc., RGLD Gold AG, Thompson Creek Metals Company Inc. and Terrane Metals Corp. dated as of August 8, 2012 (filed as Exhibit 10.1 to the Company's Current Report on Form 8-K on August 9, 2012 and incorporated herein by reference) | |
103
| Exhibit Number |
Description | ||
|---|---|---|---|
| 10.46 | Second Amendment to Amended and Restated Purchase and Sale Agreement by and among Royal Gold, Inc., RGLD Gold AG, Thompson Creek Metals Company Inc. and Terrane Metals Corp. dated as of December 11, 2014 (filed as Exhibit 10.1 to the Company's Quarterly Report on Form 10-Q on January 29, 2015 and incorporated herein by reference). | ||
| 10.47 | Intercreditor Agreement by and among RGLD Gold AG, Terrane Metals Corp. and Valiant Trust Company dated November 27, 2012 (filed as Exhibit 10.1 to the Company's Quarterly Report on Form 10-Q on January 31, 2013 and incorporated herein by reference) | ||
| 10.48 | Option Agreement between Seabridge Gold Inc. and RGLD Gold Canada, Inc. dated June 16, 2011 (filed as Exhibit 10.1 to the Company's Current Report on Form 8-K on June 22, 2011 and incorporated herein by reference) | ||
| 10.49 | Subscription Agreement between Seabridge Gold Inc. and RGLD Gold Canada, Inc. dated June 16, 2011 (filed as Exhibit 10.2 to the Company's Current Report on Form 8-K on June 22, 2011 and incorporated herein by reference) | ||
| 10.50 | Amending Agreement between Seabridge Gold Inc. and RG Exchangeco Inc., dated October 28, 2011 (filed as Exhibit 10.3 to the Company's Quarterly Report on Form 10-Q on November 3, 2011 and incorporated herein by reference) | ||
| 10.51 | Second Amending Agreement by and between RG Exchangeco Inc. and Seabridge Gold Inc. dated as of December 13, 2012 (filed as Exhibit 10.2 to the Company's Quarterly Report on Form 10-Q on January 31, 2013 and incorporated herein by reference) | ||
| 10.52 | Net Smelter Royalty Agreement between Barrick Gold Corporation and McWatters Mining Inc., dated April 3, 2003 (filed as Exhibit 10.50 to the Company's Annual Report on Form 10-K on August 18, 2011 and incorporated herein by reference) | ||
| 10.53 | Agreement between Rio Tinto Metals Limited and MK Gold Company, dated September 1, 1999 (filed as Exhibit 10.52 to the Company's Annual Report on Form 10-K on August 18, 2011 and incorporated herein by reference) | ||
| 10.54 | Net Smelter Return Royalty Agreement between Expatriate Resources Ltd. and Atna Resources Ltd., dated June 16, 2004, as modified by Partial Assignment of Royalty between Atna Resources Ltd, Equity Engineering Ltd. and Yukon Zinc Corporation, dated August 20, 2007 (filed as Exhibit 10.53 to the Company's Annual Report on Form 10-K on August 18, 2011 and incorporated herein by reference) | ||
| 10.55 | † | Purchase and Sale Agreement by and between RGLD Gold AG and Chieftain Metals Inc., dated as of December 22, 2011 (filed as Exhibit 10.1 to the Company's Current Report on Form 8-K on December 28, 2011 and incorporated herein by reference) | |
| 10.56 | Form of Agreement for Assignment of Partnership Interest in Crescent Valley Partners, L.P. (filed as Exhibit 10.1 to the Company's Current Report on Form 8-K on January 8, 2014 and incorporated herein by reference) | ||
| 10.57 | *▲ | Form of Incentive Stock Option Agreement under Royal Gold's 2015 Omnibus Long-Term Incentive Plan | |
104
| Exhibit Number |
Description | ||
|---|---|---|---|
| 10.58 | *▲ | Form of Restricted Stock Agreement under Royal Gold 2015 Omnibus Long-Term Incentive Plan | |
| 10.59 | *▲ | Form of Director Restricted Stock Agreement under Royal Gold's 2015 Omnibus Long-Term Incentive Plan | |
| 10.60 | *▲ | Form of Performance Share Agreement under Royal Gold's 2015 Omnibus Long-Term Incentive Plan | |
| 10.61 | *▲ | Form of Stock Appreciation Rights Agreement under Royal Gold's 2015 Omnibus Long-Term Incentive Plan | |
| 21.1 | * | Royal Gold and Its Subsidiaries | |
| 23.1 | * | Consent of Independent Registered Public Accounting Firm | |
| 31.1 | * | Certification of President and Chief Executive Officer required by Section 302 of the Sarbanes-Oxley Act of 2002 | |
| 31.2 | * | Certification of Chief Financial Officer required by Section 302 of the Sarbanes-Oxley Act of 2002 | |
| 32.1 | * | Written Statement of the President and Chief Executive Officer pursuant to Section 906 of the Sarbanes-Oxley Act of 2002 | |
| 32.2 | * | Written Statement of the Chief Financial Officer pursuant to Section 906 of the Sarbanes-Oxley Act of 2002 | |
| 101.INS | * | XBRL Instance Document | |
| 101.SCH | * | XBRL Taxonomy Extension Schema Document | |
| 101.CAL | * | XBRL Taxonomy Extension Calculation Linkbase Document | |
| 101.DEF | * | XBRL Taxonomy Extension Definition Linkbase Document | |
| 101.LAB | * | XBRL Taxonomy Extension Label Linkbase Document | |
| 101.PRE | * | XBRL Taxonomy Extension Presentation Linkbase Document | |
- *
- Filed
or furnished herewith.
- ▲
- Identifies
each management contract or compensation plan or arrangement.
- †
- Certain portions of this exhibit have been omitted by redacting a portion of the text (indicated by asterisks in the text). This exhibit has been filed separately with the U.S. Securities and Exchange Commission pursuant to a request for confidential treatment.
105