Attached files
| file | filename |
|---|---|
| 8-K - 8-K - RENASANT CORP | rnst-20200507.htm |

Q1 2020 Investor Presentation

Forward-Looking Statements This presentation may contain various statements about Renasant Corporation (“Renasant,” “we,” “our,” or “us”) that constitute “forward-looking statements” within the meaning of Section 27A of the Securities Act of 1933, as amended, and Section 21E of the Securities Exchange Act of 1934, as amended. Statements preceded by, followed by or that otherwise include the words “believes,” “expects,” “projects,” “anticipates,” “intends,” “estimates,” “plans,” “potential,” “possible,” “may increase,” “may fluctuate,” “will likely result,” and similar expressions, or future or conditional verbs such as “will,” “should,” “would” and “could,” are generally forward-looking in nature and not historical facts. Forward-looking statements include information about our future financial performance, business strategy, projected plans and objectives and are based on the current beliefs and expectations of management. We believe these forward-looking statements are reasonable, but they are all inherently subject to significant business, economic and competitive risks and uncertainties, many of which are beyond our control. In addition, these forward-looking statements are subject to assumptions about future business strategies and decisions that are subject to change. Actual results may differ from those indicated or implied in the forward-looking statements; such differences may be material. Prospective investors are cautioned that any forward-looking statements are not guarantees of future performance and involve risks and uncertainties. Investors should not place undue reliance on these forward-looking statements, which speak only as of the date they are made. Currently, the most important factor that could cause Renasant’s actual results to differ materially from those in forward-looking statements is the impact of the COVID-19 pandemic and related governmental measures to respond to the pandemic on the U.S. economy and the economies of the markets in which we operate. In this presentation, we have addressed the historical impact of the pandemic on certain aspects of our operations and set forth certain expectations regarding the COVID-19 pandemic’s future impact on our business, financial condition, results of operations, liquidity, asset quality, cash flows and prospects. We believe these statements about future events and conditions in light of the COVID-19 pandemic are reasonable, but these statements are based on assumptions regarding, among other things, how long the pandemic will continue, the duration and extent of the governmental measures implemented to contain the pandemic and ameliorate its impact on businesses and individuals throughout the United States, and the impact of the pandemic and the government’s virus containment measures on national and local economies, which are out of our control. If the assumptions underlying these statements about future events prove to be incorrect, Renasant’s business, financial condition, results of operations, liquidity, asset quality, cash flows and prospects may be materially and adversely affected. Important factors other than the COVID-19 pandemic currently known to us that could cause actual results to differ materially from those in forward-looking statements include the following: (i) our ability to efficiently integrate acquisitions into operations, retain the customers of these businesses, grow the acquired operations and realize the cost savings expected from an acquisition to the extent and in the timeframe management anticipated; (ii) the effect of economic conditions and interest rates on a national, regional or international basis; (iii) timing and success of the implementation of changes in operations to achieve enhanced earnings or effect cost savings; (iv) competitive pressures in the consumer finance, commercial finance, insurance, financial services, asset management, retail banking, mortgage lending and auto lending industries; (v) the financial resources of, and products available from, competitors; (vi) changes in laws and regulations as well as changes in accounting standards, such as the adoption of the Accounting Standards Codification Topic 326 (or CECL) on January 1, 2020; (vii) changes in policy by regulatory agencies; (viii) changes in the securities and foreign exchange markets; (ix) our potential growth, including our entrance or expansion into new markets, and the need for sufficient capital to support that growth; (x) changes in the quality or composition of our loan or investment portfolios, including adverse developments in borrower industries or in the repayment ability of individual borrowers; (xi) an insufficient allowance for credit losses as a result of inaccurate assumptions; (xii) general economic, market or business conditions, including the impact of inflation; (xiii) changes in demand for loan products and financial services; (xiv) concentration of credit exposure; (xv) changes or the lack of changes in interest rates, yield curves and interest rate spread relationships; (xvi) increased cybersecurity risk, including potential network breaches, business disruptions or financial losses; (xvii) natural disasters, epidemics and other catastrophic events in our geographic area; (xviii) the impact, extent and timing of technological changes; and (xix) other circumstances, many of which are beyond our control. The COVID-19 pandemic may exacerbate the impact of any of these factors on us. Management believes that the assumptions underlying our forward-looking statements are reasonable, but any of the assumptions could prove to be inaccurate. Investors are urged to carefully consider the risks described in Renasant’s filings with the Securities and Exchange Commission from time to time, which are available at www.renasant.com and the SEC’s website at www.sec.gov. We undertake no obligation, and specifically disclaim any obligation, to update or our revise forward-looking statements, whether as a result of new information or to reflect changed assumptions, the occurrence of unanticipated events or changes to future operating results over time, except as required by federal securities laws. 2

Current Footprint More than 200 banking, lending, wealth management and insurance offices 3
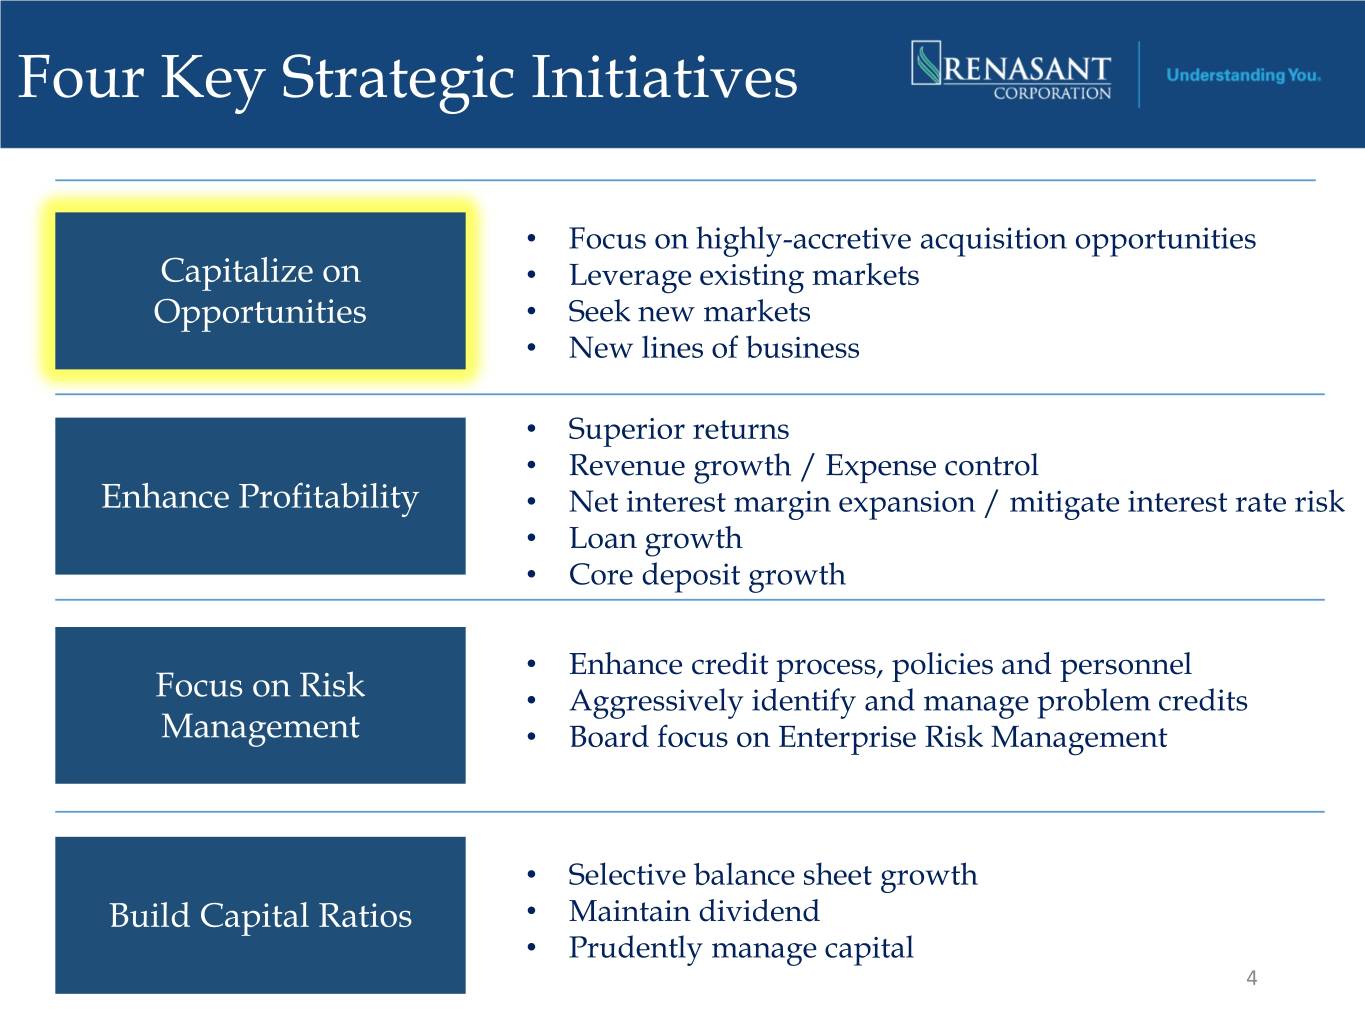
Four Key Strategic Initiatives • Focus on highly-accretive acquisition opportunities Capitalize on • Leverage existing markets Opportunities • Seek new markets • New lines of business • Superior returns • Revenue growth / Expense control Enhance Profitability • Net interest margin expansion / mitigate interest rate risk • Loan growth • Core deposit growth • Enhance credit process, policies and personnel Focus on Risk • Aggressively identify and manage problem credits Management • Board focus on Enterprise Risk Management • Selective balance sheet growth Build Capital Ratios • Maintain dividend • Prudently manage capital 4

Renasant Footprint – June 2010 Financial Highlights Nashville TENNESSEE Assets $3.59 Billion Memphis Gross Loans* $2.28 Billion Deposits $2.69 Billion Huntsville Tupelo Atlanta Birmingham GEORGIA ALABAMA Jackson Montgomery MISSISSIPPI Source: SNL Financial 5 * Excludes loans held for sale 5
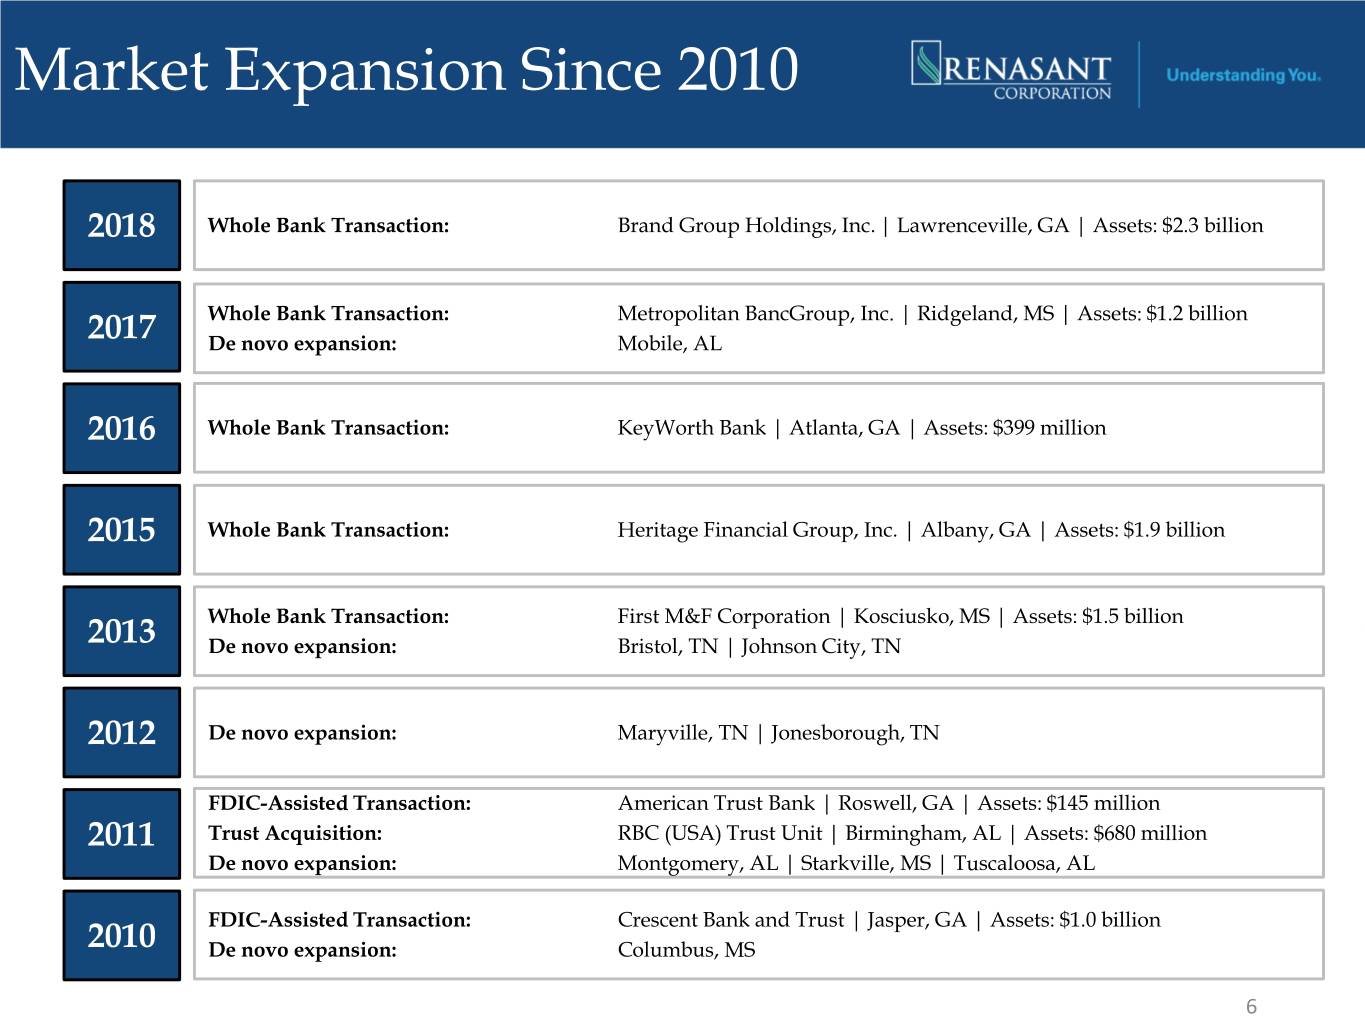
Market Expansion Since 2010 2018 Whole Bank Transaction: Brand Group Holdings, Inc. | Lawrenceville, GA | Assets: $2.3 billion Whole Bank Transaction: Metropolitan BancGroup, Inc. | Ridgeland, MS | Assets: $1.2 billion 2017 De novo expansion: Mobile, AL 2016 Whole Bank Transaction: KeyWorth Bank | Atlanta, GA | Assets: $399 million 2015 Whole Bank Transaction: Heritage Financial Group, Inc. | Albany, GA | Assets: $1.9 billion Whole Bank Transaction: First M&F Corporation | Kosciusko, MS | Assets: $1.5 billion 2013 De novo expansion: Bristol, TN | Johnson City, TN 2012 De novo expansion: Maryville, TN | Jonesborough, TN FDIC-Assisted Transaction: American Trust Bank | Roswell, GA | Assets: $145 million 2011 Trust Acquisition: RBC (USA) Trust Unit | Birmingham, AL | Assets: $680 million De novo expansion: Montgomery, AL | Starkville, MS | Tuscaloosa, AL FDIC-Assisted Transaction: Crescent Bank and Trust | Jasper, GA | Assets: $1.0 billion 2010 De novo expansion: Columbus, MS 6

Opportunities and Talent Acquisition Strategic Production and Support Hires - 2019 - HealthCare RM - CRE • Added just under 50 - Head of Retail Banking - Commercial RMs revenue producers - C&I Middle Market across our footprint, including corporate banking team led by - C&I Middle Market RM’s Curtis Perry - C&I Middle Market Teams • - Corporate CRE Team - ABL RMs Increased our credit - Equipment Leasing RM’s team to support - Head of Retail Banking - Commercial RMs expected loan growth and portfolio diversification - Curtis Perry, Chief • Added to our treasury Destin Corporate Banking Officer solutions team to enhance deposit − New Market Presidents − Commercial RMs product offerings and − Business Banking Officer drive additional revenue 7
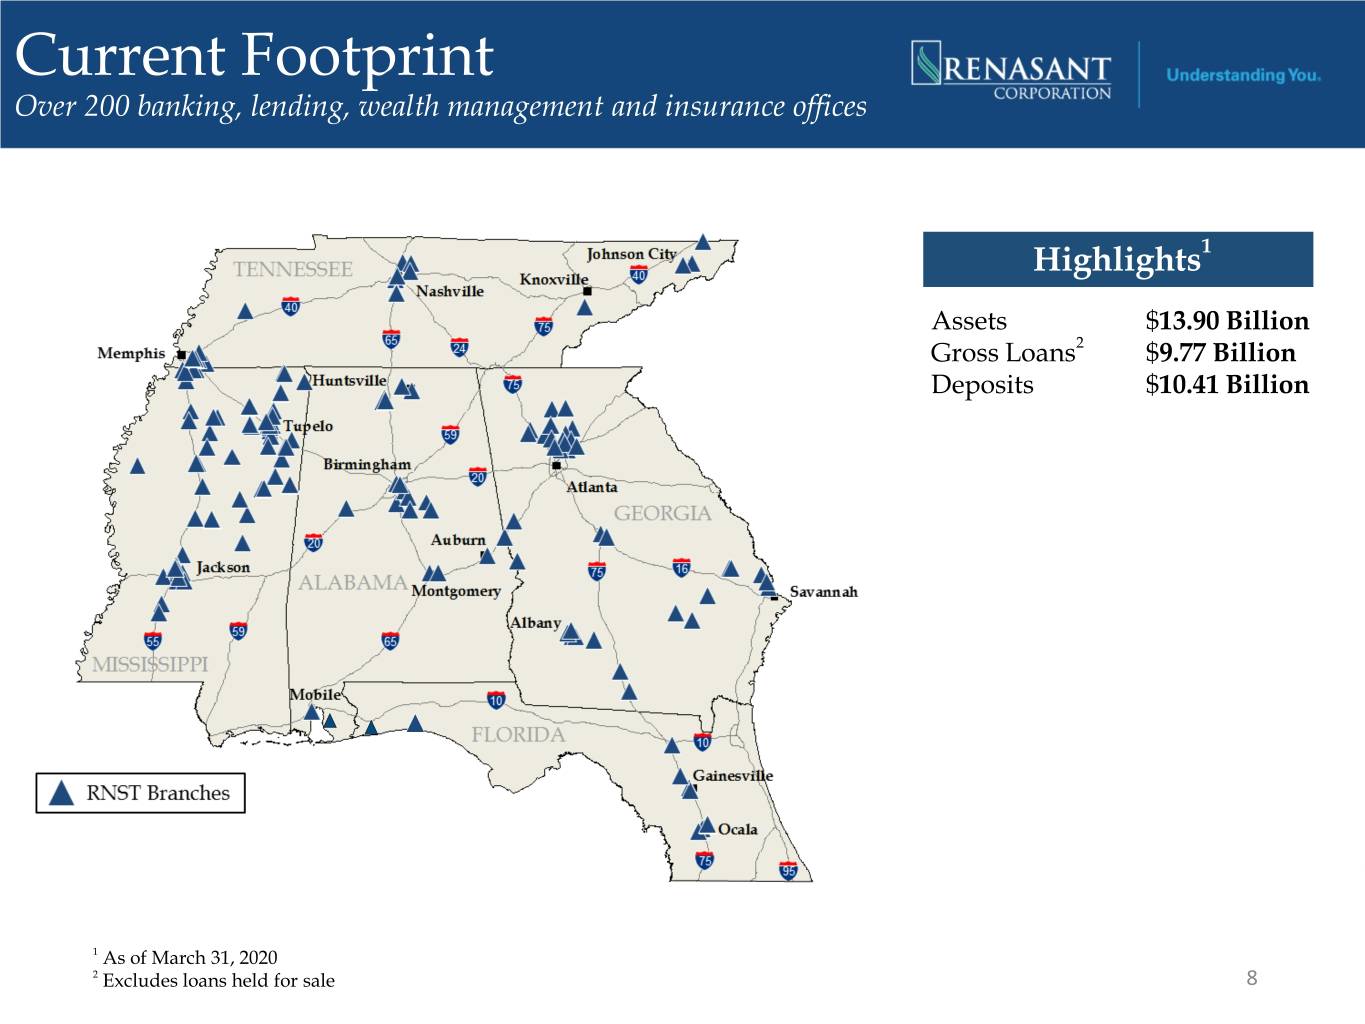
Current Footprint Over 200 banking, lending, wealth management and insurance offices Highlights1 Assets $13.90 Billion Gross Loans2 $9.77 Billion Deposits $10.41 Billion 1 As of March 31, 2020 2 Excludes loans held for sale 8

Four Key Strategic Initiatives • Focus on highly-accretive acquisition opportunities Capitalize on • Leverage existing markets Opportunities • Seek new markets • New lines of business • Superior returns • Revenue growth / Expense control Enhance Profitability • Net interest margin expansion / mitigate interest rate risk • Loan growth • Core deposit growth • Enhance credit process, policies and personnel Focus on Risk • Aggressively identify and manage problem credits Management • Board focus on Enterprise Risk Management • Selective balance sheet growth Build Capital Ratios • Maintain dividend • Prudently manage capital 9

Total Assets $14,000 $12,000 $10,000 $8,000 $6,000 $4,000 $2,000 $0 2014 2015 2016 2017 2018 2019 1Q20 (In millions) Total Assets Deposits 10

Diluted Earnings per Share (Adjusted)* $0.90 $.77 $0.80 Credit cost (thousands, except per share amounts) $0.70 $.65 impact to EPS 1Q19 4Q19 1Q20 $0.60 Provision for credit losses on loans $ 1,500 $ 2,950 $ 26,350 $0.50 Diluted EPS impact $ 0.02 $ 0.04 $ 0.33 $0.40 Provision for unfunded $0.30 commitments $ - $ - $ 3,400 $.20 $0.20 Diluted EPS impact $ 0.04 $0.10 Other Earnings Highlights: $- 1Q19 4Q19 1Q20 • Fees and commissions in 4Q19 and 1Q20 impacted by the Durbin Amendment, which became effective for RNST in 2Q19. EPS, with exclusions 1Q19 4Q19 1Q20 Diluted EPS, as reported $ 0.77 $ 0.67 $ 0.04 • Salaries and benefits in 4Q19 and 1Q20 impacted by MSR valuation adjustment - (0.02) 0.12 strategic production and supporting staff hires to support RNST’s growth strategy as well as increased COVID-19 related expenses - - 0.04 mortgage commissions and incentives in connection with Diluted EPS (adjusted) (Non-GAAP) $ 0.77 $ 0.65 $ 0.20 increased mortgage production. * Diluted earnings per share (adjusted) is a non-GAAP financial measure. It excludes mortgage servicing rights (“MSR”) valuation adjustments, merger and conversion related costs and COVID-19 related expenses. See slide 40 for reconciliation of this non-GAAP financial measure to GAAP. 11

Profitability Return on Assets (Adjusted)1 Efficiency Ratio (Adjusted)2 2.00% Efficiency Ratio 1.44% Efficiency Ratio ex. Mortgage & Credit Costs 1.50% 1.13% 80.00% 1.00% 70.00% 0.50% 0.33% 60.00% 0.00% 50.00% 1Q19 4Q19 1Q20 40.00% Return on Tangible Equity (Adjusted)1 2014 2015 2016 2017 2018 2019 1Q20 20.00% 18.00% 17.41% Credit cost impact 1Q19 4Q19 1Q20 16.00% 1 Return on Average Assets (adj.) 0.03% 0.07% 0.64% 14.00% 13.41% 1 12.00% Return on Tangible Equity (adj.) 0.43% 0.81% 7.65% 10.00% 1 Return on assets (adjusted) and return on tangible equity (adjusted) are non-GAAP 8.00% financial measures, and each excludes MSR valuation adjustments, merger and 6.00% conversion related expenses and COVID-19 related expenses. Return on tangible 4.41% equity (adjusted) also excludes amortization of intangibles. See slides 41 and 42 for 4.00% reconciliations of these non-GAAP financial measures to GAAP. 2.00% 2 Excludes profit (loss) on sales of securities and MSR valuation adjustments from 0.00% noninterest income and excludes amortization of intangibles, merger and conversion 1Q19 4Q19 1Q20 related expenses, debt extinguishment penalties, loss share termination and COVID-19 related expenses from noninterest expense. See slides 37 and 38 for reconciliation of this non-GAAP financial measure to GAAP. 12

Total Portfolio Loans* $10,000,000 At March 31, 2020, loans totaled $9.77 billion $9,000,000 80% Not Purchased $8,000,000 20% Purchased $7,000,000 Non Owner Land Dev Occupied 2% $6,000,000 21% $5,000,000 1-4 Family Multifamily 29% $4,000,000 4% $3,000,000 $2,000,000 Owner Occupied $1,000,000 17% $0 Const 8% ($ in thousands) 1Q19 4Q19 1Q20 Consumer 4% C&I 15% Not Purchased Loans Purchased Loans * Loan amounts on this page exclude loans held for sale. 13

Focus on Core Funding $3,000,000 Non Interest Bearing Demand Deposits 1Q20 Deposits $2,500,000 Noninterest- $2,000,000 bearing 20% $1,500,000 25% Other Interest- bearing $1,000,000 7% Savings $500,000 $- 48% Time ($ in thousands) Liquidity Cost of Funds 1Q19 4Q19 1Q20 • During 1Q19, increased on-balance sheet liquidity through short-term borrowings from FHLB; excess Noninterest-bearing demand - - - liquidity ~$400 million Interest-bearing demand 0.85% 0.81% 0.75% Savings 0.19% 0.17% 0.15% • Remaining availability: $2.8 billion at FHLB, $160 million of fed fund lines with other banks and $500 Time deposits 1.60% 1.76% 1.71% million in unpledged securities Borrowed funds 4.66% 3.02% 2.46% Total Cost of funds 0.92% 0.89% 0.85% • Expect to participate in the Paycheck Protection Program Liquidity Facility established by the Fed. Will receive favorable capital treatment and interest rate on the borrowings, which will offset impact to liquidity from PPP lending. 14

Net Interest Income and Net Interest Margin 6.00% 6.00% 5.00% 5.00% 4.00% 4.00% 3.00% 3.00% Margin Yield/Cost 2.00% 2.00% 1.00% 1.00% 0.00% 0.00% 2014 2015 2016 2017 2018 1Q19 2Q19 3Q19 4Q19 1Q20 Yield on Earning Assets Cost of Funds Margin ($ in thousands) 2014 2015 2016 2017 2018 1Q19 2Q19 3Q19 4Q19 1Q20 Net Interest 202,482 241,358 300,991 336,897 396,525 113,147 112,800 108,825 108,885 106,602 Income Net Interest 4.12% 4.16% 4.22% 4.16% 4.16% 4.27% 4.19% 3.98% 3.90% 3.75% Margin Yield on Earning 4.59% 4.52% 4.61% 4.62% 4.84% 5.16% 5.11% 4.91% 4.75% 4.57% Assets Cost of Funds 0.47% 0.37% 0.39% 0.47% 0.70% 0.92% 0.96% 0.97% 0.89% 0.85% 15

Deposit Repricing Opportunities Cost of Deposit Trends Actions Taken in March: 1.09% • Aggressively reduced stated rates on NOW, 1.10% MM and CDs 1.00% 0.92% • Reduced $1.8B in money market accounts by .38% (additional adjustments have been made 0.90% 0.84% since March 31, 2020) 0.80% 0.68% Repricing opportunities on accounts with 0.70% commitment terms: 0.60% Next 4 Quarters Next 8 Quarters 0.50% Type Balance Rate Balance Rate CDs $1.2B 1.55% $1.6B 1.66% 0.40% 0.31% Public Funds $313M 1.28% $445M 1.41% 0.30% Money Market $212M 1.02% $215M 1.02% Total $1.7B 1.44% $2.25B 1.55% 0.20% 0.25% Repricing opportunities in future quarters should provide substantial reductions in the cost of Cost of Total Deposits Cost of Int-Bearing Deposits deposits. 16
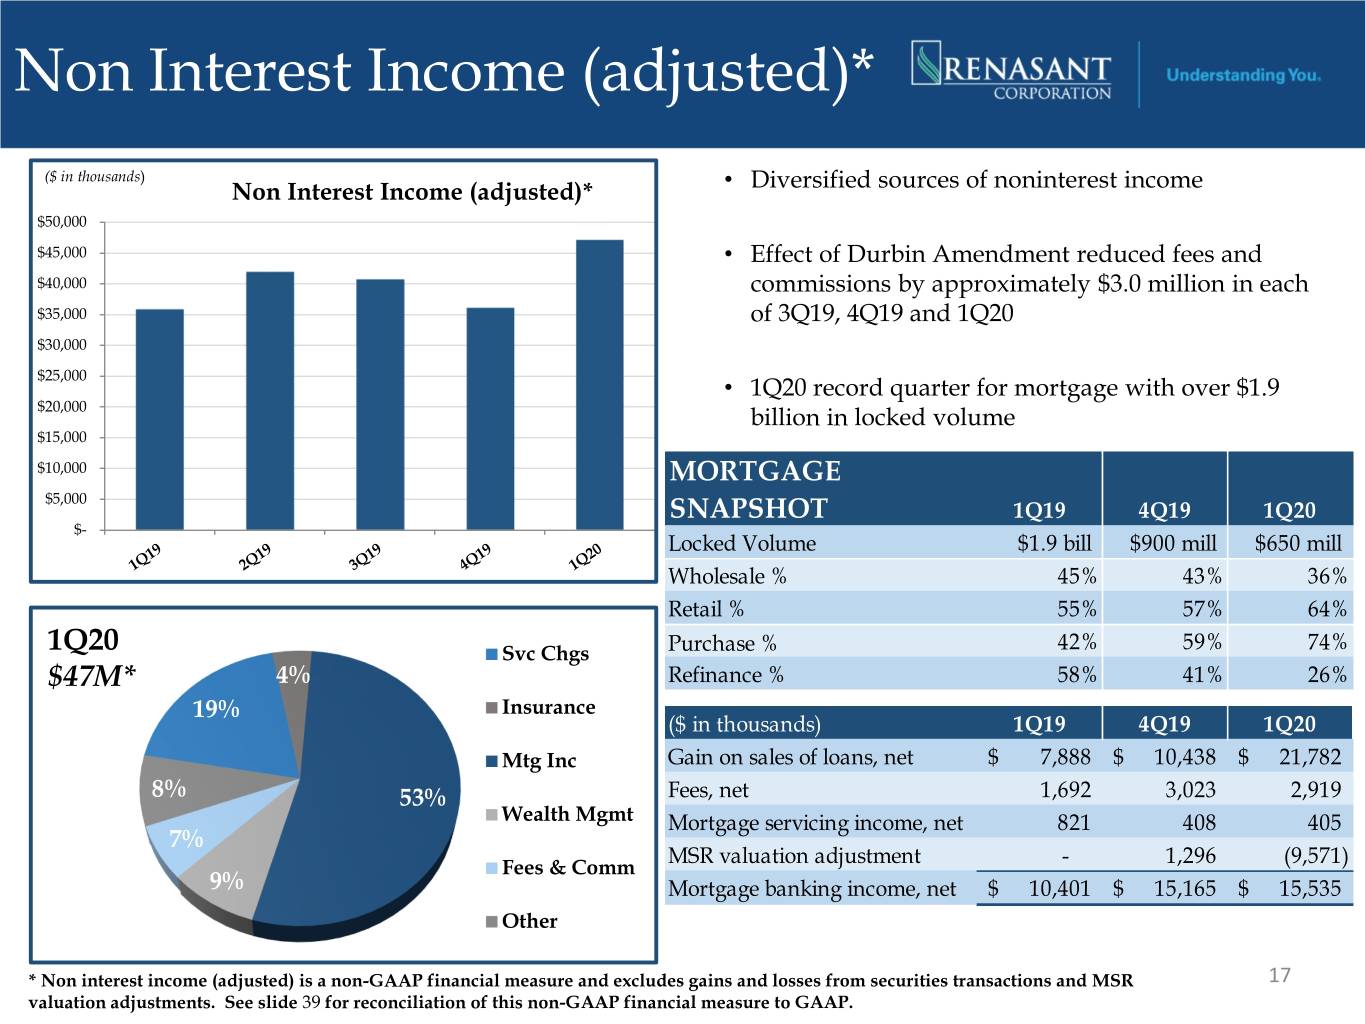
Non Interest Income (adjusted)* ($ in thousands) • Non Interest Income (adjusted)* Diversified sources of noninterest income $50,000 $45,000 • Effect of Durbin Amendment reduced fees and $40,000 commissions by approximately $3.0 million in each $35,000 of 3Q19, 4Q19 and 1Q20 $30,000 $25,000 • 1Q20 record quarter for mortgage with over $1.9 $20,000 billion in locked volume $15,000 $10,000 MORTGAGE $5,000 SNAPSHOT 1Q19 4Q19 1Q20 $- Locked Volume $1.9 bill $900 mill $650 mill Wholesale % 45% 43% 36% Retail % 55% 57% 64% 1Q20 Svc Chgs Purchase % 42% 59% 74% $47M* 4% Refinance % 58% 41% 26% 19% Insurance ($ in thousands) 1Q19 4Q19 1Q20 Mtg Inc Gain on sales of loans, net $ 7,888 $ 10,438 $ 21,782 8% 53% Fees, net 1,692 3,023 2,919 Wealth Mgmt Mortgage servicing income, net 821 408 405 7% MSR valuation adjustment - 1,296 (9,571) Fees & Comm 9% Mortgage banking income, net $ 10,401 $ 15,165 $ 15,535 Other * Non interest income (adjusted) is a non-GAAP financial measure and excludes gains and losses from securities transactions and MSR 17 valuation adjustments. See slide 39 for reconciliation of this non-GAAP financial measure to GAAP.
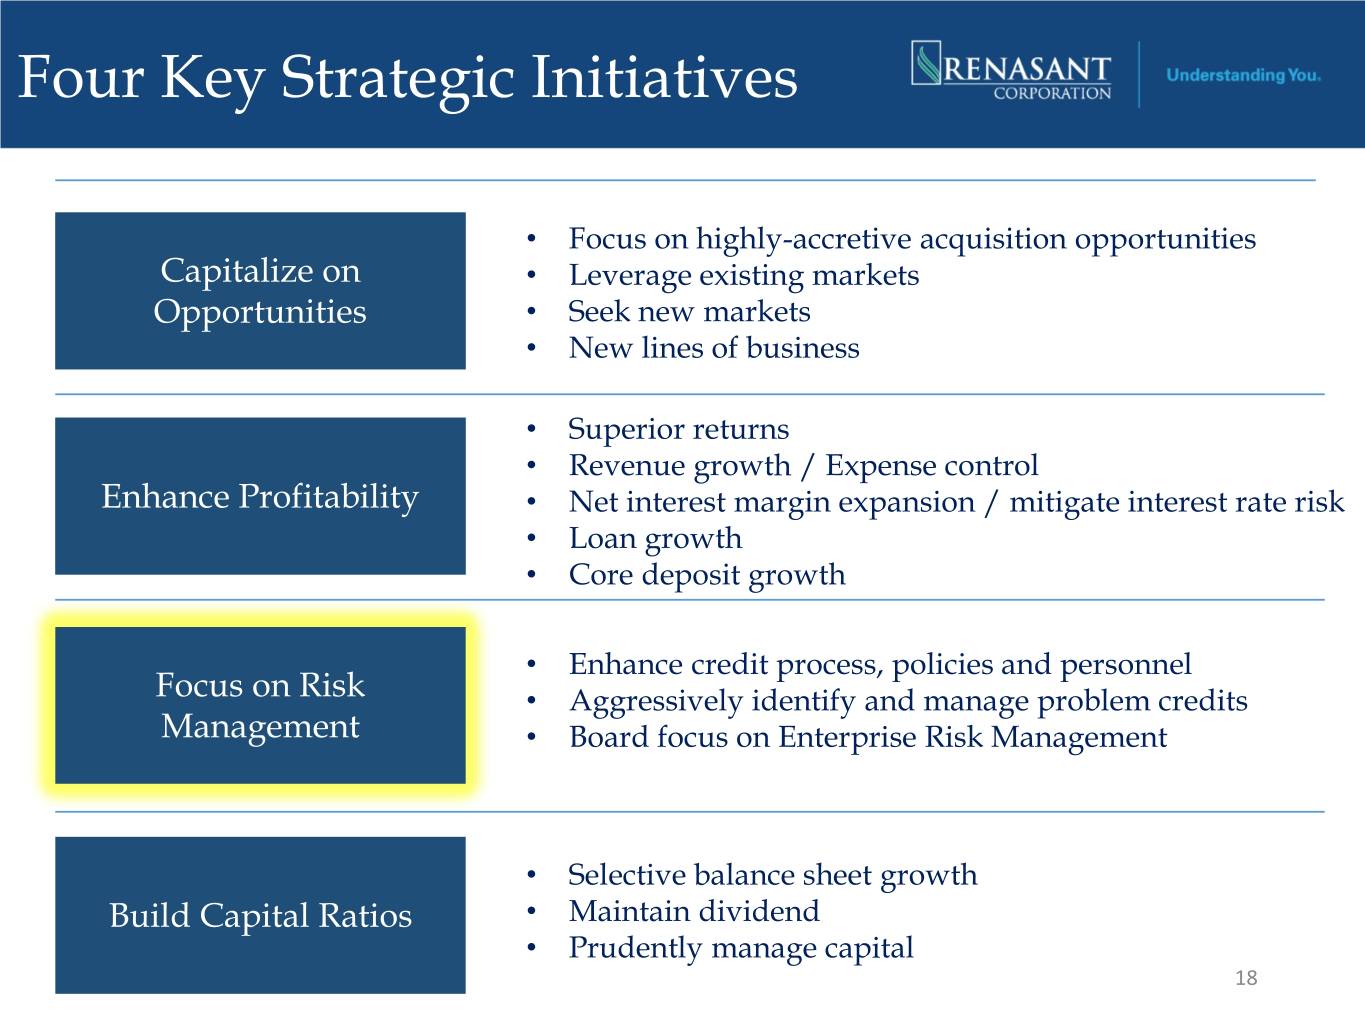
Four Key Strategic Initiatives • Focus on highly-accretive acquisition opportunities Capitalize on • Leverage existing markets Opportunities • Seek new markets • New lines of business • Superior returns • Revenue growth / Expense control Enhance Profitability • Net interest margin expansion / mitigate interest rate risk • Loan growth • Core deposit growth • Enhance credit process, policies and personnel Focus on Risk • Aggressively identify and manage problem credits Management • Board focus on Enterprise Risk Management • Selective balance sheet growth Build Capital Ratios • Maintain dividend • Prudently manage capital 18

Asset Quality Metrics NPAs/Total Assets Net Charge-offs/Average Loans $60,000 0.45% $3,000 $2,700 0.14% $50,000 0.40% $2,400 0.12% $40,000 $2,100 0.35% 0.10% $1,800 $30,000 0.08% 0.30% $1,500 $20,000 $1,200 0.06% $10,000 0.25% $900 0.04% $600 $- 0.20% $300 0.02% ($ in thousands) $- 0.00% ($ in thousands) Nonperforming loans CECL Impact* OREO % of Assets Net charge-offs % of Avg Loans • Net charge-offs as a percentage of average loans have * Implementation of CECL, which required purchased remained below 10 basis points credit deteriorated loans to be classified as nonaccrual based on performance, contributed $5.7 million to increase in nonaccrual loans in 1Q20 19

Asset Quality Metrics, cont. Allowance/Total Loans Allowance/Nonperforming Loans $120,000 2.00% $120,000 450.00% $100,000 $100,000 1.50% 350.00% $80,000 $80,000 250.00% $60,000 1.00% $60,000 150.00% $40,000 $40,000 0.50% $20,000 $20,000 50.00% $- 0.00% $- -50.00% ($ in thousands) ($ in thousands) Allowance Allowance % of Nonpurchased Loans % of Nonpurchased NPLs % of Total Loans % of Total NPLs • Adopted CECL effective January 1, 2020 20

Current Expected Credit Losses (CECL) 12/31/2019 Incurred Loss 1/1/2020 CECL Adoption 3/31/2020 CECL ALLL as a % of ACL as a % of ACL as a % of ($ in thousands) ALLL Loans ACL Loans ACL Loans Commercial, Financial, Agricultural 10,658 0.78% 22,010 1.61% 25,937 1.82% Lease Financing Receivables 910 1.11% 1,431 1.75% 1,588 1.88% Real Estate - 1-4 Family Mortgage 9,814 0.34% 24,128 0.84% 27,320 0.96% Real Estate - Commercial Mortgage 24,990 0.59% 29,283 0.69% 44,237 1.03% Real Estate - Construction 5,029 0.61% 8,534 1.03% 10,924 1.39% Installment loans to individuals 761 0.25% 9,261 3.06% 10,179 3.21% Allowance for Credit Losses on Loans 52,162 0.54% 94,646 0.98% 120,185 1.23% Reserve for Unfunded Commitments 946 11,335 14,735 Total Allowance for Credit Losses 53,108 105,981 134,920 Dec 31 2019 Day 1 CECL Jan 1 2020 1Q20 Highlights: ($ in thousands) (as reported) Impact (adjusted) Assets: • 1Q20 provision for credit losses on loans was Allowance for credit losses $ (52,162) $ (42,484) $ (94,646) $26.4 million and reserve for unfunded Deferred tax assets, net 27,282 12,305 39,587 commitments increased $3.4 million Remaining purchase discount on loans (50,958) 5,469 (45,489) Liabilities: • Elevated provision related to the COVID-19 pandemic with forecasted negative GDP Reserve for unfunded commitments $ 946 $ 10,389 $ 11,335 growth and high unemployment rates Shareholders' equity: Retained earnings $ 617,355 $ (35,099) $ 582,256 • The potential benefits of the stimulus package Shareholders' equity to assets 15.86% -0.23% 15.63% as well as internal programs implemented to Tangible capital ratio 9.25% -0.26% 8.99% assist customers were also considered when developing the estimate 21

Loan Portfolio* • Legacy of proactive portfolio management and Consumer Const 4% 8% Land Dev prudent credit underwriting C&I 2% 15% • Granular loan portfolio: o Average loan size is approximately $109,000 o No single commercial collateral type exceeds 1-4 Family 29% 7% of total portfolio o Remain below 100/300 CRE concentration limitations Owner Occupied • Line utilization percentage remained flat at 17% 3/31/20 as compared to 12/31/19 Multi-Family 4% Non Owner • Minimal exposure to Energy sector Occupied 21% • Approximately 95% of loans are in footprint Total Loan Portfolio1 * All references to loans in pages 22 through 30 exclude loans held for sale 1 As of March 31, 2020 22

Commercial Loan Portfolio As of March 31, 2020 Manufacturing Office 4% Health Care and Social 9% Assistance Finance and Insurance 9% 4% Real Estate and Rental Multi Family and Leasing 7% 11% Hospitality & Other Accommodations Restaurants & Other 5% Food Services 4% Retail Trade Industries < 3% of 12% Portfolio 19% C-Store 4% Construction 12% 23
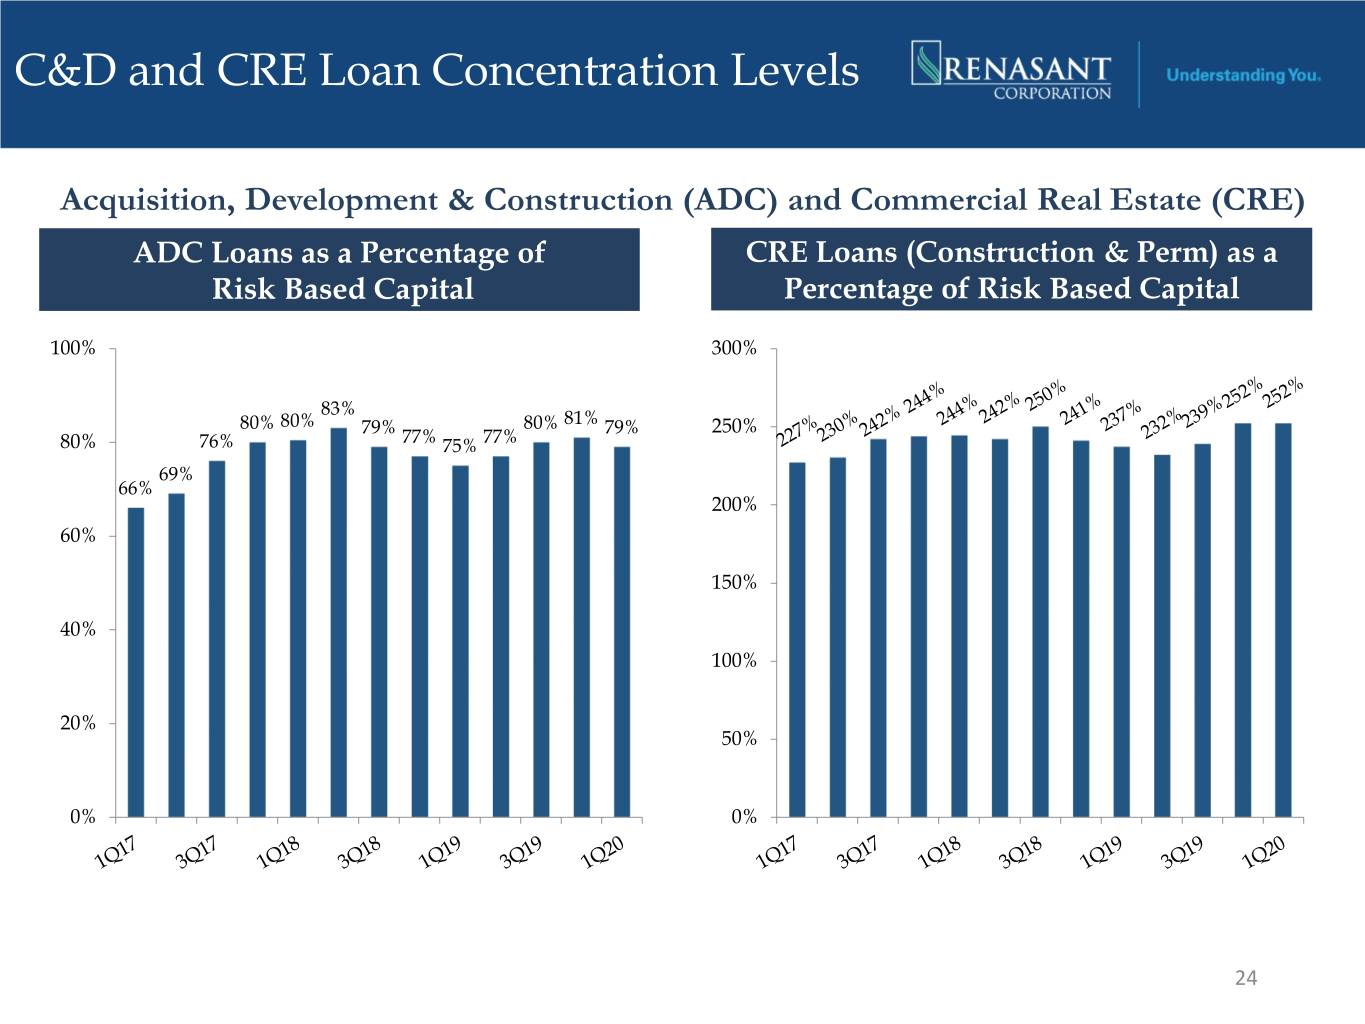
C&D and CRE Loan Concentration Levels Acquisition, Development & Construction (ADC) and Commercial Real Estate (CRE) ADC Loans as a Percentage of CRE Loans (Construction & Perm) as a Risk Based Capital Percentage of Risk Based Capital 100% 300% 83% 80% 80% 79% 80% 81% 79% 250% 80% 76% 77% 75% 77% 69% 66% 200% 60% 150% 40% 100% 20% 50% 0% 0% 24
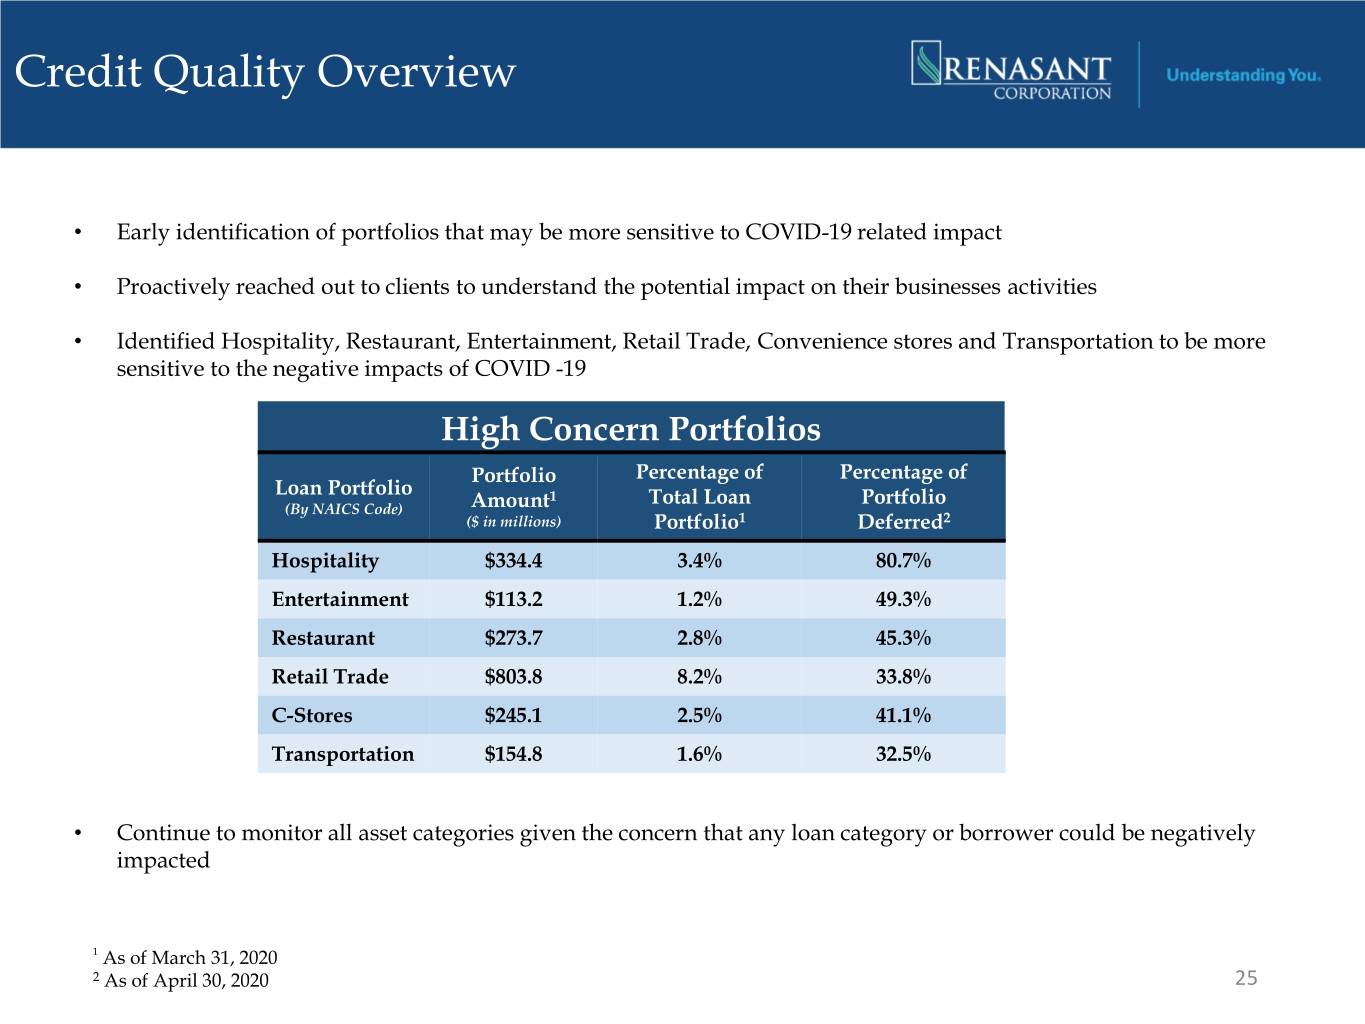
Credit Quality Overview • Early identification of portfolios that may be more sensitive to COVID-19 related impact • Proactively reached out to clients to understand the potential impact on their businesses activities • Identified Hospitality, Restaurant, Entertainment, Retail Trade, Convenience stores and Transportation to be more sensitive to the negative impacts of COVID -19 High Concern Portfolios Portfolio Percentage of Percentage of Loan Portfolio 1 Total Loan Portfolio (By NAICS Code) Amount ($ in millions) Portfolio1 Deferred2 Hospitality $334.4 3.4% 80.7% Entertainment $113.2 1.2% 49.3% Restaurant $273.7 2.8% 45.3% Retail Trade $803.8 8.2% 33.8% C-Stores $245.1 2.5% 41.1% Transportation $154.8 1.6% 32.5% • Continue to monitor all asset categories given the concern that any loan category or borrower could be negatively impacted 1 As of March 31, 2020 2 As of April 30, 2020 25

Loan Deferral Program • As of April 30, 2020, approximately 18% of total loan portfolio under the deferral program • In mid-March, Company offered a 90-day deferral of principal and interest to consumers and commercial customers who met the following criteria at the time of deferral: o Current on taxes and insurance o Current on loan payments • Requires relationship manager to perform enhanced due diligence of borrower’s operations, financial condition, liquidity and/or cash flow during deferral period • The following table presents the balance of loans as of March 31, 2020 that have been deferred through April 30, 2020: Deferral Average Balance # of Amount Deferred SEC Category Loans ($ in millions) Commercial, Financial, Agricultural 907 $164.1 $180,881 Real Estate - 1-4 Family Mortgage 1,047 $233.6 $223,121 Installment loans to individuals 297 $4.1 $13,925 Real Estate - Commercial Mortgage 1,165 $1,255.9 $1,078,000 Real Estate - Construction 34 $43.0 $1,265,184 Lease Financing Receivables - $0.0 $0 Total 3,450 $1,700.7 $492,953 26
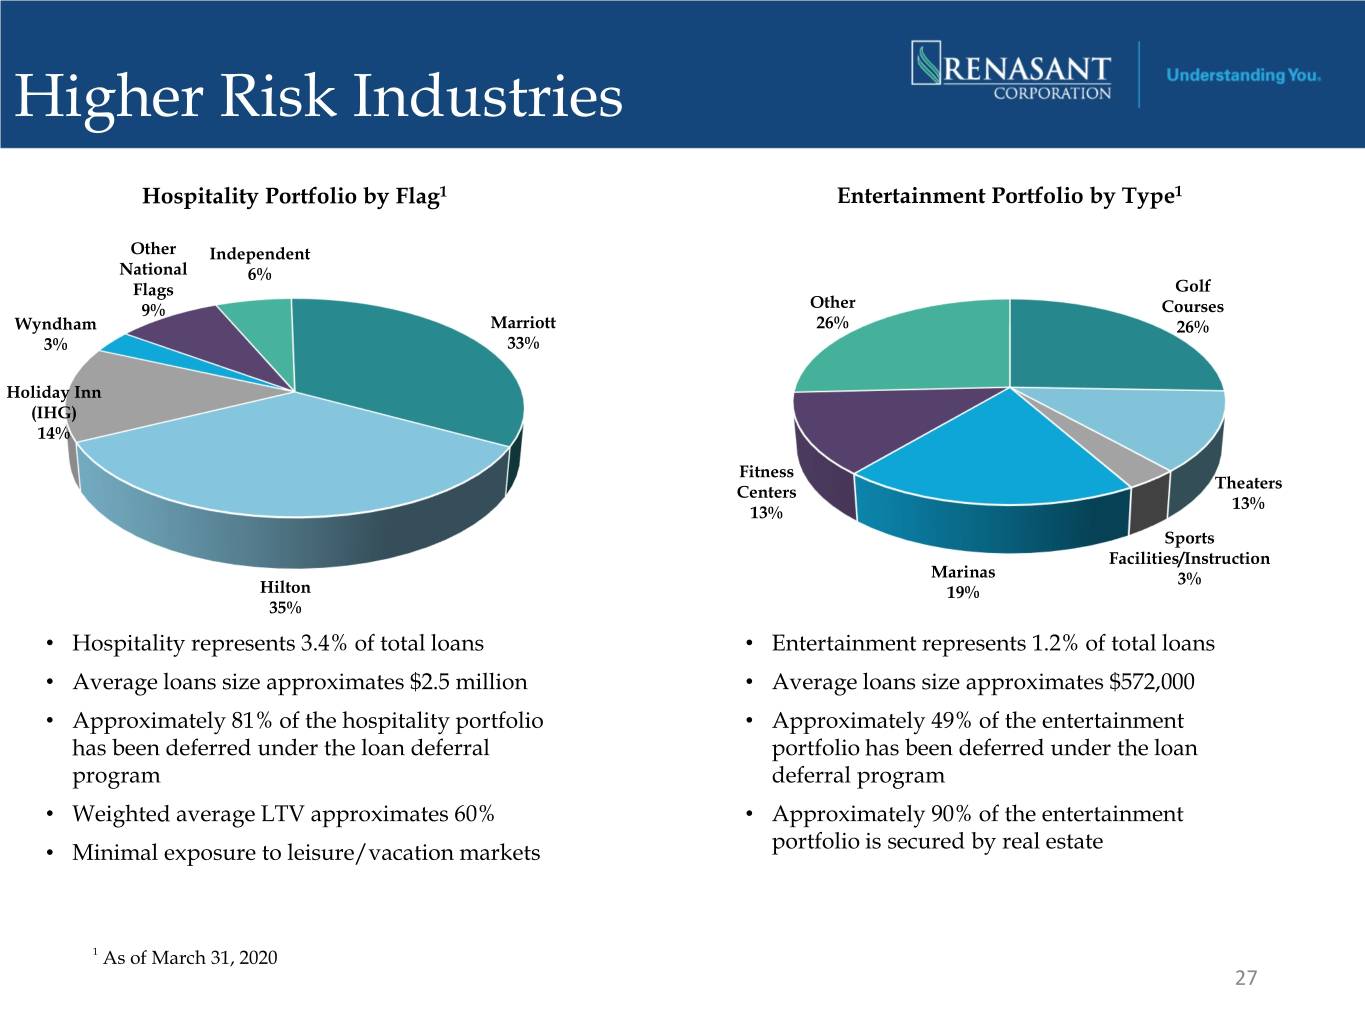
Higher Risk Industries Hospitality Portfolio by Flag1 Entertainment Portfolio by Type1 Other Independent National 6% Flags Golf 9% Other Courses Wyndham Marriott 26% 26% 3% 33% Holiday Inn (IHG) 14% Fitness Theaters Centers 13% 13% Sports Facilities/Instruction Marinas 3% Hilton 19% 35% • Hospitality represents 3.4% of total loans • Entertainment represents 1.2% of total loans • Average loans size approximates $2.5 million • Average loans size approximates $572,000 • Approximately 81% of the hospitality portfolio • Approximately 49% of the entertainment has been deferred under the loan deferral portfolio has been deferred under the loan program deferral program • Weighted average LTV approximates 60% • Approximately 90% of the entertainment portfolio is secured by real estate • Minimal exposure to leisure/vacation markets 1 As of March 31, 2020 27

Higher Risk Industries, cont. Restaurant Portfolio by Type1 Retail Trade Portfolio by Type1 Other Other Auto Dealers 3% 13% 12% Full-Service 46% Single Tenant 22% Limited- Grocery Unanchored Service Anchored Multi- 51% 4% Tenant 34% Other Anchored 15% • Restaurant represents 2.8% of total loans • Retail Trade represents 8.2% of total loans • Average loans size approximates $402,000 • Average loans size approximates $583,000 • Approximately 45% of the restaurant portfolio • Approximately 34% of the retail trade portfolio has has been deferred under the loan deferral been deferred under the loan deferral program program • Weighted average LTV of approximately 53% • Approximately 79% of the restaurant portfolio is • Approximately 90% of the retail trade portfolio is secured by real estate secured by real estate 1 As of March 31, 2020 28

Higher Risk Industries, cont. C-Store Portfolio by Franchise1 Transportation Portfolio by Type1 Other Nonscheduled Other Air Airport Ops BP 9% & Support 16% 14% Chartered Passenger Texaco Other Air 8% Brands 22% 45% Exxon 11% Freight - Other Other 35% 5% Shell 7% Freight - Circle K Chevron Trucking 7% 6% 15% • C-Store represents 2.5% of total loans • Transportation represents 1.6% of total loans • Average loans size approximates $683,000 • Average loans size approximates $256,000 • Approximately 41% of the C-store portfolio has • Approximately 33% of the transportation portfolio been deferred under the loan deferral program has been deferred under the loan deferral program • Approximately 98% of the C-store portfolio is • Approximately 17% of the transportation portfolio secured by real estate is secured by real estate 1 As of March 31, 2020 29

CARES Act and Payment Protection Program (PPP) • Processed approximately 9,500 applications and obtained funding of approximately $1.3 billion through May 5, 2020 • Offered access to the Program for clients and non-clients • Plan to participate in the Paycheck Protection Program Liquidity Facility (PPPLF). Plan to utilize on-balance sheet liquidity for current funding needs 30
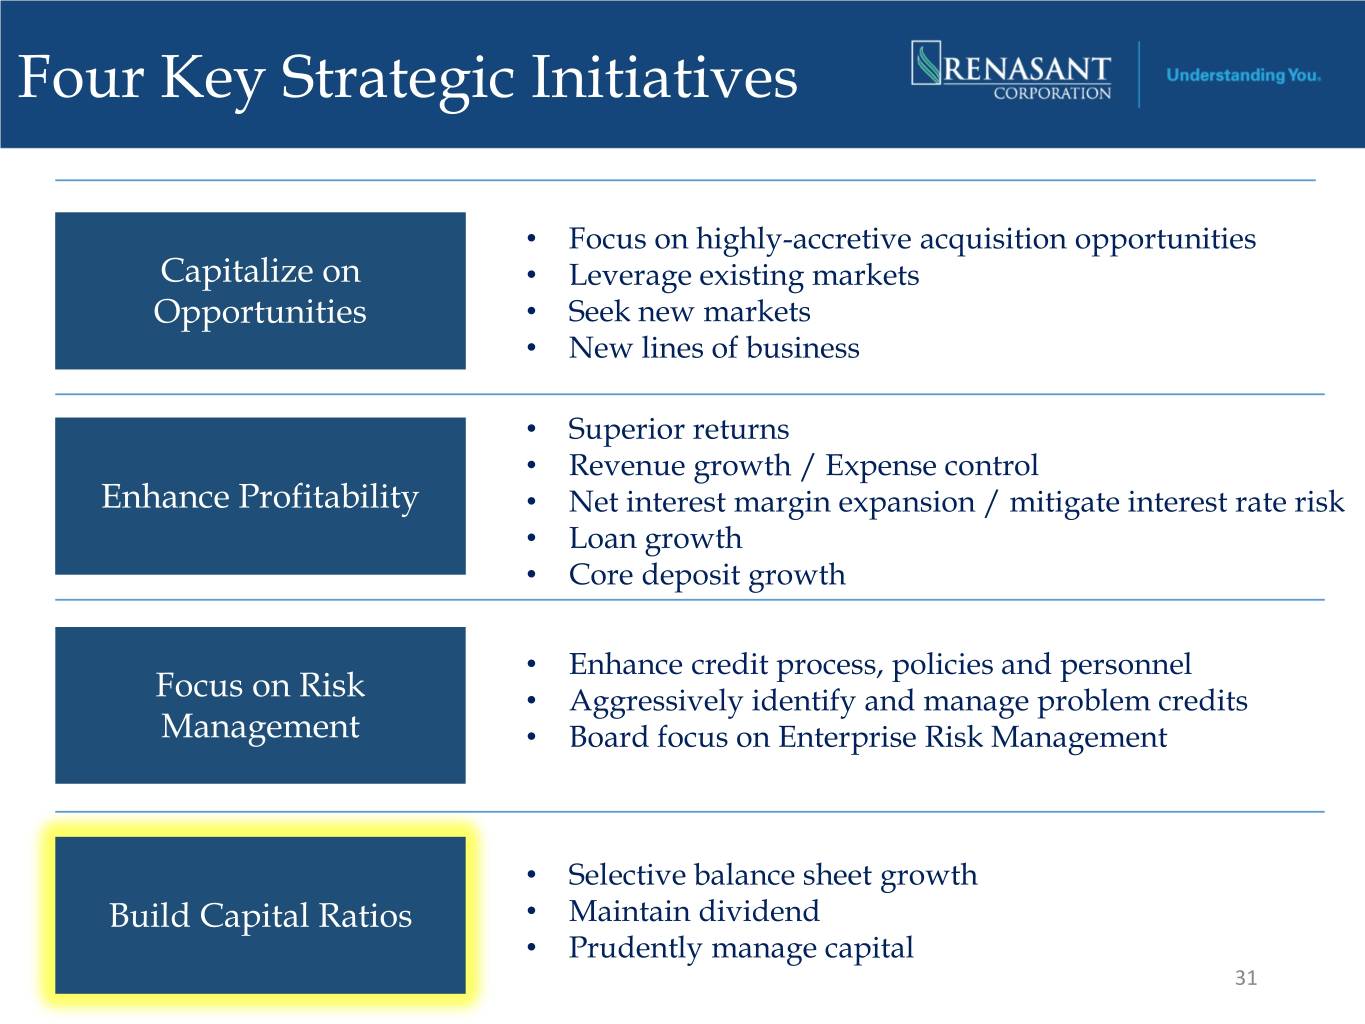
Four Key Strategic Initiatives • Focus on highly-accretive acquisition opportunities Capitalize on • Leverage existing markets Opportunities • Seek new markets • New lines of business • Superior returns • Revenue growth / Expense control Enhance Profitability • Net interest margin expansion / mitigate interest rate risk • Loan growth • Core deposit growth • Enhance credit process, policies and personnel Focus on Risk • Aggressively identify and manage problem credits Management • Board focus on Enterprise Risk Management • Selective balance sheet growth Build Capital Ratios • Maintain dividend • Prudently manage capital 31
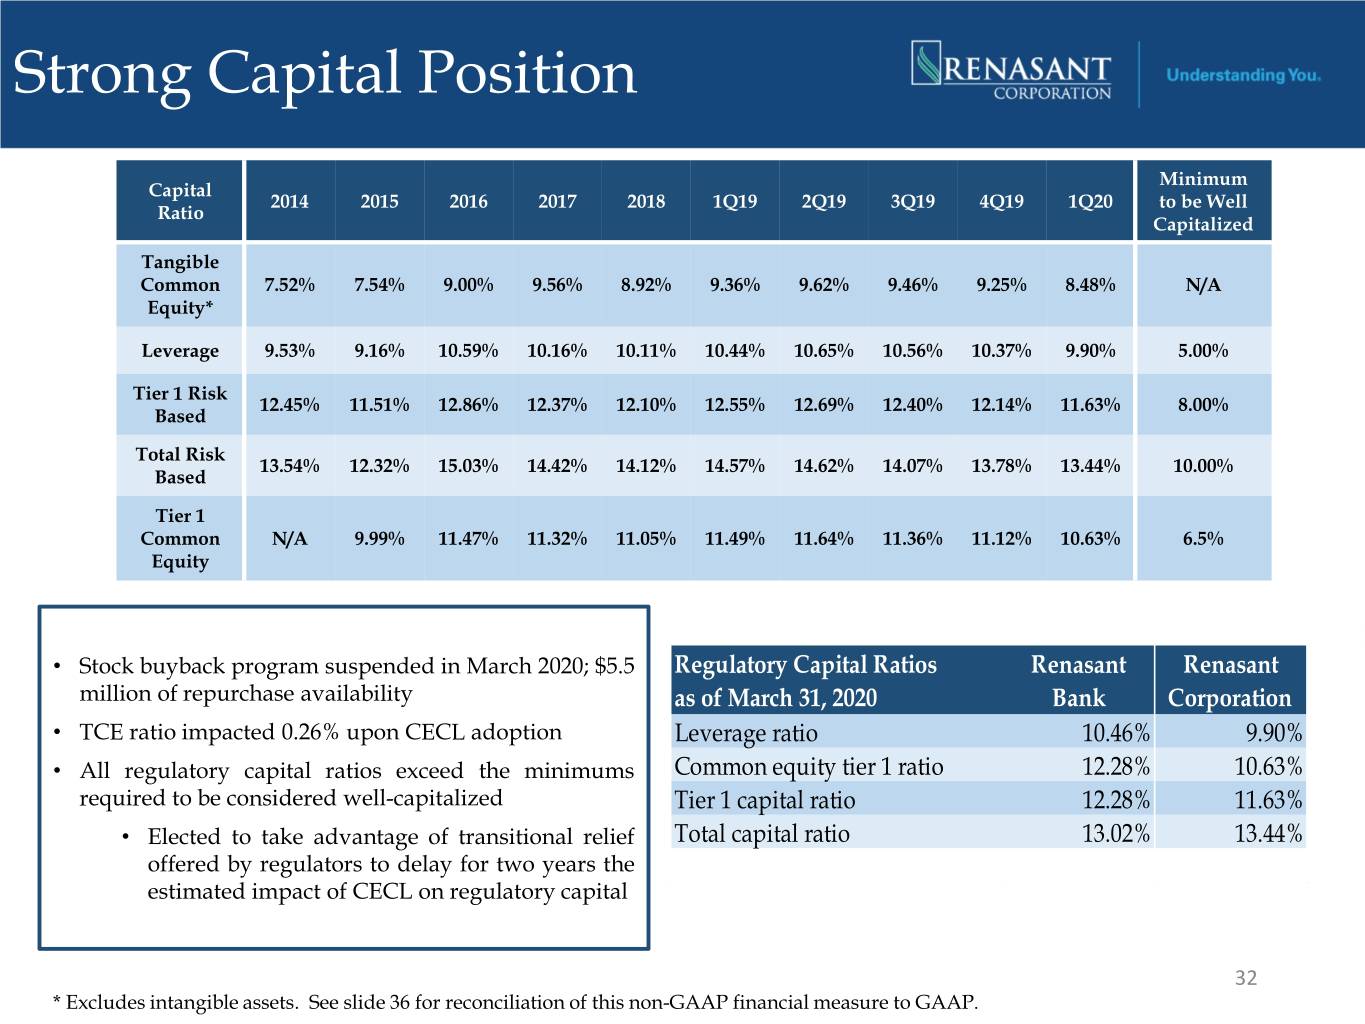
Strong Capital Position Minimum Capital 2014 2015 2016 2017 2018 1Q19 2Q19 3Q19 4Q19 1Q20 to be Well Ratio Capitalized Tangible Common 7.52% 7.54% 9.00% 9.56% 8.92% 9.36% 9.62% 9.46% 9.25% 8.48% N/A Equity* Leverage 9.53% 9.16% 10.59% 10.16% 10.11% 10.44% 10.65% 10.56% 10.37% 9.90% 5.00% Tier 1 Risk 12.45% 11.51% 12.86% 12.37% 12.10% 12.55% 12.69% 12.40% 12.14% 11.63% 8.00% Based Total Risk 13.54% 12.32% 15.03% 14.42% 14.12% 14.57% 14.62% 14.07% 13.78% 13.44% 10.00% Based Tier 1 Common N/A 9.99% 11.47% 11.32% 11.05% 11.49% 11.64% 11.36% 11.12% 10.63% 6.5% Equity • Stock buyback program suspended in March 2020; $5.5 Regulatory Capital Ratios Renasant Renasant million of repurchase availability as of March 31, 2020 Bank Corporation • TCE ratio impacted 0.26% upon CECL adoption Leverage ratio 10.46% 9.90% • All regulatory capital ratios exceed the minimums Common equity tier 1 ratio 12.28% 10.63% required to be considered well-capitalized Tier 1 capital ratio 12.28% 11.63% • Elected to take advantage of transitional relief Total capital ratio 13.02% 13.44% offered by regulators to delay for two years the estimated impact of CECL on regulatory capital 32 * Excludes intangible assets. See slide 36 for reconciliation of this non-GAAP financial measure to GAAP.

Consistent and Strong Dividend Dividends Per Share – Annually Dividends Per Share – Quarterly $1.00 $0.25 $0.90 $0.80 $0.20 $0.70 $0.60 $0.15 $0.50 $0.40 $0.10 $0.30 $0.20 $0.05 $0.10 $0.00 $0.00 33

Poised for Growth with Added Shareholder Value . $13.9B franchise well positioned in attractive markets in the Southeast . Strategic focus on expanding footprint • Acquisition • De Novo • New lines of business . Opportunity for further profitability improvement . Organic loan growth . Core deposit growth . Revenue growth . Declining credit costs . Strong capital position . Consistent dividend payment history 34

Appendix 35

Reconciliation of Non-GAAP Disclosures Tangible Common Equity $ in thousands 2014 2015 2016 2017 2018 Actual shareholders' equity (GAAP) $ 711,651 $ 1,036,818 $ 1,232,883 $ 1,514,983 $ 2,043,913 Intangibles 297,330 474,682 494,608 635,556 977,793 Actual tangible shareholders' equity (non-GAAP) $ 414,321 $ 562,136 $ 738,275 $ 879,427 $ 1,066,120 Actual total assets (GAAP) $ 5,805,129 $ 7,926,496 $ 8,699,851 $ 9,829,981 $ 12,934,878 Intangibles 297,330 474,682 494,608 635,556 977,793 Actual tangible assets (non-GAAP) $ 5,507,799 $ 7,451,814 $ 8,205,243 $ 9,194,425 $ 11,957,085 Tangible Common Equity Ratio Shareholders' equity to (actual) assets (GAAP) 12.26% 13.08% 14.17% 15.41% 15.80% Effect of adjustment for intangible assets 4.74% 5.54% 5.17% 5.85% 6.88% Tangible common equity ratio (non-GAAP) 7.52% 7.54% 9.00% 9.56% 8.92% $ in thousands 1Q19 2Q19 3Q19 4Q19 1Q20 Actual shareholders' equity (GAAP) $ 2,088,877 $ 2,119,696 $ 2,119,659 $ 2,125,689 $ 2,070,512 Intangibles 975,726 973,673 978,390 976,943 975,048 Actual tangible shareholders' equity (non-GAAP) $ 1,113,151 $ 1,146,023 $ 1,141,269 $ 1,148,746 $ 1,095,464 Actual total assets (GAAP) $ 12,862,395 $ 12,892,653 $ 13,039,674 $ 13,400,619 $ 13,890,550 Intangibles 975,726 973,673 978,390 976,943 975,048 Actual tangible assets (non-GAAP) $ 11,886,669 $ 11,918,980 $ 12,061,284 $ 12,423,676 $ 12,915,502 Tangible Common Equity Ratio Shareholders' equity to (actual) assets (GAAP) 16.24% 16.44% 16.26% 15.86% 14.91% Effect of adjustment for intangible assets 6.88% 6.82% 6.80% 6.61% 6.43% Tangible common equity ratio (non-GAAP) 9.36% 9.62% 9.46% 9.25% 8.48% 36
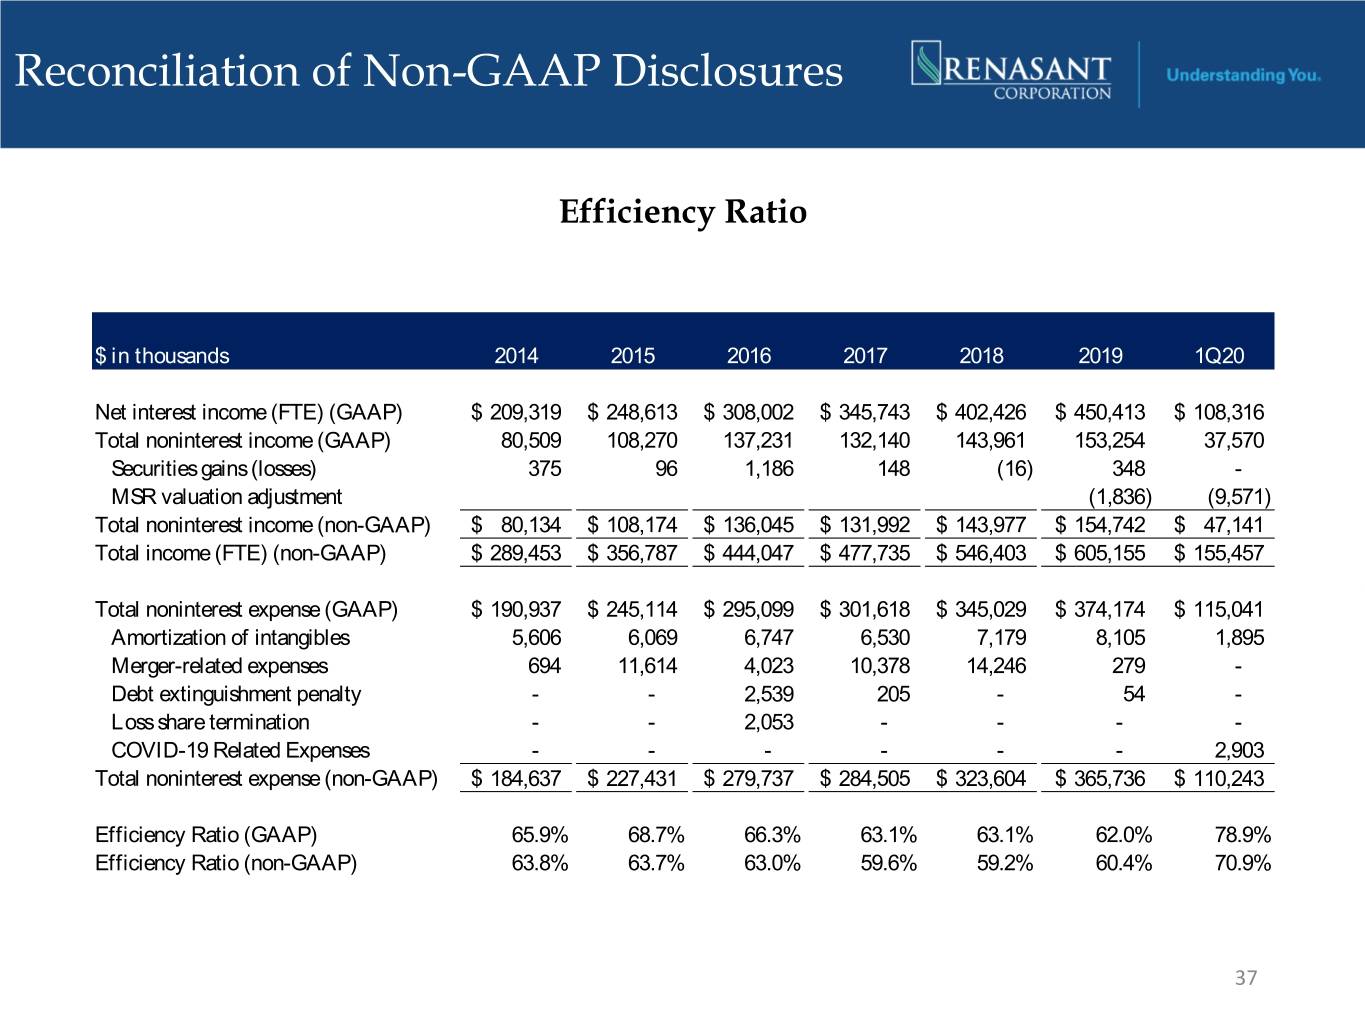
Reconciliation of Non-GAAP Disclosures Efficiency Ratio $ in thousands 2014 2015 2016 2017 2018 2019 1Q20 Net interest income (FTE) (GAAP) $ 209,319 $ 248,613 $ 308,002 $ 345,743 $ 402,426 $ 450,413 $ 108,316 Total noninterest income (GAAP) 80,509 108,270 137,231 132,140 143,961 153,254 37,570 Securities gains (losses) 375 96 1,186 148 (16) 348 - MSR valuation adjustment (1,836) (9,571) Total noninterest income (non-GAAP) $ 80,134 $ 108,174 $ 136,045 $ 131,992 $ 143,977 $ 154,742 $ 47,141 Total income (FTE) (non-GAAP) $ 289,453 $ 356,787 $ 444,047 $ 477,735 $ 546,403 $ 605,155 $ 155,457 Total noninterest expense (GAAP) $ 190,937 $ 245,114 $ 295,099 $ 301,618 $ 345,029 $ 374,174 $ 115,041 Amortization of intangibles 5,606 6,069 6,747 6,530 7,179 8,105 1,895 Merger-related expenses 694 11,614 4,023 10,378 14,246 279 - Debt extinguishment penalty - - 2,539 205 - 54 - Loss share termination - - 2,053 - - - - COVID-19 Related Expenses - - - - - - 2,903 Total noninterest expense (non-GAAP) $ 184,637 $ 227,431 $ 279,737 $ 284,505 $ 323,604 $ 365,736 $ 110,243 Efficiency Ratio (GAAP) 65.9% 68.7% 66.3% 63.1% 63.1% 62.0% 78.9% Efficiency Ratio (non-GAAP) 63.8% 63.7% 63.0% 59.6% 59.2% 60.4% 70.9% 37

Reconciliation of Non-GAAP Disclosures Efficiency Ratio (Excluding Mortgage & Credit Cost) $ in thousands 2014 2015 2016 2017 2018 2019 1Q20 Net interest income (FTE) (GAAP) $ 207,446 $ 240,304 $ 299,868 $ 340,794 $ 398,720 $ 445,951 $ 106,712 Total noninterest income (GAAP) 65,645 73,276 86,692 84,945 92,544 87,273 20,336 Securities gains (losses) 375 96 1,186 148 (16) 348 - Total noninterest income (non-GAAP) $ 65,270 $ 73,180 $ 85,506 $ 84,797 $ 92,560 $ 86,925 $ 20,336 Total income (FTE) (non-GAAP) $ 272,716 $ 313,484 $ 385,374 $ 425,591 $ 491,280 $ 532,876 $ 127,048 Total noninterest expense (GAAP) $ 177,468 $ 212,852 $ 247,428 $ 258,434 $ 297,138 $ 318,876 $ 94,129 Amortization of intangibles 5,606 6,069 6,747 6,530 7,179 8,105 1,895 Merger-related expenses 694 11,614 4,023 10,378 14,246 279 - Debt extinguishment penalty - - 2,539 205 - 54 - Loss share termination - - 2,053 - - - - COVID-19 related expenses - - - - - - 2,903 Provision for unfunded commitments - - - - - - 3,400 Total noninterest expense (non-GAAP) $ 171,168 $ 195,169 $ 232,066 $ 241,321 $ 275,713 $ 310,438 $ 85,931 Efficiency Ratio (non-GAAP) 62.8% 62.3% 60.2% 56.7% 56.1% 58.3% 67.6% 38

Reconciliation of Non-GAAP Disclosures Non Interest Income $ in thousands 1Q19 2Q19 3Q19 4Q19 1Q20 Actual non interest income (GAAP) $ 35,885 $ 41,960 $ 37,953 $ 37,456 $ 37,570 Securities gains (losses) 13 (8) 343 - - MSR valuation adjustment - - (3,132) 1,296 (9,571) Actual non interest income (non-GAAP) $ 35,872 $ 41,968 $ 40,742 $ 36,160 $ 47,141 39

Reconciliation of Non-GAAP Disclosures Diluted Earnings Per Share $ in thousands 1Q19 4Q19 1Q20 Net income (GAAP) $ 45,110 $ 38,415 $ 2,008 Merger and conversion expense - 76 - MSR valuation adjustment - (1,296) 9,571 COVID-19 Related Expenses - - 2,903 Tax effect of adjustment noted above 241 (3,467) Net income with exclusions (non-GAAP) $ 45,110 $ 37,436 $ 11,015 Diluted shares outstanding (average) 58,730,535 57,391,876 56,706,289 Diluted EPS (GAAP) $ 0.77 $ 0.67 $ 0.04 Diluted EPS, with exclusions (non-GAAP) $ 0.77 $ 0.65 $ 0.20 40
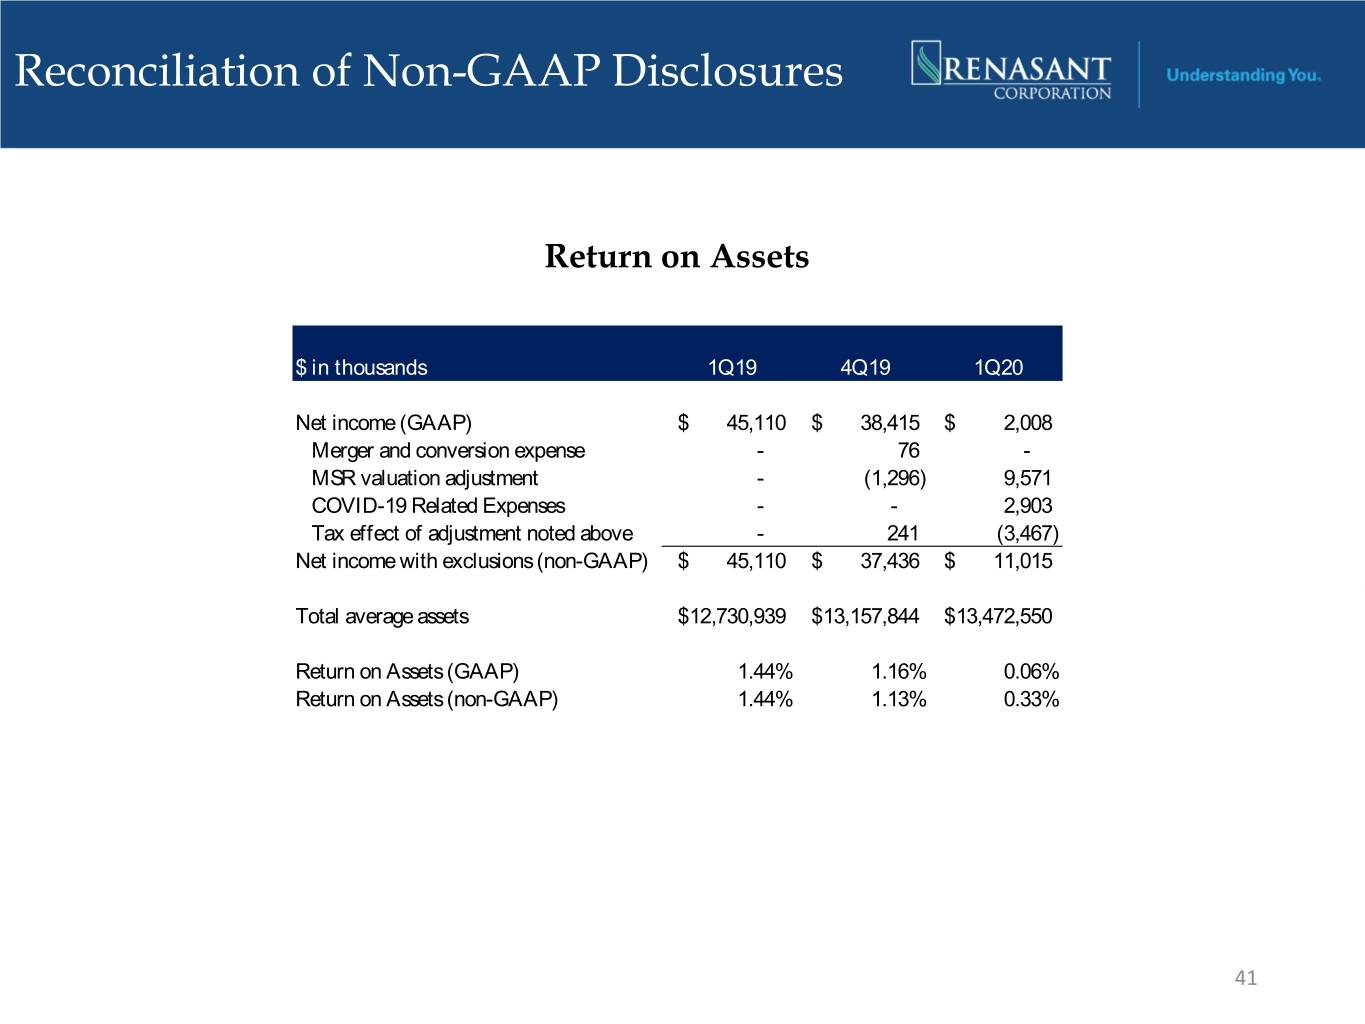
Reconciliation of Non-GAAP Disclosures Return on Assets $ in thousands 1Q19 4Q19 1Q20 Net income (GAAP) $ 45,110 $ 38,415 $ 2,008 Merger and conversion expense - 76 - MSR valuation adjustment - (1,296) 9,571 COVID-19 Related Expenses - - 2,903 Tax effect of adjustment noted above - 241 (3,467) Net income with exclusions (non-GAAP) $ 45,110 $ 37,436 $ 11,015 Total average assets $ 12,730,939 $ 13,157,844 $ 13,472,550 Return on Assets (GAAP) 1.44% 1.16% 0.06% Return on Assets (non-GAAP) 1.44% 1.13% 0.33% 41
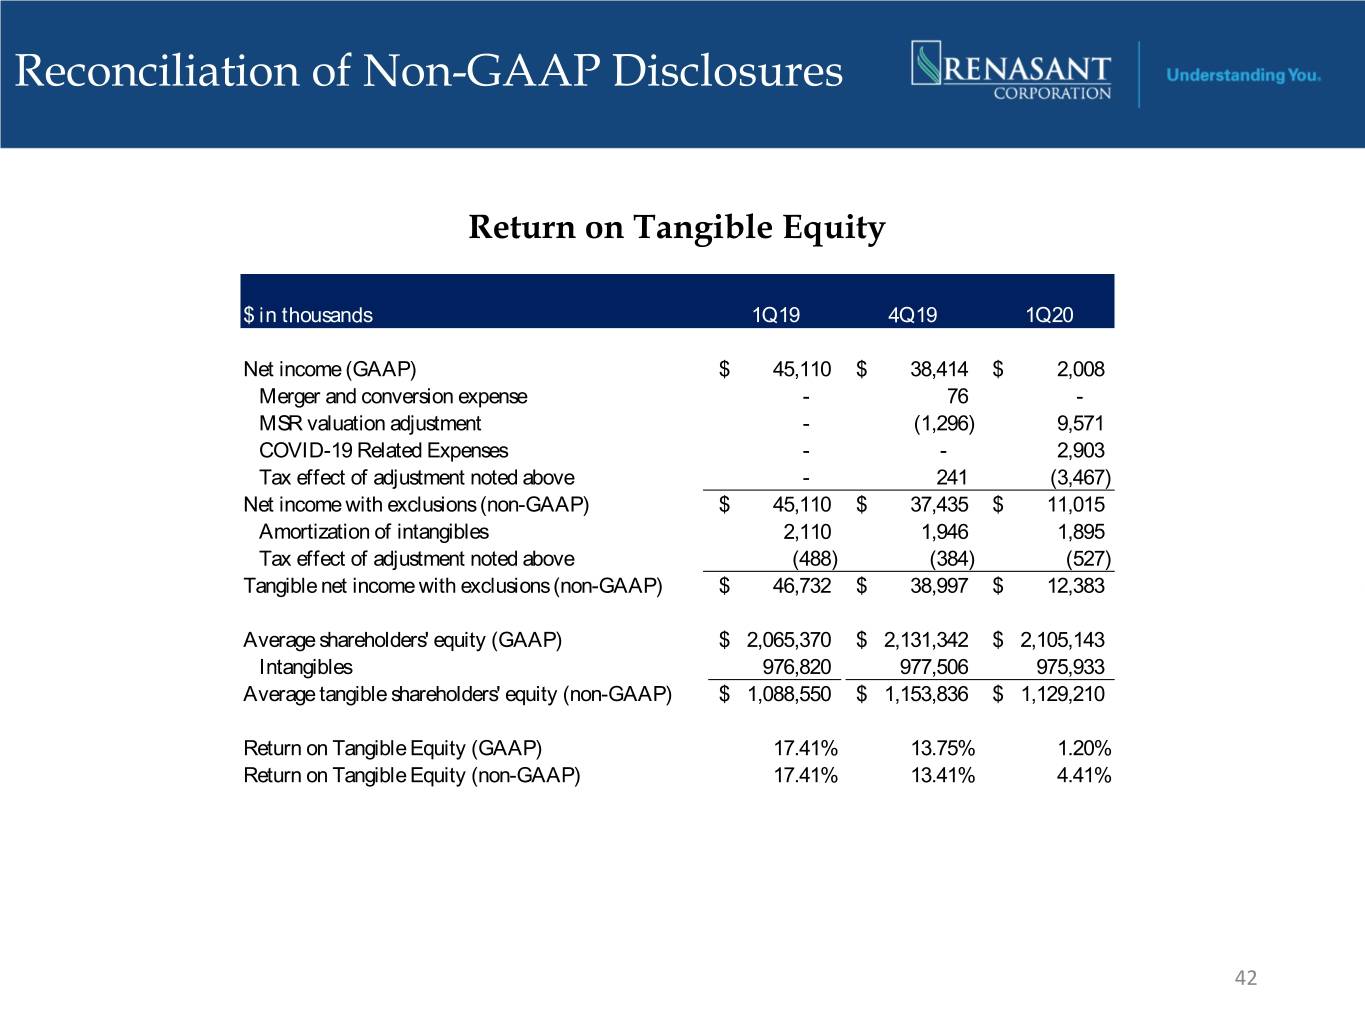
Reconciliation of Non-GAAP Disclosures Return on Tangible Equity $ in thousands 1Q19 4Q19 1Q20 Net income (GAAP) $ 45,110 $ 38,414 $ 2,008 Merger and conversion expense - 76 - MSR valuation adjustment - (1,296) 9,571 COVID-19 Related Expenses - - 2,903 Tax effect of adjustment noted above - 241 (3,467) Net income with exclusions (non-GAAP) $ 45,110 $ 37,435 $ 11,015 Amortization of intangibles 2,110 1,946 1,895 Tax effect of adjustment noted above (488) (384) (527) Tangible net income with exclusions (non-GAAP) $ 46,732 $ 38,997 $ 12,383 Average shareholders' equity (GAAP) $ 2,065,370 $ 2,131,342 $ 2,105,143 Intangibles 976,820 977,506 975,933 Average tangible shareholders' equity (non-GAAP) $ 1,088,550 $ 1,153,836 $ 1,129,210 Return on Tangible Equity (GAAP) 17.41% 13.75% 1.20% Return on Tangible Equity (non-GAAP) 17.41% 13.41% 4.41% 42

Investor Inquiries C. Mitchell Waycaster President and Chief Executive Officer 209 TROY STREET TUPELO, MS 38804-4827 Kevin D. Chapman Senior Executive Vice President, PHONE: 1-800-680-1601 Chief Financial Officer and Chief FACSIMILE: 1-662-680-1234 Operating Officer WWW.RENASANT.COM WWW.RENASANTBANK.COM 43
