Attached files
Table of Contents
Index to Financial Statements
UNITED STATES
SECURITIES AND EXCHANGE COMMISSION
Washington, D.C. 20549
FORM 10-K
Annual Report Pursuant to Section 13 or 15(d) of the Securities Exchange Act of 1934
For the fiscal year ended December 31, 2009
Commission file number 001-13253
RENASANT CORPORATION
(Exact name of registrant as specified in its charter)
| Mississippi | 64-0676974 | |
| (State or other jurisdiction of incorporation or organization) |
(I.R.S. Employer Identification No.) |
| 209 Troy Street, Tupelo, Mississippi | 38804-4827 | |
| (Address of principal executive offices) | (Zip Code) |
Registrant’s telephone number, including area code (662) 680-1001
Securities registered pursuant to Section 12(b) of the Act:
| Title of each class |
Name of each exchange on which registered | |
| Common Stock, $5.00 par value | The NASDAQ Global Select Market |
Securities registered pursuant to Section 12(g) of the Act: None
Indicate by check mark if the registrant is a well-known seasoned issuer, as defined in Rule 405 of the Securities Act. Yes x No ¨
Indicate by check mark if the registrant is not required to file reports pursuant to Section 13 or Section 15(d) of the Act. Yes ¨ No x
Indicate by check mark whether the registrant (1) has filed all reports required to be filed by Section 13 or 15(d) of the Securities Exchange Act of 1934 during the preceding 12 months (or for such shorter period that the registrant was required to file such reports), and (2) has been subject to such filing requirements for the past 90 days. Yes x No ¨
Indicate by check mark whether the registrant has submitted electronically and posted on its corporate Web site, if any, every Interactive Data File required to be submitted and posted pursuant to Rule 405 of Regulation S-T (§232.405 of this chapter) during the preceding 12 months (or for such shorter period that the registrant was required to submit and post such files). Yes ¨ No ¨
Indicate by check mark if disclosure of delinquent filers pursuant to Item 405 of Regulation S-K is not contained herein, and will not be contained, to the best of registrant’s knowledge, in definitive proxy or information statements incorporated by reference in Part III of this Form 10-K or any amendment to this Form 10-K. ¨
Indicate by check mark whether the registrant is a large accelerated filer, an accelerated filer, a non-accelerated filer, or a smaller reporting company. See the definitions of “large accelerated filer,” “accelerated filer” and “smaller reporting company” in Rule 12b-2 of the Exchange Act.
| Large accelerated filer |
¨ |
Accelerated filer |
x | |||
| Non-accelerated filer |
¨ (Do not check if a smaller reporting company) |
Smaller reporting company |
¨ | |||
Indicate by check mark whether the registrant is a shell company (as defined in Rule 12b-2 of the Exchange Act). Yes ¨ No x
As of June 30, 2009, the aggregate market value of the registrant’s common stock, $5.00 par value, held by non-affiliates of the registrant, computed by reference to the last sale price as reported on The NASDAQ Global Select Market for such date, was $293,318,956.
As of February 28, 2010, 21,082,991 shares of the registrant’s common stock, $5.00 par value, were outstanding. The registrant has no other classes of securities outstanding.
DOCUMENTS INCORPORATED BY REFERENCE
Portions of the Proxy Statement relating to the 2010 Annual Meeting of Shareholders of Renasant Corporation are incorporated by reference into Part III.
Table of Contents
Index to Financial Statements
Form 10-K
For the Year Ended December 31, 2009
CONTENTS
| Page | ||||
| Item 1. |
1 | |||
| Item 1A. |
12 | |||
| Item 1B. |
21 | |||
| Item 2. |
21 | |||
| Item 3. |
21 | |||
| Item 4. |
21 | |||
| Item 5. |
22 | |||
| Item 6. |
24 | |||
| Item 7. |
Management’s Discussion and Analysis of Financial Condition and Results of Operations |
25 | ||
| Item 7A. |
48 | |||
| Item 8. |
48 | |||
| Item 9. |
Changes in and Disagreements with Accountants on Accounting and Financial Disclosure |
87 | ||
| Item 9A. |
87 | |||
| Item 9B. |
87 | |||
| Item 10. |
88 | |||
| Item 11. |
88 | |||
| Item 12. |
Security Ownership of Certain Beneficial Owners and Management and Related Stockholder Matters |
88 | ||
| Item 13. |
Certain Relationships and Related Transactions, and Director Independence |
90 | ||
| Item 14. |
90 | |||
| Item 15. |
90 | |||
Table of Contents
Index to Financial Statements
This Annual Report on Form 10-K may contain or incorporate by reference statements which may constitute “forward-looking statements” within the meaning of Section 27A of the Securities Act of 1933, as amended, and Section 21E of the Securities Exchange Act of 1934, as amended. Prospective investors are cautioned that any such forward-looking statements are not guarantees of future performance and involve risks and uncertainties and that actual results may differ materially from those contemplated by such forward-looking statements. Important factors currently known to management that could cause actual results to differ materially from those in forward-looking statements include those risks identified in Item 1A, Risk Factors, of this Form 10-K and significant fluctuations in interest rates, inflation, economic recession, significant changes in the federal and state legal and regulatory environment, significant underperformance in our portfolio of outstanding loans and competition in our markets. We undertake no obligation to update or revise forward-looking statements to reflect changed assumptions, the occurrence of unanticipated events or changes to future operating results over time.
The information set forth in this Annual Report on Form 10-K is as of February 28, 2010, unless otherwise indicated herein.
| ITEM 1. | BUSINESS |
General
Renasant Corporation (referred to herein as the “Company,” “we,” “our,” or “us”), a Mississippi corporation incorporated in 1982, owns and operates Renasant Bank, a Mississippi banking association with operations in Mississippi, Alabama and Tennessee, and Renasant Insurance, Inc., a Mississippi corporation with operations in Mississippi. Renasant Insurance, Inc. is a wholly-owned subsidiary of Renasant Bank. Renasant Bank is referred to herein as the “Bank” and Renasant Insurance, Inc. is referred to herein as “Renasant Insurance.”
Our vision is to be the financial services advisor and provider of choice in each community we serve. With this vision in mind, management has organized the branch banks into community banks using a franchise concept. The franchise approach empowers community bank presidents to execute their own business plans in order to achieve our vision. Specific performance measurement tools are available to assist these presidents in determining the success of their plan implementation. A few of the ratios used in measuring the success of their business plan include:
| • return on average assets |
• net interest margin and spread | |
| • the efficiency ratio |
• fee income shown as a percentage of loans and deposits | |
| • loan and deposit growth |
• the number and type of services provided per household | |
| • net charge-offs to average loans |
• the percentage of loans past due and nonaccruing |
While we have preserved decision-making at a local level, we have centralized our legal, accounting, investment, loan review, human resources, audit and data processing functions. The centralization of these processes enables us to maintain consistent quality of these functions and achieve certain economies of scale.
Our vision is further validated through our core values. These values state that (1) employees are our greatest assets, (2) quality is not negotiable and (3) clients’ trust is foremost. Centered on these values was the development of five different objectives that are the focal point of our strategic plan. Those objectives include: (1) client satisfaction and development, (2) financial soundness and profitability, (3) growth, (4) employee satisfaction and development and (5) shareholder satisfaction and development.
Members of our Board of Directors also serve as members of the Board of Directors of the Bank. Responsibility for the management of our Bank remains with the Board of Directors and officers of the Bank; however, management services rendered by the Company to the Bank are intended to supplement internal management and expand the scope of banking services normally offered by the Bank.
Mergers
On July 1, 2007, the Company merged with Capital Bancorp, Inc. (“Capital”), a bank holding company headquartered in Nashville, Tennessee. The Company issued approximately 2.8 million shares of its common stock and paid approximately $56.0 million in cash as merger consideration to the shareholders of Capital. The Company used the proceeds of its public offering of 2.76 million shares of its common stock completed in June 2007 to pay the cash portion of the merger consideration. Capital Bank & Trust Company, a wholly-owned subsidiary of Capital with seven banking offices in the Nashville-Davidson-Murfreesboro, Tennessee Metropolitan Statistical Area, was merged into the Bank immediately after the consummation of the merger of Capital into the Company.
1
Table of Contents
Index to Financial Statements
Operations
We have four reportable segments: a Mississippi community bank, a Tennessee community bank, an Alabama community bank and an insurance agency. Financial information about our segments, including information with respect to revenues from external customers, profit or loss and total assets for each segment, is contained in Note O, “Segment Reporting,” in the Notes to Consolidated Financial Statements of the Company in Item 8, Financial Statements and Supplementary Data. The description of the operations of the Bank immediately below applies to the operations of each of our three banking segments.
Operations of the Bank
Substantially all of our business activities are conducted through, and substantially all of our assets and revenues are derived from, the Bank, which is a community bank offering a complete range of banking and financial services to individuals and to small to medium-size businesses. These services include checking and savings accounts, business and personal loans, interim construction and residential mortgage loans, equipment leasing, as well as safe deposit and night depository facilities. Automated teller machines are located throughout our market area. Our Internet Banking product and our call center also provide 24-hour banking services. Accounts receivable financing is also available to qualified businesses.
On February 26, 2010, we had 62 banking and financial services offices located throughout our markets in north and north central Mississippi, west and middle Tennessee, and north and north central Alabama.
Lending Activities. Income generated by our lending activities, in the form of both interest income and loan-related fees, comprises a substantial portion of our revenue, accounting for approximately 63.56%, 68.03% and 71.61% of our total gross revenues in 2009, 2008 and 2007, respectively. Total gross revenues consist of interest income on a fully taxable equivalent basis and noninterest income. Our lending philosophy is to minimize credit losses by following strict credit approval standards, diversifying our loan portfolio and conducting ongoing review and management of the loan portfolio. The following is a description of each of the principal types of loans in our loan portfolio, the relative risk of each type of loan and the steps we take to reduce credit risk. A further discussion of our risk reduction policies and procedures can be found in Item 7, Management’s Discussion and Analysis of Financial Condition and Results of Operations, under the heading “Risk Management – Credit Risk and Allowance for Loan Losses.” We have omitted a discussion of lease financing, as such financing comprised only approximately 0.03% of our portfolio at December 31, 2009.
— Commercial, Financial and Agricultural Loans. Commercial, financial and agricultural loans (referred to as “commercial loans”), which accounted for approximately 11.98% of our total loans at December 31, 2009, are customarily granted to established local business customers in our market area on a fully collateralized basis to meet their credit needs. Many of these loans have terms allowing the loan to be extended for periods of between one and five years. Loans are usually structured either to fully amortize over the term of the loan or to balloon after the third year or fifth year of the loan, typically with an amortization period not to exceed 15 years. The terms and loan structure are dependent on the collateral and strength of the borrower. The loan-to-value ratios range from 50% to 80%, depending on the type of collateral.
Commercial lending generally involves different risks from those associated with commercial real estate lending or construction lending. Although commercial loans may be collateralized by equipment or other business assets, the repayment of these types of loans depends primarily on the creditworthiness and projected cash flow of the borrower (and any guarantors). Thus, the general business conditions of the local economy and the local business borrower’s ability to sell its products and services, thereby generating sufficient operating revenue to repay us under the agreed upon terms and conditions, are the chief considerations when assessing the risk of a commercial loan. The liquidation of collateral is considered a secondary source of repayment because equipment and other business assets may, among other things, be obsolete or of limited use. To manage these risks, the Bank’s policy is to secure its commercial loans with both the assets of the borrowing business and any other additional collateral and guarantees that may be available. In addition, we actively monitor certain financial measures of the borrower, including advance rate, cash flow, collateral value and other appropriate credit factors. We use commercial loan credit scoring models for smaller level commercial loans.
2
Table of Contents
Index to Financial Statements
— Real Estate – Construction. Our Real Estate – Construction loans (“construction loans”) represented approximately 5.68% of our total loans at December 31, 2009. Our construction loan portfolio consists of loans for the construction of single family residential properties, multi-family properties and commercial projects. Maturities for construction loans generally range from 6 to 12 months for residential property and from 12 to 24 months for non-residential and multi-family properties. Construction lending entails significant additional risks compared to residential real estate or commercial real estate lending. A significant additional risk is that loan funds are advanced upon the security of the property under construction, which is of uncertain value prior to the completion of construction. Thus, it is more difficult to evaluate accurately the total loan funds required to complete a project and to calculate related loan-to-value ratios. To minimize the risks associated with construction lending, we limit loan-to-value ratios to 85% of when-completed appraised values for owner-occupied and investor-owned residential or commercial properties.
— Real Estate – 1-4 Family Mortgage. We are active in the Real Estate – 1-4 Family Mortgage area (referred to as “residential real estate loans”), with approximately 34.97% of our total loans at December 31, 2009 being residential real estate loans. We offer both first and second mortgages on residential real estate. Loans secured by residential real estate in which the property is the principal residence of the borrower are referred to as “primary” 1-4 Family Mortgages. Loans secured by residential real estate in which the property is rented to tenants or is not the principal residence of the borrower are referred to as “rental/investment” 1-4 Family Mortgages. We also, offer loans for the preparation of residential real property prior to construction (referred to in this Annual Report as “residential land development loans”). In addition, we offer home equity lines of credit and term loans secured by first and second mortgages on the residences of borrowers for purchases, refinances, home improvements, education and other personal expenditures. Both fixed and variable rate loans are offered with competitive terms and fees. Originations of residential real estate loans are generated through either retail efforts in our branches or wholesale marketing, which involves obtaining mortgage referrals from third-party mortgage brokers. We attempt to minimize the risk associated with residential real estate loans by strictly scrutinizing the financial condition of the borrower; typically, we also limit the maximum loan-to-value ratio.
We retain loans for our portfolio when the Bank has sufficient liquidity to fund the needs of established customers and when rates are favorable to retain the loans. We also originate residential real estate loans with the intention of selling them in the secondary market to third party private investors. These loans are collateralized by one-to-four family residential real estate and are sold with servicing rights released. Residential real estate originations to be sold are locked in at a contractual rate with third party private investors, and we are obligated to sell the mortgages to such investors only if the mortgages are closed and funded. The risk we assume is conditioned upon loan underwriting and market conditions in the national mortgage market. The Company does not actively market or originate subprime mortgage loans.
We also offer home equity loans or lines of credit as an option to borrowers who elect to utilize the accumulated equity in their homes by borrowing money through either a first or second lien home equity loan or line of credit. We limit our exposure to second lien home equity loans or lines of credit, which inherently carry a higher risk of loss upon default, by limiting these types of loans to borrowers with high credit scores.
— Real Estate – Commercial Mortgage. Our Real Estate – Commercial Mortgage loans (“commercial real estate loans”) represented approximately 44.33% of our total loans at December 31, 2009. We offer loans in which the owner develops a property with the intention of locating its business there. These loans are referred to as “owner-occupied” commercial real estate. Because payments on these loans are often dependent on the successful development, operation and management of the properties, repayment of these loans may be affected by adverse conditions in the real estate market or the economy as a whole, in addition to the borrower’s ability to generate sufficient operating revenue to repay us. If our estimate of value proves to be inaccurate, we may not be able to obtain full repayment on the loan in the event of default and foreclosure. In most instances, these loans are secured by the underlying real estate of the business and other non-real estate collateral, such as equipment or other assets used in the course of business. In addition, we offer loans in which the owner develops a property where the source of repayment of the loan will come from the sale or lease of the developed property, for example, retail shopping centers, hotels, storage facilities, nursing homes, etc. These loans are referred to as “non-owner occupied” commercial real estate. We also offer commercial real estate loans to developers of commercial properties for purposes of site acquisition and preparation and other development prior to actual construction (referred to in this Annual Report as “commercial land development loans”). We seek to minimize risks by limiting the maximum loan-to-value ratio and strictly scrutinizing the financial condition of the borrower, the quality of the collateral and the
3
Table of Contents
Index to Financial Statements
management of the property securing the loan. We also actively monitor such financial measures as advance rate, cash flow, collateral value and other appropriate credit factors. We generally obtain loan guarantees from financially capable parties to the transaction based on a review of the guarantor’s financial statements.
— Installment Loans to Individuals. Installment Loans to Individuals (or “consumer loans”), which represented approximately 3.01% of our total loans at December 31, 2009, are granted to individuals for the purchase of personal goods. These loans are generally granted for periods ranging between one and six years at fixed rates of interest 1% to 5% above the prime interest rate quoted in The Wall Street Journal. Loss or decline of income by the borrower due to unplanned occurrences may represent risk of default to us. In the event of default, a shortfall in the value of the collateral may pose a loss to us in this loan category. Before granting a consumer loan, we assess the applicant’s credit history and ability to meet existing and proposed debt obligations. Although the applicant’s creditworthiness is the primary consideration, the underwriting process also includes a comparison of the value of the collateral, if any, to the proposed loan amount. We obtain a lien against the collateral securing the loan and hold title until the loan is repaid in full.
Deposit Services. We offer a broad range of deposit services and products to our consumer and commercial clients. Through our community branch networks, we offer totally free consumer checking accounts with free Internet banking with bill pay and free debit cards, interest bearing checking, money market accounts and savings accounts. In addition, Renasant offers certificates of deposit, individual retirement accounts and health savings accounts.
For our commercial clients, we offer a competitive suite of cash management products which include, but are not limited to, remote deposit capture, CD ROM statements with account reconciliation, electronic statements, positive pay, ACH origination and wire transfer, wholesale and retail lockbox, investment sweep accounts, enhanced business Internet banking, outbound data exchange, multi-bank reporting and international services.
The deposit services we offer accounted for approximately 12.51%, 11.29% and 10.30% of our total gross revenues in 2009, 2008 and 2007, respectively, in the form of fees for deposit services. No material portion of our deposits has been obtained from a single or small group of customers, and the loss of any single customer’s deposits or a small group of customers’ deposits would not have a materially adverse effect on our business. The deposits held by our Bank have been primarily generated within the market areas where the branches are located. Neither we nor the Bank have any foreign activities.
Other Products and Services. Through the Financial Services division of the Bank, we also offer a wide variety of fiduciary services and administer (as trustee or in other fiduciary or representative capacities) qualified retirement plans, profit sharing and other employee benefit plans, personal trusts and estates. In addition, the Financial Services division offers annuities, mutual funds and other investment services through a third party broker-dealer. The Financial Services division does not constitute a separately-reportable segment for financial reporting purposes.
Operations of Renasant Insurance
Renasant Insurance is a full-service insurance agency offering all lines of commercial and personal insurance through major carriers. At December 31, 2009, Renasant Insurance contributed total revenue of $3.9 million, or 1.66%, of the Company’s total gross revenues, and operated three offices in central and northern Mississippi.
Competition
Banking
Vigorous competition exists in all major product and geographic areas in which we conduct banking business. We compete through our Bank for available loans and deposits with state, regional and national banks in all of our service areas, as well as savings and loan associations, credit unions, finance companies, mortgage companies, insurance companies, brokerage firms and investment companies. All of these numerous institutions compete in the delivery of services and products through availability, quality and pricing, and many of our competitors are larger and have substantially greater resources than we do, including higher total assets and capitalization, greater access to capital markets and a broader offering of financial services.
For 2009, we maintained approximately 17% of the market share (deposit base) in our entire Mississippi area, approximately 2% in our entire Tennessee area and approximately 2% in our entire Alabama area. Certain markets in which we operate have demographics which we believe indicate the possibility of future growth at higher rates than other markets in which we operate. At December 31, 2009, 82% of our loans and 65% of our deposits were located in these key markets. We have identified these markets, which are listed in the table below, as our key growth markets.
4
Table of Contents
Index to Financial Statements
The following table shows our deposit share in the markets that we consider our key markets as of June 30, 2009 (which is the latest date that such information is available):
| Market |
Available Deposits (in billions) |
Deposit Share |
||||
| Mississippi |
||||||
| Tupelo |
$ | 1.4 | 30.4 | % | ||
| DeSoto County |
1.9 | 10.2 | % | |||
| Oxford |
0.8 | 4.7 | % | |||
| Alabama |
||||||
| Birmingham |
22.3 | 0.4 | % | |||
| Decatur |
1.6 | 13.4 | % | |||
| Huntsville/Madison |
6.3 | 1.7 | % | |||
| Tennessee |
||||||
| Memphis |
18.0 | 1.5 | % | |||
| Nashville |
26.7 | 1.3 | % | |||
| Total |
$ | 79.0 | ||||
| Source: FDIC, As of June 30, 2009 | ||||||
Insurance
We encounter strong competition in the markets in which we conduct insurance operations. Through our insurance subsidiary, we compete with independent insurance agencies and agencies affiliated with other banks and/or other insurance carriers. All of these agencies compete in the delivery of personal and commercial product lines. There is no dominant insurance agency in our markets.
Supervision and Regulation
Banking
Under the current regulatory environment, nearly every facet of our banking operations is regulated pursuant to various state and federal banking laws, rules and regulations. The primary focus of these laws and regulations is the protection of depositors and the maintenance of the safety and soundness of the banking system as a whole and the insurance funds of the Federal Deposit Insurance Corporation (“FDIC”). While the following summary addresses the regulatory environment in which we operate, it is not intended to be a fully inclusive discussion of the statutes and regulations affecting our operations. Discussions in this section focus only on certain provisions of such statutes and regulations and do not purport to be comprehensive. Such discussions are qualified in their entirety by reference to the relevant statutes and regulations. In addition, the impact from future changes in federal or state legislation on our operations cannot be predicted. In the wake of the economic downturn currently affecting the United States, many significant changes to federal and state laws affecting us have been proposed.
We elected not to participate in the U.S. Treasury Department’s Capital Purchase Program, which is part of the federal government’s Troubled Asset Relief Program. Thus, we will not be subject to any of the regulations enacted (and to be enacted) with respect to such program. We have, however, opted to participate in the FDIC’s Temporary Liquidity Guarantee Program. The regulations we are subject to on account of our participation in this program currently do not have a material effect on our business or operations, but we are unable to predict what additional regulations, if any, we may be subject to in connection with our participation in this program and the impact of any such regulations on our business and operations.
We are a bank holding company within the meaning of the Bank Holding Company Act of 1956, as amended (the “Act”), and are registered as such with the Board of Governors of the Federal Reserve System (the “Federal Reserve”). We are required to file with the Federal Reserve an annual report and such other information as the Federal Reserve may require. The Federal Reserve may also make examinations of us and the Bank pursuant to the Act. The Federal Reserve has the authority (which to date it has not exercised) to regulate provisions of certain types of our debt.
The Act requires a bank holding company to obtain the prior approval of the Federal Reserve before acquiring direct or indirect ownership or control of more than 5% of the voting shares of any bank that is not already majority-owned
5
Table of Contents
Index to Financial Statements
by such bank holding company. The Act further provides that the Federal Reserve shall not approve any acquisition, merger or consolidation which would result in a monopoly or which would be in furtherance of any combination or conspiracy to monopolize or attempt to monopolize the business of banking. The Federal Reserve will also not approve any transaction in which the effect of the transaction might be to substantially lessen competition or in any manner amount to a restraint on trade, unless the anti-competitive effects of the proposed transaction are clearly outweighed by the benefits to the public interest resulting from the probable effect of the transaction in meeting the convenience and needs of the community to be served.
The Act also prohibits a bank holding company, with certain exceptions, from itself engaging in or acquiring direct or indirect control of more than 5% of the voting shares of any company engaged in non-banking activities. The principal exception to this prohibition is for a bank holding company engaging in or acquiring shares of a company whose activities are found by the Federal Reserve to be so closely related to banking or managing banks as to be a proper incident thereto. In making determinations whether activities are closely related to banking or managing banks, the Federal Reserve is required to consider whether the performance of such activities by a bank holding company or its subsidiaries can reasonably be expected to produce benefits to the public, such as greater convenience, increased competition or gains in efficiency of resources and whether such public benefits outweigh the risks of possible adverse effects, such as decreased or unfair competition, conflicts of interest or unsound banking practices.
The Company and the Bank are subject to certain restrictions imposed by the Federal Reserve Act and the Federal Deposit Insurance Act on any extensions of credit to the Company or the Bank, on investments in the stock or other securities of the Company or the Bank and on taking such stock or other securities as collateral for loans of any borrower.
On November 12, 1999, the Gramm-Leach-Bliley Financial Services Modernization Act of 1999 (the “Financial Services Modernization Act”) was signed into law. The Financial Services Modernization Act eliminates the barriers erected by the 1933 Glass-Steagall Act and amends the Act, among other statutes. Further, it allows for the affiliation of banking, securities and insurance activities in new financial services organizations.
A dominant theme of the Financial Services Modernization Act is functional regulation of financial services, with the primary regulator of the Company or its subsidiaries being the agency which traditionally regulates the activity in which the Company or its subsidiaries wish to engage. For example, the Securities and Exchange Commission (“SEC”) will regulate bank holding company securities transactions, and the various banking regulators will oversee banking activities.
The principal provisions of the Financial Services Modernization Act permit the Company, so long as it meets the standards for a “well-managed” and “well-capitalized” institution and has at least a “satisfactory” Community Reinvestment Act performance rating, to engage in any activity that is “financial in nature,” including security and insurance underwriting, investment banking and merchant banking investing in commercial and industrial companies. The Company, if it satisfies the above criteria, can file a declaration of its status as a “financial holding company” (“FHC”) with the Federal Reserve and thereafter engage directly or through nonbank subsidiaries in the expanded range of activities which the Financial Services Modernization Act identifies as financial in nature. Further, the Company, if it elects FHC status, will be able to pursue additional activities which are incidental or complementary in nature to a financial activity or which the Federal Reserve subsequently determines to be financial in nature. We have not elected to become an FHC.
Under the Reigle-Neal Interstate Banking and Branching Efficiency Act of 1994 (the “Interstate Act”), the Company or any other bank holding company located in Mississippi is able to acquire a bank located in any other state, and a bank holding company located outside Mississippi can acquire any Mississippi-based bank, in either case subject to certain deposit percentage and other restrictions.
The Interstate Act also provides that, unless an individual state has elected to prohibit out-of-state banks from operating interstate branches within its territory, adequately capitalized and managed bank holding companies may consolidate their multistate bank operations into a single bank subsidiary and branch interstate through acquisitions. Under Mississippi law, out-of-state bank holding companies may establish a bank in Mississippi only by acquiring a Mississippi bank or Mississippi bank holding company.
Bank holding companies are allowed to acquire savings associations under The Financial Institutions Reform, Recovery and Enforcement Act of 1989 (“FIRREA”). Deposit insurance premiums for banks and savings associations were increased as a result of FIRREA, and losses incurred by the FDIC in connection with the default or assistance of troubled federally-insured financial institutions are required to be reimbursed by other federally-insured financial institutions.
6
Table of Contents
Index to Financial Statements
The Company’s ability to pay dividends to our shareholders is substantially dependent on the ability of Renasant Bank to transfer funds to the Company in the form of dividends, loans and advances. Under Mississippi law, a Mississippi bank may not pay dividends unless its earned surplus is in excess of three times capital stock. A Mississippi bank with earned surplus in excess of three times capital stock may pay a dividend, subject to the approval of the Mississippi Department of Banking and Consumer Finance. In addition, the FDIC must approve any payment of dividends by the Bank. Accordingly, the approval of these supervisory authorities is required prior to Renasant Bank paying dividends to the Company. Federal Reserve regulations also limit the amount Renasant Bank may loan to the Company unless such loans are collateralized by specific obligations.
The Bank’s deposits are insured by the FDIC, and the Bank is subject to examination and review by that regulatory authority. The Federal Deposit Insurance Corporation Improvement Act of 1991 (“FDICIA”) provides for increased funding for the FDIC’s Deposit Insurance Fund through risk based assessments and expands the regulatory powers of federal banking agencies to permit prompt corrective actions to resolve problems of insured depository institutions.
The Community Reinvestment Act of 1997 requires the assessment by the appropriate regulatory authority of a financial institution’s record in meeting the credit needs of its local communities, including low and moderate-income neighborhoods, consistent with the safe and sound operation of those institutions. These factors are also considered in evaluating mergers, acquisitions and applications to open a branch or facility.
The USA PATRIOT Act of 2001 contains the International Money Laundering Abatement and Financial Anti-Terrorism Act of 2001 (the “IMLAFA”). The IMLAFA substantially broadens existing anti-money laundering legislation and the extraterritorial jurisdiction of the United States, imposes new compliance and due diligence obligations, creates new crimes and penalties, compels the production of documents located both inside and outside the United States, including those of foreign institutions that have a correspondent relationship in the United States and clarifies the safe harbor from civil liability to customers. The U.S. Treasury Department has issued a number of regulations implementing the USA PATRIOT Act that apply certain of its requirements to financial institutions such as our Bank. The regulations impose new obligations on financial institutions to maintain appropriate policies, procedures and controls to detect, prevent and report money laundering and terrorist financing. The IMLAFA requires all “financial institutions,” as defined, to establish anti-money laundering compliance and due diligence programs. Such programs must include, among other things, adequate policies, the designation of a compliance officer, employee training programs and an independent audit function to review and test the program. The Company believes that it has complied with these requirements.
Insurance
Renasant Insurance is subject to licensing requirements and regulation under the laws of the United States and the State of Mississippi. The laws and regulations are primarily for the benefit of clients. In all jurisdictions, the applicable laws and regulations are subject to amendment by regulatory authorities. Generally, such authorities are vested with relatively broad discretion to grant, renew and revoke licenses and approvals and to implement regulations. Licenses may be denied or revoked for various reasons, including the violation of such regulations, conviction of crimes and the like. Possible sanctions which may be imposed for violation of regulations include suspension of individual employees, limitations on engaging in a particular business for a specified period of time, revocation of licenses, censures and fines.
Monetary Policy and Economic Controls
We and the Bank are affected by the policies of regulatory authorities, including the Federal Reserve. An important function of the Federal Reserve is to regulate the national supply of bank credit in order to stabilize prices. Among the instruments of monetary policy used by the Federal Reserve to implement these objectives are open market operations in U.S. Government securities, changes in the discount rate on bank borrowings and changes in reserve requirements against bank deposits. These instruments are used in varying degrees to influence overall growth of bank loans, investments and deposits and may also affect interest rates charged on loans or paid for deposits.
The monetary policies of the Federal Reserve have had a significant effect on the operating results of commercial banks in the past, especially in connection with the economic downturn currently affecting the United States, and are expected to do so in the future. In view of changing conditions in the national economy and in the various money markets, as well as the effect of actions by monetary and fiscal authorities including the Federal Reserve, the effect on our, and the Bank’s, future business and earnings cannot be predicted with accuracy.
7
Table of Contents
Index to Financial Statements
Sources and Availability of Funds
The funds essential to our, and our Bank’s, business consist primarily of funds derived from customer deposits, federal funds purchased, securities sold under repurchase agreements, Federal Home Loan Bank advances and borrowings from correspondent banks by the Bank. The availability of such funds is primarily dependent upon the economic policies of the federal government, the economy in general and the general credit market for loans.
Personnel
At December 31, 2009, we employed 816 people at all of our subsidiaries on a full-time equivalent basis. Of this total, the Bank accounted for 780 employees, and Renasant Insurance employed 36 individuals. The Company has no additional employees; however, at December 31, 2009, 16 employees of the Bank served as officers of the Company in addition to their positions with the Bank.
Dependence Upon a Single Customer
Neither we nor our subsidiaries are dependent upon a single customer or upon a limited number of customers. A discussion of concentrations of credit in our loan portfolio is set forth under the heading “Risk Management—Loan Concentrations” in Item 7, Management’s Discussion and Analysis of Financial Condition and Results of Operations.
Available Information
Our Internet address is www.renasant.com. We make available at this address on the Investors Relations webpage under the caption “SEC Filings”, free of charge, our Annual Report on Form 10-K, quarterly reports on Form 10-Q, current reports on Form 8-K and amendments to those reports filed or furnished pursuant to Section 13(a) or 15(d) of the Securities Exchange Act of 1934, as amended, as soon as reasonably practicable after we electronically file such material with, or furnish it to, the SEC.
8
Table of Contents
Index to Financial Statements
Table 1 – Distribution of Assets, Liabilities and Shareholders’ Equity; Interest Rates and Interest Differential
(In Thousands)
The following table sets forth average balance sheet data, including all major categories of interest-earning assets and interest-bearing liabilities, together with the interest earned or interest paid and the average yield or average rate paid on each such category for the years ended December 31, 2009, 2008 and 2007:
| 2009 | 2008 | 2007 | |||||||||||||||||||||||||
| Average Balance |
Interest Income/ Expense |
Yield/ Rate |
Average Balance |
Interest Income/ Expense |
Yield/ Rate |
Average Balance |
Interest Income/ Expense |
Yield/ Rate |
|||||||||||||||||||
| Assets |
|||||||||||||||||||||||||||
| Interest-earning assets: |
|||||||||||||||||||||||||||
| Loans(1) |
$ | 2,497,377 | $ | 139,808 | 5.60 | % | $ | 2,591,254 | $ | 167,824 | 6.48 | % | $ | 2,259,634 | $ | 172,694 | 7.64 | % | |||||||||
| Securities: |
|||||||||||||||||||||||||||
| Taxable(2) |
574,427 | 26,939 | 4.69 | 552,361 | 28,595 | 5.18 | 381,652 | 19,879 | 5.21 | ||||||||||||||||||
| Tax-exempt |
128,262 | 8,193 | 6.39 | 125,136 | 7,637 | 6.10 | 121,792 | 7,731 | 6.35 | ||||||||||||||||||
| Interest-bearing balances with banks |
90,290 | 230 | 0.25 | 20,651 | 547 | 2.65 | 23,931 | 1,539 | 6.43 | ||||||||||||||||||
| Total interest-earning assets |
3,290,356 | 175,170 | 5.32 | 3,289,402 | 204,603 | 6.22 | 2,787,009 | 201,843 | 7.24 | ||||||||||||||||||
| Cash and due from banks |
52,802 | 74,285 | 69,454 | ||||||||||||||||||||||||
| Intangible assets |
192,321 | 195,252 | 146,175 | ||||||||||||||||||||||||
| Other assets |
168,871 | 147,086 | 130,153 | ||||||||||||||||||||||||
| Total assets |
$ | 3,704,350 | $ | 3,706,025 | $ | 3,132,791 | |||||||||||||||||||||
| Liabilities and shareholders’ equity |
|||||||||||||||||||||||||||
| Interest-bearing liabilities: |
|||||||||||||||||||||||||||
| Deposits: |
|||||||||||||||||||||||||||
| Interest-bearing demand(3) |
$ | 892,545 | 11,874 | 1.33 | $ | 813,628 | 14,476 | 1.78 | $ | 768,597 | 21,610 | 2.81 | |||||||||||||||
| Savings deposits |
91,563 | 154 | 0.17 | 105,281 | 568 | 0.54 | 97,527 | 1,139 | 1.17 | ||||||||||||||||||
| Time deposits |
1,297,685 | 34,680 | 2.67 | 1,276,862 | 48,465 | 3.80 | 1,271,482 | 61,067 | 4.80 | ||||||||||||||||||
| Total interest-bearing deposits |
2,281,793 | 46,708 | 2.05 | 2,195,771 | 63,509 | 2.89 | 2,137,606 | 83,816 | 3.92 | ||||||||||||||||||
| Borrowed funds |
689,020 | 24,390 | 3.54 | 772,952 | 28,011 | 3.62 | 340,084 | 18,566 | 5.46 | ||||||||||||||||||
| Total interest-bearing liabilities |
2,970,813 | 71,098 | 2.39 | 2,968,723 | 91,520 | 3.08 | 2,477,690 | 102,382 | 4.13 | ||||||||||||||||||
| Noninterest-bearing deposits |
299,465 | 292,145 | 279,271 | ||||||||||||||||||||||||
| Other liabilities |
27,894 | 42,132 | 40,915 | ||||||||||||||||||||||||
| Shareholders’ equity |
406,178 | 403,025 | 334,915 | ||||||||||||||||||||||||
| Total liabilities and shareholders’ equity |
$ | 3,704,350 | $ | 3,706,025 | $ | 3,132,791 | |||||||||||||||||||||
| Net interest income/ net interest margin |
$ | 104,072 | 3.16 | % | $ | 113,083 | 3.44 | % | $ | 99,461 | 3.57 | % | |||||||||||||||
| (1) | Includes mortgage loans held for sale and shown net of unearned income. |
| (2) | U.S. Government and some U.S. Government Agency securities are tax-exempt in the states in which we operate. |
| (3) | Interest-bearing demand deposits include interest-bearing transactional accounts and money market deposits. |
The average balances of nonaccruing loans are included in this table. Interest income and weighted average yields on tax-exempt loans and securities have been computed on a fully tax-equivalent basis assuming a federal tax rate of 35% and a state tax rate of 3.3%, which is net of federal tax benefit.
9
Table of Contents
Index to Financial Statements
Table 2 – Volume/Rate Analysis
(In Thousands)
The following table sets forth a summary of the changes in interest earned, on a tax equivalent basis, and interest paid resulting from changes in volume and rates for the Company for the years ended December 31, as indicated:
| 2009 Compared to 2008 | 2008 Compared to 2007 | |||||||||||||||||||||||
| Volume | Rate | Net(1) | Volume | Rate | Net(1) | |||||||||||||||||||
| Interest income: |
||||||||||||||||||||||||
| Loans (2) |
$ | (6,470 | ) | $ | (21,546 | ) | $ | (28,016 | ) | $ | 25,344 | $ | (30,214 | ) | $ | (4,870 | ) | |||||||
| Securities: |
||||||||||||||||||||||||
| Taxable |
1,117 | (2,773 | ) | (1,656 | ) | 8,892 | (176 | ) | 8,716 | |||||||||||||||
| Tax-exempt |
703 | (147 | ) | 556 | 212 | (306 | ) | (94 | ) | |||||||||||||||
| Interest-bearing balances with banks |
1,846 | (2,163 | ) | (317 | ) | (211 | ) | (781 | ) | (992 | ) | |||||||||||||
| Total interest-earning assets |
(2,804 | ) | (26,629 | ) | (29,433 | ) | 34,237 | (31,477 | ) | 2,760 | ||||||||||||||
| Interest expense: |
||||||||||||||||||||||||
| Interest-bearing demand deposits |
1,404 | (4,006 | ) | (2,602 | ) | 1,291 | (8,425 | ) | (7,134 | ) | ||||||||||||||
| Savings deposits |
(74 | ) | (340 | ) | (414 | ) | 91 | (662 | ) | (571 | ) | |||||||||||||
| Time deposits |
791 | (14,576 | ) | (13,785 | ) | 258 | (12,860 | ) | (12,602 | ) | ||||||||||||||
| Borrowed funds |
(3,042 | ) | (579 | ) | (3,621 | ) | 23,630 | (14,185 | ) | 9,445 | ||||||||||||||
| Total interest-bearing liabilities |
(921 | ) | (19,501 | ) | (20,422 | ) | 25,270 | (36,132 | ) | (10,862 | ) | |||||||||||||
| Change in net interest income |
$ | (1,883 | ) | $ | (7,128 | ) | $ | (9,011 | ) | $ | 8,967 | $ | 4,655 | $ | 13,622 | |||||||||
| (1) | Changes in interest due to both volume and rate have been allocated on a pro-rata basis using the absolute ratio value of amounts calculated. |
| (2) | Includes mortgage loans held for sale and shown net of unearned income. |
Table 3 – Investment Portfolio
(In Thousands)
The following table sets forth the scheduled maturity distribution and weighted average yield based on the amortized cost of our investment portfolio as of December 31, 2009. See Note B, “Securities,” in the Notes to Consolidated Financial Statements in Item 8, Financial Statements and Supplementary Data, for information regarding the carrying value of the investment securities listed below as of December 31, 2009, 2008 and 2007.
| One Year or Less | After One Year Through Five Years |
After Five Years Through Ten Years |
After Ten Years | |||||||||||||||||||||
| Amount | Yield | Amount | Yield | Amount | Yield | Amount | Yield | |||||||||||||||||
| Available for Sale: |
||||||||||||||||||||||||
| Obligations of other U.S. Government agencies and corporations |
$ | — | — | $ | 24,489 | 3.16 | % | $ | 33,520 | 3.37 | % | $ | 5,121 | 3.00 | % | |||||||||
| Mortgage-backed securities |
882 | 5.24 | % | 4,555 | 4.65 | % | 52,399 | 4.77 | % | 387,811 | 4.62 | % | ||||||||||||
| Trust preferred securities |
— | — | — | — | — | — | 33,803 | 6.97 | % | |||||||||||||||
| Other equity securities |
— | — | — | — | — | — | 39,971 | 3.15 | % | |||||||||||||||
| $ | 882 | $ | 29,044 | $ | 85,919 | $ | 466,706 | |||||||||||||||||
| Held to Maturity: |
||||||||||||||||||||||||
| Obligations of states and political subdivisions |
$ | 6,479 | 1.47 | % | $ | 42,558 | 2.43 | % | $ | 46,449 | 4.08 | % | $ | 43,320 | 5.61 | % | ||||||||
The maturity of mortgage-backed securities reflects scheduled repayments based upon the contractual maturities of the securities. Weighted average yields on tax-exempt obligations have been computed on a fully tax-equivalent basis assuming a federal tax rate of 35% and a state tax rate of 3.3%, which is net of federal tax benefit.
10
Table of Contents
Index to Financial Statements
Table 4 – Loan Portfolio
(In Thousands)
The following table sets forth loans, net of unearned income, outstanding as of December 31, 2009, which, based on remaining scheduled repayments of principal, are due in the periods indicated. Loans with balloon payments and longer amortizations are often repriced and extended beyond the initial maturity when credit conditions remain satisfactory. Demand loans, loans having no stated schedule of repayments and no stated maturity, and overdrafts are reported below as due in one year or less. For information regarding the loan balances in each of the categories listed below as of the end of each of the last five years, see Item 7, Management’s Discussion and Analysis of Financial Condition and Results of Operations, under the heading “Financial Condition and Results of Operations—Loan and Loan Interest Income.” See “Risk Management—Credit Risk and Allowance for Loan Losses” in Item 7 for information regarding the risk elements applicable to, and a summary of our loan loss experience with respect to, the loans in each of the categories listed below.
| One Year or Less |
After One Year Through Five Years |
After Five Years |
Total | |||||||||
| Commercial, financial, agricultural |
$ | 143,314 | $ | 119,353 | $ | 18,662 | $ | 281,329 | ||||
| Lease financing |
279 | 499 | — | 778 | ||||||||
| Real estate – construction |
25,285 | 101,809 | 6,205 | 133,299 | ||||||||
| Real estate – 1-4 family mortgage |
396,608 | 338,372 | 85,937 | 820,917 | ||||||||
| Real estate – commercial mortgage |
364,338 | 478,060 | 198,191 | 1,040,589 | ||||||||
| Installment loans to individuals |
29,095 | 39,597 | 2,011 | 70,703 | ||||||||
| $ | 958,919 | $ | 1,077,690 | $ | 311,006 | $ | 2,347,615 | |||||
The following table sets forth the fixed and variable rate loans maturing or scheduled to reprice after one year as of December 31, 2009:
| Interest Sensitivity | ||||||
| Fixed Rate |
Variable Rate | |||||
| Due after one year through five years |
$ | 1,010,878 | $ | 66,812 | ||
| Due after five years |
303,088 | 7,918 | ||||
| $ | 1,313,966 | $ | 74,730 | |||
Table 5 – Deposits
(In Thousands)
The following table shows the maturity of certificates of deposit and other time deposits over $100 at December 31, 2009:
| Certificates of Deposit |
Other | |||||
| Three Months or Less |
$ | 104,590 | $ | 2,790 | ||
| Over Three through Six Months |
83,339 | 4,478 | ||||
| Over Six through Twelve Months |
211,938 | 9,064 | ||||
| Over 12 Months |
199,170 | 20,935 | ||||
| $ | 599,037 | $ | 37,267 | |||
11
Table of Contents
Index to Financial Statements
| ITEM 1A. | RISK FACTORS |
In addition to the other information contained in or incorporated by reference into this Form 10-K and the exhibits hereto, the following risk factors should be considered carefully in evaluating our business. The risks disclosed below, either alone or in combination, could materially adversely affect the business, financial condition or results of operations of the Company. Additional risks not presently known to us, or that we currently deem immaterial, may also adversely affect our business, financial condition or results of operations.
Risks Related To Our Business and Industry
Our business may be adversely affected by conditions in the financial markets and economic conditions in general.
Over the past 18 months, the United States economy and the global economy experienced a severe economic downturn. Only in recent months has it appeared that United States and global economic conditions are beginning to improve. Notwithstanding these signs of improvement, business activity across a wide range of industries and regions remains greatly reduced, and local governments and many businesses are in serious difficulty due to the lack of consumer spending and the lack of liquidity in the credit markets. Unemployment has also increased dramatically.
Since mid-2007, and particularly during the second half of 2008, the financial services industry and the securities markets generally were materially and adversely affected by significant declines in the values of nearly all asset classes and by a significant lack of liquidity in the credit markets. This was initially triggered by declines in home prices and the values of subprime mortgages. The global markets have since been characterized by substantially increased volatility and an overall loss of investor confidence, initially in financial institutions, but now in companies in virtually all other industries and in the broader markets.
Declining asset values, defaults on mortgages and consumer loans, and the lack of market and investor confidence, as well as other factors, have all combined to cause rating agencies to lower credit ratings, and to otherwise increase the cost and decrease the availability of liquidity, despite very significant and lasting declines in Federal Reserve borrowing rates and other government actions. As a result of this market volatility, many banks and other institutions have suffered significant losses and have become reluctant to lend, even on a secured basis, due to the increased risk of default and the impact of declining asset values on the value of collateral. This has significantly weakened the strength and liquidity of many financial institutions worldwide, resulting in the failure or near-failure of many institutions. Despite governmental intervention both in the United States and abroad, asset values remain stressed and access to liquidity in the credit markets continues to be restricted.
Our financial performance generally, and in particular the ability of borrowers to pay interest on and repay principal of outstanding loans and the value of collateral securing those loans, is highly dependent upon the business environment in the markets where we operate and in the United States as a whole. We anticipate that the business environment in our markets and the United States as a whole could remain depressed for the foreseeable future, and there remains a significant possibility of further deterioration. In either case, the credit quality of our loans as well as our results of operations and financial condition are likely to be materially and adversely affected.
We believe that the impact of the economic downturn in the United States heightens all of the risk described in the remainder of this Item 1A.
We are subject to lending risk.
There are inherent risks associated with our lending activities. These risks include, among other things, the impact of changes in interest rates and changes in the economic conditions in the markets where we operate as well as those across the United States. Increases in interest rates and/or weakening economic conditions could adversely impact the ability of borrowers to repay outstanding loans or the value of the collateral securing these loans. For the reasons explained below, if current trends in the housing and real estate markets continue, we may experience higher than normal delinquencies and credit losses.
As of December 31, 2009, approximately 61.99% of our loan portfolio consisted of commercial, construction and commercial real estate loans. These types of loans are generally viewed as having more risk to our financial condition than other types of loans due primarily to the large amounts loaned to individual borrowers. Because the loan portfolio contains a significant number of commercial, construction and commercial real estate loans with relatively large balances, the deterioration of one or a few of these loans could cause a significant increase in nonperforming loans. An increase in nonperforming loans could result in a net loss of earnings from these loans, an increase in the provision for possible loan losses and an increase in loan charge-offs, all of which could have a material adverse effect on our financial condition and results of operations.
12
Table of Contents
Index to Financial Statements
Our commercial, construction and commercial real estate loan portfolios are discussed in more detail under the caption “Operations – Operations of the Bank” in Item 1, Business.
We have a high concentration of loans secured by real estate.
Approximately 84.98% of our loan portfolio had real estate as a primary or secondary component of the collateral securing the loan. The real estate provides an alternate source of repayment in the event of a default by the borrower. Over the past two years, United States real estate has experienced a severe decline in value, and it is not clear at this point whether real estate values have begun to stabilize. Although real estates values in the markets in which we operate have not declined as dramatically as in other areas of the United States, any such adverse change in our markets could significantly impair the value of the particular collateral securing our loans and our ability to sell the collateral upon foreclosure for an amount necessary to satisfy the borrower’s obligations to us. Furthermore, in a declining real estate market, we often will need to further increase our allowance for loan losses to address the deterioration in the value of the real estate securing our loans, which was the case in 2009 and 2008. Any of the foregoing could have a material adverse effect on our financial condition and results of operations.
We have a concentration of credit exposure in commercial real estate.
At December 31, 2009, we had approximately $1.0 billion in commercial real estate loans, representing approximately 44.33% of our loans outstanding on that date. In addition to the general risks associated with our lending activities described above, including the effects of declines in real estate values, commercial real estate loans are subject to additional risks. Commercial real estate loans depend on cash flows from the property to service the debt. Cash flows, either in the form of rental income or the proceeds from sales of commercial real estate, may be affected significantly by general economic conditions. A downturn in the local economy generally or in occupancy rates where the property is located could increase the likelihood of default. In addition, in light of the current downturn in United States real estate markets generally, banking regulators are giving commercial real estate lending greater scrutiny and, in some instances, have required banks with higher levels of commercial real estate loans to implement improved underwriting, internal controls, risk management policies and portfolio stress testing, as well as possibly higher levels of allowances for possible losses and capital levels as a result of commercial real estate lending growth and exposure. Any of these factors could have a material adverse effect on our financial condition and results of operations.
We depend on the accuracy and completeness of information furnished by others about customers and counterparties.
In deciding whether to extend credit or enter into other transactions, we often rely on information furnished by or on behalf of customers and counterparties, including financial statements, credit reports and other financial information. We may also rely on representations of those customers, counterparties or other third parties, such as independent auditors, as to the accuracy and completeness of that information. Reliance on inaccurate or misleading financial statements, credit reports or other financial information could have a material adverse effect on our business and, in turn, our financial condition and results of operations.
Our allowance for possible loan losses may be insufficient.
Although we try to maintain diversification within our loan portfolio in order to minimize the effect of economic conditions within a particular industry, management also maintains an allowance for loan losses, which is a reserve established through a provision for loan losses charged to expense, to absorb probable credit losses inherent in the entire loan portfolio. The appropriate level of the allowance is based on management’s ongoing analysis of the loan portfolio and represents an amount that management deems adequate to provide for inherent losses, including collateral impairment. Among other considerations in establishing the allowance for loan losses, management considers economic conditions reflected within industry segments, the unemployment rate in our markets, loan segmentation and historical losses that are inherent in the loan portfolio. The determination of the appropriate level of the allowance for loan losses inherently involves a high degree of subjectivity and requires management to make significant estimates of current credit risks and future trends, all of which may undergo material changes. Changes in economic conditions affecting borrowers, new information regarding existing loans, identification of additional problem loans and other factors, both within and outside of our control, may require an increase in the allowance for loan losses. The economic downturn in the United States has made it more difficult to estimate with precision the extent to which credit risks and future trends need to be addressed through a provision to our allowance for loan losses.
13
Table of Contents
Index to Financial Statements
In addition, bank regulatory agencies periodically review the allowance for loan losses and may require an increase in the provision for loan losses or the recognition of further loan charge-offs, based on judgments different than those of management. In addition, if charge-offs in future periods exceed the allowance for loan losses, we will need additional provisions to increase the allowance for loan losses. Any increases in the allowance for loan losses will result in a decrease in net income and, possibly, capital and may have a material adverse effect on our financial condition and results of operations. A discussion of the policies and procedures related to management’s process for determining the appropriate level of the allowance for loan losses is set forth under the caption “Risk Management – Credit Risk and Allowance for Loan Losses” in Item 7, Management’s Discussion and Analysis of Financial Condition and Results of Operations.
We are subject to interest rate risk.
Our earnings and cash flows are largely dependent upon our net interest income. Net interest income is the difference between interest earned on assets, such as loans and securities, and the cost of interest-bearing liabilities, such as deposits and borrowed funds. Interest rates are highly sensitive to many factors that are beyond our control, including general economic conditions and policies of various governmental and regulatory agencies and, in particular, the Federal Reserve. Currently, to help combat the effects of the economic downturn in the United States, the Federal Reserve has indicated that it is likely to maintain a low interest rate policy with respect to its federal funds target rate for the foreseeable future. Changes in monetary policy, including changes in interest rates, could influence not only the interest we receive on loans and securities and the amount of interest we pay on deposits and borrowings, but such changes could also affect (1) our ability to originate loans and obtain deposits, which could reduce the amount of fee income generated, (2) the fair value of our financial assets and liabilities and (3) the average duration of our mortgage-backed securities portfolio. For example, throughout 2009 higher-fixed rate mortgages have been repaid faster than anticipated as long-term mortgage rates have remained low and borrowers have refinanced into lower rate mortgages. Further, if the interest rates paid on deposits and other borrowings increase at a faster rate than the interest rates received on loans and other investments, our net interest income could be adversely affected, which in turn could negatively affect our earnings. Earnings could also be adversely affected if the interest rates received on loans and other investments fall more quickly than the interest rates paid on deposits and other borrowings.
Although management believes it has implemented effective asset and liability management strategies to reduce the potential effects of changes in interest rates on the results of our operations, any substantial, unexpected, prolonged change in market interest rates could have a material adverse effect on our financial condition and results of operations. Volatility in interest rates may also result in disintermediation, which is the flow of funds away from financial institutions into direct investments, such as U.S. Government and Agency securities and other investment vehicles, including mutual funds, which generally pay higher rates of return than financial institutions because of the absence of federal insurance premiums and reserve requirements. Disintermediation could also result in material adverse effects on our financial condition and results of operations.
A discussion of the policies and procedures used to identify, assess and manage certain interest rate risk is set forth under the caption “Risk Management – Interest Rate Risk” in Item 7, Management’s Discussion and Analysis of Financial Condition and Results of Operations.
Liquidity needs could adversely affect our results of operations and financial condition.
We rely on the dividends from the Bank as our primary source of funds. The primary source of the Bank’s funds are customer deposits and loan repayments. While scheduled loan repayments are a relatively stable source of funds, they are subject to the ability of borrowers to repay the loans. The ability of borrowers to repay loans can be adversely affected by a number of factors, including changes in economic conditions, adverse trends or events affecting business industry groups, reductions in real estate values or markets, business closings or lay-offs, inclement weather, natural disasters and international instability. Many of these conditions have arisen during the current economic downturn. Additionally, deposit levels may be affected by a number of factors, including rates paid by competitors, general interest rate levels, returns available to customers on alternative investments and general economic conditions. Accordingly, we may be required from time to time to rely on secondary sources of liquidity to meet withdrawal demands or otherwise fund operations or to support growth. Such sources include Federal Home Loan Bank advances and federal funds lines of credit from correspondent banks. While we believe that these sources are currently adequate, there can be no assurance they will be sufficient to meet future liquidity demands.
14
Table of Contents
Index to Financial Statements
If the aforementioned sources of liquidity are not adequate for our needs, we may attempt to raise additional capital in the capital markets. Over the past year, major stock market indices have been volatile, and our stock price has been affected as well. Our ability to raise additional capital, if needed, will depend on conditions in such markets at that time, which are outside our control, and on our financial performance. Accordingly, we cannot assure you of our ability to raise additional capital in this manner.
If we are unable to meet our liquidity needs, we may be required to slow or discontinue loan growth, capital expenditures or other investments or liquidate assets.
Our business strategy includes the continuation of growth plans, and our financial condition and results of operations could be negatively affected if we fail to grow or fail to manage our growth effectively.
Since 2004, we have significantly grown our business outside our Mississippi footprint through the acquisition of entire financial institutions and through de novo branching. We intend to continue pursuing a growth strategy for our business through de novo branching. In addition, we expect to continue to evaluate attractive acquisition opportunities that are presented to us. Our prospects must be considered in light of the risks, expenses and difficulties frequently encountered by companies in growth stages of development, including the following:
Management of Growth. We may be unable to successfully:
| • | maintain loan quality in the context of significant loan growth; |
| • | maintain adequate management personnel and systems to oversee such growth; |
| • | maintain adequate internal audit, loan review and compliance functions; and |
| • | implement additional policies, procedures and operating systems required to support such growth. |
Operating Results. There is no assurance that existing offices or future offices will maintain or achieve deposit levels, loan balances or other operating results necessary to avoid losses or produce profits. Our growth and de novo branching strategy necessarily entails growth in overhead expenses as we routinely add new offices and staff. Our historical results may not be indicative of future results or results that may be achieved as we continue to increase the number and concentration of our branch offices. Should any new location be unprofitable or marginally profitable, or should any existing location experience a decline in profitability or incur losses, the adverse effect on our results of operations and financial condition could be more significant than would be the case for a larger company.
Development of Offices. There are considerable costs involved in opening branches, and new branches generally do not generate sufficient revenues to offset their costs until they have been in operation for at least a year or more. Accordingly, our de novo branches can be expected to negatively impact our earnings for some period of time until the branches reach certain economies of scale. Our expenses could be further increased if we encounter delays in opening any of our de novo branches. We may be unable to accomplish future branch expansion plans due to a lack of available satisfactory sites, difficulties in acquiring such sites, increased expenses or loss of potential sites due to complexities associated with zoning and permitting processes, higher than anticipated merger and acquisition costs or other factors. Finally, we have no assurance our de novo branches or branches that we may acquire will be successful even after they have been established or acquired, as the case may be.
Expansion into New Markets. Much of our recent growth, and all of our growth through acquisitions, has been focused in the highly-competitive Memphis and Nashville, Tennessee and Birmingham and Huntsville, Alabama metropolitan markets. The customer demographics and financial services offerings in these markets are unlike those found in the Mississippi markets that we have historically served. In these growth markets we face competition from a wide array of financial institutions, including much larger, well-established financial institutions.
Regulatory and Economic Factors. Our growth and expansion plans may be adversely affected by a number of regulatory and economic developments or other events, including regulatory changes enacted in response to the current economic downturn. Failure to obtain required regulatory approvals, changes in laws and regulations or other regulatory developments and changes in prevailing economic conditions or other unanticipated events may prevent or adversely affect our continued growth and expansion. Such factors may cause us to alter our growth and expansion plans or slow or halt the growth and expansion process, which may prevent us from entering certain target markets or allow competitors to gain or retain market share in our existing or expected markets.
15
Table of Contents
Index to Financial Statements
Failure to successfully address these issues could have a material adverse effect on our financial condition and results of operations, and could adversely affect our ability to successfully implement our business strategy. Also, if our growth occurs more slowly than anticipated or declines, our operating results could be materially adversely affected.
We may face risks with respect to future acquisitions.
When we attempt to expand our business through mergers and acquisitions, we seek partners that are culturally similar to us, have experienced management and possess either significant market presence or have potential for improved profitability through economies of scale or expanded services. Acquiring other banks, businesses or branches involves various risks commonly associated with acquisitions, including, among other things:
| • | the time and costs associated with identifying and evaluating potential acquisition and merger partners; |
| • | inaccuracies in the estimates and judgments used to evaluate credit, operations, management and market risks with respect to the target institution; |
| • | the time and costs of evaluating new markets, hiring experienced local management and opening new bank locations, and the time lags between these activities and the generation of sufficient assets and deposits to support the costs of the expansion; |
| • | our ability to finance an acquisition and possible dilution to our existing shareholders; |
| • | the diversion of our management’s attention to the negotiation of a transaction; |
| • | the incurrence of an impairment of goodwill associated with an acquisition and adverse effects on our results of operations; |
| • | entry into new markets where we lack experience; and |
| • | risks associated with integrating the operations and personnel of the acquired business, which are discussed below. |
We expect to continue to evaluate merger and acquisition opportunities that are presented to us and conduct due diligence activities related to possible transactions with other financial institutions. As a result, merger or acquisition discussions and, in some cases, negotiations may take place and future mergers or acquisitions involving cash, debt or equity securities may occur at any time. Historically, acquisitions of financial institutions have involved the payment of a premium over book and market values. Currently, merger and acquisition activity has been primarily the result of the acquisition of assets and assumption of liabilities from failed financial institutions in which the acquirer enters into an agreement with the FDIC so that the acquirer and the FDIC share in the future losses on the assets acquired. In any merger or acquisition , failure to realize the expected revenue increases, cost savings, increases in geographic or product presence and/or other projected benefits from an acquisition could have a material adverse effect on our financial condition and results of operations.
Details of the 2007 merger with Capital are presented in Note V, “Mergers and Acquisitions,” in the Notes to Consolidated Financial Statements of the Company included in Item 8, Financial Statements and Supplementary Data.
Our integration efforts following any future mergers or acquisitions may not be successful. After giving effect to an acquisition, we may not be able to achieve profits comparable to or better than our historical experience.
The success of any merger or acquisition we enter into will depend primarily on our ability to consolidate operations, systems and procedures and to eliminate redundancies and costs. We may not be able to integrate our operations without encountering difficulties, such as:
| • | the loss of key employees and customers; |
| • | the disruption of our ongoing business and operations; |
| • | our inability to maintain and increase competitive presence; |
| • | deposit attrition and revenue loss; |
| • | possible inconsistencies in standards, controls, procedures and policies; |
| • | unexpected problems with costs, operations, personnel, technology and credit; and/or |
| • | problems with the assimilation of new operations, sites or personnel. |
Additionally, general market and economic conditions or governmental actions affecting the financial industry generally may inhibit our successful integration of operations.
16
Table of Contents
Index to Financial Statements
If we have difficulties with the integration, we might not achieve the economic benefits we expect to result from the merger or acquisition. Failure to achieve these anticipated benefits could result in greater than expected costs, decreases in the amount of expected revenues and diversion of management’s time and energy, all of which could materially impact our business, financial condition and results of operations. In addition, the attention and effort devoted to the integration of an acquired business may divert management’s attention from other important issues and could seriously harm our business. Finally, cost savings from any mergers or acquisitions may be offset by losses in revenues or charges to earnings.
Competition in the banking industry is intense and may adversely affect our profitability.
We face substantial competition in all areas of our operations from a variety of different competitors, many of which are larger and have substantially greater resources than we have, including higher total assets and capitalization, greater access to capital markets and a broader offering of financial services. Such competitors primarily include national, regional and community banks within the various markets in which we operate. We also face competition from many other types of financial institutions, including savings and loans, credit unions, finance companies, brokerage firms, insurance companies, factoring companies and other financial intermediaries. The information under the caption “Competition” in Item 1, Business, provides more information regarding the competitive conditions in our growth markets.
Our industry could become even more competitive as a result of legislative, regulatory and technological changes and continued consolidation. The economic downturn in the United States has already resulted in the consolidation of a number of financial institutions, in addition to acquisitions of failed institutions. We expect additional consolidation to occur. Banks, securities firms and insurance companies can merge under the umbrella of a financial holding company, which can offer virtually any type of financial service, including banking, securities underwriting, insurance (both agency and underwriting) and merchant banking. Also, proposed legislative and regulatory changes on both the federal and state level, if enacted, could materially affect competitive conditions in our industry. Finally, technology has lowered barriers to entry and made it possible for non-banks to offer products and services traditionally provided by banks, such as automatic transfer and automatic payment systems. Many of our competitors have fewer regulatory constraints and may have lower cost structures.
Our ability to compete successfully depends on a number of factors, including, among other things:
| • | the ability to develop, maintain and build upon long-term customer relationships based on top quality service, high ethical standards and safe, sound assets; |
| • | the ability to expand our market position; |
| • | the scope, relevance and pricing of products and services offered to meet customer needs and demands; |
| • | the rate at which we introduce new products and services relative to our competitors; |
| • | customer satisfaction with our level of service; and |
| • | industry and general economic trends. |
Failure to perform in any of these areas could significantly weaken our competitive position, which could adversely affect our growth and profitability, which, in turn, could have a material adverse effect on our financial condition and results of operations.
Our profitability depends significantly on economic conditions in the states of Mississippi, Tennessee and Alabama.
Our success depends primarily on the general economic conditions of the states of Mississippi, Tennessee and Alabama and the specific local markets in which we operate. Unlike larger national or other regional banks that are more geographically diversified, 82% of our loans and 65% of our deposits as of December 31, 2009 were principally located in the Tupelo and Oxford, Mississippi, Memphis (including its suburbs in DeSoto County, Mississippi) and Nashville, Tennessee, and Birmingham, Decatur and Huntsville, Alabama metropolitan areas. Although economic conditions in these areas have not deteriorated as dramatically as in other areas of the United States, economic conditions have declined and could continue to decline. The local economic conditions in these areas have a significant impact on the demand for our products and services as well as the ability of our customers to repay loans, the value of the collateral securing loans and the stability of our deposit funding sources.
Our earnings are significantly affected by general business and economic conditions.
In addition to the risks associated with the general economic conditions in the markets in which we operate, our operations and profitability are also impacted by general business and economic conditions in the United States and
17
Table of Contents
Index to Financial Statements
abroad. These conditions include liquidity in the credit markets, short-term and long-term interest rates, inflation, deflated money supply, political issues, legislative and regulatory changes, fluctuations in both debt and equity capital markets, broad trends in industry and finance and the strength of the U.S. economy and the local economies in which we operate, all of which are beyond our control. The economic downturn that the United States is currently experiencing has resulted in an increase in loan delinquencies and nonperforming assets, decreases in loan collateral values and a decrease in demand for our products and services, among other things, which in turn has had an adverse effect on our financial condition and results of operations. The slow recovery of the United States economy from this downturn is likely to continue to negatively affect our financial condition and results of operations.
We may be adversely affected by the soundness of other financial institutions.
Financial services institutions are interrelated as a result of trading, clearing, counterparty and other relationships. We have exposure to many different industries and counterparties and from time to time execute transactions with counterparties in the financial services industry, including commercial banks, brokers and dealers, investment banks, and other institutional clients. Many of these transactions expose us to credit risk in the event of a default by a counterparty or client. In addition, our credit risk may be exacerbated when the collateral we hold cannot be realized upon or is liquidated at prices not sufficient to recover the full amount of the credit due to us. Any such losses could have a material adverse affect on our financial condition and results of operations.
We are subject to extensive government regulation, and such regulation could limit or restrict our activities and adversely affect our earnings.
We and the Bank are subject to extensive federal and state regulation and supervision. Banking regulations are primarily intended to protect depositors’ funds, federal deposit insurance funds and the banking system as a whole. These regulations affect our lending practices, capital structure, investment practices, dividend policy and growth, among other things. Furthermore, significant changes to the regulations governing banks and other financial institutions have been proposed in light of the recent performance of the financial institutions sector and the events that contributed to such performance. We believe it is likely that some of these proposed changes will be enacted, although it is impossible to predict the ultimate substance of these changes or their likely effect on our activities or profitability. Changes to statutes, regulations or regulatory policies, including changes in interpretation or implementation of the foregoing, could affect us and/or the Bank in substantial and unpredictable ways. Such changes could subject us to additional costs, limit the types of financial services and products we may offer and/or increase the ability of non-banks to offer competing financial services and products, among other things.
Under regulatory capital adequacy guidelines and other regulatory requirements, we and the Bank must meet guidelines that include quantitative measures of assets, liabilities and certain off-balance sheet items, subject to qualitative judgments by regulators about components, risk weightings and other factors. If we fail to meet these minimum capital guidelines and other regulatory requirements, our financial condition would be materially and adversely affected. Our failure to maintain the status of “well capitalized” under our regulatory framework could affect the confidence of our customers in us, thus compromising our competitive position. In addition, failure to maintain the status of “well capitalized” under our regulatory framework or “well managed” under regulatory examination procedures could compromise our status as a bank holding company and related eligibility for a streamlined review process for merger or acquisition proposals and would result in higher deposit insurance premiums assessed by the FDIC.
We are also subject to laws, regulations and standards relating to corporate governance and public disclosure, including the Sarbanes-Oxley Act of 2002 and SEC regulations. These laws, regulations and standards are subject to varying interpretations in many cases, and as a result, their application in practice may evolve over time as new guidance is provided by regulatory and governing bodies, which could result in continuing uncertainty regarding compliance matters and higher costs necessitated by ongoing revisions to disclosure and governance practices. We are committed to maintaining high standards of corporate governance and public disclosure. As a result, our efforts to comply with evolving laws, regulations and standards have resulted in, and are likely to continue to result in, increased expenses and a diversion of management time and attention.
Failure to comply with laws, regulations or policies could also result in sanctions by regulatory agencies and/or civil money penalties, which could have a material adverse effect on our business, financial condition and results of operations. While we have policies and procedures designed to prevent any such violations, there can be no assurance that such violations will not occur. The information under the caption “Supervision and Regulation” in
18
Table of Contents
Index to Financial Statements
Item 1, Business, and Note N, “Regulatory Matters,” in the Notes to Consolidated Financial Statements of the Company in Item 8, Financial Statements and Supplementary Data, provides more information regarding the regulatory environment in which we and the Bank operate.
We may not be able to attract and retain skilled people.
Our success depends in part on our ability to retain key executives and to attract and retain additional qualified personnel who have experience both in sophisticated banking matters and in operating a bank of our size. Competition for such personnel can be intense in the banking industry, and we may not be successful in attracting or retaining the personnel we require. The unexpected loss of one or more of our key personnel could have a material adverse effect on our business because of their skills, knowledge of our markets, years of industry experience and the difficulty of promptly finding qualified replacements. We expect to effectively compete in this area by offering financial packages that are competitive within the industry.
We are subject to environmental liability risk associated with lending activities.
A significant portion of our loan portfolio is secured by real property. During the ordinary course of business, we may foreclose on and take title to properties securing certain loans. In doing so, there is a risk that hazardous or toxic substances could be found on these properties. If hazardous or toxic substances are found, we may be liable for remediation costs, as well as for personal injury and property damage. Environmental laws may require us to incur substantial expenses and may materially reduce the affected property’s value or limit our ability to use or sell the affected property. The remediation costs and any other financial liabilities associated with an environmental hazard could have a material adverse effect on our financial condition and results of operations. In addition, future laws or more stringent interpretations or enforcement policies with respect to existing laws may increase our exposure to environmental liability. Although management has policies and procedures to perform an environmental review before the loan is recorded and before initiating any foreclosure action on real property, these reviews may not be sufficient to detect all potential environmental hazards.
Severe weather, natural disasters, acts of war or terrorism and other external events could significantly impact our business.
Severe weather, natural disasters, acts of war or terrorism and other adverse external events could have a significant impact on our ability to conduct business. Such events could affect the stability of our deposit base, impair the ability of borrowers to repay outstanding loans, impair the value of collateral securing loans, cause significant property damage, result in loss of revenue and/or cause us to incur additional expenses. Although management has established disaster recovery policies and procedures, the occurrence of any such event could have a material adverse effect on our business, which, in turn, could have a material adverse effect on our financial condition and results of operations.
Risks Associated With Our Common Stock
Our stock price can be volatile.
Stock price volatility may make it more difficult for an investor to resell our common stock when desired and at attractive prices. Our stock price can fluctuate significantly in response to a variety of factors including, among other things:
| • | actual or anticipated variations in quarterly results of operations; |
| • | recommendations by securities analysts; |
| • | operating and stock price performance of other companies that investors deem comparable to us; |
| • | news reports relating to trends, concerns and other issues in the banking and financial services industry; |
| • | perceptions in the marketplace regarding us and/or our competitors; |
| • | new technology used, or services offered, by us or our competitors; |
| • | significant acquisitions or business combinations, strategic partnerships, joint ventures or capital commitments by or involving us or our competitors; |
| • | failure to integrate acquisitions or realize anticipated benefits from acquisitions; |
| • | changes in government regulations; and |
| • | geopolitical conditions such as acts or threats of terrorism or military conflicts. |
19
Table of Contents
Index to Financial Statements
General market fluctuations, industry factors and general economic and political conditions and events, such as economic slowdowns or recessions, interest rate changes or credit loss trends, could also cause our stock price to decrease regardless of operating results.
The trading volume in our common stock is less than that of other larger bank holding companies.
Although our common stock is listed for trading on The NASDAQ Global Select Market, the average daily trading volume in our common stock is lower than other publicly traded companies, generally less than that of many of our competitors and other larger bank holding companies. For the three months ended February 28, 2010, the average daily trading volume for Renasant common stock was 76,242 shares per day. A public trading market having the desired characteristics of depth, liquidity and orderliness depends on the presence in the marketplace of willing buyers and sellers of our common stock at any given time. This presence depends on the individual decisions of investors and general economic and market conditions over which we have no control. Significant sales of our common stock, or the expectation of these sales, could cause volatility in the price of our common stock.
Our ability to declare and pay dividends is limited by law, and we may be unable to pay future dividends.
We are a separate and distinct legal entity from the Bank, and we receive substantially all of our revenue from dividends from the Bank. These dividends are the principal source of funds to pay dividends on our common stock and interest and principal on debt. Various federal and/or state laws and regulations limit the amount of dividends that the Bank may pay to us. In the event the Bank is unable to pay dividends to us, we may not be able to service debt, pay obligations or pay dividends on our common stock. The inability to receive dividends from the Bank could have a material adverse effect on our business, financial condition and results of operations. The information under Note M, “Restrictions on Cash, Bank Dividends, Loans or Advances,” in the Notes to Consolidated Financial Statements of the Company in Item 8, Financial Statements and Supplementary Data, provides a detailed discussion about the restrictions governing the Bank’s ability to transfer funds to us.
Holders of our junior subordinated debentures have rights that are senior to those of our common shareholders.
We have supported a portion of our growth through the issuance of trust preferred securities from special purpose trusts and accompanying junior subordinated debentures. Also, in connection with the Heritage Financial Holding Corporation (“Heritage”) and Capital mergers, we assumed junior subordinated debentures issued by Heritage and Capital, respectively. At December 31, 2009, we had trust preferred securities and accompanying junior subordinated debentures with a carrying value of $76 million. Payments of the principal and interest on the trust preferred securities of these trusts are conditionally guaranteed by us. Further, the junior subordinated debentures we issued to the trusts are senior to our shares of common stock. As a result, we must make payments on the junior subordinated debentures before any dividends can be paid on our common stock and, in the event of our bankruptcy, dissolution or liquidation, the holders of the junior subordinated debentures must be satisfied before any distributions can be made on our common stock. We have the right to defer distributions on our junior subordinated debentures (and the related trust preferred securities) for up to five years, during which time no dividends may be paid on our common stock.
An investment in our common stock is not an insured deposit.
Our common stock is not a bank deposit and, therefore, is not insured against loss by the FDIC, any deposit insurance fund or by any other public or private entity. Investment in our common stock is inherently risky for the reasons described in this “Risk Factors” section and elsewhere in this Annual Report on Form 10-K and is subject to the same market forces that affect the price of common stock in any company. As a result, an investor may lose some or all of his investment in our common stock.
Our Articles of Incorporation and Bylaws, as well as certain banking laws, could decrease our chances of being acquired even if our acquisition is in our shareholders’ best interests.
Provisions of our Articles of Incorporation and Bylaws and federal banking laws, including regulatory approval requirements, could make it more difficult for a third party to acquire us, even if doing so would be perceived to be beneficial to our shareholders. The combination of these provisions impedes a non-negotiated merger or other business combination, which, in turn, could adversely affect the market price of our common stock.
Our issuance of preferred stock could adversely affect holders of our common stock and discourage a takeover.
Our shareholders authorized the Board of Directors to issue up to 5,000,000 shares of preferred stock without any further action on the part of our shareholders. Our Board of Directors also has the power, without shareholder
20
Table of Contents
Index to Financial Statements
approval, to set the terms of any series of preferred stock that may be issued, including voting rights, dividend rights, preferences over our common stock with respect to dividends or in the event of a dissolution, liquidation or winding up and other terms. In the event that we issue preferred stock in the future that has preference over our common stock with respect to payment of dividends or upon our liquidation, dissolution or winding up, or if we issue preferred stock with voting rights that dilute the voting power of our common stock, the rights of the holders of our common stock or the market price of our common stock could be adversely affected. In addition, the ability of our Board of Directors to issue shares of preferred stock without any action on the part of our shareholders may impede a takeover of us and prevent a transaction perceived to be favorable to our shareholders.
| ITEM 1B. | UNRESOLVED STAFF COMMENTS |
None.
| ITEM 2. | PROPERTIES |
The main office of the Company is located at 209 Troy Street, Tupelo, Mississippi. Various departments occupy each floor of the five-story building. The Technology Center, also located in Tupelo, houses electronic data processing, document preparation, document imaging, loan servicing and deposit operations. In addition, the Bank operates forty-two branches and one financial services office throughout north and north central Mississippi, ten branches throughout west and middle Tennessee, and nine branches throughout north and north central Alabama.
In Mississippi, the Bank has seven branches in Tupelo, three branches in Booneville, two branches each in Amory, Corinth, Oxford, Pontotoc and West Point and one branch each in Aberdeen, Batesville, Belden, Calhoun City, Coffeeville, Grenada, Guntown, Hernando, Horn Lake, Iuka, Louisville, New Albany, Okolona, Olive Branch, Saltillo, Sardis, Shannon, Smithville, Southaven, Verona, Water Valley and Winona. The Bank operates one financial services office in Tupelo.
In Tennessee, the Bank operates ten branches, three branches in the Memphis area and seven branches in the Nashville area. In Memphis, the Bank operates one branch each in East Memphis, Germantown and Collierville. In Nashville, the Bank operates three branches within the city of Nashville and one branch each in Franklin, Goodlettsville, Hendersonville and Hermitage.
In Alabama, the Bank has three branches in Decatur, three branches in Birmingham and one branch each in Huntsville, Madison and Trussville.
Renasant Insurance has one office each in Corinth, Louisville and Tupelo, Mississippi.
The Bank owns the Company’s main office located at 209 Troy Street, Tupelo, Mississippi as well as forty-one of the Mississippi branch office sites and financial services centers. The Bank leases three locations in Mississippi for use in conducting banking activities as well as various storage facilities. In Tennessee, the Bank owns four branch office sites. The remaining six branch office sites as well as storage facilities in Tennessee are leased. In Alabama, the Bank owns two of the branch office sites in Decatur and leases seven office sites for conducting banking activities. Renasant Insurance owns each of the three locations for conducting its business. The aggregate annual rental for all leased premises during the year ending December 31, 2009 was $1.8 million. None of our properties are subject to any material encumbrances.
| ITEM 3. | LEGAL PROCEEDINGS |
There are no material pending legal proceedings to which the Company, the Bank, Renasant Insurance or any other subsidiaries are a party or to which any of their property is subject, and no such legal proceedings were terminated in the fourth quarter of 2009.
| ITEM 4. | [RESERVED] |
21
Table of Contents
Index to Financial Statements
| ITEM 5. | MARKET FOR REGISTRANT’S COMMON EQUITY, RELATED STOCKHOLDER MATTERS AND ISSUER PURCHASES OF EQUITY SECURITIES |
Market Information and Dividends
The Company’s common stock trades on The NASDAQ Global Select Market (“NASDAQ”) under the ticker symbol “RNST.” On February 26, 2010, the Company had approximately 6,900 shareholders of record and the closing sales price of the Company’s common stock was $15.26. The following table sets forth the high and low sales price for the Company’s common stock for each quarterly period for the fiscal years ended December 31, 2009 and 2008 as reported on NASDAQ, and the amount of cash dividends declared during each quarterly period during such fiscal years:
| Dividends | Prices | ||||||||
| Per Share | Low | High | |||||||
| 2009 |
|||||||||
| 1st Quarter |
$ | 0.170 | $ | 7.80 | $ | 17.37 | |||
| 2nd Quarter |
0.170 | 11.59 | 16.66 | ||||||
| 3rd Quarter |
0.170 | 12.25 | 16.19 | ||||||
| 4th Quarter |
0.170 | 12.81 | 15.12 | ||||||
| 2008 |
|||||||||
| 1st Quarter |
$ | 0.170 | $ | 16.96 | $ | 23.30 | |||
| 2nd Quarter |
0.170 | 14.60 | 24.28 | ||||||
| 3rd Quarter |
0.170 | 13.87 | 26.00 | ||||||
| 4th Quarter |
0.170 | 15.00 | 22.00 | ||||||
The Company declares dividends on a quarterly basis. Funds for the payment of cash dividends are obtained from dividends received by the Company from the Bank. Accordingly, the declaration and payment of cash dividends by the Company depends upon the Bank’s earnings, financial condition, general economic conditions, compliance with regulatory requirements and other factors. Restrictions on the Bank’s ability to transfer funds to the Company in the form of cash dividends exist under federal and state law and regulations. See Note M, “Restrictions on Cash, Bank Dividends, Loans or Advances,” in the Notes to Consolidated Financial Statements of the Company in Item 8, Financial Statements and Supplementary Data, for a discussion of these restrictions. There restrictions do not, and are not expected in the future to, materially limit the Company’s ability to pay dividends to its shareholders in an amount consistent with the Company’s history of dividend payments.
Please refer to the information under “Equity Compensation Plan Information” in Item 12, Security Ownership of Certain Beneficial Owners and Management and Related Stockholder Matters, for a discussion of the securities authorized for issuance under the Company’s equity compensation plans.
Issuer Purchases of Equity Securities
The Company did not repurchase any of its outstanding equity securities during the three month period ended December 31, 2009.
22
Table of Contents
Index to Financial Statements
Stock Performance Graph
The following performance graph compares the performance of our common stock to the NASDAQ Market Index and to two peer groups of regional southeast bank holding companies (each of which includes the Company) for our reporting period. The performance graph assumes that the value of the investment in our common stock, the NASDAQ Market Index and the peer groups of regional southeast bank holding companies was $100 at December 31, 2004, and that all dividends were reinvested.
Total Return Performance
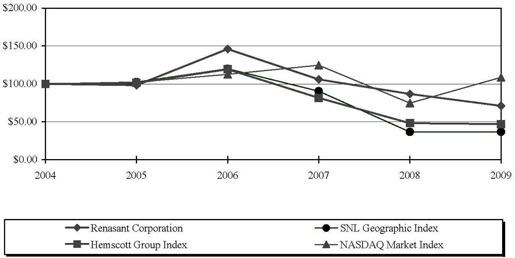
| Period Ending December 31, | ||||||||||||||||||
| 2004 | 2005 | 2006 | 2007 | 2008 | 2009 | |||||||||||||
| Renasant Corporation |
$ | 100.00 | $ | 98.26 | $ | 146.03 | $ | 105.91 | $ | 86.72 | $ | 72.84 | ||||||
| SNL Geographic Index(1) |
100.00 | 102.36 | 120.03 | 90.42 | 36.60 | 36.75 | ||||||||||||
| Hemscott Industry Group(2) |
100.00 | 101.26 | 119.31 | 81.54 | 48.16 | 46.90 | ||||||||||||
| NASDAQ Market Index |
100.00 | 102.20 | 112.68 | 124.57 | 74.71 | 108.56 | ||||||||||||
| (1) | The SNL Geographic Index, Southeast Banks, is a peer group of 109 regional bank holding companies, whose common stock is traded either on the New York Stock Exchange, NYSE Amex or NASDAQ, and who are headquartered in Alabama, Arkansas, Florida, Georgia, Mississippi, North Carolina, South Carolina, Tennessee, Virginia and West Virginia. |
| (2) | The Hemscott Industry Group, Regional – Southeast Banks, is a peer group of 75 regional bank holding companies located in the southeast area of the United States. |
With respect to the SNL Geographic Index and the Hemscott Industry Group, in future years we expect to discontinue the use of the Hemscott Industry Group and use only the SNL Geographic Index in order to minimize the costs associated with compiling our stock performance graph. We believe that the SNL Geographic Index provides a peer group comparison that is substantially equivalent to the comparison the Hemscott Industry Group provides.
There can be no assurance that our common stock performance will continue in the future with the same or similar trends depicted in the performance graph above. We will not make or endorse any predictions as to future stock performance. The information provided under the caption “Stock Performance Graph” shall not be deemed to be “soliciting material” or to be “filed” with the SEC or subject to its proxy regulations or to the liabilities of Section 18 of the Securities Exchange Act of 1934, as amended, other than as provided in Item 201 of Regulation S-K. The information provided in this section shall not be deemed to be incorporated by reference into any filing under the Securities Act of 1933, as amended, or the Securities Exchange Act of 1934, as amended.
23
Table of Contents
Index to Financial Statements
| ITEM 6. | SELECTED FINANCIAL DATA(1)(2) |
(In Thousands, Except Share Data) (Unaudited)
| Year ended December 31, | 2009 | 2008 | 2007 | 2006 | 2005 | |||||||||||||||
| Interest income |
$ | 170,564 | $ | 200,962 | $ | 198,203 | $ | 154,293 | $ | 128,389 | ||||||||||
| Interest expense |
71,098 | 91,520 | 102,382 | 70,230 | 47,963 | |||||||||||||||
| Provision for loan losses |
26,890 | 22,804 | 4,838 | 2,408 | 2,990 | |||||||||||||||
| Noninterest income |
57,558 | 54,042 | 52,187 | 45,943 | 40,216 | |||||||||||||||
| Noninterest expense |
105,753 | 107,968 | 98,000 | 89,006 | 83,940 | |||||||||||||||
| Income before income taxes |
24,381 | 32,712 | 45,170 | 38,592 | 33,712 | |||||||||||||||
| Income taxes |
5,863 | 8,660 | 14,069 | 11,467 | 9,503 | |||||||||||||||
| Net income |
$ | 18,518 | $ | 24,052 | $ | 31,101 | $ | 27,125 | $ | 24,209 | ||||||||||
| Per Common Share |
||||||||||||||||||||
| Net income – Basic |
$ | 0.88 | $ | 1.15 | $ | 1.66 | $ | 1.75 | $ | 1.56 | ||||||||||
| Net income – Diluted |
0.87 | 1.14 | 1.64 | 1.71 | 1.54 | |||||||||||||||
| Book value at December 31 |
19.45 | 19.00 | 19.15 | 16.27 | 15.22 | |||||||||||||||
| Closing price(3) |
13.60 | 17.03 | 21.57 | 30.63 | 21.09 | |||||||||||||||
| Cash dividends declared and paid |
0.680 | 0.680 | 0.660 | 0.627 | 0.580 | |||||||||||||||
| At December 31, |
||||||||||||||||||||
| Assets |
$ | 3,641,081 | $ | 3,715,980 | $ | 3,612,287 | $ | 2,611,356 | $ | 2,397,702 | ||||||||||
| Loans, net of unearned income |
2,347,615 | 2,530,886 | 2,586,593 | 1,826,762 | 1,646,223 | |||||||||||||||
| Securities |
714,164 | 695,106 | 539,590 | 428,065 | 399,034 | |||||||||||||||
| Deposits |
2,576,100 | 2,344,331 | 2,547,821 | 2,108,965 | 1,868,451 | |||||||||||||||
| Borrowings |
618,024 | 933,976 | 624,388 | 216,423 | 266,505 | |||||||||||||||
| Shareholders’ equity |
410,122 | 400,371 | 399,073 | 252,704 | 235,440 | |||||||||||||||
| Selected Ratios |
||||||||||||||||||||
| Return on average: |
||||||||||||||||||||
| Total assets |
0.50 | % | 0.65 | % | 0.99 | % | 1.08 | % | 1.03 | % | ||||||||||
| Shareholders’ equity |
4.56 | % | 5.97 | % | 9.29 | % | 11.00 | % | 10.29 | % | ||||||||||
| Average shareholders’ equity to average assets |
10.96 | % | 10.87 | % | 10.69 | % | 9.83 | % | 10.00 | % | ||||||||||
| At December 31, |
||||||||||||||||||||
| Shareholders’ equity to assets |
11.26 | % | 10.77 | % | 11.05 | % | 9.67 | % | 9.82 | % | ||||||||||
| Allowance for loan losses to total loans, net of unearned income |
1.67 | % | 1.38 | % | 1.02 | % | 1.07 | % | 1.12 | % | ||||||||||
| Allowance for loan losses to nonperforming loans |
78.25 | % | 87.45 | % | 162.02 | % | 173.05 | % | 291.94 | % | ||||||||||
| Nonperforming loans to total loans, net of unearned income |
2.13 | % | 1.58 | % | 0.63 | % | 0.62 | % | 0.38 | % | ||||||||||
| Dividend payout |
78.16 | % | 59.65 | % | 40.24 | % | 36.67 | % | 37.66 | % | ||||||||||
| (1) | Selected consolidated financial data includes the effect of mergers from the date of each merger. On July 1, 2007, the Company completed the merger with Capital Bancorp, Inc. of Nashville, Tennessee. Refer to Item 1, Business, and Note V, “Mergers and Acquisitions,” in the Notes to Consolidated Financial Statements in Item 8, Financial Statements and Supplementary Data, for additional information about the Capital Bancorp, Inc. merger. |
| (2) | Per share information listed above has been restated to reflect the three-for-two stock split effected in the form of a stock dividend on August 28, 2006. Please refer to Item 7, Management’s Discussion and Analysis of Financial Condition and Results of Operations, for a discussion of the financial data discussed above. |
| (3) | Reflects the closing price on the NASDAQ Global Select Market at December 31, 2009, 2008, 2007 and 2006, and on the NASDAQ National Market at December 31, 2005. |
24
Table of Contents
Index to Financial Statements
| ITEM 7. | MANAGEMENT’S DISCUSSION AND ANALYSIS OF FINANCIAL CONDITION AND RESULTS OF OPERATIONS |
(In Thousands, Except Share Data)
Performance Overview
Net income was $18,518 for 2009 compared to $24,052 for 2008 and $31,101 for 2007. The decline in net income since 2007 was influenced by a number of factors:
| • | Net interest income decreased 9.12% to $99,466 for 2009 as compared to $109,442 for 2008 and increased as compared to $95,821 for 2007. Interest income decreased 15.13% to $170,564 for 2009 from $200,962 for 2008 and $198,203 for 2007. Interest expense decreased 22.31% to $71,098 for 2009 compared to $91,520 for 2008 and $102,382 for 2007. |
| • | Net charge-offs as a percentage of average loans increased to 0.91% in 2009 compared to 0.55% in 2008 and 0.14% in 2007. The provision for loan losses was $26,890 for 2009 compared to $22,804 for 2008 and $4,838 for 2007. |
| • | Noninterest income continued to be a stable source of revenue as noninterest income increased to $57,558 for 2009 compared to $54,042 for 2008 and $52,187 for 2007. |
| • | Noninterest expenses were $105,753 for 2009 compared to $107,968 for 2008 and $98,000 for 2007. |
| • | Loans, net of unearned income, totaled $2,347,615 at December 31, 2009 while deposits totaled $2,576,100 at December 31, 2009. |
A historical look at key performance indicators is presented below.
| 2009 | 2008 | 2007 | 2006 | 2005 | ||||||||||||||||
| Diluted EPS |
$ | 0.87 | $ | 1.14 | $ | 1.64 | $ | 1.71 | $ | 1.54 | ||||||||||
| Diluted EPS Growth |
(23.68 | )% | (30.49 | )% | (4.09 | )% | 11.04 | % | 8.45 | % | ||||||||||
| Return on Average Assets |
0.50 | % | 0.65 | % | 0.99 | % | 1.08 | % | 1.03 | % | ||||||||||
| Return on Average Shareholders’ Equity |
4.56 | % | 5.97 | % | 9.29 | % | 11.00 | % | 10.29 | % | ||||||||||
Certain markets in which we operate have demographics which we believe indicate the possibility of future growth at higher rates than other markets in which we operate. These markets are: Tupelo, Oxford and DeSoto County, Mississippi; Birmingham, Decatur and Huntsville/Madison, Alabama; and Germantown, Collierville, Memphis/Cordova, Tennessee, and the Nashville-Davidson-Murfreesboro, Tennessee Metropolitan Statistical Area. We have identified these markets as key growth markets, and when we refer in this item to “our key markets,” we are referring to such markets.
We expect future loan growth to come primarily from our key markets. It is our strategy to fund this loan growth with deposits throughout all of our markets. While we believe future deposit growth will come primarily from these key markets, deposits outside of these key markets remain valuable to us given the low cost of such deposits relative to the cost of deposits in our key markets.
Critical Accounting Policies
Our financial statements are prepared using accounting estimates for various accounts. Wherever feasible, we utilize third-party information to provide management with estimates. Although independent third parties are engaged to assist us in the estimation process, management evaluates the results, challenges assumptions used and considers other factors which could impact these estimates. We monitor the status of proposed and newly issued accounting standards to evaluate the impact on our financial condition and results of operations. The impact of newly issued accounting standards is discussed in further detail in Note A, “Significant Accounting Policies,” in the Notes to Consolidated Financial Statements in Item 8, Financial Statements and Supplementary Data. The following discussion presents some of the more significant estimates used in preparing our financial statements.
Allowance for Loan Losses
The critical accounting policy most important to the presentation of our financial statements relates to the allowance for loan losses and the related provision for loan losses. The allowance for loan losses is available to absorb
25
Table of Contents
Index to Financial Statements
probable credit losses inherent in the entire loan portfolio. The appropriate level of the allowance is based on an ongoing analysis of the loan portfolio and represents an amount that management deems adequate to provide for inherent losses, including collective impairment as recognized under the Financial Accounting Standards Board Accounting Standards Codification Topic (“ASC”) 450, “Contingencies” (“ASC 450”). Collective impairment is calculated based on loans grouped by grade. Another component of the allowance is losses on loans assessed as impaired under ASC 310, “Receivables” (“ASC 310”). The balance of the loans determined to be impaired under ASC 310 and the related allowance is included in management’s estimation and analysis of the allowance for loan losses. The determination of the appropriate level of the allowance is sensitive to a variety of internal factors, primarily historical loss ratios and assigned risk ratings, and external factors, primarily the economic environment. Additionally, the estimate of the allowance required to absorb credit losses in the entire portfolio may change due to shifts in the mix and level of loan balances outstanding and in prevailing economic conditions, as evidenced by changes in real estate demand and values, interest rates, unemployment rates and energy costs. While no one factor is dominant, each could cause actual loan losses to differ materially from originally estimated amounts. For a discussion of other considerations in establishing the allowance for loan losses and our loan policies and procedures for addressing credit risk, please refer to the disclosures in this Item under the heading “Risk Management – Credit Risk and Allowance for Loan Losses.”
Certain loans acquired in the mergers with Capital Bancorp, Inc. (“Capital”) and Heritage Financial Holding Corporation (“Heritage”) are accounted for under ASC 310-30, “Loans and Debt Securities Acquired with Deteriorated Credit Quality” (“ASC 310-30”). ASC 310-30 prohibits the carryover of an allowance for loan losses for loans acquired in which the acquirer concludes that it will not collect the contractual amount. As a result, these loans are carried at values which represent management’s estimate of the future cash flow of these loans. Increases in expected cash flows to be collected from the contractual cash flows are required to be recognized as an adjustment of the loan’s yield over its remaining life, while decreases in expected cash flows are required to be recognized as an impairment. A more detailed discussion of loans accounted for under ASC 310-30 resulting from the Capital and Heritage mergers is set forth below under the heading “Risk Management – Credit Risk and Allowance for Loan Losses” and in Note C, “Loans and the Allowance for Loan Losses,” in the Notes to Consolidated Financial Statements in Item 8, Financial Statements and Supplementary Data.
Intangible Assets
Our intangible assets consist primarily of goodwill and core deposit intangibles. Goodwill arises from business combinations and represents the value attributable to unidentifiable intangible elements of the business acquired. Our reporting units are comprised of the operations we have acquired. Specifically, our reporting units are broken out into four geographic units of our bank and our insurance company. We review the goodwill of each reporting unit for impairment on an annual basis, or more often, if events or circumstances indicate that it is more likely than not that the fair value of the reporting unit is below the carrying value of its equity. In determining the fair value of our reporting units, we used discounted cash flow analyses, which require assumptions about short and long-term net cash flow growth rates for each reporting unit, as well as discount rates. We assess the reasonableness of the estimated fair value of the reporting units by reference to our market capitalization; however, due to the significant volatility in the equity markets with respect to financial institution sector throughout 2009, we also consulted supplemental information based on observable market multiples, adjusting to reflect our specific factors, as well as current market conditions.
Long-term net cash flow forecasts are developed for each reporting unit by considering several key business drivers such as new business initiatives, market share changes, anticipated loan and deposit growth, historical performance, and industry and economic trends, among other considerations. The long-term growth rate used in determining the terminal value of each reporting unit was estimated at 3% in 2009 based on management’s assessment of the minimum expected terminal growth rate of each reporting unit, as well as broader economic considerations. In 2009, the discount rate used was 12%.
The estimated fair value of a reporting unit is highly sensitive to changes in the estimates and assumptions. In some instances changes in these assumptions could impact whether the fair value of a reporting unit is greater than its carrying value. We perform sensitivity analyses around these assumptions in order to assess the reasonableness of the assumptions and the resulting estimated fair values. If the carrying value of a reporting unit’s equity exceeds its estimated fair value, we then calculate the fair value of the reporting unit’s implied goodwill. Implied goodwill is the excess fair value of a reporting unit (as determined using the above-described methodology) over the fair value of its net assets and is calculated by determining fair value of the reporting unit’s assets and liabilities, including
26
Table of Contents
Index to Financial Statements
previously unrecognized intangible assets, on an individual basis. This calculation is performed in the same manner as goodwill is recognized in a business combination. Significant judgment and estimates are involved in estimating the fair value of the assets and liabilities of the reporting unit.
Other identifiable intangible assets, primarily core deposit intangibles, are reviewed at least annually for events or circumstances which could impact the recoverability of the intangible asset, such as loss of core deposits, increased competition or adverse changes in the economy. To the extent an other identifiable intangible asset is deemed unrecoverable, an impairment loss would be recorded as a noninterest expense to reduce the carrying amount. These events or circumstances, when or if they occur, could be material to our operating results for any particular reporting period.
Benefit Plans and Stock Based Compensation
Our independent actuary firm prepares actuarial valuations of our pension cost under ASC 715, “Compensation – Retirement Benefits” (“ASC 715”). The discount rate utilized in the December 31, 2009 valuation was 6.00%, compared to 6.25% in 2008. Actual plan assets as of December 31, 2009 were used in the calculation and the expected long-term return on plan assets assumed for this valuation was 8.00%. Actual return on plan assets during 2009 approximated 18.10%. Changes in these assumptions and estimates can materially affect the benefit plan obligation and the funded status of the plan which in turn may impact shareholders’ equity through an adjustment to accumulated other comprehensive income and future pension expense. The pension plan covered under ASC 715 was frozen as of December 31, 1996.
The Company recognizes compensation expense for all share-based payments to employees in accordance with ASC 718, “Compensation – Stock Compensation.” We utilize the Black-Scholes model for determining fair value of our options. Determining the fair value of, and ultimately the expense we recognize related to, our stock options requires us to make assumptions regarding dividend yields, expected stock price volatility, estimated forfeitures and the expected life of the option. Changes in these assumptions and estimates can materially affect the calculated fair value of stock-based compensation and the related expense to be recognized. Due to the low historical forfeiture rate, the Company has not estimated any forfeitures in determining the fair value of options granted in 2009, 2008 and 2007. Changes in this assumption in the future could result in lower expenses related to the Company’s stock option. For a description of our assumptions utilized in calculating the fair value of our share-based payments, please refer to Note L, “Employee Benefit and Deferred Compensation Plans,” in the Notes to Consolidated Financial Statements in Item 8, Financial Statements and Supplementary Data.
Income Taxes
Accrued taxes represent the estimated amount payable to or receivable from taxing jurisdictions, either currently or in the future, and are reported, on a net basis, as a component of “Other assets” in the Consolidated Balance Sheets. The calculation of our income tax expense is complex and requires the use of many estimates and judgments in its determination.
Management’s determination of the realization of the net deferred tax asset is based upon management’s judgment of various future events and uncertainties, including the timing and amount of future income earned by certain subsidiaries and the implementation of various tax plans to maximize realization of the deferred tax asset. Management believes that the Company and its subsidiaries will generate sufficient operating earnings to realize the deferred tax assets.
For certain business plans enacted by the Company, management bases the estimates of related tax liabilities on its belief that future events will validate management’s current assumptions regarding the ultimate outcome of tax-related exposures. As part of this process, management consults with its outside advisers to assess the relative merits and risks of our proposed tax treatment of such business plans. Although we have received from these outside advisers opinions that our proposed tax treatment should prevail, the examination of our income tax returns, changes in tax law and regulatory guidance may impact the tax treatment of these transactions and resulting provisions for income taxes.
We believe we employ appropriate methods for these calculations and that the results of such calculations closely approximate the actual cost. We review the calculated results for reasonableness and compare those calculations to prior period costs. We also consider the effect of current economic conditions on the calculations.
27
Table of Contents
Index to Financial Statements
Financial Condition and Results of Operations
Net Income
Net income for the year ended December 31, 2009 was $18,518, which represents a decrease of $5,534, or 23.01%, from net income of $24,052 for the year ended December 31, 2008. Basic earnings per share decreased $.27 to $.88 for the year ended December 31, 2009 as compared to $1.15 for the prior year. Diluted earnings per share decreased $.27 to $.87 for the year ended December 31, 2009 as compared to $1.14 for the prior year. The decrease in earnings per share in 2009 as compared to 2008 is due primarily to the current economic environment which has resulted in lower net interest income and higher loan loss provisions.
Net income for the year ended December 31, 2008 was $24,052, which represents a decrease of $7,049, or 22.66%, from net income of $31,101 for the year ended December 31, 2007. Basic earnings per share decreased $.51 to $1.15 for the year ended December 31, 2008 as compared to $1.66 for the prior year. Diluted earnings per share decreased $.50 to $1.14 for the year ended December 31, 2008 as compared to $1.64 for the prior year. The decrease in net income and earnings per share was primarily attributable to an increase in the provision for loan losses for 2008 as compared to 2007. Earnings per share were further negatively impacted by the dilutive effect of the 5.56 million shares issued during July 2007 in connection with our acquisition of Capital and the related equity offering completed in June 2007 that were outstanding for all of 2008.
Net Interest Income
Net interest income, the difference between interest earned on assets and the cost of interest-bearing liabilities, is the largest component of our net income, comprising 64.39% of total net revenue in 2009. Total net revenue consists of net interest income on a fully taxable equivalent basis and noninterest income. The primary concerns in managing net interest income are the mix and the repricing of rate-sensitive assets and liabilities.
Net interest income decreased 9.12% to $99,466 for 2009 compared to $109,442 for the same period in 2008. On a tax equivalent basis, net interest income declined $9,011 to $104,072 in 2009 as compared to $113,083 in 2008. Of the decrease in net interest income, the decrease due to the decline in the volume of net earning assets was $1,883, while the decrease from the declining interest rate environment was $7,128.
| Net Interest Margin – Tax Equivalent | ||||
| 2009 |
2008 |
2007 | ||
| 3.16% |
3.44% | 3.57% | ||
Net interest margin, the tax equivalent net yield on earning assets, decreased to 3.16% during 2009 from 3.44% in the prior year. Net interest margin and net interest income are influenced by several factors, primarily changes in interest rates, competition and the shape of the interest rate yield curve. Significant reductions in interest rate indices throughout 2008 had a negative impact on net interest margin in 2009. With each rate reduction in rate indices, specifically, the prime rate, rates paid on U.S. Treasury securities and the London Interbank Offering Rate (“LIBOR”), the yield on our variable rate loans indexed to these indices decreased. At the same time, competitive and market-wide liquidity factors prevented the cost of funding sources, particularly deposits, from declining proportionately. As a result, net interest margin declined. Increased liquidity due to deposit growth, coupled with loan paydowns and higher than anticipated prepayment speeds within our investment portfolio, resulted in changes in the mix of our earning assets. These changes also had a negative impact on net interest margin. We currently intend to keep these excess funds in interest-bearing balances with banks until they are utilized in future quarters to fund loan growth, purchase investment securities or pay off borrowings. Not only do interest-bearing balances with banks typically pay a lower rate than the rates paid on investment securities and loans, but the rate has also been more sensitive to the decline in the interest rate environment as the average rate paid on such balances for 2009 was 0.25% compared to 2.65% for the same period in 2008. In addition, higher levels of nonaccrual loans during 2009 as compared to 2008 had a further negative impact on net interest margin in 2009.
Interest income, on a tax equivalent basis, was $175,170 for 2009 compared to $204,603 for 2008. The decrease in interest income was driven primarily by a decline in the yield on interest-earning assets as the tax equivalent yield on interest-earning assets decreased 90 basis points during 2009. Although the average balance of interest-earning assets increased slightly during 2009 as compared to 2008, the change in the mix of interest-earning assets further contributed to the decline in net interest income.
28
Table of Contents
Index to Financial Statements
The following table presents the percentage of total average earning assets, by type and yield, for 2009, 2008 and 2007:
| Percentage of Total | Yield | |||||||||||||||||
| 2009 | 2008 | 2007 | 2009 | 2008 | 2007 | |||||||||||||
| Loans |
75.90 | % | 78.78 | % | 81.08 | % | 5.60 | % | 6.48 | % | 7.64 | % | ||||||
| Securities |
21.36 | 20.60 | 18.06 | 5.00 | 5.35 | 5.48 | ||||||||||||
| Other |
2.74 | 0.62 | 0.86 | 0.25 | 2.65 | 6.43 | ||||||||||||
| Total earning assets |
100.00 | % | 100.00 | % | 100.00 | % | 5.32 | % | 6.22 | % | 7.24 | % | ||||||
Interest expense was $71,098 for 2009, a decrease of $20,422, or 22.31% as compared to 2008. The decrease in interest expense was due to the decrease in the cost of interest bearing liabilities as a result of the declining interest rate environment and a change in the mix of our interest bearing liabilities in which we utilized lower cost deposits to replace higher costing liabilities. The cost of interest bearing liabilities was 2.39% for 2009 as compared to 3.08% for 2008 while the average balance of interest bearing liabilities increased slightly to $2,970,813 for 2009 compared to $2,968,723 in 2008.
Net interest income on a tax equivalent basis increased $13,622 to $113,083 in 2008 from $99,461 in 2007. Of the tax equivalent increase, an increase of $8,967 was due to the favorable growth in the volume of net earning assets while changes in interest rates resulted in an increase of $4,655 due to management’s ability to take advantage of lower deposit costs and use lower costing alternative funding sources, which offset reductions in interest income due to changes in the interest rate environment. Interest income, on a tax equivalent basis, grew to $204,603 for 2008 from $201,843 for 2007. The growth in interest income was driven primarily by volume, as the average balance in interest-earning assets increased $502,393 during 2008, while the tax equivalent yield on earning assets decreased 102 basis points to 6.22%. The full year impact of the Capital acquisition and purchase of investment securities during 2008 were the primary reason for the increase in the average balance of interest-earning assets. The reduction in interest rates which began in 2007 and continued through 2008 was the primary reason for the reduction in the yield of earnings assets. Interest expense for 2008 was $91,520 as compared to $102,382 for 2007. The average balance of interest bearing liabilities increased $491,033 to $2,968,723 during 2008 as compared to the average balance for 2007. The full year impact of the Capital acquisition was the primary reason for the increase in the average balance of interest-bearing liabilities in 2008. The cost of interest-bearing liabilities decreased from 4.13% in 2007 to 3.08% in 2008, or 105 basis points.
| Average Earning Assets to Total Average Assets | ||||
| 2009 |
2008 |
2007 | ||
| 88.82% |
88.76% | 88.96% | ||
Average earning assets as a percentage of total average assets are shown above for the years ended December 31, 2009, 2008 and 2007. The tax equivalent yields on earning assets were 5.32%, 6.22% and 7.24% for 2009, 2008 and 2007, respectively.
Loans and Loan Interest Income
Loans, excluding mortgage loans held for sale, are the Company’s most significant earning asset, comprising 64.48%, 68.11% and 71.61% of total assets at December 31, 2009, 2008 and 2007, respectively. The table below sets forth the balance of loans outstanding by loan type at December 31:
| 2009 | 2008 | 2007 | 2006 | 2005 | |||||||||||
| Commercial, financial, agricultural |
$ | 281,329 | $ | 312,648 | $ | 317,866 | $ | 236,741 | $ | 226,203 | |||||
| Lease financing |
778 | 1,746 | 2,557 | 4,234 | 7,468 | ||||||||||
| Real estate – construction |
133,299 | 241,818 | 386,184 | 242,669 | 169,543 | ||||||||||
| Real estate – 1-4 family mortgage |
820,917 | 886,380 | 850,658 | 636,060 | 566,455 | ||||||||||
| Real estate – commercial mortgage |
1,040,589 | 1,015,894 | 948,322 | 629,354 | 597,273 | ||||||||||
| Installment loans to individuals |
70,703 | 72,400 | 81,006 | 77,704 | 79,281 | ||||||||||
| Total loans, net of unearned income |
$ | 2,347,615 | $ | 2,530,886 | $ | 2,586,593 | $ | 1,826,762 | $ | 1,646,223 | |||||
29
Table of Contents
Index to Financial Statements
The following table presents the percentage of loans, by category, to total loans at December 31 for the last five years:
| 2009 | 2008 | 2007 | 2006 | 2005 | |||||||||||
| Commercial, financial, agricultural |
11.98 | % | 12.35 | % | 12.29 | % | 12.96 | % | 13.74 | % | |||||
| Lease financing |
0.03 | 0.07 | 0.10 | 0.23 | 0.45 | ||||||||||
| Real estate – construction |
5.68 | 9.56 | 14.93 | 13.28 | 10.30 | ||||||||||
| Real estate – 1-4 family mortgage |
34.97 | 35.02 | 32.89 | 34.82 | 34.41 | ||||||||||
| Real estate – commercial mortgage |
44.33 | 40.14 | 36.66 | 34.45 | 36.28 | ||||||||||
| Installment loans to individuals |
3.01 | 2.86 | 3.13 | 4.26 | 4.82 | ||||||||||
| Total |
100.00 | % | 100.00 | % | 100.00 | % | 100.00 | % | 100.00 | % | |||||
Loan concentrations are considered to exist when there are amounts loaned to a number of borrowers engaged in similar activities which would cause them to be similarly impacted by economic or other conditions. At December 31, 2009, there were no concentrations of loans exceeding 10% of total loans which are not disclosed as a category of loans separate from the categories listed above.
At December 31, 2009 loans decreased $183,271, or 7.24%, from December 31, 2008. The decrease in total loans is a result of an overall slowdown in economic activity in our markets and a continued focus by management on diversifying the loan portfolio. As the general economic environment began to decline in the last half of 2007, management responded by implementing a strategy to diversify our loan portfolio by specifically reducing the concentration in construction and land development loans. Management reduced our exposure to construction and land development loans by applying more stringent levels of underwriting on new originations of construction and land development loans and requiring principal reductions of these loans at time of renewal. Our construction loan portfolio was also reduced as construction loans were refinanced into permanent financing arrangements due to the completion of the construction phase of underlying projects and thus reclassified to commercial or residential real estate loans.
Loans secured by real estate represented 84.98%, 84.72% and 84.48% of the Company’s total loan portfolio at December 31, 2009, 2008 and 2007, respectively. The following table provides further details of the types of loans in the Company’s loan portfolio secured by real estate at December 31, 2009 and 2008:
| 2009 | 2008 | |||||
| Construction: |
||||||
| Residential |
$ | 45,559 | $ | 139,332 | ||
| Commercial |
74,440 | 90,039 | ||||
| Condominiums |
13,300 | 12,447 | ||||
| Total construction |
133,299 | 241,818 | ||||
| 1-4 family mortgage: |
||||||
| Primary |
345,971 | 361,153 | ||||
| Home equity |
171,180 | 181,960 | ||||
| Rental/investment |
158,436 | 178,814 | ||||
| Land development |
145,330 | 164,453 | ||||
| Total 1-4 family mortgage |
820,917 | 886,380 | ||||
| Commercial mortgage: |
||||||
| Owner-occupied |
537,387 | 530,938 | ||||
| Non-owner occupied |
367,011 | 347,000 | ||||
| Land development |
136,191 | 137,956 | ||||
| Total commercial mortgage |
1,040,589 | 1,015,894 | ||||
| Total loans secured by real estate |
$ | 1,994,805 | $ | 2,144,092 | ||
During 2009, loans in our Mississippi region decreased $95,701 while loans in our Alabama and Tennessee regions decreased $30,221 and $57,349, respectively, from December 31, 2008. At December 31, 2008 loans decreased $55,707, or 2.16%, from December 31, 2007. During 2008, loans in our Tennessee region grew $44,972 while loans in our Alabama and Mississippi regions decreased $59,554 and $41,125, respectively. At December 31, 2009 and 2008, 82% of our loans were located in our key markets.
30
Table of Contents
Index to Financial Statements
Our loan portfolio yield decreased to 5.60% in 2009 from 6.48% in 2008 and 7.64% in 2007. The decrease in the loan yields was driven by a declining interest rate environment from 2007 to 2009.
Mortgage loans held for sale were $25,749 at December 31, 2009 compared to $41,805 at December 31, 2008 and $37,468 at December 31, 2007. Originations of mortgage loans to be sold totaled $815,067 in 2009, $742,090 in 2008 and $605,594 in 2007. The increase in originations in 2009 is due partially from refinancings made possible by historically lower mortgage interest rates during periods in 2009 compared to previous years. Originations of mortgage loans to be sold also increased due to the expansion of our mortgage operations. Mortgage loans to be sold are locked in at a contractual rate with third party private investors, and the Company is obligated to sell the mortgages to such investors only if the mortgages are closed and funded. Gains and losses are realized at the time consideration is received and all other criteria for sales treatment have been met. These loans are typically sold within thirty days after the loan is funded. Although loan fees and some interest income are derived from mortgage loans held for sale, the main source of income is gains from the sale of mortgage loans in the secondary market.
Investments and Investment Interest Income
Investment income is the second largest component of interest income. The securities portfolio is used to provide a source for meeting liquidity needs and to supply securities to be used in collateralizing certain deposits and other types of borrowings. The following table shows the carrying value of our securities portfolio by investment type, and the percentage of such investment type relative to the entire securities portfolio, as of December 31:
| 2009 | 2008 | 2007 | ||||||||||||||||
| Obligations of other U.S. Government agencies and corporations |
$ | 63,032 | 8.83 | % | $ | 59,920 | 8.62 | % | $ | 116,412 | 21.57 | % | ||||||
| Mortgage-backed securities |
457,891 | 64.11 | 448,967 | 64.59 | 262,047 | 48.56 | ||||||||||||
| Obligations of states and political subdivisions |
138,806 | 19.44 | 112,734 | 16.22 | 119,550 | 22.16 | ||||||||||||
| Trust preferred securities |
14,438 | 2.02 | 20,543 | 2.95 | 4,907 | 0.91 | ||||||||||||
| Other equity securities |
39,997 | 5.60 | 52,942 | 7.62 | 36,674 | 6.80 | ||||||||||||
| $ | 714,164 | 100.00 | % | $ | 695,106 | 100.00 | % | $ | 539,590 | 100.00 | % | |||||||
In 2009, investment income, on a tax equivalent basis, decreased $1,100 to $35,132 from $36,232 for 2008. The average balance in the investment portfolio in 2009 was $702,689 compared to $677,497 in 2008. The tax equivalent yield on the investment portfolio was 5.00%, down 35 basis points from 2008. The decline in yield was a result of the call of securities within the Company’s portfolio that had higher rates than the rates on the securities that the Company purchased with the proceeds of such calls. These rates were lower due to the generally lower interest rate environment.
The balance of our investment portfolio at December 31, 2009 increased $19,058 to $714,164 compared to $695,106 at December 31, 2008. During 2009, we purchased $362,865 in investment securities. The purchases were primarily mortgage-backed securities and collateralized mortgage obligations (“CMO’s”), which in the aggregate made up approximately 64.94% of the purchases. CMO’s are included in the “Mortgage-backed securities” line item in the above table. The mortgage-backed securities and CMO’s held in our investment portfolio are primarily issued by government sponsored entities. U.S. Government Agency securities purchased accounted for approximately 24.31%, with the remainder of the purchases being primarily municipal securities. Maturities and calls of securities during 2009 totaled $240,498. At December 31, 2009, unrealized losses of $21,136 were recorded on investment securities with a carrying value of $103,933.
The Company holds investments in pooled trust preferred securities. This portfolio had a cost basis of $30,803 and $29,669 and a fair value of $11,301 and $17,537 at December 31, 2009 and 2008, respectively. The investment in pooled trust preferred securities consists of four securities representing interests in various tranches of trusts collateralized by debt issued by over 321 financial institutions. As of December 31, 2009, management determined that there is not sufficient evidence to conclude that the decline in value of these securities is due to adverse changes that are likely to result in a permanent reduction in future cash flow. Management’s determination is based on the current credit ratings, the known deferrals and defaults by the underlying issuing banks and the degree to which future deferrals and defaults would be required to occur before the cash flow for our tranches is negatively impacted.
31
Table of Contents
Index to Financial Statements
The Company also holds investments in mortgage-backed securities and CMO’s of institutions not sponsored by government entities, commonly referred to as “private-label” securities. This portfolio had a cost basis of $20,596 and $32,860 and a fair value of $19,520 and $27,978 at December 31, 2009 and 2008, respectively. As of December 31, 2009, management determined that there is not sufficient evidence to conclude that the decline in value of these securities is due to adverse changes that are likely to result in a permanent reduction in future cash flow. Management’s determination is based on the current credit ratings of the securities, analysis of the credit scores of the underlying borrowers, analysis of the loan-to-value of the underlying collateral and the geographic location of the underlying borrowers.
In 2008, investment income, on a tax equivalent basis, increased $8,622 to $36,232 from investment income on a tax equivalent basis for 2007. The average balance in the investment portfolio was $677,497, up $174,053, or 34.57%, over 2007. The tax equivalent yield on the investment portfolio was 5.35%, down 13 basis points from 2007.
At December 31, 2008, the balance of our investment portfolio was $695,106, an increase of $155,516 as compared to December 31, 2007. During 2008, we purchased $326,064 in investment securities. The purchases were primarily mortgage-backed securities and CMO’s, comprising approximately 77.00% of the purchases. The change in the mix of our investment portfolio in 2008 as compared to prior periods is a result of purchases during the year consisting primarily of mortgage-backed securities. We favor investments in mortgage-backed securities and CMO’s because these securities provide monthly cash flow streams and the yields on these securities, although taxable, are generally higher than yields on U.S. Government Agency securities. U.S. Government Agency securities purchased accounted for approximately 6.10%, with the remainder of the purchases being primarily municipal securities. Maturities and calls of securities during 2008 totaled $159,506.
Deposits and Deposit Interest Expense
The Company relies on deposits as its major source of funds. Total deposits were $2,576,100, $2,344,331 and $2,547,821 as of December 31, 2009, 2008 and 2007, respectively. Noninterest-bearing deposits at December 31, 2009, 2008 and 2007 were $304,962, $284,227 and $299,394, respectively, while interest-bearing deposits were $2,271,138, $2,060,104 and $2,248,427 at December 31, 2009, 2008 and 2007, respectively. The increase in deposits at December 31, 2009 as compared to December 31, 2008 is due to the easing of competition for deposits in our markets, which caused deposit pricing to return to more normal levels as compared to 2008. As a result of this growth, the Company used deposits as its primary source of funding rather than borrowed funds. The decrease in deposits at December 31, 2008 as compared to December 31, 2007 is due primarily to decreases in time deposits offset by increases in public fund transactional accounts. As competition increased for deposits in 2008, primarily money market accounts and time deposits, the costs of these deposits remained higher than alternative sources of funds. As a result, during 2008, the Company was more selective in pricing these deposits and instead utilized lower costing borrowed funds, primarily Federal Home Loan Bank (“FHLB”) borrowings. This strategy was the primary reason for the decrease in time deposits during 2008.
Deposits in the Tennessee, Alabama and Mississippi regions increased $44,117, $60,210 and $127,442, respectively, in 2009 as compared to 2008. Historically, rates paid on deposits have been lower in our Mississippi region than our other regions. Deposits in the Tennessee, Alabama and Mississippi regions decreased $115,420, $75,572 and $12,498, respectively, in 2008 as compared to 2007. At December 31, 2009, 65% of our deposits were from our key markets as compared to 63% at December 31, 2008.
| Average Interest-Bearing Deposits to Total Average Deposits | ||||
| 2009 |
2008 |
2007 | ||
| 88.40% |
88.26% | 88.44% | ||
Interest expense on deposits was $46,708, $63,509 and $83,816 for 2009, 2008 and 2007, respectively. The cost of interest-bearing deposits was 2.05%, 2.89% and 3.92% for the same periods. A more detailed discussion of the cost of our deposits is set forth below under the heading “Liquidity and Capital Resources” in this item.
From time to time, we participate in gathering government, public and trust deposits (collectively referred to as “public fund deposits”). Public fund deposits may be readily obtained based on the Company’s pricing bid in comparison with competitors. The source of funds that we select depends on the terms and how those terms assist us in mitigating interest rate risk and maintaining our net interest margin. Accordingly, funds are only acquired when needed and at a rate that is prudent under the circumstances. Generally, public fund time deposits are higher costing due to the volume of the deposits and because they are obtained through a bid process. Our public fund transaction accounts are principally obtained from municipalities including school boards and utilities. Public fund deposits totaled $360,948, $441,281 and $409,823 at December 31, 2009, 2008 and 2007.
32
Table of Contents
Index to Financial Statements
Borrowed Funds and Interest Expense on Borrowings
Total borrowings include advances from the FHLB, junior subordinated debentures, federal funds purchased, treasury, tax and loan notes and securities sold under agreements to repurchase. Interest expense on total borrowings was $24,930, $28,011 and $18,566 for the years ending December 31, 2009, 2008 and 2007, respectively. Funds are borrowed from the FHLB primarily to match-fund against certain loans, negating interest rate exposure when rates rise. Such match-funded loans are typically large commercial or real estate loans. In addition, short-term FHLB advances and federal funds purchased are used to meet day to day liquidity needs. FHLB advances were $469,574, $768,302 and $464,717 for the years ended December 31, 2009, 2008 and 2007, respectively. The Company had no short-term FHLB advances outstanding at December 31, 2009, as compared to $225,000 and $287,000 at December 31, 2008 and 2007, respectively. At December 31, 2009, the Company had $312,154 of availability on unused lines of credit with the FHLB.
The cost of our FHLB advances was 3.42%, 3.43% and 4.93% for 2009, 2008 and 2007. As noted above, beginning in the last half of 2007 and continuing throughout most of 2008, costs of borrowings at the FHLB were lower than costs of time deposits in certain of our markets. As management anticipated, in the last few weeks of 2008, competition for deposits eased and pricing of such deposits returned to more normal conditions.
Interest expense on junior subordinated debentures was $4,332, $4,915 and $5,469 for the years ended December 31, 2009, 2008 and 2007, respectively. For more information about our outstanding subordinated debentures, refer to the discussion in this item below under the heading “Shareholders’ Equity and Regulatory Matters.”
The outstanding balance of treasury, tax and loan notes as of December 31, 2009, 2008 and 2007 was $2,682, $4,494 and $10,000, respectively. The balance in this account is contingent on the amount of funds we pledge as collateral as well as the Federal Reserve’s need for funds.
Noninterest Income
| Noninterest Income to Average Assets | ||||
| 2009 |
2008 |
2007 | ||
| 1.51% |
1.46% | 1.66% | ||
Total noninterest income includes fees generated from deposit services, loan services, insurance products, trust and other wealth management products and services, security gains and all other noninterest income. Our focus over the last few years has been to develop and enhance our products that generate noninterest income in order to diversify our revenue sources. Noninterest income as a percentage of total net revenues was 35.61%, 32.34% and 34.41% and for 2009, 2008 and 2007, respectively. Since 2004, our mergers have provided us with additional opportunities to grow our noninterest income.
Noninterest income was $57,558 for the year ended December 31, 2009, an increase of $3,516, or 6.51%, as compared to 2008. For 2008, noninterest income was $54,042, an increase of $1,855, or 3.55%, over 2007.
Charges for deposit services, the primary contributor to noninterest income, were $22,000 for 2009, a decrease of $645, or 2.85%, from 2008. The decline in service charges on deposits was primarily a result of customers slowing spending in 2009 as a result of current economic conditions. Service charges on deposits were $22,645 in 2008, an increase of $2,117 from 2007. Service charges include maintenance fees on accounts, per item charges, account enhancement charges for additional packaged benefits and overdraft fees. Overdraft fees represented 90.04%, 90.00% and 88.51% of total charges for deposit services in 2009, 2008 and 2007. Regulations issued in November 2009 will restrict the Company’s ability to impose overdraft fees on ATM and one-time debit card transactions. Beginning in the third quarter of 2010, the Company will be required to ask customers to affirmatively consent, or “opt in”, to the Company’s overdraft service for ATM and one-time debit card transactions before overdraft fees may be assessed by the Company. Management believes these restrictions could have an adverse impact on noninterest income, but it is unable at this time to predict the extent of such impact.
Fees and commissions (which includes fees charged for both deposit services and loan services) increased 3.12% to $16,621 during 2009 as compared to $16,118 for 2008. Fees charged on loans include origination, underwriting, documentation and other administrative fees. Loan fees were $8,104 during 2009 as compared to $8,124 for 2008. This is due to the decrease in portfolio loans originated during 2009, which was offset by fees generated due to
33
Table of Contents
Index to Financial Statements
higher mortgage loan originations to be sold in the secondary market during the same period. With respect to fees related to deposit services, interchange fees on debit card transactions continue to be a strong source of noninterest income. For 2009, fees associated with debit card usage were $5,563, an increase of 15.65% as compared to $4,810 for 2008. Income derived from use of our debit cards made up 33.47% of the total fees and commissions for 2009. We expect income from use of our debit cards to continue to grow as we make a direct effort to encourage usage by our customers.
Fees and commissions increased $392 to $16,118 during 2008 as compared to $15,726 for 2007. Loan fees decreased $1,093 during 2008 to $8,124 as compared to 2007. This decrease is due to the reduction in the types of loans we retain in our portfolio, rather than sell to third parties, as reflected by the decrease in loans during the same period. For 2008, fees associated with debit card usage were $4,810, an increase of 20.18% as compared to $4,003 for 2007.
Income earned on insurance products was $3,319, $3,483 and $3,549 for the years ended December 31, 2009, 2008 and 2007, respectively. Through Renasant Insurance, we offer a range of commercial and personal insurance products through major insurance carriers. Contingency income is a bonus received from the insurance underwriters and is based both on commission income and claims experience on our client’s policies during the previous year. Increases and decreases in contingency income are reflective of corresponding increases and decreases in the amount of claims paid by insurance carriers. Contingency income, which is included in “Other noninterest income” in the Consolidated Statements of Income, was $310, $323 and $265 for 2009, 2008 and 2007, respectively.
Trust department revenue is reported in the Consolidated Statements of Income in the noninterest income section in the line account “Trust revenue.” Trust revenue was $2,039 for 2009 compared to $2,444 for 2008 and $2,859 for 2007. The market value of trust assets under management as of December 31, 2009 and 2008 was $432,683 and $461,881, respectively. The decline in market value of assets under management from 2008 to 2009 resulted in the reduction of trust revenues. The decline in trust revenues for 2009 as compared to 2008 was further accentuated by higher market values in the first three quarters of 2008 than the full year of 2009.
Gross gains on sales of securities available for sale for 2009 were $2,318, resulting from the sale of approximately $107,739 in securities. These gains were offset by the complete write-off of the Company’s $645 investment in Silverton Financial Services, Inc., the holding company of Silverton Bank, N.A., which was placed in receivership on May 1, 2009. For 2008, there were no sales of securities available for sale. Gains of $78 for 2007 resulted from the sale of approximately $54,944 of securities.
Gains on the sale of mortgage loans held for sale for 2009 were $7,566, an increase of $2,119, or 38.90%, from 2008. The increase in gains on the sale of mortgage loans is attributable to higher volumes of loans sold during 2009 compared to 2008 due to the above-mentioned increase in originations and refinancing. Originations of mortgage loans to be sold totaled $815,067 for 2009 as compared to $742,090 for 2008. Approximately 59.72% of the total mortgage originations during 2009 were mortgages being refinanced with the Company, with the remainder being new originations. Gains on the sale of mortgage loans held for sale for 2008 were $5,447, an increase of $584 from 2007.
Other noninterest income for 2009 includes a $638 gain related to a change in vendors related to our debit card product. In comparison, other noninterest income for 2008 includes a $409 gain related to the redemption of shares as a result of the Visa initial public offering.
Noninterest Expense
| Noninterest Expense to Average Assets | ||||
| 2009 |
2008 |
2007 | ||
| 2.85% |
2.91% | 3.13% | ||
Noninterest expense was $105,753, $107,968 and $98,000 for 2009, 2008 and 2007, respectively. Noninterest expense decreased $2,215, or 2.05%, during 2009 as compared to 2008. Through renegotiations of various contracts with suppliers and vendors and an overall effort to reduce non-essential expenses, the Company reduced its noninterest expenses and offset increases in FDIC insurance assessments due to increases in the base assessment rates and a special assessment, both of which were applicable to all insured institutions. Noninterest expense increased $9,968, or 10.17%, during 2008 as compared to 2007. The full year impact of the operations of Capital increased noninterest expenses by $12,376 during 2008 as compared to $6,142 for the last six months of 2007.
34
Table of Contents
Index to Financial Statements
Salaries and employee benefits is the largest component of noninterest expenses and represented 52.40%, 53.16% and 56.11% of total noninterest expense at December 31, 2009, 2008 and 2007, respectively. During 2009, salaries and employee benefits decreased $1,985, or 3.46%, to $55,415 as compared to $57,400 for 2008. During 2009, the Company had a 4.85% reduction in our workforce as employee service capacity exceeded projected growth in certain areas.
During 2008, salaries and employee benefits increased $2,410, or 4.38%, to $57,400 as compared to $54,990 for 2007. The operations of Capital contributed $5,680 to salaries and employee benefits expense during 2008 offset by a reduction in performance-based incentive payments in 2008 as compared to 2007.
The compensation expense recorded in connection with grants of stock options and awards of restricted stock, which is included within salaries and employee benefits, was $626, $1,014 and $1,444 at December 31, 2009, 2008 and 2007, respectively.
Data processing costs increased $396, or 7.60%, to $5,605 for 2009 from 2008. Data processing costs increased $324, or 6.63%, to $5,209 for 2008 from 2007. The increase in data processing costs over the periods presented is reflective of increased loan and deposit processing from growth in the number of loans and deposits. The increase in 2008 compared to 2007 is a result of the full year inclusion of data processing costs from the Capital operations.
Net occupancy expense in 2009 was $8,314, down $278 from 2008. This decrease is attributable to reductions in expense resulting from renegotiations of various contracts with suppliers and vendors and the Company’s overall efforts to reduce non-essential expenses. Occupancy expense in 2008 was $8,592, up $593 from 2007 primarily due to the full year inclusion of Capital in the Company’s operations.
Computer and equipment expense in 2009 was $4,024, a decrease of $679 or 14.44%, over 2008. The decrease in computer and equipment expense for 2009 as compared to 2008 is attributable to lower depreciation expense and repairs on equipment. Computer and equipment expense in 2008 was $4,703, an increase of $495 over 2007. The increase in computer and equipment expense for 2008 as compared to 2007 is associated with additional equipment expense from the operations of Capital.
Professional fees include fees we paid our directors as well as fees for legal and accounting services. Professional fees were $3,813 for 2009 as compared to $3,509 for 2008 and $2,705 for 2007. The increases in professional fees are attributable to legal fees associated with loan workouts and foreclosure proceedings.
Advertising and public relations expense was $3,176 for 2009, down $1,909 or 37.54%, compared to $5,085 for 2008. The reduction in advertising and public relations expense for 2009 as compared to 2008 was related to expenses which the Company does not anticipate will impact its ability to grow loans or deposits in the future. Advertising and public relations expense decreased $38 for 2008 compared to $5,123 for 2007.
Amortization of intangible assets decreased $489 to $1,966 for 2009 compared to $2,455 for 2008. In connection with the Capital, Heritage and Renasant Bancshares, Inc. mergers, we recorded $5,974, $5,224 and $5,801, respectively, in finite-lived intangible assets. These intangible assets are being amortized over their estimated useful lives, which range between 5 and 10 years. These finite-lived intangible assets have remaining estimated useful lives ranging from two to eight years. Amortization of intangible assets increased $464 for 2008 compared to $1,991 for 2007.
Communication expenses are those expenses incurred for communication to clients and between employees. Communication expenses were $4,390 for 2009 as compared to $4,591 for 2008 and $4,789 for 2007.
Other noninterest expense was $19,050, $16,424 and $11,310 for the years ended December 31, 2009, 2008 and 2007, respectively. Other noninterest expense for the year ended December 31, 2009 includes expenses related to other real estate owned of $2,488, an increase of $845, or 51.42%, compared to $1,643 for the same period in 2008. In addition, other noninterest expense for the year ended December 31, 2009 includes an increase of $1,911 in expenses associated with our FDIC deposit insurance assessments due to an increase in the base assessment rates applicable to all insured institutions and the $1,750 charge for the special deposit insurance assessment collected by the FDIC from all insured institutions during the third quarter of 2009.
35
Table of Contents
Index to Financial Statements
| Efficiency Ratio | ||||
| 2009 |
2008 |
2007 | ||
| 65.43% |
64.60% | 64.62% | ||
The efficiency ratio is one measure of productivity in the banking industry. This ratio is calculated to measure the cost of generating one dollar of revenue. That is, the ratio is designed to reflect the percentage of one dollar which must be expended to generate that dollar of revenue. The Company calculates this ratio by dividing noninterest expense by the sum of net interest income on a fully taxable equivalent basis and noninterest income. Our efficiency ratio increased in 2009 from 2008 due to the decrease in net interest income attributable to the decline in the volume of net earning assets and the declining interest rate environment during 2009 as compared to 2008. This decrease was partially offset by a decrease in noninterest expense. We remain committed to aggressively managing our costs within the framework of our business model.
Income Taxes
Income tax expense for 2009, 2008 and 2007 was $5,863, $8,660 and $14,069, respectively. The effective tax rates for those years were 24.05%, 26.47% and 31.15%, respectively. The decrease in the effective tax rate for the years presented is attributable to a reduction in taxable income while, at the same time, tax-exempt income remained at consistent levels.
Risk Management
The management of risk is an on-going process. Primary risks that are associated with the Company include credit, interest rate and liquidity risk. Credit and interest rate risk are discussed below, while liquidity risk is discussed in the next subsection under the heading “Liquidity and Capital Resources.”
Credit Risk and Allowance for Loan Losses
Inherent in any lending activity is credit risk, that is, the risk of loss should a borrower default. Credit risk is monitored and managed on an ongoing basis by a credit administration department, senior loan committee, a loss management committee and the Board of Directors loan committee. Credit quality, adherence to policies and loss mitigation are major concerns of credit administration and these committees. The Company implemented several initiatives during 2009 to improve the monitoring and managing of credit risk. First, management established a portfolio management committee to monitor and identify risks within the Company’s loan portfolio by focusing its efforts on reviewing and analyzing loans which are not on the Company’s internal watch list. The portfolio management committee monitors loans in portfolios or regions which management believes could be stressed or experiencing credit deterioration. Second, the Board of Directors established a standing problem loan review committee to more closely monitor credit losses and credit risk mitigation strategies. Finally, the Company created a central appraisal review department managed by a licensed appraiser. The department reviews and approves third-party appraisals obtained by the Company on real estate collateral and monitors loan maturities to ensure updated appraisals are obtained.
The allowance for loan losses is available to absorb probable credit losses inherent in the entire loan portfolio. The appropriate level of the allowance is based on a quarterly analysis of the loan portfolio and represents an amount that management deems adequate to provide for inherent losses, including collective impairment as recognized under ASC 450. Collective impairment is calculated based on loans grouped by grade. Another component of the allowance is losses on loans assessed as impaired under ASC 310. The balance of these loans and their related allowance is included in management’s estimation and analysis of the allowance for loan losses. Other considerations in establishing the allowance for loan losses include economic conditions reflected within industry segments, the unemployment rate in our markets, loan segmentation and historical losses that are inherent in the loan portfolio. The allowance for loan losses is established after input from management, loan review and the loss management committee. An evaluation of the adequacy of the allowance is calculated quarterly based on the types of loans, an analysis of credit losses and risk in the portfolio, economic conditions and trends within each of these factors. In addition, on a regular basis, management and the Board of Directors review loan ratios. These ratios include the allowance for loan losses as a percentage of total loans, net charge-offs as a percentage of average loans, the provision for loan losses as a percentage of average loans, nonperforming loans as a percentage of total loans and the allowance coverage on nonperforming loans. Also, management reviews past due ratios by officer, community bank and the Company as a whole. The allowance for loan losses was $39,145, $34,905 and $26,372 at December 31, 2009, 2008 and 2007, respectively
36
Table of Contents
Index to Financial Statements
We have a number of documented loan policies and procedures that set forth the approval and monitoring process of the lending function. Adherence to these policies and procedures is monitored by management and the Board of Directors. A number of committees and an underwriting staff oversee the lending operations of the Company. These include in-house loan and loss management committees and the Board of Directors loan and problem loan review committees. In addition, we maintain a loan review staff to independently monitor loan quality and lending practices. Loan review personnel monitor and, if necessary, adjust the grades assigned to loans through periodic examination. During 2009, loan review personnel primarily focused their review on commercial and real estate loans rather than consumer and consumer mortgage loans.
In compliance with loan policy, the lending staff is given lending limits based on their knowledge and experience. In addition, each lending officer’s prior performance is evaluated for credit quality and compliance as a tool for establishing and enhancing lending limits. Before funds are advanced on consumer and commercial loans below certain dollar thresholds, loans are reviewed and scored using centralized underwriting methodologies. Loan quality or “risk-rating” grades are assigned based upon certain factors, which include the scoring of the loans. This information is used to assist management in monitoring the credit quality. Loan requests of amounts greater than the officers’ lending limits are reviewed by senior credit officers, in-house loan committees or the Board of Directors.
For portfolio balances of consumer, consumer mortgage and certain other similar loan types, allowance factors are determined based on historical loss ratios by portfolio for the preceding eight quarters and may be adjusted by other qualitative criteria. For commercial and commercial real estate secured loans, risk-rating grades are assigned by lending, credit administration or loan review personnel, based on an analysis of the financial and collateral strength and other credit attributes underlying each loan. Loan grades range from 1 to 9, with 1 being loans with the least credit risk. Allowance factors established by management are applied to the total balance of loans in each grade to determine the amount needed in the allowance for loan losses. The allowance factors are established based on historical loss ratios experienced by the Company for these loan types, as well as the credit quality criteria underlying each grade, adjusted for trends and expectations about losses inherent in our existing portfolios. In making these adjustments to the allowance factors, management takes into consideration factors which it believes are causing, or are likely in the future to cause, losses within our loan portfolio but which may not be fully reflected in our historical loss ratios.
The loss management committee and the Board of Directors problem loan review committee monitors loans that are past due or those that have been downgraded due to a decline in the collateral value or cash flow of the debtor and adjusts the loan grade accordingly. This information is used to assist management in monitoring credit quality. On a regular basis, management and the Board of Directors review loan ratios. These ratios include the allowance for loan losses as a percentage of total loans, net charge-offs as a percentage of average loans, the provision for loan losses as a percentage of average loans, nonperforming loans as a percentage of total loans and the allowance coverage on nonperforming loans. In addition, management reviews past due ratios by officer, community bank and the Company as a whole.
A loan is considered impaired when, based on current information and events, it is probable that the Company will be unable to collect the scheduled payments of principal and interest when due according to the contractual terms of the loan agreement. Impairment is measured on a loan-by-loan basis for problem loans of $100 or greater by either the present value of expected future cash flows discounted at the loan’s effective interest rate, the loan’s obtainable market price or the fair value of the collateral if the loan is collateral dependent. For real estate collateral, the fair market value of the collateral is based upon a recent appraisal by a qualified and licensed appraiser of the underlying collateral. When the ultimate collectability of a loan’s principal is in doubt, wholly or partially, the loan is placed on nonaccrual.
After all collection efforts have failed, collateral securing loans may be repossessed and sold or, for loans secured by real estate, foreclosure proceedings are initiated. The collateral is sold at public auction for fair market value, with fees associated with the foreclosure being deducted from the sales price. For real estate collateral, the fair market value of the collateral being sold is based upon a recent appraisal by a qualified and licensed appraiser of the underlying collateral. The purchase price is applied to the outstanding loan balance. If the loan balance is greater than the sales proceeds, the deficient balance is sent to the loan committee comprised of the Board of Directors for charge-off approval. These charge-offs reduce the allowance for loan losses.
37
Table of Contents
Index to Financial Statements
| Provision for Loan Losses to Average Loans | ||||
| 2009 |
2008 |
2007 | ||
| 1.08% |
0.88% | 0.21% | ||
The provision for loan losses charged to operating expense is an amount which, in the judgment of management, is necessary to maintain the allowance for loan losses at a level that is believed to be adequate to meet the inherent risks of losses in our loan portfolio. The provision for loan losses was $26,890, $22,804 and $4,838, respectively for 2009, 2008 and 2007, respectively. Factors considered by management in determining the amount of provision for loan losses to charge to current operations include the internal risk rating of individual credits, historical and current trends in net charge-offs, trends in nonperforming loans, trends in past due loans, trends in the market values of underlying collateral securing loans and the current economic conditions in the market in which we operate. For 2008 and 2009, as compared to 2007 and prior periods, the provision for loan losses was increased to address credit deterioration resulting from the effects of the economic downturn on our borrowers’ ability to make timely payments or repay their loans at maturity. This deterioration is reflected in the increase in nonperforming loans and loans past due 30-89 days in 2008 and 2009, as well as the decline in market values of underlying collateral securing loans, primarily real estate, over the same period. In addition, the increase in the provision for loan losses in 2009 and 2008 compared to prior periods is attributable to management identifying potential credit deterioration through the internal loan grading system and increasing the allowance for loan losses in response. For impaired loans, specific reserves were established to adjust the carrying value of the loan to its estimated net realizable value.
Charge-offs reflect the realization of losses in the portfolio that were recognized previously through the provision for loan losses. Net charge-offs for the year ended December 31, 2009 were $22,650, or 0.91% as a percentage of average loans compared to net charge-offs of $14,271, or 0.55%, for 2008 and $3,253, or 0.14%, for 2007. The increase in net charge-offs during 2009 and 2008 as compared to prior years is a direct result of the prolonged effects of the economic downturn in our markets on borrowers’ ability to repay their loans coupled with the decline in market values of the underlying collateral securing loans, particularly real estate secured loans. Although many of the markets in which we operate did not experience the extreme appreciation in real estate values as experienced in other national markets over the past few years, the real estate market in all of our markets began to slow down significantly in 2008. The large inventories of both completed residential homes and land that had been developed for future residential home construction, coupled with declining consumer demand for residential real estate, caused a severe decline in the values of both homes and developed land. As a result, the credit quality of some of our loans in the construction and land development portfolios deteriorated.
The increase in the allowance for loan losses as a percentage of total loans since December 31, 2007 is attributable to the increased provision for loan losses recorded as a result of credit deterioration identified by the Company in the loan portfolio, primarily related to the construction and land development loan segment of the portfolio.
38
Table of Contents
Index to Financial Statements
The table below reflects the activity in the allowance for loan losses, in thousands, for the years ended December 31:
| 2009 | 2008 | 2007 | 2006 | 2005 | ||||||||||||||||
| Balance at beginning of year |
$ | 34,905 | $ | 26,372 | $ | 19,534 | $ | 18,363 | $ | 14,403 | ||||||||||
| Additions from business combinations |
— | — | 5,253 | — | 4,214 | |||||||||||||||
| Provision for loan losses |
26,890 | 22,804 | 4,838 | 2,408 | 2,990 | |||||||||||||||
| Charge-offs |
||||||||||||||||||||
| Commercial, financial, agricultural |
2,682 | 623 | 253 | 659 | 467 | |||||||||||||||
| Lease financing |
— | — | — | — | — | |||||||||||||||
| Real estate – construction |
2,719 | 2,393 | 1,821 | 222 | 141 | |||||||||||||||
| Real estate – 1-4 family mortgage |
16,234 | 11,224 | 1,411 | 1,762 | 2,027 | |||||||||||||||
| Real estate – commercial mortgage |
2,144 | 1,067 | 2 | 217 | 419 | |||||||||||||||
| Installment loans to individuals |
313 | 376 | 612 | 222 | 832 | |||||||||||||||
| Total charge-offs |
24,092 | 15,683 | 4,099 | 3,082 | 3,886 | |||||||||||||||
| Recoveries |
||||||||||||||||||||
| Commercial, financial, agricultural |
187 | 207 | 432 | 501 | 71 | |||||||||||||||
| Lease financing |
— | — | — | — | — | |||||||||||||||
| Real estate – construction |
199 | 136 | 28 | — | 32 | |||||||||||||||
| Real estate – 1-4 family mortgage |
700 | 237 | 230 | 249 | 279 | |||||||||||||||
| Real estate – commercial mortgage |
158 | 31 | 2 | 1,014 | 35 | |||||||||||||||
| Installment loans to individuals |
198 | 801 | 154 | 81 | 225 | |||||||||||||||
| Total recoveries |
1,442 | 1,412 | 846 | 1,845 | 642 | |||||||||||||||
| Net charge-offs |
22,650 | 14,271 | 3,253 | 1,237 | 3,244 | |||||||||||||||
| Balance at end of year |
$ | 39,145 | $ | 34,905 | $ | 26,372 | $ | 19,534 | $ | 18,363 | ||||||||||
| Net charge-offs to: |
||||||||||||||||||||
| Loans - average |
0.91 | % | 0.55 | % | 0.14 | % | 0.07 | % | 0.20 | % | ||||||||||
| Allowance for loan losses |
57.86 | % | 40.89 | % | 12.34 | % | 6.33 | % | 17.67 | % | ||||||||||
| Allowance for loan losses to: |
||||||||||||||||||||
| Loans - year end |
1.67 | % | 1.38 | % | 1.02 | % | 1.07 | % | 1.12 | % | ||||||||||
| Nonperforming loans |
78.25 | % | 87.45 | % | 162.02 | % | 173.05 | % | 291.94 | % | ||||||||||
The following table provides further details of the Company’s net charge-offs of loans secured by real estate for the years ended December 31:
| 2009 | 2008 | 2007 | ||||||||
| Construction: |
||||||||||
| Residential |
$ | 2,278 | $ | 1,735 | $ | 1,797 | ||||
| Commercial |
— | — | — | |||||||
| Condominiums |
242 | 522 | (4 | ) | ||||||
| Total construction |
2,520 | 2,257 | 1,793 | |||||||
| 1-4 family mortgage: |
||||||||||
| Primary |
1,765 | 1,481 | 284 | |||||||
| Home equity |
2,191 | 1,160 | 332 | |||||||
| Rental/investment |
1,548 | 1,897 | 448 | |||||||
| Land development |
10,030 | 6,449 | 117 | |||||||
| Total 1-4 family mortgage |
15,534 | 10,987 | 1,181 | |||||||
| Commercial mortgage: |
||||||||||
| Owner-occupied |
213 | 227 | (2 | ) | ||||||
| Non-owner occupied |
1,711 | 759 | 2 | |||||||
| Land development |
62 | 50 | — | |||||||
| Total commercial mortgage |
1,986 | 1,036 | — | |||||||
| Total net charge-offs of loans secured by real estate |
$ | 20,040 | $ | 14,280 | $ | 2,974 | ||||
39
Table of Contents
Index to Financial Statements
Loans acquired in the Capital and Heritage mergers that are accounted for under ASC 310-30 are carried at values which, in management’s opinion, reflect the estimated future cash flows, based on the facts and circumstances surrounding each respective loan at the date of acquisition. We continually monitor these loans as part of our normal credit review and monitoring procedures for changes in the estimated future cash flows. The Company did not increase the provision for loan losses for loans accounted for under ASC 310-30 during 2009 or 2008. Management believes that as of December 31, 2009 the credit quality of the loans accounted for under ASC 310-30 has not deteriorated further since the date of acquisition and, thus, the carrying value of these loans at December 31, 2009 continues to reflect the future cash flows.
The following table quantifies the amount of the specific reserves component of the allowance for loan losses and the amount of the allowance determined by applying allowance factors to graded loans at December 31 for each of the years presented:
| 2009 | 2008 | 2007 | 2006 | 2005 | |||||||||||
| Specific reserves for impaired loans |
$ | 14,468 | $ | 8,769 | $ | 3,625 | $ | 4,377 | $ | 3,985 | |||||
| Allocated reserves for remaining portfolio |
24,677 | 26,136 | 22,747 | 15,157 | 14,378 | ||||||||||
| Total |
$ | 39,145 | $ | 34,905 | $ | 26,372 | $ | 19,534 | $ | 18,363 | |||||
| The following table presents the allocation of the allowance for loan losses by loan category at December 31 for each of the years presented. | |||||||||||||||
| 2009 | 2008 | 2007 | 2006 | 2005 | |||||||||||
| Commercial, financial, agricultural |
$ | 4,855 | $ | 5,238 | $ | 5,583 | $ | 4,570 | $ | 4,484 | |||||
| Lease financing |
4 | 8 | 12 | 19 | 22 | ||||||||||
| Real estate – construction |
4,494 | 6,590 | 2,613 | 982 | 577 | ||||||||||
| Real estate – 1-4 family mortgage |
15,593 | 10,514 | 8,219 | 6,481 | 6,199 | ||||||||||
| Real estate – commercial mortgage |
12,577 | 10,775 | 8,756 | 6,498 | 6,216 | ||||||||||
| Installment loans to individuals |
1,622 | 1,780 | 1,189 | 984 | 865 | ||||||||||
| Total |
$ | 39,145 | $ | 34,905 | $ | 26,372 | $ | 19,534 | $ | 18,363 | |||||
Nonperforming loans are those on which the accrual of interest has stopped or loans which are contractually past due 90 days, on which interest continues to accrue. Generally, the accrual of income is discontinued when the full collection of principal or interest is in doubt or when the payment of principal or interest has been contractually 90 days past due, unless the obligation is both well secured and in the process of collection. Management, the loss management committee and our loan review staff closely monitor loans that are considered to be nonperforming. Restructured loans are those for which concessions have been granted to the borrower due to a deterioration of the borrower’s financial condition. Such concessions may include reduction in interest rates or deferral of interest or principal payments. In evaluating whether to restructure a loan, management analyzes the long-term financial condition of the borrower, including guarantor and collateral support, to determine whether the proposed concessions will increase the likelihood of repayment of principal and interest. The following table shows the principal amounts of nonperforming and restructured loans at December 31:
| 2009 | 2008 | 2007 | 2006 | 2005 | ||||||||||||||||
| Nonaccruing loans |
$ | 39,454 | $ | 35,661 | $ | 14,231 | $ | 7,821 | $ | 3,984 | ||||||||||
| Accruing loans past due 90 days or more |
10,571 | 4,252 | 2,046 | 3,467 | 2,306 | |||||||||||||||
| Total nonperforming loans |
50,025 | 39,913 | 16,277 | 11,288 | 6,290 | |||||||||||||||
| Restructured loans |
36,335 | 1,270 | 543 | 768 | 116 | |||||||||||||||
| Total nonperforming and restructured loans |
$ | 86,360 | $ | 41,183 | $ | 16,820 | $ | 12,056 | $ | 6,406 | ||||||||||
| Interest income recognized on nonaccruing and restructured loans |
$ | 1,557 | $ | 1,597 | $ | 807 | $ | 233 | $ | 231 | ||||||||||
| Interest income foregone on nonaccruing and restructured loans |
$ | 1,285 | $ | 538 | $ | 277 | $ | 486 | $ | 216 | ||||||||||
| Nonperforming loans to: |
||||||||||||||||||||
| Loans – year end |
2.13 | % | 1.58 | % | 0.63 | % | 0.62 | % | 0.38 | % | ||||||||||
| Loans – average |
2.00 | % | 1.54 | % | 0.72 | % | 0.64 | % | 0.39 | % | ||||||||||
40
Table of Contents
Index to Financial Statements
All loans where information exists about possible credit problems that would cause us to have serious doubts about the borrower’s ability to comply with the current repayment terms of the loan have been reflected in the table above. As of December 31, 2009, we do not hold any other interest-bearing assets that would be included in the table above if such assets were loans.
The following table presents nonperforming loans by loan category at December 31 for each of the years presented.
| 2009 | 2008 | 2007 | 2006 | 2005 | |||||||||||
| Commercial, financial, agricultural |
$ | 3,446 | $ | 2,709 | $ | 140 | $ | 574 | $ | 652 | |||||
| Lease financing |
— | — | — | — | 74 | ||||||||||
| Real estate – construction |
3,648 | 6,451 | 3,671 | 3,721 | 178 | ||||||||||
| Real estate – 1-4 family mortgage |
28,630 | 25,517 | 9,199 | 5,160 | 2,804 | ||||||||||
| Real estate – commercial mortgage |
14,078 | 5,094 | 3,133 | 1,630 | 2,355 | ||||||||||
| Installment loans to individuals |
223 | 142 | 134 | 203 | 227 | ||||||||||
| Total |
$ | 50,025 | $ | 39,913 | $ | 16,277 | $ | 11,288 | $ | 6,290 | |||||
The following table provides further details of the Company’s nonperforming loans secured by real estate at December 31 for each of the years presented:
| 2009 | 2008 | 2007 | |||||||
| Construction: |
|||||||||
| Residential |
$ | 3,648 | $ | 5,196 | $ | 3,671 | |||
| Commercial |
— | — | — | ||||||
| Condominiums |
— | 1,255 | — | ||||||
| Total construction |
3,648 | 6,451 | 3,671 | ||||||
| 1-4 family mortgage: |
|||||||||
| Primary |
4,281 | 2,968 | 4,815 | ||||||
| Home equity |
990 | 612 | 152 | ||||||
| Rental/investment |
5,500 | 3,796 | 317 | ||||||
| Land development |
17,859 | 18,141 | 3,915 | ||||||
| Total 1-4 family mortgage |
28,630 | 25,517 | 9,199 | ||||||
| Commercial mortgage: |
|||||||||
| Owner-occupied |
3,984 | 2,341 | 339 | ||||||
| Non-owner occupied |
5,049 | 2,753 | 2,794 | ||||||
| Land development |
5,045 | — | — | ||||||
| Total commercial mortgage |
14,078 | 5,094 | 3,133 | ||||||
| Total nonperforming loans secured by real estate |
$ | 46,356 | $ | 37,062 | $ | 16,003 | |||
As shown in the above tables, nonperforming loans were $50,025 at December 31, 2009 as compared to $39,913 at December 31, 2008 and $16,277 at December 31, 2007. The increase in nonperforming loans from December 31, 2007 to December 31, 2009 is primarily attributable to continued credit deterioration in our commercial and residential land development loans over the period. Nonperforming land development loans represented 45.79%, 45.46% and 24.05% of total nonperforming loans at December 31, 2009, 2008 and 2007, respectively. Management has evaluated the aforementioned loans and other loans classified as nonperforming and believes that all nonperforming loans have been adequately reserved for in the allowance for loan losses at December 31, 2009. Management also continually monitors loans past due loans for potential credit quality deterioration. Total loans past due 30-89 days were $24,062, $48,473 and $28,330 at December 31, 2009, 2008 and 2007, respectively.
As shown above, restructured loans totaled $36,335 at December 31, 2009 compared to $1,270 at December 31, 2008. At December 31, 2009, total loans restructured through interest rate concessions represented 48.57% of total restructured loans, while loans restructured by a concession in payment terms represented the remainder.
41
Table of Contents
Index to Financial Statements
The following table provides further details of the Company’s restructured loans secured by real estate at December 31, 2009:
| 2009 | |||
| Construction: |
|||
| Residential |
$ | 2,356 | |
| Commercial |
— | ||
| Condominiums |
5,610 | ||
| Total construction |
7,966 | ||
| 1-4 family mortgage: |
|||
| Primary |
1,240 | ||
| Home equity |
— | ||
| Rental/investment |
550 | ||
| Land development |
21,221 | ||
| Total 1-4 family mortgage |
23,011 | ||
| Commercial mortgage: |
|||
| Owner-occupied |
3,809 | ||
| Non-owner occupied |
— | ||
| Land development |
350 | ||
| Total commercial mortgage |
4,159 | ||
| Total restructured loans secured by real estate |
$ | 35,136 | |
Other real estate owned and repossessions of $58,568 and $25,111 at December 31, 2009 and 2008, respectively, is included in the Consolidated Balance Sheets heading “Other assets” and consists of properties acquired through foreclosure or acceptance of a deed in lieu of foreclosure. These properties are carried at the lower of cost or fair market value based on appraised value less estimated selling costs. Losses arising at the time of foreclosure of properties are charged against the allowance for loan losses. Reductions in the carrying value subsequent to acquisition are charged to earnings and are included in “Other noninterest expense” in the Consolidated Statements of Income. Other real estate owned with a cost basis of $16,005 was sold during the year ended December 31, 2009, resulting in a net loss of $818.
The following table provides details of the Company’s other real estate owned and repossessions as of December 31, 2009 and 2008:
| 2009 | 2008 | |||||||||||
| Residential real estate |
$ | 18,038 | $ | 13,603 | ||||||||
| Commercial real estate |
10,336 | 2,484 | ||||||||||
| Residential land development |
27,018 | 8,913 | ||||||||||
| Commercial land development |
165 | — | ||||||||||
| Other |
3,011 | 111 | ||||||||||
| Total other real estate owned and repossessions |
$ | 58,568 | $ | 25,111 | ||||||||
| Changes in the Company’s other real estate owned and repossessions as of December 31 are as follows: | ||||||||||||
| 2009 | 2008 | |||||||||||
| Balance as of January 1 |
$ | 25,111 | $ | 8,584 | ||||||||
| Additions |
49,377 | 28,608 | ||||||||||
| Capitalized improvements |
641 | 302 | ||||||||||
| Impairments |
(561 | ) | (773 | ) | ||||||||
| Dispositions |
(16,005 | ) | (11,550 | ) | ||||||||
| Other |
5 | (60 | ) | |||||||||
| Balance as of December 31 |
$ | 58,568 | $ | 25,111 | ||||||||
42
Table of Contents
Index to Financial Statements
Interest Rate Risk
Market risk is the risk of loss from adverse changes in market prices and rates. The majority of assets and liabilities of a financial institution are monetary in nature and therefore differ greatly from most commercial and industrial companies that have significant investments in fixed assets and inventories. Our market risk arises primarily from interest rate risk inherent in lending and deposit-taking activities. Management believes the most significant impact on the Company’s financial results stems from our ability to react to changes in interest rates. To that end, management actively monitors and manages our interest rate risk exposure.
We have an Asset/Liability Committee (“ALCO”) which is authorized by the Board of Directors to monitor our interest rate sensitivity and to make decisions relating to that process. The ALCO’s goal is to structure our asset-liability composition to maximize net interest income while managing interest rate risk so as to minimize the adverse impact of changes in interest rates on net interest income and capital. Profitability is affected by fluctuations in interest rates. A sudden and substantial change in interest rates may adversely impact our earnings because the interest rates borne by assets and liabilities do not change at the same speed, to the same extent or on the same basis. We monitor the impact of changes in interest rates on our net interest income and economic value of equity (“EVE”) using rate shock analysis. Net interest income simulations measure the short-term earnings exposure from changes in market rates of interest in a more rigorous and explicit fashion. Our current financial position is combined with assumptions regarding future business to calculate net interest income under varying hypothetical rate scenarios. The EVE measures our long-term earnings exposure from changes in market rates of interest. EVE is defined as the present value of assets minus the present value of liabilities at a point in time. A decrease in EVE due to a specified rate change indicates a decline in the long-term earnings capacity of the balance sheet assuming that the rate change remains in effect over the life of the current balance sheet.
The following rate shock analysis depicts the estimated impact on net interest income and EVE of immediate changes in interest rates at the specified levels at December 31:
| Percentage Change In: | ||||||||||||
| Change in Interest Rates | Net Interest Income(1) | Economic Value of Equity (2) |
||||||||||
| (In Basis Points) |
2009 | 2008 | 2009 | 2008 | ||||||||
| +200 |
3.15 | % | 8.85 | % | 6.03 | % | 10.77 | % | ||||
| +100 |
0.95 | % | 4.96 | % | 6.27 | % | 8.49 | % | ||||
| -100 |
(1.51 | )% | (4.13 | )% | (10.56 | )% | (9.03 | )% | ||||
| -200 |
1.06 | % | (5.88 | )% | (14.08 | )% | (17.01 | )% | ||||
| (1) | The percentage change in this column represents net interest income for 12 months in a stable interest rate environment versus the net interest income in the various rate scenarios. |
| (2) | The percentage change in this column represents our EVE in a stable interest rate environment versus the EVE in the various rate scenarios. |
The preceding measures assume no change in asset/liability compositions. Thus, the measures do not reflect actions the ALCO may undertake in response to such changes in interest rates. The balance sheet structure as of December 31, 2009 and 2008 indicates we are asset sensitive. The above results of the interest rate shock analysis are within the limits set by the Board of Directors. The scenarios assume instantaneous movements in interest rates in increments of 100 and 200 basis points. With the present position of the target federal funds rate, the declining rate scenarios seem improbable. Further, it has been the Federal Reserve’s policy to adjust the target federal funds rate incrementally over time. As interest rates are adjusted over a period of time, it is our strategy to proactively change the volume and mix of our balance sheet in order to mitigate our interest rate risk. The computation of the prospective effects of hypothetical interest rate changes requires numerous assumptions regarding characteristics of new business and the behavior of existing positions. These business assumptions are based upon our experience, business plans and published industry experience. Key assumptions employed in the model include asset prepayment speeds, competitive factors, the relative price sensitivity of certain assets and liabilities and the expected life of non-maturity deposits. Because these assumptions are inherently uncertain, actual results will differ from simulated results.
We have entered into interest rate swaps to mitigate our interest rate risk. The Company has entered into an interest rate swap with a notional amount of $31,000 whereby we receive a variable rate of interest based on the three-month LIBOR plus 187 basis points and pay a fixed rate of 5.70%. The swap has a maturity date of March 2010. The
43
Table of Contents
Index to Financial Statements
interest rate swap is a designated cash flow hedge designed to convert the variable interest rate on $31,000 of our junior subordinated debentures to a fixed rate. At December 31, 2009, the rate paid to us by the third-party was 358 basis points lower than the rate we paid on this swap. In addition, the Company has entered into interest rate swaps with a notional amount of $75,000 whereby it receives a fixed rate of interest and pays a variable rate based on the Prime rate. The swaps have a maturity date of August 2012 and August 2013. These interest rate swaps are a designated cash flow hedge designed to convert the variable interest rate on $75,000 of loans to a fixed rate. At December 31, 2009, the rate paid to us by the third-party was 374 basis points higher than the rate we paid on these swaps. For more information about the Company’s derivative financial instruments, see Note Q, “Derivative Instruments,” in the Notes to Consolidated Financial Statements of the Company in Item 8, Financial Statements and Supplementary Data.
The Company enters into mortgage loan commitments with its customers. Under the mortgage loan commitments, interest rates for a mortgage loan are locked in with the customer for a period of time, typically thirty days. Once a mortgage loan commitment is entered into with a customer, the Company enters into a sales agreement with an investor in the secondary market to sell such loan on a “best efforts” basis. As such, the Company does not incur risk if the mortgage loan commitment in the pipeline fails to close. Other than mortgage loan commitments and the interest rate swaps, we have not entered into any other derivative activities.
Liquidity and Capital Resources
Liquidity management is the ability to meet the cash flow requirements of customers who may be either depositors wishing to withdraw funds or borrowers needing assurance that sufficient funds will be available to meet their credit needs.
Core deposits, which are deposits excluding time deposits, are a major source of funds used by the Bank to meet cash flow needs. Maintaining the ability to acquire these funds as needed in a variety of markets is the key to assuring the Bank’s liquidity. Management continually monitors the liquidity and non-core dependency ratios to ensure compliance with ALCO targets.
Our investment portfolio is another alternative for meeting liquidity needs. These assets generally have readily available markets that offer conversions to cash as needed. Within the next twelve months the securities available for sale portfolio is forecasted to generate cash flow through maturities equal to 43.79% of the carrying value of the total securities available for sale portfolio. Securities within our investment portfolio are also used to secure certain deposit types and short-term borrowings. At December 31, 2009, securities with a carrying value of approximately $386,965 were pledged to secure public fund deposits and as collateral for short-term borrowings as compared to $468,640 at December 31, 2008. During 2009, management implemented a strategy to reduce public fund deposits through pricing initiatives and the runoff of deposit balances as government agencies utilized the funds held in these accounts, resulting in an increase in the amount of unpledged investment securities
Other sources available for meeting liquidity needs include federal funds purchased and advances from the FHLB. Interest is charged at the prevailing market rate on federal funds purchased and FHLB advances. There were no outstanding federal funds purchased at December 31, 2009. Federal funds purchased at December 31, 2008 totaled $63,800. Funds obtained from the FHLB are used primarily to match-fund real estate loans and other longer-term fixed rate loans in order to minimize interest rate risk and may be used to meet day to day liquidity needs (primarily when the cost of such borrowing compares favorably to the rates that we would be required to pay to attract deposits). As of December 31, 2009, the balance of our outstanding advances with the FHLB was $469,574. The total amount of the remaining credit available to us from the FHLB at December 31, 2009 was $312,154. We also maintain lines of credits with other commercial banks totaling $85,000. These are unsecured lines of credit maturing at various times within the next twelve months. At December 31, 2009 and 2008, there were no amounts outstanding under these lines of credit.
In October 2008, the FDIC announced the Temporary Liquidity Guaranty Program (“TLGP”) to strengthen confidence and encourage liquidity in the banking system by guaranteeing newly issued senior unsecured debt of banks, thrifts, and certain holding companies and by providing full deposit insurance coverage of non-interest bearing deposit transaction accounts, regardless of dollar amount. Under the final rules, qualifying newly issued senior unsecured debt with a maturity greater than 30 days issued on or before October 31, 2009, would be backed by the full faith and credit of the United States through June 30, 2012. The guarantee was limited to 2% of consolidated liabilities for entities, such as the Company, that had no senior unsecured debt outstanding as of September 30, 2008. Renasant Bank issued $50,000 of qualifying senior debt securities guaranteed under the TLGP in March 2009. Management used the proceeds from the debt issuance to pay-off long term advances with the FHLB as they matured in 2009.
44
Table of Contents
Index to Financial Statements
The following table presents the percentage of total average deposits and borrowed funds, by type, and total cost of funds, for each of the years presented:
| Percentage of Total | Cost of Funds | |||||||||||||||||
| 2009 | 2008 | 2007 | 2009 | 2008 | 2007 | |||||||||||||
| Noninterest-bearing demand |
9.16 | % | 8.96 | % | 10.13 | % | — | % | — | % | — | % | ||||||
| Interest-bearing demand |
27.29 | 24.95 | 27.88 | 1.33 | 1.78 | 2.81 | ||||||||||||
| Savings |
2.80 | 3.23 | 3.54 | 0.17 | 0.54 | 1.17 | ||||||||||||
| Time deposits |
39.68 | 39.16 | 46.12 | 2.67 | 3.80 | 4.80 | ||||||||||||
| Federal Home Loan Bank advances |
16.52 | 19.76 | 8.77 | 3.42 | 3.43 | 4.93 | ||||||||||||
| Other borrowed funds |
4.55 | 3.94 | 3.56 | 3.99 | 4.60 | 6.76 | ||||||||||||
| Total deposits and borrowed funds |
100.00 | % | 100.00 | % | 100.00 | % | 2.17 | % | 2.81 | % | 3.71 | % | ||||||
Our strategy in choosing funds is focused on attempting to mitigate interest rate risk, and thus we utilize funding sources that are commensurate with the interest rate risk associated with the assets. Accordingly, management targets growth of non-interest bearing deposits. While we do not control the types of deposit instruments our clients choose, we do influence those choices with the rates we offer and with the deposit specials we offer. For example, we could obtain time deposits based on our aggressiveness in pricing and length of term. We constantly monitor our funds position and evaluate the effect various funding sources have on our financial position.
Our cost of funds decreased in 2009 as management used lower costing deposits and repaid higher costing funding sources. For 2008, our cost of funds decreased as management took advantage of lower costing alternative funding sources, such as FHLB advances, rather than competing for the higher costing deposits available in our markets. Also, in the second half of 2007, customers began moving funds into short-term (less than one year) time deposits as short-term interest rates were the same or higher than longer term rates. As such, 69.80% of our time deposits had a maturity of less than 12 months at December 31, 2008.
Cash and cash equivalents were $148,560 at December 31, 2009, compared to $100,394 at December 31, 2008 and $99,793 at December 31, 2007. Cash provided by investing activities for the year ended December 31, 2009 was $96,594, compared to cash used in investing activities of $156,224 in 2008 and $353,805 in 2007. A net decrease in loans provided funds of $112,266 and $14,400 during 2009 and 2008, respectively, compared to $262,016 used to fund loan growth for 2007. The Company used $362,865 to purchase investment securities in 2009. In 2009, we received proceeds of $348,237 from the sale and maturity of our securities in our investment portfolio. Cash used in investing activities for the year ended December 31, 2007 includes the net cash paid for the Capital merger of $52,606.
Cash used in financing activities for the year ended December 31, 2009 was $98,133, compared to cash provided by financing activities of $94,224 for the same period of 2008 and $312,129 in 2007. Cash flows from the generation of deposits during the year ended December 31, 2009 of $231,769 were used primarily to reduce our total borrowings by $372,679. Proceeds from long-term debt for the year ended December 31, 2009 were $56,935, which includes $50,000 of proceeds from the issuance of guaranteed senior unsecured debt under the TLGP discussed above. Cash provided by financing activities for 2007 includes the proceeds from the issuance of 2.76 million shares of the Company’s common stock in a public equity offering. The proceeds from the equity offering totaled $58,126 and were used to the fund the cash portion of the merger consideration for the Capital merger.
The Company completed the merger with Capital on July 1, 2007. The aggregate transaction value, including transaction expenses and the dilutive impact of Capital’s options assumed by the Company, was approximately $131,400. In accordance with the merger agreement, the Company delivered to Capital shareholders either cash, Company common stock or a combination of cash and Company common stock, in exchange for the shares of Capital common stock owned by a shareholder. The cash portion of the merger consideration was $56,055 and was funded with the proceeds of the Company’s equity offering. The Company issued 2,797,238 shares of its common stock in the transaction, totaling approximately $67,497. These shares were registered under the Securities Act of 1933, as amended.
45
Table of Contents
Index to Financial Statements
The Company’s liquidity and capital resources are substantially dependent on the ability of the Bank to transfer funds to the Company in the form of dividends, loans and advances. Please refer to Note M, “Restrictions on Cash, Bank Dividends, Loans or Advances,” in the Notes to Consolidated Financial Statements of the Company in Item 8, Financial Statements and Supplementary Data, for a detailed discussion of the federal and state restrictions on the Bank’s ability to transfer funds to the Company.
Off-Balance Sheet Transactions
The Company enters into loan commitments and standby letters of credit in the normal course of its business. Loan commitments are made to accommodate the financial needs of the Company’s customers. Standby letters of credit commit the Company to make payments on behalf of customers when certain specified future events occur. Both arrangements have credit risk essentially the same as that involved in extending loans to customers and are subject to the Company’s normal credit policies. Collateral (e.g., securities, receivables, inventory, equipment, etc.) is obtained based on management’s credit assessment of the customer.
Loan commitments and standby letters of credit do not necessarily represent future cash requirements of the Company in that while the borrower has the ability to draw upon these commitments at any time, these commitments often expire without being drawn upon. The Company’s unfunded loan commitments and standby letters of credit outstanding at December 31, 2009, 2008 and 2007 are as follows:
| 2009 | 2008 | 2007 | |||||||
| Loan commitments |
$ | 320,259 | $ | 614,311 | $ | 794,592 | |||
| Standby letters of credit |
28,956 | 27,497 | 27,843 | ||||||
The Company closely monitors the amount of remaining future commitments to borrowers in light of prevailing economic conditions and adjusts these commitments as necessary. The Company will continue this process as new commitments are entered into or existing commitments are renewed.
For more information about the Company’s off-balance sheet transactions, see Note J, “Commitments, Contingent Liabilities and Financial Instruments with Off-Balance Sheet Risk,” in the Notes to Consolidated Financial Statements of the Company in Item 8, Financial Statements and Supplementary Data.
Contractual Obligations
The following table presents, as of December 31, 2009, significant fixed and determinable contractual obligations to third parties by payment date. The Note Reference below refers to the applicable footnote in the Notes to Consolidated Financial Statements in Item 8, Financial Statements and Supplementary Data.
| Payments Due In: | |||||||||||||||||
| Note Reference |
Less Than One Year |
One to Three Years |
Three to Five Years |
Over Five Years |
Total | ||||||||||||
| Operating leases |
D | $ | 1,860 | $ | 3,329 | $ | 2,933 | $ | 6,825 | $ | 14,947 | ||||||
| Deposits without a stated maturity(1) |
G | 1,324,332 | — | — | — | 1,324,332 | |||||||||||
| Time deposits |
G | 799,033 | 418,979 | 33,404 | 352 | 1,251,768 | |||||||||||
| Treasury, tax and loan notes |
H | 2,682 | — | — | — | 2,682 | |||||||||||
| Securities sold under agreements to repurchase |
H | 19,715 | — | — | — | 19,715 | |||||||||||
| Federal Home Loan Bank advances |
I | 169,810 | 192,976 | 45,632 | 61,156 | 469,574 | |||||||||||
| Junior subordinated debentures |
I | — | — | — | 76,053 | 76,053 | |||||||||||
| TLGP Senior Note |
I | — | 50,000 | — | — | 50,000 | |||||||||||
| Purchase obligations(2) |
105 | — | — | — | 105 | ||||||||||||
| Total contractual obligations |
$ | 2,317,537 | $ | 665,284 | $ | 81,969 | $ | 144,386 | $ | 3,209,176 | |||||||
| (1) | Excludes interest. |
| (2) | Purchase obligations represent obligations under agreements to purchase goods or services that are enforceable and legally binding on the Company and that specify all significant terms, including: fixed or minimum quantities to be purchased; fixed, minimum or variable price provisions; and the approximate timing of the transaction. The purchase obligation amounts presented above primarily relate to certain contractual payments for capital expenditures expected to be incurred in connection with the opening of a new branch. |
46
Table of Contents
Index to Financial Statements
Shareholders’ Equity and Regulatory Matters
Total shareholders’ equity of the Company was $410,122, $400,371 and $399,073 at December 31, 2009, 2008 and 2007, respectively. Book value per share was $19.45, $19.00 and $19.15 at December 31, 2009, 2008 and 2007, respectively. The growth in shareholders’ equity was attributable to earnings retention offset by dividends declared and changes in accumulated other comprehensive income.
On July 8, 2009, the Company filed a shelf registration statement with the Securities and Exchange Commission (“SEC”). The shelf registration statement, which the SEC declared effective on July 13, 2009, allows the Company to raise capital from time to time, up to an aggregate of $150,000, through the sale of common stock, preferred stock, warrants and units, or a combination thereof, subject to market conditions. Specific terms and prices will be determined at the time of any offering under a separate prospectus supplement that the Company will be required to file with the SEC at the time of the specific offering. The proceeds of the sale of securities, if and when offered, will be used for general corporate purposes as described in any prospectus supplement and could include the expansion of the Company’s banking, insurance and wealth management operations as well as other business opportunities.
The Company adopted a share repurchase plan in September 2002 which authorized the repurchase of 2,595,031 shares of the Company’s common stock, subject to a monthly purchase limit of $2.0 million. This plan was terminated by the Board of Directors in January 2008. Shares repurchased are held for reissue in connection with stock compensation plans and for general corporate purposes. Approximately 96,000 and 384,000 shares of stock were purchased during 2008 and 2007 for a total purchase price of $2,004 and $7,810, respectively.
The Company has junior subordinated debentures with a carrying value of $76,053 at December 31, 2009, of which $73,000 are included in the Company’s Tier I capital. The Federal Reserve Board issued guidance in March 2005 providing more strict quantitative limits on the amount of securities, similar to our junior subordinated debentures, that are includable in Tier 1 capital. The new guidance, which became effective in March 2009, did not impact the amount of debentures we include in Tier 1 capital.
The Federal Reserve, the FDIC and the Office of the Comptroller of the Currency have issued guidelines governing the levels of capital that banks must maintain. Those guidelines specify capital tiers, which include the following classifications:
| Capital Tiers |
Tier I Capital to Average Assets (Leverage) |
Tier I Capital to Risk – Weighted Assets |
Total Capital to Risk – Weighted Assets | |||
| Well capitalized |
5% or above | 6% or above | 10% or above | |||
| Adequately capitalized |
4% or above | 4% or above | 8% or above | |||
| Undercapitalized |
Less than 4% | Less than 4% | Less than 8% | |||
| Significantly undercapitalized |
Less than 3% | Less than 3% | Less than 6% | |||
| Critically undercapitalized |
2% or less |
The following table includes the capital ratios and capital amounts for the Company and the Bank as of December 31, 2009:
| Actual | Minimum Capital Requirement to be Well Capitalized |
Minimum Capital Requirement to be Adequately Capitalized |
||||||||||||||||
| Amount | Ratio | Amount | Ratio | Amount | Ratio | |||||||||||||
| Tier I Capital to Average Assets |
||||||||||||||||||
| Renasant Corporation |
$ | 299,221 | 8.68 | % | $ | 172,458 | 5.00 | % | $ | 137,966 | 4.00 | % | ||||||
| Renasant Bank |
291,115 | 8.47 | % | 171,885 | 5.00 | % | 137,508 | 4.00 | % | |||||||||
| Tier I Capital to Risk-Weighted Assets |
||||||||||||||||||
| Renasant Corporation |
$ | 299,221 | 11.12 | % | $ | 161,386 | 6.00 | % | $ | 107,591 | 4.00 | % | ||||||
| Renasant Bank |
291,115 | 10.85 | % | 161,047 | 6.00 | % | 107,365 | 4.00 | % | |||||||||
| Total Capital to Risk-Weighted Assets |
||||||||||||||||||
| Renasant Corporation |
$ | 332,780 | 12.37 | % | $ | 268,977 | 10.00 | % | $ | 215,182 | 8.00 | % | ||||||
| Renasant Bank |
324,674 | 12.10 | % | 268,411 | 10.00 | % | 214,729 | 8.00 | % | |||||||||
47
Table of Contents
Index to Financial Statements
SEC Form 10-K
A COPY OF THIS ANNUAL REPORT ON FORM 10-K , AS FILED WITH THE SECURITIES AND EXCHANGE COMMISSION, MAY BE OBTAINED WITHOUT CHARGE BY DIRECTING A WRITTEN REQUEST TO: JOHN S. OXFORD, VICE PRESIDENT, RENASANT CORPORATION, 209 TROY STREET, TUPELO, MISSISSIPPI, 38804-4827.
| ITEM 7A. | QUANTITATIVE AND QUALITATIVE DISCLOSURES ABOUT MARKET RISK |
Please refer to the discussion found under the captions “Risk Management – Interest Rate Risk” and “Liquidity and Capital Resources” in Management’s Discussion and Analysis of Financial Condition and Results of Operations above for the disclosures required pursuant to this Item 7A.
| ITEM 8. | FINANCIAL STATEMENTS AND SUPPLEMENTARY DATA |
The Consolidated Financial Statements of the Company meeting the requirements of Regulation S-X are included on the succeeding pages of this Item. All schedules have been omitted because they are not required or are not applicable.
RENASANT CORPORATION AND SUBSIDIARIES
CONSOLIDATED FINANCIAL STATEMENTS
Years Ended December 31, 2009, 2008 and 2007
| Page | ||
| Report on Management’s Assessment of Internal Control over Financial Reporting |
49 | |
| 50 | ||
| 52 | ||
| 53 | ||
| 54 | ||
| 55 | ||
| 56 |
48
Table of Contents
Index to Financial Statements
Report on Management’s Assessment of
Internal Control over Financial Reporting
Renasant Corporation (the “Company”) is responsible for the preparation, integrity and fair presentation of the consolidated financial statements included in this annual report. The consolidated financial statements and notes included in this annual report have been prepared in conformity with accounting principles generally accepted in the United States and necessarily include some amounts that are based on management’s best estimates and judgments.
We, as management of the Company, are responsible for establishing and maintaining effective internal control over financial reporting that is designed to produce reliable financial statements in conformity with accounting principles generally accepted in the United States. The Company’s internal control over financial reporting includes those policies and procedures that: (1) pertain to the maintenance of records that, in reasonable detail, accurately and fairly reflect the transactions and dispositions of the assets of the Company; (2) provide reasonable assurance that transactions are recorded as necessary to permit preparation of financial statements in accordance with accounting principles generally accepted in the United States and that receipts and expenditures of the Company are being made only in accordance with authorizations of management and directors of the Company; and (3) provide reasonable assurance regarding prevention or timely detection of unauthorized acquisition, use or disposition of the Company’s assets that could have a material effect on the financial statements.
The system of internal control over financial reporting as it relates to the financial statements is evaluated for effectiveness by management and tested for reliability through a program of internal audits. Actions are taken to correct potential deficiencies as they are identified. Any system of internal control, no matter how well designed, has inherent limitations, including the possibility that a control can be circumvented or overridden, and misstatements due to error or fraud may occur and not be detected. Also, because of changes in conditions, internal control effectiveness may vary over time. Accordingly, even an effective system of internal control will provide only reasonable assurance with respect to financial statement preparation.
Management, with the participation of the Company’s chief executive officer and chief financial officer, conducted an assessment of the Company’s system of internal control over financial reporting as of December 31, 2009, based on criteria for effective internal control over financial reporting described in “Internal Control - Integrated Framework,” issued by the Committee of Sponsoring Organizations of the Treadway Commission. Based on this assessment, management has concluded that, as of December 31, 2009, its system of internal control over financial reporting is effective and meets the criteria of the “Internal Control – Integrated Framework”. HORNE LLP, the Company’s independent registered public accounting firm that has audited the Company’s financial statements included in this annual report, has issued an attestation report on the Company’s internal control over financial reporting which is included herein.
| /s/ E. Robinson McGraw |
/s/ Stuart R. Johnson | |||
| E. Robinson McGraw |
Stuart R. Johnson | |||
| Chairman, President and Chief Executive Officer |
Executive Vice President and Chief Financial Officer | |||
| March 3, 2010 |
||||
49
Table of Contents
Index to Financial Statements
Report of Independent Registered Public Accounting Firm
To the Board of Directors and Shareholders
Renasant Corporation
Tupelo, Mississippi
We have audited the accompanying consolidated balance sheets of Renasant Corporation and subsidiaries (the “Company”) as of December 31, 2009 and 2008, and the related consolidated statements of income, changes in shareholders’ equity, and cash flows for each of the three years in the period ended December 31, 2009. These financial statements are the responsibility of the Company’s management. Our responsibility is to express an opinion on these financial statements based on our audits.
We conducted our audits in accordance with the standards of the Public Company Accounting Oversight Board (United States). Those standards require that we plan and perform the audit to obtain reasonable assurance about whether the financial statements are free of material misstatement. An audit includes examining, on a test basis, evidence supporting the amounts and disclosures in the financial statements. An audit also includes assessing the accounting principles used and significant estimates made by management, as well as evaluating the overall financial statement presentation. We believe that our audits provide a reasonable basis for our opinion.
In our opinion, the consolidated financial statements referred to above present fairly, in all material respects, the financial position of the Company as of December 31, 2009 and 2008, and the results of its operations, changes in shareholders’ equity and cash flows for each of the three years in the period ended December 31, 2009, in conformity with accounting principles generally accepted in the United States of America.
We have also audited, in accordance with the standards of the Public Company Accounting Oversight Board (United States), the Company’s internal control over financial reporting as of December 31, 2009, based on criteria established in Internal Control — Integrated Framework issued by the Committee of Sponsoring Organizations of the Treadway Commission, and our report dated March 3, 2010 expressed an unqualified opinion on the effectiveness of the Company’s internal control over financial reporting.
| /s/ Home LLP |
| Memphis, Tennessee |
| March 3, 2010 |
50
Table of Contents
Index to Financial Statements
Report of Independent Registered Public Accounting Firm
To the Board of Directors and Shareholders
Renasant Corporation
Tupelo, Mississippi
We have audited Renasant Corporation and subsidiaries’ (the “Company”) internal control over financial reporting as of December 31, 2009, based on criteria established in Internal Control — Integrated Framework issued by the Committee of Sponsoring Organizations of the Treadway Commission. The Company’s management is responsible for maintaining effective internal control over financial reporting and for its assessment of the effectiveness of internal control over financial reporting included in the accompanying Report on Management’s Assessment of Internal Control over Financial Reporting. Our responsibility is to express an opinion on the Company’s internal control over financial reporting based on our audit.
We conducted our audit in accordance with the standards of the Public Company Accounting Oversight Board (United States). Those standards require that we plan and perform the audit to obtain reasonable assurance about whether effective internal control over financial reporting was maintained in all material respects. Our audit included obtaining an understanding of internal control over financial reporting, assessing the risk that a material weakness exists, and testing and evaluating the design and operating effectiveness of internal control based on the assessed risk. Our audit also included performing such other procedures as we considered necessary in the circumstances. We believe that our audit provides a reasonable basis for our opinion.
A company’s internal control over financial reporting is a process designed to provide reasonable assurance regarding the reliability of financial reporting and the preparation of financial statements for external purposes in accordance with generally accepted accounting principles. A company’s internal control over financial reporting includes those policies and procedures that (a) pertain to the maintenance of records that, in reasonable detail, accurately and fairly reflect the transactions and dispositions of the assets of the company; (b) provide reasonable assurance that transactions are recorded as necessary to permit preparation of financial statements in accordance with generally accepted accounting principles, and that receipts and expenditures of the company are being made only in accordance with authorizations of management and directors of the company; and (c) provide reasonable assurance regarding prevention or timely detection of unauthorized acquisition, use, or disposition of the company’s assets that could have a material effect on the financial statements.
Because of its inherent limitations, internal control over financial reporting may not prevent or detect misstatements. Also, projections of any evaluation of effectiveness to future periods are subject to the risk that controls may become inadequate because of changes in conditions, or that the degree of compliance with the policies or procedures may deteriorate.
In our opinion, the Company maintained, in all material respects, effective internal control over financial reporting as of December 31, 2009, based on criteria established in Internal Control — Integrated Framework issued by the Committee of Sponsoring Organizations of the Treadway Commission.
We have also audited, in accordance with the standards of the Public Company Accounting Oversight Board (United States), the consolidated balance sheets of Company as of December 31, 2009 and 2008, and the related consolidated statements of income, changes in shareholders’ equity, and cash flows for each of the three years in the period ended December 31, 2009 of the Company and our report dated March 3, 2010 expressed an unqualified opinion.
| /s/ Home LLP |
| Memphis, Tennessee |
| March 3, 2010 |
51
Table of Contents
Index to Financial Statements
Renasant Corporation and Subsidiaries
Consolidated Balance Sheets
(In Thousands, Except Share Data)
| December 31, | ||||||||
| 2009 | 2008 | |||||||
| Assets |
||||||||
| Cash and due from banks |
$ | 63,049 | $ | 81,427 | ||||
| Interest-bearing balances with banks |
85,511 | 18,967 | ||||||
| Cash and cash equivalents |
148,560 | 100,394 | ||||||
| Securities held to maturity (fair value of $139,433 at December 31, 2009) |
138,806 | — | ||||||
| Securities available for sale |
575,358 | 695,106 | ||||||
| Mortgage loans held for sale |
25,749 | 41,805 | ||||||
| Loans, net of unearned income |
2,347,615 | 2,530,886 | ||||||
| Allowance for loan losses |
(39,145 | ) | (34,905 | ) | ||||
| Net loans |
2,308,470 | 2,495,981 | ||||||
| Premises and equipment, net |
43,672 | 46,992 | ||||||
| Intangible assets, net |
191,357 | 193,323 | ||||||
| Other assets |
209,109 | 142,379 | ||||||
| Total assets |
$ | 3,641,081 | $ | 3,715,980 | ||||
| Liabilities and shareholders’ equity |
||||||||
| Liabilities |
||||||||
| Deposits |
||||||||
| Noninterest-bearing |
$ | 304,962 | $ | 284,227 | ||||
| Interest-bearing |
2,271,138 | 2,060,104 | ||||||
| Total deposits |
2,576,100 | 2,344,331 | ||||||
| Short-term borrowings |
22,397 | 314,541 | ||||||
| Long-term debt |
595,627 | 619,435 | ||||||
| Other liabilities |
36,835 | 37,302 | ||||||
| Total liabilities |
3,230,959 | 3,315,609 | ||||||
| Shareholders’ equity |
||||||||
| Preferred stock, $.01 par value – 5,000,000 shares authorized; no shares issued and outstanding |
— | — | ||||||
| Common stock, $5.00 par value – 75,000,000 shares authorized, 22,790,797 shares issued; 21,082,991 and 21,067,539 shares outstanding as of December 31, 2009 and 2008, respectively |
113,954 | 113,954 | ||||||
| Treasury stock, at cost |
(27,788 | ) | (28,044 | ) | ||||
| Additional paid-in capital |
184,831 | 184,273 | ||||||
| Retained earnings |
146,581 | 142,427 | ||||||
| Accumulated other comprehensive loss |
(7,456 | ) | (12,239 | ) | ||||
| Total shareholders’ equity |
410,122 | 400,371 | ||||||
| Total liabilities and shareholders’ equity |
$ | 3,641,081 | $ | 3,715,980 | ||||
See Notes to Consolidated Financial Statements.
52
Table of Contents
Index to Financial Statements
Renasant Corporation and Subsidiaries
Consolidated Statements of Income
(In Thousands, Except Share Data)
| Year Ended December 31, | |||||||||
| 2009 | 2008 | 2007 | |||||||
| Interest income |
|||||||||
| Loans |
$ | 138,738 | $ | 167,580 | $ | 172,483 | |||
| Securities: |
|||||||||
| Taxable |
26,603 | 28,258 | 20,576 | ||||||
| Tax-exempt |
4,996 | 4,585 | 3,618 | ||||||
| Other |
227 | 539 | 1,526 | ||||||
| Total interest income |
170,564 | 200,962 | 198,203 | ||||||
| Interest expense |
|||||||||
| Deposits |
46,708 | 63,509 | 83,816 | ||||||
| Borrowings |
24,390 | 28,011 | 18,566 | ||||||
| Total interest expense |
71,098 | 91,520 | 102,382 | ||||||
| Net interest income |
99,466 | 109,442 | 95,821 | ||||||
| Provision for loan losses |
26,890 | 22,804 | 4,838 | ||||||
| Net interest income after provision for loan losses |
72,576 | 86,638 | 90,983 | ||||||
| Noninterest income |
|||||||||
| Service charges on deposit accounts |
22,000 | 22,645 | 20,528 | ||||||
| Fees and commissions |
16,621 | 16,118 | 15,726 | ||||||
| Insurance commissions |
3,319 | 3,483 | 3,549 | ||||||
| Trust revenue |
2,039 | 2,444 | 2,859 | ||||||
| Gains on sales of securities, net |
1,673 | — | 78 | ||||||
| BOLI income |
2,439 | 2,160 | 2,664 | ||||||
| Gains on sales of mortgage loans held for sale |
7,566 | 5,447 | 4,863 | ||||||
| Other |
1,901 | 1,745 | 1,920 | ||||||
| Total noninterest income |
57,558 | 54,042 | 52,187 | ||||||
| Noninterest expense |
|||||||||
| Salaries and employee benefits |
55,415 | 57,400 | 54,990 | ||||||
| Data processing |
5,605 | 5,209 | 4,885 | ||||||
| Net occupancy |
8,314 | 8,592 | 7,999 | ||||||
| Equipment |
4,024 | 4,703 | 4,208 | ||||||
| Professional fees |
3,813 | 3,509 | 2,705 | ||||||
| Advertising and public relations |
3,176 | 5,085 | 5,123 | ||||||
| Intangible amortization |
1,966 | 2,455 | 1,991 | ||||||
| Communications |
4,390 | 4,591 | 4,789 | ||||||
| Other |
19,050 | 16,424 | 11,310 | ||||||
| Total noninterest expense |
105,753 | 107,968 | 98,000 | ||||||
| Income before income taxes |
24,381 | 32,712 | 45,170 | ||||||
| Income taxes |
5,863 | 8,660 | 14,069 | ||||||
| Net income |
$ | 18,518 | $ | 24,052 | $ | 31,101 | |||
| Basic earnings per share |
$ | 0.88 | $ | 1.15 | $ | 1.66 | |||
| Diluted earnings per share |
$ | 0.87 | $ | 1.14 | $ | 1.64 | |||
See Notes to Consolidated Financial Statements.
53
Table of Contents
Index to Financial Statements
Renasant Corporation and Subsidiaries
Consolidated Statements of Changes in Shareholders’ Equity
(In Thousands, Except Share Data)
| Accumulated | ||||||||||||||||||||||||||
| Additional | Other | |||||||||||||||||||||||||
| Common Stock | Treasury | Paid-In | Retained | Comprehensive | ||||||||||||||||||||||
| Shares | Amount | Stock | Capital | Earnings | Income (Loss) | Total | ||||||||||||||||||||
| Balance at January 1, 2007 |
15,536,475 | $ | 86,168 | $ | (25,719 | ) | $ | 83,844 | $ | 114,254 | $ | (5,843 | ) | $ | 252,704 | |||||||||||
| Net income |
31,101 | 31,101 | ||||||||||||||||||||||||
| Changes in other comprehensive income (loss) |
4,745 | 4,745 | ||||||||||||||||||||||||
| Comprehensive income |
35,846 | |||||||||||||||||||||||||
| Cash dividends ($0.660 per share) |
(12,581 | ) | (12,581 | ) | ||||||||||||||||||||||
| Shares issued in business combinations |
2,797,238 | 13,986 | 53,511 | 67,497 | ||||||||||||||||||||||
| Valuation of options assumed |
2,496 | 2,496 | ||||||||||||||||||||||||
| Shares issued in equity offering |
2,760,000 | 13,800 | 44,326 | 58,126 | ||||||||||||||||||||||
| Exercise of stock-based compensation |
131,422 | 2,116 | (255 | ) | 1,861 | |||||||||||||||||||||
| Stock option compensation |
934 | 934 | ||||||||||||||||||||||||
| Treasury stock purchased |
(383,770 | ) | (7,810 | ) | (7,810 | ) | ||||||||||||||||||||
| Balance at December 31, 2007 |
20,841,365 | 113,954 | (31,413 | ) | 184,856 | 132,774 | (1,098 | ) | 399,073 | |||||||||||||||||
| Net income |
24,052 | 24,052 | ||||||||||||||||||||||||
| Changes in other comprehensive income (loss) |
(11,141 | ) | (11,141 | ) | ||||||||||||||||||||||
| Comprehensive income |
12,911 | |||||||||||||||||||||||||
| Cumulative effect of change in accounting for endorsement split-dollar life insurance arrangements |
(78 | ) | (78 | ) | ||||||||||||||||||||||
| Cash dividends ($0.680 per share) |
(14,321 | ) | (14,321 | ) | ||||||||||||||||||||||
| Exercise of stock-based compensation |
322,159 | 5,373 | (1,597 | ) | 3,776 | |||||||||||||||||||||
| Stock option compensation |
1,014 | 1,014 | ||||||||||||||||||||||||
| Treasury stock purchased |
(95,985 | ) | (2,004 | ) | (2,004 | ) | ||||||||||||||||||||
| Balance at December 31, 2008 |
21,067,539 | 113,954 | (28,044 | ) | 184,273 | 142,427 | (12,239 | ) | 400,371 | |||||||||||||||||
| Net income |
18,518 | 18,518 | ||||||||||||||||||||||||
| Changes in other comprehensive income (loss) |
4,783 | 4,783 | ||||||||||||||||||||||||
| Comprehensive income |
23,301 | |||||||||||||||||||||||||
| Cash dividends ($0.680 per share) |
(14,364 | ) | (14,364 | ) | ||||||||||||||||||||||
| Exercise of stock-based compensation |
15,452 | 256 | (68 | ) | 188 | |||||||||||||||||||||
| Stock option compensation |
626 | 626 | ||||||||||||||||||||||||
| Balance at December 31, 2009 |
21,082,991 | $ | 113,954 | $ | (27,788 | ) | $ | 184,831 | $ | 146,581 | $ | (7,456 | ) | $ | 410,122 | |||||||||||
See Notes to Consolidated Financial Statements.
54
Table of Contents
Index to Financial Statements
Renasant Corporation and Subsidiaries
Consolidated Statements of Cash Flows
(In Thousands, Except Share Data)
| Year Ended December 31, | ||||||||||||
| 2009 | 2008 | 2007 | ||||||||||
| Operating activities |
||||||||||||
| Net income |
$ | 18,518 | $ | 24,052 | $ | 31,101 | ||||||
| Adjustments to reconcile net income to net cash provided by operating activities: |
||||||||||||
| Provision for loan losses |
26,890 | 22,804 | 4,838 | |||||||||
| Depreciation, amortization and accretion |
8,899 | 6,648 | 6,539 | |||||||||
| Deferred income tax (benefit) expense |
(447 | ) | 1,575 | 106 | ||||||||
| Funding of mortgage loans held for sale |
(815,067 | ) | (742,090 | ) | (605,594 | ) | ||||||
| Proceeds from sales of mortgage loans held for sale |
838,689 | 743,200 | 613,101 | |||||||||
| Gains on sales of mortgage loans held for sale |
(7,566 | ) | (5,447 | ) | (4,863 | ) | ||||||
| Gains on sales of securities available for sale |
(1,673 | ) | — | (78 | ) | |||||||
| (Gains) losses on sales of premises and equipment |
(18 | ) | (109 | ) | 1 | |||||||
| Stock-based compensation |
626 | 1,014 | 1,444 | |||||||||
| (Increase) decrease in other assets |
(19,452 | ) | 15,150 | (7,402 | ) | |||||||
| Increase (decrease) in other liabilities |
306 | (4,196 | ) | 4,075 | ||||||||
| Net cash provided by operating activities |
49,705 | 62,601 | 43,268 | |||||||||
| Investing activities |
||||||||||||
| Purchases of securities available for sale |
(356,319 | ) | (326,064 | ) | (167,223 | ) | ||||||
| Proceeds from sales of securities available for sale |
107,739 | — | 54,944 | |||||||||
| Proceeds from call/maturities of securities available for sale |
233,654 | 159,506 | 78,221 | |||||||||
| Purchases of securities held to maturity |
(6,546 | ) | — | — | ||||||||
| Proceeds from call/maturities of securities held to maturity |
6,844 | — | — | |||||||||
| Net decrease (increase) in loans |
112,266 | 14,400 | (262,016 | ) | ||||||||
| Purchases of premises and equipment |
(1,113 | ) | (4,279 | ) | (5,477 | ) | ||||||
| Proceeds from sales of premises and equipment |
69 | 213 | 352 | |||||||||
| Net cash paid in business combination |
— | — | (52,606 | ) | ||||||||
| Net cash provided by (used in) investing activities |
96,594 | (156,224 | ) | (353,805 | ) | |||||||
| Financing activities |
||||||||||||
| Net increase (decrease) in noninterest-bearing deposits |
20,735 | (15,167 | ) | (11,808 | ) | |||||||
| Net increase (decrease) in interest-bearing deposits |
211,034 | (188,178 | ) | (39,739 | ) | |||||||
| Net (decrease) increase in short-term borrowings |
(292,144 | ) | (55,915 | ) | 321,949 | |||||||
| Proceeds from long-term debt |
56,935 | 438,940 | 75,372 | |||||||||
| Repayment of long-term debt |
(80,535 | ) | (73,227 | ) | (73,083 | ) | ||||||
| Purchase of treasury stock |
— | (2,004 | ) | (7,810 | ) | |||||||
| Cash paid for dividends |
(14,364 | ) | (14,321 | ) | (12,581 | ) | ||||||
| Cash received on exercise of stock-based compensation |
206 | 3,284 | 1,297 | |||||||||
| Excess tax benefits from stock-based compensation |
— | 812 | 406 | |||||||||
| Proceeds from equity offering |
— | — | 58,126 | |||||||||
| Net cash (used in) provided by financing activities |
(98,133 | ) | 94,224 | 312,129 | ||||||||
| Net increase in cash and cash equivalents |
48,166 | 601 | 1,592 | |||||||||
| Cash and cash equivalents at beginning of year |
100,394 | 99,793 | 98,201 | |||||||||
| Cash and cash equivalents at end of year |
$ | 148,560 | $ | 100,394 | $ | 99,793 | ||||||
| Supplemental disclosures |
||||||||||||
| Cash paid for interest |
$ | 72,955 | $ | 99,666 | $ | 97,423 | ||||||
| Cash paid for income taxes |
7,133 | 11,990 | 9,606 | |||||||||
| Noncash transactions: |
||||||||||||
| Transfers of loans to other real estate |
49,377 | 28,608 | 9,119 | |||||||||
| Transfer of securities classified as available for sale to held to maturity |
139,566 | — | — | |||||||||
| Common stock issued and fair value of stock options assumed in business combinations |
— | — | 69,993 | |||||||||
See Notes to Consolidated Financial Statements.
55
Table of Contents
Index to Financial Statements
Renasant Corporation and Subsidiaries
Notes to Consolidated Financial Statements
Note A – Significant Accounting Policies
(In Thousands, Except Share Data)
Nature of Operations: Renasant Corporation (referred to herein as the “Company”) offers a diversified range of financial and insurance services to its retail and commercial customers through its subsidiaries and full service offices located throughout north and north central Mississippi, west and middle Tennessee and north and north central Alabama.
Use of Estimates: The preparation of financial statements in conformity with accounting principles generally accepted in the United States requires management to make estimates and assumptions that affect the amounts reported in the financial statements and accompanying notes. Actual results could differ from those estimates.
Consolidation: In accordance with the Financial Accounting Standards Board (“FASB”) Accounting Standards Codification Topic (“Codification” or “ASC”) 810, “Consolidation” (“ASC 810”), a company’s consolidated financial statements are required to include subsidiaries in which the company has a controlling financial interest. The accompanying Consolidated Financial Statements and Notes to Consolidated Financial Statements include the accounts of the Company and its consolidated wholly-owned subsidiaries. All intercompany balances and transactions have been eliminated. Certain prior year amounts have been reclassified to conform to the current year presentation. The Company is not the primary beneficiary of any variable interest entity as defined by ASC 810.
Business Combinations: On July 1, 2007, the Company completed its merger with Capital Bancorp, Inc. (“Capital”). On the same date, Capital Bank & Trust Company was merged into Renasant Bank. The financial condition and results of operations for Capital are included in the Company’s financial statements since the date of the merger. This transaction was accounted for using the purchase method of accounting which reflects the net assets of the companies recorded at their fair value at the date of acquisition.
Future business combinations will be accounted for using the acquisition method of accounting which requires an acquirer to recognize the assets acquired, the liabilities assumed and any noncontrolling interest in the acquiree at the acquisition date, measured at their respective fair values.
Cash and Cash Equivalents: The Company considers all highly liquid investments with a maturity of three months or less when purchased to be cash equivalents.
Securities: Debt securities are classified as held to maturity when purchased if management has the intent and ability to hold the securities to maturity. Held to maturity securities are stated at amortized cost. Securities not classified as held to maturity or trading are classified as available for sale. Presently, the Company has no intention of establishing a trading classification. Available for sale securities are stated at fair value, with the unrealized gains and losses, net of tax, reported in accumulated other comprehensive income within shareholders’ equity.
The amortized cost of securities is adjusted for amortization of premiums and accretion of discounts. Such amortization and accretion is included in interest income from securities. Dividend income is included in interest income from securities. Realized gains and losses, as well as declines in value judged to be other than temporary, are included in net securities gains (losses). The cost of securities sold is based on the specific identification method.
Management periodically reviews the investment portfolio for impairment based upon a number of factors, including but not limited to, length of time and extent to which the fair value has been less than cost, the likelihood of the security’s ability to recover any decline in its fair value, financial condition of the underlying issuer, ability of the issuer to meet contractual obligations and ability to retain the security for a period of time sufficient to allow for recovery in fair value. Impairments on securities are recognized when management, based on its analysis, deems the impairment to be other-than-temporary. Disclosures about unrealized losses in our securities portfolio that have not been recognized as other-than-temporary impairments are provided in Note B, “Securities.”
Securities Sold Under Agreements to Repurchase: Securities sold under agreements to repurchase are accounted for as collateralized financing transactions and are recorded at the amounts at which the securities were sold. Securities, generally U.S. government and federal agency securities, pledged as collateral under these financing arrangements cannot be sold or repledged by the secured party.
Mortgage Loans Held for Sale: Mortgage loans held for sale represent residential mortgage loans held for sale. Loans held for sale are carried at the lower of aggregate cost or market value and are classified separately on the Consolidated Balance Sheets. Loans to be sold are locked in at the contractual rate upon closing, thereby eliminating any interest rate risk for the Company. Gains and losses are realized at the time consideration is received and all other criteria for sales treatment have been met. These gains and losses are classified under the caption “Gains on sales of mortgage loans held for sale” on the Consolidated Statements of Income.
56
Table of Contents
Index to Financial Statements
Renasant Corporation and Subsidiaries
Notes to Consolidated Financial Statements
Note A – Significant Accounting Policies (continued)
Loans and the Allowance for Loan Losses: Loans that management has the intent and ability to hold for the foreseeable future or until maturity or pay-off generally are reported at their outstanding unpaid principal balances adjusted for charge-offs, the allowance for loan losses and any deferred fees or costs on originated loans. Renasant Bank defers certain nonrefundable loan origination fees as well as the direct costs of originating or acquiring loans.
The deferred fees and costs are then amortized over the term of the note for all loans with payment schedules. Those loans with no payment schedule are amortized using the interest method. The amortization of these deferred fees is presented as an adjustment to the yield on loans. Interest income is accrued on the unpaid principal balance.
Generally, the accrual of interest on mortgage and commercial loans is discontinued at the time the loan is 90 days past due unless the credit is well-secured and in process of collection. Consumer and other retail loans are typically charged off no later than 120 days past due. In all cases, loans are placed on nonaccrual or charged-off at an earlier date if collection of principal or interest is considered doubtful. All interest accrued for the current year, but not collected, for loans that are placed on nonaccrual or charged-off, is reversed against interest income. The interest on these loans is accounted for on the cash-basis or cost-recovery method, until qualifying for return to accrual. Loans are returned to accrual status when all the principal and interest amounts contractually due are brought current and future payments are reasonably assured.
Certain loans acquired in the Capital and Heritage Financial Holding Corporation (“Heritage”) mergers are accounted for in accordance with ASC 310-30, “Loans and Debt Securities Acquired with Deteriorated Credit Quality” (“ASC 310-30”). Increases in expected cash flows to be collected on these loans are recognized as an adjustment of the loan’s yield over its remaining life, while decreases in expected cash flows are recognized as an impairment.
The allowance for loan losses is established through a provision for loan losses charged to earnings resulting from measurements of inherent credit risk in the loan portfolio and estimates of probable losses or impairments of individual loans. Loan losses are charged against the allowance when management believes the uncollectability of a loan balance is confirmed. Subsequent recoveries, if any, are credited to the allowance.
For portfolio balances of consumer, consumer mortgage and certain other similar loan types, allowance factors are determined based on historical loss ratios by portfolio for the preceding eight quarters and may be adjusted by other qualitative criteria. For commercial and commercial real estate secured loans, risk-rating grades are assigned by lending, credit administration or loan review personnel, based on an analysis of the financial and collateral strength and other credit attributes underlying each loan. Loan grades range between 1 and 9, with 1 being loans with the least credit risk. Both lending and credit personnel monitor all loans on an ongoing basis, and grades are subject to adjustment and change based on changing circumstances and are then used in the calculation of the adequacy of the allowance for loan losses. Further, loan review personnel monitor the grades assigned to loans through periodic examination.
Allowance factors established by management are multiplied by loan balances for each grade or homogeneous portfolio of loans to determine the amount needed in the allowance for loan losses. The allowance factors are established based on the Company’s historical loss experience, adjusted for trends and expectations about losses inherent in the Company’s existing portfolios. For impaired loans, a specific reserve is established to adjust the carrying value of the loan to its estimated net realizable value.
A loan is considered impaired when, based on current information and events, it is probable that the Company will be unable to collect the scheduled payments of principal or interest when due according to the contractual terms of the loan agreement. Impairment is measured on a loan-by-loan basis for commercial and construction loans above a minimum dollar amount threshold by either the present value of expected future cash flows discounted at the loan’s effective interest rate, the loan’s obtainable market price or the fair value of the collateral if the loan is collateral dependent. When the ultimate collectability of an impaired loan’s principal is in doubt, wholly or partially, all cash receipts are applied to principal. Once the recorded balance has been reduced to zero, future cash receipts are applied to interest income, to the extent any interest has been foregone, and then they are recorded as recoveries of any amounts previously charged-off. Large groups of smaller balance homogeneous loans are evaluated collectively for impairment.
57
Table of Contents
Index to Financial Statements
Renasant Corporation and Subsidiaries
Notes to Consolidated Financial Statements
Note A – Significant Accounting Policies (continued)
The allowance for loan losses is maintained at a level believed adequate by management to absorb estimated credit losses for specifically identified loans as well as probable losses inherent in the loan portfolio. Management and the internal loan review staff evaluate the adequacy of the allowance for loan losses calculation quarterly. The allowance for loan losses is evaluated based on a continuing assessment of problem loans, the types of loans, historical loss experience, new lending products, emerging credit trends, changes in the size and character of loan categories and other factors, including its risk rating system, regulatory guidance and economic conditions. This evaluation is inherently subjective, as it requires estimates that are susceptible to significant revision as more information becomes available.
Premises and Equipment: Premises and equipment are stated at cost less accumulated depreciation and amortization. Depreciation is computed primarily by use of the straight-line method for furniture, fixtures, equipment and premises. The annual provisions for depreciation and amortization have been computed primarily using estimated lives of forty years for premises, seven years for furniture and equipment and three to five years for computer equipment. Leasehold improvements are amortized over the period of the leases or the estimated useful life of the improvements, whichever is shorter.
Other Real Estate and Repossessions: Other real estate owned and repossessions of $58,568 and $25,111 at December 31, 2009 and 2008, respectively, is included in the Consolidated Balance Sheets under the heading “Other assets” and consists of properties acquired through foreclosure or acceptance of a deed in lieu of foreclosure. These properties are carried at the lower of cost or fair market value based on appraised value less estimated selling costs. Losses arising at the time of foreclosure of properties are charged against the allowance for loan losses. Reductions in the carrying value subsequent to acquisition are charged to earnings and are included in “Other noninterest expense” in the Consolidated Statements of Income.
Goodwill and Intangible Assets: Goodwill represents the excess of the cost of an acquisition over the fair value of the net assets acquired. Goodwill impairment testing is performed annually or more frequently if events or circumstances indicate possible impairment. Goodwill is assigned to the Company’s reporting segments. Fair values of reporting segments are determined using either discounted cash flow analyses based on internal financial forecasts or, if available, market-based valuation multiples for comparable businesses. No impairment was identified as a result of the testing performed during 2009, 2008 or 2007. Other intangible assets represent purchased assets that also lack physical substance but can be distinguished from goodwill because of contractual or other legal rights. Intangibles with finite lives are amortized over their estimated useful lives.
Bank-Owned Life Insurance: Bank-owned life insurance (“BOLI”) is an institutionally-priced insurance product that is specifically designed for purchase by insured depository institutions. BOLI is a life insurance policy purchased by Renasant Bank on certain employees, with Renasant Bank being listed as the primary beneficiary. The carrying value of BOLI is recorded at the cash surrender value of the policies, net of any applicable surrender charges. The carrying value of BOLI included in the Consolidated Balance Sheets under the heading “Other assets” at December 31, 2009 and 2008 was $73,296 and $71,637, respectively. Changes in the value of the cash surrender value of the policies are reflected under the caption “BOLI income” on the Consolidated Statements of Income.
Insurance Agency Revenues: Renasant Insurance, Inc. is a full-service insurance agency offering all lines of commercial and personal insurance through major third-party insurance carriers. Commissions and fees are recognized when earned based on contractual terms and condition of insurance policies with the insurance carriers. Contingency fee income paid by the insurance carriers is recognized upon receipt.
Trust and Financial Services Revenues: The Company offers trust services as well as various alternative investment products, including annuities and mutual funds. Trust revenues are recognized on the accrual basis in accordance with the contractual terms of the trust. Commissions and fees from the sale of annuities and mutual funds are recognized when earned based on contractual terms with the third-party broker dealer.
Income Taxes: Income taxes are accounted for under the liability method. Under this method, deferred tax assets and liabilities are determined based on differences between financial reporting and tax bases of assets and liabilities and are measured using the enacted tax rates and laws that will be in effect when the differences are expected to reverse. It is the Company’s policy to recognize interest and penalties, if incurred, related to unrecognized tax benefits in income tax expense. The Company and its subsidiaries file a consolidated federal income tax return. Renasant Bank provides for income taxes on a separate-return basis and remits to the Company amounts determined to be currently payable.
58
Table of Contents
Index to Financial Statements
Renasant Corporation and Subsidiaries
Notes to Consolidated Financial Statements
Note A – Significant Accounting Policies (continued)
Derivative Instruments and Hedging Activities: The Company utilizes derivative financial instruments as part of its ongoing efforts to manage its interest rate risk exposure. These derivative financial instruments currently include interest rate swaps and mortgage loan commitments. Derivative financial instruments are included in the Consolidated Balance Sheets heading “Other assets” or “Other liabilities” at fair value in accordance with ASC 815, “Derivatives and Hedging” (“ASC 815”).
Cash flow hedges are utilized to mitigate the exposure to variability in expected future cash flows or other types of forecasted transactions. For the Company’s derivatives designated as cash flow hedges, changes in the fair value of cash flow hedges are, to the extent that the hedging relationship is effective, recorded as other comprehensive income and are subsequently recognized in earnings at the same time that the hedged item is recognized in earnings. The assessment of the effectiveness of the hedging relationship is evaluated under the hypothetical derivative method.
The Company enters into mortgage loan commitments with its customers to mitigate the interest rate risk associated with the commitments to fund fixed-rate mortgage loans. Under such commitments, interest rates for a mortgage loan may be locked in for up to thirty days with the customer. Once a mortgage loan commitment is entered into with a customer, the Company enters into a sales agreement with an investor in the secondary market to sell such loan on a “best efforts” basis. Under this sales agreement, the Company is obligated to sell the mortgage loan to the investor only if the loan is closed and funded. Thus, the Company will not incur any liability to an investor if the mortgage loan commitment in the pipeline fails to close. These mortgage loan commitments are recorded at fair value, with gains and losses arising from changes in the valuation of the commitments reflected under the caption “Gains on sales of mortgage loans held for sale” on the Consolidated Statements of Income and do not qualify for hedge accounting.
Treasury Stock: The Company had an active repurchase plan for the acquisition of its common stock until January 24, 2008. Treasury stock is recorded at cost. Shares held in treasury are not retired.
Stock-Based Compensation: Compensation expense for option grants and restricted stock awards is determined based on the estimated fair value of the stock options and restricted stock on the applicable grant or award date. Further, compensation expense is based on an estimate of the number of grants expected to vest and is recognized over the grants’ vesting period. The Company did not estimate any forfeitures for 2009, due to the low historical forfeiture rate. Expense associated with the Company’s stock-based compensation is included under the caption “Salaries and employee benefits” on the Consolidated Statements of Income. The Company recognizes compensation expense for all share-based payments to employees in accordance with ASC 718, “Compensation – Stock Compensation.” See Note L, “Employee Benefit and Deferred Compensation Plans,” for further details regarding the Company’s stock-based compensation.
Earnings Per Common Share: Basic net income per common share is calculated by dividing net income by the weighted-average number of common shares outstanding for the period. Diluted net income per common share reflects the pro forma dilution assuming outstanding stock options and warrants were exercised into common shares, calculated in accordance with the treasury stock method. See Note U, “Net Income Per Common Share,” for the reconciliation of the numerators and denominators of the basic and diluted earnings per share computations.
Subsequent Events: The Company has evaluated, for consideration of recognition or disclosure, subsequent events that have occurred through the date of issuance of its financial statements, and has determined that no significant events occurred after December 31, 2009 but prior to the issuance of these financial statements that would have a material impact on its Consolidated Financial Statements.
Impact of Recently-Issued Accounting Standards and Pronouncements: In June 2009, the FASB redefined the new hierarchy for U.S. GAAP and established the FASB ASC as the sole source for all authoritative accounting guidance. The FASB will not issue new standards in the form of Statements, FASB Staff Positions, or Emerging Issues Task Force Abstracts. Instead, it will issue Accounting Standards Updates. In addition, the FASB will not consider Accounting Standards Updates as authoritative in their own right; rather, Accounting Standards Updates will serve only to update the Codification, provide background information about the guidance, and provide the bases for conclusions on the change(s) in the Codification. The Codification is effective for interim and annual periods ending after September 15, 2009. The adoption of the Codification had no impact on the Company’s financial statements.
59
Table of Contents
Index to Financial Statements
Renasant Corporation and Subsidiaries
Notes to Consolidated Financial Statements
Note A – Significant Accounting Policies (continued)
In December 2007, the FASB issued an update to ASC 810 that established new accounting and reporting standards that require the ownership interests in subsidiaries held by parties other than the parent to be clearly identified, labeled, and presented in the consolidated statement of financial position within equity, but separate from the parent’s equity. This update also requires the amount of consolidated net income attributable to the parent and to the noncontrolling interest to be clearly identified and presented on the face of the consolidated statement of income. In addition, when a subsidiary is deconsolidated, any retained noncontrolling equity investment in the former subsidiary must be initially measured at fair value, with the gain or loss on the deconsolidation of the subsidiary measured using the fair value of any noncontrolling equity investment rather than the carrying amount of that retained investment. This update also clarifies that transactions resulting in changes in a parent’s ownership interest in a subsidiary that do not result in deconsolidation should be accounted for as equity transactions. This update also includes expanded disclosure requirements regarding the interests of the parent and its noncontrolling interest. This update is effective for fiscal years, and interim periods within those fiscal years, beginning on or after December 15, 2008. The Company adopted this update on January 1, 2009 with no material impact on its financial statements.
In March 2008, the FASB issued an update to ASC 815 that requires entities to provide enhanced disclosures about how and why an entity uses derivative instruments, how derivative instruments and related hedging activities are accounted for under ASC 815, and how derivative instruments and related hedging activities affect an entity’s financial position, financial performance, and cash flows. To meet these objectives, this update requires qualitative disclosures regarding the objectives and strategies for using derivative instruments and engaging in hedging activities in the context of an entity’s overall risk exposure, quantitative disclosures presented in tabular format of the fair values of and gains and losses on derivative instruments, and disclosures about credit-risk related contingent features in derivative instruments. The Company adopted this update on January 1, 2009 with no material impact on its financial statements. See Note Q, “Derivative Instruments,” in these Notes to Consolidated Financial Statements for further disclosures regarding the Company’s adoption of this update.
In December 2008, the FASB issued an update to ASC 715, “Compensation - Retirement Benefits” that requires further disclosures about the fair value measurements of an employer’s benefit plan assets, including disclosures about the following: how investment allocation decisions are made, including the factors material to an understanding of investment policies and strategies; major categories of plan assets; information about inputs and valuation techniques, including the fair value hierarchy classifications, as defined by ASC 820, “Fair Value Measurements and Disclosures,” (“ASC 820”) of the major categories of plan assets; the effect of fair value measurements using significant unobservable inputs (Level 3 inputs) on changes in plan assets; and significant concentrations of risk within plan assets. This update is effective for fiscal years beginning on or after December 15, 2009, with early adoption permitted. See Note L, “Employee Benefit and Deferred Compensation Plans,” in these Notes to Consolidated Financial Statements for further disclosures regarding the Company’s adoption of this update.
In January 2009, the FASB issued an update to ASC 325, “Investments – Other” that amends the existing guidance to achieve a more consistent determination of whether an other-than-temporary impairment has occurred. This update also retains and emphasizes the objective of an other-than-temporary impairment assessment and the related disclosure requirements. This update was effective for interim and annual reporting periods ending after December 15, 2008, and was to be applied prospectively. Retroactive application was not permitted. The Company adopted this update on January 1, 2009 with no material impact on its financial statements.
In April 2009, the FASB issued an update to ASC 805, “Business Combinations” that amends and clarifies existing guidance to address the initial recognition and measurement of an asset acquired or a liability assumed in a business combination that arises from a contingency provided the asset or liability’s fair value on the date of acquisition can be determined. When the fair value, at the acquisition date, of an asset acquired or liability assumed cannot be determined, this update requires using the guidance under ASC 450, “Contingencies”. This update is effective for assets or liabilities arising from contingencies in business combinations that occur following the start of the first annual reporting period beginning on or after December 15, 2008. The adoption of this update will impact the Company’s accounting for and reporting of acquisitions completed after January 1, 2009.
60
Table of Contents
Index to Financial Statements
Renasant Corporation and Subsidiaries
Notes to Consolidated Financial Statements
Note A – Significant Accounting Policies (continued)
In April 2009, the FASB issued an update to ASC 820 that relates to determining fair values when there is no active market or where the price inputs being used represent distressed sales. It reaffirms the objective of fair value measurement: to reflect how much an asset or liability would be sold for in an orderly transaction (as opposed to a distressed or forced transaction) at the date of the financial statements under current market conditions. Specifically, it reaffirms the need to use judgment to ascertain if a formerly active market has become inactive and in determining fair values when markets have become inactive. The Company adopted this update as of June 30, 2009 with no material impact on its financial statements.
In April 2009, the FASB issued an update to ASC 320, “Investments – Debt and Equity Securities” that is intended to bring greater consistency to the timing of impairment recognition and provide greater clarity to investors about the credit and noncredit components of impaired debt securities that are not expected to be sold. The measure of impairment in comprehensive income remains fair value. This update also requires increased and more frequent disclosures regarding expected cash flows, credit losses, and an aging of securities with unrealized losses. See Note B, “Securities,” in these Notes to Consolidated Financial Statements for further disclosures regarding the Company’s adoption of this update.
In April 2009, the FASB issued an update to ASC 825, “Financial Instruments” that amends existing authoritative accounting literature to require quantitative and qualitative disclosures about fair value of financial instruments for both annual and interim reporting periods of publicly traded companies. See Note P, “Fair Value of Financial Instruments,” in these Notes to Consolidated Financial Statements for further disclosures regarding the Company’s adoption of this update.
In May 2009, the FASB issued an update to ASC 855, “Subsequent Events” to establish general standards of accounting for and disclosure of events that occur after the balance sheet date but before financial statements are issued or are available to be issued. This update sets forth the period after the balance sheet date during which management of a reporting entity should evaluate events or transactions that may occur for potential recognition or disclosure in the financial statements, the circumstances under which an entity should recognize events or transactions occurring after the balance sheet date in its financial statements, and the disclosures that an entity should make about events or transactions that occurred after the balance sheet date. This update was effective for the Company beginning with its Quarterly Report on Form 10-Q for the quarterly period ended June 30, 2009. The adoption of this update had no material impact on the Company’s financial statements.
In August 2009, the FASB issued an update to ASC 820 that provides further guidance on how to measure the fair value of a liability. This update provides clarification that in circumstances in which a quoted price in an active market for an identical liability is not available, an entity is required to measure fair value using a valuation technique that uses the quoted price of an identical liability when traded as an asset, quoted prices for similar liabilities or similar liabilities when traded as assets, or another valuation technique that is consistent with the principles of ASC 820. This update is effective for the first reporting period beginning on or after the date of issuance of the update, which was August 26, 2009. The adoption of this update had no material impact on the Company’s financial statements.
In January 2010, the FASB issued an update to ASC 820 that requires new disclosures and clarifications of existing disclosures about recurring and nonrecurring fair value measurements. As to new disclosure requirements, a reporting entity must disclose separately the amount of significant transfers in and out of Level 1 and Level 2 fair value measurements, describe the reasons for the transfers, and present separately information about purchases, sales, issuances and settlements in the reconciliation for fair value measurements using Level 3 inputs. As to clarifications of existing disclosures, a reporting entity should provide fair value measurements for each class within each category of assets and liabilities, and provide disclosures about the valuation techniques and inputs used to measure fair value for both recurring and nonrecurring fair measurements that fall in either Level 2 or Level 3. The new disclosures and clarifications of existing disclosures are effective for interim and annual reporting periods beginning after December 15, 2009, except for the disclosures about purchases, sales, issuances and settlements, which are effective beginning after December 15, 2010, and for interim periods within those fiscal years. The Company is currently in the process of evaluating the impact of adopting this update on its financial statements.
61
Table of Contents
Index to Financial Statements
Renasant Corporation and Subsidiaries
Notes to Consolidated Financial Statements
Note B – Securities
(In Thousands)
The amortized cost and fair value of securities available for sale are as follows:
| Amortized Cost |
Gross Unrealized Gains |
Gross Unrealized Losses |
Fair Value | ||||||||||
| December 31, 2009 |
|||||||||||||
| Obligations of other U.S. Government agencies and corporations |
$ | 63,130 | $ | 191 | $ | (289 | ) | $ | 63,032 | ||||
| Mortgage-backed securities |
445,647 | 13,589 | (1,345 | ) | 457,891 | ||||||||
| Trust preferred securities |
33,803 | 137 | (19,502 | ) | 14,438 | ||||||||
| Other equity securities |
39,971 | 26 | — | 39,997 | |||||||||
| $ | 582,551 | $ | 13,943 | $ | (21,136 | ) | $ | 575,358 | |||||
| December 31, 2008 |
|||||||||||||
| Obligations of other U.S. Government agencies and corporations |
$ | 58,792 | $ | 1,128 | $ | — | $ | 59,920 | |||||
| Mortgage-backed securities |
447,297 | 6,713 | (5,043 | ) | 448,967 | ||||||||
| Obligations of states and political subdivisions |
112,129 | 1,344 | (739 | ) | 112,734 | ||||||||
| Trust preferred securities |
32,669 | 6 | (12,132 | ) | 20,543 | ||||||||
| Other equity securities |
53,089 | 265 | (412 | ) | 52,942 | ||||||||
| $ | 703,976 | $ | 9,456 | $ | (18,326 | ) | $ | 695,106 | |||||
| December 31, 2007 |
|||||||||||||
| Obligations of other U.S. Government agencies and corporations |
$ | 115,438 | $ | 1,241 | $ | (267 | ) | $ | 116,412 | ||||
| Mortgage-backed securities |
261,641 | 2,021 | (1,615 | ) | 262,047 | ||||||||
| Obligations of states and political subdivisions |
118,479 | 1,365 | (294 | ) | 119,550 | ||||||||
| Trust preferred securities |
4,949 | 24 | (66 | ) | 4,907 | ||||||||
| Other equity securities |
36,717 | 44 | (87 | ) | 36,674 | ||||||||
| $ | 537,224 | $ | 4,695 | $ | (2,329 | ) | $ | 539,590 | |||||
Gross gains on sales of securities available for sale for the year ended December 31, 2009 were $2,318. These gains were offset by the complete write-off of the Company’s $645 investment in Silverton Financial Services, Inc., the holding company of Silverton Bank, N.A., which was placed in receivership on May 1, 2009. For the year ended December 31, 2008, there were no sales of securities available for sale. Gross gains on sales of securities available for sale for 2007 were $221. Gross losses on sales of securities available for sale for 2007 were $143.
At December 31, 2009 and 2008, securities with a carrying value of approximately $361,723 and $422,102, respectively, were pledged to secure government, public and trust deposits. Securities with a carrying value of $25,242 and $46,538 were pledged as collateral for short-term borrowings at December 31, 2009 and 2008, respectively.
During the third quarter of 2009, the Company transferred all of its securities representing obligations of states and political subdivisions from the available for sale category to the held to maturity category. The Company has the intent and the ability to hold these securities to maturity. Transfers of debt securities into the held to maturity category from the available for sale category are made at fair value at the date of the transfer. The unrealized holding gain or loss at the date of transfer is retained in other comprehensive income and in the carrying value of the held to maturity securities. Such amounts are amortized or accreted over the remaining life of the securities.
62
Table of Contents
Index to Financial Statements
Renasant Corporation and Subsidiaries
Notes to Consolidated Financial Statements
Note B – Securities (continued)
The amortized cost and fair value of securities held to maturity are as follows:
| Amortized Cost |
Gross Unrealized Gains |
Gross Unrealized Losses |
Fair Value | ||||||||||
| December 31, 2009 |
|||||||||||||
| Obligations of states and political subdivisions |
$ | 138,806 | $ | 958 | $ | (331 | ) | $ | 139,433 | ||||
The amortized cost and fair value of securities at December 31, 2009, by contractual maturity, are shown below. Expected maturities will differ from contractual maturities because borrowers may have the right to call or prepay obligations with or without call or prepayment penalties.
| Available for Sale | Held to Maturity | |||||||||||
| Amortized Cost |
Fair Value |
Amortized Cost |
Fair Value | |||||||||
| Due within one year |
$ | — | $ | — | $ | 6,479 | $ | 6,487 | ||||
| Due after one year through five years |
24,489 | 24,608 | 42,558 | 42,568 | ||||||||
| Due after five years through ten years |
33,520 | 33,249 | 46,449 | 46,601 | ||||||||
| Due after ten years |
38,924 | 19,613 | 43,320 | 43,777 | ||||||||
| Mortgage-backed securities |
445,647 | 457,891 | — | — | ||||||||
| Other equity securities |
39,971 | 39,997 | — | — | ||||||||
| $ | 582,551 | $ | 575,358 | $ | 138,806 | $ | 139,433 | |||||
The following table presents the age of gross unrealized losses and fair value by investment category:
| Available for Sale: | Less than 12 Months | 12 Months or More | Total | ||||||||||||||||||
| Fair Value |
Unrealized Losses |
Fair Value |
Unrealized Losses |
Fair Value |
Unrealized Losses |
||||||||||||||||
| December 31, 2009 |
|||||||||||||||||||||
| Obligations of other U.S Government agencies and corporations |
$ | 30,238 | $ | (289 | ) | $ | — | $ | — | $ | 30,238 | $ | (289 | ) | |||||||
| Mortgage-backed securities |
56,044 | (872 | ) | 6,350 | (473 | ) | 62,394 | (1,345 | ) | ||||||||||||
| Trust preferred securities |
— | — | 11,301 | (19,502 | ) | 11,301 | (19,502 | ) | |||||||||||||
| Other equity securities |
— | — | — | — | — | — | |||||||||||||||
| Total |
$ | 86,282 | $ | (1,161 | ) | $ | 17,651 | $ | (19,975 | ) | $ | 103,933 | $ | (21,136 | ) | ||||||
| December 31, 2008 |
|||||||||||||||||||||
| Obligations of other U.S Government agencies and corporations |
$ | — | $ | — | $ | — | $ | — | $ | — | $ | — | |||||||||
| Mortgage-backed securities |
37,342 | (5,020 | ) | 2,676 | (23 | ) | 40,018 | (5,043 | ) | ||||||||||||
| Obligations of states and political subdivisions |
32,311 | (699 | ) | 735 | (40 | ) | 33,046 | (739 | ) | ||||||||||||
| Trust preferred securities |
17,537 | (12,132 | ) | — | — | 17,537 | (12,132 | ) | |||||||||||||
| Other equity securities |
883 | (412 | ) | — | — | 883 | (412 | ) | |||||||||||||
| Total |
$ | 88,073 | $ | (18,263 | ) | $ | 3,411 | $ | (63 | ) | $ | 91,484 | $ | (18,326 | ) | ||||||
| Held to Maturity: | Less than 12 Months | 12 Months or More | Total | ||||||||||||||||||
| Fair Value |
Unrealized Losses |
Fair Value |
Unrealized Losses |
Fair Value |
Unrealized Losses |
||||||||||||||||
| December 31, 2009 |
|||||||||||||||||||||
| Obligations of states and political subdivisions |
$ | 64,155 | $ | (331 | ) | $ | — | $ | — | $ | 64,155 | $ | (331 | ) | |||||||
63
Table of Contents
Index to Financial Statements
Renasant Corporation and Subsidiaries
Notes to Consolidated Financial Statements
Note B – Securities (continued)
The Company holds investments in pooled trust preferred securities. This portfolio had a cost basis of $30,803 and $29,669 and a fair value of $11,301 and $17,537 at December 31, 2009 and December 31, 2008, respectively. The investment in pooled trust preferred securities consists of four securities representing interests in various tranches of trusts collateralized by debt issued by over 321 financial institutions. As of December 31, 2009, management determined that there is not sufficient evidence to conclude that the decline in value of these securities is due to adverse changes that are likely to result in a permanent reduction in future cash flow. Management’s determination is based on the current credit ratings, the known deferrals and defaults by the underlying issuing banks and the degree to which future deferrals and defaults would be required to occur before the cash flow for the Company’s tranches is negatively impacted. In addition, management continually monitors key credit quality and capital ratios of the issuing institutions. This determination is further supported by quarterly valuations obtained by the Company performed by third parties. The following table provides information regarding the Company’s investments in pooled trust preferred securities as of December 31, 2009:
| Name |
Single/ Pooled |
Class/ Tranche |
Amortized Cost |
Fair Value |
Unrealized Loss |
Lowest Credit Rating(1) |
Issuers Currently in Deferral or Default |
Estimated Additional Default before Credit Impairment |
||||||||||||||
| PreTSL XXIV |
Pooled | B-2 | $ | 13,737 | $ | 3,882 | $ | (9,855 | ) | Caa3 | 29 | % | 16 | % | ||||||||
| PreTSL XXVI |
Pooled | B-2 | 5,185 | 2,002 | (3,183 | ) | Ca | 30 | % | 21 | % | |||||||||||
| PreTSL XXIII |
Pooled | B-2 | 9,931 | 4,627 | (5,304 | ) | Ca | 17 | % | 29 | % | |||||||||||
| PreTSL XIII |
Pooled | B-2 | 1,950 | 790 | (1,160 | ) | Ca | 15 | % | 11 | % | |||||||||||
| $ | 30,803 | $ | 11,301 | $ | (19,502 | ) | ||||||||||||||||
| (1) | Based on Moody’s |
Management does not believe unrealized losses in the Company’s investment portfolio, individually or in the aggregate, as of December 31, 2009 represent an other-than-temporary impairment. Management does not currently believe such securities will be settled at a price less than the amortized cost of the investment. Because the Company does not intend to sell the investments and it is not more likely than not that the Company will be required to sell the investments before recovery of its amortized cost, which may be maturity, it does not consider the investments to be other-than-temporarily impaired at December 31, 2009.
Note C – Loans and the Allowance for Loan Losses
(In Thousands)
The following is a summary of loans as of December 31:
| 2009 | 2008 | |||||||
| Commercial, financial, agricultural |
$ | 281,329 | $ | 312,648 | ||||
| Lease financing |
832 | 1,849 | ||||||
| Real estate – construction |
133,299 | 241,818 | ||||||
| Real estate – 1-4 family mortgage |
820,917 | 886,380 | ||||||
| Real estate – commercial mortgage |
1,040,589 | 1,015,894 | ||||||
| Installment loans to individuals |
70,703 | 72,400 | ||||||
| Gross loans |
2,347,669 | 2,530,989 | ||||||
| Unearned income |
(54 | ) | (103 | ) | ||||
| Loans, net of unearned income |
2,347,615 | 2,530,886 | ||||||
| Allowance for loan losses |
(39,145 | ) | (34,905 | ) | ||||
| Net loans |
$ | 2,308,470 | $ | 2,495,981 | ||||
64
Table of Contents
Index to Financial Statements
Renasant Corporation and Subsidiaries
Notes to Consolidated Financial Statements
Note C – Loans and the Allowance for Loan Losses (continued)
Changes in the allowance for loan losses were as follows:
| Year Ended December 31, | ||||||||||||
| 2009 | 2008 | 2007 | ||||||||||
| Balance at beginning of year |
$ | 34,905 | $ | 26,372 | $ | 19,534 | ||||||
| Additions from business combinations |
— | — | 5,253 | |||||||||
| Provision for loan losses |
26,890 | 22,804 | 4,838 | |||||||||
| Loans charged-off |
(24,092 | ) | (15,683 | ) | (4,099 | ) | ||||||
| Recoveries of loans previously charged-off |
1,442 | 1,412 | 846 | |||||||||
| Balance at end of year |
$ | 39,145 | $ | 34,905 | $ | 26,372 | ||||||
The Company applied the provisions of ASC 310-30 on certain loans acquired in connection with the mergers with Capital and Heritage. At the date of acquisition, there was evidence of deterioration of the credit quality of these loans since origination, and it was probable that all contractually required payments would not be collected. The amount of such loans included in the Consolidated Balance Sheets heading “Loans, net of unearned income” as of December 31 is as follows:
| 2009 | 2008 | |||||
| Commercial |
$ | 4,461 | $ | 4,532 | ||
| Consumer |
57 | 137 | ||||
| Mortgage |
396 | 575 | ||||
| Total outstanding balance |
$ | 4,914 | $ | 5,244 | ||
| Total carrying amount |
$ | 3,553 | $ | 3,466 | ||
Changes in the accretable yield of these loans as of December 31 are as follows:
| 2009 | 2008 | |||||||
| Balance at January 1 |
$ | 30 | $ | 578 | ||||
| Additions |
— | — | ||||||
| Reclassifications from nonaccretable difference |
252 | 69 | ||||||
| Accretion |
(162 | ) | (617 | ) | ||||
| Balance at December 31 |
$ | 120 | $ | 30 | ||||
The Company did not increase the allowance for loan losses through a charge to the provision for loan losses on loans accounted for in accordance with ASC 310-30 during 2009 or 2008.
At December 31, 2009 and 2008, nonaccrual loans totaled $39,454 and $35,661, respectively, while loans past due 90 days or more and still accruing interest were $10,571 and $4,252, respectively. Impaired loans recognized in conformity with ASC 310, “Receivables” (“ASC 310”), were as follows:
| December 31, | ||||||
| 2009 | 2008 | |||||
| Impaired loans with an allocated allowance for loan losses |
$ | 76,943 | $ | 35,133 | ||
| Impaired loans without an allocated allowance for loan losses |
1,641 | 259 | ||||
| Total impaired loans |
$ | 78,584 | $ | 35,392 | ||
| Allocated allowance on impaired loans |
$ | 13,468 | $ | 5,357 | ||
| Year Ended December 31, | |||||||||
| 2009 | 2008 | 2007 | |||||||
| Average recorded investment in impaired loans |
$ | 56,988 | $ | 23,531 | $ | 10,130 | |||
| Interest income recognized using the accrual basis of income recognition |
$ | 1,460 | $ | 92 | $ | 67 | |||
| Interest income recognized using the cash-basis of income recognition |
$ | 992 | $ | 1,012 | $ | 642 | |||
65
Table of Contents
Index to Financial Statements
Renasant Corporation and Subsidiaries
Notes to Consolidated Financial Statements
Note C – Loans and the Allowance for Loan Losses (continued)
The allocated allowance for loan losses attributable to restructured loans included in the table above was $4,837 and $592 at December 31, 2009 and 2008, respectively. At December 31, 2009, the Company had $784 in remaining availability under commitments to lend additional funds on these restructured loans.
Certain executive officers and directors of Renasant Bank and their associates are customers of and have other transactions with Renasant Bank. Related party loans and commitments are made on substantially the same terms, including interest rates and collateral, as those prevailing at the time for comparable transactions with unrelated persons and do not involve more than a normal risk of collectability. The aggregate dollar amount of these loans was $23,640 and $25,060 at December 31, 2009 and 2008, respectively. During 2009, $7,125 of new loans were made to related parties and payments received totaled $7,860. The loan balance to related parties decreased $685 as a result of changes in related parties during the year.
Note D – Premises and Equipment
(In Thousands)
Bank premises and equipment accounts as of December 31 are summarized as follows:
| 2009 | 2008 | |||||||
| Premises |
$ | 51,923 | $ | 51,902 | ||||
| Leasehold improvements |
5,170 | 5,065 | ||||||
| Furniture and equipment |
18,781 | 18,490 | ||||||
| Computer equipment |
10,480 | 9,992 | ||||||
| Autos |
183 | 368 | ||||||
| Total |
86,537 | 85,817 | ||||||
| Accumulated depreciation |
(42,865 | ) | (38,825 | ) | ||||
| Net |
$ | 43,672 | $ | 46,992 | ||||
Depreciation expense was $4,382, $4,736 and $4,272 at December 31, 2009, 2008 and 2007, respectively. The Company has operating leases which extend to 2025 for certain land and office locations. Leases that expire are generally expected to be renewed or replaced by other leases. Rental expense was $1,914, $2,121 and $1,866 for 2009, 2008 and 2007, respectively. The following is a summary of future minimum lease payments for years following December 31, 2009:
| 2010 |
$ | 1,860 | |
| 2011 |
1,673 | ||
| 2012 |
1,656 | ||
| 2013 |
1,616 | ||
| 2014 |
1,317 | ||
| Thereafter |
6,825 | ||
| Total |
$ | 14,947 | |
Note E – Goodwill and Other Intangible Assets
(In Thousands)
Changes in the carrying amount of goodwill during the years ended December 31, 2009 and 2008 were as follows:
| Goodwill | ||||
| Balance as of December 31, 2007 |
$ | 186,420 | ||
| Adjustment to previously recorded goodwill |
(1,536 | ) | ||
| Balance as of December 31, 2008 |
$ | 184,884 | ||
| Adjustment to previously recorded goodwill |
— | |||
| Balance as of December 31, 2009 |
$ | 184,884 | ||
The adjustment to previously recorded goodwill in 2008 reflects tax benefits associated with the exercise of stock options assumed in connection with the mergers with Capital, Heritage and Renasant Bancshares, Inc. (“Renasant Bancshares”).
66
Table of Contents
Index to Financial Statements
Renasant Corporation and Subsidiaries
Notes to Consolidated Financial Statements
Note E – Goodwill and Other Intangible Assets (continued)
The following table provides a summary of finite-lived intangible assets:
| Gross Carrying |
Accumulated | Net Carrying | ||||||||
| Amount | Amortization | Amount | ||||||||
| December 31, 2009 |
||||||||||
| Core deposit intangible |
$ | 15,585 | $ | (9,112 | ) | $ | 6,473 | |||
| Other intangibles |
1,390 | (1,390 | ) | — | ||||||
| Total |
$ | 16,975 | $ | (10,502 | ) | $ | 6,473 | |||
| December 31, 2008 |
||||||||||
| Core deposit intangible |
$ | 15,585 | $ | (7,146 | ) | $ | 8,439 | |||
| Other intangibles |
1,390 | (1,390 | ) | — | ||||||
| Total |
$ | 16,975 | $ | (8,536 | ) | $ | 8,439 | |||
Aggregate amortization expense for the years ended December 31, 2009, 2008 and 2007 was $1,966, $2,455 and $1,991, respectively. The estimated amortization expense of finite-lived intangible assets for future periods is summarized as follows:
| 2010 |
$ | 1,865 | |
| 2011 |
1,428 | ||
| 2012 |
977 | ||
| 2013 |
831 | ||
| 2014 |
631 | ||
| Thereafter |
741 |
Note F – Other Real Estate and Repossessions
(In Thousands)
The following table provides details of the Company’s other real estate owned and repossessions as of December 31, 2009 and 2008:
| 2009 | 2008 | |||||||||||
| Residential real estate |
$ | 18,038 | $ | 13,603 | ||||||||
| Commercial real estate |
10,336 | 2,484 | ||||||||||
| Residential land development |
27,018 | 8,913 | ||||||||||
| Commercial land development |
165 | — | ||||||||||
| Other |
3,011 | 111 | ||||||||||
| Total other real estate owned and repossessions |
$ | 58,568 | $ | 25,111 | ||||||||
| Changes in the Company’s other real estate owned and repossessions as of December 31 are as follows: | ||||||||||||
| 2009 | 2008 | |||||||||||
| Balance as of January 1 |
$ | 25,111 | $ | 8,584 | ||||||||
| Additions |
49,377 | 28,608 | ||||||||||
| Capitalized improvements |
641 | 302 | ||||||||||
| Impairments |
(561 | ) | (773 | ) | ||||||||
| Dispositions |
(16,005 | ) | (11,550 | ) | ||||||||
| Other |
5 | (60 | ) | |||||||||
| Balance as of December 31 |
$ | 58,568 | $ | 25,111 | ||||||||
67
Table of Contents
Index to Financial Statements
Renasant Corporation and Subsidiaries
Notes to Consolidated Financial Statements
Note G – Deposits
(In Thousands)
The following is a summary of deposits as of December 31:
| 2009 | 2008 | |||||
| Noninterest-bearing deposits |
$ | 304,962 | $ | 284,227 | ||
| Interest-bearing demand deposits |
928,856 | 765,274 | ||||
| Savings deposits |
90,514 | 93,454 | ||||
| Time deposits |
1,251,768 | 1,201,376 | ||||
| Total deposits |
$ | 2,576,100 | $ | 2,344,331 | ||
The approximate scheduled maturities of time deposits at December 31, 2009 are as follows:
| 2010 |
$ | 799,033 | |
| 2011 |
346,516 | ||
| 2012 |
72,463 | ||
| 2013 |
22,341 | ||
| 2014 |
11,063 | ||
| Thereafter |
352 | ||
| Total |
$ | 1,251,768 | |
The aggregate amount of time deposits in denominations of $100 or more at December 31, 2009 and 2008 was $636,304 and $590,619, respectively. Certain executive officers and directors had amounts on deposit with Renasant Bank of approximately $11,410 at December 31, 2009.
Note H – Short-Term Borrowings
(In Thousands)
Short-term borrowings as of December 31 are summarized as follows:
| 2009 | 2008 | |||||
| Federal funds purchased |
$ | — | $ | 63,800 | ||
| Treasury, tax and loan notes |
2,682 | 4,494 | ||||
| Federal Home Loan Bank advances |
— | 225,000 | ||||
| Securities sold under agreements to repurchase |
19,715 | 21,247 | ||||
| Total short-term borrowings |
$ | 22,397 | $ | 314,541 | ||
The average balances and cost of funds of short-term borrowings for the years ending December 31 are summarized as follows:
| Average Balances | Cost of Funds | |||||||||||||||||
| 2009 | 2008 | 2007 | 2009 | 2008 | 2007 | |||||||||||||
| Federal funds purchased |
$ | 2,852 | $ | 32,263 | $ | 17,589 | 0.93 | % | 2.32 | % | 4.87 | % | ||||||
| Treasury, tax and loan notes |
2,302 | 2,371 | 1,602 | 0.04 | 1.35 | 4.92 | ||||||||||||
| Federal Home Loan Bank advances |
41,354 | 129,797 | 98,708 | 1.05 | 2.42 | 4.83 | ||||||||||||
| Securities sold under agreements to repurchase |
29,649 | 17,810 | 8,856 | 0.51 | 1.37 | 2.71 | ||||||||||||
| Total short-term borrowings |
$ | 76,157 | $ | 182,241 | $ | 126,755 | 0.81 | % | 2.28 | % | 4.69 | % | ||||||
The maximum amount outstanding of Federal Home Loan Bank advances at any month-end during 2008 was $225,000, and the weighted-average interest rate on these borrowings at December 31, 2008 was 0.78%. The Company maintains lines of credit with correspondent banks totaling $85,000 at December 31, 2009. Interest is charged at the market federal funds rate on all advances. There were no amounts outstanding under these lines of credit at December 31, 2009 or 2008. In addition, the Company maintains a treasury, tax and loan notes account with the Federal Reserve. The balance is collateralized by assets of Renasant Bank. Availability of the line of credit depends upon the amount of collateral pledged as well as the Federal Reserve’s need for funds.
68
Table of Contents
Index to Financial Statements
Renasant Corporation and Subsidiaries
Notes to Consolidated Financial Statements
Note I – Long-Term Debt
(In Thousands)
Long-term debt as of December 31, 2009 and 2008 is summarized as follows:
| 2009 | 2008 | |||||
| Federal Home Loan Bank advances |
$ | 469,574 | $ | 543,302 | ||
| Junior subordinated debentures |
76,053 | 76,133 | ||||
| TLGP Senior Note |
50,000 | — | ||||
| Total long-term debt |
$ | 595,627 | $ | 619,435 | ||
Long-term advances from the Federal Home Loan Bank (“FHLB”) outstanding at December 31, 2009 had maturities ranging from 2010 to 2029 with a combination of fixed and floating rates ranging from 2.71% to 7.93%. Weighted-average interest rates on outstanding advances at December 31, 2009 and 2008 were 3.60% and 3.61%, respectively. These advances are collateralized by a pledge of a blanket lien on the Company’s mortgage loans. The Company had availability on unused lines of credit with the FHLB of $312,154 at December 31, 2009.
The Company owns the outstanding common stock of business trusts that issued corporation-obligated mandatorily redeemable preferred capital securities to third-party investors. The trusts used the proceeds from the issuance of their preferred capital securities and common stock (collectively referred to as “capital securities’) to buy floating rate debentures issued by the Company. The debentures are the trusts’ only assets and interest payments from the debentures finance the distributions paid on the capital securities. Distributions on the capital securities are payable quarterly at a rate per annum equal to the interest rate being earned by the trusts on the debentures held by the trusts. The capital securities are subject to mandatory redemption, in whole or in part, upon repayment of the debentures. The Company has entered into an agreement which fully and unconditionally guarantees the capital securities subject to the terms of the guarantee.
The following table provides details on the debentures as of December 31, 2009:
| Principal Amount |
Interest Rate | Year of Maturity |
Amount Included in Tier I Capital | ||||||||
| PHC Statutory Trust I |
$ | 20,619 | 3.10 | % | 2033 | $ | 20,000 | ||||
| PHC Statutory Trust II |
31,959 | 2.12 | 2035 | 31,000 | |||||||
| Heritage Financial Statutory Trust I |
10,310 | 10.20 | 2031 | 10,000 | |||||||
| Capital Bancorp Capital Trust I |
12,372 | 5.64 | 2035 | 12,000 | |||||||
During 2003, the Company formed PHC Statutory Trust I for the purpose of issuing corporation-obligated mandatory redeemable capital securities to third party investors and investing the proceeds from the sale of such capital securities in floating rate junior debentures of the Company. The issue provided us with funds for the cash portion of the Renasant Bancshares merger. The interest rate for PHC Statutory Trust I reprices quarterly equal to the three-month LIBOR at the determination date plus 285 basis points. The debentures owned by PHC Statutory Trust I are currently redeemable at par.
During 2005, the Company formed PHC Statutory Trust II for the purpose of issuing corporation-obligated mandatory redeemable capital securities to third-party investors and investing the proceeds from the sale of such capital securities solely in floating rate junior debentures of the Company. The issue provided us with funds for the cash portion of the Heritage merger. The interest rate for PHC Statutory Trust II reprices quarterly equal to the three-month LIBOR at the determination date plus 187 basis points. On or after March 15, 2010, the debentures owned by PHC Statutory Trust II may be redeemed at par.
Pursuant to the merger with Heritage, the Company assumed the debentures issued to Heritage Financial Statutory Trust I. The premium associated with the Company’s assumption of the debentures issued to Heritage Financial Statutory Trust I had a carrying value of $833 and $993 as of December 31, 2009 and 2008, respectively. The premium is being amortized through February 2015. The interest rate for Heritage Financial Statutory Trust I is fixed at 10.20% per annum. On or after February 22, 2021, the debentures owned by Heritage Financial Statutory Trust I may be redeemed at par.
69
Table of Contents
Index to Financial Statements
Renasant Corporation and Subsidiaries
Notes to Consolidated Financial Statements
Note I – Long-Term Debt (continued)
Pursuant to the merger with Capital, the Company assumed the debentures issued to Capital Bancorp Capital Trust I. The discount associated with the Company’s assumption of the debentures issued to Capital Bancorp Capital Trust I had a carrying value of $40 and $120 as of December 31, 2009 and 2008, respectively. The discount is being amortized through June 2010. The interest rate for Capital Bancorp Capital Trust I is fixed at 5.64% per annum through June 30, 2010 and will reprice quarterly equal to the three-month LIBOR plus 150 basis points thereafter. The Company may redeem the debentures owned by Capital Bancorp Capital Trust I, at par, in whole or in part on or after June 30, 2010.
The Company has classified $73,000 of the debentures described in the above paragraphs as Tier I capital. The Federal Reserve Board issued guidance in March 2005 providing more strict quantitative limits on the amount of securities, similar to the junior subordinated debentures issued or assumed by the Company, that are includable in Tier 1 capital. The new guidance, which became effective in March 2009, did not impact the amount of debentures the Company includes in Tier 1 capital.
On March 31, 2009, Renasant Bank completed an offering of a $50,000 aggregate principal amount 2.625% Senior Note due 2012 (the “Note”). The Note is guaranteed by the Federal Deposit Insurance Corporation under its Temporary Liquidity Guarantee Program (the “TLGP”) and is backed by the full faith and credit of the United States. The Note is a direct, unsecured general obligation of Renasant Bank and ranks equally with all other senior unsecured indebtedness of Renasant Bank, and it is not subject to redemption prior to maturity. The Note is solely the obligation of Renasant Bank and is not guaranteed by the Company. Renasant Bank received net proceeds, after the placement commission but before deducting other expenses of the offering, of approximately $49,700, which was used to pay-off long-term advances with the FHLB as they matured in 2009. The cost of these funds for the year ended December 31, 2009, including amortization, was 3.80%. In connection with the TLGP, on December 5, 2008, the Bank entered into a Master Agreement with the FDIC. The Master Agreement contains certain terms and conditions that must be included in the governing documents for any senior debt securities issued by the Bank that are guaranteed pursuant to the TLGP.
The aggregate stated maturities of long-term debt outstanding at December 31, 2009, are summarized as follows:
| 2010 |
$ | 169,810 | |
| 2011 |
152,116 | ||
| 2012 |
90,860 | ||
| 2013 |
31,921 | ||
| 2014 |
13,711 | ||
| Thereafter |
137,209 | ||
| Total |
$ | 595,627 | |
Note J – Commitments, Contingent Liabilities and Financial Instruments with Off-Balance Sheet Risk
(In Thousands)
Loan commitments are made to accommodate the financial needs of the Company’s customers. Standby letters of credit commit the Company to make payments on behalf of customers when certain specified future events occur. Both arrangements have credit risk essentially the same as that involved in extending loans to customers and are subject to the Company’s normal credit policies. Collateral (e.g., securities, receivables, inventory, equipment, etc.) is obtained based on management’s credit assessment of the customer. The Company’s unfunded loan commitments (unfunded loans and unused lines of credit) and standby letters of credit outstanding at December 31, 2009, were approximately $320,259 and $28,956, respectively, compared to $614,311 and $27,497, respectively, at December 31, 2008.
Various claims and lawsuits, incidental to the ordinary course of business, are pending against the Company and Renasant Bank. In the opinion of management, after consultation with legal counsel, resolution of these matters is not expected to have a material effect on the consolidated financial statements.
Market risk resulting from interest rate changes on particular off-balance sheet financial instruments may be offset by other on- or off-balance sheet transactions. Interest rate sensitivity is monitored by the Company for determining the net effect of potential changes in interest rates on the market value of both on- and off-balance sheet financial instruments.
70
Table of Contents
Index to Financial Statements
Renasant Corporation and Subsidiaries
Notes to Consolidated Financial Statements
Note K – Income Taxes
(In Thousands)
Significant components of the provision for income taxes (benefits) are as follows:
| Year Ended December 31, | ||||||||||||
| 2009 | 2008 | 2007 | ||||||||||
| Current | ||||||||||||
| Federal |
$ | 6,191 | $ | 7,379 | $ | 12,692 | ||||||
| State |
119 | (294 | ) | 1,271 | ||||||||
| 6,310 | 7,085 | 13,963 | ||||||||||
| Deferred | ||||||||||||
| Federal |
(471 | ) | 1,473 | 282 | ||||||||
| State |
24 | 102 | (176 | ) | ||||||||
| (447 | ) | 1,575 | 106 | |||||||||
| $ | 5,863 | $ | 8,660 | $ | 14,069 | |||||||
The reconciliation of income taxes computed at the United States federal statutory tax rates to the provision for income taxes is as follows:
| Year Ended December 31, | ||||||||||||
| 2009 | 2008 | 2007 | ||||||||||
| Tax at U.S. statutory rate |
$ | 8,533 | $ | 11,449 | $ | 15,810 | ||||||
| Increase (decrease) in taxes resulting from: |
||||||||||||
| Tax-exempt interest income |
(1,790 | ) | (1,665 | ) | (1,738 | ) | ||||||
| Income from Bank-owned life insurance |
(876 | ) | (755 | ) | (932 | ) | ||||||
| Investment tax credits |
(321 | ) | (155 | ) | (155 | ) | ||||||
| State income taxes, net of federal benefit |
93 | (191 | ) | 712 | ||||||||
| Other items, net |
224 | (23 | ) | 372 | ||||||||
| $ | 5,863 | $ | 8,660 | $ | 14,069 | |||||||
Deferred income taxes, included in “Other assets” on the Consolidated Balance Sheets, reflect the net tax effects of temporary differences between the carrying amounts of assets and liabilities for financial reporting purposes and the amounts used for income tax purposes. No valuation allowance was recognized as the deferred tax assets were determined to be realizable in future years. This determination was based on the Company’s earnings history – the Company has no basis for believing future performance will not continue to follow the same pattern.
Significant components of the Company’s deferred tax assets and liabilities as of December 31, 2009 and 2008 are as follows:
| 2009 | 2008 | |||||
| Deferred tax assets: |
||||||
| Allowance for loan losses |
$ | 15,856 | $ | 14,116 | ||
| Deferred compensation |
7,251 | 6,655 | ||||
| Net unrealized losses on securities |
1,008 | 3,393 | ||||
| Purchase accounting adjustments |
1,792 | 2,332 | ||||
| Pension |
1,338 | 1,654 | ||||
| Net operating loss carryforward |
— | 900 | ||||
| Other |
2,860 | 568 | ||||
| Total deferred tax assets |
30,105 | 29,618 | ||||
| Deferred tax liabilities: |
||||||
| Core deposit intangible |
2,476 | 3,228 | ||||
| Depreciation |
1,196 | 1,145 | ||||
| Prepaid expenses |
1,250 | 743 | ||||
| FHLB stock dividends |
1,841 | 1,747 | ||||
| Other |
5,402 | 1,136 | ||||
| Total deferred tax liabilities |
12,165 | 7,999 | ||||
| Net deferred tax assets |
$ | 17,940 | $ | 21,619 | ||
71
Table of Contents
Index to Financial Statements
Renasant Corporation and Subsidiaries
Notes to Consolidated Financial Statements
Note K – Income Taxes (continued)
The Company and its subsidiaries file a consolidated U.S. federal income tax return. The Company is currently open to audit under the statute of limitations by the Internal Revenue Service for the years ending December 31, 2005 through 2009. The Company and its subsidiaries’ state income tax returns are open to audit under the statute of limitations for the years ended December 31, 2006 through 2009.
A reconciliation of the beginning and ending amount of unrecognized tax benefits, excluding interest, related to federal and state income tax matters as of December 31 is as follows:
| 2009 | 2008 | 2007 | |||||||||
| Balance at January 1 |
$ | 490 | $ | 530 | $ | 171 | |||||
| Additions based on positions related to current period |
— | 209 | — | ||||||||
| Additions based on positions related to prior period |
72 | 35 | 366 | ||||||||
| Reductions based on positions related to prior period |
— | (225 | ) | — | |||||||
| Settlements |
— | — | — | ||||||||
| Reductions due to lapse of statute of limitations |
— | (59 | ) | (7 | ) | ||||||
| Balance at December 31 |
$ | 562 | $ | 490 | $ | 530 | |||||
If ultimately recognized, the Company does not anticipate any material increase in the effective tax rate during 2009 relative to any tax positions taken prior to January 1, 2009. The Company had accrued $86, $55 and $75 for interest and penalties related to unrecognized tax benefits as of December 31, 2009, 2008 and 2007, respectively.
Note L – Employee Benefit and Deferred Compensation Plans
(In Thousands, Except Share Data)
The Company sponsors a noncontributory defined benefit pension plan, under which participation and future benefit accruals ceased as of December 31, 1996. The Company’s funding policy is to contribute annually to the plan an amount at least equal to the minimum amount determined by consulting actuaries in accordance with the requirements of the Internal Revenue Code. The Company contributed $372 to the pension plan for 2009. The Company did not make a contribution during 2008. The Company does not anticipate that a contribution will be required in 2010. The plan’s accumulated benefit obligations and the projected benefit obligations are substantially the same since benefit accruals under the plan ceased at 1996 levels. The accumulated benefit obligation for the plan was $16,538 and $16,245 at December 31, 2009 and 2008, respectively. There is no additional minimum pension liability required to be recognized.
The Company also provides retiree health care benefits for certain employees who were employed by the Company and enrolled in the Company’s health plan as of December 31, 2004. To receive benefits, an eligible employee must retire from service with the Company and its affiliates, between age 55 and 65, and be credited with at least 15 years of service or with 70 points, determined as the sum of age and service at retirement. The Company periodically determines the portion of the premium to be paid by each eligible retiree and the portion to be paid by the Company. Coverage ceases when an employee attains age 65 and is eligible for Medicare. The Company also provides life insurance coverage for each retiree in the face amount of $5,000 until age 70. Retirees can purchase additional insurance or continue coverage beyond age 70 at their sole expense.
The Company has accounted for its obligation related to these retiree benefits in accordance with ASC 715, “Compensation – Retirement Benefits.” The Company has limited its liability for the rate of increase in the per capita cost of covered benefits (i.e., health care cost trend rate) to the rate of inflation assumed to be 4% each year. Increasing or decreasing the assumed health care cost trend rates by one percentage point in each year would not materially increase or decrease the accumulated post-retirement benefit obligation nor the service and interest cost components of net periodic post-retirement benefit costs as of December 31, 2009, and for the year then ended.
72
Table of Contents
Index to Financial Statements
Renasant Corporation and Subsidiaries
Notes to Consolidated Financial Statements
Note L – Employee Benefit and Deferred Compensation Plans (continued)
Information relating to the defined benefit pension plan (“Pension Benefits”) and post-retirement health and life plans (“Other Benefits”) as of December 31, 2009, and 2008 is as follows:
| Pension Benefits | Other Benefits | |||||||||||||||
| 2009 | 2008 | 2009 | 2008 | |||||||||||||
| Change in benefit obligation |
||||||||||||||||
| Benefit obligation at beginning of year |
$ | 16,245 | $ | 16,270 | $ | 1,175 | $ | 1,121 | ||||||||
| Service cost |
— | — | 38 | 39 | ||||||||||||
| Interest cost |
990 | 1,023 | 92 | 73 | ||||||||||||
| Plan participants’ contributions |
— | — | 94 | 88 | ||||||||||||
| Actuarial (gain)/loss |
612 | 424 | 412 | 137 | ||||||||||||
| Curtailments |
— | — | — | — | ||||||||||||
| Benefits paid |
(1,309 | ) | (1,472 | ) | (303 | ) | (283 | ) | ||||||||
| Benefit obligation at end of year |
$ | 16,538 | $ | 16,245 | $ | 1,508 | $ | 1,175 | ||||||||
| Change in fair value of plan assets |
||||||||||||||||
| Fair value of plan assets at beginning of year |
$ | 13,139 | $ | 18,258 | ||||||||||||
| Actual return on plan assets |
2,378 | (3,647 | ) | |||||||||||||
| Contribution by employer |
372 | — | ||||||||||||||
| Benefits paid |
(1,309 | ) | (1,472 | ) | ||||||||||||
| Fair value of plan assets at end of year |
$ | 14,580 | $ | 13,139 | ||||||||||||
| Funded status at end of year |
$ | (1,958 | ) | $ | (3,106 | ) | $ | (1,508 | ) | $ | (1,175 | ) | ||||
| Weighted-average assumptions as of December 31 |
||||||||||||||||
| Discount rate |
6.00 | % | 6.25 | % | 6.00 | % | 6.25 | % | ||||||||
| Expected return on plan assets |
8.00 | % | 8.00 | % | N/A | N/A | ||||||||||
The plan expense for the defined benefit pension and post-retirement health and life plans for the year ended December 31, 2009, 2008 and 2007 is as follows:
| Pension Benefits | Other Benefits | ||||||||||||||||||||
| 2009 | 2008 | 2007 | 2009 | 2008 | 2007 | ||||||||||||||||
| Components of net periodic benefit cost (income) |
|||||||||||||||||||||
| Service cost |
$ | — | $ | — | $ | — | $ | 38 | $ | 39 | $ | 43 | |||||||||
| Interest cost |
990 | 1,023 | 996 | 92 | 73 | 69 | |||||||||||||||
| Expected return on plan assets |
(1,009 | ) | (1,418 | ) | (1,408 | ) | — | — | — | ||||||||||||
| Prior service cost recognized |
20 | 30 | 30 | — | — | 3 | |||||||||||||||
| Recognized actuarial loss |
371 | 314 | 403 | 118 | 68 | 66 | |||||||||||||||
| Recognized curtailment loss |
— | — | — | — | — | — | |||||||||||||||
| Net periodic benefit cost |
$ | 372 | $ | (51 | ) | $ | 21 | $ | 248 | $ | 180 | $ | 181 | ||||||||
Future estimated benefit payments under the defined benefit pension plan and post-retirement health and life plan are as follows:
| Pension Benefits |
Other Benefits | |||||
| 2010 |
$ | 1,147 | $ | 212 | ||
| 2011 |
1,184 | 197 | ||||
| 2012 |
1,216 | 169 | ||||
| 2013 |
1,269 | 166 | ||||
| 2014 |
1,283 | 157 | ||||
| Thereafter |
6,624 | 743 | ||||
73
Table of Contents
Index to Financial Statements
Renasant Corporation and Subsidiaries
Notes to Consolidated Financial Statements
Note L – Employee Benefit and Deferred Compensation Plans (continued)
Amounts recognized in accumulated other comprehensive income, net of tax, for the year ended December 31, 2009 are as follows:
| Pension Benefits |
Other Benefits |
|||||||
| Prior service cost |
$ | — | $ | — | ||||
| Actuarial loss |
(5,667 | ) | (605 | ) | ||||
| Total |
$ | (5,667 | ) | $ | (605 | ) | ||
The estimated costs that will be amortized from accumulated other comprehensive income into net periodic cost over the next fiscal year are as follows:
| Pension Benefits |
Other Benefits | |||||
| Prior service cost |
$ | — | $ | — | ||
| Actuarial loss |
326 | 105 | ||||
| Total |
$ | 326 | $ | 105 | ||
The investment objective for the pension or defined benefit plan is to achieve above average income and moderate long term growth. Management seeks to accomplish this objective by combining an equity income strategy (approximately 60%), which generally invests in larger capitalization common stocks, and an intermediate fixed income strategy (approximately 40%), which generally invests in U.S. Government securities and investment grade corporate bonds. It is management’s intent to give the investment managers flexibility within the overall guidelines with respect to investment decisions and their timing. However, significant modifications of any previously approved investments or anticipated use of derivatives to execute investment strategies must be approved by management.
The plan’s expected long-term rate of return was estimated using market benchmarks for investment classes applied to the plan’s target asset allocation. The expected return on investment classes was computed using a valuation methodology which projected future returns based on current equity valuations rather than historical returns.
The fair values of the Company’s defined benefit pension plan assets by category at December 31, 2009 are as follows. Equity securities consist primarily of larger capitalization common stocks that are traded in active markets and are valued based on quoted market prices of identical assets. Fixed income securities consist of U.S. Government securities and investment grade corporate bonds. The fair values of these instruments are based on quoted market prices of similar instruments or a discounted cash flow model.
| Quoted Prices in Active Markets for Identical Assets (Liabilities) (Level 1) |
Significant Other Observable Inputs (Level 2) |
Significant Unobservable Inputs (Level 3) |
Totals | |||||||||
| Cash and cash equivalents |
$ | 431 | $ | — | $ | — | $ | 431 | ||||
| Equity securities |
8,354 | — | — | 8,354 | ||||||||
| Fixed income securities: |
||||||||||||
| U.S. government bonds |
— | 1,209 | — | 1,209 | ||||||||
| Other corporate bonds |
— | 4,586 | — | 4,586 | ||||||||
| $ | 8,785 | $ | 5,795 | $ | — | $ | 14,580 | |||||
74
Table of Contents
Index to Financial Statements
Renasant Corporation and Subsidiaries
Notes to Consolidated Financial Statements
Note L – Employee Benefit and Deferred Compensation Plans (continued)
The Company maintains a 401(k) plan, which is a contributory plan. Employees may contribute pre-tax earnings, subject to a maximum established annually by the IRS. The Company matches employee deferrals, up to 4% of compensation. The Company also makes a nondiscretionary contribution for each eligible employee in an amount equal to 5% of plan compensation and 5% of plan compensation in excess of the Social Security wage base. Employees are generally eligible to participate in the plan upon the attainment of age 21 and the completion of six months of service. Company contributions are allocated to eligible employees who are employed on the last day of each plan year. The Company’s costs related to the 401(k) plan, excluding employee deferrals, in 2009, 2008 and 2007 were $3,254, $3,605 and $3,333, respectively.
The Company adopted the “Performance Based Rewards” incentive compensation plan on January 1, 2001, under which annual cash bonuses are paid to eligible officers and employees, subject to the attainment of designated performance criteria. The Company designates minimum levels of performance for all applicable profit centers and rewards employees on performance over the minimum level. The Company did not make any payments under the plan during 2009 or 2008 and thus did not incur any expense. The expense associated with the plan for 2007 was $616.
The Company maintains three deferred compensation plans: a Deferred Stock Unit Plan and two conventional deferred compensation plans. Nonemployee directors may defer all or any portion of their fees and retainer to the Deferred Stock Unit Plan or the deferred compensation plan maintained for their benefit. Officers may defer base salary and bonus to the Deferred Stock Unit Plan or to the deferred compensation plan maintained for their benefit, subject to maximums that are determined annually by the Company. Amounts credited to the Deferred Stock Unit Plan are invested in units representing shares of the Company’s common stock. Amounts credited to a deferred compensation plan are invested in the discretion of each participant from among designated investment alternatives. Directors and officers who participated in the Company’s deferred compensation plans on or before December 31, 2006, may invest in a preferential interest rate investment that is derived from the Moody’s Average Corporate Bond Rate, adjusted monthly, and the beneficiaries of participants in the deferred compensation plans as of such date may receive a preretirement death benefit in excess of the amounts credited to plan accounts at the time of death. All of the Company’s deferred compensation plans are unfunded. It is anticipated that the two conventional deferred compensation plans will result in no additional cost to the Company because life insurance policies on the lives of the participants have been purchased in amounts estimated to be sufficient to pay plan benefits. The Company is both the owner and beneficiary of the life insurance policies. The expense recorded in 2009, 2008 and 2007 for the Company’s deferred compensation plans, inclusive of deferrals, was $1,661, $1,168 and $1,128, respectively.
The Company assumed four supplemental executive retirement plans (SERPs) in connection with the merger with Capital. The SERPs were established by Capital to provide supplemental retirement benefits. The plans provide four officers of the Company specified annual benefits based upon a projected retirement date. These benefits are payable for a 15-year period after retirement. At December 31, 2009, the supplemental executive retirement liabilities totaled $1,408. The plans are not qualified under Section 401 of the Internal Revenue Code.
At December 31, 2009, an aggregate of 1,977,645 common shares were reserved for issuance under the Company’s employee benefit plans. During 2008, the Company repurchased approximately 95,985 shares under an approved repurchase plan. Repurchased shares will be used for various corporate purposes, including the issuance of shares for business combinations and employee benefit plans. The repurchase plan was discontinued in January 2008.
In 2001, the Company adopted a long-term equity incentive plan, which provides for the grant of stock options and restricted stock. Options granted under the plan allow participants to acquire shares of the Company’s common stock at a fixed exercise price and expire ten years after the grant date. Options vest and become exercisable in installments over a three-year period measured from the grant date. Options that have not vested are forfeited and cancelled upon the termination of a participant’s employment. The Company recorded compensation expense of $473, $689 and $934 for the years ended December 31, 2009, 2008 and 2007, respectively, for options granted under the plan.
75
Table of Contents
Index to Financial Statements
Renasant Corporation and Subsidiaries
Notes to Consolidated Financial Statements
Note L – Employee Benefit and Deferred Compensation Plans (continued)
The fair value of each option grant was estimated on the grant date using the Black-Scholes option-pricing model with the following assumptions for each option grant:
| 2009 Grant | 2008 Grant | 2007 Grant | ||||
| Dividend yield |
3.99% | 3.86% | 2.45% | |||
| Expected volatility |
30% | 21% | 21% | |||
| Risk-free interest rate |
1.55% | 3.45% | 4.72% | |||
| Expected lives |
6 years | 6 years | 6 years | |||
| Weighted average fair value |
$3.09 | $2.66 | $6.98 |
The total intrinsic value of options and warrants exercised during the years ended December 31, 2009, 2008 and 2007 was $20, $2,743 and $1,063, respectively. Unrecognized stock-based compensation expense related to stock options and restricted stock totaled $403 and $79, respectively, at December 31, 2009. At such date, the weighted average period over which this unrecognized expense is expected to be recognized was approximately 1.4 years and 1.0 years for stock options and restricted stock, respectively.
In connection with its merger with Capital, the Company assumed the Capital Bancorp, Inc. 2001 Stock Option Plan, under which options to purchase an aggregate of 224,966 shares of the Company’s common stock were outstanding as of the date of assumption. No additional options or other forms of equity incentives will be granted or awarded under either of these plans.
The following table summarizes information about options issued under the long-term equity incentive plan as of and for the year ended December 31, 2009:
| Shares | Weighted Average Exercise Price |
Weighted Average Remaining Contractual Life |
Aggregate Intrinsic Value | ||||||||
| Outstanding at beginning of year |
1,141,462 | $ | 19.87 | ||||||||
| Granted |
136,750 | 17.03 | |||||||||
| Exercised |
(5,062 | ) | 8.85 | ||||||||
| Forfeited |
(89,375 | ) | 22.41 | ||||||||
| Outstanding at end of year |
1,183,775 | $ | 19.40 | 5.54 | $ | 778 | |||||
| Exercisable at end of year |
906,108 | $ | 19.35 | 4.70 | $ | 778 | |||||
The Company awards performance-based restricted stock to executives and time-based restricted stock to other officers and employees under the long-term equity incentive plan. The performance-based restricted stock vests upon completion of a one-year service period and the attainment of certain performance goals. Performance-based restricted stock is issued at the target level; the number of shares ultimately awarded is determined at the end of each year and may be increased or decreased depending upon the Company meeting or exceeding financial performance measures defined by the Board of Directors. No performance-based shares vested during 2009 because performance at the threshold level was not achieved. Time-based restricted stock vests at the end of a three-year service period. The fair value of each restricted stock grant is the closing price of the Company’s common stock on the day immediately preceding the grant date. The Company recorded compensation expense of $153, $325 and $510 for the years ended December 31, 2009, 2008 and 2007, respectively, for restricted stock awarded under the plan.
The following table summarizes the changes in restricted stock as of and for the year ended December 31, 2009:
| Performance-Based Restricted Stock |
Weighted Average Grant-Date Fair Value |
Time-Based Restricted Stock |
Weighted Average Grant-Date Fair Value | |||||||||
| Nonvested at beginning of year |
— | $ | — | 29,000 | $ | 21.61 | ||||||
| Granted |
26,750 | (1) | 17.03 | — | — | |||||||
| Vested |
— | — | (5,500 | ) | 30.63 | |||||||
| Cancelled |
(26,750 | ) | 17.03 | (3,500 | ) | 19.63 | ||||||
| Nonvested at end of year |
— | $ | — | 20,000 | $ | 19.48 | ||||||
| (1) | Assumes target levels of performance are met for performance-based awards. |
76
Table of Contents
Index to Financial Statements
Renasant Corporation and Subsidiaries
Notes to Consolidated Financial Statements
Note M – Restrictions on Cash, Bank Dividends, Loans or Advances
(In Thousands)
Renasant Bank is required to maintain minimum average balances with the Federal Reserve. At December 31, 2009 and 2008, Renasant Bank’s reserve requirements with the Federal Reserve were $31,753 and $45,145, with which it was in full compliance.
The Company’s ability to pay dividends to our shareholders is substantially dependent on the ability of Renasant Bank to transfer funds to the Company in the form of dividends, loans and advances. Under Mississippi law, a Mississippi bank may not pay dividends unless its earned surplus is in excess of three times capital stock. A Mississippi bank with earned surplus in excess of three times capital stock may pay a dividend, subject to the approval of the Mississippi Department of Banking and Consumer Finance. In addition, the FDIC must approve any payment of dividends by the Bank. Accordingly, the approval of these supervisory authorities is required prior to Renasant Bank paying dividends to the Company.
Federal Reserve regulations also limit the amount Renasant Bank may loan to the Company unless such loans are collateralized by specific obligations. At December 31, 2009, the maximum amount available for transfer from Renasant Bank to the Company in the form of loans was $32,467. There were no loans outstanding from Renasant Bank to the Company at December 31, 2009.
Note N – Regulatory Matters
(In Thousands)
Renasant Bank is subject to various regulatory capital requirements administered by the federal banking agencies. Failure to meet minimum capital requirements can initiate certain mandatory, and possibly additional discretionary, actions by regulators that, if undertaken, could have a direct material effect on Renasant Bank’s financial statements. Under capital adequacy guidelines and the regulatory framework for prompt corrective action, Renasant Bank must meet specific capital guidelines that involve quantitative measures of Renasant Bank’s assets, liabilities, and certain off-balance-sheet items as calculated under regulatory accounting practices. Renasant Bank’s capital amounts and classification are also subject to qualitative judgments by the regulators about components, risk weightings, and other factors.
Quantitative measures established by regulation to ensure capital adequacy require Renasant Bank to maintain minimum balances and ratios. All banks are required to have core capital (Tier I) of at least 4% of risk-weighted assets, Tier I leverage of 4% of average assets, and total capital of 8% of risk-weighted assets (as such ratios are defined in Federal regulations). To be categorized as well capitalized, banks must maintain minimum Tier I leverage, Tier I risk-based and total risk-based ratios of 5%, 6%, and 10%, respectively. As of December 31, 2009, Renasant Bank met all capital adequacy requirements to which it is subject.
As of December 31, 2009, the most recent notification from the FDIC categorized Renasant Bank as well capitalized under the regulatory framework for prompt corrective action. There are no conditions or events since that notification that management believes have changed Renasant Bank’s category.
The following table provides the capital and risk-based capital and leverage ratios for the Company and for our banking subsidiary at December 31:
| 2009 | 2008 | |||||||||||
| Amount | Ratio | Amount | Ratio | |||||||||
| Renasant Corporation |
||||||||||||
| Total Capital |
$ | 332,780 | 12.37 | % | $ | 325,982 | 12.10 | % | ||||
| Tier I Capital |
299,221 | 11.12 | % | 292,287 | 10.85 | % | ||||||
| Tier I Leverage |
299,221 | 8.68 | % | 292,287 | 8.34 | % | ||||||
| Renasant Bank |
||||||||||||
| Total Capital |
$ | 324,674 | 12.10 | % | $ | 315,867 | 11.74 | % | ||||
| Tier I Capital |
291,115 | 10.85 | % | 282,233 | 10.49 | % | ||||||
| Tier I Leverage |
291,115 | 8.47 | % | 282,233 | 8.07 | % | ||||||
77
Table of Contents
Index to Financial Statements
Renasant Corporation and Subsidiaries
Notes to Consolidated Financial Statements
Note O – Segment Reporting
(In Thousands)
The Company’s internal reporting process is organized into four segments that account for the Company’s principal activities: the delivery of financial services through its community banks in Mississippi, Tennessee and Alabama and the delivery of insurance services through its insurance agency. In order to give the Company’s regional management a more precise indication of the income and expenses they can control, the results of operations for the geographic regions of the community banks and for the insurance company reflect the direct revenues and expenses of each respective segment. The Company believes this management approach will enable its regional management to focus on serving customers through loan originations and deposit gathering. Indirect revenues and expenses, including but not limited to income from the Company’s investment portfolio, as well as certain costs associated with other data processing and back office functions, are not allocated to the Company’s segments. Rather, these revenues and expenses are shown in the “Other” column along with the operations of the holding company and eliminations which are necessary for purposes of reconciling to the consolidated amounts.
The following table provides financial information for our operating segments for the years ended December 31, 2009, 2008 and 2007:
| Community Banks | |||||||||||||||||||
| Mississippi | Tennessee | Alabama | Insurance | Other | Consolidated | ||||||||||||||
| 2009: |
|||||||||||||||||||
| Net interest income |
$ | 52,303 | $ | 30,739 | $ | 21,472 | $ | 98 | $ | (5,146 | ) | $ | 99,466 | ||||||
| Provision for loan losses |
8,952 | 9,795 | 8,143 | — | — | 26,890 | |||||||||||||
| Noninterest income |
30,067 | 4,166 | 11,790 | 3,774 | 7,761 | 57,558 | |||||||||||||
| Noninterest expense |
33,241 | 18,310 | 17,210 | 3,023 | 33,969 | 105,753 | |||||||||||||
| Income before income taxes |
40,177 | 6,800 | 7,909 | 849 | (31,354 | ) | 24,381 | ||||||||||||
| Income taxes |
10,154 | 1,718 | 1,999 | 330 | (8,338 | ) | 5,863 | ||||||||||||
| Net income (loss) |
$ | 30,023 | $ | 5,082 | $ | 5,910 | $ | 519 | $ | (23,016 | ) | $ | 18,518 | ||||||
| Total assets |
$ | 1,542,644 | $ | 1,356,972 | $ | 726,609 | $ | 8,452 | $ | 6,404 | $ | 3,641,081 | |||||||
| Goodwill |
2,265 | 133,316 | 46,520 | 2,783 | — | 184,884 | |||||||||||||
| 2008: |
|||||||||||||||||||
| Net interest income |
$ | 47,475 | $ | 30,587 | $ | 20,970 | $ | 111 | $ | 10,299 | $ | 109,442 | |||||||
| Provision for loan losses |
7,535 | 9,361 | 5,908 | — | — | 22,804 | |||||||||||||
| Noninterest income |
31,465 | 4,439 | 9,424 | 3,929 | 4,785 | 54,042 | |||||||||||||
| Noninterest expense |
32,198 | 20,013 | 16,915 | 3,225 | 35,617 | 107,968 | |||||||||||||
| Income before income taxes |
39,207 | 5,652 | 7,571 | 815 | (20,533 | ) | 32,712 | ||||||||||||
| Income taxes |
10,925 | 1,575 | 2,110 | 317 | (6,267 | ) | 8,660 | ||||||||||||
| Net income (loss) |
$ | 28,282 | $ | 4,077 | $ | 5,461 | $ | 498 | $ | (14,266 | ) | $ | 24,052 | ||||||
| Total assets |
$ | 1,603,777 | $ | 1,362,499 | $ | 736,320 | $ | 7,778 | $ | 5,606 | $ | 3,715,980 | |||||||
| Goodwill |
2,265 | 133,316 | 46,520 | 2,783 | — | 184,884 | |||||||||||||
| 2007: |
|||||||||||||||||||
| Net interest income |
$ | 55,312 | $ | 23,404 | $ | 20,616 | $ | 92 | $ | (3,603 | ) | $ | 95,821 | ||||||
| Provision for loan losses |
770 | 1,861 | 2,207 | — | — | 4,838 | |||||||||||||
| Noninterest income |
31,205 | 2,755 | 9,546 | 3,963 | 4,718 | 52,187 | |||||||||||||
| Noninterest expense |
31,191 | 14,553 | 17,003 | 3,147 | 32,106 | 98,000 | |||||||||||||
| Income before income taxes |
54,556 | 9,745 | 10,952 | 908 | (30,991 | ) | 45,170 | ||||||||||||
| Income taxes |
17,475 | 3,121 | 3,508 | 326 | (10,361 | ) | 14,069 | ||||||||||||
| Net income (loss) |
$ | 37,081 | $ | 6,624 | $ | 7,444 | $ | 582 | $ | (20,630 | ) | $ | 31,101 | ||||||
| Total assets |
$ | 1,555,787 | $ | 1,278,167 | $ | 766,844 | $ | 7,202 | $ | 4,287 | $ | 3,612,287 | |||||||
| Goodwill |
2,265 | 134,550 | 46,822 | 2,783 | — | 186,420 | |||||||||||||
78
Table of Contents
Index to Financial Statements
Renasant Corporation and Subsidiaries
Notes to Consolidated Financial Statements
Note P – Fair Value of Financial Instruments
(In Thousands)
The carrying amounts and estimated fair values of the Company’s financial instruments are as follows:
| December 31, | ||||||||||||
| 2009 | 2008 | |||||||||||
| Carrying Value |
Fair Value |
Carrying Value |
Fair Value | |||||||||
| Financial assets: |
||||||||||||
| Cash and cash equivalents |
$ | 148,560 | $ | 148,560 | $ | 100,394 | $ | 100,394 | ||||
| Securities available for sale |
575,358 | 575,358 | 695,106 | 695,106 | ||||||||
| Securities held to maturity |
138,806 | 139,433 | — | — | ||||||||
| Mortgage loans held for sale |
25,749 | 25,749 | 41,805 | 41,805 | ||||||||
| Loans, net |
2,308,470 | 2,291,654 | 2,495,981 | 2,511,845 | ||||||||
| Derivative instruments |
1,946 | 1,946 | 150 | 150 | ||||||||
| Financial liabilities: |
||||||||||||
| Deposits |
2,576,100 | 2,589,135 | 2,344,331 | 2,359,423 | ||||||||
| Short-term borrowings |
22,397 | 22,397 | 89,541 | 89,541 | ||||||||
| Federal Home Loan Bank advances |
469,574 | 480,639 | 768,302 | 780,246 | ||||||||
| Junior subordinated debentures |
76,053 | 37,548 | 76,133 | 77,388 | ||||||||
| TLGP Senior Note |
50,000 | 51,888 | — | — | ||||||||
| Derivative instruments |
277 | 277 | 953 | 953 | ||||||||
The following methods and assumptions were used to estimate the fair value of each class of financial instruments for which it is practicable to estimate that value:
Cash and cash equivalents: Cash and cash equivalents consists of cash and due from banks and interest-bearing balances with banks. The carrying amount reported in the Consolidated Balance Sheets for cash and cash equivalents approximates fair value.
Securities: For both securities available for sale and securities held to maturity, fair values for debt securities are based on quoted market prices, where available. If quoted market prices are not available, fair values are based on quoted market prices of comparable instruments. The fair value of equity securities not traded in an active market approximates their historical cost.
Mortgage loans held for sale: Mortgage loans held for sale are carried at the lower of cost or fair value. If fair value is used, it is determined using current secondary market prices for loans with similar characteristics.
Loans: For variable-rate loans that reprice frequently and with no significant change in credit risk, fair values are based on carrying values. Fixed-rate loan fair values, including mortgages, commercial, agricultural and consumer loans are estimated using a discounted cash flow analysis based on interest rates currently being offered for loans with similar terms to borrowers of similar credit quality.
Derivative instruments: Derivative instruments include interest rate swaps and mortgage loan commitments. The fair value of the interest rate swaps are based on the projected future cash flows. The fair value of the mortgage loan commitments is based on readily available fair values, obtained in the open market from mortgage investors.
Deposits: The fair values disclosed for demand deposits, both interest-bearing and noninterest-bearing are, by definition, equal to the amount payable on demand at the reporting date. The fair values of certificates of deposit and individual retirement accounts are estimated using a discounted cash flow based on currently effective interest rates for similar types of accounts.
Short-term borrowings: Short-term borrowings consist of federal funds purchased, treasury, tax and loan notes and securities sold under agreements to repurchase. The fair value of these short-term borrowings approximates the carrying value of the amounts reported in the Consolidated Balance Sheets for each respective account.
Federal Home Loan Bank advances: The fair value for Federal Home Loan Bank advances was determined by discounting the cash flow using the current market rate.
79
Table of Contents
Index to Financial Statements
Renasant Corporation and Subsidiaries
Notes to Consolidated Financial Statements
Note P – Fair Value of Financial Instruments (continued)
Junior subordinated debentures: The fair value for the Company’s junior subordinated debentures was determined by discounting the cash flow using the current market rate.
TLGP Senior Note: The fair value for the Company’s TLGP senior note was determined by discounting the cash flow using the current market rate.
ASC 820 provides guidance for using fair value to measure assets and liabilities and also establishes a fair value hierarchy that prioritizes the inputs to valuation techniques used to measure fair value into three broad levels. The fair value hierarchy gives the highest priority to a valuation based on quoted prices in active markets for identical assets and liabilities (Level 1), moderate priority to a valuation based on quoted prices in active markets for similar assets and liabilities and/or based on assumptions that are observable in the market (Level 2), and the lowest priority to a valuation based on assumptions that are not observable in the market (Level 3). The following methods and assumptions are used by the Company to estimate the fair values of the Company’s financial assets and liabilities on a recurring basis:
Securities available for sale: Securities available for sale consist primarily of debt securities such as obligations of U.S. Government agencies and corporations, mortgage-backed securities and trust preferred securities. The fair values of these instruments are based on quoted market prices of similar instruments or a discounted cash flow model. Securities available for sale also include equity securities that are not traded in an active market. The fair value of these securities approximates their historical cost.
Derivative instruments: Interest rate swaps are extensively traded in over-the-counter markets at prices based upon projections of future cash payments/receipts discounted at market rates. The fair value of the Company’s interest rate swaps are determined based upon discounted cash flows. The fair value of the mortgage loan commitments are based on readily available fair values, obtained in the open market from mortgage investors. These fair values reflect the values of mortgage loans having similar terms and characteristics to the mortgage loan commitments entered into by the Company.
The following table presents assets and liabilities that are measured at fair value on a recurring basis at December 31, 2009 and 2008:
| Quoted Prices in Active Markets for Identical Assets (Liabilities) (Level 1) |
Significant Other Observable Inputs (Level 2) |
Significant Unobservable Inputs (Level 3) |
Totals | |||||||||||
| December 31, 2009 |
||||||||||||||
| Securities available for sale |
$ | — | $ | 524,059 | $ | 51,299 | $ | 575,358 | ||||||
| Derivative instruments, net |
— | 1,669 | — | 1,669 | ||||||||||
| $ | — | $ | 525,728 | $ | 51,299 | $ | 577,027 | |||||||
| December 31, 2008 |
||||||||||||||
| Securities available for sale |
$ | — | $ | 624,625 | $ | 70,481 | $ | 695,106 | ||||||
| Derivative instruments, net |
— | (803 | ) | — | (803 | ) | ||||||||
| $ | — | $ | 623,822 | $ | 70,481 | $ | 694,303 | |||||||
The decrease in securities available for sale valued using Level 2 inputs at December 31, 2009 as compared to December 31, 2008 is a result of the Company transferring all of its securities representing obligations of states and political subdivisions from available for sale to held to maturity.
The following table provides a reconciliation for assets and liabilities measured at fair value on a recurring basis using significant unobservable inputs, or Level 3 inputs, during the years ended December 31, 2009 and 2008:
80
Table of Contents
Index to Financial Statements
Renasant Corporation and Subsidiaries
Notes to Consolidated Financial Statements
Note P – Fair Value of Financial Instruments (continued)
| Securities available for sale | ||||||||
| 2009 | 2008 | |||||||
| Balance as of January 1 |
$ | 70,481 | $ | 36,674 | ||||
| Realized (losses) gains included in net income |
(581 | ) | 964 | |||||
| Unrealized losses included in other comprehensive income |
(7,197 | ) | (12,236 | ) | ||||
| Net purchases, sales, issuances, and settlements |
(11,404 | ) | 43,130 | |||||
| Transfers in and/or out of Level 3 |
— | 1,949 | ||||||
| Balance as of December 31 |
$ | 51,299 | $ | 70,481 | ||||
Certain assets may be recorded at fair value on a nonrecurring basis. These nonrecurring fair value adjustments typically are a result of the application of the lower of cost or market accounting or a write-down occurring during the period. The following methods and assumptions are used by the Company to estimate the fair values of the Company’s financial assets and liabilities on a nonrecurring basis:
Mortgage loans held for sale: Mortgage loans held for sale are carried at the lower of cost or fair value. If fair value is used, it is determined using current secondary market prices for loans with similar characteristics. Mortgage loans held for sale were carried at cost on the Consolidated Balance Sheets at December 31, 2009 and 2008, respectively.
Impaired loans: Loans considered impaired are reserved for at the time the loan is identified as impaired taking into account the fair value of the collateral less estimated selling costs. Collateral may be real estate and/or business assets including but not limited to equipment, inventory and accounts receivable. The fair value of real estate is determined based on appraisals by qualified licensed appraisers. The fair value of the business assets is generally based on amounts reported on the business’s financial statements. Appraised and reported values may be adjusted based on management’s historical knowledge, changes in market conditions from the time of valuation and management’s knowledge of the client and the client’s business. Since not all valuation inputs are observable, these nonrecurring fair value determinations are classified as Level 3. Impaired loans are reviewed and evaluated on at least a quarterly basis for additional impairment and adjusted accordingly, based on the same factors previously identified.
Other real estate owned: Other real estate owned (“OREO”) is comprised of commercial and residential real estate obtained in partial or total satisfaction of loan obligations. OREO acquired in settlement of indebtedness is recorded at the fair value of the real estate less costs to sell. Subsequently, it may be necessary to record nonrecurring fair value adjustments for declines in fair value. Fair value, when recorded, is determined based on appraisals by qualified licensed appraisers and adjusted for management’s estimates of costs to sell. As such, values for OREO are classified as Level 3.
The following table presents assets measured at fair value on a nonrecurring basis at December 31, 2009 and 2008 that were still held in the Consolidated Balance Sheets at those respective dates:
| Level 1 | Level 2 | Level 3 | Totals | |||||||||
| December 31, 2009 |
||||||||||||
| Impaired loans |
$ | — | $ | — | $ | 78,584 | $ | 78,584 | ||||
| Other real estate owned |
— | — | 2,462 | 2,462 | ||||||||
| December 31, 2008 |
||||||||||||
| Impaired loans |
$ | — | $ | — | $ | 35,392 | $ | 35,392 | ||||
| Other real estate owned |
— | — | 6,735 | 6,735 | ||||||||
Impaired loans with a carrying value of $78,584 and $35,392 had an allocated allowance for loan losses of $13,468 and $5,357 at December 31, 2009 and 2008, respectively. The allocated allowance is based on the carrying value of the impaired loan and the fair value of the underlying collateral less estimated costs to sell.
OREO with a carrying amount of $3,023 was written down to $2,462, resulting in a loss of $561, which was included in the results of operations for the year ended December 31, 2009. OREO with a carrying amount of $7,482 was written down to $6,735, resulting in a loss of $747, which was included in the results of operations for the year ended December 31, 2008.
81
Table of Contents
Index to Financial Statements
Renasant Corporation and Subsidiaries
Notes to Consolidated Financial Statements
Note Q – Derivative Instruments
(In Thousands)
The Company has entered into an interest rate swap with a notional amount of $31,000 whereby it receives a variable rate of interest based on the three-month LIBOR plus 187 basis points and pays a fixed rate of 5.70%. The swap matures in March 2010. The Company accounts for this swap as a cash flow hedge of the volatility in cash flows resulting from changes in interest rates on $31,000 of its junior subordinated debentures. The swap had a fair value of $(277) and $(953) at December 31, 2009 and 2008, respectively. In addition, the Company has entered into interest rate swaps with a notional amount of $75,000 whereby it receives a fixed rate of interest and pays a variable rate based on the Prime rate. The swaps have a maturity date of August 2012 and August 2013. The interest rate swaps are a designated cash flow hedge designed to convert the variable interest rate on $75,000 of loans to a fixed rate. At December 31, 2009, the swaps had a fair value of $1,701.
In March 2008, the Company terminated an interest rate swap designated as a cash flow hedge designed to convert the variable interest rate on $100,000 of loans to a fixed rate. Deferred gains related to the swap of $1,013 and $2,150 were amortized into net interest income over the designated hedging period that ended in May 2009 during the year ended December 31, 2009 and 2008, respectively.
The Company enters into mortgage loan commitments with its customers to mitigate the interest rate risk associated with the commitments to fund fixed-rate mortgage loans. These mortgage loan commitments are recorded at fair value, with gains and losses arising from changes in the valuation of the commitments reflected under the caption “Gains on sales of mortgage loans held for sale” on the Consolidated Statements of Income and do not qualify for hedge accounting. At December 31, 2009, the notional amount of commitments to fund fixed-rate mortgage loans was $23,277 with a fair value of $245. At December 31, 2008, the notional amount of commitments to fund fixed-rate mortgage loans was $50,777 with a fair value of $150.
Note R – Renasant Corporation (Parent Company Only) Condensed Financial Information
(In Thousands)
| Balance Sheets | December 31, | |||||
| 2009 | 2008 | |||||
| Assets |
||||||
| Cash and cash equivalents(1) |
$ | 5,745 | $ | 6,085 | ||
| Investments |
3,400 | 3,218 | ||||
| Investment in bank subsidiary(1) |
475,171 | 463,996 | ||||
| Accrued interest receivable on bank balances(1) |
35 | 47 | ||||
| Stock options receivable(1) |
626 | 1,191 | ||||
| Other assets |
2,041 | 3,648 | ||||
| Total assets |
$ | 487,018 | $ | 478,185 | ||
| Liabilities and shareholders’ equity |
||||||
| Junior subordinated debentures |
$ | 76,053 | $ | 76,133 | ||
| Other liabilities |
843 | 1,681 | ||||
| Shareholders’ equity |
410,122 | 400,371 | ||||
| Total liabilities and shareholders’ equity |
$ | 487,018 | $ | 478,185 | ||
| (1) | Eliminates in consolidation |
82
Table of Contents
Index to Financial Statements
Renasant Corporation and Subsidiaries
Notes to Consolidated Financial Statements
Note R – Renasant Corporation (Parent Company Only) Condensed Financial Information (continued)
| Statements of Income | Year Ended December 31, | |||||||||||
| 2009 | 2008 | 2007 | ||||||||||
| Income |
||||||||||||
| Dividends from bank subsidiary(1) |
$ | 14,365 | $ | 16,321 | $ | 19,081 | ||||||
| Interest income from bank subsidiary(1) |
57 | 84 | 113 | |||||||||
| Other dividends |
108 | 146 | 190 | |||||||||
| Other income |
7 | 30 | 2 | |||||||||
| Total income |
14,537 | 16,581 | 19,386 | |||||||||
| Expenses |
4,424 | 5,497 | 6,097 | |||||||||
| Income before income tax benefit and equity in undistributed net income of bank subsidiary |
10,113 | 11,084 | 13,289 | |||||||||
| Income tax benefit |
(1,489 | ) | (2,004 | ) | (2,255 | ) | ||||||
| Equity in undistributed net income of bank subsidiary(1) |
6,916 | 10,964 | 15,557 | |||||||||
| Net income |
$ | 18,518 | $ | 24,052 | $ | 31,101 | ||||||
| (1) | Eliminates in consolidation |
| Statements of Cash Flows | Year Ended December 31, | |||||||||||
| 2009 | 2008 | 2007 | ||||||||||
| Operating activities |
||||||||||||
| Net income |
$ | 18,518 | $ | 24,052 | $ | 31,101 | ||||||
| Adjustments to reconcile net income to net cash provided by operating activities: |
||||||||||||
| Equity in undistributed net income of bank subsidiary |
(6,916 | ) | (10,964 | ) | (15,557 | ) | ||||||
| Amortization |
(88 | ) | (113 | ) | 273 | |||||||
| Decrease (increase) in other assets |
2,743 | (430 | ) | 3,177 | ||||||||
| (Decrease) increase in other liabilities |
(439 | ) | 1,218 | (136 | ) | |||||||
| Net cash provided by operating activities |
13,818 | 13,763 | 18,858 | |||||||||
| Investing activities |
||||||||||||
| Investment in subsidiaries |
— | — | (56,982 | ) | ||||||||
| Net cash used in investing activities |
— | — | (56,982 | ) | ||||||||
| Financing activities |
||||||||||||
| Proceeds from advances from subsidiary |
— | 1,000 | 2,000 | |||||||||
| Repayment of advances from subsidiary |
— | (1,000 | ) | (2,000 | ) | |||||||
| Cash paid for dividends |
(14,364 | ) | (14,321 | ) | (12,581 | ) | ||||||
| Purchase of treasury stock |
— | (2,004 | ) | (7,810 | ) | |||||||
| Cash received on exercise of stock-based compensation |
206 | 3,284 | 1,297 | |||||||||
| Proceeds from equity offering |
— | — | 58,126 | |||||||||
| Net cash (used in) provided by financing activities |
(14,158 | ) | (13,041 | ) | 39,032 | |||||||
| (Decrease) increase in cash and cash equivalents |
(340 | ) | 722 | 908 | ||||||||
| Cash and cash equivalents at beginning of year |
6,085 | 5,363 | 4,455 | |||||||||
| Cash and cash equivalents at end of year |
$ | 5,745 | $ | 6,085 | $ | 5,363 | ||||||
83
Table of Contents
Index to Financial Statements
Renasant Corporation and Subsidiaries
Notes to Consolidated Financial Statements
Note S – Quarterly Results of Operations
(In Thousands, Except Share Data) (Unaudited)
The following table sets forth a summary of the unaudited quarterly results of operations.
| First Quarter |
Second Quarter |
Third Quarter |
Fourth Quarter |
||||||||||
| 2009 |
|||||||||||||
| Interest income |
$ | 43,910 | $ | 42,709 | $ | 42,614 | $ | 41,331 | |||||
| Interest expense |
18,597 | 18,549 | 17,423 | 16,529 | |||||||||
| Net interest income |
25,313 | 24,160 | 25,191 | 24,802 | |||||||||
| Provision for loan losses |
5,040 | 6,700 | 7,350 | 7,800 | |||||||||
| Noninterest income |
14,762 | 15,424 | 13,953 | 13,419 | |||||||||
| Noninterest expense |
26,920 | 27,132 | 26,118 | 25,583 | |||||||||
| Income before income taxes |
8,115 | 5,752 | 5,676 | 4,838 | |||||||||
| Income taxes |
2,109 | 1,496 | 1,451 | 807 | |||||||||
| Net income |
$ | 6,006 | $ | 4,256 | $ | 4,225 | $ | 4,031 | |||||
| Basic earnings per share |
$ | 0.29 | $ | 0.20 | $ | 0.20 | $ | 0.19 | |||||
| Diluted earnings per share |
$ | 0.28 | $ | 0.20 | $ | 0.20 | $ | 0.19 | |||||
| 2008 |
|||||||||||||
| Interest income |
$ | 53,383 | $ | 50,465 | $ | 50,004 | $ | 47,110 | |||||
| Interest expense |
26,226 | 22,963 | 22,063 | 20,268 | |||||||||
| Net interest income |
27,157 | 27,502 | 27,941 | 26,842 | |||||||||
| Provision for loan losses |
2,625 | 2,200 | 3,000 | 14,979 | |||||||||
| Noninterest income |
13,857 | 13,790 | 13,644 | 12,751 | |||||||||
| Noninterest expense |
26,798 | 27,698 | 27,784 | 25,688 | |||||||||
| Income before income taxes |
11,591 | 11,394 | 10,801 | (1,074 | ) | ||||||||
| Income taxes |
3,314 | 3,409 | 3,243 | (1,306 | ) | ||||||||
| Net income |
$ | 8,277 | $ | 7,985 | $ | 7,558 | $ | 232 | |||||
| Basic earnings per share |
$ | 0.40 | $ | 0.38 | $ | 0.36 | $ | 0.01 | |||||
| Diluted earnings per share |
$ | 0.39 | $ | 0.38 | $ | 0.36 | $ | 0.01 | |||||
84
Table of Contents
Index to Financial Statements
Renasant Corporation and Subsidiaries
Notes to Consolidated Financial Statements
Note T – Other Comprehensive Income
(In Thousands)
The components of other comprehensive income for the years ended December 31 are as follows:
| 2009 | 2008 | 2007 | ||||||||||
| Net income |
$ | 18,518 | $ | 24,052 | $ | 31,101 | ||||||
| Other comprehensive income (loss): |
||||||||||||
| Unrealized holding gains (losses) on securities, net of tax expense (benefit) of $2,755, $(4,260), and $2,088 |
4,447 | (6,877 | ) | 3,371 | ||||||||
| Reclassification adjustment for gains realized in net income, net of tax expense of $640 and $30 |
(1,033 | ) | — | (48 | ) | |||||||
| Net change in unrealized gains (losses) on securities |
3,414 | (6,877 | ) | 3,323 | ||||||||
| Unrealized holding gains on derivative instruments, net of tax expense of $909, $175 and $501 |
1,468 | 284 | 809 | |||||||||
| Reclassification adjustment for gains realized in net income, net of tax expense of $387 and $822 |
(626 | ) | (1,328 | ) | — | |||||||
| Net change in unrealized gains (losses) on derivative instruments |
842 | (1,044 | ) | 809 | ||||||||
| Net change in defined benefit pension and post-retirement benefit plans, net of tax expense (benefit) of $327, $(1,995) and $380 |
527 | (3,220 | ) | 613 | ||||||||
| Other comprehensive income (loss) |
4,783 | (11,141 | ) | 4,745 | ||||||||
| Comprehensive income |
$ | 23,301 | $ | 12,911 | $ | 35,846 | ||||||
The accumulated balances for each component of other comprehensive income, net of tax, are as follows
| 2009 | 2008 | 2007 | ||||||||||
| Net unrealized (losses) gains on securities |
$ | (2,063 | ) | $ | (5,477 | ) | $ | 1,400 | ||||
| Net unrealized gains on derivative instruments |
879 | 37 | 1,081 | |||||||||
| Net unrecognized defined benefit pension and post-retirement benefit plans obligations |
(6,272 | ) | (6,799 | ) | (3,579 | ) | ||||||
| Total accumulated other comprehensive loss |
$ | (7,456 | ) | $ | (12,239 | ) | $ | (1,098 | ) | |||
Note U – Net Income Per Common Share
(In Thousands, Except Share Data)
Basic and diluted net income per common share calculations are as follows:
| Year Ended December 31, | |||||||||
| 2009 | 2008 | 2007 | |||||||
| Basic |
|||||||||
| Net income applicable to common stock |
$ | 18,518 | $ | 24,052 | $ | 31,101 | |||
| Average common shares outstanding |
21,073,916 | 20,961,364 | 18,679,857 | ||||||
| Net income per common share - basic |
$ | 0.88 | $ | 1.15 | $ | 1.66 | |||
| Diluted |
|||||||||
| Net income applicable to common stock |
$ | 18,518 | $ | 24,052 | $ | 31,101 | |||
| Average common shares outstanding |
21,073,916 | 20,961,364 | 18,679,857 | ||||||
| Effect of dilutive stock-based compensation |
137,756 | 156,850 | 309,422 | ||||||
| Average common shares outstanding - diluted |
21,211,672 | 21,118,214 | 18,989,279 | ||||||
| Net income per common share - diluted |
$ | 0.87 | $ | 1.14 | $ | 1.64 | |||
85
Table of Contents
Index to Financial Statements
Renasant Corporation and Subsidiaries
Notes to Consolidated Financial Statements
Note V – Mergers and Acquisitions
(In Thousands, Except Share Data)
On July 1, 2007, the Company completed its merger with Capital, a bank holding company headquartered in Nashville, Tennessee. Capital was the parent of Capital Bank & Trust Company and operated seven banking offices in the Nashville-Davidson-Murfreesboro, Tennessee Metropolitan Statistical Area (the “Nashville MSA”). The merger with Capital allowed the Company to further its strategic initiatives by expanding its geographic footprint into the Nashville MSA.
The Company issued 2,797,238 shares of its common stock and paid approximately $56,055 in cash for 100% of the voting equity interests in Capital. The common stock issued by the Company was registered under the Securities Act of 1933, as amended. The Company used the proceeds of its public offering of 2.76 million shares of its common stock to pay the cash portion of the merger consideration. Three members of the Board of Directors of Capital were added to the Company’s Board. The aggregate transaction value, including the value of Capital’s options assumed by the Company, was $131,400. In connection with the merger, the Company recorded approximately $101,492 in intangible assets. The intangible assets are not deductible for income tax purposes.
The following table summarizes the assets acquired and liabilities assumed in connection with the merger with Capital:
| Cash and cash equivalents |
$ | 8,801 | ||
| Securities |
72,266 | |||
| Mortgage loans held for sale |
1,440 | |||
| Loans, net of unearned income |
515,982 | |||
| Allowance for loan losses |
(5,554 | ) | ||
| Other assets |
21,867 | |||
| Total assets |
614,802 | |||
| Deposits |
490,257 | |||
| Borrowings |
84,127 | |||
| Other liabilities |
4,151 | |||
The following unaudited summary information presents the condensed consolidated statements of income of the Company, on a pro forma basis, as if the merger with Capital and the equity offering had been completed on January 1, 2007. The pro forma summary information does not necessarily reflect the results of operations that would have occurred if the mergers had occurred at the beginning of the periods presented, or of results which may occur in the future.
| Year Ended December 31, 2007 | |||
| Interest income |
$ | 219,998 | |
| Interest expense |
113,977 | ||
| Net interest income |
106,021 | ||
| Provision for loan losses |
6,143 | ||
| Noninterest income |
53,444 | ||
| Noninterest expense |
106,289 | ||
| Income before income taxes |
47,033 | ||
| Income taxes |
14,768 | ||
| Net income |
$ | 32,265 | |
| Earnings per share: |
|||
| Basic |
$ | 1.53 | |
| Diluted |
$ | 1.50 | |
86
Table of Contents
Index to Financial Statements
| ITEM 9. | CHANGES IN AND DISAGREEMENTS WITH ACCOUNTANTS ON ACCOUNTING AND FINANCIAL DISCLOSURE |
None.
| ITEM 9A. | CONTROLS AND PROCEDURES |
Disclosure Controls and Procedures
Based upon their evaluation as of December 31, 2009, our Chief Executive Officer and Chief Financial Officer have concluded that our disclosure controls and procedures (as defined in Rules 13a-15(e) and 15d-15(e)) under the Securities Exchange Act of 1934, as amended) are effective for timely ensuring that information required to be disclosed in reports we are required to submit under the Securities Exchange Act of 1934, as amended, is recorded, processed, summarized and reported within the time periods specified in the Securities and Exchange Commission’s rules and forms.
Management’s Annual Report on Internal Control over Financial Reporting and Attestation Report of Independent Registered Public Accounting Firm
The information required to be furnished pursuant to this item is set forth under the captions “Report on Management’s Assessment of Internal Control over Financial Reporting” and “Report of Independent Registered Public Accounting Firm” in the Company’s Consolidated Financial Statements in Item 8, Financial Statements and Supplementary Data.
Changes in Internal Control over Financial Reporting
There were no changes to internal control over financial reporting during the fourth quarter of 2009 that have materially affected, or are reasonably likely to materially affect, our internal control over financial reporting.
| ITEM 9B. | OTHER INFORMATION |
None.
87
Table of Contents
Index to Financial Statements
| ITEM 10. | DIRECTORS, EXECUTIVE OFFICERS AND CORPORATE GOVERNANCE |
Executive Officers of the Company
The information appearing under the headings “Executive Officers,” “Executive Compensation” and “Stock Ownership” in the Company’s Definitive Proxy Statement for its 2010 Annual Meeting of Shareholders is incorporated herein by reference.
Code of Ethics
The Company has adopted a code of business conduct and ethics in compliance with Item 406 of Regulation S-K for the Company’s principal executive officer, principal financial officer, principal accounting officer and controller. The Company’s Code of Ethics is available on its website at www.renasant.com on the Investors Relations webpage under the caption, “Corporate Overview.” Any person may request a free copy of the Code of Ethics from the Company by sending a request to the following address: Renasant Corporation, 209 Troy Street, Tupelo, Mississippi, 38804-4827, Attention: Director of Investor Relations. The Company intends to satisfy the disclosure requirement under Item 5.05 of Form 8-K regarding an amendment to, or waiver from, a provision of the Company’s Code of Ethics by posting such information on its website, at the address specified above.
Directors of the Company, Shareholder Recommendations of Director Candidates, Audit Committee Members and Section 16(a) Beneficial Ownership Reporting Compliance
The information appearing under the heading “Board of Directors” and “Stock Ownership” in the Company’s Definitive Proxy Statement for its 2010 Annual Meeting of Shareholders is incorporated herein by reference.
| ITEM 11. | EXECUTIVE COMPENSATION |
The information appearing under the heading “Board of Directors,” “Executive Compensation,” “Compensation Committee Report,” “Compensation Committee Interlocks and Insider Participation” and “Compensation Tables” in the Company’s Definitive Proxy Statement for its 2010 Annual Meeting of Shareholders is incorporated herein by reference.
| ITEM 12. | SECURITY OWNERSHIP OF CERTAIN BENEFICIAL OWNERS AND MANAGEMENT AND RELATED STOCKHOLDER MATTERS |
The information appearing under the heading “Stock Ownership” in the Company’s Definitive Proxy Statement for its 2010 Annual Meeting of Shareholders is incorporated herein by reference.
88
Table of Contents
Index to Financial Statements
Equity Compensation Plan Information
The following table includes certain information about the Company’s equity compensation plans as of December 31, 2009:
Equity Compensation Plan Information
| Plan category |
(a) Number of securities to be issued upon exercise of outstanding options, warrants and rights |
(b) Weighted-average exercise price of outstanding options, warrants and rights |
(c) Number of securities remaining available for future issuance under equity compensation plans (excluding securities reflected in column (a)) | |||||
| Equity compensation plans approved by security holders(1) |
1,022,500 | $ | 20.97 | 432,441 | ||||
| Equity compensation plans not approved by security holders(2) |
312,962 | 10.56 | (3) | 35,813 | ||||
| Total |
1,335,462 | $ | 19.40 | 468,254 | ||||
| (1) | The shareholder approved plan is the 2001 Long-Term Incentive Plan, which provides for the grant of stock options and restricted stock awards. A total of 1,537,500 shares of common stock have been authorized for issuance under the plan. As of December 31, 2009, 20,000 shares of unvested restricted stock and options to acquire 1,002,500 shares were outstanding. |
| (2) | As of December 31, 2009, there were four equity compensation plans that were not approved by our shareholders: |
| • | In connection with its merger with Renasant Bancshares, Inc., the Company assumed the Renasant Bancshares, Inc. Stock Option Plan, under which options to purchase an aggregate of 1,676 shares of the Company’s common stock remain outstanding as of December 31, 2009; no additional options or other forms of equity incentives will be granted or awarded under the plan. |
| • | In connection with its merger with Heritage, the Company assumed the Heritage Financial Holding Corporation Incentive Stock Compensation Plan, under which options to purchase an aggregate of 18,000 shares of the Company’s common stock remained outstanding as of December 31, 2009; no additional options or other forms of equity incentives will be granted or awarded under the plan. |
| • | In connection with its merger with Capital, the Company assumed the Capital 2001 Stock Option Plan, under which options to purchase an aggregate of 161,599 shares of the Company’s common stock remained outstanding as of December 31, 2009; no additional options or other forms of equity incentives will be granted or awarded under the plan. |
| • | One of the Company’s deferred compensation plans provides that deferred amounts are invested in units representing shares of our common stock. At the end of each participant’s deferral period, the units are distributed in the form of common stock. Units are allocated to each participant’s account based on quarterly average market price. An aggregate of 167,500 shares of common stock is authorized for issuance under the plan. Units representing an aggregate of 131,687 shares of our common stock have been credited to participant accounts. |
| (3) | The weighted average exercise price does not take into account awards under the Company’s deferred compensation plans. |
89
Table of Contents
Index to Financial Statements
| ITEM 13. | CERTAIN RELATIONSHIPS AND RELATED TRANSACTIONS AND DIRECTOR INDEPENDENCE |
The information appearing under the heading “Board of Directors” in the Company’s Definitive Proxy Statement for its 2010 Annual Meeting of Shareholders is incorporated herein by reference.
| ITEM 14. | PRINCIPAL ACCOUNTING FEES AND SERVICES |
The information appearing under the heading “Independent Registered Public Accountants” in the Company’s Definitive Proxy Statement for its 2010 Annual Meeting of Shareholders is incorporated herein by reference.
| ITEM 15. | EXHIBITS, FINANCIAL STATEMENT SCHEDULES |
(a) - (1) Financial Statements
The following consolidated financial statements and supplementary information for the fiscal years ended December 31, 2009, 2008 and 2007 are included in Part II, Item 8 herein:
| (i) | Report on Management’s Assessment of Internal Control over Financial Reporting |
| (ii) | Report of Independent Registered Public Accounting Firm |
| (iii) | Consolidated Balance Sheets – December 31, 2009 and 2008 |
| (iv) | Consolidated Statements of Income – Years ended December 31, 2009, 2008 and 2007 |
| (v) | Consolidated Statements of Changes in Shareholders’ Equity – Years ended December 31, 2009, 2008 and 2007 |
| (vi) | Consolidated Statements of Cash Flows – Years ended December 31, 2009, 2008 and 2007 |
| (vii) | Notes to Consolidated Financial Statements – December 31, 2009 |
(a) - (2) Financial Statement Schedules
All schedules have been omitted because they are either not applicable or the required information has been included in the consolidated financial statements or notes thereto.
(a) - (3) Exhibits required by Item 601 of Regulation S-K
| (2)(i) | Agreement and Plan of Merger dated as of February 5, 2007 by and among Renasant Corporation, Renasant Bank, Capital Bancorp, Inc. and Capital Bank & Trust Company, as amended by Amendment Number One to Agreement and Plan of Merger dated March 2, 2007. Pursuant to Item 601(b)(2) of Regulation S-K, the disclosure schedules to this agreement have been omitted from this filing. The Registrant agrees to furnish the SEC a copy of such schedules upon request.(1) |
| (3)(i) | Articles of Incorporation of the Company, as amended(2) |
| (3)(ii) | Bylaws of the Company, as amended(3) |
| (4)(i) | Articles of Incorporation of the Company, as amended(2) |
| (4)(ii) | Bylaws of the Company, as amended(3) |
| (10)(i) | The Peoples Holding Company 2001 Long-Term Incentive Plan, as amended*(4) |
| (10)(ii) | Renasant Corporation Deferred Stock Unit Plan, as amended*(5) |
| (10)(iii) | The Peoples Holding Company Plan of Assumption of Renasant Bancshares, Inc. Stock Option Plan*(6) |
| (10)(iv) | Employment Agreement dated as of July 14, 2004 by and between Larry R. Mathews, The Peoples Holding Company and The Peoples Bank & Trust Company*(7) |
| (10)(v) | Termination and Release Agreement dated as of January 1, 2005 by and among Larry R. Mathews, Heritage Financial Holding Corporation and Heritage Bank*(8) |
| (10)(vi) | The Peoples Holding Company Plan of Assumption of Heritage Financial Holding Corporation Incentive Stock Compensation Plan*(9) |
| (10)(vii) | Description of Performance Based Rewards Bonus Plan*(10) |
90
Table of Contents
Index to Financial Statements
| (10)(viii) | Employment Agreement dated as of July 1, 2004 by and between Francis J. Cianciola and The Peoples Holding Company*(11) |
| (10)(ix) | Renasant Bank Executive Deferred Income Plan, as amended*(12) |
| (10)(x) | Renasant Bank Directors’ Deferred Fee Plan, as amended*(13) |
| (10)(xi) | Employment Agreement dated as of June 29, 2007 by and between R. Rick Hart and Renasant Corporation.*(14) |
| (10)(xii) | Termination and Release Agreement dated as of June 29, 2007 by and among R. Rick Hart, Capital Bancorp, Inc., Capital Bank & Trust Company and Renasant Corporation.*(15) |
| (10)(xiii) | Employment Agreement dated as of June 29, 2007 by and between John W. Gregory, Jr. and Renasant Bank.*(16) |
| (10)(xviii) | Termination and Release Agreement dated as of June 29, 2007 by and among John W. Gregory, Jr., Capital Bancorp, Inc., Capital Bank & Trust Company and Renasant Corporation.*(17) |
| (10)(xiv) | Second Amendment to the Capital Bank & Trust Company Supplemental Executive Retirement Plan Agreement dated August 20, 2003 for R. Rick Hart, executed June 29, 2007.*(18) |
| (10)(xv) | Second Amendment to the Capital Bank & Trust Company Supplemental Executive Retirement Plan Agreement dated July 10, 2006 for R. Rick Hart, executed June 29, 2007.*(19) |
| (10)(xvi) | Second Amendment to the Capital Bank & Trust Company Supplemental Executive Retirement Plan Agreement dated August 20, 2003 for John W. Gregory, Jr., executed June 29, 2007.*(20) |
| (10)(xvii) | Second Amendment to the Capital Bank & Trust Company Supplemental Executive Retirement Plan Agreement dated July 10, 2006 for John W. Gregory, Jr., executed June 29, 2007.*(21) |
| (10)(xviii) | Supplemental Agreement to the Capital Bancorp, Inc. 2001 Stock Option Plan for R. Rick Hart, executed June 29, 2007.*(22) |
| (10)(xxix) | Supplemental Agreement to the Capital Bancorp, Inc. 2001 Stock Option Plan for John W. Gregory, Jr., executed June 29, 2007.*(23) |
| (10)(xx) | Renasant Corporation Plan of Assumption of Capital Bancorp, Inc. 2001 Stock Option Plan*(24) |
| (10)(xxi) | Renasant Corporation Plan of Assumption of Capital Bancorp, Inc. Director Deferred Stock Compensation Plan*(25) |
| (10)(xxii) | Executive Employment Agreement dated January 2, 2008 by and between E. Robinson McGraw and Renasant Corporation*(26) |
| (10)(xxiii) | Separation Agreement dated February 11, 2009 between the Company and Larry R. Mathews*(27) |
| (10)(xxiv) | Renasant Corporation Severance Pay Plan*(28) |
| (10)(xxv) | Change in Control Agreement dated as of January 1, 2009 between Renasant Corporation and Stuart R. Johnson*(29) |
| (10)(xxvi) | Change in Control Agreement dated as of January 1, 2009 between Renasant Corporation and C. Mitchell Waycaster*(30) |
| (10)(xxvii) | Change in Control Agreement dated as of January 1, 2009 between Renasant Corporation and Michael D. Ross*(31) |
| (21) | Subsidiaries of the Registrant |
| (23) | Consent of Consent of Independent Registered Public Accounting Firm |
| (31)(i) | Certification of the Chief Executive Officer, as required pursuant to Section 302 of the Sarbanes-Oxley Act of 2002. |
| (31)(ii) | Certification of the Chief Financial Officer, as required pursuant to Section 302 of the Sarbanes-Oxley Act of 2002. |
| (32)(i) | Certification of the Chief Executive Officer, as required pursuant to Section 906 of the Sarbanes-Oxley Act of 2002. |
91
Table of Contents
Index to Financial Statements
| (32)(ii) | Certification of the Chief Financial Officer, as required pursuant to Section 906 of the Sarbanes-Oxley Act of 2002. |
| * | Management contract or compensatory plan or arrangement required to be filed as an exhibit to this Form 10-K pursuant to Item 15(b) of Form 10-K. |
| (1) | Filed as exhibit 2.1 to the Form 8-K of the Company filed with the Securities and Exchange Commission on February 5, 2007 and, as to Amendment Number One, filed as exhibit 2.1 to the Form 8-K of the Company filed with the Securities and Exchange Commission on March 6, 2007, each of which is incorporated herein by reference. |
| (2) | Filed as exhibit 3.1 to the Form 10-Q of the Company filed with the Securities and Exchange Commission on May 9, 2005 and incorporated herein by reference. |
| (3) | Filed as exhibit 3.2 to the Form 8-K of the Company filed with the Securities and Exchange Commission on October 21, 2008 and incorporated herein by reference. |
| (4) | Filed as exhibits 4.1 and 4.2 to the Form S-8 Registration Statement of the Company (File No. 333-102152) filed with the Securities and Exchange Commission on December 23, 2002 and, as to Amendment No. 1 to the plan, as Appendix B to the Company’s Definitive Proxy Statement filed with the Securities and Exchange Commission on March 14, 2005, and, as to Amendment No. 2 to the plan, as Exhibit 99.1 to the Form 8-K of the Company filed with the Securities and Exchange Commission on July 19, 2006, each of which is incorporated herein by reference. |
| (5) | Filed as exhibits 4.3 and 4.4 to the Form S-8 Registration Statement of the Company (File No. 333-102152) filed with the Securities and Exchange Commission on December 23, 2002, and, as to the amendment and restatement of the plan, as exhibit 99.2 to the Form 8-K of the Company filed with the Securities and Exchange Commission on July 19, 2006, and, as to the amendments to the amended and restated plan, as exhibit 99.1 to the Form S-8 Registration Statement of the Company (File No. 333-141185) filed with the Securities and Exchange Commission on June 29, 2007, and as exhibit 10.2 to the Form 8-K of the Company filed with the Securities and Exchange Commission on February 17, 2009, each of which is incorporated herein by reference. |
| (6) | Filed as exhibit 99 to the Form S-8 Registration Statement of the Company (File No. 333-117987) filed with the Securities and Exchange Commission on August 6, 2004 and incorporated herein by reference. |
| (7) | Filed as exhibit 10.11 to the Form 8-K of the Company filed with the Securities and Exchange Commission on January 6, 2005 and incorporated herein by reference. |
| (8) | Filed as exhibit 10.12 to the Form 8-K of the Company filed with the Securities and Exchange Commission on January 6, 2005 and incorporated herein by reference. |
| (9) | Filed as exhibit 10.13 to the Form 8-K of the Company filed with the Securities and Exchange Commission on January 24, 2005 and incorporated herein by reference. |
| (10) | Filed under Item 1.01 of the Form 8-K of the Company filed with the Securities and Exchange Commission on February 3, 2005 and incorporated herein by reference. |
| (11) | Filed as exhibit 10.16 to the Form 10-K of the Company filed with the Securities and Exchange Commission on March 14, 2005 and incorporated herein by reference. |
| (12) | Filed as exhibit 99.1 to the Form 8-K of the Company filed with the Securities and Exchange Commission on January 5, 2007, and, as to the amendment of the plan, as exhibit 10.3 to the Form 8-K of the Company filed with the Securities and Exchange Commission on February 17, 2009, each of which is incorporated herein by reference. |
| (13) | Filed as exhibit 99.2 to the Form 8-K of the Company filed with the Securities and Exchange Commission on January 5, 2007, and, as to the amendment of the plan, as exhibit 10.4 to the Form 8-K of the Company filed with the Securities and Exchange Commission on February 17, 2009, each of which is incorporated herein by reference. |
| (14) | Filed as exhibit 10.1 to the Form 8-K of the Company filed with the Securities and Exchange Commission on July 6, 2007 and incorporated herein by reference. |
| (15) | Filed as exhibit 10.2 to the Form 8-K of the Company filed with the Securities and Exchange Commission on July 6, 2007 and incorporated herein by reference. |
| (16) | Filed as exhibit 10.3 to the Form 8-K of the Company filed with the Securities and Exchange Commission on July 6, 2007 and incorporated herein by reference. |
| (17) | Filed as exhibit 10.4 to the Form 8-K of the Company filed with the Securities and Exchange Commission on July 6, 2007 and incorporated herein by reference. |
92
Table of Contents
Index to Financial Statements
| (18) | Filed as exhibit 10.5 to the Form 8-K of the Company filed with the Securities and Exchange Commission on July 6, 2007 and incorporated herein by reference. |
| (19) | Filed as exhibit 10.6 to the Form 8-K of the Company filed with the Securities and Exchange Commission on July 6, 2007 and incorporated herein by reference. |
| (20) | Filed as exhibit 10.7 to the Form 8-K of the Company filed with the Securities and Exchange Commission on July 6, 2007 and incorporated herein by reference. |
| (21) | Filed as exhibit 10.8 to the Form 8-K of the Company filed with the Securities and Exchange Commission on July 6, 2007 and incorporated herein by reference. |
| (22) | Filed as exhibit 10.9 to the Form 8-K of the Company filed with the Securities and Exchange Commission on July 6, 2007 and incorporated herein by reference. |
| (23) | Filed as exhibit 10.10 to the Form 8-K of the Company filed with the Securities and Exchange Commission on July 6, 2007 and incorporated herein by reference. |
| (24) | Filed as exhibit 99.1 to the Form S-8 Registration Statement of the Company (File No. 333-144694) filed with the Securities and Exchange Commission on July 19, 2007 and incorporated herein by reference. |
| (25) | Filed as exhibit 99.2 to the Form S-8 Registration Statement of the Company (File No. 333-144694) filed with the Securities and Exchange Commission on July 19, 2007 and incorporated herein by reference. |
| (26) | Filed as exhibit 10.1 to the Form 8-K of the Company filed with the Securities and Exchange Commission on March 7, 2008 and incorporated herein by reference. |
| (27) | Filed as exhibit 10.1 to the Form 8-K of the Company filed with the Securities and Exchange Commission on February 17, 2009 and incorporated herein by reference. |
| (28) | Filed as exhibit 10.5 to the Form 8-K of the Company filed with the Securities and Exchange Commission on February 17, 2009 and incorporated herein by reference. |
| (29) | Filed as exhibit 10.6 to the Form 8-K of the Company filed with the Securities and Exchange Commission on February 17, 2009 and incorporated herein by reference. |
| (30) | Filed as exhibit 10.7 to the Form 8-K of the Company filed with the Securities and Exchange Commission on February 17, 2009 and incorporated herein by reference. |
| (31) | Filed as exhibit 10.1 to the Form 8-K of the Company filed with the Securities and Exchange Commission on March 4, 2010 and incorporated herein by reference. |
The Company does not have any long-term debt instruments under which securities are authorized exceeding ten percent of the total assets of the Company and its subsidiaries on a consolidated basis. The Company will furnish to the Securities and Exchange Commission, upon their request, a copy of all long-term debt instruments.
93
Table of Contents
Index to Financial Statements
SIGNATURES
Pursuant to the requirements of Section 13 or 15(d) of the Securities Exchange Act of 1934, the registrant has duly caused this report to be signed on its behalf by the undersigned, thereunto duly authorized.
| RENASANT CORPORATION | ||||
| Date: March 3, 2010 |
by: |
/s/ E. Robinson McGraw | ||
| E. Robinson McGraw | ||||
| Chairman, President and Chief Executive Officer | ||||
Pursuant to the requirements of the Securities Exchange Act of 1934, this report has been signed by the following persons in the capacities and on the date indicated.
| Date: March 3, 2010 |
by: |
/s/ William M. Beasley | ||
| William M. Beasley | ||||
| Director | ||||
| Date: March 3, 2010 |
by: |
/s/ George H. Booth, II | ||
| George H. Booth, II | ||||
| Director | ||||
| Date: March 3 2010 |
by: |
/s/ Frank B. Brooks | ||
| Frank B. Brooks | ||||
| Director | ||||
| Date: March 3, 2010 |
by: |
/s/ John M. Creekmore | ||
| John M. Creekmore | ||||
| Director | ||||
| Date: March 3, 2010 |
by: |
/s/ Albert J. Dale, III | ||
| Albert J. Dale, III | ||||
| Director | ||||
| Date: March 3, 2010 |
by: |
/s/ Marshall H. Dickerson | ||
| Marshall H. Dickerson | ||||
| Director | ||||
| Date: March 3, 2010 |
by: |
/s/ John T. Foy | ||
| John T. Foy | ||||
| Director | ||||
| Date: March 3, 2010 |
by: |
/s/ T. Michael Glenn | ||
| T. Michael Glenn | ||||
| Director | ||||
| Date: March 3, 2010 |
by: |
/s/ R. Rick Hart | ||
| R. Rick Hart | ||||
| Executive Vice President and Director | ||||
| Date: March 3, 2010 |
by: |
/s/ Richard L. Heyer, Jr. | ||
| Richard L. Heyer, Jr. | ||||
| Director | ||||
S – 1
Table of Contents
Index to Financial Statements
| Date: March 3, 2010 |
by: |
/s/ Neal A. Holland, Jr. | ||
| Neal A. Holland, Jr. | ||||
| Director | ||||
| Date: March 3, 2010 |
by: |
/s/ Jack C. Johnson | ||
| Jack C. Johnson | ||||
| Director | ||||
| Date: March 3, 2010 |
by: |
/s/ Stuart R. Johnson | ||
| Stuart R. Johnson | ||||
| Executive Vice President and Chief Financial Officer | ||||
| (Principal Financial and Accounting Officer) | ||||
| Date: March 3, 2010 |
by: |
/s/ E. Robinson McGraw | ||
| E. Robinson McGraw | ||||
| Chairman of the Board, Director, President and Chief Executive Officer | ||||
| (Principal Executive Officer) | ||||
| Date: March 3, 2010 |
by: |
/s/ J. Niles McNeel | ||
| J. Niles McNeel | ||||
| Director | ||||
| Date: March 3, 2010 |
by: |
/s/ Theodore S. Moll | ||
| Theodore S. Moll | ||||
| Director | ||||
| Date: March 3, 2010 |
by: |
/s/ Michael D. Shmerling | ||
| Michael D. Shmerling | ||||
| Director | ||||
| Date: March 3, 2010 |
by: |
/s/ H. Joe Trulove | ||
| H. Joe Trulove | ||||
| Director | ||||
| Date: March 3, 2010 |
by: |
/s/ J. Larry Young | ||
| J. Larry Young | ||||
| Vice Chairman of the Board and Director | ||||
S – 2
Table of Contents
Index to Financial Statements
EXHIBIT INDEX
| Exhibit |
Description | |
| (21) | Subsidiaries of the Registrant | |
| (23) | Consent of Independent Registered Public Accounting Firm | |
| (31)(i) | Certification of the Chief Executive Officer, as required pursuant to Section 302 of the Sarbanes-Oxley Act of 2002. | |
| (31)(ii) | Certification of the Chief Financial Officer, as required pursuant to Section 302 of the Sarbanes-Oxley Act of 2002. | |
| (32)(i) | Certification of the Chief Executive Officer, as required pursuant to Section 906 of the Sarbanes-Oxley Act of 2002. | |
| (32)(ii) | Certification of the Chief Financial Officer, as required pursuant to Section 906 of the Sarbanes-Oxley Act of 2002. | |