Attached files
| file | filename |
|---|---|
| 8-K - 8-K - Daseke, Inc. | tmb-20200507x8k.htm |
Exhibit 99.1
| Q1 2020 Earnings Presentation May 7, 2020 |

| Important Disclaimers 2 Forward-Looking Statements This presentation contains “forward-looking statements” within the meaning of the Private Securities Litigation Reform Act of 1995. All statements, other than statements of historical fact, are forward-looking statements. Forward-looking statements may be identified by the use of words such as “may,” “will,” “continue,” “forecast,” “intend,” “seek,” “target,” “anticipate,” “believe,” “expect,” “estimate,” “plan,” “outlook,” “should,” “could,” “would,” “predict,” “potential,” and “project,” the negative of these terms, or other comparable terminology and similar expressions. Forward-looking statements may include projected financial information and results as well as statements about Daseke’s goals, including its restructuring plans; Daseke’s financial strategy, liquidity and capital required for its business strategy and plans; and general economic conditions. The forward-looking statements contained herein are based on information available as of the date of this news release and current expectations, forecasts and assumptions. While management believes that these forward-looking statements are reasonable as and when made, there can be no assurance that future developments affecting us will be those that Daseke anticipates, and readers are cautioned not to place undue reliance on the forward-looking statements. A number of factors, many of which are beyond our control, could cause actual results or outcomes to differ materially from those indicated by the forward-looking statements contained herein. These factors include, but are not limited to, general economic and business risks, such as downturns in customers’ business cycles and disruptions in capital and credit markets (including as a result of the recent coronavirus outbreaks or other global and national heath epidemics or concerns); Daseke’s ability to adequately address downward pricing and other competitive pressures; driver shortages and increases in driver compensation or owner-operator contracted rates; Daseke’s ability to execute and realize all of the expected benefits of its integration, business improvement and comprehensive restructuring plans; loss of key personnel; Daseke’s ability to realize all of the intended benefits from recent or future acquisitions; Daseke’s ability to complete recent or future divestitures successfully; seasonality and the impact of weather and other catastrophic events; fluctuations in the price or availability of diesel fuel; increased prices for, or decreases in the availability of, new revenue equipment and decreases in the value of used revenue equipment; Daseke’s ability to generate sufficient cash to service all of its indebtedness and Daseke’s ability to finance its capital requirements; restrictions in Daseke’s existing and future debt agreements; increases in interest rates; changes in existing laws or regulations, including environmental and worker health safety laws and regulations and those relating to tax rates or taxes in general; the impact of governmental regulations and other governmental actions related to Daseke and its operations; insurance and claims expenses; and litigation and governmental proceedings. For additional information regarding known material factors that could cause our actual results to differ from those expressed in forward-looking statements, please see Daseke’s filings with the Securities and Exchange Commission (the “SEC”), available at www.sec.gov, including Daseke’s Annual Report on Form 10-K filed with the SEC on March 10, 2020 and subsequent quarterly reports on Form 10-Q, particularly the section titled “Risk Factors.” The effect of the COVID-19 pandemic may remain prevalent for a significant period of time and may continue to adversely affect the Company’s business, results of operations and financial condition even after the COVID-19 pandemic has subsided and “stay at home” mandates have been lifted. The extent to which the COVID-19 pandemic impacts the Company will depend on numerous evolving factors and future developments that we are not able to predict. There are no comparable recent events that provide guidance as to the effect the COVID-19 global pandemic may have, and, as a result, the ultimate impact of the pandemic is highly uncertain and subject to change. Additionally, the Company will regularly evaluate its capital structure and liquidity position. From time to time and as opportunities arise, the Company may access the debt capital markets and modify its debt arrangements to optimize its capital structure and liquidity position. Daseke does not undertake any obligation to update forward-looking statements to reflect events or circumstances after the date as of when they were made, whether as a result of new information, future events or otherwise, except as may be required under applicable securities laws. You should not place undue reliance on these forward-looking statements. Non-GAAP Financial Measures This presentation includes non-GAAP financial measures for the Company and its reporting segments. The Company believes its presentation of Non-GAAP financial measures is useful because it provides investors and industry analysts the same information that the Company uses internally for purposes of assessing its core operating performance. You can find the reconciliations of these measures to the nearest comparable GAAP measure in the Appendix of this presentation. Please note that non-GAAP measures are not a substitute for, or more meaningful than, net income (loss), cash flows from operating activities, operating income or any other measure prescribed by GAAP, and there are limitations to using non-GAAP measures. Certain items excluded from these non- GAAP measures are significant components in understanding and assessing a company’s financial performance, such as a company’s cost of capital, tax structure and the historic costs of depreciable assets. Also, other companies in Daseke’s industry may define these non‐GAAP measures differently than Daseke does, and as a result, it may be difficult to use these non‐GAAP measures to compare the performance of those companies to Daseke’s performance. Because of these limitations, these non-GAAP measures should not be considered a measure of the income generated by Daseke’s business or discretionary cash available to it to invest in the growth of its business. Daseke’s management compensates for these limitations by relying primarily on Daseke’s GAAP results and using these non-GAAP measures supplementally. Daseke defines Adjusted EBITDA as net income (loss) plus (i) depreciation and amortization, (ii) interest expense, and other fees and charges associated with financings, net of interest income, (iii) income taxes, (iv) acquisition-related transaction expenses (including due diligence costs, legal, accounting and other advisory fees and costs, retention and severance payments and financing fees and expenses), (v) business transformation costs, (vi) non-cash impairment, (vii) restructuring charges, and (viii) non-cash stock and equity-compensation expense. Daseke defines Adjusted EBITDA Margin as Adjusted EBITDA divided by revenue. Daseke defines Adjusted Net Income (Loss) as net income (loss) adjusted for acquisition related transaction expenses, business transformation costs, non-cash impairments, restructuring charges, amortization of intangible assets, the net impact of step-up in basis of acquired assets and unusual or non-regularly recurring expenses or recoveries. Daseke defines Adjusted Operating Ratio as (a) total operating expenses (i) less, acquisition-related transaction expenses, non-cash impairment, restructuring charges, unusual or non-regularly recurring expenses or recoveries, (ii) less, business transformation costs, and (iii) further adjusted for the net impact of the step-up in basis (such as increased depreciation and amortization expense) and amortization of identifiable intangible assets resulting from acquisitions, as a percentage of (b) total revenue. Daseke defines Operating Ratio as (a) total operating expenses as a percentage of (b) total revenue. Daseke defines Free Cash Flow as net cash provided by operating activities less purchases of property and equipment, plus proceeds from sale of property and equipment as such amounts are shown on the face of the Statements of Cash Flows. Daseke defines Net Debt as total debt less cash. See the Appendix for directly comparable GAAP measures. Industry and Market Data This presentation includes market data and other statistical information from third party sources, including independent industry publications, government publications and other published independent sources. Although Daseke believes these third-party sources are reliable as of their respective dates, Daseke has not independently verified the accuracy or completeness of this information. |
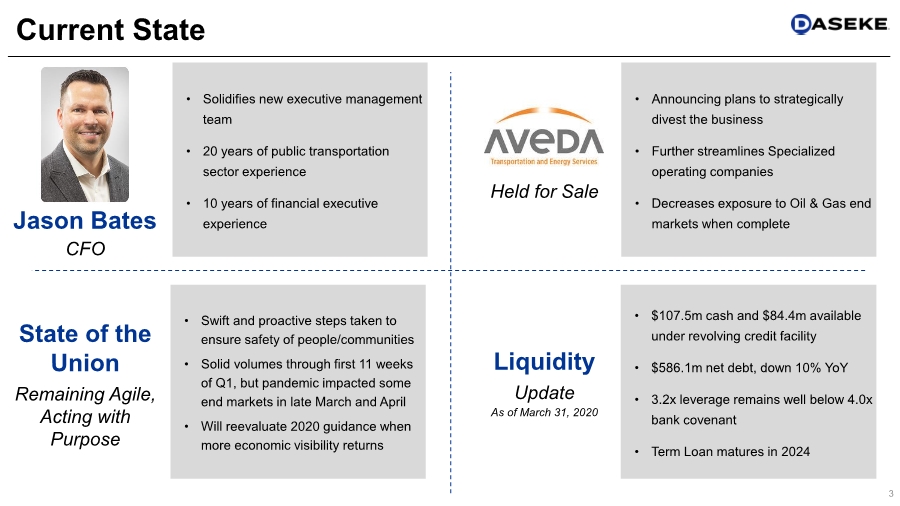
| 3 Current State Liquidity Update As of March 31, 2020 State of the Union Remaining Agile, Acting with Purpose • $107.5m cash and $84.4m available under revolving credit facility • $586.1m net debt, down 10% YoY • 3.2x leverage remains well below 4.0x bank covenant • Term Loan matures in 2024 • Solidifies new executive management team • 20 years of public transportation sector experience • 10 years of financial executive experience • Swift and proactive steps taken to ensure safety of people/communities • Solid volumes through first 11 weeks of Q1, but pandemic impacted some end markets in late March and April • Will reevaluate 2020 guidance when more economic visibility returns Held for Sale • Announcing plans to strategically divest the business • Further streamlines Specialized operating companies • Decreases exposure to Oil & Gas end markets when complete Jason Bates CFO |
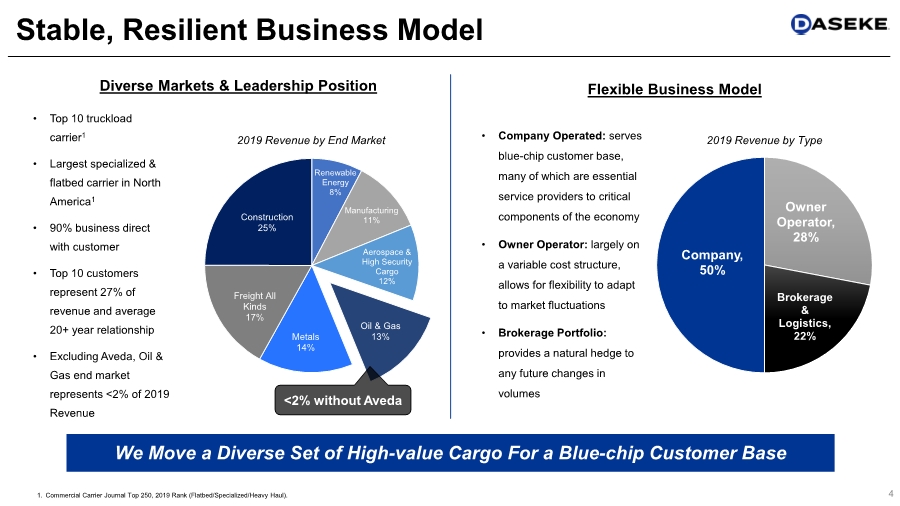
| Stable, Resilient Business Model 4 • Top 10 truckload carrier1 • Largest specialized & flatbed carrier in North America1 • 90% business direct with customer • Top 10 customers represent 27% of revenue and average 20+ year relationship • Excluding Aveda, Oil & Gas end market represents <2% of 2019 Revenue We Move a Diverse Set of High-value Cargo For a Blue-chip Customer Base Renewable Energy 8% Manufacturing 11% Aerospace & High Security Cargo 12% Oil & Gas 13% Metals 14% Freight All Kinds 17% Construction 25% Diverse Markets & Leadership Position 1. Commercial Carrier Journal Top 250, 2019 Rank (Flatbed/Specialized/Heavy Haul). Company, 50% Owner Operator, 28% Brokerage & Logistics, 22% Flexible Business Model • Company Operated: serves blue-chip customer base, many of which are essential service providers to critical components of the economy • Owner Operator: largely on a variable cost structure, allows for flexibility to adapt to market fluctuations • Brokerage Portfolio: provides a natural hedge to any future changes in volumes 2019 Revenue by Type 2019 Revenue by End Market <2% without Aveda |
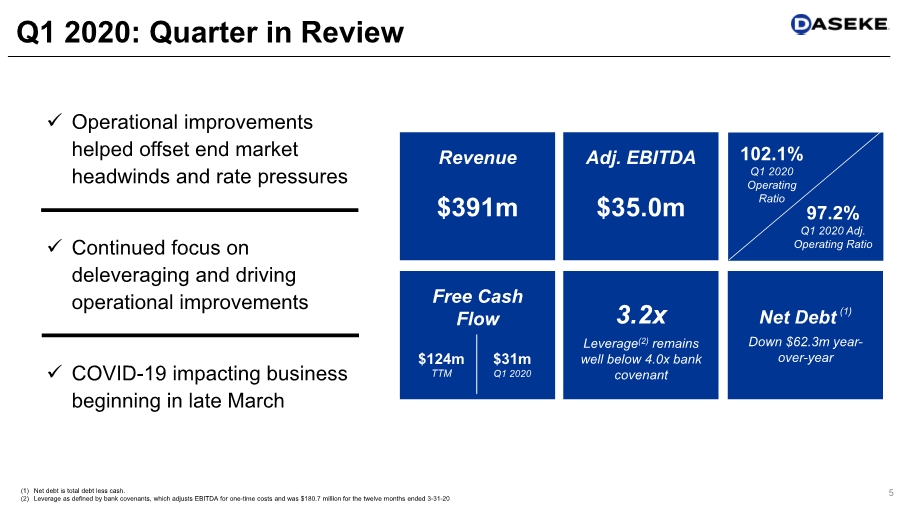
| ✓ Operational improvements helped offset end market headwinds and rate pressures ✓ Continued focus on deleveraging and driving operational improvements ✓ COVID-19 impacting business beginning in late March Free Cash Flow Net Debt (1) Down $62.3m year- over-year Q1 2020: Quarter in Review Revenue $391m 5 (1) Net debt is total debt less cash. (2) Leverage as defined by bank covenants, which adjusts EBITDA for one-time costs and was $180.7 million for the twelve months ended 3-31-20 97.2% Q1 2020 Adj. Operating Ratio 102.1% Q1 2020 Operating Ratio Adj. EBITDA $35.0m 3.2x Leverage(2) remains well below 4.0x bank covenant $124m TTM $31m Q1 2020 |
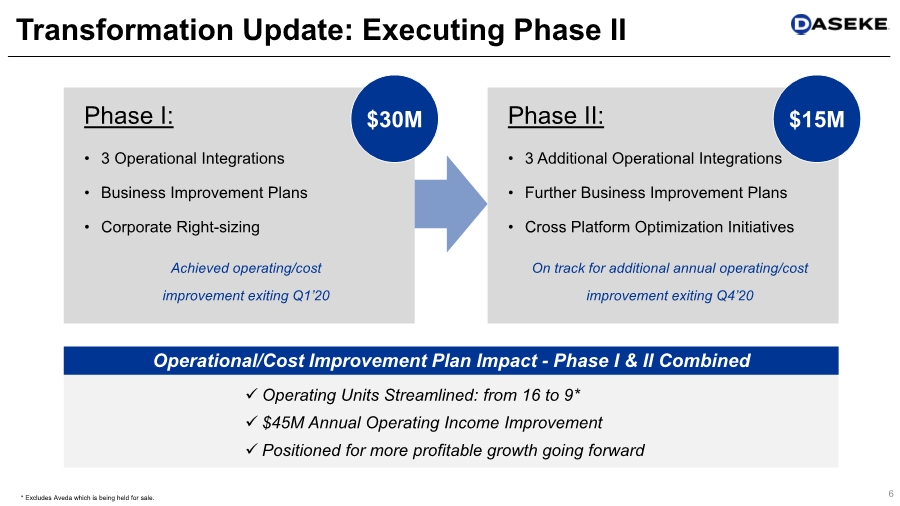
| 6 Transformation Update: Executing Phase II Phase I: • 3 Operational Integrations • Business Improvement Plans • Corporate Right-sizing Achieved operating/cost improvement exiting Q1’20 Phase II: • 3 Additional Operational Integrations • Further Business Improvement Plans • Cross Platform Optimization Initiatives On track for additional annual operating/cost improvement exiting Q4’20 Operational/Cost Improvement Plan Impact - Phase I & II Combined ✓ Operating Units Streamlined: from 16 to 9* ✓ $45M Annual Operating Income Improvement ✓ Positioned for more profitable growth going forward $30M $15M * Excludes Aveda which is being held for sale. |
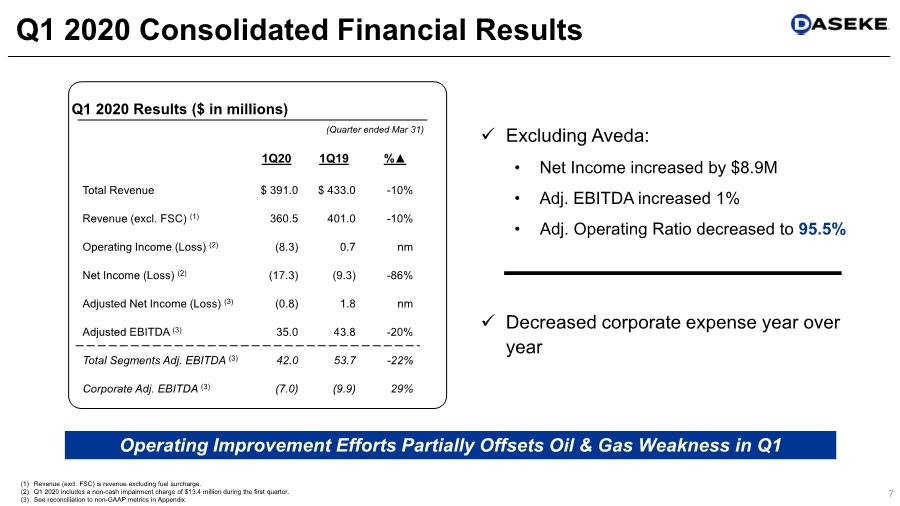
| 7 Q1 2020 Consolidated Financial Results (Quarter ended Mar 31) Q1 2020 Results ($ in millions) Operating Improvement Efforts Partially Offsets Oil & Gas Weakness in Q1 1Q20 1Q19 %▲ Total Revenue $ 391.0 $ 433.0 -10% Revenue (excl. FSC) (1) 360.5 401.0 -10% Operating Income (Loss) (2) (8.3) 0.7 nm Net Income (Loss) (2) (17.3) (9.3) -86% Adjusted Net Income (Loss) (3) (0.8) 1.8 nm Adjusted EBITDA (3) 35.0 43.8 -20% Total Segments Adj. EBITDA (3) 42.0 53.7 -22% Corporate Adj. EBITDA (3) (7.0) (9.9) 29% (1) Revenue (excl. FSC) is revenue excluding fuel surcharge. (2) Q1 2020 includes a non-cash impairment charge of $13.4 million during the first quarter. (3) See reconciliation to non-GAAP metrics in Appendix. ✓ Excluding Aveda: • Net Income increased by $8.9M • Adj. EBITDA increased 1% • Adj. Operating Ratio decreased to 95.5% ✓ Decreased corporate expense year over year |
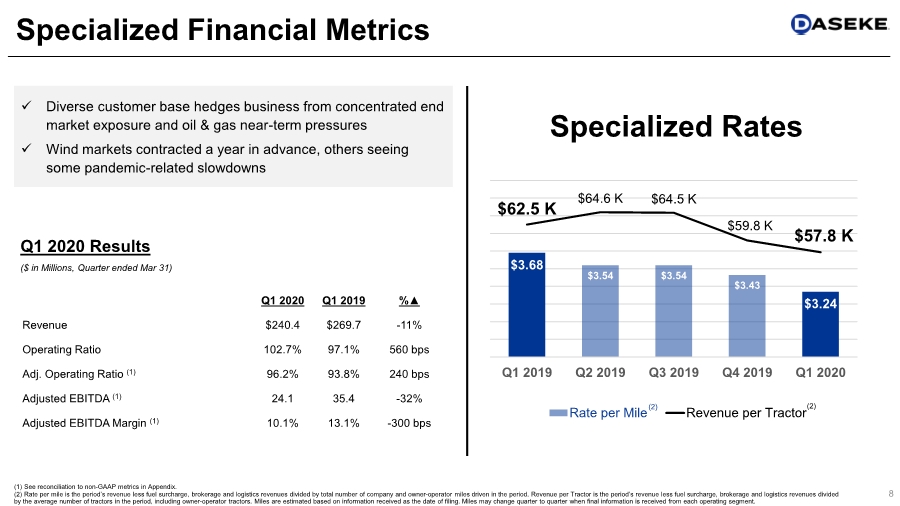
| $3.68 $3.54 $3.54 $3.43 $3.24 $62.5 K $64.6 K $64.5 K $59.8 K $57.8 K $40.00 $45.00 $50.00 $55.00 $60.00 $65.00 $70.00 $2.50 $2.70 $2.90 $3.10 $3.30 $3.50 $3.70 $3.90 $4.10 $4.30 $4.50 Q1 2019 Q2 2019 Q3 2019 Q4 2019 Q1 2020 Specialized Rates Rate per Mile Revenue per Tractor 8 Specialized Financial Metrics (1) See reconciliation to non-GAAP metrics in Appendix. (2) Rate per mile is the period’s revenue less fuel surcharge, brokerage and logistics revenues divided by total number of company and owner-operator miles driven in the period. Revenue per Tractor is the period’s revenue less fuel surcharge, brokerage and logistics revenues divided by the average number of tractors in the period, including owner-operator tractors. Miles are estimated based on information received as the date of filing. Miles may change quarter to quarter when final information is received from each operating segment. Q1 2020 Q1 2019 %▲ Revenue $240.4 $269.7 -11% Operating Ratio 102.7% 97.1% 560 bps Adj. Operating Ratio (1) 96.2% 93.8% 240 bps Adjusted EBITDA (1) 24.1 35.4 -32% Adjusted EBITDA Margin (1) 10.1% 13.1% -300 bps (2) (2) ($ in Millions, Quarter ended Mar 31) Q1 2020 Results ✓ Diverse customer base hedges business from concentrated end market exposure and oil & gas near-term pressures ✓ Wind markets contracted a year in advance, others seeing some pandemic-related slowdowns |
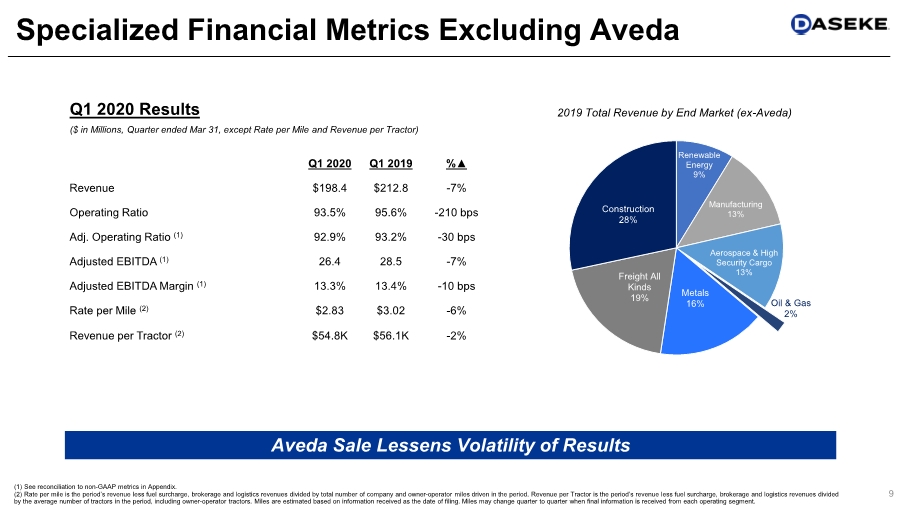
| 9 Specialized Financial Metrics Excluding Aveda (1) See reconciliation to non-GAAP metrics in Appendix. (2) Rate per mile is the period’s revenue less fuel surcharge, brokerage and logistics revenues divided by total number of company and owner-operator miles driven in the period. Revenue per Tractor is the period’s revenue less fuel surcharge, brokerage and logistics revenues divided by the average number of tractors in the period, including owner-operator tractors. Miles are estimated based on information received as the date of filing. Miles may change quarter to quarter when final information is received from each operating segment. Q1 2020 Q1 2019 %▲ Revenue $198.4 $212.8 -7% Operating Ratio 93.5% 95.6% -210 bps Adj. Operating Ratio (1) 92.9% 93.2% -30 bps Adjusted EBITDA (1) 26.4 28.5 -7% Adjusted EBITDA Margin (1) 13.3% 13.4% -10 bps Rate per Mile (2) $2.83 $3.02 -6% Revenue per Tractor (2) $54.8K $56.1K -2% ($ in Millions, Quarter ended Mar 31, except Rate per Mile and Revenue per Tractor) Q1 2020 Results 2019 Total Revenue by End Market (ex-Aveda) Aveda Sale Lessens Volatility of Results Renewable Energy 9% Manufacturing 13% Aerospace & High Security Cargo 13% Oil & Gas 2% Metals 16% Freight All Kinds 19% Construction 28% |
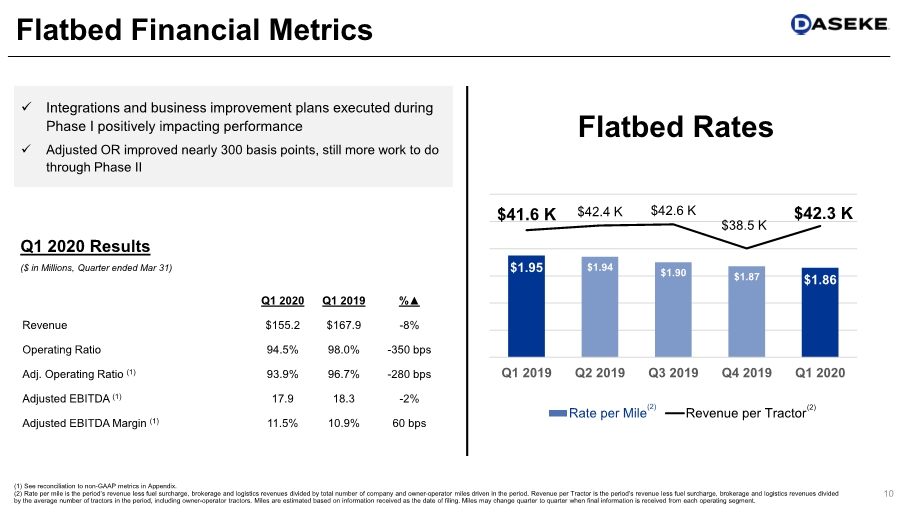
| 10 Flatbed Financial Metrics $1.95 $1.94 $1.90 $1.87 $1.86 $41.6 K $42.4 K $42.6 K $38.5 K $42.3 K $20.00 $25.00 $30.00 $35.00 $40.00 $45.00 $50.00 $1.20 $1.40 $1.60 $1.80 $2.00 $2.20 $2.40 Q1 2019 Q2 2019 Q3 2019 Q4 2019 Q1 2020 Flatbed Rates Rate per Mile Revenue per Tractor (2) (2) (1) See reconciliation to non-GAAP metrics in Appendix. (2) Rate per mile is the period’s revenue less fuel surcharge, brokerage and logistics revenues divided by total number of company and owner-operator miles driven in the period. Revenue per Tractor is the period’s revenue less fuel surcharge, brokerage and logistics revenues divided by the average number of tractors in the period, including owner-operator tractors. Miles are estimated based on information received as the date of filing. Miles may change quarter to quarter when final information is received from each operating segment. Q1 2020 Q1 2019 %▲ Revenue $155.2 $167.9 -8% Operating Ratio 94.5% 98.0% -350 bps Adj. Operating Ratio (1) 93.9% 96.7% -280 bps Adjusted EBITDA (1) 17.9 18.3 -2% Adjusted EBITDA Margin (1) 11.5% 10.9% 60 bps ($ in Millions, Quarter ended Mar 31) Q1 2020 Results ✓ Integrations and business improvement plans executed during Phase I positively impacting performance ✓ Adjusted OR improved nearly 300 basis points, still more work to do through Phase II |
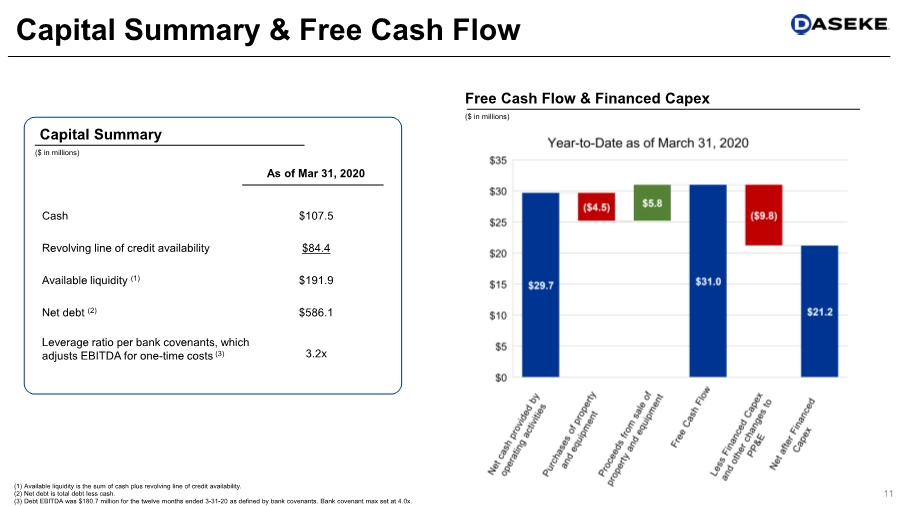
| Cash $107.5 Revolving line of credit availability $84.4 Available liquidity (1) $191.9 Net debt (2) $586.1 Leverage ratio per bank covenants, which adjusts EBITDA for one-time costs (3) 3.2x 11 Capital Summary & Free Cash Flow (1) Available liquidity is the sum of cash plus revolving line of credit availability. (2) Net debt is total debt less cash. (3) Debt EBITDA was $180.7 million for the twelve months ended 3-31-20 as defined by bank covenants. Bank covenant max set at 4.0x. ($ in millions) Capital Summary As of Mar 31, 2020 ($ in millions) Free Cash Flow & Financed Capex |
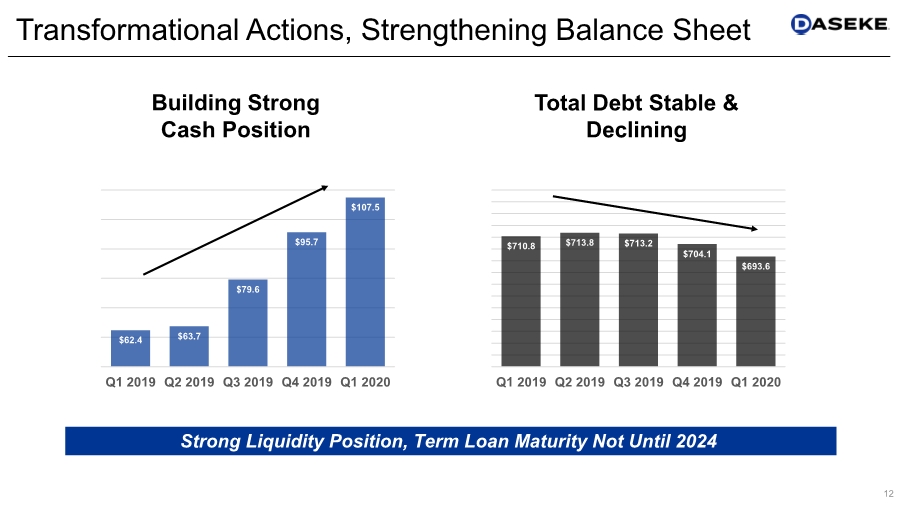
| Transformational Actions, Strengthening Balance Sheet 12 $62.4 $63.7 $79.6 $95.7 $107.5 $50.00 $60.00 $70.00 $80.00 $90.00 $100.00 $110.00 Q1 2019 Q2 2019 Q3 2019 Q4 2019 Q1 2020 Building Strong Cash Position $710.8 $713.8 $713.2 $704.1 $693.6 $600.00 $610.00 $620.00 $630.00 $640.00 $650.00 $660.00 $670.00 $680.00 $690.00 $700.00 $710.00 $720.00 $730.00 $740.00 $750.00 Q1 2019 Q2 2019 Q3 2019 Q4 2019 Q1 2020 Total Debt Stable & Declining Strong Liquidity Position, Term Loan Maturity Not Until 2024 |
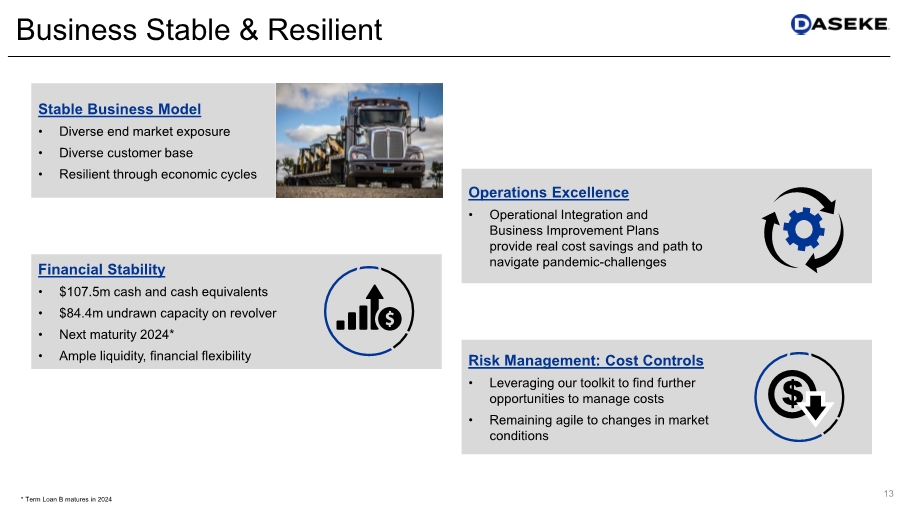
| Risk Management: Cost Controls • Leveraging our toolkit to find further opportunities to manage costs • Remaining agile to changes in market conditions Business Stable & Resilient 13 Stable Business Model • Diverse end market exposure • Diverse customer base • Resilient through economic cycles Financial Stability • $107.5m cash and cash equivalents • $84.4m undrawn capacity on revolver • Next maturity 2024* • Ample liquidity, financial flexibility * Term Loan B matures in 2024 Operations Excellence • Operational Integration and Business Improvement Plans provide real cost savings and path to navigate pandemic-challenges |
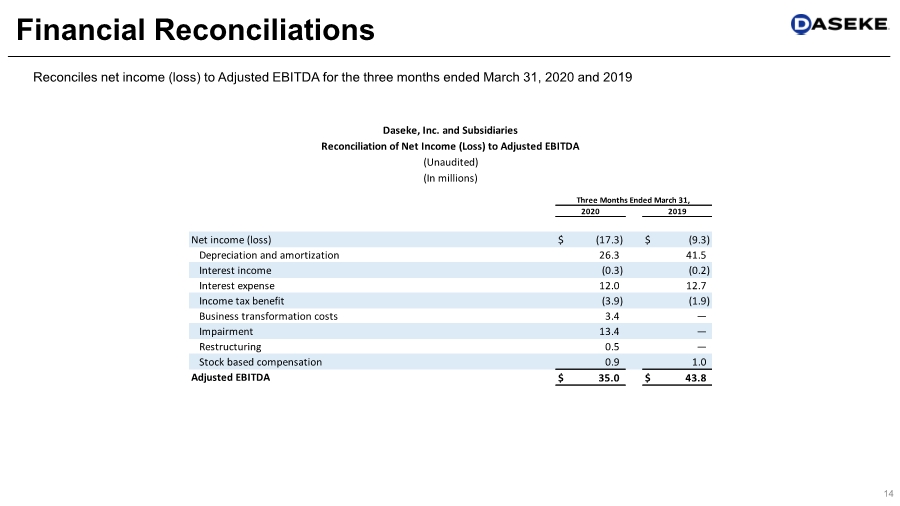
| 14 Financial Reconciliations Reconciles net income (loss) to Adjusted EBITDA for the three months ended March 31, 2020 and 2019 Net income (loss) $ (17.3) $ (9.3) Depreciation and amortization 26.3 41.5 Interest income (0.3) (0.2) Interest expense 12.0 12.7 Income tax benefit (3.9) (1.9) Business transformation costs 3.4 — Impairment 13.4 — Restructuring 0.5 — Stock based compensation 0.9 1.0 Adjusted EBITDA $ 35.0 $ 43.8 2020 2019 Daseke, Inc. and Subsidiaries Reconciliation of Net Income (Loss) to Adjusted EBITDA (Unaudited) (In millions) Three Months Ended March 31, |
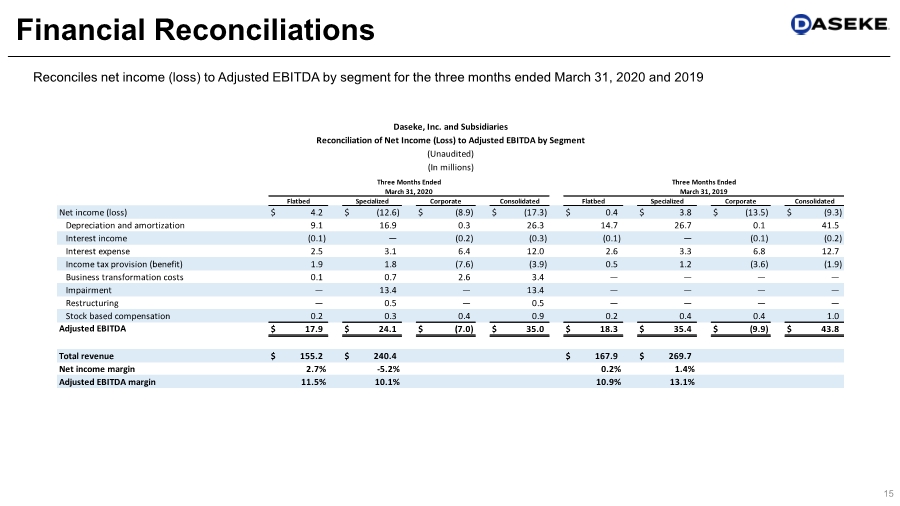
| 15 Financial Reconciliations Reconciles net income (loss) to Adjusted EBITDA by segment for the three months ended March 31, 2020 and 2019 Net income (loss) $ 4.2 $ (12.6) $ (8.9) $ (17.3) $ 0.4 $ 3.8 $ (13.5) $ (9.3) Depreciation and amortization 9.1 16.9 0.3 26.3 14.7 26.7 0.1 41.5 Interest income (0.1) — (0.2) (0.3) (0.1) — (0.1) (0.2) Interest expense 2.5 3.1 6.4 12.0 2.6 3.3 6.8 12.7 Income tax provision (benefit) 1.9 1.8 (7.6) (3.9) 0.5 1.2 (3.6) (1.9) Business transformation costs 0.1 0.7 2.6 3.4 — — — — Impairment — 13.4 — 13.4 — — — — Restructuring — 0.5 — 0.5 — — — — Stock based compensation 0.2 0.3 0.4 0.9 0.2 0.4 0.4 1.0 Adjusted EBITDA $ 17.9 $ 24.1 $ (7.0) $ 35.0 $ 18.3 $ 35.4 $ (9.9) $ 43.8 Total revenue $ 155.2 $ 240.4 $ 167.9 $ 269.7 Net income margin 2.7% -5.2% 0.2% 1.4% Adjusted EBITDA margin 11.5% 10.1% 10.9% 13.1% March 31, 2020 March 31, 2019 Flatbed Specialized Corporate Consolidated Flatbed Specialized Corporate Consolidated Daseke, Inc. and Subsidiaries Reconciliation of Net Income (Loss) to Adjusted EBITDA by Segment (Unaudited) (In millions) Three Months Ended Three Months Ended |
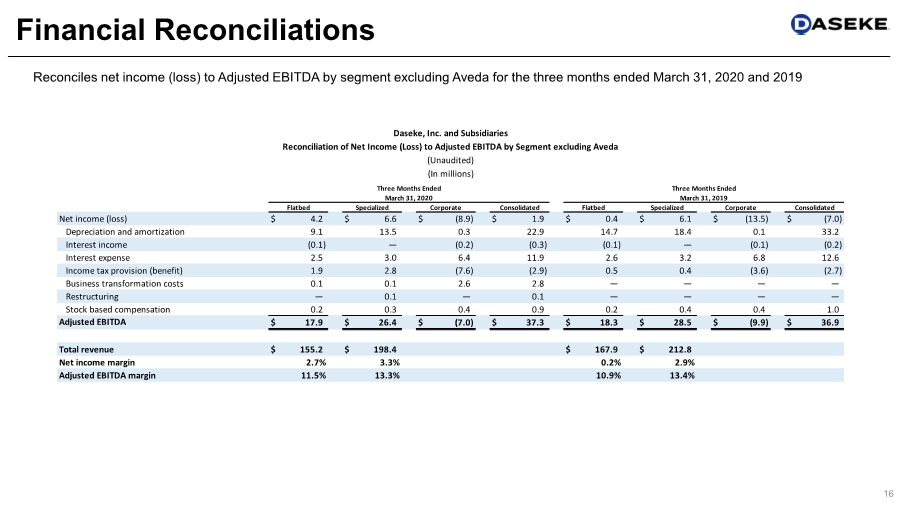
| 16 Financial Reconciliations Reconciles net income (loss) to Adjusted EBITDA by segment excluding Aveda for the three months ended March 31, 2020 and 2019 Net income (loss) $ 4.2 $ 6.6 $ (8.9) $ 1.9 $ 0.4 $ 6.1 $ (13.5) $ (7.0) Depreciation and amortization 9.1 13.5 0.3 22.9 14.7 18.4 0.1 33.2 Interest income (0.1) — (0.2) (0.3) (0.1) — (0.1) (0.2) Interest expense 2.5 3.0 6.4 11.9 2.6 3.2 6.8 12.6 Income tax provision (benefit) 1.9 2.8 (7.6) (2.9) 0.5 0.4 (3.6) (2.7) Business transformation costs 0.1 0.1 2.6 2.8 — — — — Restructuring — 0.1 — 0.1 — — — — Stock based compensation 0.2 0.3 0.4 0.9 0.2 0.4 0.4 1.0 Adjusted EBITDA $ 17.9 $ 26.4 $ (7.0) $ 37.3 $ 18.3 $ 28.5 $ (9.9) $ 36.9 Total revenue $ 155.2 $ 198.4 $ 167.9 $ 212.8 Net income margin 2.7% 3.3% 0.2% 2.9% Adjusted EBITDA margin 11.5% 13.3% 10.9% 13.4% March 31, 2020 March 31, 2019 Flatbed Specialized Corporate Consolidated Flatbed Specialized Corporate Consolidated Daseke, Inc. and Subsidiaries Reconciliation of Net Income (Loss) to Adjusted EBITDA by Segment excluding Aveda (Unaudited) (In millions) Three Months Ended Three Months Ended |
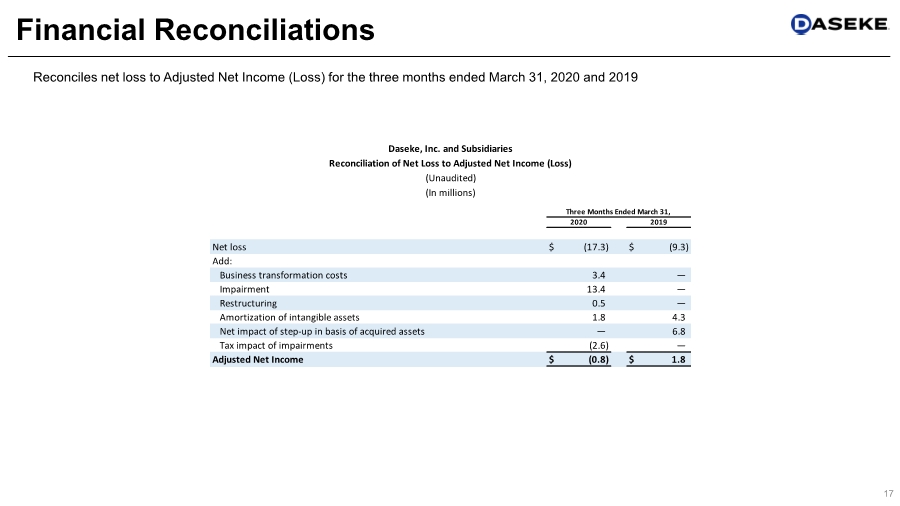
| 17 Financial Reconciliations Reconciles net loss to Adjusted Net Income (Loss) for the three months ended March 31, 2020 and 2019 Net loss $ (17.3) $ (9.3) Add: Business transformation costs 3.4 — Impairment 13.4 — Restructuring 0.5 — Amortization of intangible assets 1.8 4.3 Net impact of step-up in basis of acquired assets — 6.8 Tax impact of impairments (2.6) — Adjusted Net Income $ (0.8) $ 1.8 2020 2019 Daseke, Inc. and Subsidiaries Reconciliation of Net Loss to Adjusted Net Income (Loss) (Unaudited) (In millions) Three Months Ended March 31, |
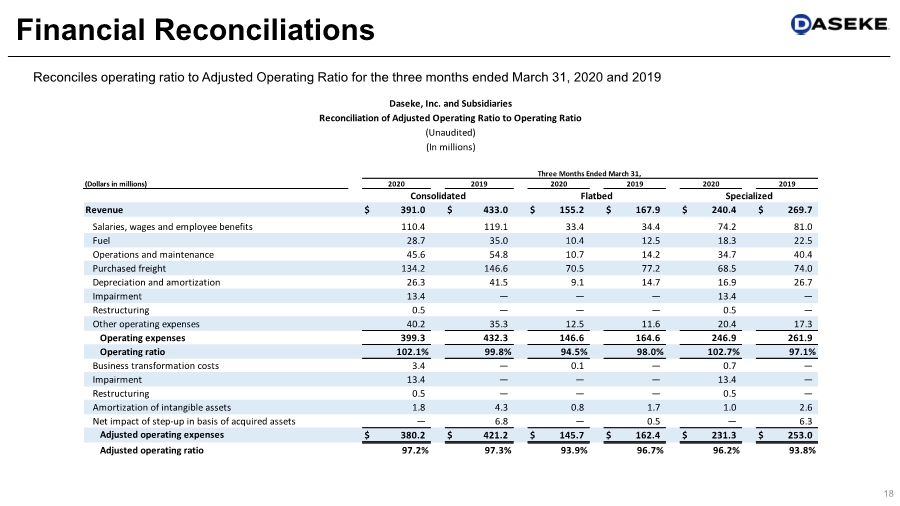
| 18 Financial Reconciliations Reconciles operating ratio to Adjusted Operating Ratio for the three months ended March 31, 2020 and 2019 (Dollars in millions) Revenue $ 391.0 $ 433.0 $ 155.2 $ 167.9 $ 240.4 $ 269.7 Salaries, wages and employee benefits 110.4 119.1 33.4 34.4 74.2 81.0 Fuel 28.7 35.0 10.4 12.5 18.3 22.5 Operations and maintenance 45.6 54.8 10.7 14.2 34.7 40.4 Purchased freight 134.2 146.6 70.5 77.2 68.5 74.0 Depreciation and amortization 26.3 41.5 9.1 14.7 16.9 26.7 Impairment 13.4 — — — 13.4 — Restructuring 0.5 — — — 0.5 — Other operating expenses 40.2 35.3 12.5 11.6 20.4 17.3 Operating expenses 399.3 432.3 146.6 164.6 246.9 261.9 Operating ratio 102.1% 99.8% 94.5% 98.0% 102.7% 97.1% Business transformation costs 3.4 — 0.1 — 0.7 — Impairment 13.4 — — — 13.4 — Restructuring 0.5 — — — 0.5 — Amortization of intangible assets 1.8 4.3 0.8 1.7 1.0 2.6 Net impact of step-up in basis of acquired assets — 6.8 — 0.5 — 6.3 Adjusted operating expenses $ 380.2 $ 421.2 $ 145.7 $ 162.4 $ 231.3 $ 253.0 Adjusted operating ratio 97.2% 97.3% 93.9% 96.7% 96.2% 93.8% Daseke, Inc. and Subsidiaries Reconciliation of Adjusted Operating Ratio to Operating Ratio (Unaudited) (In millions) Three Months Ended March 31, 2020 2019 2020 2019 2020 2019 Consolidated Flatbed Specialized |
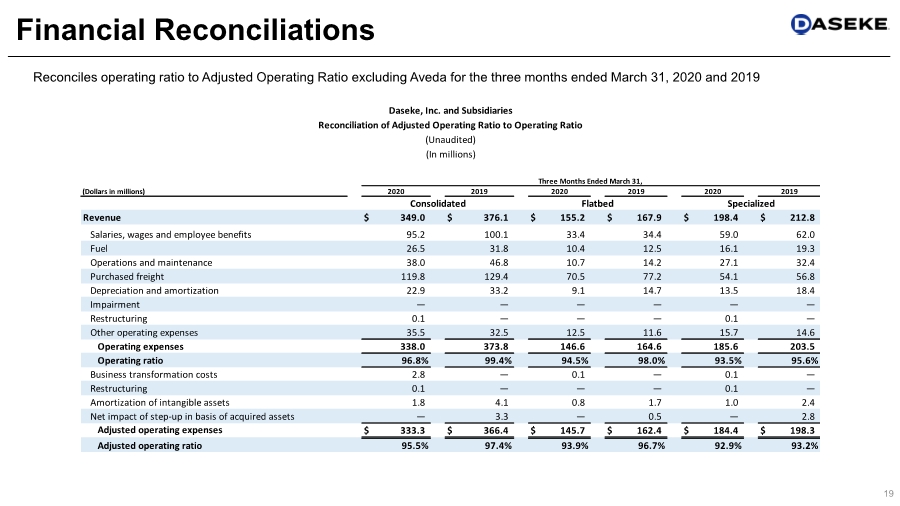
| 19 Financial Reconciliations Reconciles operating ratio to Adjusted Operating Ratio excluding Aveda for the three months ended March 31, 2020 and 2019 (Dollars in millions) Revenue $ 349.0 $ 376.1 $ 155.2 $ 167.9 $ 198.4 $ 212.8 Salaries, wages and employee benefits 95.2 100.1 33.4 34.4 59.0 62.0 Fuel 26.5 31.8 10.4 12.5 16.1 19.3 Operations and maintenance 38.0 46.8 10.7 14.2 27.1 32.4 Purchased freight 119.8 129.4 70.5 77.2 54.1 56.8 Depreciation and amortization 22.9 33.2 9.1 14.7 13.5 18.4 Impairment — — — — — — Restructuring 0.1 — — — 0.1 — Other operating expenses 35.5 32.5 12.5 11.6 15.7 14.6 Operating expenses 338.0 373.8 146.6 164.6 185.6 203.5 Operating ratio 96.8% 99.4% 94.5% 98.0% 93.5% 95.6% Business transformation costs 2.8 — 0.1 — 0.1 — Restructuring 0.1 — — — 0.1 — Amortization of intangible assets 1.8 4.1 0.8 1.7 1.0 2.4 Net impact of step-up in basis of acquired assets — 3.3 — 0.5 — 2.8 Adjusted operating expenses $ 333.3 $ 366.4 $ 145.7 $ 162.4 $ 184.4 $ 198.3 Adjusted operating ratio 95.5% 97.4% 93.9% 96.7% 92.9% 93.2% Daseke, Inc. and Subsidiaries Reconciliation of Adjusted Operating Ratio to Operating Ratio (Unaudited) (In millions) Three Months Ended March 31, 2020 2019 2020 2019 2020 2019 Consolidated Flatbed Specialized |
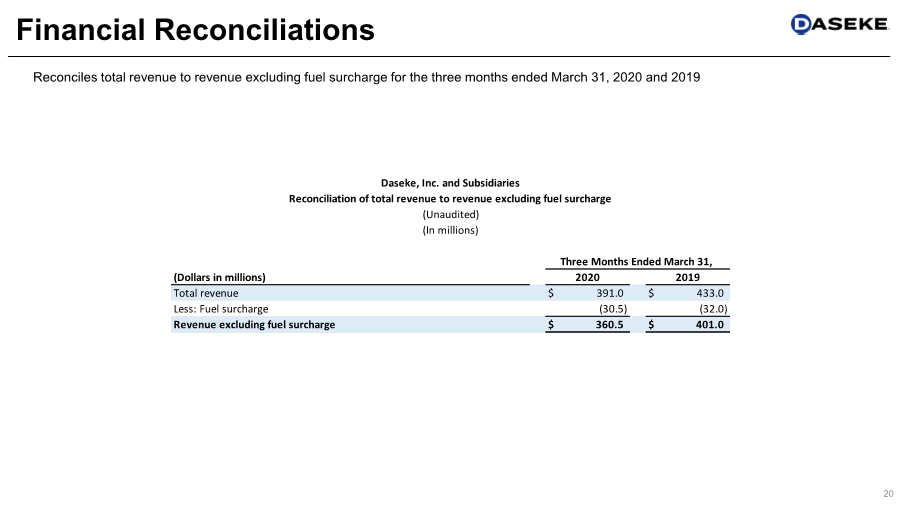
| 20 Financial Reconciliations Reconciles total revenue to revenue excluding fuel surcharge for the three months ended March 31, 2020 and 2019 (Dollars in millions) Total revenue $ 391.0 $ 433.0 Less: Fuel surcharge (30.5) (32.0) Revenue excluding fuel surcharge $ 360.5 $ 401.0 2020 2019 Daseke, Inc. and Subsidiaries Reconciliation of total revenue to revenue excluding fuel surcharge (Unaudited) (In millions) Three Months Ended March 31, |
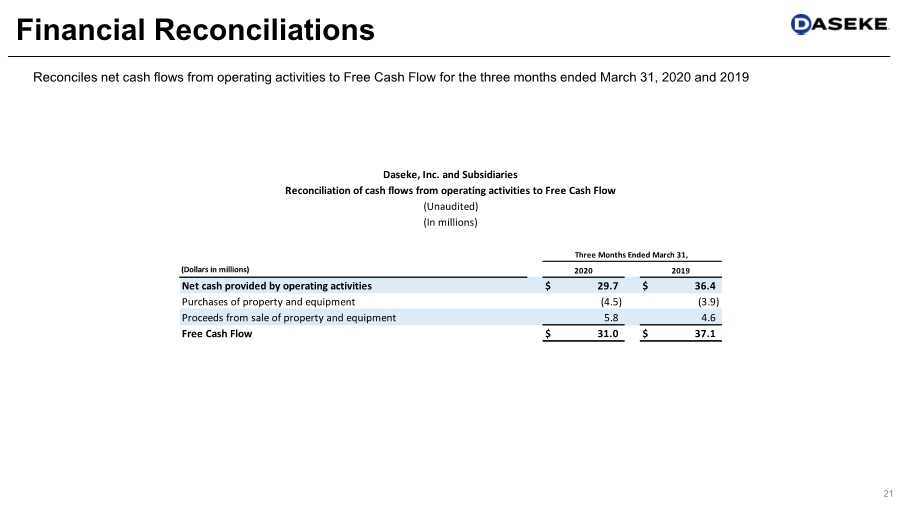
| 21 Financial Reconciliations Reconciles net cash flows from operating activities to Free Cash Flow for the three months ended March 31, 2020 and 2019 (Dollars in millions) Net cash provided by operating activities $ 29.7 $ 36.4 Purchases of property and equipment (4.5) (3.9) Proceeds from sale of property and equipment 5.8 4.6 Free Cash Flow $ 31.0 $ 37.1 2020 2019 Daseke, Inc. and Subsidiaries Reconciliation of cash flows from operating activities to Free Cash Flow (Unaudited) (In millions) Three Months Ended March 31, |
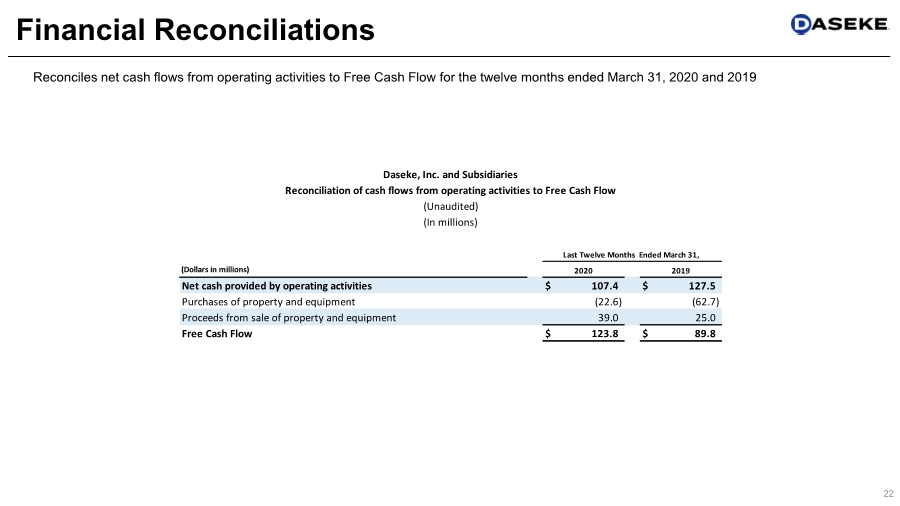
| 22 Financial Reconciliations Reconciles net cash flows from operating activities to Free Cash Flow for the twelve months ended March 31, 2020 and 2019 (Dollars in millions) Net cash provided by operating activities $ 107.4 $ 127.5 Purchases of property and equipment (22.6) (62.7) Proceeds from sale of property and equipment 39.0 25.0 Free Cash Flow $ 123.8 $ 89.8 2020 2019 Daseke, Inc. and Subsidiaries Reconciliation of cash flows from operating activities to Free Cash Flow (Unaudited) (In millions) Last Twelve Months Ended March 31, |
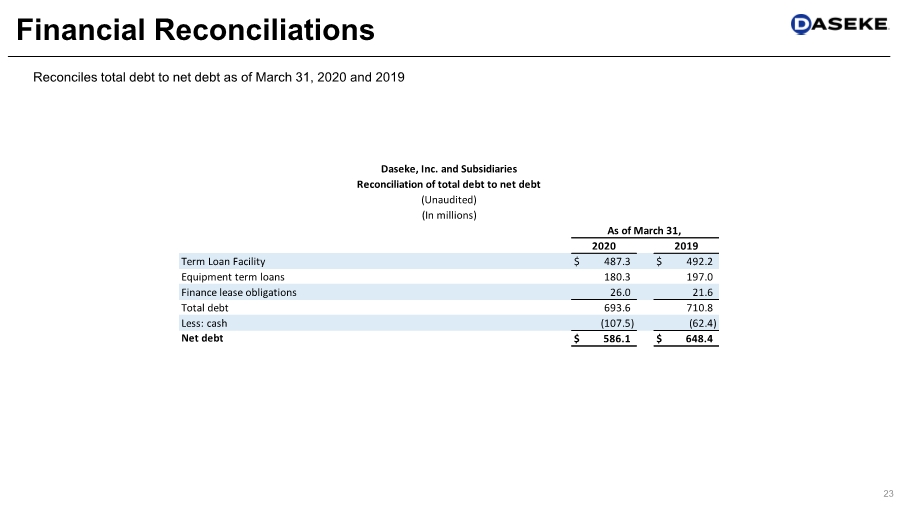
| 23 Financial Reconciliations Reconciles total debt to net debt as of March 31, 2020 and 2019 Term Loan Facility $ 487.3 $ 492.2 Equipment term loans 180.3 197.0 Finance lease obligations 26.0 21.6 Total debt 693.6 710.8 Less: cash (107.5) (62.4) Net debt $ 586.1 $ 648.4 2020 2019 Daseke, Inc. and Subsidiaries Reconciliation of total debt to net debt (Unaudited) (In millions) As of March 31, |
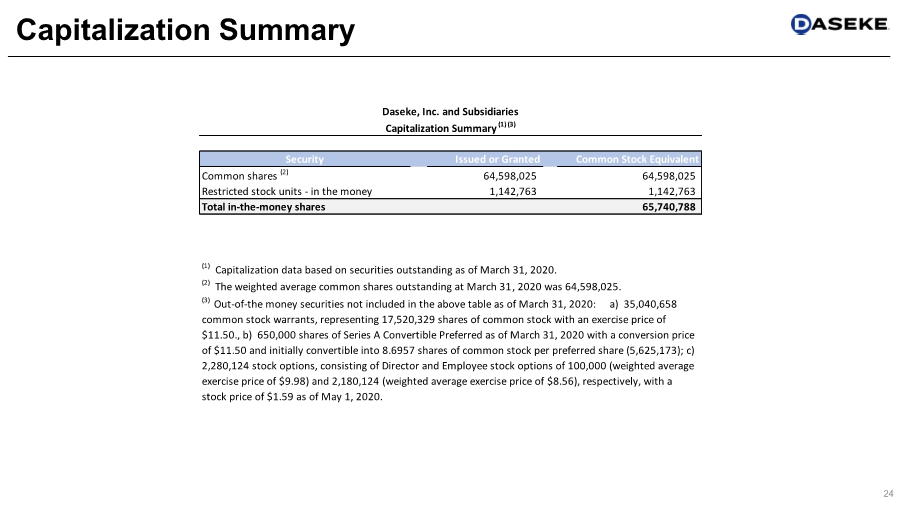
| 24 Capitalization Summary Security Issued or Granted Common Stock Equivalent Common shares (2) 64,598,025 64,598,025 Restricted stock units - in the money 1,142,763 1,142,763 Total in-the-money shares 65,740,788 (1) Capitalization data based on securities outstanding as of March 31, 2020. (2) The weighted average common shares outstanding at March 31, 2020 was 64,598,025. Daseke, Inc. and Subsidiaries Capitalization Summary (1) (3) (3) Out-of-the money securities not included in the above table as of March 31, 2020: a) 35,040,658 common stock warrants, representing 17,520,329 shares of common stock with an exercise price of $11.50., b) 650,000 shares of Series A Convertible Preferred as of March 31, 2020 with a conversion price of $11.50 and initially convertible into 8.6957 shares of common stock per preferred share (5,625,173); c) 2,280,124 stock options, consisting of Director and Employee stock options of 100,000 (weighted average exercise price of $9.98) and 2,180,124 (weighted average exercise price of $8.56), respectively, with a stock price of $1.59 as of May 1, 2020. |
| Daseke, Inc. 15455 Dallas Parkway, Ste 550 Addison, TX 75001 www.Daseke.com Investor Relations Joe Caminiti or Chris Hodges, Alpha IR 312-445-2870 DSKE@alpha-ir.com 25 Contact Information |