Attached files
| file | filename |
|---|---|
| EX-99.2 - EXHIBIT 99.2 - HEALTHCARE REALTY TRUST INC | exhibit992supplemental.htm |
| EX-99.1 - EXHIBIT 99.1 - HEALTHCARE REALTY TRUST INC | exhibit991firstquarter.htm |
| 8-K - 8-K - HEALTHCARE REALTY TRUST INC | hr-2020331xearningsfor.htm |

COVID-19 Business Update May 6, 2020

This presentation contains disclosures that are “forward-looking statements” as defined in Section 27A of the Securities Act of 1933, as amended, and Section 21E of the Securities Exchange Act of 1934, as amended. Forward-looking statements include all statements that do not relate solely to historical or current facts and can be identified by the use of words and phrases such as “can,” “may,” “payable,” “indicative,” "predictive," “annualized,” “expect,” “expected,” “range of expectations,” "would have been," "budget," and other comparable terms in this presentation. These forward-looking statements are made as of the date of this presentation and are not guarantees of future performance. These statements are based on the current plans and expectations of Company management and are subject to a number of unknown risks, uncertainties, assumptions and other factors that could cause actual results to differ materially from those described in this release or implied by such forward-looking statements. Such risks and uncertainties include, among other things, the following: the duration and scope of the COVID-19 pandemic; the impact of the COVID-19 pandemic on occupancy rates and on the operations of the Company and its tenants; actions governments take in response to the COVID-19 pandemic, including the introduction of public health measures and other regulations affecting the Company’s properties and the operations of the Company and its tenants; the effects of health and safety measures adopted by the Company and its tenants related to the COVID-19 pandemic; the impact of the COVID-19 pandemic on the business and financial condition of tenants; general economic uncertainty in key markets as a result of the COVID-19 pandemic and a worsening of global economic conditions or low levels of economic growth changes in the economy; increases in interest rates; the availability and cost of capital at expected rates; changes to facility-related healthcare regulations; competition for quality assets; negative developments in the operating results or financial condition of the Company's tenants, including, but not limited to, their ability to pay rent and repay loans; the Company's ability to reposition or sell facilities with profitable results; the Company's ability to re-lease space at similar rates as vacancies occur; the Company's ability to renew expiring long-term single-tenant net leases; the Company's ability to timely reinvest proceeds from the sale of assets at similar yields; government regulations affecting tenants' Medicare and Medicaid reimbursement rates and operational requirements; unanticipated difficulties and/or expenditures relating to future acquisitions and developments; changes in rules or practices governing the Company's financial reporting; the Company may be required under purchase options to sell properties and may not be able to reinvest the proceeds from such sales at rates of return equal to the return received on the properties sold; uninsured or underinsured losses related to casualty or liability; the incurrence of impairment charges on its real estate properties or other assets; and other legal and operational matters. Other risks, uncertainties and factors that could cause actual results to differ materially from those projected are detailed under the heading “Risk Factors,” in the Company's Annual Report on Form 10-K filed with the Securities and Exchange Commission (“SEC”) for the year ended December 31, 2019, under the heading "Risk Factors" in the Company's Quarterly Report on Form 10-Q filed with the SEC for the quarter ended March 31, 2020, and other risks described from time to time thereafter in the Company's SEC filings. The Company undertakes no obligation to publicly update or revise any forward-looking statements, whether as a result of new information, future events or otherwise. Information as of March 31, 2020 unless otherwise disclosed

COVID-19 Update PATIENTS PROVIDERS EMPLOYEES • Coordinating with hospitals to restrict • 51% of tenants are hospitals • HR employees are working from home access to fewer points of entry and • Our average not-for-profit hospital where possible screen patients for symptoms tenant had 229 days cash on hand • No employees are traveling beyond • Protecting vulnerable patient • 88.7% of associated health systems their immediate area populations by managing social are investment grade • On-site staff staggering schedules and distancing, restricting waiting room practicing social distancing to reduce access and enhancing cleaning • The other 49% of tenants are primarily exposure risk protocols small businesses including independent physician practices • Providing PPE for on-site employees • Fifteen COVID-19 testing sites located at our properties • Supporting smaller tenants through rent • No employees have yet tested positive deferral program (as outlined on pages • Providing sick leave for employees • 100% of our buildings are open 4–6) needing to quarantine • Providing temporary space to • Providing education on government hospitals at operating cost assistance • Expanding building hours to PAYCHECK PROTECTION PROGRAM serve pent-up patient demand Forgivable SBA loan for payroll and rent for healthcare services as state and local restrictions on elective PROVIDER RELIEF FUNDS procedures are lifted $175B of grants for healthcare providers ACCELERATED AND ADVANCE PAYMENTS PROGRAM Loan based on Medicare billings 3

April Rent Update Non-hospital tenants and more elective specialties largely explain differences in deferral rates across the portfolio % OF TOTAL % OF HR DEFERRAL TOTAL REQUESTS PORTFOLIO TENANT TYPE BY SQUARE FEET Hospital 5% 51% Non-Hospital 95% 49% Average Square Feet per Lease 3,376 4,416 SPECIALTY BY SQUARE FEET Dentistry 11% 2% Dermatology 7% 2% 89% Ophthamology 6% 2% PAID Plastic Surgery 5% 1% APRIL TOTAL Optometry 3% 1% BILLED CHARGES 31% 8% 7% DEFERRED DEFERRAL ASSISTANCE Application requires select financial and 4% operational data CURRENT Providing deferrals one month at a time PERIOD Deferred amounts to be repaid in 2H 2020 A/R RANGE OF HISTORICAL CURRENT PERIOD A/R 4% 5% 9% LOW AVG HIGH 4

Specialty Deferral Prevalence Elective specialties have higher rates of deferral requests but are a smaller portion of HR’s total portfolio % OF HR'S TOTAL APRIL RENT DEFERRAL PREVALENCE (1) 9% 60% 8 DE FE 50 R R A 7 L P 52% R E V A L 6 E 40 N C E ( 1) 5 30 4 3 20 SPECIALTIES' 2 APRIL RENT 10 1 0% 0 0 Dentistry Plastic Optometry Dermatology Ophthalmology Ortho OB-GYN ASC Pediatrics Imaging Neurology Cardiology Oncology Surgery MORE ELECTIVE LESS ELECTIVE SPECIALTIES SPECIALTIES (1) Based on April rent 5

Market Deferral Prevalence Variance in deferral prevalence across geographical markets primarily driven by ratio of non-hospital tenancy HR’S % OF RENT FROM NON-HOSPITAL TENANTS BY MARKET (1) DEFERRAL PREVALENCE (2) 80% 25% 72% 70 DEFERRAL PREVALENCE 20 60 19% (2) 50 15 40 10 30 20 17% 5 10 0% 0 0 Honolulu Houston Los Angeles Dallas Denver Seattle Wash., DC Oklahoma City Charlotte Indianapolis (1) HR’s rent from non-hospital tenants within a market divided by HR’s total rent within the same market (2) Based on April rent 6

Top Market Reopening Starts Elective procedures in HR’s top markets began selectively reopening by the end of April and were halted an average of 34 days DALLAS SEATTLE NASHVILLE CHARLOTTE LOS ANGELES MARCH 19 DAY CLOSED 22 23 23 26 APRIL ELECTIVE PROCEDURES 22 22 BEGIN REOPENING 29 30 27 MAY TODAY 6 6 6 6 6 DAYS ELECTIVE PROCEDURES HALTED 31 37 38 32 34 7

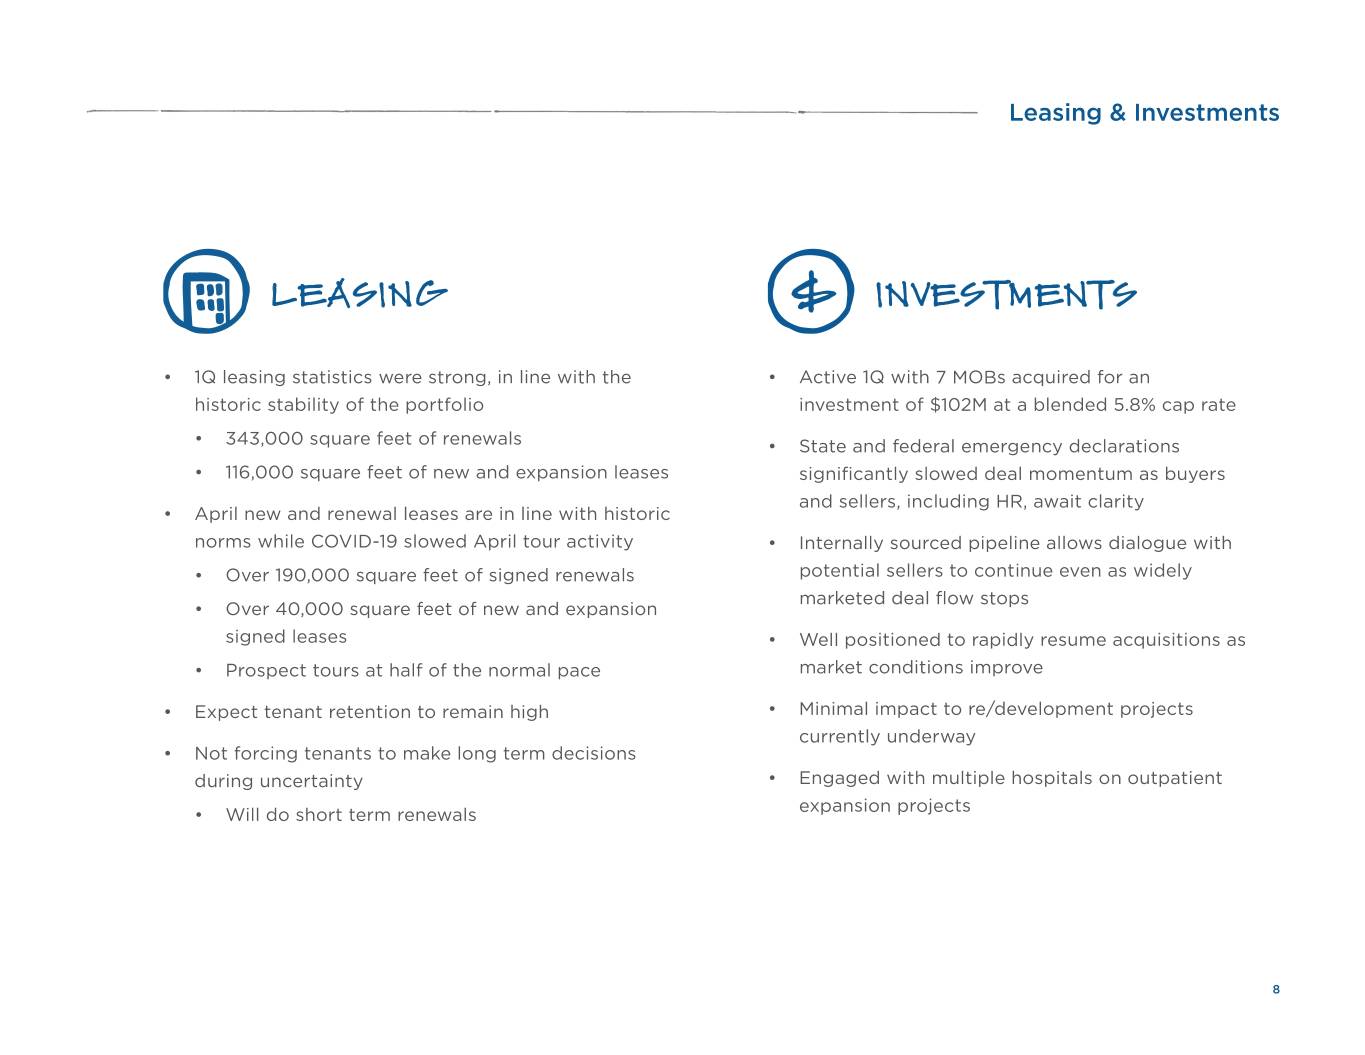
Leasing & Investments LEASING INVESTMENTS • 1Q leasing statistics were strong, in line with the • Active 1Q with 7 MOBs acquired for an historic stability of the portfolio investment of $102M at a blended 5.8% cap rate • 343,000 square feet of renewals • State and federal emergency declarations • 116,000 square feet of new and expansion leases significantly slowed deal momentum as buyers and sellers, including HR, await clarity • April new and renewal leases are in line with historic norms while COVID-19 slowed April tour activity • Internally sourced pipeline allows dialogue with • Over 190,000 square feet of signed renewals potential sellers to continue even as widely marketed deal flow stops • Over 40,000 square feet of new and expansion signed leases • Well positioned to rapidly resume acquisitions as • Prospect tours at half of the normal pace market conditions improve • Expect tenant retention to remain high • Minimal impact to re/development projects currently underway • Not forcing tenants to make long term decisions during uncertainty • Engaged with multiple hospitals on outpatient expansion projects • Will do short term renewals 8

Liquidity and Debt Update AS OF MARCH 31, 2020 Total Remaining Months Effective LIQUIDITY Available Balance Available to Maturity Rate Unsecured credit facility, net of cash $700,000 $111,630 $588,370 38 1.89% 5-year unsecured term loan 200,000 200,000 - 50 3.20% (1) $738M total available liquidity 7-year unsecured delayed draw term loan 150,000 - 150,000 74 NA (2) at 3/31/20 Senior notes due 2023 250,000 250,000 - 37 3.95% • Decreased variable rate borrowing Senior notes due 2025 250,000 250,000 - 61 4.08% (3) from 22.4% to 8.8% • Increased term by 10 months Senior notes due 2028 300,000 300,000 - 93 3.84% • Decreased overall rate by 24 basis Senior notes due 2030 300,000 300,000 - 120 2.71% (4) points • Less than $50M of debt maturities Mortgage notes payable, net 141,325 141,325 - 54 4.70% through 2022 Total $2,291,325 $1,552,955 $738,370 69 3.43% variable rate debt 136,630 8.8% for the period ended December 31, 2019 $1,978,601 $1,422,258 $556,343 59 3.67% variable rate debt 318,000 22.4% Change from year-end to March 31, 2020 $312,724 $130,697 $182,027 10 (0.24%) 12 months DEBT MATURITIES (as of 3/31/20) DEBT METRICS ended 3/31/20 $350M Mortgage Notes Payable Fixed Charge Coverage Ratio 4.3x Senior Notes Debt Service Coverage 4.8x (5) 300 Revolver 5-year Term Loan (6) 250 Net Debt to Adjusted EBITDA 5.3x 7-year Term Loan Availability (7) 200 Net Debt to Enterprise Value 29.2% 150 100 50 $16M $18M $13M 0 2020 2021 2022 2023 2024 2025 2026 2027 2028 2029 2030+ Revolver = unsecured credit facility (1) The effective interest rate includes the impact of interest rate swaps on $175.0 million at a weighted average rate of 2.29% (plus the applicable margin rate, currently 100 basis points). (2) As of March 31, 2020, there are no outstanding loans under the $150 million unsecured term loan due June 2026. This term loan has a delayed draw feature that allows the Company until May 29, 2020 to draw against the commitments. (3) The effective interest rate includes the impact of the $1.7 million settlement of a forward-starting interest rate swap. (4) The effective interest rate includes the impact of the $4.3 million settlement of forward interest rate hedges. (5) Based on the senior note covenant calculations that apply to the Senior Notes due 2025 and 2028. (6) Adjusted EBITDA is based on the current quarter results, annualized. See page 26 of our Quarterly Supplement for a reconciliation of adjusted EBITDA. Net debt does not include lease liabilities. 9 (7) Based on a closing stock price of $27.93 and 134,932,206 shares outstanding on March 31, 2020. Debt does not include lease liabilities.
