Attached files
| file | filename |
|---|---|
| 8-K - 8-K - R1 RCM INC. | achi-20200505.htm |
| EX-99.1 - EX-99.1 - R1 RCM INC. | a991-q12020pressrelease.htm |

Exhibit 99.2 First Quarter 2020 Results Conference Call May 5, 2020
Forward-Looking Statements and Non-GAAP Financial Measures This presentation includes information that may constitute “forward-looking statements,” made pursuant to the safe harbor provisions of the Private Securities Litigation Reform Act of 1995. Forward-looking statements relate to future, not past, events and often address our expected future growth, plans and performance or forecasts. These forward-looking statements are often identified by the use of words such as “anticipate,” “believe,” “designed,” “estimate,” “expect,” “forecast,” “intend,” “may,” “plan,” “predict,” “project,” “target,” “will,” or “would,” and similar expressions or variations, although not all forward-looking statements contain these identifying words. These forward-looking statements include, among other things, statements about the potential impacts of the COVID-19 pandemic, our strategic initiatives, our capital plans, our costs, our ability to successfully deliver on our commitments to our customers, our ability to deploy new business as planned, our ability to successfully implement new technologies, our future financial performance and our liquidity. Such forward-looking statements are based on management’s current expectations about future events as of the date hereof and involve many risks and uncertainties that could cause our actual results to differ materially from those expressed or implied in our forward-looking statements. Subsequent events and developments, including actual results or changes in our assumptions, may cause our views to change. We do not undertake to update our forward-looking statements except to the extent required by applicable law. Readers are cautioned not to place undue reliance on such forward-looking statements. All forward-looking statements included herein are expressly qualified in their entirety by these cautionary statements. Our actual results and outcomes could differ materially from those included in these forward-looking statements as a result of various factors, including, but not limited to, the severity, magnitude and duration of the COVID-19 pandemic; responses to the pandemic by the government and healthcare providers and the direct and indirect impacts of the pandemic on our customers and personnel; the disruption of national, state and local economies as a result of the pandemic; the impact of the pandemic on our financial results, including possible lost revenue and increased expenses; and the factors discussed under the heading “Risk Factors” in our annual report on Form 10-K for the year ended December 31, 2019, our quarterly reports on Form 10-Q and any other periodic reports that the Company files with the Securities and Exchange Commission. This presentation includes the following non-GAAP financial measures: adjusted EBITDA, non-GAAP cost of services, non-GAAP SG&A expense and net debt. Please refer to the Appendix located at the end of this presentation for a reconciliation of the non-GAAP financial measures to the most directly comparable GAAP financial measures. 2
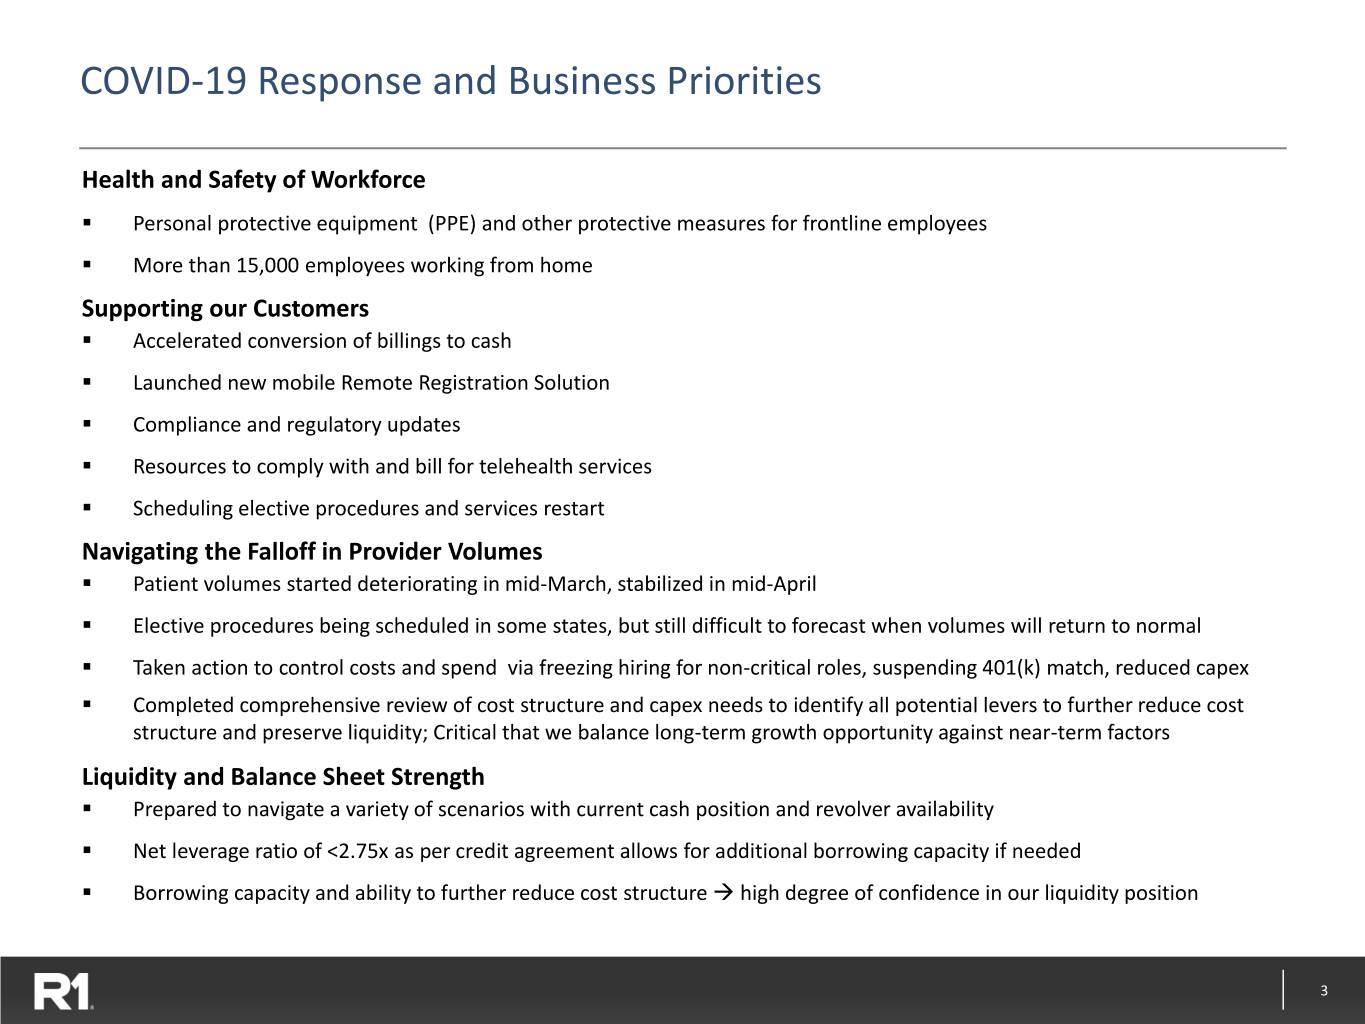
COVID-19 Response and Business Priorities Health and Safety of Workforce ▪ Personal protective equipment (PPE) and other protective measures for frontline employees ▪ More than 15,000 employees working from home Supporting our Customers ▪ Accelerated conversion of billings to cash ▪ Launched new mobile Remote Registration Solution ▪ Compliance and regulatory updates ▪ Resources to comply with and bill for telehealth services ▪ Scheduling elective procedures and services restart Navigating the Falloff in Provider Volumes ▪ Patient volumes started deteriorating in mid-March, stabilized in mid-April ▪ Elective procedures being scheduled in some states, but still difficult to forecast when volumes will return to normal ▪ Taken action to control costs and spend via freezing hiring for non-critical roles, suspending 401(k) match, reduced capex ▪ Completed comprehensive review of cost structure and capex needs to identify all potential levers to further reduce cost structure and preserve liquidity; Critical that we balance long-term growth opportunity against near-term factors Liquidity and Balance Sheet Strength ▪ Prepared to navigate a variety of scenarios with current cash position and revolver availability ▪ Net leverage ratio of <2.75x as per credit agreement allows for additional borrowing capacity if needed ▪ Borrowing capacity and ability to further reduce cost structure → high degree of confidence in our liquidity position 3
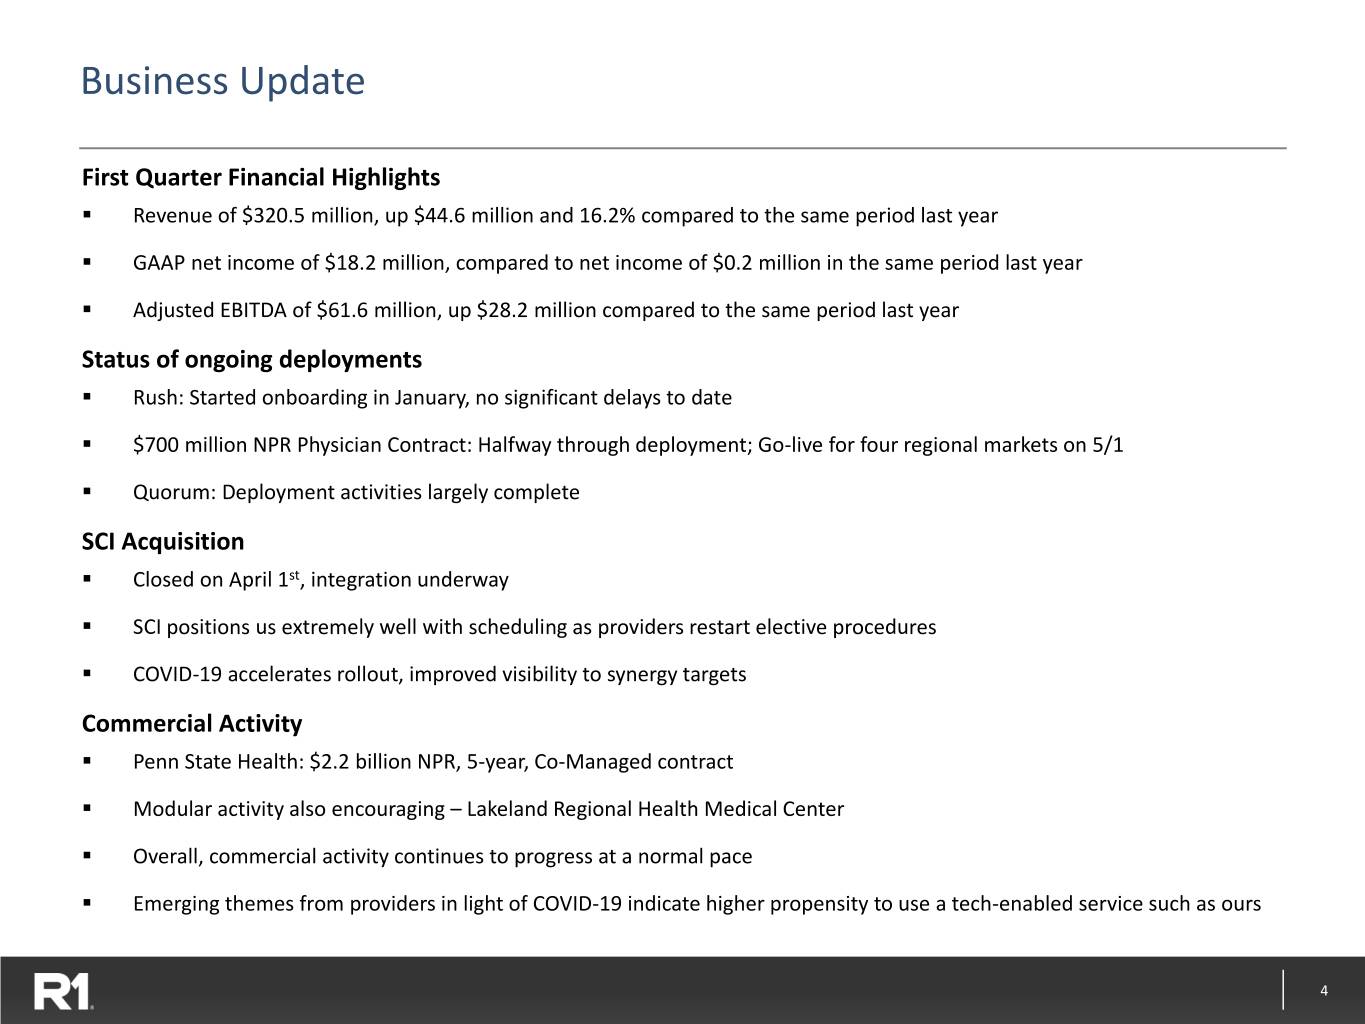
Business Update First Quarter Financial Highlights ▪ Revenue of $320.5 million, up $44.6 million and 16.2% compared to the same period last year ▪ GAAP net income of $18.2 million, compared to net income of $0.2 million in the same period last year ▪ Adjusted EBITDA of $61.6 million, up $28.2 million compared to the same period last year Status of ongoing deployments ▪ Rush: Started onboarding in January, no significant delays to date ▪ $700 million NPR Physician Contract: Halfway through deployment; Go-live for four regional markets on 5/1 ▪ Quorum: Deployment activities largely complete SCI Acquisition ▪ Closed on April 1st, integration underway ▪ SCI positions us extremely well with scheduling as providers restart elective procedures ▪ COVID-19 accelerates rollout, improved visibility to synergy targets Commercial Activity ▪ Penn State Health: $2.2 billion NPR, 5-year, Co-Managed contract ▪ Modular activity also encouraging – Lakeland Regional Health Medical Center ▪ Overall, commercial activity continues to progress at a normal pace ▪ Emerging themes from providers in light of COVID-19 indicate higher propensity to use a tech-enabled service such as ours 4
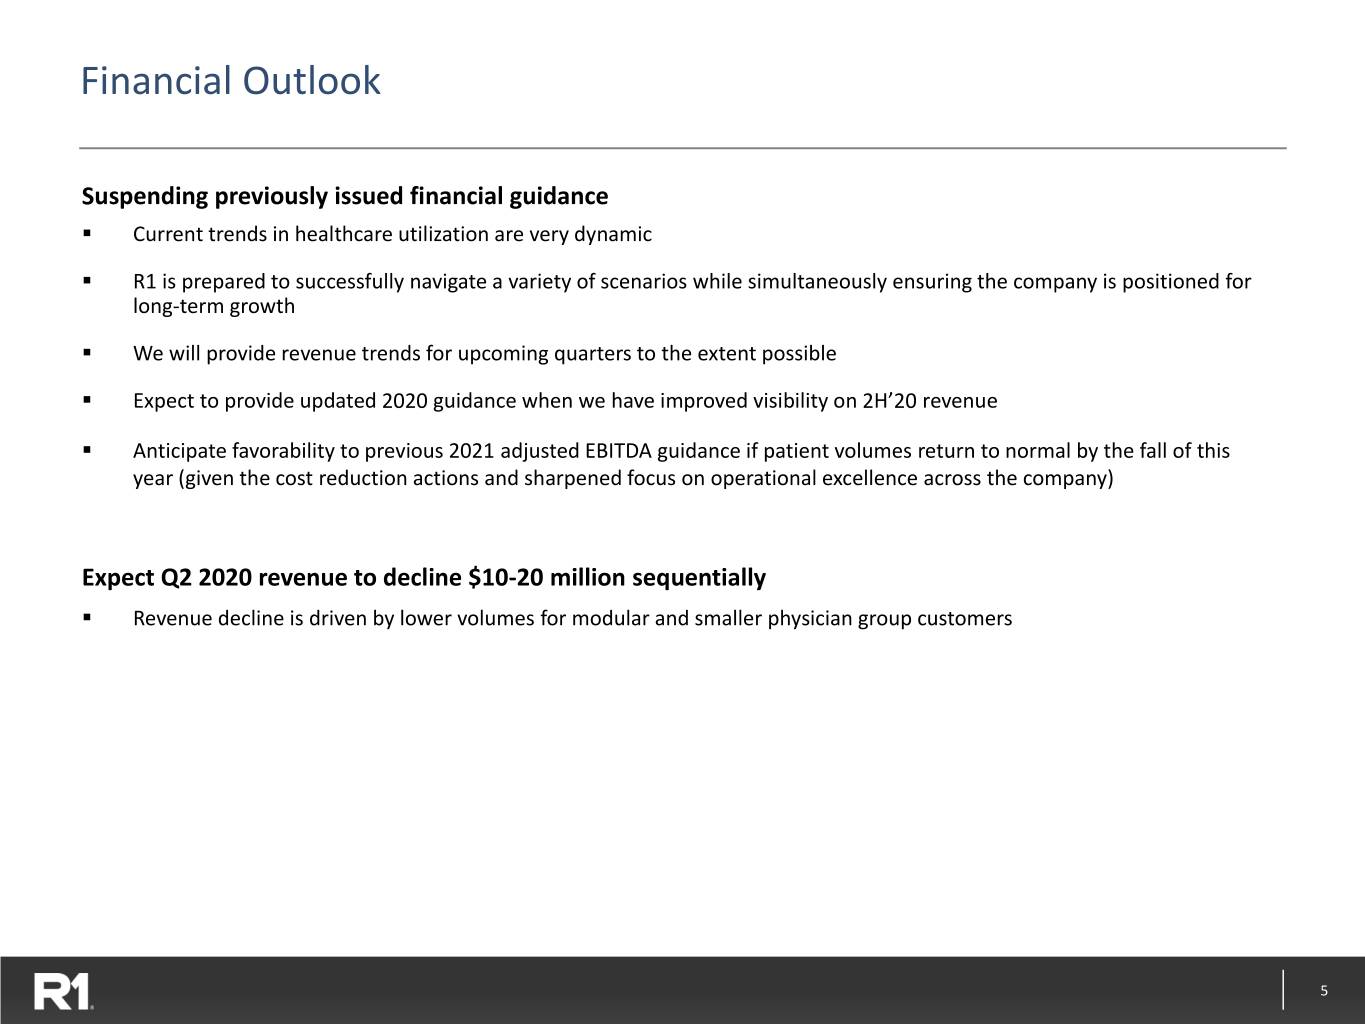
Financial Outlook Suspending previously issued financial guidance ▪ Current trends in healthcare utilization are very dynamic ▪ R1 is prepared to successfully navigate a variety of scenarios while simultaneously ensuring the company is positioned for long-term growth ▪ We will provide revenue trends for upcoming quarters to the extent possible ▪ Expect to provide updated 2020 guidance when we have improved visibility on 2H’20 revenue ▪ Anticipate favorability to previous 2021 adjusted EBITDA guidance if patient volumes return to normal by the fall of this year (given the cost reduction actions and sharpened focus on operational excellence across the company) Expect Q2 2020 revenue to decline $10-20 million sequentially ▪ Revenue decline is driven by lower volumes for modular and smaller physician group customers 5
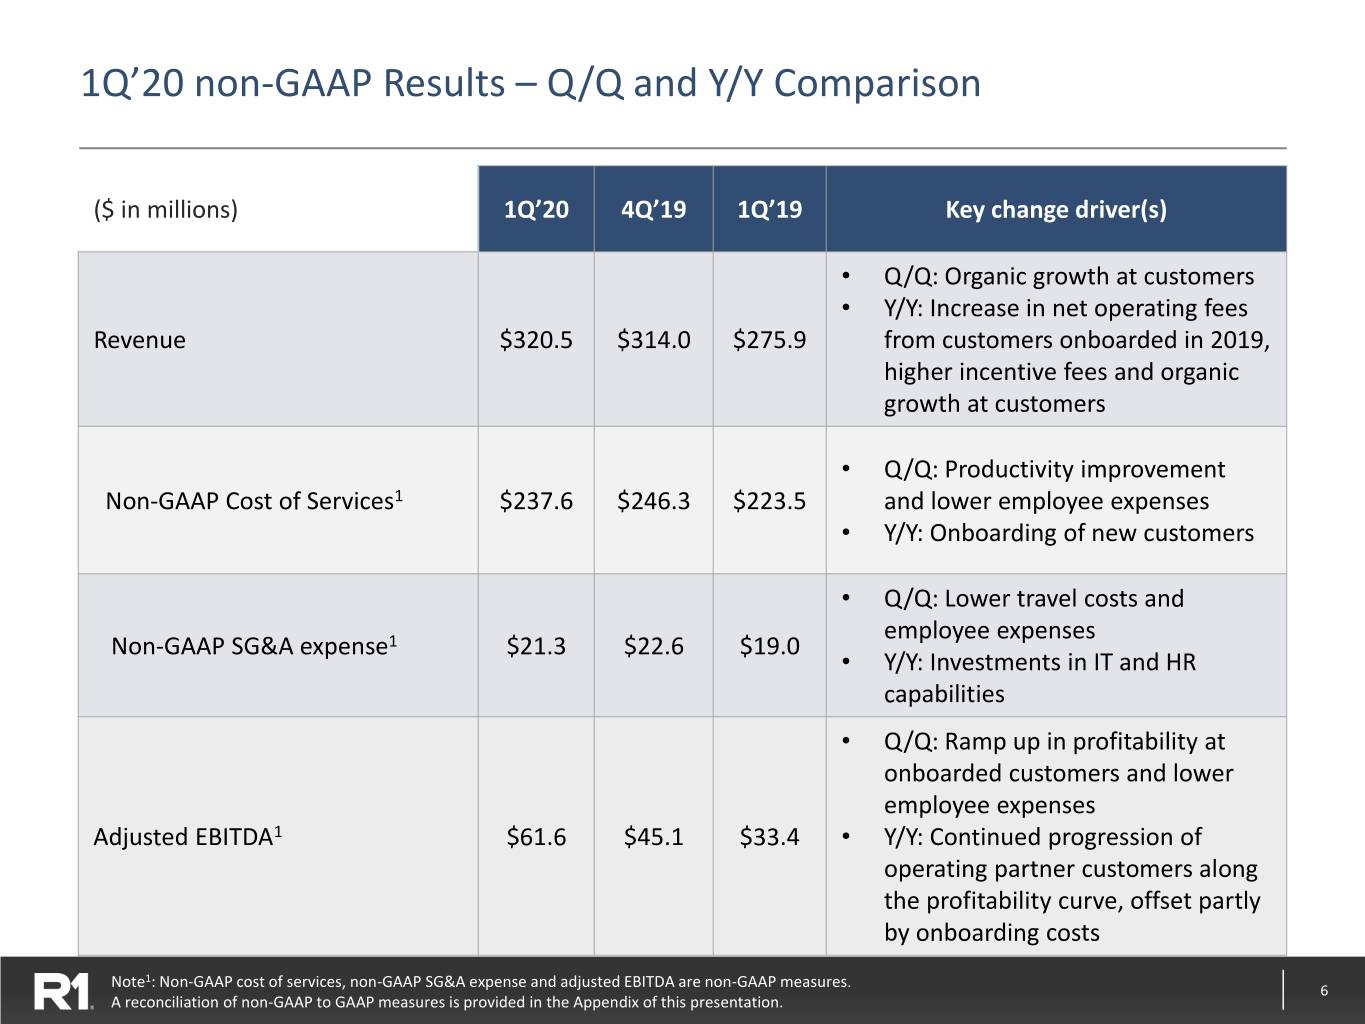
1Q’20 non-GAAP Results – Q/Q and Y/Y Comparison ($ in millions) 1Q’20 4Q’19 1Q’19 Key change driver(s) • Q/Q: Organic growth at customers • Y/Y: Increase in net operating fees Revenue $320.5 $314.0 $275.9 from customers onboarded in 2019, higher incentive fees and organic growth at customers • Q/Q: Productivity improvement Non-GAAP Cost of Services1 $237.6 $246.3 $223.5 and lower employee expenses • Y/Y: Onboarding of new customers • Q/Q: Lower travel costs and employee expenses Non-GAAP SG&A expense1 $21.3 $22.6 $19.0 • Y/Y: Investments in IT and HR capabilities • Q/Q: Ramp up in profitability at onboarded customers and lower employee expenses Adjusted EBITDA1 $61.6 $45.1 $33.4 • Y/Y: Continued progression of operating partner customers along the profitability curve, offset partly by onboarding costs Note1: Non-GAAP cost of services, non-GAAP SG&A expense and adjusted EBITDA are non-GAAP measures. 6 A reconciliation of non-GAAP to GAAP measures is provided in the Appendix of this presentation.
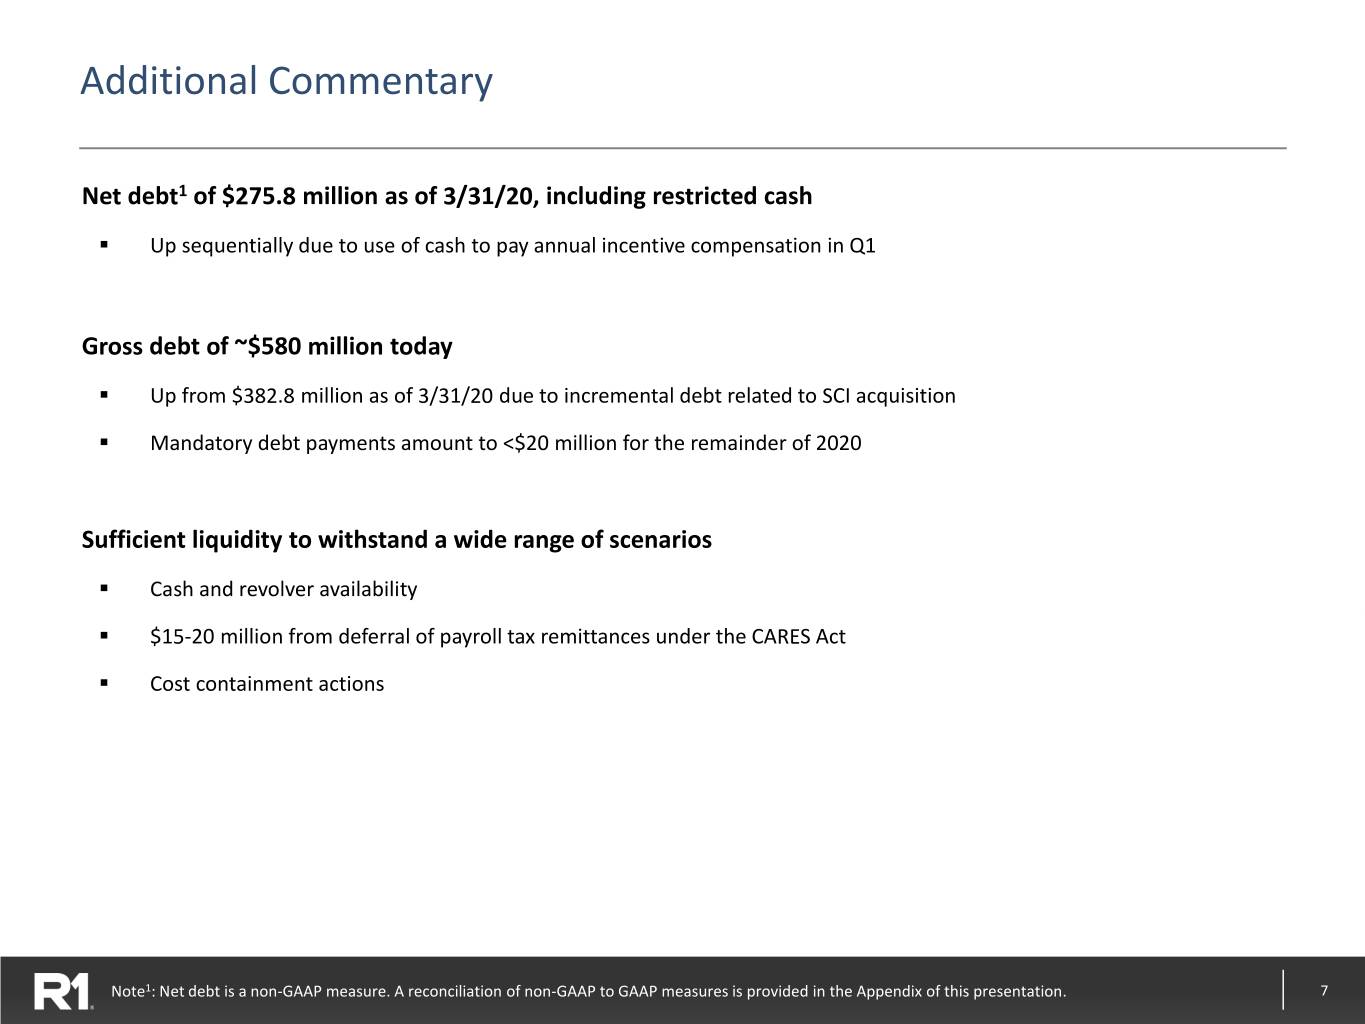
Additional Commentary Net debt1 of $275.8 million as of 3/31/20, including restricted cash ▪ Up sequentially due to use of cash to pay annual incentive compensation in Q1 Gross debt of ~$580 million today ▪ Up from $382.8 million as of 3/31/20 due to incremental debt related to SCI acquisition ▪ Mandatory debt payments amount to <$20 million for the remainder of 2020 Sufficient liquidity to withstand a wide range of scenarios ▪ Cash and revolver availability ▪ $15-20 million from deferral of payroll tax remittances under the CARES Act ▪ Cost containment actions Note1: Net debt is a non-GAAP measure. A reconciliation of non-GAAP to GAAP measures is provided in the Appendix of this presentation. 7

Appendix 8
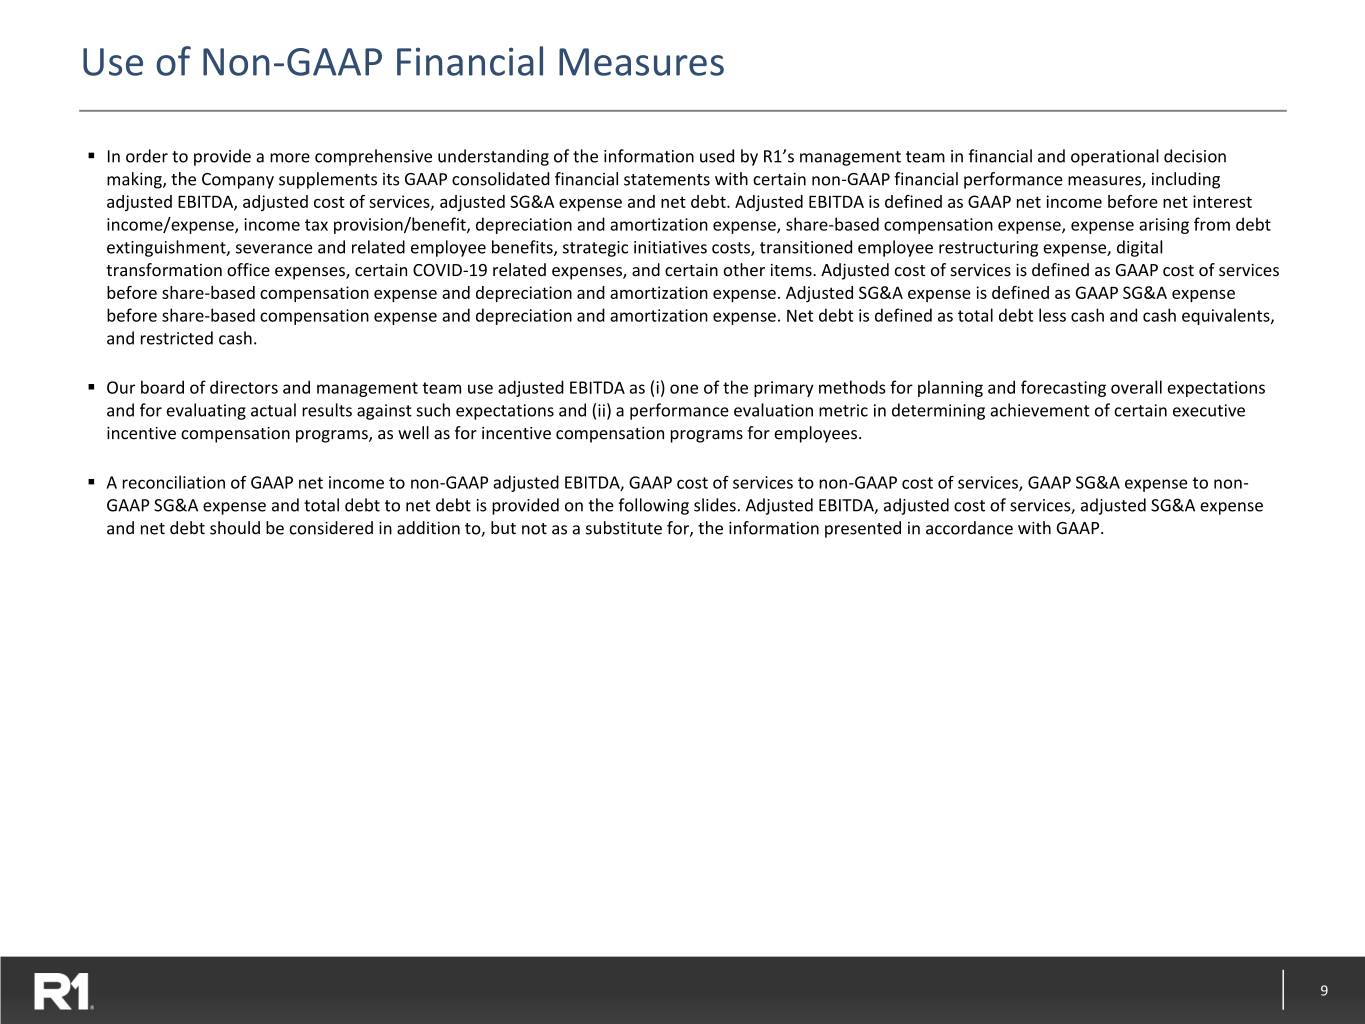
Use of Non-GAAP Financial Measures ▪ In order to provide a more comprehensive understanding of the information used by R1’s management team in financial and operational decision making, the Company supplements its GAAP consolidated financial statements with certain non-GAAP financial performance measures, including adjusted EBITDA, adjusted cost of services, adjusted SG&A expense and net debt. Adjusted EBITDA is defined as GAAP net income before net interest income/expense, income tax provision/benefit, depreciation and amortization expense, share-based compensation expense, expense arising from debt extinguishment, severance and related employee benefits, strategic initiatives costs, transitioned employee restructuring expense, digital transformation office expenses, certain COVID-19 related expenses, and certain other items. Adjusted cost of services is defined as GAAP cost of services before share-based compensation expense and depreciation and amortization expense. Adjusted SG&A expense is defined as GAAP SG&A expense before share-based compensation expense and depreciation and amortization expense. Net debt is defined as total debt less cash and cash equivalents, and restricted cash. ▪ Our board of directors and management team use adjusted EBITDA as (i) one of the primary methods for planning and forecasting overall expectations and for evaluating actual results against such expectations and (ii) a performance evaluation metric in determining achievement of certain executive incentive compensation programs, as well as for incentive compensation programs for employees. ▪ A reconciliation of GAAP net income to non-GAAP adjusted EBITDA, GAAP cost of services to non-GAAP cost of services, GAAP SG&A expense to non- GAAP SG&A expense and total debt to net debt is provided on the following slides. Adjusted EBITDA, adjusted cost of services, adjusted SG&A expense and net debt should be considered in addition to, but not as a substitute for, the information presented in accordance with GAAP. 9
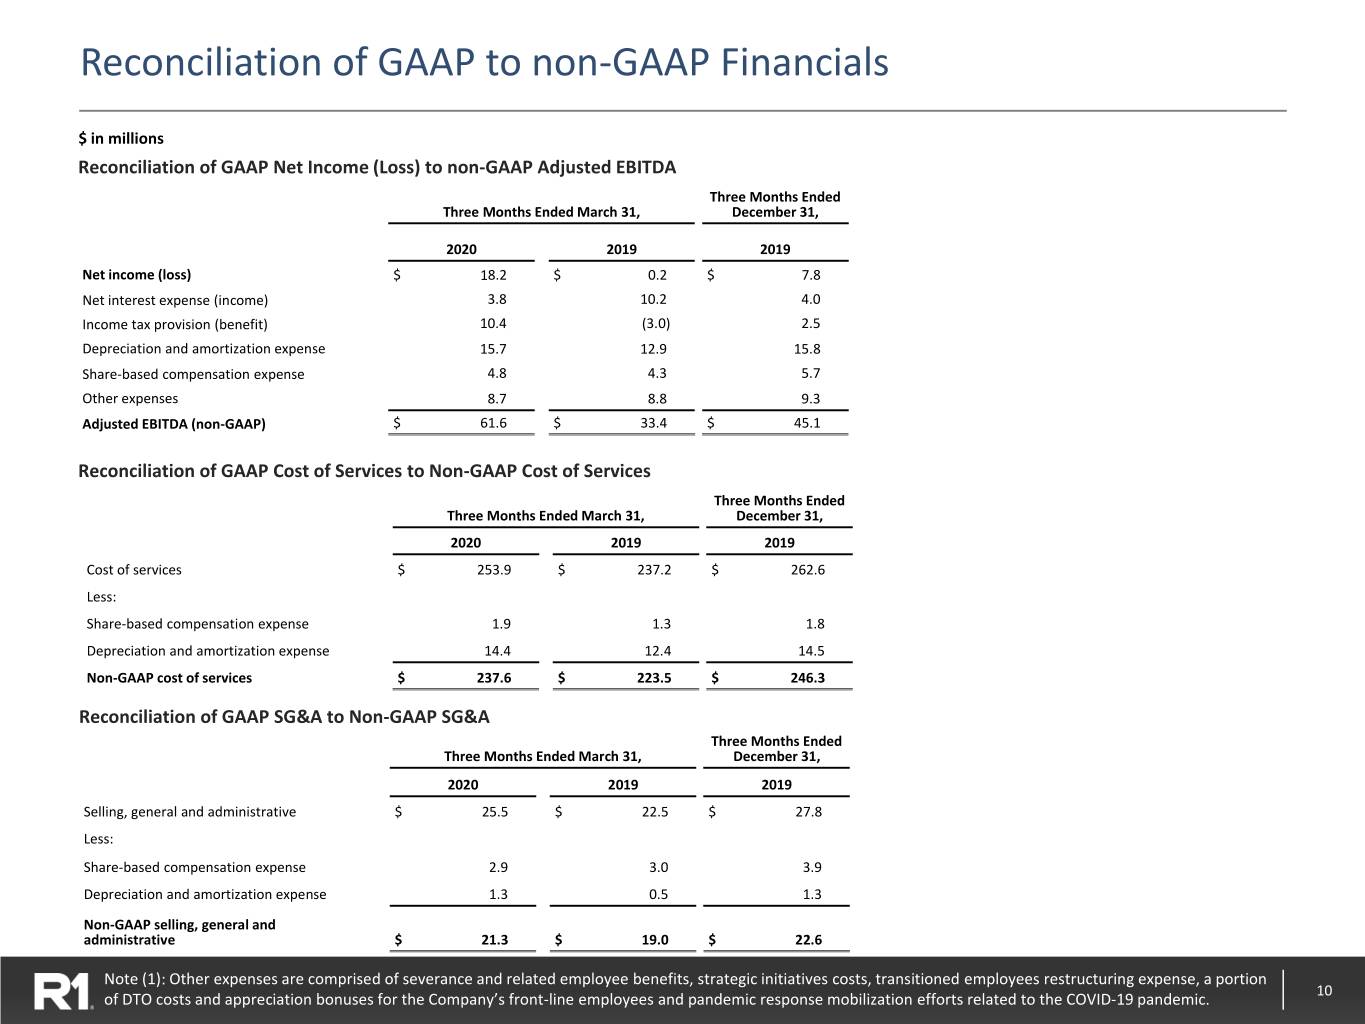
Reconciliation of GAAP to non-GAAP Financials $ in millions Reconciliation of GAAP Net Income (Loss) to non-GAAP Adjusted EBITDA Three Months Ended Three Months Ended March 31, December 31, 2020 2019 2019 Net income (loss) $ 18.2 $ 0.2 $ 7.8 Net interest expense (income) 3.8 10.2 4.0 Income tax provision (benefit) 10.4 (3.0) 2.5 Depreciation and amortization expense 15.7 12.9 15.8 Share-based compensation expense 4.8 4.3 5.7 Other expenses 8.7 8.8 9.3 Adjusted EBITDA (non-GAAP) $ 61.6 $ 33.4 $ 45.1 Reconciliation of GAAP Cost of Services to Non-GAAP Cost of Services Three Months Ended Three Months Ended March 31, December 31, 2020 2019 2019 Cost of services $ 253.9 $ 237.2 $ 262.6 Less: Share-based compensation expense 1.9 1.3 1.8 Depreciation and amortization expense 14.4 12.4 14.5 Non-GAAP cost of services $ 237.6 $ 223.5 $ 246.3 Reconciliation of GAAP SG&A to Non-GAAP SG&A Three Months Ended Three Months Ended March 31, December 31, 2020 2019 2019 Selling, general and administrative $ 25.5 $ 22.5 $ 27.8 Less: Share-based compensation expense 2.9 3.0 3.9 Depreciation and amortization expense 1.3 0.5 1.3 Non-GAAP selling, general and administrative $ 21.3 $ 19.0 $ 22.6 Note (1): Other expenses are comprised of severance and related employee benefits, strategic initiatives costs, transitioned employees restructuring expense, a portion 10 of DTO costs and appreciation bonuses for the Company’s front-line employees and pandemic response mobilization efforts related to the COVID-19 pandemic.
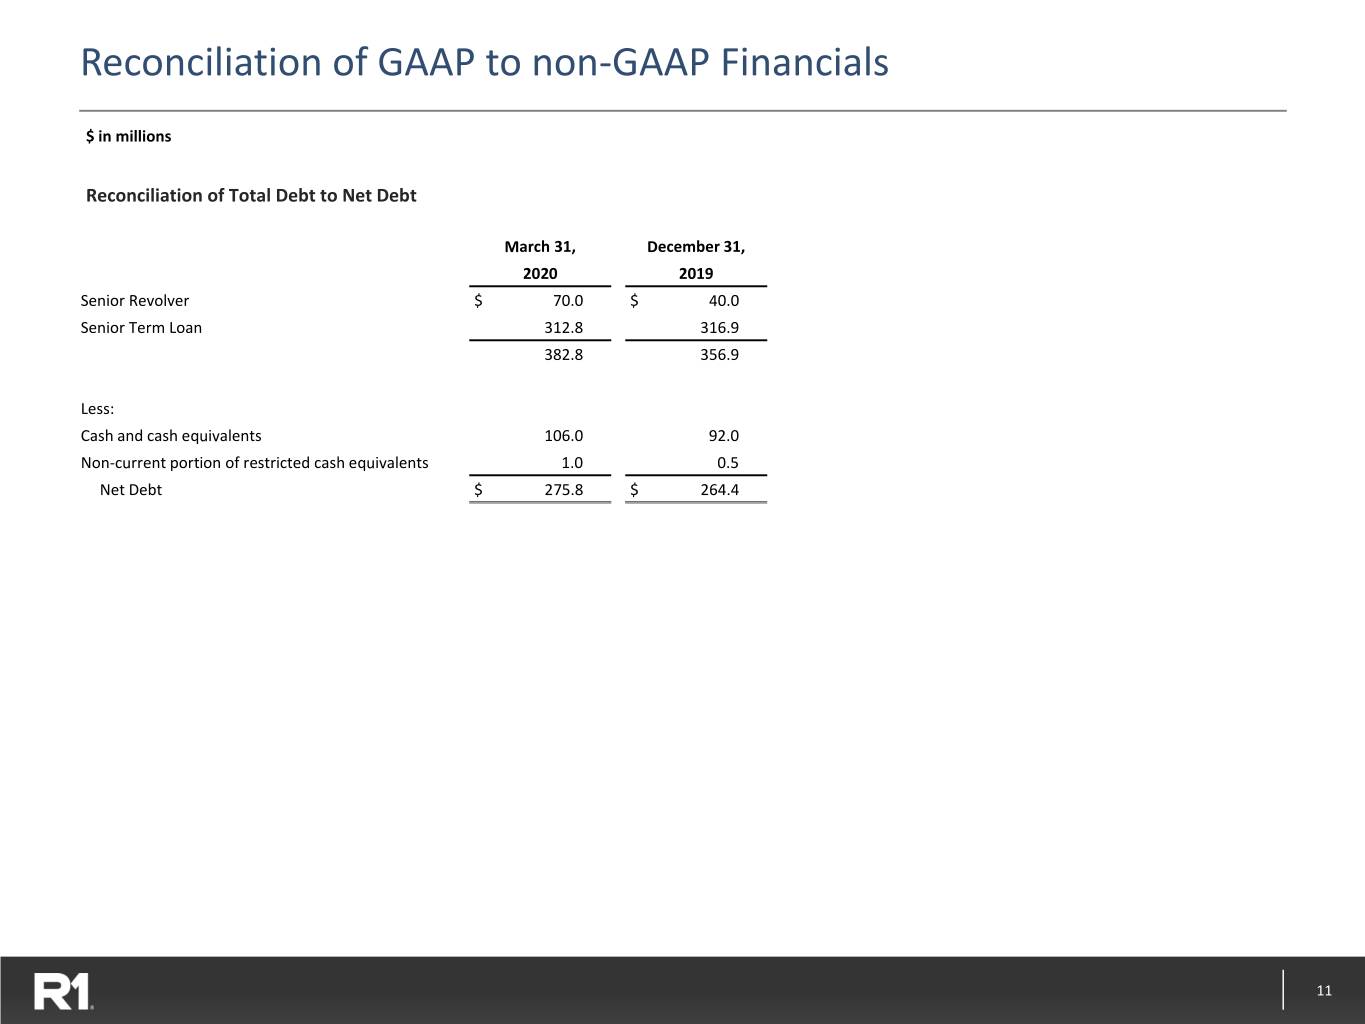
Reconciliation of GAAP to non-GAAP Financials $ in millions Reconciliation of Total Debt to Net Debt March 31, December 31, 2020 2019 Senior Revolver $ 70.0 $ 40.0 Senior Term Loan 312.8 316.9 382.8 356.9 Less: Cash and cash equivalents 106.0 92.0 Non-current portion of restricted cash equivalents 1.0 0.5 Net Debt $ 275.8 $ 264.4 11
