Attached files
| file | filename |
|---|---|
| EX-31.1 - CEO CERTIFICATION UNDER SECTION 302 OF SARBANES -OXLEY ACT. - FEDERAL SIGNAL CORP /DE/ | fss-2020331x10qexx311.htm |
| 10-Q - 10-Q - FEDERAL SIGNAL CORP /DE/ | fss-2020331x10q.htm |
| EX-99.1 - FIRST QUARTER FINANCIAL RESULTS PRESS RELEASE. - FEDERAL SIGNAL CORP /DE/ | fss-2020331x10qexhx991.htm |
| EX-32.2 - CFO CERTIFICATION OF PERIODIC REPORT UNDER SECTION 906 OF SARBANES-OXLEY ACT. - FEDERAL SIGNAL CORP /DE/ | fss-2020331x10qexx322.htm |
| EX-32.1 - CEO CERTIFICATION OF PERIODIC REPORT UNDER SECTION 906 OF SARBANES-OXLEY ACT. - FEDERAL SIGNAL CORP /DE/ | fss-2020331x10qexx321.htm |
| EX-31.2 - CFO CERTIFICATION UNDER SECTION 302 OF SARBANES-OXLEY ACT. - FEDERAL SIGNAL CORP /DE/ | fss-2020331x10qexx312.htm |

Federal Signal Q1 2020 Earnings Call April 29, 2020 Jennifer Sherman, President & Chief Executive Officer Ian Hudson, SVP, Chief Financial Officer

Safe Harbor This presentation contains unaudited financial information and various forward-looking statements as of the date hereof and we undertake no obligation to update these forward- looking statements regardless of new developments or otherwise. Statements in this presentation that are not historical are forward-looking statements. Such statements are subject to various risks and uncertainties that could cause actual results to vary materially from those stated. Such risks and uncertainties include but are not limited to: direct and indirect impacts of the coronavirus pandemic and the associated government response, economic conditions in various regions, product and price competition, supply chain disruptions, work stoppages, availability and pricing of raw materials, risks associated with acquisitions such as integration of operations and achieving anticipated revenue and cost benefits, foreign currency exchange rate changes, interest rate changes, increased legal expenses and litigation results, legal and regulatory developments and other risks and uncertainties described in filings with the Securities and Exchange Commission. This presentation also contains references to certain non-GAAP financial information. Such items are reconciled herein and in our earnings news release provided as of the date of this presentation. 2
Executive Summary • Portfolio of businesses includes many market-leading brands with solid fundamentals • Strong financial position with ample liquidity • History of robust cash flow generation • High-performing culture • Clearly-defined strategy • Experienced team with a proven track record of anticipating issues and proactively implementing responses • Reclaiming Tomorrow, Together offensive strategy 3
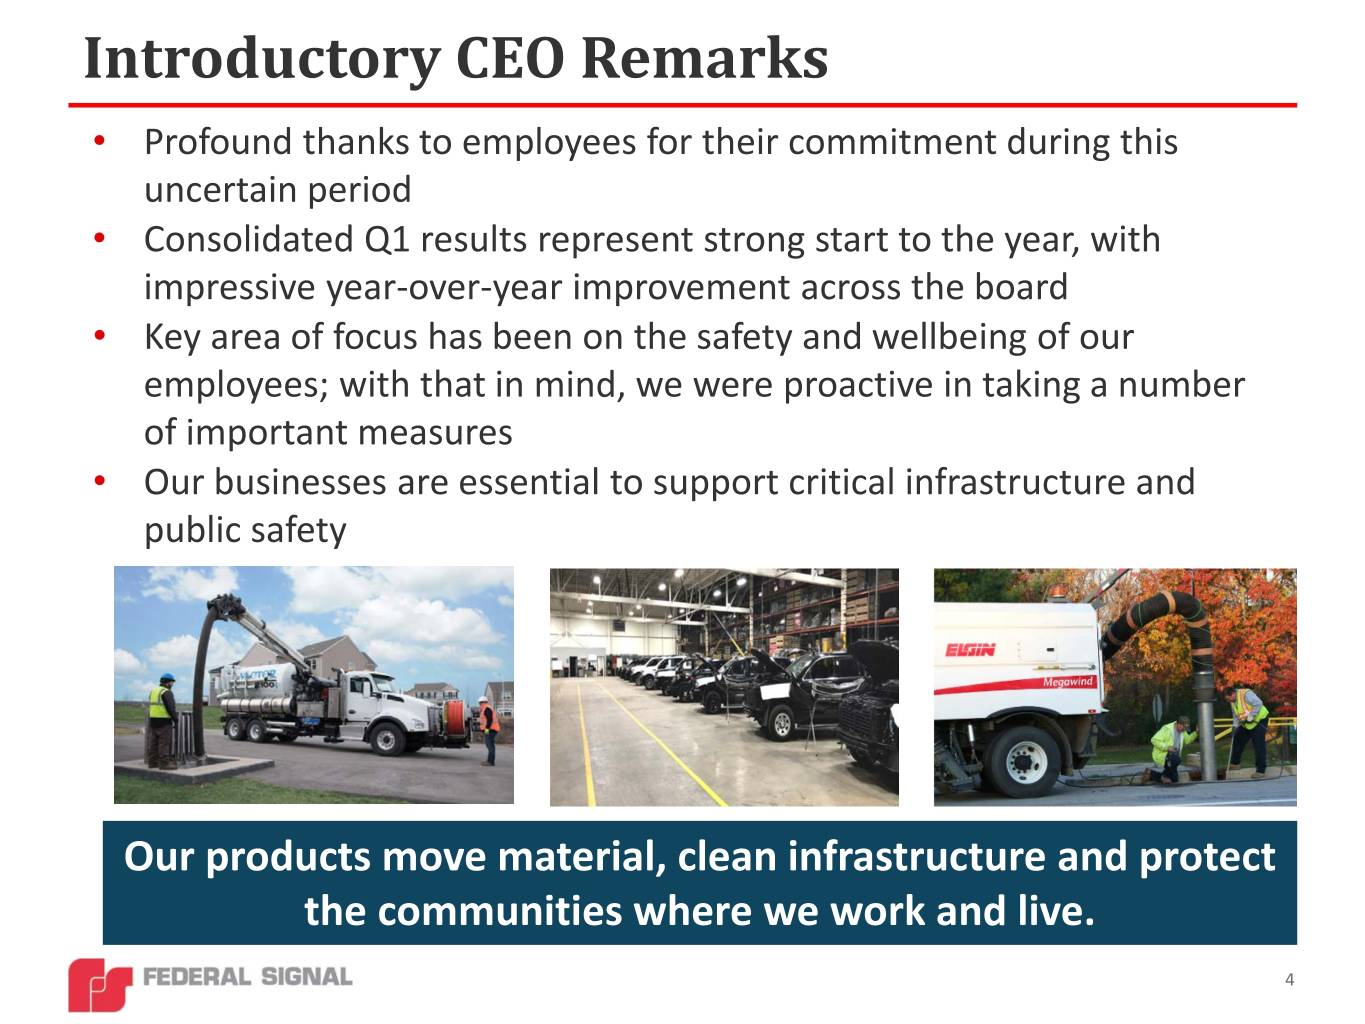
Introductory CEO Remarks • Profound thanks to employees for their commitment during this uncertain period • Consolidated Q1 results represent strong start to the year, with impressive year-over-year improvement across the board • Key area of focus has been on the safety and wellbeing of our employees; with that in mind, we were proactive in taking a number of important measures • Our businesses are essential to support critical infrastructure and public safety Our products move material, clean infrastructure and protect the communities where we work and live. 4

How Federal Signal is Helping Supporting Local Food Banks Where We Live And Operate Ways in which our equipment can be used to clean and sanitize Protective Face Shield Production at our University Park Facility 5

Q1 Highlights * • Net sales of $286 M, up $12 M, or 4% • Operating income of $32.3 M, up $6.5 M, or 25% • Adjusted EBITDA of $43.9 M, up $8.0 M, or 22% • Adjusted EBITDA margin of 15.3%, compared to 13.1% • GAAP EPS of $0.38, up $0.09, or 31% • Adjusted EPS of $0.39, up $0.09, or 30% • Orders of $304 M, up $5 M, or 2% • Backlog of $401 M, up $37 M, or 10% • Backlog up $14 M, or 4% vs. Q4 FY19 * Comparisons versus Q1 of 2019, unless otherwise noted 6

Group and Corporate Results $ millions, except % Q1 2020 Q1 2019 % Change ESG Orders 237.5 243.7 -3% Sales 233.0 219.5 6% Operating income 29.4 25.7 14% Operating margin 12.6% 11.7% Adjusted EBITDA 40.0 34.7 15% Adjusted EBITDA margin 17.2% 15.8% SSG Orders 66.4 55.3 20% Sales 53.1 54.3 -2% Operating income 7.4 8.7 -15% Operating margin 13.9% 16.0% Adjusted EBITDA 8.2 9.6 -15% Adjusted EBITDA margin 15.4% 17.7% Corporate expenses 4.5 8.6 -48% Consolidated Orders 303.9 299.0 2% Sales 286.1 273.8 4% Operating income 32.3 25.8 25% Operating margin 11.3% 9.4% Adjusted EBITDA 43.9 35.9 22% Adjusted EBITDA margin 15.3% 13.1% 7
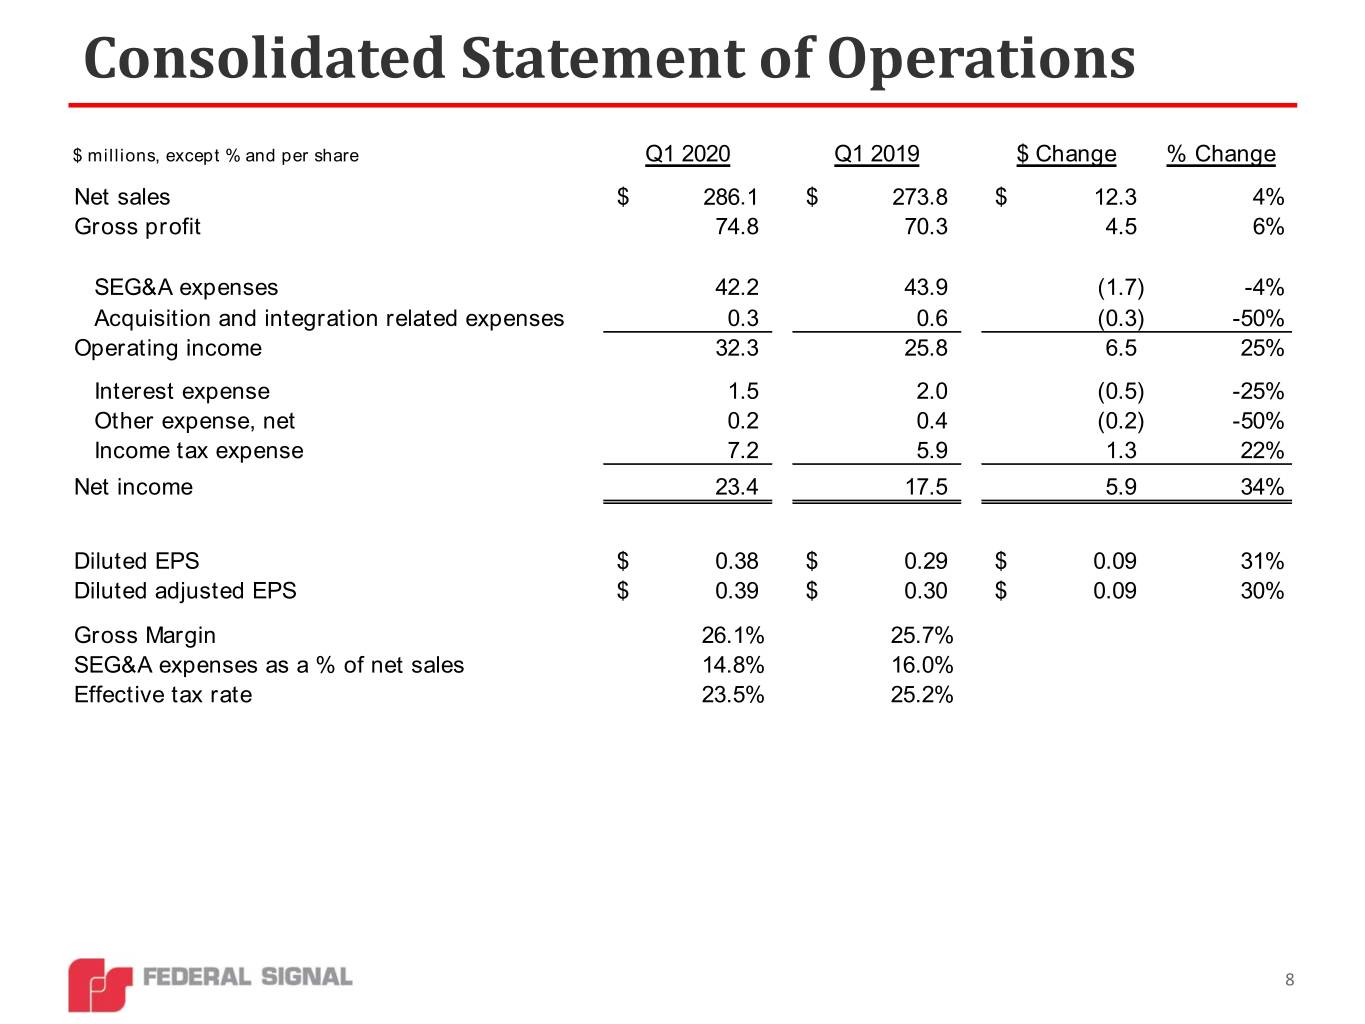
Consolidated Statement of Operations $ millions, except % and per share Q1 2020 Q1 2019 $ Change % Change Net sales $ 286.1 $ 273.8 $ 12.3 4% Gross profit 74.8 70.3 4.5 6% SEG&A expenses 42.2 43.9 (1.7) -4% Acquisition and integration related expenses 0.3 0.6 (0.3) -50% Operating income 32.3 25.8 6.5 25% Interest expense 1.5 2.0 (0.5) -25% Other expense, net 0.2 0.4 (0.2) -50% Income tax expense 7.2 5.9 1.3 22% Net income 23.4 17.5 5.9 34% Diluted EPS $ 0.38 $ 0.29 $ 0.09 31% Diluted adjusted EPS $ 0.39 $ 0.30 $ 0.09 30% Gross Margin 26.1% 25.7% SEG&A expenses as a % of net sales 14.8% 16.0% Effective tax rate 23.5% 25.2% 8

Adjusted Earnings per Share ($ in millions) Three Months Ended March 31, 2020 2019 Net income $ 23.4 $ 17.5 Add: Income tax expense 7.2 5.9 Income before income taxes 30.6 23.4 Add: Acquisition and integration-related expenses 0.3 0.6 Coronavirus-related expenses (1) 0.4 - Purchase accounting effects (2) 0.2 0.1 Adjusted income before income taxes 31.5 24.1 Adjusted income tax expense (3) (7.4) (6.0) Adjusted net income $ 24.1 $ 18.1 Diluted EPS $ 0.38 $ 0.29 Adjusted diluted EPS $ 0.39 $ 0.30 (1) Coronavirus-related expenses in the three months ended March 31, 2020 relate to direct expenses incurred in connection with the Company's response to the coronavirus pandemic, that are incremental to, and separable from, normal operations. (2) Purchase accounting effects relate to adjustments to exclude the step-up in the valuation of acquired JJE equipment that was sold subsequent to the acquisition in the three months ended March 31, 2020 and 2019, as well as to exclude the depreciation of the step-up in the valuation of the rental fleet acquired. (3) Adjusted income tax expense for the three months ended March 31, 2020 and 2019 was recomputed after excluding the impact of acquisition and integration-related expenses, coronavirus-related expenses and purchase accounting effects, where applicable. 9

Financial Strength and Flexibility * • Cash and cash equivalents of $69.4 M • $279 M of total debt outstanding • Net debt of ~$210 M ** Strong capital • In July 2019, we executed a five-year, $500 M revolving credit facility, with flexibility to structure increase by additional $250 M for acquisitions • No debt maturities until July 2024 • Net debt leverage remains at comfortable level, essentially unchanged from end of 2019 • Compliant with all covenants with significant headroom • Generated ~$5 M of cash from operations in Q1 this year, up $14 M from Q1 last year Healthy cash • Cash flow to date in April has met expectations, with no material change in customer flow and access delinquencies or bad debts to cash • ~$211 M of availability under revolving credit facility • Paid $4.8 M for dividends; recently declared $0.08 per share dividend for Q2 2020 Cash returns to • During Q1, obtained Board authorization to repurchase up to $75 M of additional shares; stockholders spent $13.5 M buying back ~491,000 shares • ~$91 M of repurchase authorization remaining under current programs (~5% of market cap) • To bolster cash position in the short-term, borrowed ~$64 M during Q1 Actions taken • Reducing discretionary capital expenditures, without deferring key ongoing initiatives (2020 to maintain capital expenditures expected to be ~$5 M lower than previous estimate) financial • Suspended additional share repurchases until further notice flexibility • Implemented measures to manage working capital • Deferring certain tax payments and pension contributions under CARES Act * Dollar amounts as of, or for the quarter ending 3/31/2020 ** Net debt is a non-GAAP measure and is computed as total debt of $278.9 M, less total cash and cash equivalents of $69.4 M 10
CEO Remarks – Current Environment • Q1 orders were strong, contributing to record backlog . Order intake at certain businesses so far in April has been slow • TBEI’s Q1 orders were the highest quarterly orders reported under our ownership, and were up ~$13 M, or 25%, from last year . However, orders to date in April have been impacted with certain customers unable to secure their chassis with OEMs shut down • Actions taken in response to lower rental fleet utilization during Q1, but continue to expect rentals to be key strategic initiative going forward • Maintaining regular contact with municipal dealer network and continuing to support them and end users who operate our equipment as providers of “essential” services 11

CEO Remarks - Remainder of 2020 • With the combination of M&A and organic growth initiatives, our end market exposures and revenues streams are now more diversified compared to prior economic downturns . Aftermarket revenues now represent ~24% of ESG’s revenues . NPD has facilitated addition of utility end market and expansion of SSG product offerings . Acquisitions have added new end markets • Current operational challenges impacting our productivity include: . Decrease in labor availability at several facilities in recent weeks . Supply chain disruption and delivery challenges . Adjusting production processes to comply with safe-distancing guidelines • Factors had limited impact in Q1; expected to have bigger impact in Q2 . Adjusted production schedules accordingly, but due to these factors, production at some of our businesses in Q2 may be down between 20%-40% vs. prior year • Taking steps to manage through challenges, including implementing contingency measures to reduce costs and manage capital prudently • Given ongoing uncertainty, we are withdrawing our adjusted EPS outlook for 2020; intend to provide further update on Q2 earnings call 12

Reclaiming Tomorrow, Together • Recently launched Reclaiming Tomorrow, Together initiative, representing four primary areas: . Improving digital customer experience . Focusing NPD efforts on ways to make our products and the way we conduct business safer for employees, customers and end users . Identifying opportunities to gain market share . Repositioning our equipment to clean and sanitize outdoor spaces • Visit www.fedsigresponse.com Federal Signal equipment being used to clean and Federal Signal equipment being used to clean and sanitize streets on “Skid Row”, Los Angeles, CA sanitize grocery carts 13

CEO Remarks - Closing Thoughts ▲ A limited number of diagnosed cases in our employee population ▲ Strong financial position – low net debt leverage and ample liquidity ▲ Healthy “essential” businesses that have to date remained largely operational and provide needed equipment ▲ Cash flow to date in April has met expectations, with no material change in customer delinquencies or bad debts ▲ Record backlog at end of Q1 ▲ Contingency plans have been invoked at certain businesses ▲ With diversification of revenue streams, end markets and product offerings, Federal Signal is a different, more stable and more diversified business than it was during prior downturns ▲ Established dealer network providing municipalities with essential services ▲ Expanded federal funding available to municipalities ▲ Most of our businesses would stand to benefit from an expected infrastructure bill ▲ Offensive strategy: Reclaiming Tomorrow, Together initiative ▲ M&A opportunities with potential for more reasonable valuation expectations ▼ Economic downturn/potential for restrictions to remain in place longer term prior to development of vaccine ▼ TBEI customer orders will be delayed given that customers cannot obtain chassis ▼ Reduced productivity at certain locations driven by various factors, including reduced labor availability, supply chain disruptions and customer delivery challenges ▼ Limited ability to perform on-site demos, a critical selling tool for our safe digging equipment ▼ Low oil and gas prices have impacted rental fleet utilization and replenishment sales ▼ Coronavirus restrictions have negatively impacted sales process in some of our businesses 14
Federal Signal Q1 2020 Earnings Call Q&A April 29, 2020 Jennifer Sherman, President & Chief Executive Officer Ian Hudson, SVP, Chief Financial Officer 15

Investor Information Stock Ticker - NYSE:FSS Company website: federalsignal.com/investors HEADQUARTERS 1415 West 22nd Street, Suite 1100 Oak Brook, IL 60523 INVESTOR RELATIONS CONTACTS 630-954-2000 Ian Hudson Svetlana Vinokur SVP, Chief Financial Officer VP, Treasurer and Corporate Development IHudson@federalsignal.com SVinokur@federalsignal.com 16

Federal Signal Q1 2020 Earnings Call Appendix 17
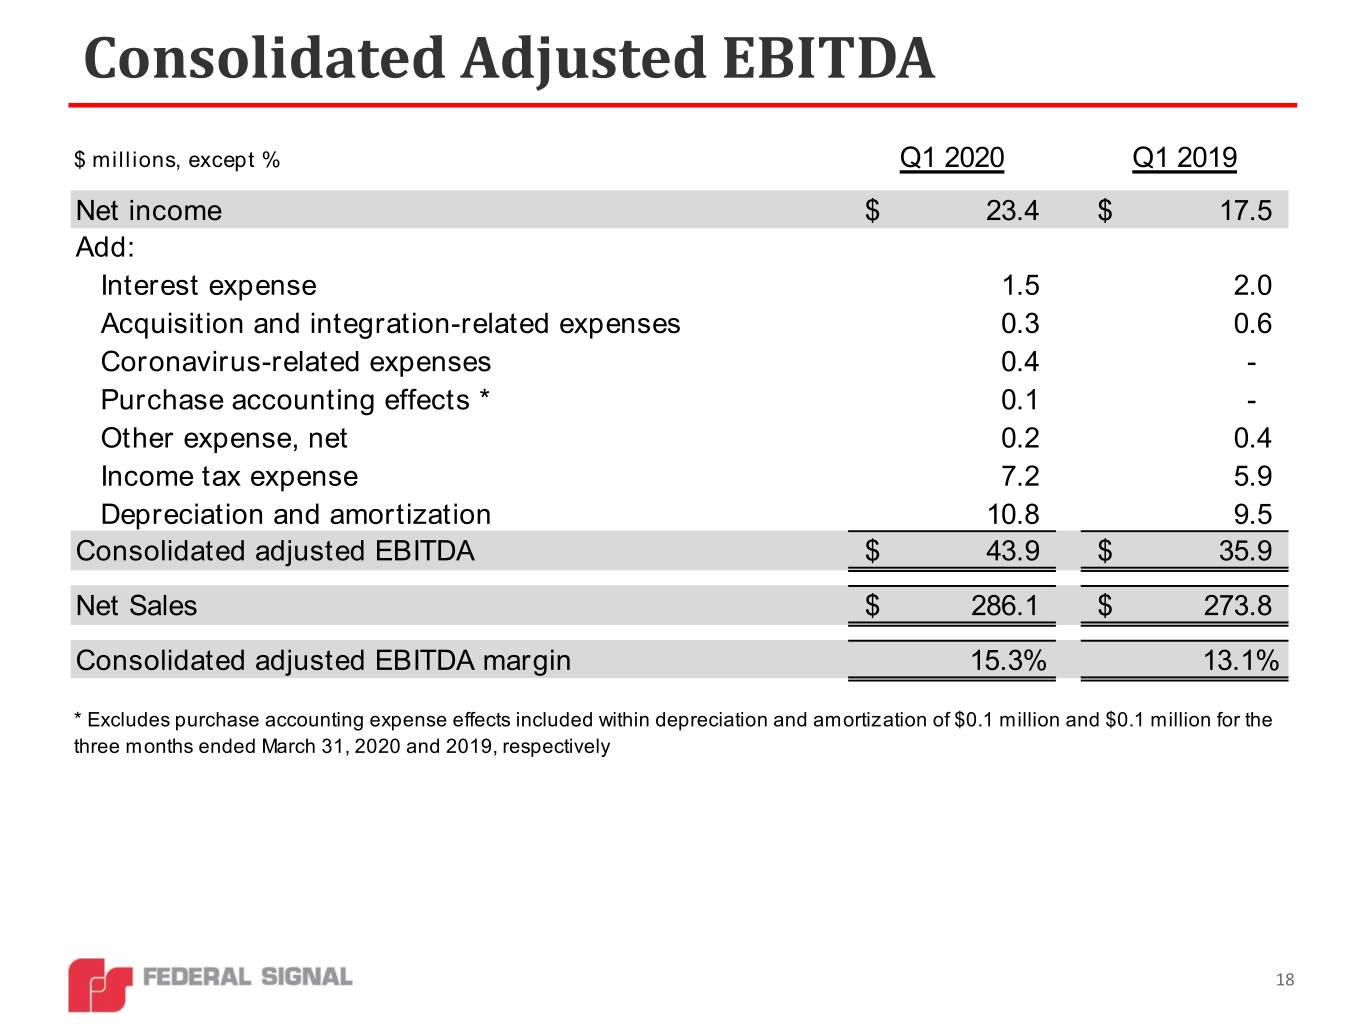
Consolidated Adjusted EBITDA $ millions, except % Q1 2020 Q1 2019 Net income $ 23.4 $ 17.5 Add: Interest expense 1.5 2.0 Acquisition and integration-related expenses 0.3 0.6 Coronavirus-related expenses 0.4 - Purchase accounting effects * 0.1 - Other expense, net 0.2 0.4 Income tax expense 7.2 5.9 Depreciation and amortization 10.8 9.5 Consolidated adjusted EBITDA $ 43.9 $ 35.9 Net Sales $ 286.1 $ 273.8 Consolidated adjusted EBITDA margin 15.3% 13.1% * Excludes purchase accounting expense effects included within depreciation and amortization of $0.1 million and $0.1 million for the three months ended March 31, 2020 and 2019, respectively 18
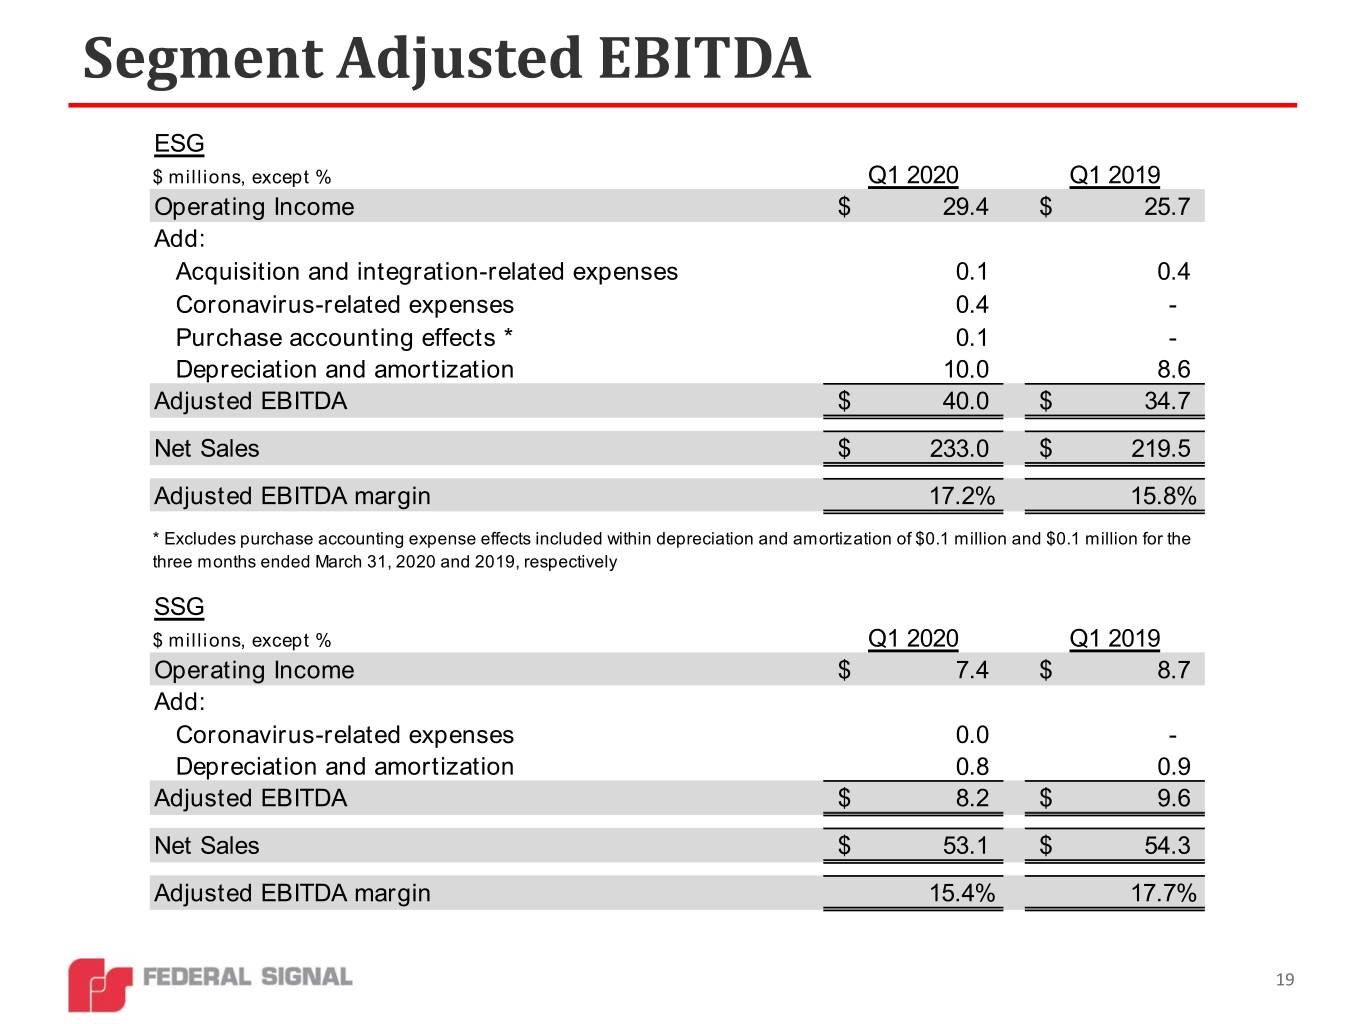
Segment Adjusted EBITDA ESG $ millions, except % Q1 2020 Q1 2019 Operating Income $ 29.4 $ 25.7 Add: Acquisition and integration-related expenses 0.1 0.4 Coronavirus-related expenses 0.4 - Purchase accounting effects * 0.1 - Depreciation and amortization 10.0 8.6 Adjusted EBITDA $ 40.0 $ 34.7 Net Sales $ 233.0 $ 219.5 Adjusted EBITDA margin 17.2% 15.8% * Excludes purchase accounting expense effects included within depreciation and amortization of $0.1 million and $0.1 million for the three months ended March 31, 2020 and 2019, respectively SSG $ millions, except % Q1 2020 Q1 2019 Operating Income $ 7.4 $ 8.7 Add: Coronavirus-related expenses 0.0 - Depreciation and amortization 0.8 0.9 Adjusted EBITDA $ 8.2 $ 9.6 Net Sales $ 53.1 $ 54.3 Adjusted EBITDA margin 15.4% 17.7% 19
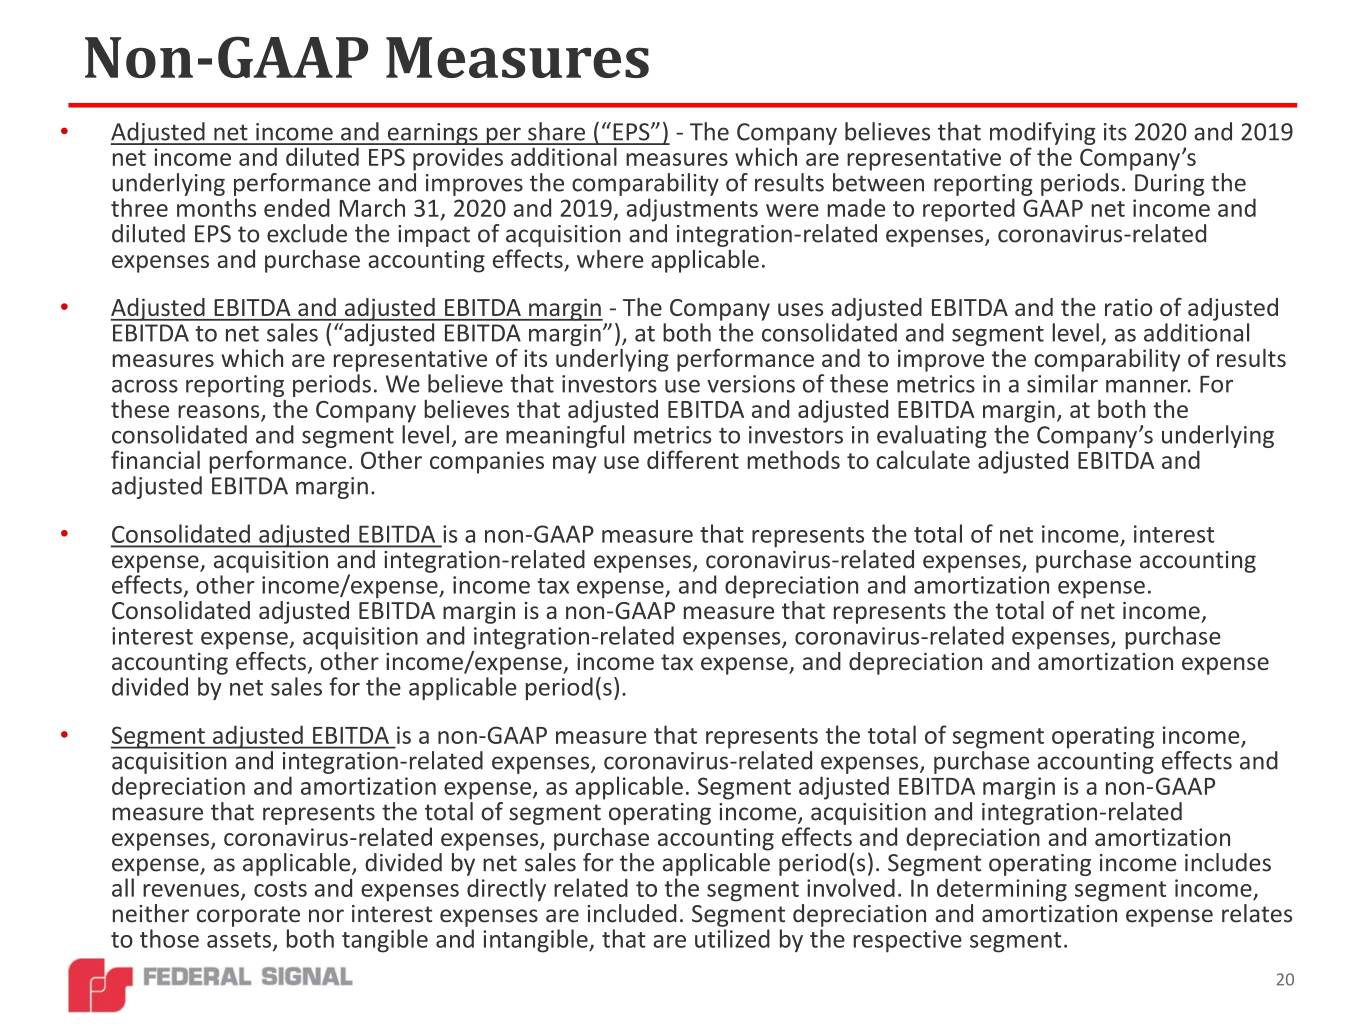
Non-GAAP Measures • Adjusted net income and earnings per share (“EPS”) - The Company believes that modifying its 2020 and 2019 net income and diluted EPS provides additional measures which are representative of the Company’s underlying performance and improves the comparability of results between reporting periods. During the three months ended March 31, 2020 and 2019, adjustments were made to reported GAAP net income and diluted EPS to exclude the impact of acquisition and integration-related expenses, coronavirus-related expenses and purchase accounting effects, where applicable. • Adjusted EBITDA and adjusted EBITDA margin - The Company uses adjusted EBITDA and the ratio of adjusted EBITDA to net sales (“adjusted EBITDA margin”), at both the consolidated and segment level, as additional measures which are representative of its underlying performance and to improve the comparability of results across reporting periods. We believe that investors use versions of these metrics in a similar manner. For these reasons, the Company believes that adjusted EBITDA and adjusted EBITDA margin, at both the consolidated and segment level, are meaningful metrics to investors in evaluating the Company’s underlying financial performance. Other companies may use different methods to calculate adjusted EBITDA and adjusted EBITDA margin. • Consolidated adjusted EBITDA is a non-GAAP measure that represents the total of net income, interest expense, acquisition and integration-related expenses, coronavirus-related expenses, purchase accounting effects, other income/expense, income tax expense, and depreciation and amortization expense. Consolidated adjusted EBITDA margin is a non-GAAP measure that represents the total of net income, interest expense, acquisition and integration-related expenses, coronavirus-related expenses, purchase accounting effects, other income/expense, income tax expense, and depreciation and amortization expense divided by net sales for the applicable period(s). • Segment adjusted EBITDA is a non-GAAP measure that represents the total of segment operating income, acquisition and integration-related expenses, coronavirus-related expenses, purchase accounting effects and depreciation and amortization expense, as applicable. Segment adjusted EBITDA margin is a non-GAAP measure that represents the total of segment operating income, acquisition and integration-related expenses, coronavirus-related expenses, purchase accounting effects and depreciation and amortization expense, as applicable, divided by net sales for the applicable period(s). Segment operating income includes all revenues, costs and expenses directly related to the segment involved. In determining segment income, neither corporate nor interest expenses are included. Segment depreciation and amortization expense relates to those assets, both tangible and intangible, that are utilized by the respective segment. 20

