Attached files
| file | filename |
|---|---|
| EX-99.2 - EXHIBIT 99.2 - SEACOAST BANKING CORP OF FLORIDA | sbcf1q2020earningspresen.htm |
| 8-K - 8-K - SEACOAST BANKING CORP OF FLORIDA | sbcf1q20208-k.htm |

Charles M. Shaffer
Executive Vice President
Chief Operating Officer and
Chief Financial Officer
(772) 221-7003
Chuck.Shaffer@seacoastbank.com
SEACOAST REPORTS FIRST QUARTER 2020 RESULTS
Record Mortgage Banking and Wealth Management Performance Highlight Q1 Results
Well Positioned Balance Sheet with Strong Capital and Liquidity
STUART, Fla., April 28, 2020 /GLOBE NEWSWIRE/ -- Seacoast Banking Corporation of Florida (“Seacoast” or the "Company”) (NASDAQ: SBCF) today reported net income in the first quarter of 2020 of $0.7 million, or $0.01 per diluted share, including $4.6 million in merger-related charges and provision for loan losses of $29.5 million. The net interest margin increased 9 basis points to 3.93%, the ratio of tangible common equity to tangible assets was 10.68% and Tier 1 capital was 15.5% at March 31, 2020.
Dennis S. Hudson, III, Seacoast’s Chairman and CEO, said, “Our results for the first quarter of 2020, as with all businesses, must be framed within the context of COVID-19 and its impact on our communities. Our priority in addressing the pandemic thus far has been to carefully adjust our operations to protect the health and welfare of our associates and customers while continuing to offer digital banking products and services that can be accessed anywhere.”
Hudson added, “With over 90 years’ experience in an area prone to hurricanes, Seacoast has a robust and well tested business continuity program that has rapidly mobilized our response to this crisis. We shifted branch operations to remain open by drive-thru or lobby appointment only, implemented enhanced cleaning protocols, and our operational teams are working remotely or in staggered shifts. As an SBA preferred lender, we are well-positioned to help our business customers access the Paycheck Protection Program (“PPP”). We processed over 1,600 loans, totaling over $388 million in the first round of the program. I am proud of our team's exceptional effort to support our communities through this unprecedented time.”
Charles M. Shaffer, Seacoast’s Chief Operating Officer and Chief Financial Officer, said, “In 2019, Seacoast delivered record financial performance, driven by our balanced growth strategy and emphasis on efficient operations. With extraordinary circumstances now facing all of us, we believe that we are well-positioned when compared to peers for the challenges that lie ahead. We enter this period from a position of strength, with our prior strategic initiatives resulting in a robust capital base, a diverse loan portfolio and a prudent liquidity position that should allow us to support our customers despite the uncertain environment. First quarter results include strong performance across multiple business lines, including record new asset acquisition in wealth management and maximizing market opportunities in mortgage banking. We will continue our commitment to maintaining a fortress balance sheet, demonstrating resilience while generating shareholder value over the long term.”
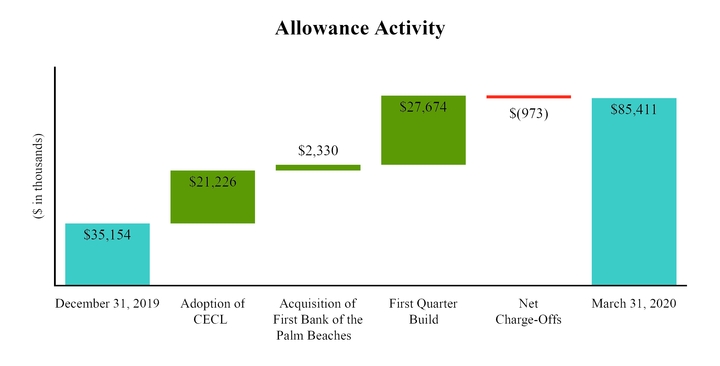
Adoption of CECL
On January 1, 2020, the Company adopted new accounting guidance that introduces the current expected credit losses (“CECL”) methodology for estimating allowances for credit losses. The adoption resulted in an increase to the allowance for credit losses on loans of $21.2 million and an addition to the reserve for unfunded commitments of $1.8 million. Under the accounting rules, adoption had no impact on the income statement and resulted in an adjustment to retained earnings, net of taxes, of $16.9 million. In March 2020, regulatory guidance was issued that allows banking organizations to delay the effects of CECL on regulatory capital calculations for two years, followed by a three-year transition period. As a result, initial adoption at January 1, 2020 had no impact on the Company’s regulatory capital ratios.
Acquisition of First Bank of the Palm Beaches
The purchase of First Bank of the Palm Beaches ("FBPB") in the first quarter of 2020 increases Seacoast’s market share as the #1 community bank in the attractive Palm Beach market. FBPB operated two branches, which have converted to Seacoast branches, with deposits of $174 million and loans of $147 million at the time of acquisition. The Company increased its allowance for credit losses at the time of acquisition by $2.3 million, recording provision for credit losses of $1.8 million. The remaining $0.5 million, which represents the allowance on purchased credit deteriorated loans, was recorded as part of the purchase price in accordance with the new CECL guidance.
First Quarter 2020 Financial Results
Income Statement
• | Net income was $0.7 million, or $0.01 per diluted share, compared to $27.2 million, or $0.52, for the prior quarter and $22.7 million, or $0.44, for the first quarter of 2019. Adjusted net income1 was $5.5 million, or $0.10 per diluted share, compared to $26.8 million, or $0.52, for the prior quarter and $24.2 million, or $0.47, for the first quarter of 2019. |
• | Net revenues were $77.9 million, a decrease of $0.3 million compared to the prior quarter, and an increase of $4.3 million, or 6%, compared to the first quarter of 2019. Adjusted revenues1 were $77.8 million, an increase of $2.2 million, or 3%, from the prior quarter and an increase of $4.2 million, or 6%, from the first quarter of 2019. |
• | Net interest income totaled $63.2 million, an increase of $1.4 million, or 2%, from the prior quarter and an increase of $2.4 million, or 4%, from the first quarter of 2019. |
• | Net interest margin was 3.93% in the first quarter of 2020, 3.84% in the fourth quarter of 2019 and 4.02% in the first quarter of 2019. Compared to the fourth quarter of 2019, the yield on loans increased 1 basis point due to an increase in accretion of purchase discounts on acquired loans offset by the impact of Federal Reserve rate cuts in March 2020. The effect on net interest margin from accretion of purchase discounts on acquired loans was 27 basis points in the first quarter of 2020, compared to 21 basis points in the fourth quarter of 2019 and 26 basis points in the first quarter of 2019. Excluding the impact of accretion, the net interest margin increased 3 basis points from the prior quarter and the yield on loans contracted 6 basis points. The 13 basis point increase in the yield on securities reflects prepayment penalties received on early payoffs of mortgage-backed securities. The cost of deposits decreased 4 basis points to 0.57%. The full benefit resulting from reductions in offered customer deposit rates was muted by strategic efforts to increase brokered deposit funding, bolstering the Company's liquidity, a prudent action arising from the current economic environment. |
• | Noninterest income totaled $14.7 million, a decrease of $1.7 million, or 10%, compared to the prior quarter and an increase of $1.9 million, or 14%, compared to the previous year. Results for the fourth quarter of 2019 included $2.5 million in realized gains on sales of securities. Other changes in noninterest income compared to the fourth quarter of 2019 consisted of the following: |
◦ | Mortgage banking fees increased $0.7 million to $2.2 million, reflecting a vibrant residential refinance market. |
◦ | Wealth management income increased by $0.3 million, or 18%, to a record $1.9 million, with an additional $44 million in new assets under management acquired in the first quarter of 2020. |
◦ | Other income increased $0.8 million on higher revenue from SBIC investments. |
◦ | SBA gains were lower by $0.4 million, the result of lower production of saleable SBA loans. |
• | The provision for credit losses was $29.5 million compared to $4.8 million in the prior quarter and $1.4 million in the first quarter of 2019. Under the CECL approach, the Company establishes a reserve for the full amount of expected credit losses over the life of the loans. The estimate is based on current conditions and reasonable and supportable forecasts. The use of CECL requires earlier recognition, when compared with the previous accounting guidance, of credit losses that are deemed expected but not yet probable. Given the uncertainty of the current economic environment, management applied significant judgment in estimating the impact on the portfolio of |
1Non-GAAP measure, see “Explanation of Certain Unaudited Non-GAAP Financial Measures" for more information and for a reconciliation to GAAP.
potential economic downturn scenarios, including the severity and duration of these scenarios and the potential impact of the government's economic support programs.
Noninterest expense was $47.8 million, an increase of $9.7 million, or 26%, compared to the prior quarter and an increase of $4.7 million, or 11%, from the first quarter of 2019. The first quarter of 2020 included $4.6 million in merger-related charges, including change in control payments, legal and investment banking fees, and technology contract termination fees associated with the FBPB and Fourth Street Banking Company acquisitions. Merger-related charges are removed from the presentation of adjusted results. Changes from the fourth quarter of 2019 consisted of the following:
◦ | Salaries, wages, and employee benefits increased $7.4 million, of which $2.2 million was acquisition- related. The remaining increase was the result of recruiting seasoned bankers, a return of payroll taxes and 401(k) contribution expenses, and the reactivation of incentive accruals, all in line with prior years' seasonality. Additionally, the first quarter included $0.3 million in bonuses for retail associates, who are keeping critical functions operating at full capacity through this pandemic. Lastly, deferred loan origination costs were impacted by $0.5 million, the result of fewer loans originated. |
◦ | Legal and professional fees increased $1.3 million, of which $1.1 million was acquisition-related. |
◦ | Marketing expenses increased by $0.4 million, reflecting acquisition-related costs of $0.1 million and first quarter 2020 deposit promotions. |
◦ | Data processing costs increased $1.0 million, including $0.8 million in merger-related data conversion expenses. |
◦ | The sale of a former branch property resulted in a $0.3 million gain. |
• | Seacoast recorded $0.2 million of income tax benefit in the first quarter of 2020, compared to tax expense of $8.1 million in the prior quarter and $6.4 million in the first quarter of 2019. Tax benefits related to stock-based compensation totaled $0.3 million in the first quarter of 2020, compared to $0.1 million in the fourth quarter of 2019 and $0.6 million in the first quarter of 2019. |
• | First quarter adjusted revenues1 increased 6% compared to prior year quarter while adjusted noninterest expense1 increased 1%, generating 5% operating leverage. |
• | The efficiency ratio was 59.8% compared to 48.4% in the prior quarter and 56.6% in the first quarter of 2019. The adjusted efficiency ratio1 was 53.6% compared to 47.5% in the preceding quarter, impacted by typical seasonality, and was 55.8% in the first quarter of 2019. |
Balance Sheet
• | At March 31, 2020, the Company had total assets of $7.4 billion and total shareholders' equity of $991.8 million. Book value per share was $18.82, and tangible book value per share was $14.42, compared to $19.13 and $14.76, respectively, at December 31, 2019 and $17.44 and $12.98, respectively, at March 31, 2019. Year-over-year, tangible book value per share increased by 11%. |
• | Debt securities totaled $1.2 billion at March 31, 2020, a decrease of $45.5 million compared to December 31, 2019 and a decrease of $10.4 million from March 31, 2019. |
• | Loans totaled $5.3 billion at March 31, 2020, an increase of $118.8 million, or 2%, compared to December 31, 2019, and an increase of $488.8 million, or 10%, from March 31, 2019. Excluding FBPB acquired loans, which were valued at $146.9 million, loans outstanding declined by $28.1 million, driven by a purposeful slowing of originations during the quarter as the impact of COVID-19 on our local economies became apparent. |
◦ | Seacoast began accepting applications from customers on Friday, April 3 for the Paycheck Protection Program ("PPP") established by the Coronavirus Aid, Relief and Economic Security Act (the "CARES Act"). In the first round of the program, Seacoast processed over 1,600 loans for its customers, totaling over $388 million. As an SBA preferred lender, the Company will continue its focus in helping small businesses access the program in the second quarter. |
1Non-GAAP measure, see “Explanation of Certain Unaudited Non-GAAP Financial Measures" for more information and for a reconciliation to GAAP.
◦ | New loan originations were $323.5 million in the first quarter of 2020, compared to $587.1 million in the fourth quarter of 2019 and $309.8 million in the first quarter of 2019. |
▪ | Commercial originations during the first quarter of 2020 were $183.3 million, compared to $304.3 million in the fourth quarter of 2019 and $186.0 million in the first quarter of 2019. |
▪ | Residential loan originations were $88.6 million in the first quarter of 2020, compared to $126.0 million in the fourth quarter of 2019 and $82.2 million in the first quarter of 2019. |
▪ | Consumer originations in the first quarter of 2020 were $51.5 million, compared to $57.7 million in the fourth quarter of 2019 and $41.6 million in the first quarter of 2019. |
• | Pipelines (loans in underwriting and approval or approved and not yet closed) totaled $287.3 million at March 31, 2020, with notable decreases in commercial and small business due to COVID-19 and the resulting economic impacts, offset by continued residential refinancing activity. Early in the second quarter of 2020, the Company's business bankers and operational resources have been focused on supporting borrowers with access to PPP program funds. |
◦ | Commercial pipelines were $171.1 million as of March 31, 2020, compared to $277.8 million as of the prior quarter end and $193.7 million as of March 31, 2019. The decline in pipeline quarter over quarter was the result of a more selective approach on new credits given the economic outlook associated with COVID-19. |
◦ | Residential saleable pipelines were $75.2 million as of March 31, 2020 compared to $19.0 million as of the prior quarter end and $25.9 million as of March 31, 2019. The increase reflects the impact of a vibrant refinance market. |
◦ | Retained residential pipelines were $11.8 million as of March 31, 2020, compared to $19.1 million as of the prior quarter end and $19.3 million as of March 31, 2019. The decrease is the result of the Company's focus on generating saleable production. |
◦ | Consumer pipelines were $29.1 million as of March 31, 2020, compared to $23.3 million as of the prior quarter end and $51.3 million as of March 31, 2019. |
• | Total deposits were $5.9 billion as of March 31, 2020, an increase of $302.7 million, or 5%, sequentially and an increase of $281.9 million, or 5%, from the prior year. |
◦ | The acquisition of FBPB contributed $174 million in deposits. |
◦ | The overall cost of deposits declined to 57 basis points in the first quarter of 2020 from 61 basis points in the prior quarter, reflecting the impact of rate cuts by the Federal Reserve during the first quarter of 2020, moderated by the strategic use of brokered deposits to bolster liquidity. |
◦ | Total transaction accounts increased 6% quarter-over-quarter, including $72.1 million acquired from FBPB. Transaction accounts continue to represent 50% of overall deposit funding. |
◦ | Interest-bearing deposits (interest-bearing demand, savings and money market deposits) increased year-over-year $112.5 million, or 4%, to $2.9 billion, noninterest-bearing demand deposits increased $27.6 million, or 2%, to $1.7 billion, and CDs (excluding brokered) decreased $88.1 million, or 12%, to $672.7 million. |
Asset Quality
• | Seacoast is supporting the needs of its communities with access to payment deferral programs for borrowers experiencing financial hardship. As of April 22, 2020, approximately 2,500 borrowers with $1 billion in outstanding balances were participating in a payment deferral plan. Our bankers are taking proactive steps to assist our borrowers in evaluating their circumstances, planning for cash needs, and identifying CARES Act and other programs that can provide further support in these uncertain times. Our relationship-based approach, with bankers that are deeply knowledgeable about their customers and communities, will continue to provide valuable information and insight as we carefully manage credit decisions in the coming months. |
1Non-GAAP measure, see “Explanation of Certain Unaudited Non-GAAP Financial Measures" for more information and for a reconciliation to GAAP.
• | Nonperforming loans to total loans outstanding were 0.48% at March 31, 2020, 0.52% at December 31, 2019, and 0.46% at March 31, 2019. |
• | Nonperforming assets to total assets were 0.55% at March 31, 2020, 0.55% at December 31, 2019 and 0.51% at March 31, 2019. Activity in other real estate owned included a $5.5 million loan transferred in, offset by the sale of a $3.3 million former branch property. |
• | The ratio of allowance for credit losses to total loans was 1.61% at March 31, 2020, 0.68% at December 31, 2019, and 0.68% at March 31, 2019. |
• | Net charge-offs were $1.0 million, or 0.07%, of average loans for the first quarter of 2020 compared to $3.2 million, or 0.25%, of average loans in the fourth quarter of 2019 and $1.0 million, or 0.08% of average loans in the first quarter of 2019. Net charge-offs for the four most recent quarters averaged 0.16%. |
• | Portfolio diversification, in terms of asset mix, industry, and loan type, has been a critical element of the Company's lending strategy. Exposure across industries and collateral types is broadly distributed. |
• | The Company does not have any purchased loan syndications, shared national credits, or mezzanine finance. |
• | Since the outbreak of COVID-19, the Company has not experienced any material increase in consumer or commercial line utilization. |
• | The funded balances of the top 10 and top 20 relationships represented 20% and 37%, respectively, of total consolidated risk-based capital, a decrease compared to 27% and 46% three years ago, in the first quarter of 2017. Seacoast's average commercial loan size is $375,000. |
• | Construction and land development and commercial real estate loans remain well below regulatory guidance at 35% and 193% of total bank-level risk based capital, respectively, compared to 40% and 204% respectively, in the fourth quarter of 2019. On a consolidated basis, construction and land development and commercial real estate loans represent 32% and 181%, respectively, of total consolidated risk-based capital. |
Capital and Liquidity
• | The tier 1 capital ratio was 15.5%, total capital ratio was 16.5% and the tier 1 leverage ratio was 12.4% at March 31, 2020 |
• | Tangible common equity to tangible assets was 10.7% at March 31, 2020, compared to 11.1% at December 31, 2019 and 10.18% at March 31, 2019. |
• | Cash and cash equivalents at March 31, 2020 totaled $314.9 million, an increase of $190.3 million from December 31, 2019. |
• | At March 31, 2020, the Company had available unsecured lines of credit of $160.0 million and lines of credit under lendable collateral value of $1.2 billion. $851.5 million of debt securities and $830.0 million in residential and commercial real estate loans are available as collateral for potential borrowings. |
1Non-GAAP measure, see “Explanation of Certain Unaudited Non-GAAP Financial Measures" for more information and for a reconciliation to GAAP.
FINANCIAL HIGHLIGHTS | ||||||||||||||||||||
(Amounts in thousands except per share data) | (Unaudited) | |||||||||||||||||||
Quarterly Trends | ||||||||||||||||||||
1Q'20 | 4Q'19 | 3Q'19 | 2Q'19 | 1Q'19 | ||||||||||||||||
Selected Balance Sheet Data: | ||||||||||||||||||||
Total Assets | $ | 7,352,894 | $ | 7,108,511 | $ | 6,890,645 | $ | 6,824,886 | $ | 6,783,389 | ||||||||||
Gross Loans | 5,317,208 | 5,198,404 | 4,986,289 | 4,888,139 | 4,828,441 | |||||||||||||||
Total Deposits | 5,887,499 | 5,584,753 | 5,673,141 | 5,541,209 | 5,605,578 | |||||||||||||||
Performance Measures: | ||||||||||||||||||||
Net Income | $ | 709 | $ | 27,176 | $ | 25,605 | $ | 23,253 | $ | 22,705 | ||||||||||
Net Interest Margin | 3.93 | % | 3.84 | % | 3.89 | % | 3.94 | % | 4.02 | % | ||||||||||
Average Diluted Shares Outstanding | 52,284 | 52,081 | 51,935 | 51,952 | 52,039 | |||||||||||||||
Diluted Earnings Per Share (EPS) | $ | 0.01 | $ | 0.52 | $ | 0.49 | $ | 0.45 | $ | 0.44 | ||||||||||
Return on (annualized): | ||||||||||||||||||||
Average Assets (ROA) | 0.04 | % | 1.54 | % | 1.49 | % | 1.38 | % | 1.36 | % | ||||||||||
Average Tangible Assets (ROTA) | 0.11 | 1.66 | 1.61 | 1.50 | 1.48 | |||||||||||||||
Average Tangible Common Equity (ROTCE) | 0.95 | 14.95 | 14.73 | 14.30 | 14.86 | |||||||||||||||
Efficiency Ratio | 59.85 | 48.36 | 48.62 | 53.48 | 56.55 | |||||||||||||||
Adjusted Operating Measures1: | ||||||||||||||||||||
Adjusted Net Income | $ | 5,462 | $ | 26,837 | $ | 27,731 | $ | 25,818 | $ | 24,205 | ||||||||||
Adjusted Diluted EPS | 0.10 | 0.52 | 0.53 | 0.50 | 0.47 | |||||||||||||||
Adjusted ROTA | 0.32 | % | 1.57 | % | 1.67 | % | 1.59 | % | 1.50 | % | ||||||||||
Adjusted ROTCE | 2.86 | 14.19 | 15.30 | 15.17 | 15.11 | |||||||||||||||
Adjusted Efficiency Ratio | 53.61 | 47.52 | 48.96 | 51.44 | 55.81 | |||||||||||||||
Adjusted Noninterest Expense as a Percent of Average Tangible Assets | 2.44 | 2.11 | 2.22 | 2.34 | 2.55 | |||||||||||||||
Other Data: | ||||||||||||||||||||
Market capitalization2 | $ | 965,097 | $ | 1,574,775 | $ | 1,303,010 | $ | 1,309,158 | $ | 1,354,759 | ||||||||||
Full-time equivalent employees | 919 | 867 | 867 | 852 | 902 | |||||||||||||||
Number of ATMs | 76 | 78 | 80 | 81 | 84 | |||||||||||||||
Full-service banking offices | 50 | 48 | 48 | 49 | 50 | |||||||||||||||
Registered online users | 113,598 | 109,684 | 107,241 | 104,017 | 102,274 | |||||||||||||||
Registered mobile devices | 104,108 | 99,361 | 96,384 | 92,281 | 87,844 | |||||||||||||||
1Non-GAAP measure, see “Explanation of Certain Unaudited Non-GAAP Financial Measures" for more information and a reconciliation to GAAP | ||||||||||||||||||||
2Common shares outstanding multiplied by closing bid price on last day of each period | ||||||||||||||||||||
Vision 2020
Prior to the emergence of COVID-19, Seacoast was on track to achieve its announced Vision 2020 performance targets exiting 2020, which included an efficiency ratio below 50%, return on tangible assets above 1.30%, and a return on tangible common equity above 16%. Changes in the outlook for the economy as a result of COVID-19 will affect achievement of these targets, though it is difficult to predict to what extent. The Company intends to continue to carefully manage operating efficiency, maintain prudent credit oversight and a robust capital position. Although the business and economic impacts of COVID-19 present obvious challenges to Seacoast's operating environment, the Company is confident that its established conservative posture entering this uncertain period should serve it well.
First Quarter Operating Highlights
Modernizing How Seacoast Sells
• | During the first quarter of 2020, Seacoast introduced digital closing and notarization capabilities for residential mortgages. This technology allows the borrower, closing agent, loan officer, witnesses and a notary public to digitally participate in the electronic signing of all mortgage documents, enabling secure and fully remote loan closings. This technology has allowed remote loan closings to occur despite the stay-at-home orders that have been issued across our footprint. |
• | Seacoast's continuous focus on and recent investments in operational resilience have provided a reliable experience for customers. Utilization of remote capabilities, web-enabled conferencing and digital tools ensure associates can serve their clients safely and effectively. |
Lowering Cost to Serve
• | At March 31, 2020, deposits per banking center were $118 million, compared to $116 million at December 31, 2019 and $112 million at March 31, 2019. |
• | Registered online users have increased by 11% from one year ago, with the number of registered mobile devices in March exceeding 100,000. Customers are seeking the convenient security of mobile banking. Since the beginning of the pandemic, online logins have increased by 42%, visits to the Seacoast website increased 47%, and customer requests made through the website increased more than 200%. |
Driving Improvements to Operations
• | During the first quarter of 2020, Seacoast completed projects to improve the speed and quality of the items processing workflow and scale its source document archiving capabilities through outsourcing, while redeploying associates to other projects. |
• | In response to heightened call volumes in the call center, Seacoast installed a virtual assistant that is allowing customers to chat with an automated response unit to resolve everyday banking needs such as checking balances or payments. This technology will be useful in lowering the cost to serve customers in future periods. |
Scaling and Evolving Seacoast's Culture
• | Seacoast's balanced growth strategy, combining organic growth with value-creating acquisitions, continues to benefit shareholders and provide new opportunities for associates. The purchase of FBPB in the first quarter of 2020 added experienced bankers in a growing market, further supporting sustainable, profitable growth. The acquisition increases Seacoast’s market share as the #1 community bank in the attractive Palm Beach market, bringing the combined company to over $821 million in total deposits in Palm Beach County. |
• | The proposed acquisition of Fourth Street Banking Company, the holding company for Freedom Bank of St. Petersburg, is expected to be completed in August 2020, with the COVID-19 pandemic prompting a delay from the anticipated June closing. |
1Non-GAAP measure, see “Explanation of Certain Unaudited Non-GAAP Financial Measures" for more information and for a reconciliation to GAAP.
OTHER INFORMATION
Conference Call Information
Seacoast will host a conference call on April 29, 2020 at 10:00 a.m. (Eastern Time) to discuss the first quarter 2020 earnings results and business trends. Investors may call in (toll-free) by dialing (888) 517-2513 (passcode: 7733 193; host: Dennis S. Hudson). Charts will be used during the conference call and may be accessed at Seacoast's website at www.SeacoastBanking.com by selecting "Presentations" under the heading "News/Events." A replay of the call will be available for one month, beginning late afternoon of April 29, 2020 by dialing (888) 843-7419 (domestic) and using passcode: 7733 193#.
Alternatively, individuals may listen to the live webcast of the presentation by visiting Seacoast's website at www.SeacoastBanking.com. The link is located in the subsection "Presentations" under the heading "Investor Services." Beginning the afternoon of April 29, 2020, an archived version of the webcast can be accessed from this same subsection of the website. The archived webcast will be available for one year.
About Seacoast Banking Corporation of Florida (NASDAQ: SBCF)
Seacoast Banking Corporation of Florida is one of the largest community banks headquartered in Florida with approximately $7.4 billion in assets and $5.9 billion in deposits as of March 31, 2020. The Company provides integrated financial services including commercial and retail banking, wealth management, and mortgage services to customers through advanced banking solutions, and 50 traditional branches of its locally-branded, wholly-owned subsidiary bank, Seacoast Bank. Offices stretch from Fort Lauderdale, Boca Raton and West Palm Beach north through the Daytona Beach area, into Orlando and Central Florida and the adjacent Tampa market, and west to Okeechobee and surrounding counties. More information about the Company is available at www.SeacoastBanking.com.
Additional Information
Seacoast has filed a registration statement on Form S-4 with the United States Securities and Exchange Commission (the “SEC”) in connection with the proposed merger of Fourth Street Banking Company (“Fourth Street”) with and into Seacoast and Freedom Bank with and into Seacoast Bank. The registration statement in connection with the Fourth Street merger includes a proxy statement of Fourth Street and a prospectus of Seacoast. A definitive proxy statement/prospectus will be mailed to shareholders of Fourth Street. This communication does not constitute an offer to sell or the solicitation of an offer to buy any securities or a solicitation of any vote or approval. WE URGE INVESTORS TO READ THE PROXY STATEMENTS/PROSPECTUSES AND ANY OTHER DOCUMENTS TO BE FILED WITH THE SEC IN CONNECTION WITH THE MERGERS OR INCORPORATED BY REFERENCE IN THE PROXY STATEMENTS/PROSPECTUSES BECAUSE THEY WILL CONTAIN IMPORTANT INFORMATION.
Investors may obtain (when available) these documents free of charge at the SEC’s Web site (www.sec.gov). In addition, documents filed with the SEC by Seacoast will be available free of charge by contacting Investor Relations at (772) 288-6085.
Fourth Street, its directors, and executive officers and other members of management and employees may be considered participants in the solicitation of proxies in connection with the merger of the proposed merger of Fourth Street with and into Seacoast. Information regarding the participants in the proxy solicitation of Fourth Street and a description of its direct and indirect interests, by security holdings or otherwise, is contained in the proxy statement/prospectus and other relevant materials to be filed with the SEC.
Cautionary Notice Regarding Forward-Looking Statements
This press release contains "forward-looking statements" within the meaning, and protections, of Section 27A of the Securities Act of 1933 and Section 21E of the Securities Exchange Act of 1934, including, without limitation, statements about future financial and operating results, cost savings, enhanced revenues, economic and seasonal conditions in our markets, and improvements to reported earnings that may be realized from cost controls, tax law changes, new initiatives and for integration of banks that we have acquired, or expect to acquire, including FBPB, as well as statements with respect to Seacoast's objectives, strategic plans, including Vision 2020, expectations and intentions and other statements that are not historical facts, any of which may be impacted by the COVID-19 pandemic and related effects on the U.S. economy. Actual results may differ from those set forth in the forward-looking statements.
Forward-looking statements include statements with respect to our beliefs, plans, objectives, goals, expectations, anticipations, assumptions, estimates and intentions about future performance and involve known and unknown risks, uncertainties and other factors, which may be beyond our control, and which may cause the actual results, performance or achievements of Seacoast to be materially different from future results, performance or achievements expressed or implied by such forward-looking statements. You should not expect us to update any forward-looking statements.
All statements other than statements of historical fact could be forward-looking statements. You can identify these forward-looking statements through our use of words such as "may", "will", "anticipate", "assume", "should", "support", "indicate", "would", "believe", "contemplate", "expect", "estimate", "continue", "further", "plan", "point to", "project", "could", "intend", "target" or other similar words and expressions of the future. These forward-looking statements may not be realized due to a variety of factors, including, without limitation: the effects of future economic and market conditions, including seasonality and the adverse impact of COVID-19 (economic and otherwise); governmental monetary and fiscal policies, including interest rate policies of the Board of Governors of the Federal Reserve, as well as legislative, tax and regulatory changes; changes in accounting policies, rules and practices, including the impact of the adoption of CECL; the risks of changes in interest rates on the level and composition of deposits, loan demand, liquidity and the values of loan collateral, securities, and interest sensitive assets and liabilities; interest rate risks, sensitivities and the shape of the yield curve; uncertainty related to the impact of LIBOR calculations on securities and loans; changes in borrower credit risks and payment behaviors; changes in the availability and cost of credit and capital in the financial markets; changes in the prices, values and sales volumes of residential and commercial real estate; our ability to comply with any regulatory requirements; the effects of problems encountered by other financial institutions that adversely affect us or the banking industry; our concentration in commercial real estate loans; the failure of assumptions and estimates, as well as differences in, and changes to, economic, market and credit conditions; the impact on the valuation of our investments due to market volatility or counterparty payment risk; statutory and regulatory dividend restrictions; increases in regulatory capital requirements for banking organizations generally; the risks of mergers, acquisitions and divestitures, including our ability to continue to identify acquisition targets and successfully acquire desirable financial institutions; changes in technology or products that may be more difficult, costly, or less effective than anticipated; our ability to identify and address increased cybersecurity risks; inability of our risk management framework to manage risks associated with our business; dependence on key suppliers or vendors to obtain equipment or services for our business on acceptable terms; reduction in or the termination of our ability to use the mobile-based platform that is critical to our business growth strategy; the effects of war or other conflicts, acts of terrorism, natural disasters, health emergencies, epidemics or pandemics, or other catastrophic events that may affect general economic conditions; unexpected outcomes of and the costs associated with, existing or new litigation involving us; our ability to maintain adequate internal controls over financial reporting; potential claims, damages, penalties, fines and reputational damage resulting from pending or future litigation, regulatory proceedings and enforcement actions; the risks that our deferred tax assets could be reduced if estimates of future taxable income from our operations and tax planning strategies are less than currently estimated and sales of our capital stock could trigger a reduction in the amount of net operating loss carryforwards that we may be able to utilize for income tax purposes; the effects of competition from other commercial banks, thrifts, mortgage banking firms, consumer finance companies, credit unions, securities brokerage firms, insurance companies, money market and other mutual funds and other financial institutions operating in our market areas and elsewhere, including institutions operating regionally, nationally and internationally, together with such competitors offering banking products and services by mail, telephone, computer and the Internet; and the failure of assumptions underlying the establishment of reserves for possible loan losses.
The risks relating to the FBPB merger and Fourth Street proposed merger include, without limitation: the timing to consummate the proposed merger; the risk that a condition to closing of the proposed merger may not be satisfied; the risk that the merger is not completed at all; the diversion of management time on issues related to the proposed merger; unexpected transaction costs, including the costs of integrating operations; the risks that the businesses will not be integrated successfully or that such integration may be more difficult, time- consuming or costly than expected; the potential failure to fully or timely realize expected revenues and revenue synergies, including as the result of revenues following the mergers being lower than expected; the risk of deposit and customer attrition; any changes in deposit mix; unexpected operating and other costs, which may differ or change from expectations; the risks of customer and employee loss and business disruptions, including, without limitation, as the result of difficulties in maintaining relationships with employees; increased competitive pressures and solicitations of customers by competitors; as well as the difficulties and risks inherent with entering new markets.
Given the many unknowns and risks being heavily weighted to the downside, our forward-looking statements are subject to the risk that conditions will be substantially different than we are currently expecting. If efforts to contain COVID-19 are unsuccessful and restrictions on movement last into the third quarter or beyond, the recession would be much longer and much more severe. Ineffective fiscal stimulus, or an extended delay in implementing it, are also major downside risks. The deeper the recession is, and the longer it lasts, the more it will damage consumer fundamentals and sentiment. This could both prolong the recession, and/or make any recovery weaker. Similarly, the recession could damage business fundamentals. And an extended global recession due to COVID-19 would weaken the U.S. recovery. As a result, the outbreak and its consequences, including responsive measures to manage it, have had and are likely to continue to have an adverse effect, possibly materially, on our business and financial performance by adversely affecting, possibly materially, the demand and profitability of our products and services, the valuation of assets and our ability to meet the needs of our customers.
All written or oral forward-looking statements attributable to us are expressly qualified in their entirety by this cautionary notice, including, without limitation, those risks and uncertainties described in our annual report on Form 10-K for the year ended December 31, 2019, under "Special Cautionary Notice Regarding Forward-looking Statements" and "Risk Factors", and otherwise in our SEC reports and filings. Such reports are available upon request from the Company, or from the Securities and Exchange Commission, including through the SEC's Internet website at www.sec.gov.
FINANCIAL HIGHLIGHTS | (Unaudited) | |||||||||||||||||||
SEACOAST BANKING CORPORATION OF FLORIDA AND SUBSIDIARIES | ||||||||||||||||||||
Quarterly Trends | ||||||||||||||||||||
(Amounts in thousands, except ratios and per share data) | 1Q'20 | 4Q'19 | 3Q'19 | 2Q'19 | 1Q'19 | |||||||||||||||
Summary of Earnings | ||||||||||||||||||||
Net income | $ | 709 | $ | 27,176 | $ | 25,605 | $ | 23,253 | $ | 22,705 | ||||||||||
Adjusted net income1 | 5,462 | 26,837 | 27,731 | 25,818 | 24,205 | |||||||||||||||
Net interest income2 | 63,291 | 61,846 | 61,027 | 60,219 | 60,861 | |||||||||||||||
Net interest margin2,3 | 3.93 | % | 3.84 | % | 3.89 | % | 3.94 | % | 4.02 | % | ||||||||||
Performance Ratios | ||||||||||||||||||||
Return on average assets-GAAP basis3 | 0.04 | % | 1.54 | % | 1.49 | % | 1.38 | % | 1.36 | % | ||||||||||
Return on average tangible assets-GAAP basis3,4 | 0.11 | 1.66 | 1.61 | 1.50 | 1.48 | |||||||||||||||
Adjusted return on average tangible assets1,3,4 | 0.32 | 1.57 | 1.67 | 1.59 | 1.50 | |||||||||||||||
Return on average shareholders' equity-GAAP basis3 | 0.29 | 11.04 | 10.73 | 10.23 | 10.47 | |||||||||||||||
Return on average tangible common equity-GAAP basis3,4 | 0.95 | 14.95 | 14.73 | 14.30 | 14.86 | |||||||||||||||
Adjusted return on average tangible common equity1,3,4 | 2.86 | 14.19 | 15.30 | 15.17 | 15.11 | |||||||||||||||
Efficiency ratio5 | 59.85 | 48.36 | 48.62 | 53.48 | 56.55 | |||||||||||||||
Adjusted efficiency ratio1 | 53.61 | 47.52 | 48.96 | 51.44 | 55.81 | |||||||||||||||
Noninterest income to total revenue (excluding securities gains/losses) | 18.84 | 18.30 | 19.53 | 18.93 | 17.45 | |||||||||||||||
Tangible common equity to tangible assets4 | 10.68 | 11.05 | 11.05 | 10.65 | 10.18 | |||||||||||||||
Average loan-to-deposit ratio | 93.02 | 90.71 | 88.35 | 87.27 | 90.55 | |||||||||||||||
End of period loan-to-deposit ratio | 90.81 | 93.44 | 88.36 | 88.53 | 86.38 | |||||||||||||||
Per Share Data | ||||||||||||||||||||
Net income diluted-GAAP basis | $ | 0.01 | $ | 0.52 | $ | 0.49 | $ | 0.45 | $ | 0.44 | ||||||||||
Net income basic-GAAP basis | 0.01 | 0.53 | 0.50 | 0.45 | 0.44 | |||||||||||||||
Adjusted earnings1 | 0.10 | 0.52 | 0.53 | 0.50 | 0.47 | |||||||||||||||
Book value per share common | 18.82 | 19.13 | 18.70 | 18.08 | 17.44 | |||||||||||||||
Tangible book value per share | 14.42 | 14.76 | 14.30 | 13.65 | 12.98 | |||||||||||||||
Cash dividends declared | — | — | — | — | — | |||||||||||||||
1Non-GAAP measure - see "Explanation of Certain Unaudited Non-GAAP Financial Measures" for more information and a reconciliation to GAAP. | ||||||||||||||||||||
2Calculated on a fully taxable equivalent basis using amortized cost. | ||||||||||||||||||||
3These ratios are stated on an annualized basis and are not necessarily indicative of future periods. | ||||||||||||||||||||
4The Company defines tangible assets as total assets less intangible assets, and tangible common equity as total shareholders' equity less intangible assets. | ||||||||||||||||||||
5Defined as noninterest expense less amortization of intangibles and gains, losses, and expenses on foreclosed properties divided by net operating revenue (net interest income on a fully taxable equivalent basis plus noninterest income excluding securities gains and losses). | ||||||||||||||||||||
CONDENSED CONSOLIDATED STATEMENTS OF INCOME | (Unaudited) | ||||||||||||||||||
SEACOAST BANKING CORPORATION OF FLORIDA AND SUBSIDIARIES | |||||||||||||||||||
Quarterly Trends | |||||||||||||||||||
(Amounts in thousands, except per share data) | 1Q'20 | 4Q'19 | 3Q'19 | 2Q'19 | 1Q'19 | ||||||||||||||
Interest on securities: | |||||||||||||||||||
Taxable | $ | 8,696 | $ | 8,500 | $ | 8,802 | $ | 8,933 | $ | 9,119 | |||||||||
Nontaxable | 122 | 130 | 131 | 143 | 151 | ||||||||||||||
Interest and fees on loans | 63,440 | 62,868 | 63,092 | 62,288 | 62,287 | ||||||||||||||
Interest on federal funds sold and other investments | 734 | 788 | 800 | 873 | 918 | ||||||||||||||
Total Interest Income | 72,992 | 72,286 | 72,825 | 72,237 | 72,475 | ||||||||||||||
Interest on deposits | 3,190 | 3,589 | 4,334 | 4,825 | 3,873 | ||||||||||||||
Interest on time certificates | 4,768 | 5,084 | 6,009 | 5,724 | 4,959 | ||||||||||||||
Interest on borrowed money | 1,857 | 1,853 | 1,534 | 1,552 | 2,869 | ||||||||||||||
Total Interest Expense | 9,815 | 10,526 | 11,877 | 12,101 | 11,701 | ||||||||||||||
Net Interest Income | 63,177 | 61,760 | 60,948 | 60,136 | 60,774 | ||||||||||||||
Provision for credit losses | 29,513 | 4,800 | 2,251 | 2,551 | 1,397 | ||||||||||||||
Net Interest Income After Provision for Credit Losses | 33,664 | 56,960 | 58,697 | 57,585 | 59,377 | ||||||||||||||
Noninterest income: | |||||||||||||||||||
Service charges on deposit accounts | 2,825 | 2,960 | 2,978 | 2,894 | 2,697 | ||||||||||||||
Interchange income | 3,246 | 3,387 | 3,206 | 3,405 | 3,401 | ||||||||||||||
Wealth management income | 1,867 | 1,579 | 1,632 | 1,688 | 1,453 | ||||||||||||||
Mortgage banking fees | 2,208 | 1,514 | 2,127 | 1,734 | 1,115 | ||||||||||||||
Marine finance fees | 146 | 338 | 153 | 201 | 362 | ||||||||||||||
SBA gains | 139 | 576 | 569 | 691 | 636 | ||||||||||||||
BOLI income | 886 | 904 | 928 | 927 | 915 | ||||||||||||||
Other | 3,352 | 2,579 | 3,197 | 2,503 | 2,266 | ||||||||||||||
14,669 | 13,837 | 14,790 | 14,043 | 12,845 | |||||||||||||||
Securities gains (losses), net | 19 | 2,539 | (847 | ) | (466 | ) | (9 | ) | |||||||||||
Total Noninterest Income | 14,688 | 16,376 | 13,943 | 13,577 | 12,836 | ||||||||||||||
Noninterest expenses: | |||||||||||||||||||
Salaries and wages | 23,698 | 17,263 | 18,640 | 19,420 | 18,506 | ||||||||||||||
Employee benefits | 4,255 | 3,323 | 2,973 | 3,195 | 4,206 | ||||||||||||||
Outsourced data processing costs | 4,633 | 3,645 | 3,711 | 3,876 | 3,845 | ||||||||||||||
Telephone / data lines | 714 | 651 | 603 | 893 | 811 | ||||||||||||||
Occupancy | 3,353 | 3,368 | 3,368 | 3,741 | 3,807 | ||||||||||||||
Furniture and equipment | 1,623 | 1,416 | 1,528 | 1,544 | 1,757 | ||||||||||||||
Marketing | 1,278 | 885 | 933 | 1,211 | 1,132 | ||||||||||||||
Legal and professional fees | 3,363 | 2,025 | 1,648 | 2,033 | 2,847 | ||||||||||||||
FDIC assessments | — | — | 56 | 337 | 488 | ||||||||||||||
Amortization of intangibles | 1,456 | 1,456 | 1,456 | 1,456 | 1,458 | ||||||||||||||
Foreclosed property expense and net (gain)/loss on sale | (315 | ) | 3 | 262 | (174 | ) | (40 | ) | |||||||||||
Other | 3,740 | 4,022 | 3,405 | 3,468 | 4,282 | ||||||||||||||
Total Noninterest Expense | 47,798 | 38,057 | 38,583 | 41,000 | 43,099 | ||||||||||||||
Income Before Income Taxes | 554 | 35,279 | 34,057 | 30,162 | 29,114 | ||||||||||||||
Income taxes | (155 | ) | 8,103 | 8,452 | 6,909 | 6,409 | |||||||||||||
Net Income | $ | 709 | $ | 27,176 | $ | 25,605 | $ | 23,253 | $ | 22,705 | |||||||||
Per share of common stock: | |||||||||||||||||||
Net income diluted | $ | 0.01 | $ | 0.52 | $ | 0.49 | $ | 0.45 | $ | 0.44 | |||||||||
Net income basic | 0.01 | 0.53 | 0.50 | 0.45 | 0.44 | ||||||||||||||
Cash dividends declared | — | — | — | — | — | ||||||||||||||
Average diluted shares outstanding | 52,284 | 52,081 | 51,935 | 51,952 | 52,039 | ||||||||||||||
Average basic shares outstanding | 51,803 | 51,517 | 51,473 | 51,446 | 51,359 | ||||||||||||||
CONDENSED CONSOLIDATED BALANCE SHEETS | (Unaudited) | ||||||||||||||||||||
SEACOAST BANKING CORPORATION OF FLORIDA AND SUBSIDIARIES | |||||||||||||||||||||
March 31, | December 31, | September 30, | June 30, | March 31, | |||||||||||||||||
(Amounts in thousands) | 2020 | 2019 | 2019 | 2019 | 2019 | ||||||||||||||||
Assets | |||||||||||||||||||||
Cash and due from banks | $ | 82,111 | $ | 89,843 | $ | 106,349 | $ | 97,792 | $ | 98,270 | |||||||||||
Interest bearing deposits with other banks | 232,763 | 34,688 | 25,911 | 61,987 | 105,741 | ||||||||||||||||
Total Cash and Cash Equivalents | 314,874 | 124,531 | 132,260 | 159,779 | 204,011 | ||||||||||||||||
Time deposits with other banks | 3,742 | 3,742 | 4,579 | 4,980 | 8,174 | ||||||||||||||||
Debt Securities: | |||||||||||||||||||||
Available for sale (at fair value) | 910,311 | 946,855 | 920,811 | 914,615 | 877,549 | ||||||||||||||||
Held to maturity (at amortized cost) | 252,373 | 261,369 | 273,644 | 287,302 | 295,485 | ||||||||||||||||
Total Debt Securities | 1,162,684 | 1,208,224 | 1,194,455 | 1,201,917 | 1,173,034 | ||||||||||||||||
Loans held for sale | 29,281 | 20,029 | 26,768 | 17,513 | 13,900 | ||||||||||||||||
Loans | 5,317,208 | 5,198,404 | 4,986,289 | 4,888,139 | 4,828,441 | ||||||||||||||||
Less: Allowance for credit losses | (85,411 | ) | (35,154 | ) | (33,605 | ) | (33,505 | ) | (32,822 | ) | |||||||||||
Net Loans | 5,231,797 | 5,163,250 | 4,952,684 | 4,854,634 | 4,795,619 | ||||||||||||||||
Bank premises and equipment, net | 71,540 | 66,615 | 67,873 | 68,738 | 70,412 | ||||||||||||||||
Other real estate owned | 14,640 | 12,390 | 13,593 | 11,043 | 11,921 | ||||||||||||||||
Goodwill | 212,085 | 205,286 | 205,286 | 205,260 | 205,260 | ||||||||||||||||
Other intangible assets, net | 19,461 | 20,066 | 21,318 | 22,672 | 23,959 | ||||||||||||||||
Bank owned life insurance | 127,067 | 126,181 | 125,277 | 125,233 | 124,306 | ||||||||||||||||
Net deferred tax assets | 19,766 | 16,457 | 17,168 | 19,353 | 24,647 | ||||||||||||||||
Other assets | 145,957 | 141,740 | 129,384 | 133,764 | 128,146 | ||||||||||||||||
Total Assets | $ | 7,352,894 | $ | 7,108,511 | $ | 6,890,645 | $ | 6,824,886 | $ | 6,783,389 | |||||||||||
Liabilities and Shareholders' Equity | |||||||||||||||||||||
Liabilities | |||||||||||||||||||||
Deposits | |||||||||||||||||||||
Noninterest demand | $ | 1,703,628 | $ | 1,590,493 | $ | 1,652,927 | $ | 1,669,804 | $ | 1,676,009 | |||||||||||
Interest-bearing demand | 1,234,193 | 1,181,732 | 1,115,455 | 1,124,519 | 1,100,477 | ||||||||||||||||
Savings | 554,836 | 519,152 | 528,214 | 519,732 | 508,320 | ||||||||||||||||
Money market | 1,124,378 | 1,108,363 | 1,158,862 | 1,172,971 | 1,192,070 | ||||||||||||||||
Other time certificates | 489,669 | 504,837 | 537,183 | 553,107 | 539,202 | ||||||||||||||||
Brokered time certificates | 597,715 | 472,857 | 458,418 | 268,998 | 367,841 | ||||||||||||||||
Time certificates of more than $250,000 | 183,080 | 207,319 | 222,082 | 232,078 | 221,659 | ||||||||||||||||
Total Deposits | 5,887,499 | 5,584,753 | 5,673,141 | 5,541,209 | 5,605,578 | ||||||||||||||||
Securities sold under agreements to repurchase | 64,723 | 86,121 | 70,414 | 82,015 | 148,005 | ||||||||||||||||
Federal Home Loan Bank borrowings | 265,000 | 315,000 | 50,000 | 140,000 | 3,000 | ||||||||||||||||
Subordinated debt | 71,155 | 71,085 | 71,014 | 70,944 | 70,874 | ||||||||||||||||
Other liabilities | 72,730 | 65,913 | 63,398 | 60,479 | 59,508 | ||||||||||||||||
Total Liabilities | 6,361,107 | 6,122,872 | 5,927,967 | 5,894,647 | 5,886,965 | ||||||||||||||||
Shareholders' Equity | |||||||||||||||||||||
Common stock | 5,271 | 5,151 | 5,148 | 5,146 | 5,141 | ||||||||||||||||
Additional paid in capital | 809,533 | 786,242 | 784,661 | 782,928 | 780,680 | ||||||||||||||||
Retained earnings | 179,646 | 195,813 | 168,637 | 143,032 | 119,779 | ||||||||||||||||
Treasury stock | (7,422 | ) | (6,032 | ) | (6,079 | ) | (6,137 | ) | (4,959 | ) | |||||||||||
987,028 | 981,174 | 952,367 | 924,969 | 900,641 | |||||||||||||||||
Accumulated other comprehensive income/(loss), net | 4,759 | 4,465 | 10,311 | 5,270 | (4,217 | ) | |||||||||||||||
Total Shareholders' Equity | 991,787 | 985,639 | 962,678 | 930,239 | 896,424 | ||||||||||||||||
Total Liabilities & Shareholders' Equity | $ | 7,352,894 | $ | 7,108,511 | $ | 6,890,645 | $ | 6,824,886 | $ | 6,783,389 | |||||||||||
Common shares outstanding | 52,709 | 51,514 | 51,482 | 51,461 | 51,414 | ||||||||||||||||
CONSOLIDATED QUARTERLY FINANCIAL DATA | (Unaudited) | ||||||||||||||||||
SEACOAST BANKING CORPORATION OF FLORIDA AND SUBSIDIARIES | |||||||||||||||||||
(Amounts in thousands) | 1Q'20 | 4Q'19 | 3Q'19 | 2Q'19 | 1Q'19 | ||||||||||||||
Credit Analysis | |||||||||||||||||||
Net charge-offs - non-acquired loans | $ | 1,316 | $ | 2,930 | $ | 2,106 | $ | 1,621 | $ | 762 | |||||||||
Net (recoveries) charge-offs - acquired loans | (342 | ) | 295 | 5 | 220 | 201 | |||||||||||||
Total Net Charge-offs | 974 | 3,225 | 2,111 | 1,841 | 963 | ||||||||||||||
TDR valuation adjustments | $ | 24 | $ | 27 | $ | 40 | $ | 27 | $ | 35 | |||||||||
Net charge-offs to average loans - non-acquired loans | 0.10 | % | 0.23 | % | 0.17 | % | 0.13 | % | 0.06 | % | |||||||||
Net (recoveries) charge-offs to average loans - acquired loans | (0.03 | ) | 0.02 | — | 0.02 | 0.02 | |||||||||||||
Total Net Charge-offs to Average Loans | 0.07 | 0.25 | 0.17 | 0.15 | 0.08 | ||||||||||||||
Provision for credit losses - non-acquired loans | $ | 25,688 | $ | 4,041 | $ | 2,241 | $ | 2,326 | $ | 1,709 | |||||||||
Provision for (recapture of) credit losses - acquired loans | 3,825 | 759 | 10 | 225 | (312 | ) | |||||||||||||
Total Provision for Credit Losses | $ | 29,513 | $ | 4,800 | $ | 2,251 | $ | 2,551 | $ | 1,397 | |||||||||
Allowance for credit losses - non-acquired loans | $ | 69,498 | $ | 34,573 | $ | 33,488 | $ | 33,393 | $ | 32,715 | |||||||||
Allowance for credit losses - acquired loans | 15,913 | 581 | 117 | 112 | 107 | ||||||||||||||
Total Allowance for Credit Losses1 | $ | 85,411 | $ | 35,154 | $ | 33,605 | $ | 33,505 | $ | 32,822 | |||||||||
Non-acquired loans at end of period | $ | 4,373,378 | $ | 4,317,919 | $ | 4,010,299 | $ | 3,817,358 | $ | 3,667,221 | |||||||||
Acquired loans at end of period | 943,830 | 880,485 | 975,990 | 1,070,781 | 1,161,220 | ||||||||||||||
Total Loans | $ | 5,317,208 | $ | 5,198,404 | $ | 4,986,289 | $ | 4,888,139 | $ | 4,828,441 | |||||||||
Non-acquired loans allowance for credit losses to non-acquired loans at end of period | 1.59 | % | 0.80 | % | 0.84 | % | 0.87 | % | 0.89 | % | |||||||||
Total allowance for credit losses to total loans at end of period | 1.61 | 0.68 | 0.67 | 0.69 | 0.68 | ||||||||||||||
Purchase discount on acquired loans at end of period | 3.36 | 3.83 | 3.76 | 3.76 | 3.80 | ||||||||||||||
End of Period | |||||||||||||||||||
Nonperforming loans - non-acquired | $ | 17,898 | $ | 20,990 | $ | 20,400 | $ | 15,810 | $ | 15,423 | |||||||||
Nonperforming loans - acquired | 7,684 | 5,965 | 5,644 | 6,986 | 6,990 | ||||||||||||||
Other real estate owned - non-acquired | 10,676 | 5,177 | 5,177 | 66 | 831 | ||||||||||||||
Other real estate owned - acquired | 372 | 372 | 1,574 | 1,612 | 1,725 | ||||||||||||||
Bank branches closed included in other real estate owned | 3,592 | 6,842 | 6,842 | 9,365 | 9,365 | ||||||||||||||
Total Nonperforming Assets | $ | 40,222 | $ | 39,346 | $ | 39,637 | $ | 33,839 | $ | 34,334 | |||||||||
Restructured loans (accruing) | $ | 10,833 | $ | 11,100 | $ | 12,395 | $ | 14,534 | $ | 14,857 | |||||||||
Nonperforming loans to loans at end of period - non-acquired | 0.41 | % | 0.49 | % | 0.51 | % | 0.41 | % | 0.42 | % | |||||||||
Nonperforming loans to loans at end of period - acquired | 0.81 | 0.68 | 0.58 | 0.65 | 0.60 | ||||||||||||||
Total Nonperforming Loans to Loans at End of Period | 0.48 | 0.52 | 0.52 | 0.47 | 0.46 | ||||||||||||||
Nonperforming assets to total assets - non-acquired | 0.44 | % | 0.46 | % | 0.47 | % | 0.37 | % | 0.38 | % | |||||||||
Nonperforming assets to total assets - acquired | 0.11 | 0.09 | 0.11 | 0.13 | 0.13 | ||||||||||||||
Total Nonperforming Assets to Total Assets | 0.55 | 0.55 | 0.58 | 0.50 | 0.51 | ||||||||||||||
March 31, | December 31, | September 30, | June 30, | March 31, | |||||||||||||||
Loans | 2020 | 2019 | 2019 | 2019 | 2019 | ||||||||||||||
Construction and land development | $ | 295,405 | $ | 325,113 | $ | 326,324 | $ | 379,991 | $ | 417,565 | |||||||||
Commercial real estate - owner occupied | 1,082,893 | 1,034,963 | 1,025,040 | 1,005,876 | 989,234 | ||||||||||||||
Commercial real estate - non-owner occupied | 1,381,096 | 1,344,008 | 1,285,327 | 1,184,409 | 1,173,183 | ||||||||||||||
Residential real estate | 1,559,754 | 1,507,863 | 1,409,946 | 1,400,184 | 1,329,166 | ||||||||||||||
Consumer | 202,022 | 208,205 | 217,366 | 215,932 | 206,414 | ||||||||||||||
Commercial and financial | 796,038 | 778,252 | 722,286 | 701,747 | 712,879 | ||||||||||||||
Total Loans | $ | 5,317,208 | $ | 5,198,404 | $ | 4,986,289 | $ | 4,888,139 | $ | 4,828,441 | |||||||||
1See section titled "Current Expected Credit Losses ("CECL") Adopted on January 1, 2020 | |||||||||||||||||||
AVERAGE BALANCES, INTEREST INCOME AND EXPENSES, YIELDS AND RATES 1 | (Unaudited) | ||||||||||||||||||||||||||||||||
SEACOAST BANKING CORPORATION OF FLORIDA AND SUBSIDIARIES | |||||||||||||||||||||||||||||||||
1Q'20 | 4Q'19 | 1Q'19 | |||||||||||||||||||||||||||||||
Average | Yield/ | Average | Yield/ | Average | Yield/ | ||||||||||||||||||||||||||||
(Amounts in thousands) | Balance | Interest | Rate | Balance | Interest | Rate | Balance | Interest | Rate | ||||||||||||||||||||||||
Assets | |||||||||||||||||||||||||||||||||
Earning assets: | |||||||||||||||||||||||||||||||||
Securities: | |||||||||||||||||||||||||||||||||
Taxable | $ | 1,152,473 | $ | 8,696 | 3.02 | % | $ | 1,179,843 | $ | 8,500 | 2.88 | % | $ | 1,186,374 | $ | 9,119 | 3.07 | % | |||||||||||||||
Nontaxable | 19,740 | 152 | 3.09 | 20,709 | 162 | 3.13 | 26,561 | 190 | 2.86 | ||||||||||||||||||||||||
Total Securities | 1,172,213 | 8,848 | 3.02 | 1,200,552 | 8,662 | 2.89 | 1,212,935 | 9,309 | 3.07 | ||||||||||||||||||||||||
Federal funds sold and other | |||||||||||||||||||||||||||||||||
investments | 87,924 | 734 | 3.36 | 84,961 | 788 | 3.68 | 91,136 | 918 | 4.09 | ||||||||||||||||||||||||
Loans, net | 5,215,234 | 63,524 | 4.90 | 5,104,272 | 62,922 | 4.89 | 4,839,046 | 62,335 | 5.22 | ||||||||||||||||||||||||
Total Earning Assets | 6,475,371 | 73,106 | 4.54 | 6,389,785 | 72,372 | 4.49 | 6,143,117 | 72,562 | 4.79 | ||||||||||||||||||||||||
Allowance for credit losses | (56,931 | ) | (34,072 | ) | (32,966 | ) | |||||||||||||||||||||||||||
Cash and due from banks | 90,084 | 99,008 | 99,940 | ||||||||||||||||||||||||||||||
Premises and equipment | 67,585 | 67,485 | 70,938 | ||||||||||||||||||||||||||||||
Intangible assets | 226,712 | 226,060 | 230,066 | ||||||||||||||||||||||||||||||
Bank owned life insurance | 126,492 | 125,597 | 123,708 | ||||||||||||||||||||||||||||||
Other assets | 126,230 | 122,351 | 136,175 | ||||||||||||||||||||||||||||||
Total Assets | $ | 7,055,543 | $ | 6,996,214 | $ | 6,770,978 | |||||||||||||||||||||||||||
Liabilities and Shareholders' Equity | |||||||||||||||||||||||||||||||||
Interest-bearing liabilities: | |||||||||||||||||||||||||||||||||
Interest-bearing demand | $ | 1,173,930 | $ | 834 | 0.29 | % | $ | 1,190,681 | $ | 983 | 0.33 | % | $ | 1,029,726 | $ | 839 | 0.33 | % | |||||||||||||||
Savings | 526,727 | 348 | 0.27 | 528,771 | 422 | 0.32 | 500,347 | 477 | 0.39 | ||||||||||||||||||||||||
Money market | 1,128,757 | 2,008 | 0.72 | 1,148,453 | 2,184 | 0.75 | 1,158,939 | 2,557 | 0.89 | ||||||||||||||||||||||||
Time deposits | 1,151,750 | 4,768 | 1.67 | 1,078,297 | 5,084 | 1.87 | 1,042,346 | 4,959 | 1.93 | ||||||||||||||||||||||||
Securities sold under agreements to repurchase | 71,065 | 167 | 0.95 | 73,693 | 226 | 1.22 | 185,032 | 550 | 1.21 | ||||||||||||||||||||||||
Federal funds purchased and Federal Home Loan Bank borrowings | 250,022 | 968 | 1.56 | 181,134 | 845 | 1.85 | 227,378 | 1,421 | 2.53 | ||||||||||||||||||||||||
Other borrowings | 71,114 | 722 | 4.08 | 71,045 | 782 | 4.37 | 70,836 | 898 | 5.14 | ||||||||||||||||||||||||
Total Interest-Bearing Liabilities | 4,373,365 | 9,815 | 0.90 | 4,272,074 | 10,526 | 0.98 | 4,214,604 | 11,701 | 1.13 | ||||||||||||||||||||||||
Noninterest demand | 1,625,215 | 1,680,734 | 1,612,548 | ||||||||||||||||||||||||||||||
Other liabilities | 62,970 | 67,206 | 64,262 | ||||||||||||||||||||||||||||||
Total Liabilities | 6,061,550 | 6,020,014 | 5,891,414 | ||||||||||||||||||||||||||||||
Shareholders' equity | 993,993 | 976,200 | 879,564 | ||||||||||||||||||||||||||||||
Total Liabilities & Equity | $ | 7,055,543 | $ | 6,996,214 | $ | 6,770,978 | |||||||||||||||||||||||||||
Cost of deposits | 0.57 | % | 0.61 | % | 0.67 | % | |||||||||||||||||||||||||||
Interest expense as a % of earning assets | 0.61 | % | 0.65 | % | 0.77 | % | |||||||||||||||||||||||||||
Net interest income as a % of earning assets | $ | 63,291 | 3.93 | % | $ | 61,846 | 3.84 | % | $ | 60,861 | 4.02 | % | |||||||||||||||||||||
1On a fully taxable equivalent basis. All yields and rates have been computed using amortized cost. | |||||||||||||||||||||||||||||||||
Fees on loans have been included in interest on loans. Nonaccrual loans are included in loan balances. | |||||||||||||||||||||||||||||||||
CONSOLIDATED QUARTERLY FINANCIAL DATA | (Unaudited) | |||||||||||||||||||||
SEACOAST BANKING CORPORATION OF FLORIDA AND SUBSIDIARIES | ||||||||||||||||||||||
March 31, | December 31, | September 30, | June 30, | March 31, | ||||||||||||||||||
(Amounts in thousands) | 2020 | 2019 | 2019 | 2019 | 2019 | |||||||||||||||||
Customer Relationship Funding | ||||||||||||||||||||||
Noninterest demand | ||||||||||||||||||||||
Commercial | $ | 1,336,352 | $ | 1,233,475 | $ | 1,314,102 | $ | 1,323,743 | $ | 1,298,468 | ||||||||||||
Retail | 271,916 | 246,717 | 241,734 | 251,879 | 275,383 | |||||||||||||||||
Public funds | 71,029 | 85,122 | 65,869 | 65,822 | 73,640 | |||||||||||||||||
Other | 24,331 | 25,179 | 31,222 | 28,360 | 28,518 | |||||||||||||||||
Total Noninterest Demand | 1,703,628 | 1,590,493 | 1,652,927 | 1,669,804 | 1,676,009 | |||||||||||||||||
Interest-bearing demand | ||||||||||||||||||||||
Commercial | 349,315 | 319,993 | 342,376 | 323,818 | 289,544 | |||||||||||||||||
Retail | 671,378 | 641,762 | 622,833 | 634,099 | 646,522 | |||||||||||||||||
Public funds | 213,500 | 219,977 | 150,246 | 166,602 | 164,411 | |||||||||||||||||
Total Interest-Bearing Demand | 1,234,193 | 1,181,732 | 1,115,455 | 1,124,519 | 1,100,477 | |||||||||||||||||
Total transaction accounts | ||||||||||||||||||||||
Commercial | 1,685,667 | 1,553,468 | 1,656,478 | 1,647,561 | 1,588,012 | |||||||||||||||||
Retail | 943,294 | 888,479 | 864,567 | 885,978 | 921,905 | |||||||||||||||||
Public funds | 284,529 | 305,099 | 216,115 | 232,424 | 238,051 | |||||||||||||||||
Other | 24,331 | 25,179 | 31,222 | 28,360 | 28,518 | |||||||||||||||||
Total Transaction Accounts | 2,937,821 | 2,772,225 | 2,768,382 | 2,794,323 | 2,776,486 | |||||||||||||||||
Savings | 554,836 | 519,152 | 528,214 | 519,732 | 508,320 | |||||||||||||||||
Money market | ||||||||||||||||||||||
Commercial | 487,759 | 494,803 | 513,477 | 517,041 | 500,649 | |||||||||||||||||
Retail | 572,785 | 553,075 | 583,917 | 590,320 | 602,378 | |||||||||||||||||
Public funds | 63,834 | 60,485 | 61,468 | 65,610 | 89,043 | |||||||||||||||||
Total Money Market | 1,124,378 | 1,108,363 | 1,158,862 | 1,172,971 | 1,192,070 | |||||||||||||||||
Brokered time certificates | 597,715 | 472,857 | 458,418 | 268,998 | 367,841 | |||||||||||||||||
Other time certificates | 672,749 | 712,156 | 759,265 | 785,185 | 760,861 | |||||||||||||||||
1,270,464 | 1,185,013 | 1,217,683 | 1,054,183 | 1,128,702 | ||||||||||||||||||
Total Deposits | $ | 5,887,499 | $ | 5,584,753 | $ | 5,673,141 | $ | 5,541,209 | $ | 5,605,578 | ||||||||||||
Customer sweep accounts | $ | 64,723 | $ | 86,121 | $ | 70,414 | $ | 82,015 | $ | 148,005 | ||||||||||||
CURRENT EXPECTED CREDIT LOSSES ("CECL") ADOPTED ON JANUARY 1, 2020 | |||||||||||
SEACOAST BANKING CORPORATION OF FLORIDA AND SUBSIDIARIES | |||||||||||
January 1, | |||||||||||
($ in thousands) | 2020 | ||||||||||
Impact of Adoption | |||||||||||
Increase to allowance for non-acquired loans | $ | 10,577 | |||||||||
Increase to allowance for acquired loans | 10,649 | ||||||||||
Reversal of contra-loan balances for purchased credit impaired loans, now included in allowance | (706 | ) | |||||||||
Increase to reserve for unfunded commitments (included in Other Liabilities) | 1,837 | ||||||||||
Tax effect | (5,481 | ) | |||||||||
Decrease to retained earnings upon adoption | $ | 16,876 | |||||||||
Explanation of Certain Unaudited Non-GAAP Financial Measures
This presentation contains financial information determined by methods other than Generally Accepted Accounting Principles (“GAAP”). Management uses these non-GAAP financial measures in its analysis of the Company’s performance and believes these presentations provide useful supplemental information, and a clearer understanding of the Company’s performance. The Company believes the non-GAAP measures enhance investors’ understanding of the Company’s business and performance and if not provided would be requested by the investor community. These measures are also useful in understanding performance trends and facilitate comparisons with the performance of other financial institutions. The limitations associated with operating measures are the risk that persons might disagree as to the appropriateness of items comprising these measures and that different companies might define or calculate these measures differently. The Company provides reconciliations between GAAP and these non-GAAP measures. These disclosures should not be considered an alternative to GAAP.
GAAP TO NON-GAAP RECONCILIATION | (Unaudited) | |||||||||||||||||||
SEACOAST BANKING CORPORATION OF FLORIDA AND SUBSIDIARIES | ||||||||||||||||||||
Quarterly Trends | ||||||||||||||||||||
(Amounts in thousands, except per share data) | 1Q'20 | 4Q'19 | 3Q'19 | 2Q'19 | 1Q'19 | |||||||||||||||
Net Income | $ | 709 | $ | 27,176 | $ | 25,605 | $ | 23,253 | $ | 22,705 | ||||||||||
Total noninterest income | 14,688 | 16,376 | 13,943 | 13,577 | 12,836 | |||||||||||||||
Securities (gains) losses, net | (19 | ) | (2,539 | ) | 847 | 466 | 9 | |||||||||||||
BOLI benefits on death (included in other income) | — | — | (956 | ) | — | — | ||||||||||||||
Total Adjustments to Noninterest Income | (19 | ) | (2,539 | ) | (109 | ) | 466 | 9 | ||||||||||||
Total Adjusted Noninterest Income | 14,669 | 13,837 | 13,834 | 14,043 | 12,845 | |||||||||||||||
Total noninterest expense | 47,798 | 38,057 | 38,583 | 41,000 | 43,099 | |||||||||||||||
Merger related charges | (4,553 | ) | (634 | ) | — | — | (335 | ) | ||||||||||||
Amortization of intangibles | (1,456 | ) | (1,456 | ) | (1,456 | ) | (1,456 | ) | (1,458 | ) | ||||||||||
Business continuity expenses | (307 | ) | — | (95 | ) | — | — | |||||||||||||
Branch reductions and other expense initiatives | — | — | (121 | ) | (1,517 | ) | (208 | ) | ||||||||||||
Total Adjustments to Noninterest Expense | (6,316 | ) | (2,090 | ) | (1,672 | ) | (2,973 | ) | (2,001 | ) | ||||||||||
Total Adjusted Noninterest Expense | 41,482 | 35,967 | 36,911 | 38,027 | 41,098 | |||||||||||||||
Income Taxes | (155 | ) | 8,103 | 8,452 | 6,909 | 6,409 | ||||||||||||||
Tax effect of adjustments | 1,544 | (110 | ) | 572 | 874 | 510 | ||||||||||||||
Effect of change in corporate tax rate on deferred tax assets | — | — | (1,135 | ) | — | — | ||||||||||||||
Total Adjustments to Income Taxes | 1,544 | (110 | ) | (563 | ) | 874 | 510 | |||||||||||||
Adjusted Income Taxes | 1,389 | 7,993 | 7,889 | 7,783 | 6,919 | |||||||||||||||
Adjusted Net Income | $ | 5,462 | $ | 26,837 | $ | 27,731 | $ | 25,818 | $ | 24,205 | ||||||||||
Earnings per diluted share, as reported | $ | 0.01 | $ | 0.52 | $ | 0.49 | $ | 0.45 | $ | 0.44 | ||||||||||
Adjusted Earnings per Diluted Share | 0.10 | 0.52 | 0.53 | 0.50 | 0.47 | |||||||||||||||
Average diluted shares outstanding | 52,284 | 52,081 | 51,935 | 51,952 | 52,039 | |||||||||||||||
Adjusted Noninterest Expense | $ | 41,482 | $ | 35,967 | $ | 36,911 | $ | 38,027 | $ | 41,098 | ||||||||||
Foreclosed property expense and net gain/(loss) on sale | 315 | (3 | ) | (262 | ) | 174 | 40 | |||||||||||||
Net Adjusted Noninterest Expense | $ | 41,797 | $ | 35,964 | $ | 36,649 | $ | 38,201 | $ | 41,138 | ||||||||||
Revenue | $ | 77,865 | $ | 78,136 | $ | 74,891 | $ | 73,713 | $ | 73,610 | ||||||||||
Total Adjustments to Revenue | (19 | ) | (2,539 | ) | (109 | ) | 466 | 9 | ||||||||||||
Impact of FTE adjustment | 115 | 87 | 79 | 83 | 87 | |||||||||||||||
Adjusted Revenue on a fully taxable equivalent basis | $ | 77,961 | $ | 75,684 | $ | 74,861 | $ | 74,262 | $ | 73,706 | ||||||||||
Adjusted Efficiency Ratio | 53.61 | % | 47.52 | % | 48.96 | % | 51.44 | % | 55.81 | % | ||||||||||
Average Assets | $ | 7,055,543 | $ | 6,996,214 | $ | 6,820,576 | $ | 6,734,994 | $ | 6,770,978 | ||||||||||
Less average goodwill and intangible assets | (226,712 | ) | (226,060 | ) | (227,389 | ) | (228,706 | ) | (230,066 | ) | ||||||||||
Average Tangible Assets | $ | 6,828,831 | $ | 6,770,154 | $ | 6,593,187 | $ | 6,506,288 | $ | 6,540,912 | ||||||||||
Return on Average Assets (ROA) | 0.04 | % | 1.54 | % | 1.49 | % | 1.38 | % | 1.36 | % | ||||||||||
Impact of removing average intangible assets and related amortization | 0.07 | 0.12 | 0.12 | 0.12 | 0.12 | |||||||||||||||
Return on Average Tangible Assets (ROTA) | 0.11 | 1.66 | 1.61 | 1.50 | 1.48 | |||||||||||||||
Impact of other adjustments for Adjusted Net Income | 0.21 | (0.09 | ) | 0.06 | 0.09 | 0.02 | ||||||||||||||
Adjusted Return on Average Tangible Assets | 0.32 | 1.57 | 1.67 | 1.59 | 1.50 | |||||||||||||||
Average Shareholders' Equity | $ | 993,993 | $ | 976,200 | $ | 946,670 | $ | 911,479 | $ | 879,564 | ||||||||||
Less average goodwill and intangible assets | (226,712 | ) | (226,060 | ) | (227,389 | ) | (228,706 | ) | (230,066 | ) | ||||||||||
Average Tangible Equity | $ | 767,281 | $ | 750,140 | $ | 719,281 | $ | 682,773 | $ | 649,498 | ||||||||||
Return on Average Shareholders' Equity | 0.29 | % | 11.04 | % | 10.73 | % | 10.23 | % | 10.47 | % | ||||||||||
Impact of removing average intangible assets and related amortization | 0.66 | 3.91 | 4.00 | 4.07 | 4.39 | |||||||||||||||
Return on Average Tangible Common Equity (ROTCE) | 0.95 | 14.95 | 14.73 | 14.30 | 14.86 | |||||||||||||||
Impact of other adjustments for Adjusted Net Income | 1.91 | (0.76 | ) | 0.57 | 0.87 | 0.25 | ||||||||||||||
Adjusted Return on Average Tangible Common Equity | 2.86 | 14.19 | 15.30 | 15.17 | 15.11 | |||||||||||||||
Loan interest income excluding accretion on acquired loans | $ | 59,237 | $ | 59,515 | $ | 59,279 | $ | 58,169 | $ | 58,397 | ||||||||||
Accretion on acquired loans | 4,287 | 3,407 | 3,859 | 4,166 | 3,938 | |||||||||||||||
Loan interest income1 | $ | 63,524 | $ | 62,922 | $ | 63,138 | $ | 62,335 | $ | 62,335 | ||||||||||
1On a fully taxable equivalent basis. All yields and rates have been computed using amortized cost. | ||||||||||||||||||||
GAAP TO NON-GAAP RECONCILIATION | (Unaudited) | |||||||||||||||||||
SEACOAST BANKING CORPORATION OF FLORIDA AND SUBSIDIARIES | ||||||||||||||||||||
Quarterly Trends | ||||||||||||||||||||
(Amounts in thousands, except per share data) | 1Q'20 | 4Q'19 | 3Q'19 | 2Q'19 | 1Q'19 | |||||||||||||||
Yield on loans excluding accretion on acquired loans | 4.57 | % | 4.63 | % | 4.76 | % | 4.82 | % | 4.89 | % | ||||||||||
Impact of accretion on acquired loans | 0.33 | 0.26 | 0.30 | 0.34 | 0.33 | |||||||||||||||
Yield on loans | 4.90 | 4.89 | 5.06 | 5.16 | 5.22 | |||||||||||||||
Net interest income excluding accretion on acquired loans | $ | 59,004 | $ | 58,439 | $ | 57,168 | $ | 56,053 | $ | 56,923 | ||||||||||
Accretion on acquired loans | 4,287 | 3,407 | 3,859 | 4,166 | 3,938 | |||||||||||||||
Net Interest Income1 | $ | 63,291 | $ | 61,846 | $ | 61,027 | $ | 60,219 | $ | 60,861 | ||||||||||
Net interest margin excluding accretion on acquired loans | 3.66 | % | 3.63 | % | 3.64 | % | 3.67 | % | 3.76 | % | ||||||||||
Impact of accretion on acquired loans | 0.27 | 0.21 | 0.25 | 0.27 | 0.26 | |||||||||||||||
Net Interest Margin | 3.93 | 3.84 | 3.89 | 3.94 | 4.02 | |||||||||||||||
Security interest income excluding tax equivalent adjustment | $ | 8,817 | $ | 8,630 | $ | 8,933 | $ | 9,076 | $ | 9,270 | ||||||||||
Tax equivalent adjustment on securities | 31 | 32 | 33 | 36 | 39 | |||||||||||||||
Security interest income1 | $ | 8,848 | $ | 8,662 | $ | 8,966 | $ | 9,112 | $ | 9,309 | ||||||||||
Loan interest income excluding tax equivalent adjustment | $ | 63,440 | $ | 62,867 | $ | 63,091 | $ | 62,287 | $ | 62,287 | ||||||||||
Tax equivalent adjustment on loans | 84 | 55 | 47 | 48 | 48 | |||||||||||||||
Loan interest income1 | $ | 63,524 | $ | 62,922 | $ | 63,138 | $ | 62,335 | $ | 62,335 | ||||||||||
Net interest income excluding tax equivalent adjustment | $ | 63,176 | $ | 61,759 | $ | 60,947 | $ | 60,135 | $ | 60,774 | ||||||||||
Tax equivalent adjustment on securities | 31 | 32 | 33 | 36 | 39 | |||||||||||||||
Tax equivalent adjustment on loans | 84 | 55 | 47 | 48 | 48 | |||||||||||||||
Net Interest Income1 | $ | 63,291 | $ | 61,846 | $ | 61,027 | $ | 60,219 | $ | 60,861 | ||||||||||
1On a fully taxable equivalent basis. All yields and rates have been computed using amortized cost. | ||||||||||||||||||||