Attached files
| file | filename |
|---|---|
| EX-99.1 - EXHIBIT 99.1 - SEACOAST BANKING CORP OF FLORIDA | sbcf1q2020earningsreleased.htm |
| 8-K - 8-K - SEACOAST BANKING CORP OF FLORIDA | sbcf1q20208-k.htm |

Earnings Presentation FIRST QUARTER 2020 RESULTS Contact: (email) Chuck.Shaffer@SeacoastBank.com (phone) 772.221.7003 (web) www.SeacoastBanking.com

Cautionary Notice Regarding Forward-Looking Statements This press release contains “forward-looking statements” within the meaning, and protections, of Section adversely affect us or the banking industry; our concentration in commercial real estate loans; the failure 27A of the Securities Act of 1933 and Section 21E of the Securities Exchange Act of 1934, including, of assumptions and estimates, as well as differences in, and changes to, economic, market and credit without limitation, statements about future financial and operating results, cost savings, enhanced conditions; the impact on the valuation of our investments due to market volatility or counterparty revenues, economic and seasonal conditions in our markets, new initiatives and improvements to payment risk; statutory and regulatory dividend restrictions; increases in regulatory capital requirements reported earnings that may be realized from cost controls, tax law changes, and for integration of banks for banking organizations generally; the risks of mergers, acquisitions and divestitures, including our that we have acquired, or expect to acquire, as well as statements with respect to Seacoast's objectives, ability to continue to identify acquisition targets and successfully acquire desirable financial institutions; strategic plans, including Vision 2020, expectations and intentions and other statements that are not changes in technology or products that may be more difficult, costly, or less effective than anticipated; historical facts, any of which may be impacted by the COVID-19 pandemic and related effects on the U.S. our ability to identify and address increased cybersecurity risks; inability of our risk management economy. Actual results may differ from those set forth in the forward-looking statements. framework to manage risks associated with our business; dependence on key suppliers or vendors to obtain equipment or services for our business on acceptable terms; reduction in or the termination of Forward-looking statements include statements with respect to our beliefs, plans, objectives, goals, our ability to use the mobile-based platform that is critical to our business growth strategy; the effects expectations, anticipations, assumptions, estimates and intentions about future performance, and of war or other conflicts, acts of terrorism, natural disasters, health emergencies, epidemics or involve known and unknown risks, uncertainties and other factors, which may be beyond our control, pandemics, or other catastrophic events that may affect general economic conditions; unexpected and which may cause the actual results, performance or achievements of Seacoast to be materially outcomes of and the costs associated with, existing or new litigation involving us; our ability to maintain different from future results, performance or achievements expressed or implied by such forward-looking adequate internal controls over financial reporting; potential claims, damages, penalties, fines and statements. You should not expect us to update any forward-looking statements. reputational damage resulting from pending or future litigation, regulatory proceedings and enforcement actions; the risks that our deferred tax assets could be reduced if estimates of future taxable income All statements other than statements of historical fact could be forward-looking statements. You can from our operations and tax planning strategies are less than currently estimated and sales of our capital identify these forward-looking statements through our use of words such as “may”, “will”, “anticipate”, stock could trigger a reduction in the amount of net operating loss carryforwards that we may be able “assume”, “should”, “support”, “indicate”, “would”, “believe”, “contemplate”, “expect”, “estimate”, to utilize for income tax purposes; the effects of competition from other commercial banks, thrifts, “continue”, “further”, “plan”, “point to”, “project”, “could”, “intend”, “target” or other similar words and mortgage banking firms, consumer finance companies, credit unions, securities brokerage firms, expressions of the future. These forward-looking statements may not be realized due to a variety of insurance companies, money market and other mutual funds and other financial institutions operating factors, including, without limitation: the effects of future economic and market conditions, including in our market areas and elsewhere, including institutions operating regionally, nationally and seasonality and the adverse impact of COVID-19 (economic and otherwise); governmental monetary and internationally, together with such competitors offering banking products and services by mail, fiscal policies, including interest rate policies of the Board of Governors of the Federal Reserve, as well telephone, computer and the Internet; and the failure of assumptions underlying the establishment of as legislative, tax and regulatory changes; changes in accounting policies, rules and practices, including reserves for possible loan losses. the impact of the adoption of CECL; the risks of changes in interest rates on the level and composition of deposits, loan demand, liquidity and the values of loan collateral, securities, and interest sensitive All written or oral forward-looking statements attributable to us are expressly qualified in their entirety assets and liabilities; interest rate risks, sensitivities and the shape of the yield curve; uncertainty related by this cautionary notice, including, without limitation, those risks and uncertainties described in our to the impact of LIBOR calculations on securities and loans; changes in borrower credit risks and payment annual report on Form 10-K for the year ended December 31, 2019 under “Special Cautionary Notice behaviors; changes in the availability and cost of credit and capital in the financial markets; changes in Regarding Forward-Looking Statements” and “Risk Factors”, and otherwise in our SEC reports and filings. the prices, values and sales volumes of residential and commercial real estate; our ability to comply with Such reports are available upon request from the Company, or from the Securities and Exchange any regulatory requirements; the effects of problems encountered by other financial institutions that Commission, including through the SEC’s Internet website at www.sec.gov. FIRST QUARTER 2020 EARNINGS PRESENTATION 2

Valuable Florida Franchise, Well Positioned with Strong Capital and Liquidity Seacoast Customer Map • $7.4 billion in assets as of March 31, • Highly disciplined credit portfolio 2020, operating in the nation’s third- most populous state • Prudent liquidity position • Strong and growing presence in four of Florida’s most attractive MSAs • Strong capital position • #1 Florida-based bank in the Orlando MSA • Steady increase in shareholder value • Growing share in West Palm Beach with tangible book value per share increasing 11% year-over-year • #2 share in Port St Lucie MSA • Growing presence in Tampa MSA • Active board with a diverse range of • Market Cap: $1.0 billion as of experience and expertise March 31, 2020 Valuable Florida Franchise with Disciplined Growth Strategy, Benefiting from Fortress Balance Sheet with Robust Capital Generation, Prudent Liquidity Position, and Strict Credit Underwriting FIRST QUARTER 2020 EARNINGS PRESENTATION 3
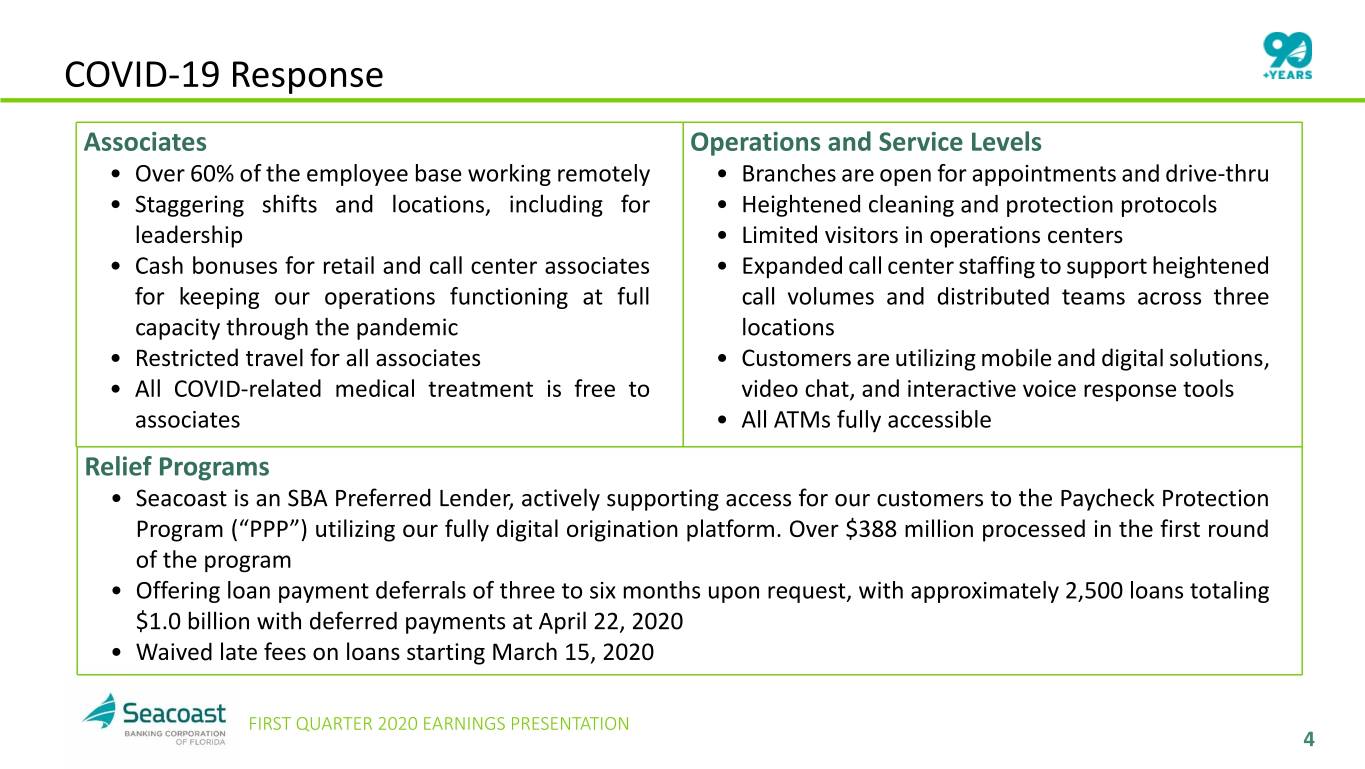
COVID-19 Response Associates Operations and Service Levels • Over 60% of the employee base working remotely • Branches are open for appointments and drive-thru • Staggering shifts and locations, including for • Heightened cleaning and protection protocols leadership • Limited visitors in operations centers • Cash bonuses for retail and call center associates • Expanded call center staffing to support heightened for keeping our operations functioning at full call volumes and distributed teams across three capacity through the pandemic locations • Restricted travel for all associates • Customers are utilizing mobile and digital solutions, • All COVID-related medical treatment is free to video chat, and interactive voice response tools associates • All ATMs fully accessible Relief Programs • Seacoast is an SBA Preferred Lender, actively supporting access for our customers to the Paycheck Protection Program (“PPP”) utilizing our fully digital origination platform. Over $388 million processed in the first round of the program • Offering loan payment deferrals of three to six months upon request, with approximately 2,500 loans totaling $1.0 billion with deferred payments at April 22, 2020 • Waived late fees on loans starting March 15, 2020 FIRST QUARTER 2020 EARNINGS PRESENTATION 4
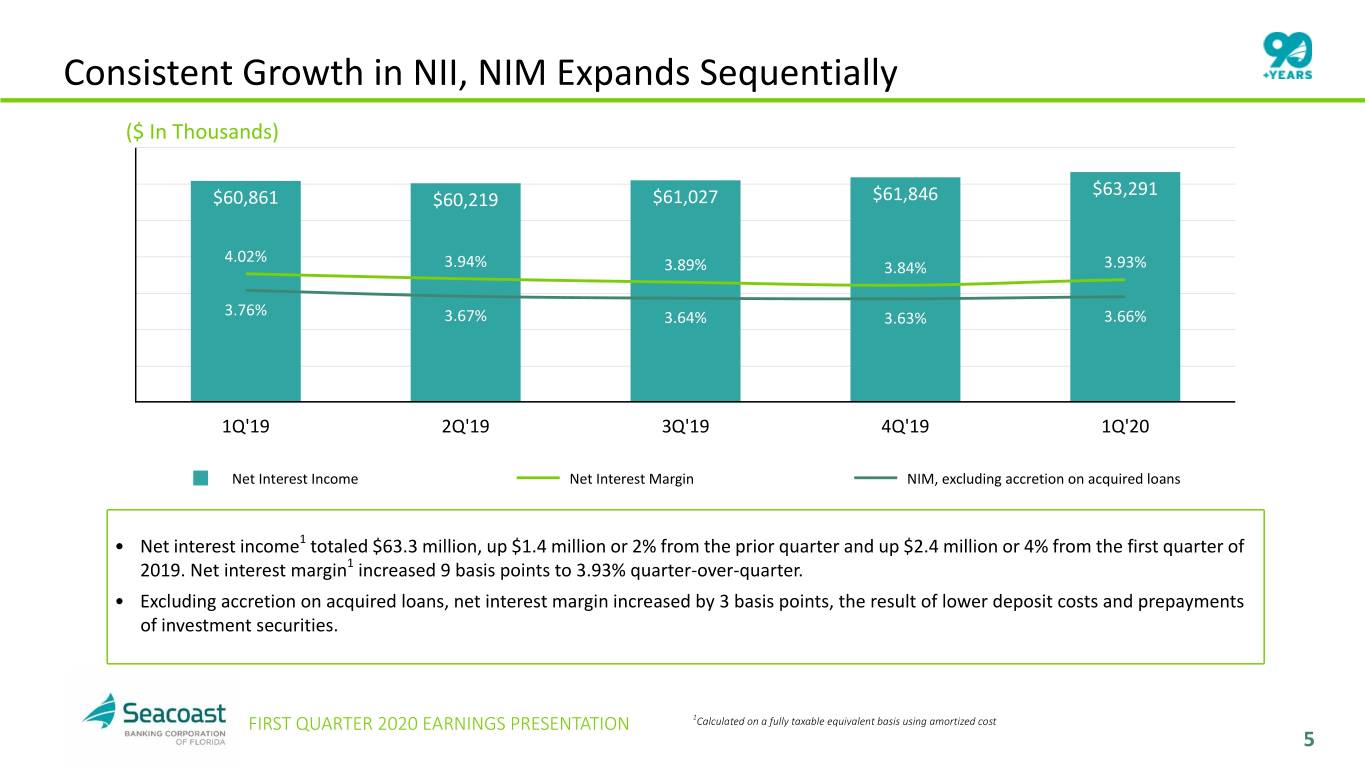
Consistent Growth in NII, NIM Expands Sequentially ($ In Thousands) $63,291 $60,861 $60,219 $61,027 $61,846 4.02% 3.94% 3.89% 3.84% 3.93% 3.76% 3.67% 3.64% 3.63% 3.66% 1Q'19 2Q'19 3Q'19 4Q'19 1Q'20 Net Interest Income Net Interest Margin NIM, excluding accretion on acquired loans • Net interest income1 totaled $63.3 million, up $1.4 million or 2% from the prior quarter and up $2.4 million or 4% from the first quarter of 2019. Net interest margin1 increased 9 basis points to 3.93% quarter-over-quarter. • Excluding accretion on acquired loans, net interest margin increased by 3 basis points, the result of lower deposit costs and prepayments of investment securities. FIRST QUARTER 2020 EARNINGS PRESENTATION 1Calculated on a fully taxable equivalent basis using amortized cost 5
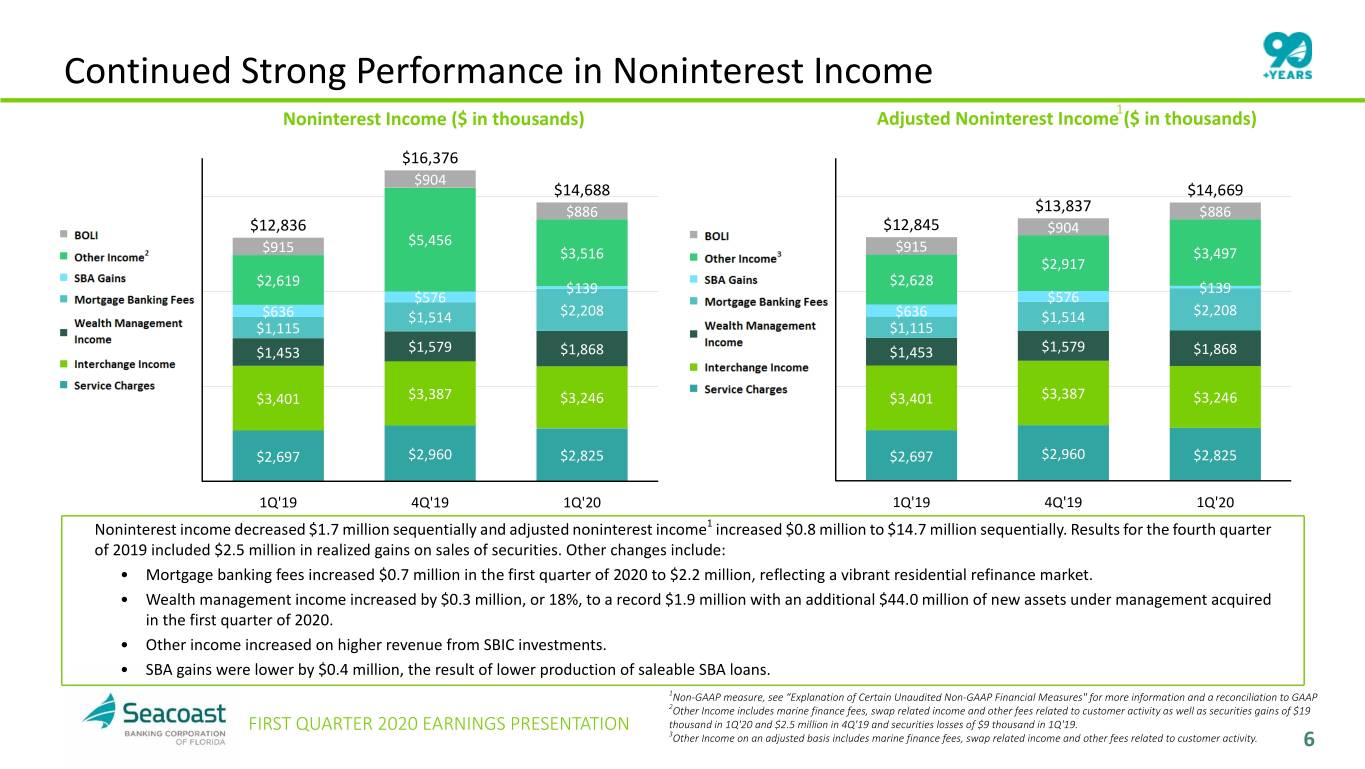
Continued Strong Performance in Noninterest Income 1 Noninterest Income ($ in thousands) Adjusted Noninterest Income ($ in thousands) $16,376 $904 $14,688 $14,669 $886 $13,837 $886 $12,836 $12,845 $904 $5,456 $915 $3,516 $915 $3,497 $2,917 $2,628 $2,619 $139 $139 $576 $576 $636 $1,514 $2,208 $636 $1,514 $2,208 $1,115 $1,115 $1,453 $1,579 $1,868 $1,453 $1,579 $1,868 $3,401 $3,387 $3,246 $3,401 $3,387 $3,246 $2,697 $2,960 $2,825 $2,697 $2,960 $2,825 1Q'19 4Q'19 1Q'20 1Q'19 4Q'19 1Q'20 Noninterest income decreased $1.7 million sequentially and adjusted noninterest income1 increased $0.8 million to $14.7 million sequentially. Results for the fourth quarter of 2019 included $2.5 million in realized gains on sales of securities. Other changes include: • Mortgage banking fees increased $0.7 million in the first quarter of 2020 to $2.2 million, reflecting a vibrant residential refinance market. • Wealth management income increased by $0.3 million, or 18%, to a record $1.9 million with an additional $44.0 million of new assets under management acquired in the first quarter of 2020. • Other income increased on higher revenue from SBIC investments. • SBA gains were lower by $0.4 million, the result of lower production of saleable SBA loans. 1Non-GAAP measure, see “Explanation of Certain Unaudited Non-GAAP Financial Measures" for more information and a reconciliation to GAAP 2Other Income includes marine finance fees, swap related income and other fees related to customer activity as well as securities gains of $19 FIRST QUARTER 2020 EARNINGS PRESENTATION thousand in 1Q'20 and $2.5 million in 4Q'19 and securities losses of $9 thousand in 1Q'19. 3Other Income on an adjusted basis includes marine finance fees, swap related income and other fees related to customer activity. 6

Continued Focus on Disciplined Expense Control Noninterest Expense ($ in thousands) Adjusted Noninterest Expense1 ($ in thousands) $47,798 $43,099 $4,703 $41,098 $41,482 $3,363 $5,862 $38,057 $4,570 $5,837 $5,690 $35,967 $2,847 $4,910 $2,242 $2,816 $4,875 $6,375 $2,025 $4,633 $5,433 $6,002 $1,419 $5,435 $1,456 $3,798 $3,845 $5,430 $3,813 $1,458 $3,645 $3,648 $1,456 $27,953 $25,439 $22,712 $22,630 $20,586 $20,595 1Q'19 4Q'19 1Q'20 1Q'19 4Q'19 1Q'20 Noninterest expense increased $9.7 million and adjusted noninterest expense1 increased $5.5 million sequentially. Changes quarter-over-quarter include: • Salaries and employee benefits increased $7.4 million on a combined basis, of which $2.2 million is merger-related, higher incentives and seasonal increases in payroll taxes during the first quarter. The remaining increase was the result of recruiting seasoned bankers, a return of payroll taxes and 401k contribution expenses, and the reactivation of incentive accruals, all in line with prior years seasonality. Additionally, the quarter's results included $0.3 million in bonuses to retail associates, who are keeping critical functions operating seamlessly through this pandemic. Lastly, deferred loan origination costs were impacted by $0.5 million, the result of fewer loans originated. • Legal and professional fees increased $1.3 million, including $1.1 million incurred in the first quarter for merger-related activities. • Data processing costs increased by $1.0 million, including $0.8 million in merger-related expenses. 1Non-GAAP measure, see “Explanation of Certain Unaudited Non-GAAP Financial Measures" for more information and a FIRST QUARTER 2020 EARNINGS PRESENTATION reconciliation to GAAP 2Other Expense includes marketing expenses and other expenses associated with ongoing business operations. 7

Efficiency Ratio Trend GAAP - Efficiency Adjusted - Efficiency1 74% 71% 66% 64% 65% 60% 61% 59% 58% 58% 58% 57% 57% 57% 57% 56% 56% 53% 53% 54% 54% 51% 49% 48% 49% 48% 7 7 7 7 8 8 8 8 9 9 9 9 0 7 7 7 7 8 8 8 8 9 9 9 9 0 '1 '1 '1 '1 '1 '1 '1 '1 '1 '1 '1 '1 '2 '1 '1 '1 '1 '1 '1 '1 '1 '1 '1 '1 '1 '2 Q Q Q Q Q Q Q Q Q Q Q Q Q Q Q Q Q Q Q Q Q Q Q Q Q Q 1 2 3 4 1 2 3 4 1 2 3 4 1 1 2 3 4 1 2 3 4 1 2 3 4 1 • The efficiency ratio was 59.8% compared to 48.4% in the prior quarter and 56.6% in the first quarter of 2019. • The adjusted efficiency ratio1 was 53.6% compared to 47.5% in the prior quarter and 55.8% in the first quarter of 2019. • The first quarter of 2020 was impacted by typical seasonality, and we continue to focus on streamlining operations. FIRST QUARTER 2020 EARNINGS PRESENTATION 1Non-GAAP measure, see “Explanation of Certain Unaudited Non-GAAP Financial Measures" for more information and a reconciliation to GAAP 8

Loan Growth Purposely Slowed in the Quarter as a Result of COVID-19 Total Loans Outstanding ($ in millions) • Seacoast began accepting applications from customers on Friday, April 3 for the Paycheck Protection Program (“PPP”) $5,198 $5,317 $4,986 established by the CARES Act. In the first round of the program, $4,828 $4,888 Seacoast processed over 1,600 loans totaling over $388 million for its customers and, as an SBA preferred lender, will continue helping customers access the program in the second quarter. • Loans outstanding totaled $5.3 billion, an increase of $489 5.22% 5.16% 5.06% million, or 10%, year-over-year. 4.89% 4.90% • New loan originations of $323 million, compared to $587 4.89% 4.82% 4.76% million in the prior quarter, contributed to net loan growth in 4.63% 4.57% the quarter of 9% on an annualized basis. Excluding FBPB, loans declined by 0.5%. Loan originations were purposefully slowed as the economic outlook deteriorated as a result of COVID-19. • Exiting the first quarter of 2020, pipelines were $171 million in commercial, $29 million in consumer, and $87 million in residential mortgage. 1Q'19 2Q'19 3Q'19 4Q'19 1Q'20 Loans Reported Yield Y i e l d E x c l u d i n g Accretion on Acquired Loans FIRST QUARTER 2020 EARNINGS PRESENTATION 9

Seacoast's Lending Strategy has Resulted in a Diverse Loan Portfolio At March 31, 2020 ($ in thousands) • Construction and land development and Acquisition, Development commercial real estate loans, as defined in Commercial & Construction regulatory guidance, represent 32% and 181%, & Financial $295,405 respectively, of total consolidated risk based $796,038 6% capital. 15% Owner Occupied • Portfolio diversification in terms of asset mix, Commercial Real Consumer Estate industry, and loan type, has been a critical $202,022 $1,082,893 element of the Company's lending strategy. 4% 20% Exposure across industries and collateral types is broadly distributed. • The Company does not have any purchased loan syndications, shared national credits, or mezzanine finance. • Since the outbreak of COVID-19, the Company has not experienced any material increase in Residential consumer or commercial line utilization. Real Estate • The funded balances of the top 10 and top 20 $1,559,754 relationships represented 20% and 37%, 29% Commercial respectively, of total consolidated risk-based Real Estate capital, a decrease compared to 27% and 46% $1,381,096 26% three years ago in the first quarter of 2017. • Average commercial loan size is $375 thousand. FIRST QUARTER 2020 EARNINGS PRESENTATION 10

OOCRE, CRE and AD&C Loans are Widely Distributed Across Asset Type and Industry OOCRE & Acquisition, Commercial Real Development & ($ in thousands) Estate Construction Total % of Total Loans Office Building $ 694,678 $ 6,278 $ 700,956 13% Retail 455,032 16,296 471,328 9% Industrial & Warehouse 356,182 16,104 372,286 7% Other Commercial Property 241,142 — 241,142 5% Apartment Building / Condominium 189,441 29,704 219,145 4% Health Care 187,419 18,267 205,686 4% Hotel / Motel 115,240 — 115,240 2% 1-4 Family Residence - Individual Borrowers — 89,544 89,544 2% Vacant Lot — 77,317 77,317 1% Convenience Store 56,704 — 56,704 1% Restaurant 44,954 495 45,449 1% 1-4 Family Residence - Spec Home 4,140 39,628 43,768 1% Church 25,563 — 25,563 —% Agriculture 22,251 — 22,251 —% School / Education 20,919 546 21,465 —% Manufacturing Building 18,850 — 18,850 —% Recreational Property 10,549 — 10,549 —% Other 20,925 1,226 22,151 —% Total $ 2,463,989 $ 295,405 $ 2,759,394 52% FIRST QUARTER 2020 EARNINGS PRESENTATION 11
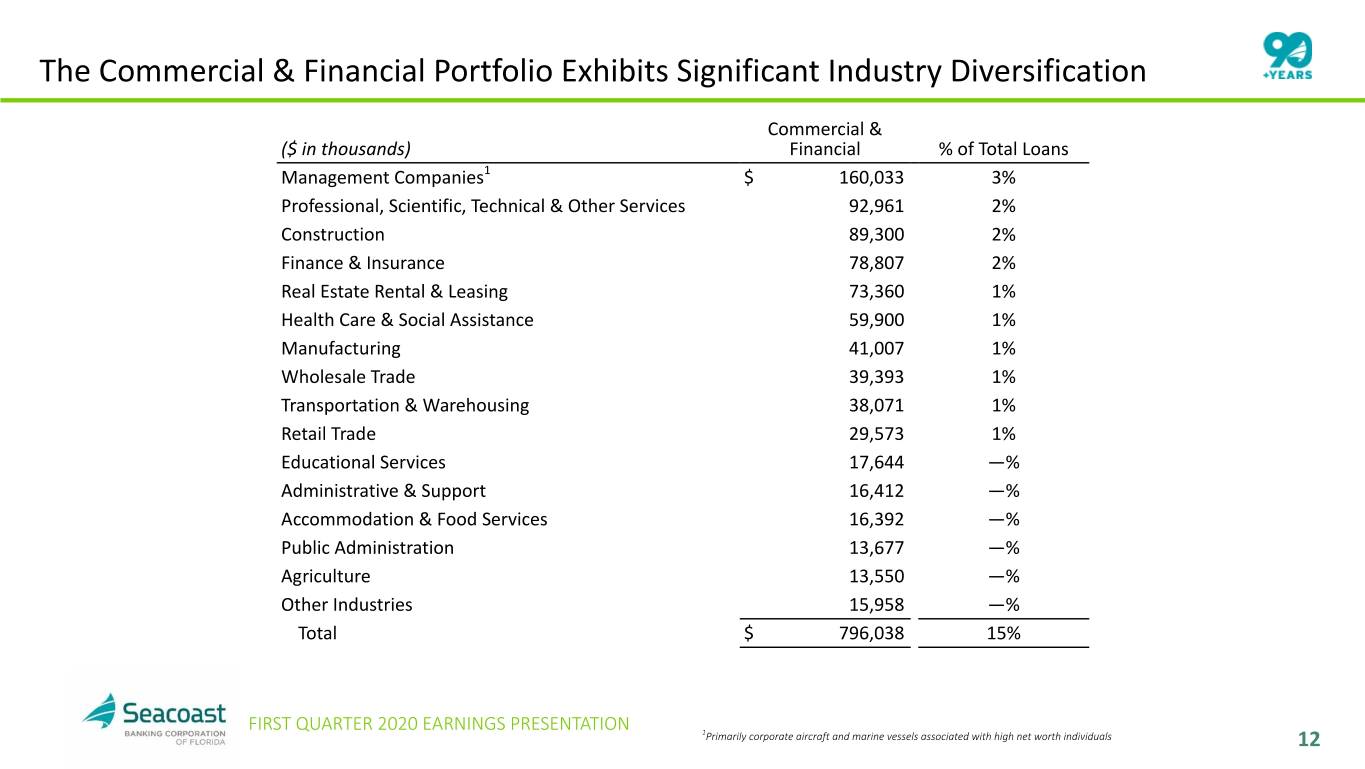
The Commercial & Financial Portfolio Exhibits Significant Industry Diversification Commercial & ($ in thousands) Financial % of Total Loans Management Companies1 $ 160,033 3% Professional, Scientific, Technical & Other Services 92,961 2% Construction 89,300 2% Finance & Insurance 78,807 2% Real Estate Rental & Leasing 73,360 1% Health Care & Social Assistance 59,900 1% Manufacturing 41,007 1% Wholesale Trade 39,393 1% Transportation & Warehousing 38,071 1% Retail Trade 29,573 1% Educational Services 17,644 —% Administrative & Support 16,412 —% Accommodation & Food Services 16,392 —% Public Administration 13,677 —% Agriculture 13,550 —% Other Industries 15,958 —% Total $ 796,038 15% FIRST QUARTER 2020 EARNINGS PRESENTATION 1Primarily corporate aircraft and marine vessels associated with high net worth individuals 12

Investment Securities • Unrealized gains in the investment portfolio increased $7.3 million quarter-over-quarter as longer duration commercial mortgage backed securities and agency mortgages appreciated in value. Collateralized loan obligation ("CLO") values declined as a result of the COVID-19 market selloff in late March. • CLO holdings have significant credit support and collateral positions, are investment grade (88% AAA/AA and 12% A) and comprised only of broadly syndicated loans, managed by top quartile managers. CLO Investment Grade Credit Ratings Unrealized Gain (Loss) in Securities as of March 31, 2020 Unrealized Gain (in thousands) Book Value Market Value (Loss) 12% Available for Sale 39% Government backed $ 9,296 $ 9,583 $ 287 Agency mortgage backed 608,714 635,219 26,505 Private label MBS and CMOs 52,868 50,569 (2,299) 49% Municipal 27,909 29,211 1,302 CLO 205,238 185,729 (19,509) Total Available for Sale $ 904,025 $ 910,311 $ 6,286 Credit Loan Level CLO Rating Support1 Market OC2 Held to Maturity Agency mortgage backed $ 252,373 $ 261,218 $ 8,845 AAA 36% 132% Total Held to Maturity $ 252,373 $ 261,218 $ 8,845 AA 28% 120% A 18% 103% Total Securities $ 1,156,398 $ 1,171,529 $ 15,131 Portfolio 30% 123% 1Source Data (Bloomberg) 2Loan Level Market Over-Collateralization calculated using market value of portfolio loans plus cash divided by liabilities FIRST QUARTER 2020 EARNINGS PRESENTATION 13
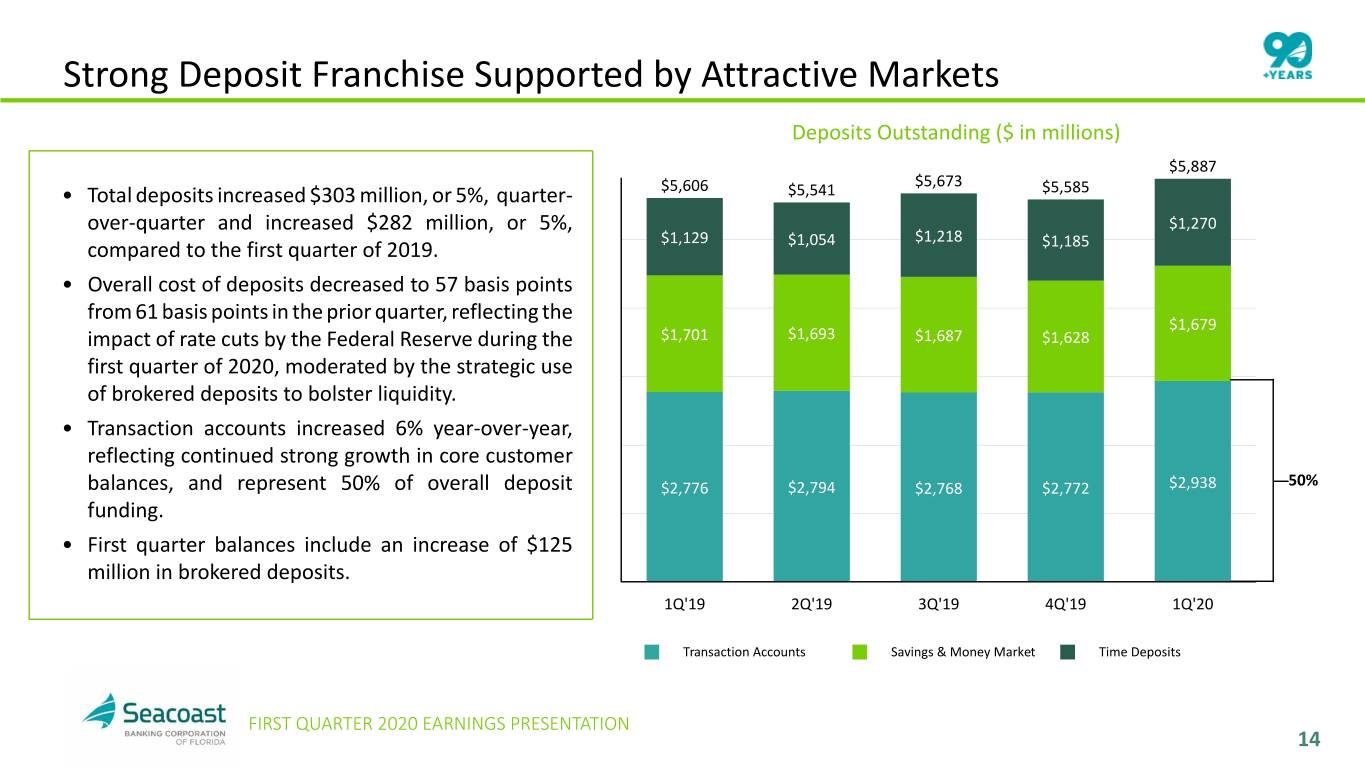
Strong Deposit Franchise Supported by Attractive Markets Deposits Outstanding ($ in millions) $5,887 $5,673 • Total deposits increased $303 million, or 5%, quarter- $5,606 $5,541 $5,585 over-quarter and increased $282 million, or 5%, $1,270 $1,129 $1,218 compared to the first quarter of 2019. $1,054 $1,185 • Overall cost of deposits decreased to 57 basis points from 61 basis points in the prior quarter, reflecting the $1,679 impact of rate cuts by the Federal Reserve during the $1,701 $1,693 $1,687 $1,628 first quarter of 2020, moderated by the strategic use of brokered deposits to bolster liquidity. • Transaction accounts increased 6% year-over-year, reflecting continued strong growth in core customer balances, and represent 50% of overall deposit $2,776 $2,794 $2,768 $2,772 $2,938 50% funding. • First quarter balances include an increase of $125 million in brokered deposits. 1Q'19 2Q'19 3Q'19 4Q'19 1Q'20 Transaction Accounts Savings & Money Market Time Deposits FIRST QUARTER 2020 EARNINGS PRESENTATION 14

Average Deposit Balances and Cost Deposit Mix and Cost of Deposits Trended Cost of Deposits Fed Funds Cost of Deposits 0.67% 0.76% 0.73% 0.61% 0.57% 9% 9% 9% 9% 9% 2.50%2.50%2.50% 20% 20% 20% 21% 21% 2.25% 2.00% 2.00% 21% 21% 21% 20% 20% 1.75% 1.75% 1.50% 1.25%1.25% 14% 14% 14% 14% 13% 1.00% 6% 6% 7% 6% 8% 0.75% 0.76% 0.67% 0.73% 0.61%0.57% 0.50% 0.54% 0.39%0.43% 30% 30% 29% 30% 29% 0.29%0.33% 0.22% 0.25% 0.15%0.14%0.14%0.17% 1Q'19 2Q'19 3Q'19 4Q'19 1Q'20 3Q'16 4Q'16 1Q'17 2Q'17 3Q'17 4Q'17 1Q'18 2Q'18 3Q'18 4Q'18 1Q'19 2Q'19 3Q'19 4Q'19 1Q'20 Our focus on organic growth and relationship-based funding, in combination with our innovative analytics platform, supports a well-diversified low-cost deposit portfolio. FIRST QUARTER 2020 EARNINGS PRESENTATION 15

CECL Adoption Impact of Adoption January 1, $27,674 ($ in thousands) 2020 $(973) $85,411 ) s $2,330 Increase to allowance for non-acquired loans $ 10,577 d n a s $21,226 Increase to allowance for acquired loans 10,649 u o h t Reversal of contra-loan balances for purchased n (706) i $35,154 $ credit impaired loans, now included in allowance ( Increase to reserve for unfunded commitments (included in Other Liabilities) 1,837 Tax effect (5,481) December 31, Adoption Acquisition Q1 Net March 31, 2019 of CECL of FBPB Build Charge-Offs 2020 Decrease to retained earnings upon adoption $ 16,876 The allowance for credit losses as of March 31, 2020 reflects management's estimate of lifetime expected credit losses. The estimation process incorporates Moody's baseline forecast as of March 31, 2020, which assumes a sudden and sharp recession as a result of COVID-19, with a strong rebound to economic expansion. Qualitative considerations were incorporated reflecting the risk of uncertain, and possibly deteriorating, economic conditions, and for additional dimensions of risk not captured in the quantitative model. In March 2020, the regulatory agencies issued an interim final rule that allows banking organizations to temporarily delay the effects of CECL on regulatory capital for two years, followed by a three-year transition period. As of March 31, 2020, the Company's capital measures exclude the $16.9 million day 1 impact to retained earnings and 25% of the first quarter increase in the allowance for credit losses. FIRST QUARTER 2020 EARNINGS PRESENTATION 16

CECL Adoption and Allowance Coverage Allowance for Credit Losses Rollforward for the Three Months ended March 31, 2020 Impact of Initial Impact Provision TDR Beginning Adoption of Allowance on for Credit Charge-offs Recoveries Allowance Ending (In thousands) Balance ASC 326 PCD Loans Losses Adjustments Balance Construction and Land Development $ 1,842 $ 1,479 $ 59 $ 1,238 $ — $ 29 $ — $ 4,647 Commercial Real Estate - Owner 5,361 80 207 (263) (44) — (13) 5,328 Occupied Commercial Real Estate - Non Owner 7,863 9,341 112 18,310 (12) 28 — 35,642 Occupied Residential Real Estate 7,667 5,787 110 6,246 (18) 116 (10) 19,898 Commercial and Financial 9,716 3,677 23 2,736 (1,099) 419 — 15,472 Consumer 2,705 862 5 1,246 (473) 80 (1) 4,424 Totals $ 35,154 $ 21,226 $ 516 $ 29,513 $ (1,646) $ 672 $ (24) $ 85,411 Total Allowance for Credit Losses to Total Loans by Loan Segment 12/31/2019 1/1/2020 3/31/2020 Construction and Land Development 0.57% 1.02% 1.57% Commercial Real Estate - Owner 0.52% 0.53% 0.49% Occupied Commercial Real Estate - Non Owner 0.59% 1.28% 2.59% Occupied Residential Real Estate 0.51% 0.89% 1.28% Commercial and Financial 1.25% 1.72% 1.94% Consumer 1.30% 1.71% 2.19% Totals 0.68% 1.08% 1.61% FIRST QUARTER 2020 EARNINGS PRESENTATION 17
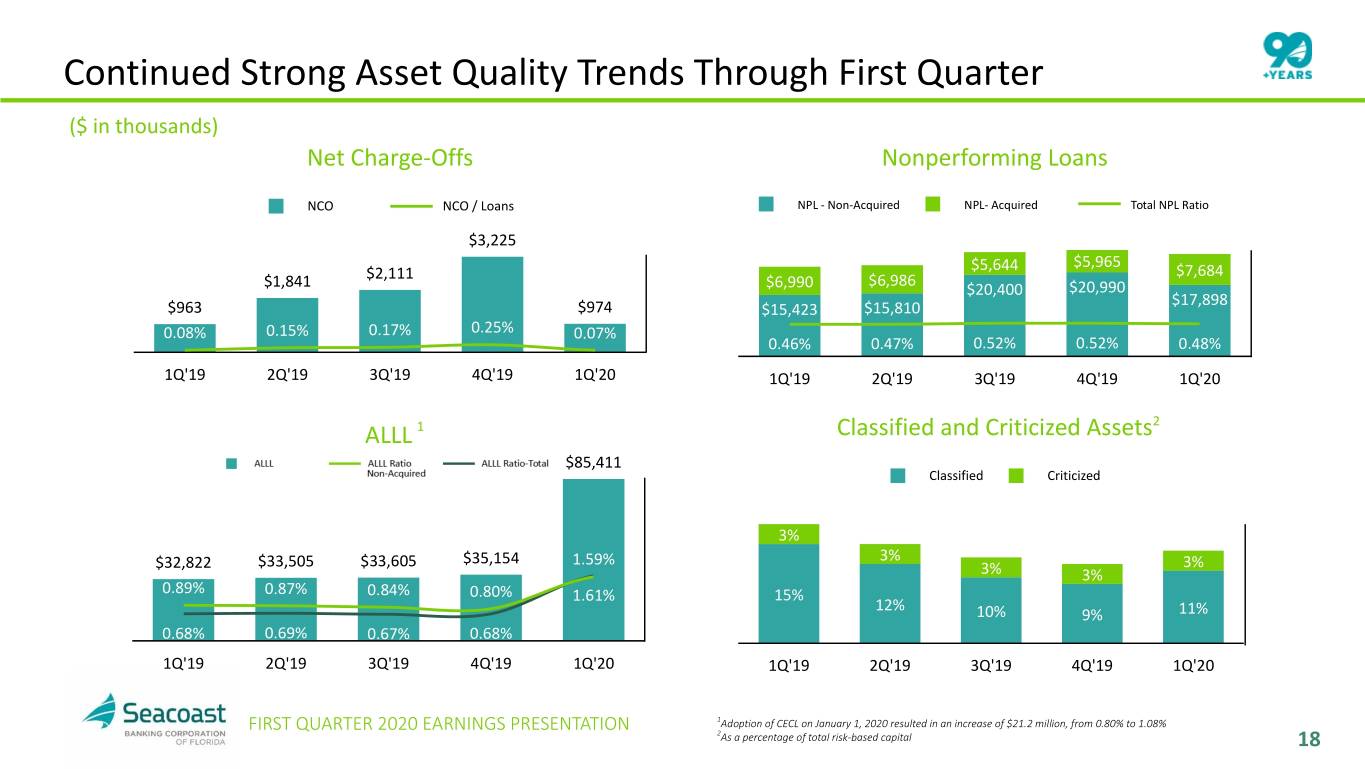
Continued Strong Asset Quality Trends Through First Quarter ($ in thousands) Net Charge-Offs Nonperforming Loans NCO NCO / Loans NPL - Non-Acquired NPL- Acquired Total NPL Ratio $3,225 $5,965 $5,644 $7,684 $2,111 $6,986 $1,841 $6,990 $20,400 $20,990 $17,898 $963 $974 $15,423 $15,810 0.08% 0.15% 0.17% 0.25% 0.07% 0.46% 0.47% 0.52% 0.52% 0.48% 1Q'19 2Q'19 3Q'19 4Q'19 1Q'20 1Q'19 2Q'19 3Q'19 4Q'19 1Q'20 2 ALLL 1 Classified and Criticized Assets $85,411 Classified Criticized 3% $32,822 $33,505 $33,605 $35,154 1.59% 3% 3% 3% 3% 0.89% 0.87% 0.84% 0.80% 1.61% 15% 12% 10% 9% 11% 0.68% 0.69% 0.67% 0.68% 1Q'19 2Q'19 3Q'19 4Q'19 1Q'20 1Q'19 2Q'19 3Q'19 4Q'19 1Q'20 FIRST QUARTER 2020 EARNINGS PRESENTATION 1Adoption of CECL on January 1, 2020 resulted in an increase of $21.2 million, from 0.80% to 1.08% 2As a percentage of total risk-based capital 18
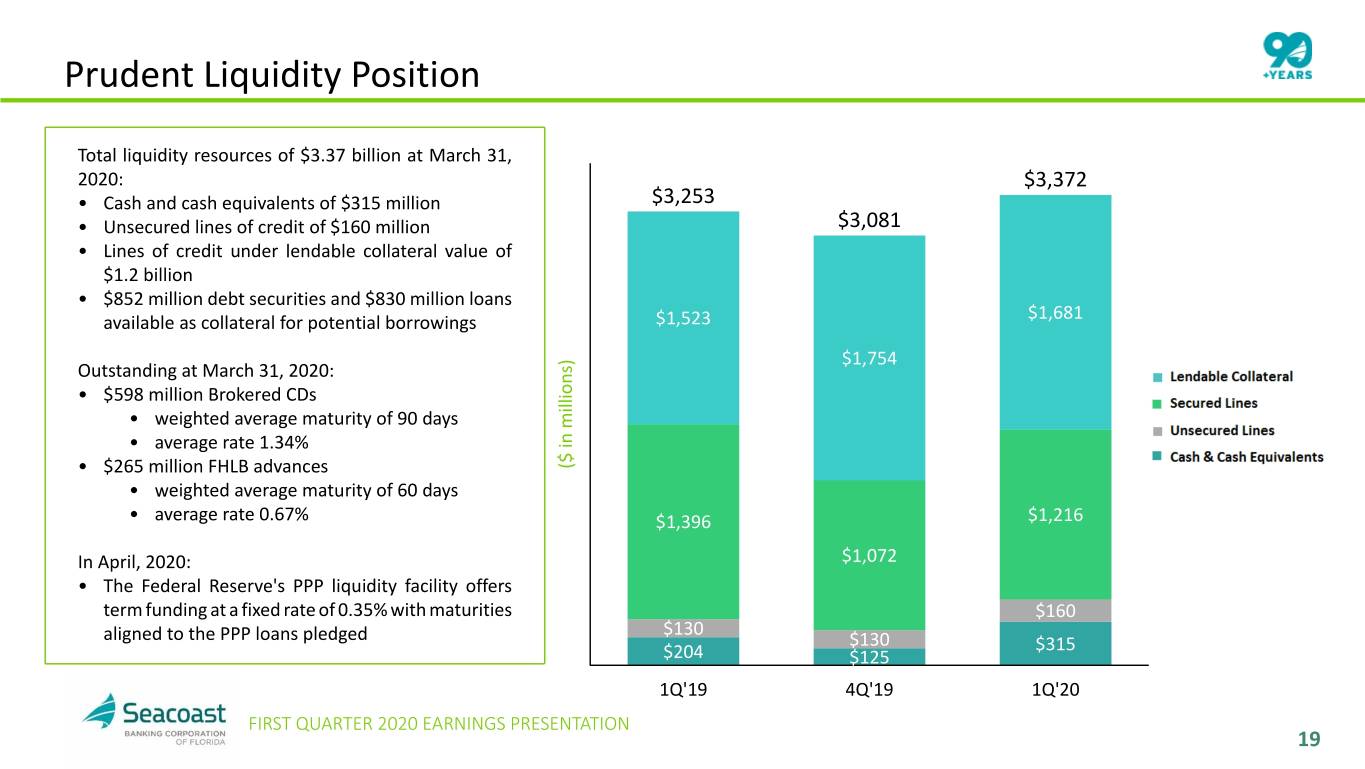
Prudent Liquidity Position Total liquidity resources of $3.37 billion at March 31, 2020: $3,372 • Cash and cash equivalents of $315 million $3,253 • Unsecured lines of credit of $160 million $3,081 • Lines of credit under lendable collateral value of $1.2 billion • $852 million debt securities and $830 million loans $1,681 available as collateral for potential borrowings $1,523 ) $1,754 Outstanding at March 31, 2020: s n o i • $598 million Brokered CDs l l i • weighted average maturity of 90 days m n • average rate 1.34% i $ • $265 million FHLB advances ( • weighted average maturity of 60 days • average rate 0.67% $1,396 $1,216 In April, 2020: $1,072 • The Federal Reserve's PPP liquidity facility offers term funding at a fixed rate of 0.35% with maturities $160 aligned to the PPP loans pledged $130 $130 $315 $204 $125 1Q'19 4Q'19 1Q'20 FIRST QUARTER 2020 EARNINGS PRESENTATION 19
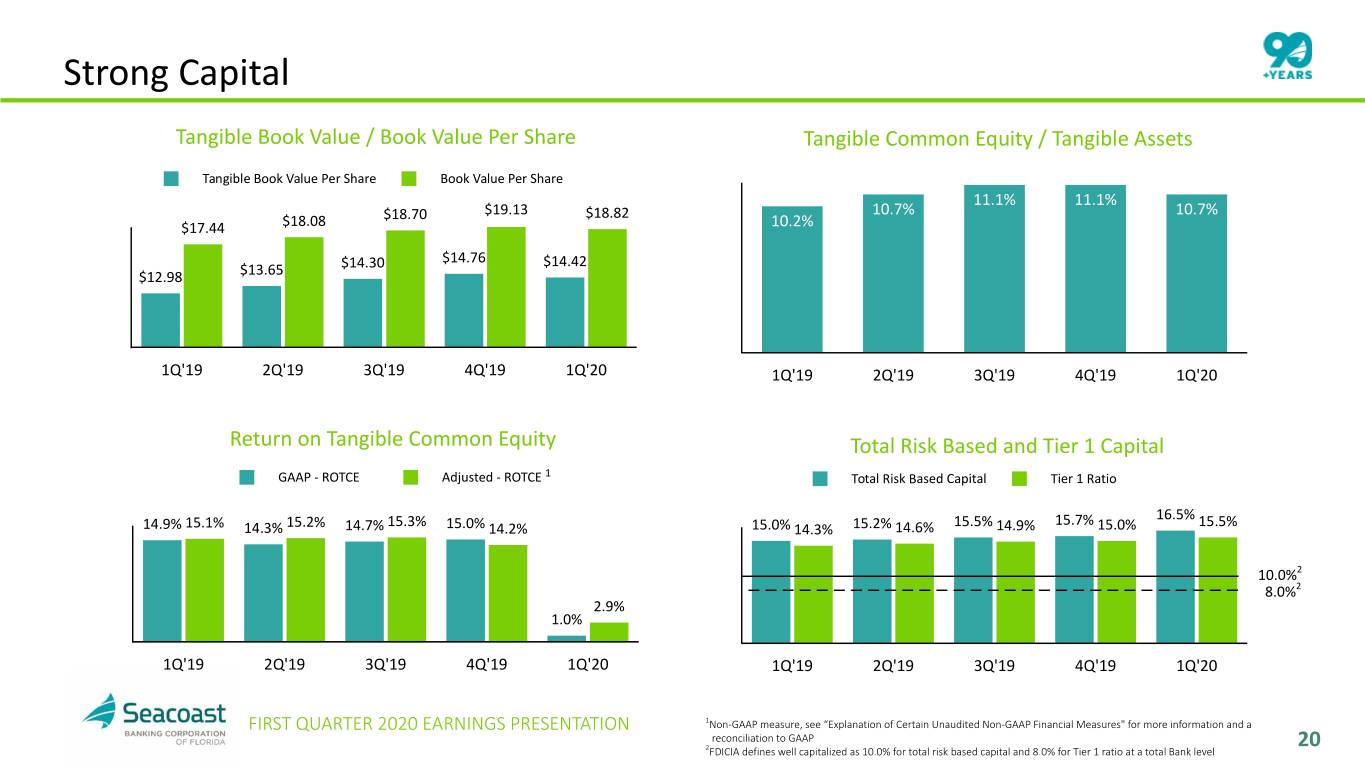
Strong Capital Tangible Book Value / Book Value Per Share Tangible Common Equity / Tangible Assets Tangible Book Value Per Share Book Value Per Share 11.1% 11.1% $18.70 $19.13 $18.82 10.7% 10.7% $17.44 $18.08 10.2% $14.30 $14.76 $14.42 $12.98 $13.65 1Q'19 2Q'19 3Q'19 4Q'19 1Q'20 1Q'19 2Q'19 3Q'19 4Q'19 1Q'20 Return on Tangible Common Equity Total Risk Based and Tier 1 Capital GAAP - ROTCE Adjusted - ROTCE 1 Total Risk Based Capital Tier 1 Ratio 15.3% 15.5% 15.7% 16.5% 15.5% 14.9% 15.1% 14.3% 15.2% 14.7% 15.0% 14.2% 15.0% 14.3% 15.2% 14.6% 14.9% 15.0% 10.0%2 8.0%2 2.9% 1.0% 1Q'19 2Q'19 3Q'19 4Q'19 1Q'20 1Q'19 2Q'19 3Q'19 4Q'19 1Q'20 FIRST QUARTER 2020 EARNINGS PRESENTATION 1Non-GAAP measure, see “Explanation of Certain Unaudited Non-GAAP Financial Measures" for more information and a reconciliation to GAAP 2 20 FDICIA defines well capitalized as 10.0% for total risk based capital and 8.0% for Tier 1 ratio at a total Bank level

Steady Increase in Shareholder Value $14.76 $14.30 $14.42 $13.65 $12.98 $12.33 $12.01 $11.67 $11.39 $11.15 $10.95 $10.55 2Q'17 3Q'17 4Q'17 1Q'18 2Q'18 3Q'18 4Q'18 1Q'19 2Q'19 3Q'19 4Q'19 1Q'20 • Compounded annual growth rate of 11% in tangible book value per share in the last three years. • The decline quarter-over-quarter in tangible book value per share was primarily the Day-1 impact of the adoption of CECL. Tangible book value per share was also modestly impacted by the acquisition of FBPB. FIRST QUARTER 2020 EARNINGS PRESENTATION 21

Contact Details: Seacoast Banking Corporation of Florida Charles M. Shaffer Executive Vice President Chief Operating Officer and Chief Financial Officer (772) 221-7003 INVESTOR RELATIONS NASDAQ: SBCF FIRST QUARTER 2020 EARNINGS PRESENTATION 22

Appendix FIRST QUARTER 2020 EARNINGS PRESENTATION 23

First Bank of The Palm Beaches Acquisition Fair Value of Assets and Liabilities Acquired (Preliminary) Loan Portfolio Valuation and CECL Impact • Loans acquired of $146.9 million includes: As of Acquisition ◦ $2.9 million purchase discount on $106.7 million in non-PCD loans, to be accreted (In thousands) Date March 13, 2020 through yield over the life of the loans. Assets: ◦ $0.6 million purchase discount on $43.7 million in PCD loans, of which $0.5 million is recorded as an allowance, and $0.1 million will be accreted through Cash $ 34,749 yield over the life of the loans. • $2.3 million in allowance, or 1.5% of the acquired loan balance recorded on day one: Debt securities 447 ◦ $1.8 million on non-PCD loans recorded as provision expense through the income Loans, net 146,839 statement. Fixed assets 6,086 ◦ $0.5 million on PCD loans recorded as an increase to the loans' amortized cost basis. Core deposit intangibles 819 PCD Loan Identification Loans acquired were identified as PCD based on the following criteria: Goodwill 6,799 • Past due 30 days over the life of the loan Other assets 1,285 • Rating below "pass" Totals $ 197,024 • FICO < 640 • Industries highly affected by COVID-19: Liabilities: ◦ Construction Deposits $ 173,741 ◦ Retail Store ◦ Tourism, including hotels Other liabilities 1,386 ◦ Restaurants & Food Service Totals $ 175,127 ◦ Agriculture & Farming FIRST QUARTER 2020 EARNINGS PRESENTATION 24
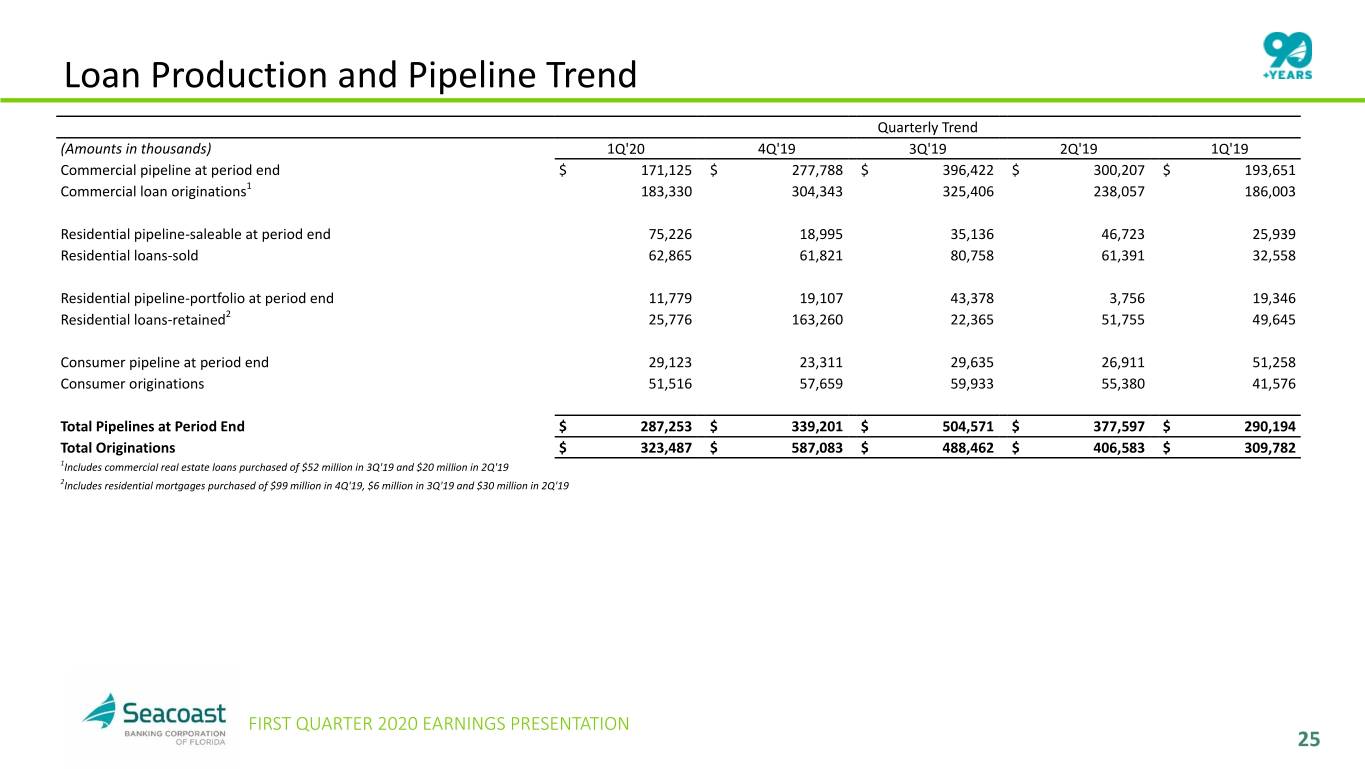
Loan Production and Pipeline Trend Quarterly Trend (Amounts in thousands) 1Q'20 4Q'19 3Q'19 2Q'19 1Q'19 Commercial pipeline at period end $ 171,125 $ 277,788 $ 396,422 $ 300,207 $ 193,651 Commercial loan originations1 183,330 304,343 325,406 238,057 186,003 Residential pipeline-saleable at period end 75,226 18,995 35,136 46,723 25,939 Residential loans-sold 62,865 61,821 80,758 61,391 32,558 Residential pipeline-portfolio at period end 11,779 19,107 43,378 3,756 19,346 Residential loans-retained2 25,776 163,260 22,365 51,755 49,645 Consumer pipeline at period end 29,123 23,311 29,635 26,911 51,258 Consumer originations 51,516 57,659 59,933 55,380 41,576 Total Pipelines at Period End $ 287,253 $ 339,201 $ 504,571 $ 377,597 $ 290,194 Total Originations $ 323,487 $ 587,083 $ 488,462 $ 406,583 $ 309,782 1Includes commercial real estate loans purchased of $52 million in 3Q'19 and $20 million in 2Q'19 2Includes residential mortgages purchased of $99 million in 4Q'19, $6 million in 3Q'19 and $30 million in 2Q'19 FIRST QUARTER 2020 EARNINGS PRESENTATION 25

Explanation of Certain Unaudited Non-GAAP Financial Measures This presentation contains financial information determined by These measures are also useful in understanding performance trends methods other than Generally Accepted Accounting Principles and facilitate comparisons with the performance of other financial (“GAAP”). The financial highlights provide reconciliations between institutions. The limitations associated with operating measures are GAAP and adjusted financial measures including net income, the risk that persons might disagree as to the appropriateness of items noninterest income, noninterest expense, tax adjustments and other comprising these measures and that different companies might define financial ratios. Management uses these non-GAAP financial measures or calculate these measures differently. The Company provides in its analysis of the Company’s performance and believes these reconciliations between GAAP and these non-GAAP measures. These presentations provide useful supplemental information, and a clearer disclosures should not be considered an alternative to GAAP. understanding of the Company’s performance. The Company believes the non-GAAP measures enhance investors’ understanding of the Company’s business and performance and if not provided would be requested by the investor community. FIRST QUARTER 2020 EARNINGS PRESENTATION 26
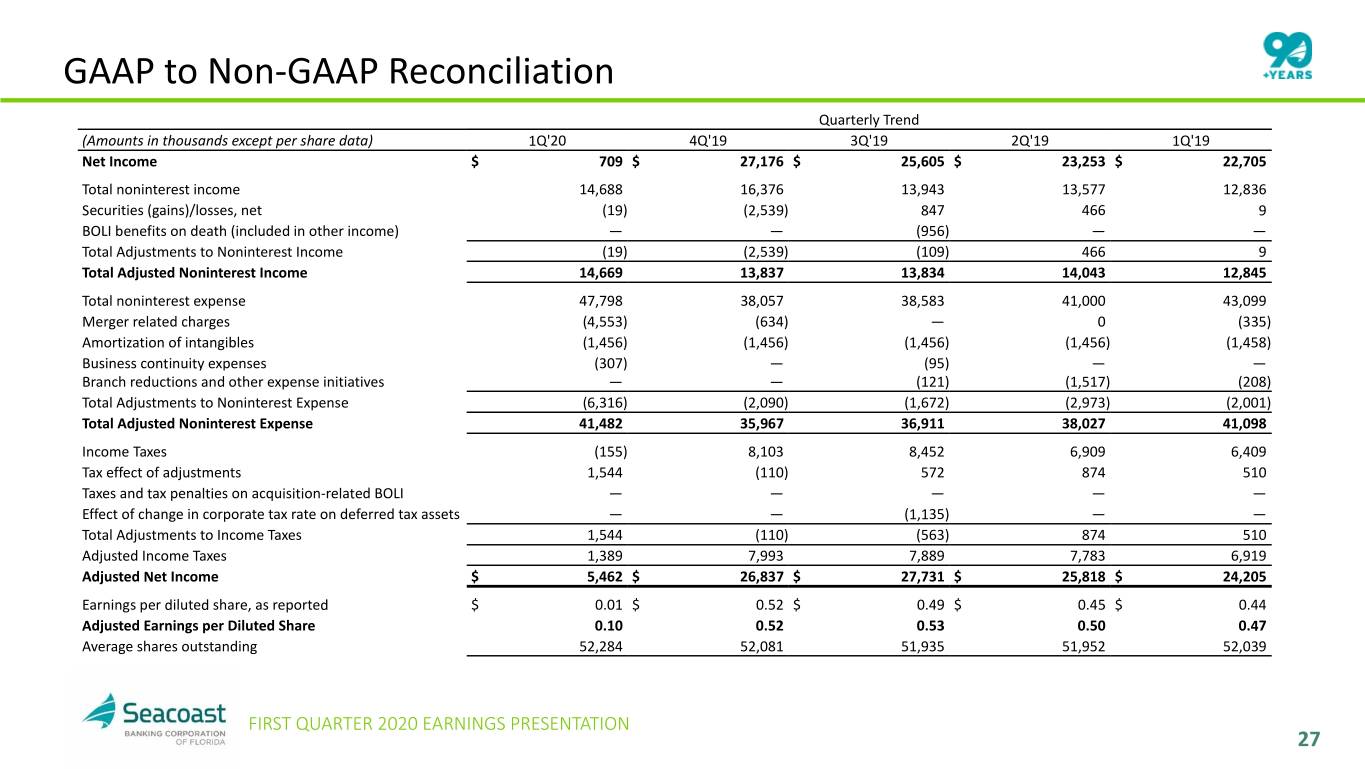
GAAP to Non-GAAP Reconciliation Quarterly Trend (Amounts in thousands except per share data) 1Q'20 4Q'19 3Q'19 2Q'19 1Q'19 Net Income $ 709 $ 27,176 $ 25,605 $ 23,253 $ 22,705 Total noninterest income 14,688 16,376 13,943 13,577 12,836 Securities (gains)/losses, net (19) (2,539) 847 466 9 BOLI benefits on death (included in other income) — — (956) — — Total Adjustments to Noninterest Income (19) (2,539) (109) 466 9 Total Adjusted Noninterest Income 14,669 13,837 13,834 14,043 12,845 Total noninterest expense 47,798 38,057 38,583 41,000 43,099 Merger related charges (4,553) (634) — 0 (335) Amortization of intangibles (1,456) (1,456) (1,456) (1,456) (1,458) Business continuity expenses (307) — (95) — — Branch reductions and other expense initiatives — — (121) (1,517) (208) Total Adjustments to Noninterest Expense (6,316) (2,090) (1,672) (2,973) (2,001) Total Adjusted Noninterest Expense 41,482 35,967 36,911 38,027 41,098 Income Taxes (155) 8,103 8,452 6,909 6,409 Tax effect of adjustments 1,544 (110) 572 874 510 Taxes and tax penalties on acquisition-related BOLI — — — — — Effectredemption of change in corporate tax rate on deferred tax assets — — (1,135) — — Total Adjustments to Income Taxes 1,544 (110) (563) 874 510 Adjusted Income Taxes 1,389 7,993 7,889 7,783 6,919 Adjusted Net Income $ 5,462 $ 26,837 $ 27,731 $ 25,818 $ 24,205 Earnings per diluted share, as reported $ 0.01 $ 0.52 $ 0.49 $ 0.45 $ 0.44 Adjusted Earnings per Diluted Share 0.10 0.52 0.53 0.50 0.47 Average shares outstanding 52,284 52,081 51,935 51,952 52,039 FIRST QUARTER 2020 EARNINGS PRESENTATION 27

GAAP to Non-GAAP Reconciliation Quarterly Trend (Amounts in thousands except per share data) 1Q'20 4Q'19 3Q'19 2Q'19 1Q'19 Adjusted Noninterest Expense $ 41,482 $ 35,967 $ 36,911 $ 38,027 $ 41,098 Foreclosed property expense and net gain/(loss) on sale 315 (3) (262) 174 40 Net Adjusted Noninterest Expense $ 41,797 $ 35,964 $ 36,649 $ 38,201 $ 41,138 Revenue $ 77,865 $ 78,136 $ 74,891 $ 73,713 $ 73,610 Total Adjustments to Revenue (19) (2,539) (109) 466 9 Impact of FTE adjustment 115 87 79 83 87 Adjusted Revenue on a Fully Taxable Equivalent Basis $ 77,961 $ 75,684 $ 74,861 $ 74,262 $ 73,706 Adjusted Efficiency Ratio 53.61% 47.52% 48.96% 51.44% 55.81% Average Assets $ 7,055,543 $ 6,996,214 $ 6,820,576 $ 6,734,994 $ 6,770,978 Less average goodwill and intangible assets (226,712) (226,060) (227,389) (228,706) (230,066) Average Tangible Assets $ 6,828,831 $ 6,770,154 $ 6,593,187 $ 6,506,288 $ 6,540,912 Return on Average Assets (ROA) 0.04% 1.54% 1.49% 1.38% 1.36% Impact of removing average intangible assets and related 0.07 0.12 0.12 0.12 0.12 amortization Return on Average Tangible Assets (ROTA) 0.11 1.66 1.61 1.50 1.48 Impact of other adjustments for Adjusted Net Income 0.21 (0.09) 0.06 0.09 0.02 Adjusted Return on Average Tangible Assets 0.32 1.57 1.67 1.59 1.50 Average Shareholders' Equity $ 993,993 $ 976,200 $ 946,670 $ 911,479 $ 879,564 Less average goodwill and intangible assets (226,712) (226,060) (227,389) (228,706) (230,066) Average Tangible Equity $ 767,281 $ 750,140 $ 719,281 $ 682,773 $ 649,498 Return on Average Shareholders' Equity 0.29% 11.04% 10.73% 10.23% 10.47% Impact of removing average intangible assets and related 0.66 3.91 4.00 4.07 4.39 amortization Return on Average Tangible Common Equity (ROTCE) 0.95 14.95 14.73 14.30 14.86 Impact of other adjustments for Adjusted Net Income 1.91 (0.76) 0.57 0.87 0.25 Adjusted Return on Average Tangible Common Equity 2.86 14.19 15.30 15.17 15.11 FIRST QUARTER 2020 EARNINGS PRESENTATION 28

GAAP to Non-GAAP Reconciliation Quarterly Trend (Amounts in thousands except per share data) 1Q'20 4Q'19 3Q'19 2Q'19 1Q'19 Loan interest income excluding accretion on acquired loans $ 59,237 $ 59,515 $ 59,279 $ 58,169 $ 58,397 Accretion on acquired loans 4,287 3,407 3,859 4,166 3,938 Loan Interest Income1 $ 63,524 $ 62,922 $ 63,138 $ 62,335 $ 62,335 Yield on loans excluding accretion on acquired loans 4.57% 4.63% 4.76% 4.82% 4.89% Impact of accretion on acquired loans 0.33 0.26 0.30 0.34 0.33 Yield on Loans1 4.90 4.89 5.06 5.16 5.22 Net interest income excluding accretion on acquired loans $ 59,004 $ 58,439 $ 57,168 $ 56,053 $ 56,923 Accretion on acquired loans 4,287 3,407 3,859 4,166 3,938 Net Interest Income1 $ 63,291 $ 61,846 $ 61,027 $ 60,219 $ 60,861 Net interest margin excluding accretion on acquired loans 3.66% 3.63% 3.64% 3.67% 3.76% Impact of accretion on acquired loans 0.27 0.21 0.25 0.27 0.26 Net Interest Margin1 3.93 3.84 3.89 3.94 4.02 Security interest income excluding tax equivalent adjustment $ 8,817 $ 8,630 $ 8,933 $ 9,076 $ 9,270 Tax equivalent adjustment on securities 31 32 33 36 39 Security Interest Income1 $ 8,848 $ 8,662 $ 8,966 $ 9,112 $ 9,309 Loan interest income excluding tax equivalent adjustment $ 63,440 $ 62,867 $ 63,091 $ 62,287 $ 62,287 Tax equivalent adjustment on loans 84 55 47 48 48 Loan Interest Income1 $ 63,524 $ 62,922 $ 63,138 $ 62,335 $ 62,335 Net interest income excluding tax equivalent adjustments $ 63,176 $ 61,759 $ 60,947 $ 60,135 $ 60,774 Tax equivalent adjustment on securities 31 32 33 36 39 Tax equivalent adjustment on loans 84 55 47 48 48 Net Interest Income1 $ 63,291 $ 61,846 $ 61,027 $ 60,219 $ 60,861 1On a fully taxable equivalent basis. All yields and rates have been computed using amortized cost. FIRST QUARTER 2020 EARNINGS PRESENTATION 29

GAAP to Non-GAAP Reconciliation $307 $1,456 $5,462 $4,553 ) s $(1,544) $(19) d n a s u o h t n i $ ( $709 Net Income Merger Amortization Business Tax Effect Securities Adjusted Related of Intangibles Continuity of Adjustments Gains, Net Net Income Charges Expenses FIRST QUARTER 2020 EARNINGS PRESENTATION 30
