Attached files
| file | filename |
|---|---|
| EX-99.1 - EXHIBIT 99.1 - CMS ENERGY CORP | tm2016795d1_ex99-1.htm |
| 8-K - FORM 8-K - CMS ENERGY CORP | tm2016795-1_8k.htm |
Exhibit 99.2

First Quarter 2020 Results and Outlook April 27, 2020FOCUSED ON WORLD CLASS PERFORMANCE

This presentation is made as of the date hereof and contains “forward-looking statements” as defined in Rule 3b-6 of the Securities Exchange Act of 1934, Rule 175 of the Securities Act of 1933, and relevant legal decisions. The forward-looking statements are subject to risks and uncertainties. All forward-looking statements should be considered in the context of the risk and other factors detailed from time to time in CMS Energy’s and Consumers Energy’s Securities and Exchange Commission filings. Forward-looking statements should be read in conjunction with “FORWARD-LOOKING STATEMENTS AND INFORMATION” and “RISK FACTORS” sections of CMS Energy’s and Consumers Energy’s most recent Form 10-K and as updated in reports CMS Energy and Consumers Energy file with the Securities and Exchange Commission. CMS Energy’s and Consumers Energy’s “FORWARD-LOOKING STATEMENTS AND INFORMATION” and “RISK FACTORS” sections are incorporated herein by reference and discuss important factors that could cause CMS Energy’s and Consumers Energy’s results to differ materially from those anticipated in such statements. CMS Energy and Consumers Energy undertake no obligation to update any of the information presented herein to reflect facts, events or circumstances after the date hereof.The presentation also includes non-GAAP measures when describing CMS Energy’s results of operations and financial performance. A reconciliation of each of these measures to the most directly comparable GAAP measure is included in the appendix and posted on our website at www.cmsenergy.com.CMS Energy provides historical financial results on both a reported (GAAP) and adjusted (non-GAAP) basis and provides forward-looking guidance on an adjusted basis. During an oral presentation, references to “earnings” are on an adjusted basis. All references to net income refer to net income available to common stockholders and references to earnings per share are on a diluted basis. Adjustments could include items such as discontinued operations, asset sales, impairments, restructuring costs, regulatory items from prior years, or other items. Management views adjusted earnings as a key measure of the company’s present operating financial performance and uses adjusted earnings for external communications with analysts and investors. Internally, the company uses adjusted earnings to measure and assess performance. Because the company is not able to estimate the impact of specific line items, which have the potential to significantly impact, favorably or unfavorably, the company's reported earnings in future periods, the company is not providing reported earnings guidance nor is it providing a reconciliation for the comparable future period earnings. The adjusted earnings should be considered supplemental information to assist in understanding our business results, rather than as a substitute for the reported earnings.Investors and others should note that CMS Energy routinely posts important information on its website and considers the Investor Relations section, www.cmsenergy.com/investor-relations, a channel of distribution.2

AgendaBusiness Update & Long-Term Outlook Patti PoppeCOVID-19 Response President & CEOPEOPLEPLANETPROFITFinancial Results Rejji HayesExecutive VP & CFO3

First Quarter . . .Results Amount a First Quarter 2020 EPS $0.86Guidance (as of 1/30/20) a Full-year EPS $2.64 – $2.68Long-Term OutlookCommentaryChallenging weather offset by cost managementUnchanged given uncertainty of duration & full impact of COVID-19EPS a& DPS Growth+6% to +8%Long-term investment thesis remains intacta _ _ _ _ _ Adjusted EPS (non-GAAP). . . earnings growth despite headwinds.4
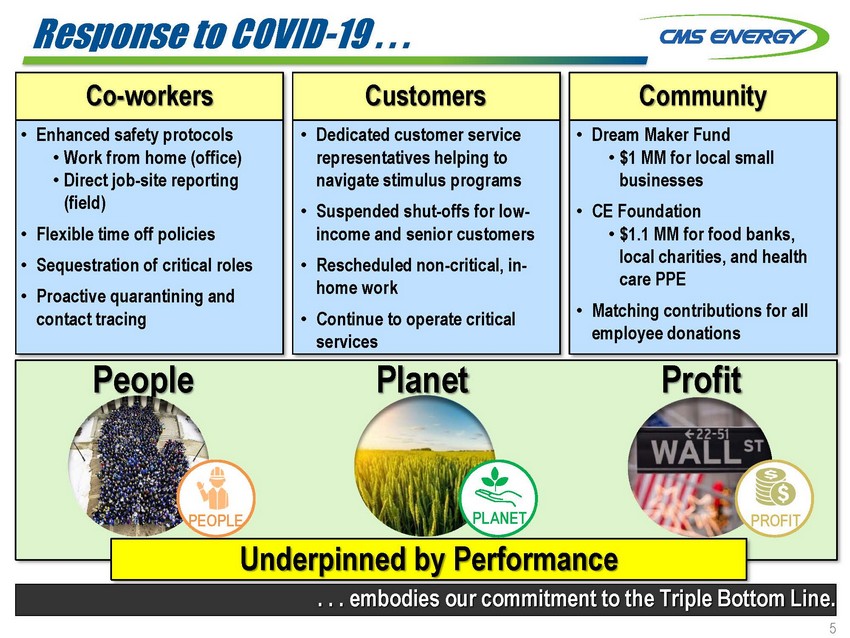
Response to COVID-19 . . .Co-workers Customers Community• Enhanced safety protocols • Work from home (office) • Direct job-site reporting (field)• Flexible time off policies• Sequestration of critical roles• Proactive quarantining and contact tracing• Dedicated customer service representatives helping to navigate stimulus programs• Suspended shut-offs for low- income and senior customers• Rescheduled non-critical, in- home work• Continue to operate critical services• Dream Maker Fund • $1 MM for local small businesses• CE Foundation • $1.1 MM for food banks, local charities, and health care PPE• Matching contributions for all employee donationsPeoplePlanet ProfitPEOPLEPLANETPROFITUnderpinned by Performance. . . embodies our commitment to the Triple Bottom Line.5

Managing Work Every Year . . .a EPS20122013 2014 20152016 201720182019$2.60+7%+7%+7%+7%Storms (9)¢Weather (13)¢+7%+7%+7%Weather (13)¢+7%Weather & storms (13)¢Weather & storms (16)¢Storms (10)¢_ _ _ _ _ a Adjusted EPS (non-GAAP). . . maximizes benefits for customers and investors. 6
Compelling Investment Thesis . . .Clean Energy LeaderAging InfrastructureConstructive RegulationStrong Cash Flow & Balance SheetAffordable PricesDiversified Service Territory. . . adaptive to changing conditions.

2020 First Quarter EPS Results . . .ResultsBy Business Segment2019 2020EPS – (GAAP) $0.75 $0.85aUtilityEnterprisesEPS $0.860.06AdjustmentsAdjusted (non-GAAP)--$0.750.01$0.86EnerBankParent & otherCMS Energy0.05(0.11)$0.86_ _ _ _ _ a See non-GAAP reconciliations_ _ _ _ _ b Adjusted EPS (non-GAAP). . . driven by investments and cost performance.8

Key COVID-19 Financial Risks . . .Utility Enterprises EnerBank Parent/LiquidityPotential Impacts• Lower sales volume from commercial and industrial • Increased uncollectible accounts • Sequestration/quarantine-related costs• Revenue stability• Loan originations • Higher charge-offs• Capital market dislocation • Higher funding costsMitigating Factors• Higher margin residential usage • Regulatory deferral mechanisms • Operational flexibility/waste elimination • Fiscal stimulus customer support• Capacity and Energy at DIG are 100% & 95% contracted, respectively • Remaining assets are under long-term PPAs with quality off-takers/contracts• 750+ FICO score borrowers • Market share gain opportunities • Conservative loan loss provision • Lower funding costs• 2020 financing plan on track • No 2020 maturities remaining (no CP) • Planned equity needs fully priced • Conservative funding assumptions • No required pension contributions. . . difficult to predict, so preparing robust risk mitigation. 9

Preliminary April Sales Challenged . . .2019 Electric & Gas Rate MixAuto2020 EPS Sensitivities1% Full Year Δ in VolumeOther Industrial 11%Other 2% 2%Residential Commercial IndustrialElectric ~ 3+¢ ~ 2 ½ +Gas 2 ¢½Commercial 23%Residential Electric 39%Impact of Observed Electric Trends (since March)x ÷Residential Gas 23%Combined residential >60% (3)¢ - (4)¢/ mo. EPS impact during extensive social distancing_ _ _ _ _ a Tariff net of PSCR and GCR_ _ _ _ _ b Non-GAAP . . . partially offset by diversification and favorable mix. 10

2020 EPS . . .First Quarter Nine Months To Go$2.49(23)¢11¢12¢ 8¢4¢ - 8¢14¢ 4¢ (1)¢1¢ - 5¢$2.64 - $2.68 6% - 8%Select COVID-19 Risks: •SalesReference: •Historical flex range~(3)¢ - (4)¢/ mo.~10¢ - 15¢First Quarter $0.752019_ _ _ _ _Weather Absence of StormsRates & InvestmentUsage, Enterprises, Tax & OtherAbsence of 2019 WeatherRates & InvestmentUsage, Enterprises, Tax & OtherFirst Quarter $0.862020a Adjusted EPS (non-GAAP). . . manageable through Q1, with longer-term risks of COVID-19 unclear.1

Financing Plan on Track . . .Planned 2020 FinancingExisting FacilitiesConsumers Energy: First Mortgage BondsTerm LoanCMS Parent: New DebtPlanned EquityRetirements:Consumers EnergyOther:Pension Contribution_ _ _ _ _Plan (MM)$650$300$325 Up to $250$100$531YTD (MM)$575$300$300$100$100$5313.5% closed 3/26Term-loan L+50 2021 maturity$150 MM pricedCalled$250 MM (Nov-2021)$850 MM (Jun-2023)Consumers Energy$2.3 Bn a of net liquidity position with no CP outstanding (as of 3/31/20)$550 MM (Jun-2023)CMS Energya $1,606 MM in available revolvers + $834 MM of unrestricted cash - $119 MM of cash at EnerBank and Other . . . with emphasis on liquidity management. 12

Credit Metrics Maintained . . .Consumers EnergyS&P Moody’s FitchRatings DriversSenior Secured Commercial Paper Outlook CMS EnergySenior Unsecured Junior Subordinated OutlookAA-2StableBBB BBB- StableAa3P-1Stable Highest Governance Practices Score (GA-1)Baa1Baa2StableA+F-2StableBBB BB+ Stable• Strong financial position• Growing operating cash flow• Return on regulated investment• Supportive regulatory environmentLast Review Oct. 2019 Jul. 2019 Oct. 2019. . . at solid investment-grade levels. 13

Investment Thesis . . .Investment Thesis TakeawaysPrudent Liquidity Management • 2020 financings largely executed • No pension contributions required in 2020Operational Excellence and Track Record • Increased productivity driven by the CE Way • Adaptive to changing conditions Top-Tier Regulatory Construct • Forward-looking test years • 10-month rate cases Visible and Executable 10-yr Capital Plan ($25 Bn) • ~85% of projects are less than $200 MMClean and Lean Energy Strategy • Replacing PPAs and coal with renewables and energy waste reductionNearly two decades of industry-leading,• Net zero carbon (2040) and afinancial performancemethane (2030) goals_ _ _ _ _ a Methane emissions for our natural gas delivery system . . . remains intact, regardless of changing conditions. 14

Q & A Thank You!

Appendix
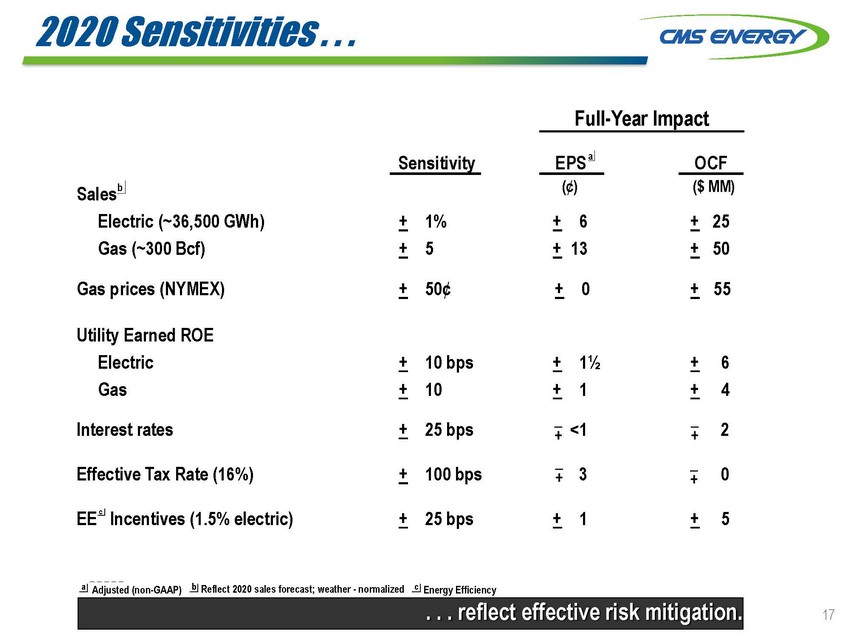
2020 Sensitivities . . .SensitivityFull-Year ImpactEPS a OCFSalesb Electric (~36,500 GWh) Gas (~300 Bcf)+ 1% + 5(¢)+ 6 + 13($ MM)+ 25 + 50Gas prices (NYMEX) + 50¢ + 0 + 55Utility Earned ROE Electric Gas+ 10 bps + 10+ 1½ + 6 + 1 + 4Interest rates + 25 bps <1 2Effective Tax Rate (16%) + 100 bps 3 0EE cIncentives (1.5% electric) + 25 bps + 1 + 5_ _ _ _ _ a Adjusted (non-GAAP)b Reflect 2020 sales forecast; weather - normalizedc Energy Efficiency . . . reflect effective risk mitigation. 17
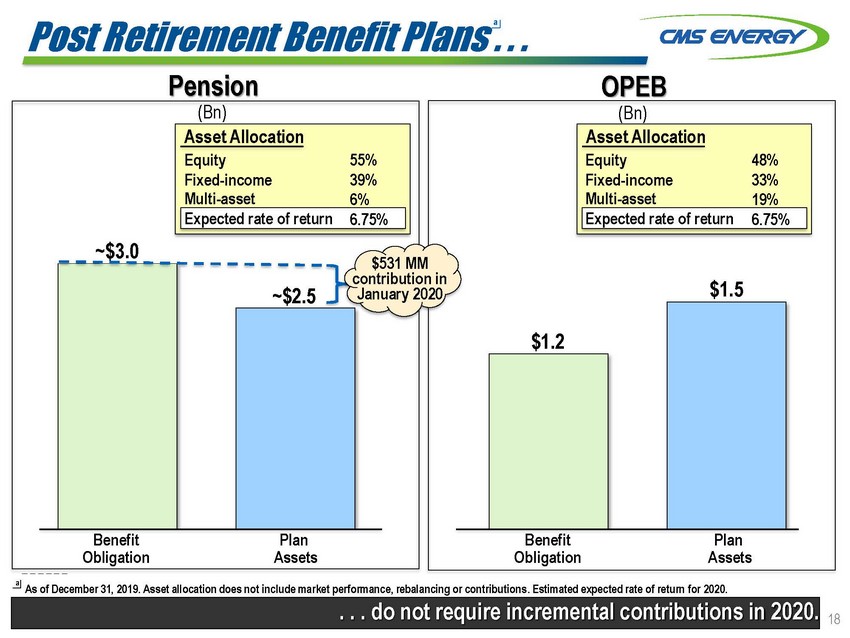
Post Retirement Benefit Plans . . .PensionOPEB(Bn) (Bn)~$3.0Asset Allocation Equity Fixed-income Multi-asset Expected rate of return~$2.555% 39% 6% 6.75%$531 MM contribution in January 2020Asset Allocation Equity Fixed-income Multi-asset Expected rate of return$1.548% 33% 19% 6.75%$1.2_ _ _ _ _ _ aBenefit ObligationPlan AssetsBenefit ObligationPlan AssetsAs of December 31, 2019. Asset allocation does not include market performance, rebalancing or contributions. Estimated expected rate of return for 2020. . . . do not require incremental contributions in 2020. 18
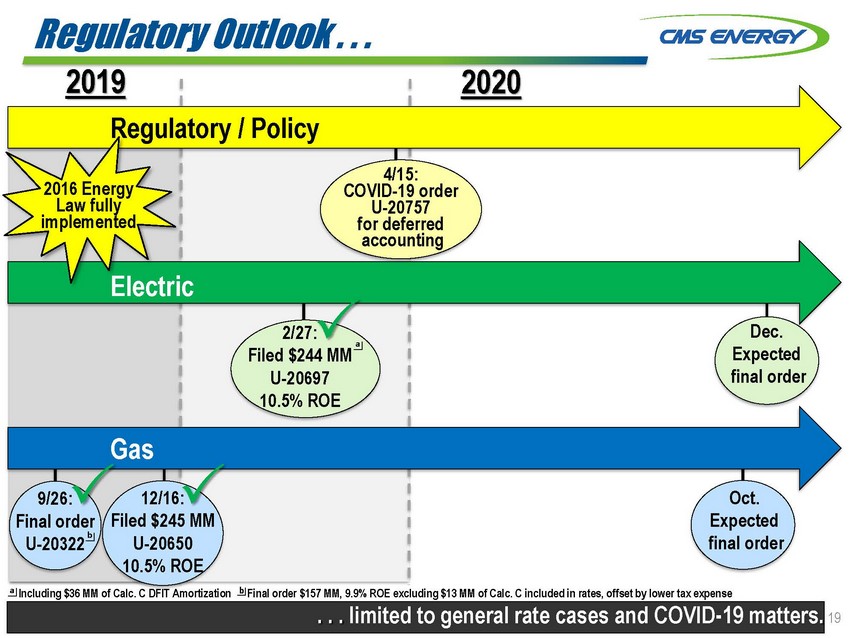
Regulatory Outlook . . . 2019Regulatory / Policy20202016 Energy Law fully implementedElectric4/15: COVID-19 order U-20757 for deferred accounting9/26: Final order U-20322Gas12/16: Filed $245 MM U-20650 10.5% ROE2/27: a Filed $244 MM U-20697 10.5% ROEDec. Expected final orderOct. Expected final ordera Including $36 MM of Calc. C DFIT Amortizationb Final order $157 MM, 9.9% ROE excluding $13 MM of Calc. C included in rates, offset by lower tax expense . . . to general rate cases and COVID-19 matters. 19
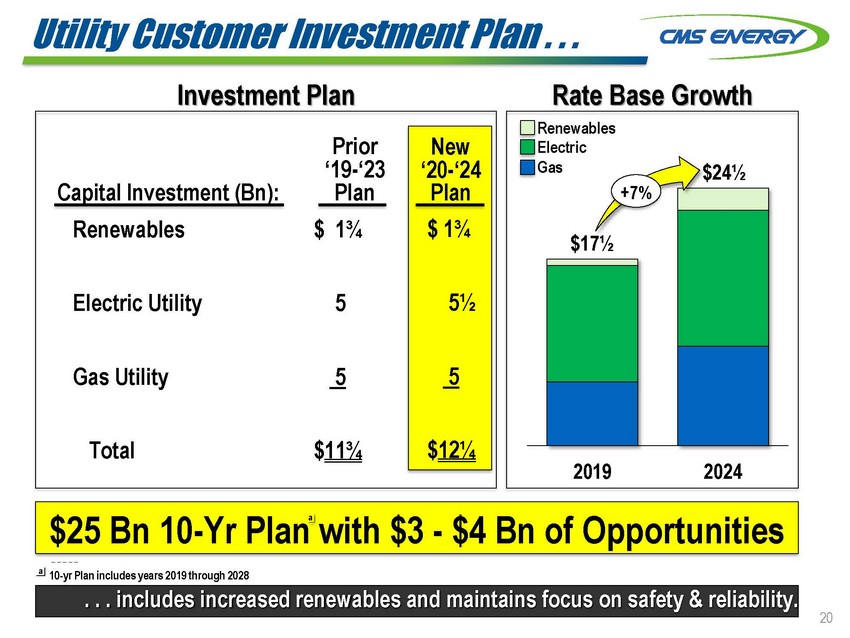
Utility Customer Investment Plan . . .Investment PlanPriorNewRate Base GrowthRenewables ElectricCapital Investment (Bn):Renewables Electric Utility Gas Utility‘19-‘23 Plan$ 1¾55‘20-‘24 Plan$ 1¾5½5Gas$17½+7%$24½Total$11¾$12¼2019 2024$25 Bn 10-Yr Plan with $3 - $4 Bn of Opportunities _ _ _ _ _a 10-yr Plan includes years 2019 through 2028 . . . includes increased renewables and maintains focus on safety & reliability. 20

CMS Enterprises . . .DIG & Other• ~1,000 MWs of plants in MI• DIG long-term energy (>95% contracted) & short-term capacity (100% contracted)• Filer City PPA with the Utility• Upside: tightening supply with future retirementsRenewable PlatformOperating Projects: • 27 MWs of solar • 64 MWs biomass • 105 MWs of wind (15-year PPA with GM)• Nearly 100% contracted• Upside: utility-like returns with creditworthy counterparties. . . continues to manage its portfolio with an emphasis on risk mitigation. 21
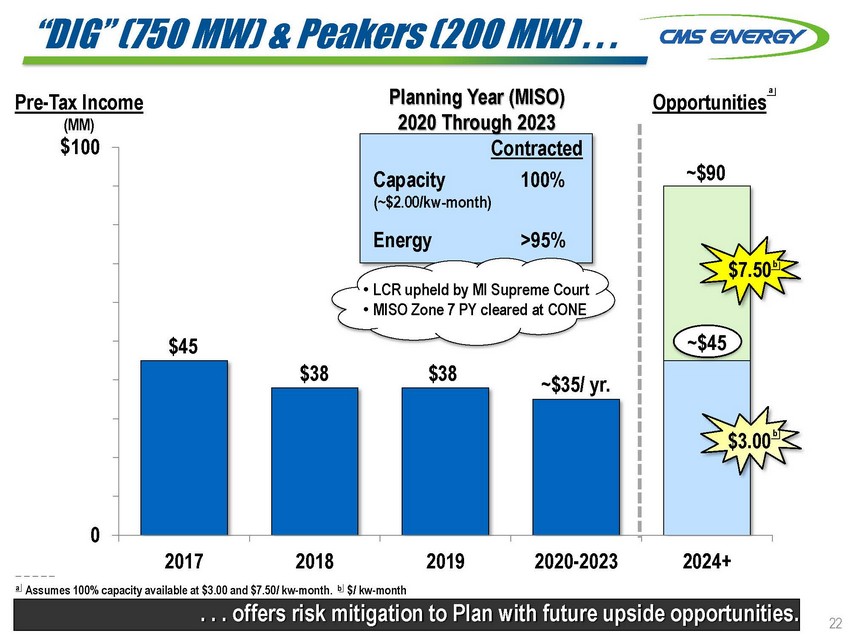
“DIG” (750 MW) & Peakers (200 MW) . . .Pre-Tax Income (MM) $100Planning Year (MISO) 2020 Through 2023 Contracteda Opportunities90 Capacity (~$2.00/kw-month) 80 Energy 70100%>95%~$90$7.50 b6050 $45• LCR upheld by MI Supreme Court • MISO Zone 7 PY cleared at CONE~$4540 $383020100$38~$35/ yr.$3.00 b_ _ _ _ _2017 2018 2019 2020-2023 2024+a Assumes 100% capacity available at $3.00 and $7.50/ kw-month. b $/ kw-month . . . offers risk mitigation to Plan with future upside opportunities. 22

GAAP Reconciliation

CMS ENERGY CORPORATION Reconciliation of GAAP EPS to Non-GAAP Adjusted EPS by Segment (Unaudited)In Millions, Except Per Share Amounts Three Months Ended 3/31/20 3/31/19El ectri c Uti l i ty Reported net income per share $ 0.41 $ 0.37 Reconciling items: Other exclusions from adjusted earnings 0.01 - Tax impact(*) - Voluntary separation program0.03 - Tax impact(0.01) - Adjusted net income per share – non-GAAP $ 0.44 $ 0.37Gas Uti l i ty Reported net income per share $ 0.41 $ 0.43 Reconciling items: Other exclusions from adjusted earnings* - Tax impact(*) - Voluntary separation program0.01 - Tax impact(*) - Adjusted net income per share – non-GAAP $ 0.42 $ 0.43Enterpri ses Reported net income per share $ 0.07 $ 0.02 Reconciling items: Other exclusions from adjusted earnings* (*) Tax impact(*) * Tax reform(0.01) - Voluntary separation program* - Tax impact(*) - Adjusted net income per share – non-GAAP $ 0.06 $ 0.02EnerBank Reported net income per share $ 0.05 $ 0.04 Reconciling items: Other exclusions from adjusted earnings- - Tax impact- - Adjusted net income per share – non-GAAP $ 0.05 $ 0.04Corporate Interest and Other Reported net loss per share $ (0.09) $ (0.11) Reconciling items: Other exclusions from adjusted earnings(*) * Tax impact* (*) Tax reform(0.02) - Adjusted net loss per share – non-GAAP $ (0.11) $ (0.11)Consol i dated Reported net income per share $ 0.85 $ 0.75 Reconciling items: Other exclusions from adjusted earnings 0.01 (*) Tax impact(*) * Tax reform(0.03) - Voluntary separation program0.04 - Tax impact(0.01) - Adjusted net income per share – non-GAAP $ 0.86 $ 0.75Average Common Shares Outstandi ng – Di l uted 285.2 283.6 * Less than $0.01 per share.24

CMS ENERGY CORPORATION Reconciliation of GAAP Net Income to Non-GAAP Adjusted Net Income by Quarter (Unaudited)In Millions, Except Per Share Amounts 2020 1QNet Income Avai l abl e to Common Stockhol ders $ 243 Reconciling items: Electric utility and gas utility 15 Tax impact (4) Enterprises1 Tax impact (4) EnerBank- Tax impact - Corporate interest and other(2) Tax impact (4) Adjusted Net Income – Non-GAAP $ 245Average Common Shares Outstandi ng – Di l uted 285.2Di l uted Earni ngs Per Average Common Share $ 0.85 Reconciling items: Electric utility and gas utility 0.05 Tax impact (0.01) Enterprises* Tax impact (0.01) EnerBank - Tax impact- Corporate interest and other (*) Tax impact(0.02) Adjusted Di l uted Earni ngs Per Average Common Share – Non-GAAP $ 0.86In Millions, Except Per Share Amounts 2019 1Q 2Q 3Q 4QNet Income Avai l abl e to Common Stockhol ders $ 213 $ 93 $ 207 $ 167 Reconciling items: Electric utility and gas utility - - - 6 Tax impact - - - (1) Enterprises(*) * 1 (1) Tax impact * (*) (*) * EnerBank - - - - Tax impact- - - - Corporate interest and other * * * 31 Tax impact (*) (*) (*) (8) Adjusted Net Income – Non-GAAP $ 213 $ 93 $ 208 $ 194Average Common Shares Outstandi ng – Di l uted 283.6 284.0 284.6 284.8Di l uted Earni ngs Per Average Common Share $ 0.75 $ 0.33 $ 0.73 $ 0.58 Reconciling items: Electric utility and gas utility - - - 0.02 Tax impact - - - (*) Enterprises(*) * * (*) Tax impact* (*) (*) * EnerBank - - - - Tax impact- - - - Corporate interest and other * * * 0.11 Tax impact (*) (*) (*) (0.03) Adjusted Di l uted Earni ngs Per Average Common Share – Non-GAAP $ 0.75 $ 0.33 $ 0.73 $ 0.68* Less than $0.5 million or $0.01 per share.25

CMS ENERGY CORPORATION Reconciliation of GAAP Net Income to Non-GAAP Adjusted Net Income (Unaudited)In Millions, Except Per Share Amounts Three Months Ended 3/31/20 3/31/19Net Income Avai l abl e to Common Stockhol ders $ 243 $ 213 Reconciling items: Other exclusions from adjusted earnings3 (*) Tax impact(*) * Tax reform(9) - Voluntary separation program11 - Tax impact(3) -Adjusted net income – non-GAAP $ 245 $ 213Average Common Shares Outstandi ng Basic283.3 282.8 Diluted285.2 283.6Basi c Earni ngs Per Average Common Share Reported net income per share $ 0.86 $ 0.75 Reconciling items: Other exclusions from adjusted earnings0.01 (*) Tax impact(*) * Tax reform(0.03) - Voluntary separation program0.04 - Tax impact(0.01) -Adjusted net income per share – non-GAAP $ 0.87 $ 0.75Di l uted Earni ngs Per Average Common Share Reported net income per share $ 0.85 $ 0.75 Reconciling items: Other exclusions from adjusted earnings0.01 (*) Tax impact(*) * Tax reform(0.03) - Voluntary separation program0.04 - Tax impact(0.01) -Adjusted net income per share – non-GAAP $ 0.86 $ 0.75* Less than $0.5 million or $0.01 per share.Management views adjusted (non-Generally Accepted Accounting Principles) earnings as a key measure of the Company's present operating financial performance and uses adjusted earnings for external communications with analysts and investors. Internally, the Company uses adjusted earnings to measure and assess performance. Adjustments could include items such as discontinued operations, asset sales, impairments, restructuring costs, regulatory items from prior years, or other items detailed in these summary financial statements. Adjusted earnings should be considered supplemental information to assist in understanding our business results, rather than as a substitute for reported earnings.26

CMS ENERGY CORPORATION Earnings Per Share By Year GAAP Reconciliation CMS ENERGY CORPORATION (Unaudited) Earnings Per Share By Year GAAP Reconciliation (Unaudited)2012 2013 2014 2015 2016 2017 2018 2019 Reported earni ngs per share - GAAP $1.42 $1.66 $1.74 $1.89 $1.98 $1.64 $2.32 $2.39 Pretax i tems: Electric and gas utility 0.27 - - - 0.04 - - 0.02 Tax impact (0.10) - - - (0.01) 0.12 (a) 0.01 (a) (*) Enterprises (0.01) * 0.05 * * * 0.02 * Tax impact * (*) (0.02) (*) (*) 0.20 (a) (0.02) (a) (*) EnerBank - - - - - - - - Tax impact - - - - - 0.01 (a) * - Corporate interest and other * * * * 0.02 0.01 * 0.11 Tax impact (*) (*) (*) (*) (0.01) 0.19 (a) (*) (0.03) Discontinued operations (income) loss, net (0.03) * (*) (*) * * (*) (*) Adjusted earni ngs per share - non-GAAP $1.55 $1.66 $1.77 $1.89 $2.02 $2.17 $2.33 $2.49* Les s than $0.01 per s hare.(a) Reflects the impact of tax reform.27