Attached files
| file | filename |
|---|---|
| 8-K - 8-K - ARMSTRONG WORLD INDUSTRIES INC | awi-8k_20200427.htm |
| EX-99.1 - EX-99.1 - ARMSTRONG WORLD INDUSTRIES INC | awi-ex991_7.htm |
Earnings Call Presentation 1st Quarter 2020 April 27, 2020 Exhibit 99.2
Our disclosures in this presentation, including without limitation, those relating to future financial results market conditions and guidance, and in our other public documents and comments contain forward-looking statements within the meaning of the Private Securities Litigation Reform Act. Those statements provide our future expectations or forecasts and can be identified by our use of words such as “anticipate,” “estimate,” “expect,” “project,” “intend,” “plan,” “believe,” “outlook,” “target,” “predict,” “may,” “will,” “would,” “could,” “should,” “seek,” and other words or phrases of similar meaning in connection with any discussion of future operating or financial performance. Forward-looking statements, by their nature, address matters that are uncertain and involve risks because they relate to events and depend on circumstances that may or may not occur in the future. As a result, our actual results may differ materially from our expected results and from those expressed in our forward-looking statements. A more detailed discussion of the risks and uncertainties that may affect our ability to achieve the projected performance is included in the “Risk Factors” and “Management’s Discussion and Analysis” sections of our reports on Forms 10-K and 10-Q filed with the U.S. Securities and Exchange Commission (“SEC”). Forward-looking statements speak only as of the date they are made. We undertake no obligation to update any forward-looking statements beyond what is required under applicable securities law. In addition, we will be referring to non-GAAP financial measures within the meaning of SEC Regulation G. A reconciliation of the differences between these measures with the most directly comparable financial measures calculated in accordance with GAAP are included within this presentation and available on the Investor Relations page of our website at www.armstrongceilings.com. 2020 guidance suspended until further notice due to COVID-19. Safe Harbor Statement
All figures throughout the presentation are in $ millions unless otherwise noted. Figures may not add due to rounding. When reporting our financial results within this presentation, we make several adjustments. Management uses these non-GAAP measures in managing the business and believes the adjustments provide meaningful comparisons of operating performance between periods. As reported results will be footnoted throughout the presentation. Basis of Presentation Explanation Results throughout this presentation are presented on a normalized basis with the exception of cash flow. With the sale of our EMEA and Pacific Rim businesses, we no longer adjust our sales for movements in foreign exchange rates as we expect these to have minimal impact on revenue. We remove the impact of certain discrete expenses and income. Examples include plant closures, restructuring actions, separation costs, environmental site expenses and related insurance recoveries, and other large unusual items. We also adjust for our U.S. pension plan (credit) expense(1). We are using actual tax rates to report 2020 and 2019 EPS results. Prior to 2019 we used a normalized book tax rate when reporting EPS. U.S. pension (credit) expense represents the actuarial net periodic benefit cost expected to be recorded as a component of earnings from continuing operations. For all periods presented, we were not required and did not make cash contributions to our U.S. Retirement Income Plan based on guidelines established by the Pension Benefit Guaranty Corporation.
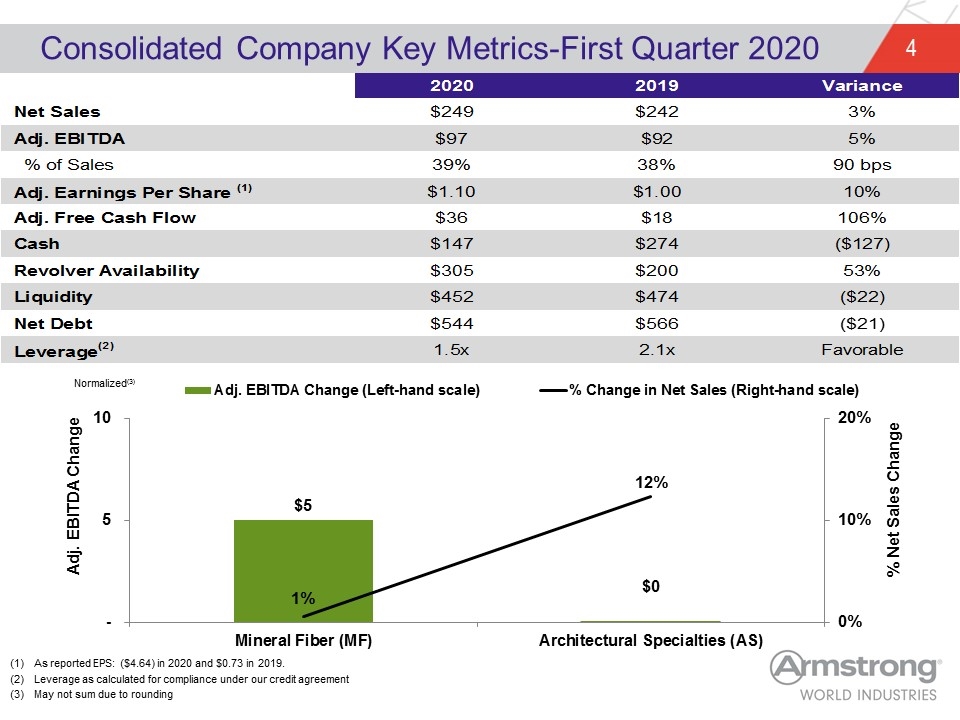
Consolidated Company Key Metrics-First Quarter 2020 As reported EPS: ($4.64) in 2020 and $0.73 in 2019. Leverage as calculated for compliance under our credit agreement May not sum due to rounding Normalized(3) $0 2020 2019 Variance Net Sales $248.7 $0 $242.1 2.7261462205700138E-2 Adj. EBITDA $96.609472999999994 $0 $91.8 $0 5.2390773420479375E-2 % of Sales 0.3884578729392843 0.379182156133829 90 bps hardcode watchout Adj. Earnings Per Share (1) $1.1026671862014512 $0.99841549073059932 0.10441714540563152 Adj. Free Cash Flow $36.400000000000006 $17.700000000000003 1.0564971751412429 Cash $147 $274 $-,127 Revolver Availability $305 $200 0.52500000000000002 Liquidity $452 $474 $-22 Net Debt $544 $566 $-21 Leverage(2) 1.5x 2.1x Favorable
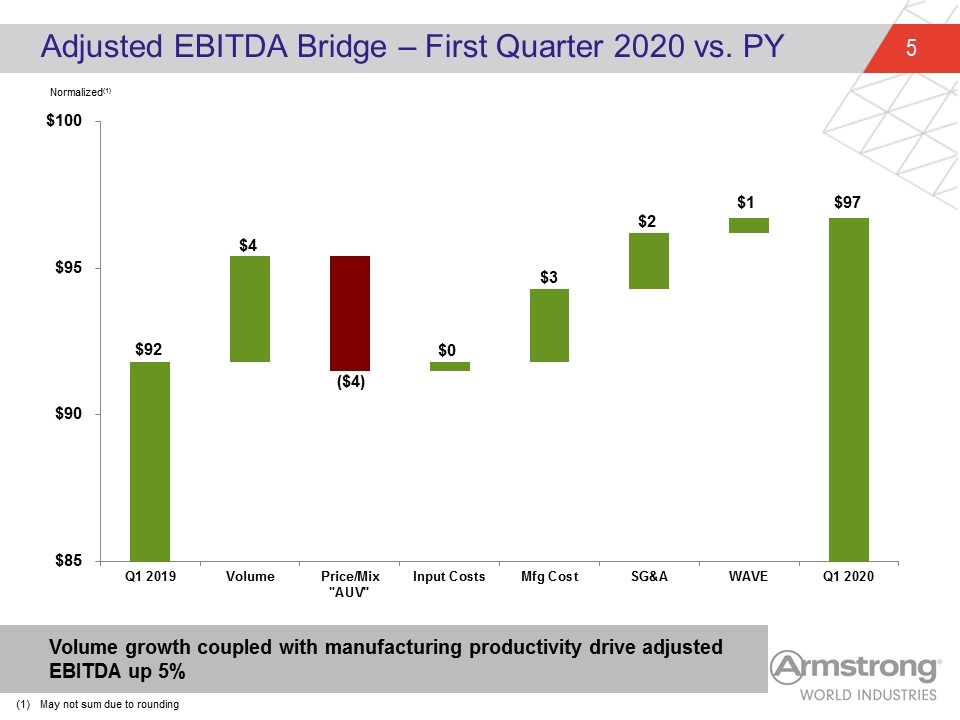
Adjusted EBITDA Bridge – First Quarter 2020 vs. PY $4 ($4) $0 $2 $3 $1 Volume growth coupled with manufacturing productivity drive adjusted EBITDA up 5% Normalized(1) May not sum due to rounding
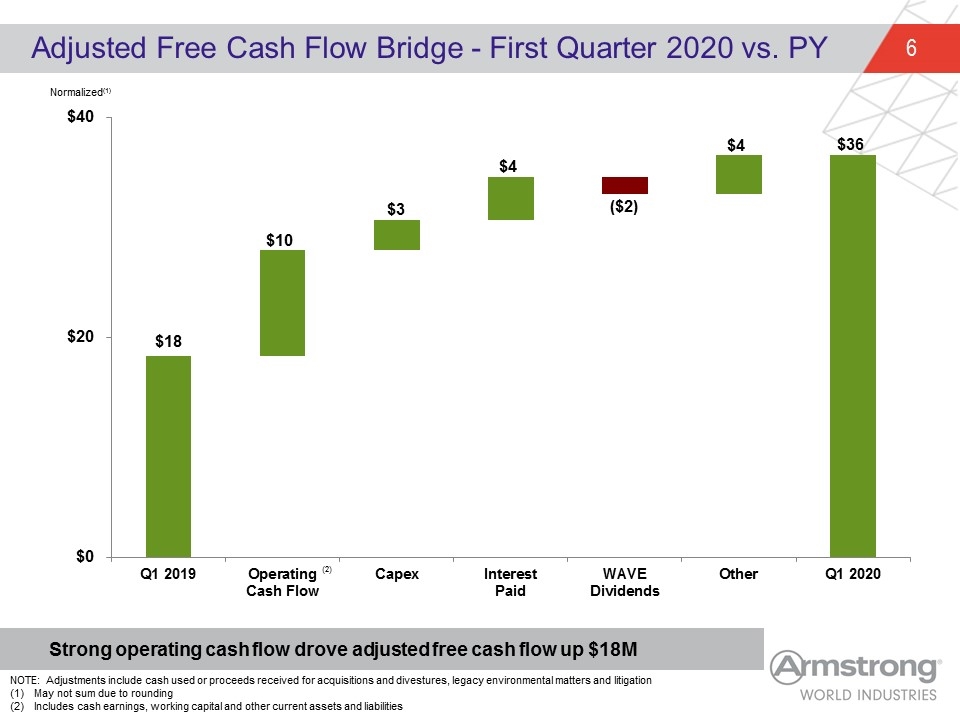
Adjusted Free Cash Flow Bridge - First Quarter 2020 vs. PY $3 Strong operating cash flow drove adjusted free cash flow up $18M $10 $4 $4 (2) NOTE: Adjustments include cash used or proceeds received for acquisitions and divestures, legacy environmental matters and litigation May not sum due to rounding Includes cash earnings, working capital and other current assets and liabilities Normalized(1) $36 ($2)
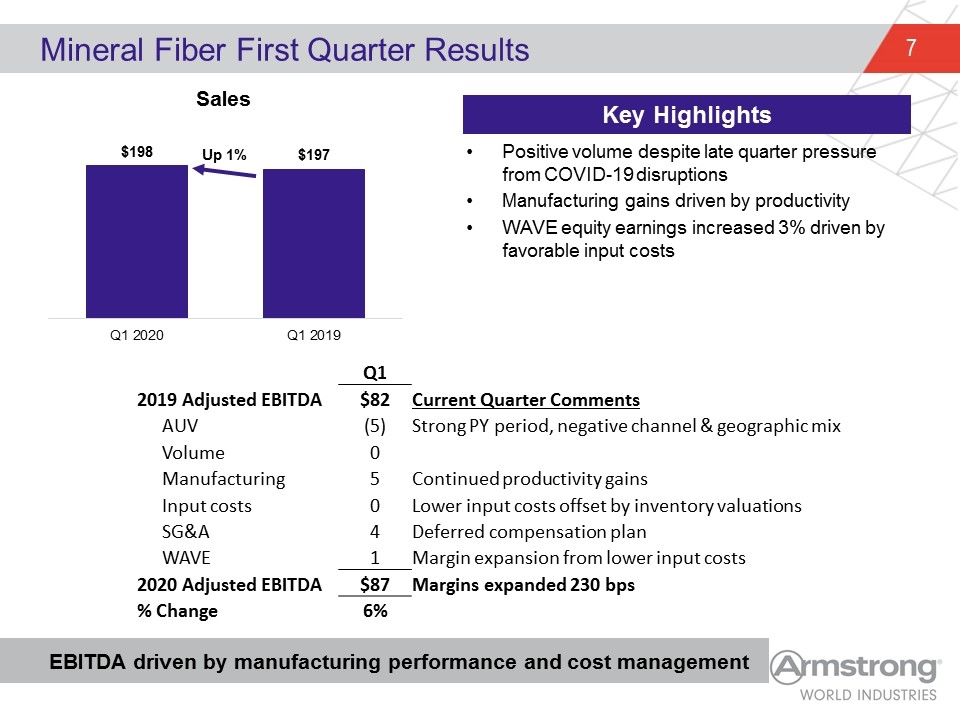
Positive volume despite late quarter pressure from COVID-19 disruptions Manufacturing gains driven by productivity WAVE equity earnings increased 3% driven by favorable input costs Mineral Fiber First Quarter Results EBITDA driven by manufacturing performance and cost management Key Highlights Q1 2019 Adjusted EBITDA $82 Current Quarter Comments AUV (5) Strong PY period, negative channel & geographic mix Volume 0 Manufacturing 5 Continued productivity gains Input costs 0 Lower input costs offset by inventory valuations SG&A 4 Deferred compensation plan WAVE 1 Margin expansion from lower input costs 2020 Adjusted EBITDA $87 Margins expanded 230 bps % Change 6%
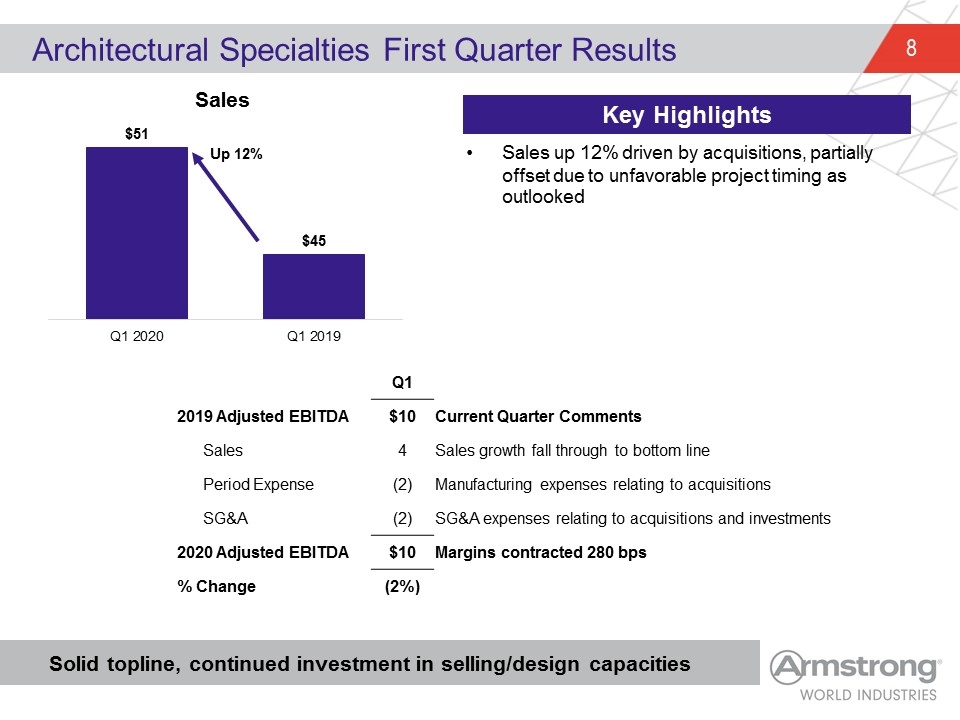
Sales up 12% driven by acquisitions, partially offset due to unfavorable project timing as outlooked Architectural Specialties First Quarter Results Solid topline, continued investment in selling/design capacities Key Highlights Q1 2019 Adjusted EBITDA $10 Current Quarter Comments Sales 4 Sales growth fall through to bottom line Period Expense (2) Manufacturing expenses relating to acquisitions SG&A (2) SG&A expenses relating to acquisitions and investments 2020 Adjusted EBITDA $10 Margins contracted 280 bps % Change (2%)
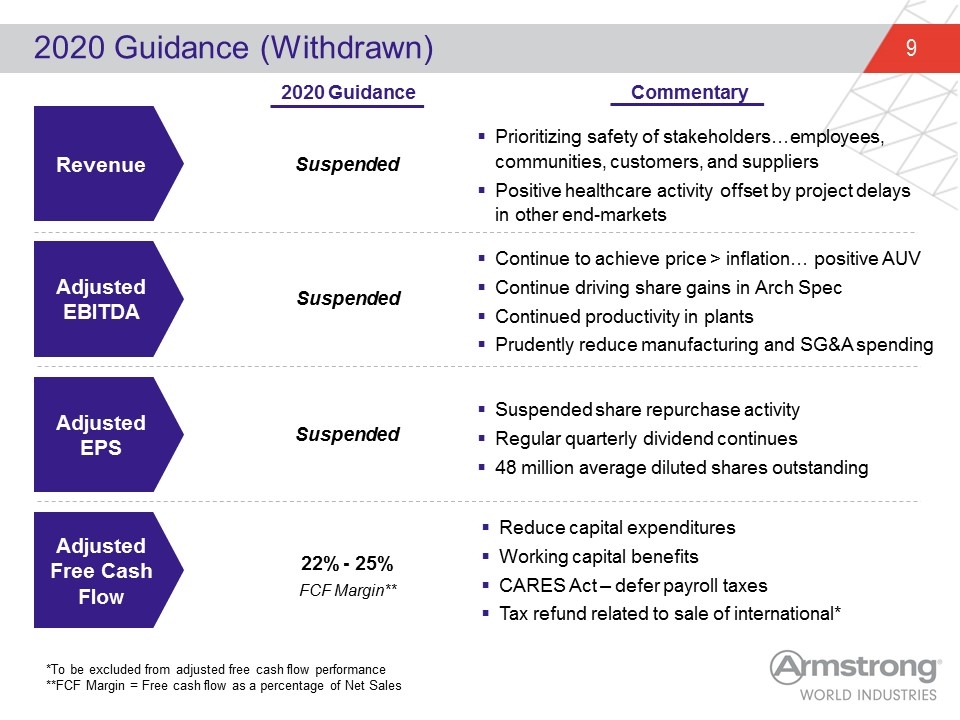
2020 Guidance (Withdrawn) Adjusted EBITDA Adjusted EPS Adjusted Free Cash Flow Revenue Suspended Prioritizing safety of stakeholders…employees, communities, customers, and suppliers Positive healthcare activity offset by project delays in other end-markets Continue to achieve price > inflation… positive AUV Continue driving share gains in Arch Spec Continued productivity in plants Prudently reduce manufacturing and SG&A spending Reduce capital expenditures Working capital benefits CARES Act – defer payroll taxes Tax refund related to sale of international* 2020 Guidance Suspended share repurchase activity Regular quarterly dividend continues 48 million average diluted shares outstanding Suspended Suspended Commentary *To be excluded from adjusted free cash flow performance **FCF Margin = Free cash flow as a percentage of Net Sales 22% - 25% FCF Margin**
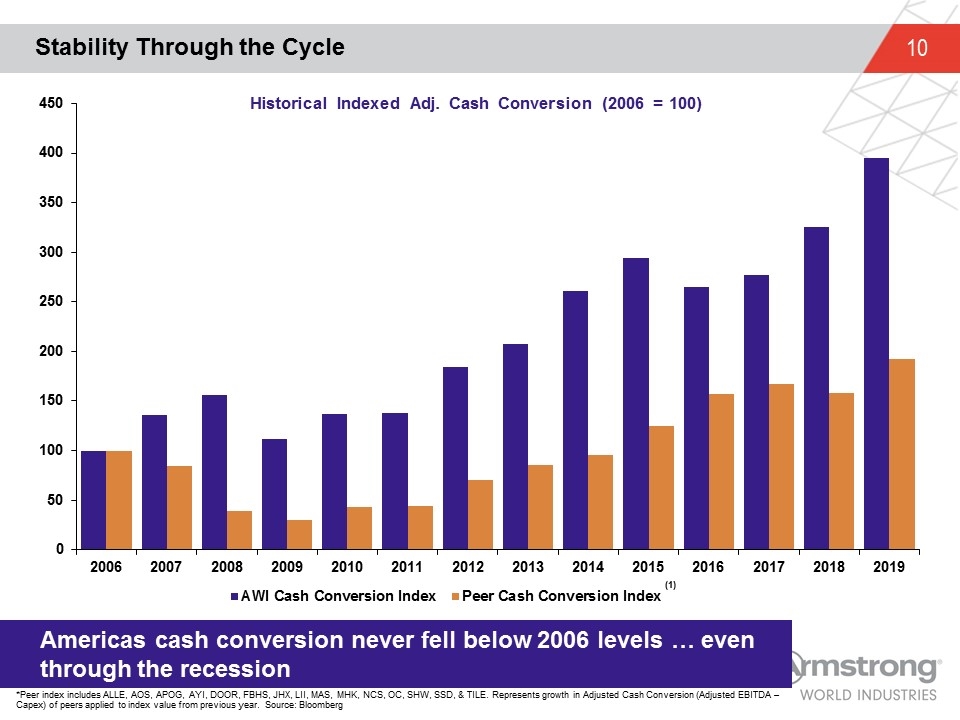
Historical Indexed Adj. Cash Conversion (2006 = 100) Stability Through the Cycle *Peer index includes ALLE, AOS, APOG, AYI, DOOR, FBHS, JHX, LII, MAS, MHK, NCS, OC, SHW, SSD, & TILE. Represents growth in Adjusted Cash Conversion (Adjusted EBITDA – Capex) of peers applied to index value from previous year. Source: Bloomberg Americas cash conversion never fell below 2006 levels … even through the recession
Appendix
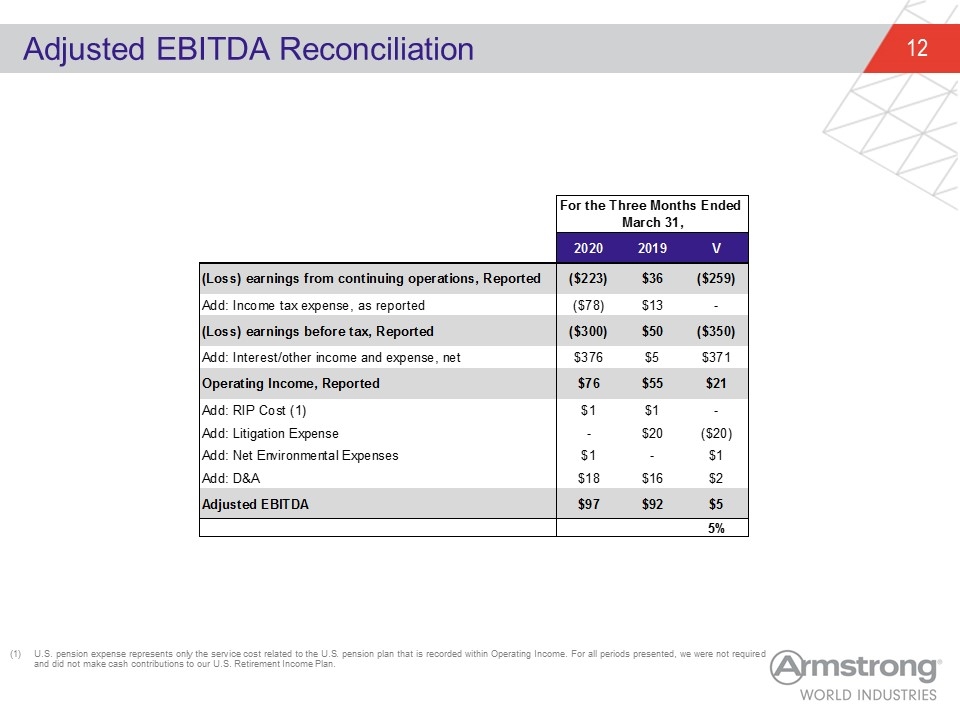
Adjusted EBITDA Reconciliation U.S. pension expense represents only the service cost related to the U.S. pension plan that is recorded within Operating Income. For all periods presented, we were not required and did not make cash contributions to our U.S. Retirement Income Plan. CONSOLIDATED For the Three Months Ended March 31, qtr YTD 2020 2019 V 2019 V (Loss) earnings from continuing operations, Reported -222.60000000000002 36.400000000000006 -259 189.6 52.699999999999875 rounding Add: Income tax expense, as reported -77.5 13.4 0 53.1 4 (Loss) earnings before tax, Reported -300.10000000000002 49.800000000000004 -349.90000000000003 242.7 56.699999999999875 rounding Add: Interest/other income and expense, net 376.09999999999997 4.9000000000000004 371.2 6.7000000000000028 11.299999999999997 Operating Income, Reported 76 54.699999999999996 21.300000000000004 249.40000000000003 67.999999999999943 Add: RIP Cost (1) 1.3660650000000001 1.1902507499999999 0 5.7387230000000002 -0.97768999999999995 Add: Litigation Expense 0 20 -20 6.5 13.080649000000001 Add: Net Environmental Expenses 1 0 1 -1.17395 2.24038 Add: D&A 18 16 2 78.016097999999943 -3.0443094999999403 Adjusted EBITDA 97 92 5 353 50.149728999999979 rounding 5.4347826086956541E-2 0.14206722096317276
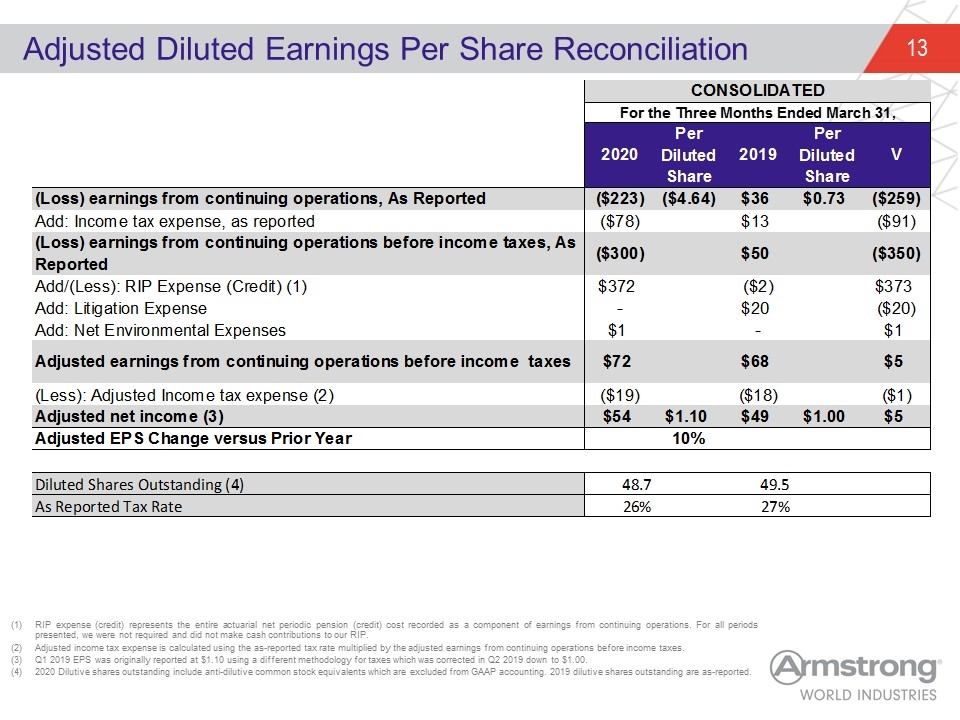
Adjusted Diluted Earnings Per Share Reconciliation RIP expense (credit) represents the entire actuarial net periodic pension (credit) cost recorded as a component of earnings from continuing operations. For all periods presented, we were not required and did not make cash contributions to our RIP. Adjusted income tax expense is calculated using the as-reported tax rate multiplied by the adjusted earnings from continuing operations before income taxes. Q1 2019 EPS was originally reported at $1.10 using a different methodology for taxes which was corrected in Q2 2019 down to $1.00. 2020 Dilutive shares outstanding include anti-dilutive common stock equivalents which are excluded from GAAP accounting. 2019 dilutive shares outstanding are as-reported. CONSOLIDATED For the Three Months Ended March 31, 2020 Per Diluted 2019 Per Diluted V Per Diluted 2018 Per Diluted V Share Share Share Share (Loss) earnings from continuing operations, As Reported $-,222.60000000000002 $-4.6399999999999997 $36.400000000000006 $0.73 $-,259 $4.88 $189.6 $3.63 $52.699999999999875 Add: Income tax expense, as reported $-77.5 $13.4 $-90.9 $53.1 $4 (Loss) earnings from continuing operations before income taxes, As Reported $-,300.10000000000002 $49.800000000000004 $-,349.90000000000003 $242.7 $56.699999999999875 Add/(Less): RIP Expense (Credit) (1) $371.6 $-1.8847795000000001 $373.4847795 $-26.275746999999999 $18.736629000000001 Add: Litigation Expense 0 $20 $-20 $6.5 $13.080649000000001 Add: Net Environmental Expenses $1 0 $1 $-1.17395 $2.24038 0 Adjusted earnings from continuing operations before income taxes $72.395946000000009 $67.615220500000007 $4.7807255000000026 $254.526432 $42.951357499999915 (Less): Adjusted Income tax expense (2) $-18.696054031989338 $-18.193653708835342 $-0.50240032315399574 $-64 $3.0647054332647983 Adjusted net income (3) $53.699891968010675 $1.1026671862014512 $49.421566791164665 $0.99841549073059932 $5 $4.78 $190.6 $3.66 $45.942494933264726 Adjusted EPS Change versus Prior Year 0.10441714540563148 0.30601092896174864 Diluted Shares Outstanding (4) 48.7 49.5 52.1 As Reported Tax Rate 0.25824725091636119 0.26907630522088349 0.21878862793572312
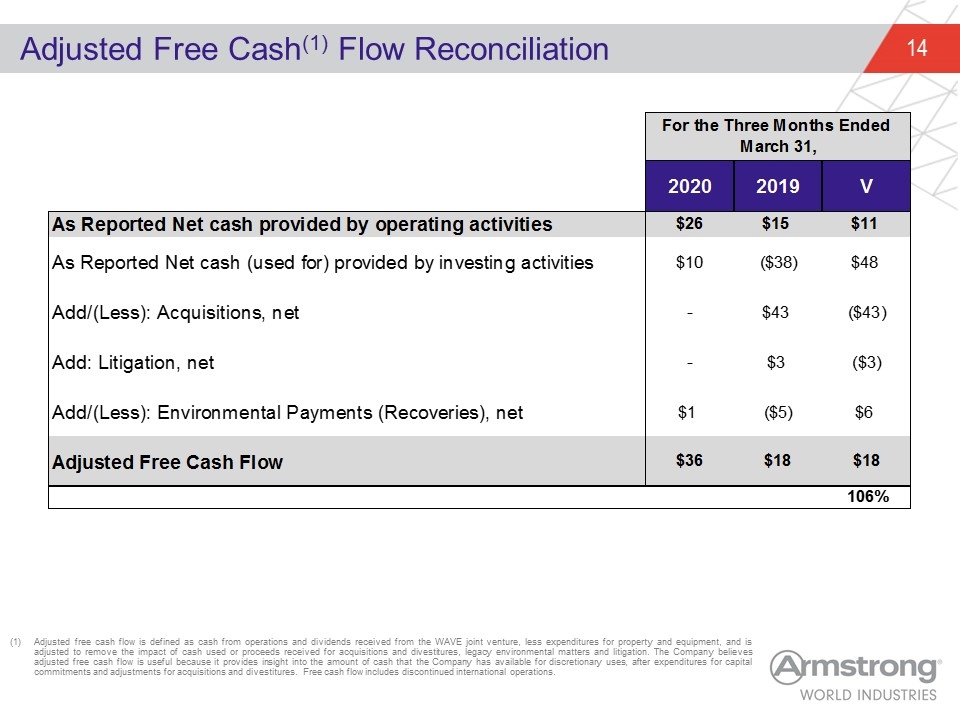
Adjusted Free Cash(1) Flow Reconciliation Adjusted free cash flow is defined as cash from operations and dividends received from the WAVE joint venture, less expenditures for property and equipment, and is adjusted to remove the impact of cash used or proceeds received for acquisitions and divestitures, legacy environmental matters and litigation. The Company believes adjusted free cash flow is useful because it provides insight into the amount of cash that the Company has available for discretionary uses, after expenditures for capital commitments and adjustments for acquisitions and divestitures. Free cash flow includes discontinued international operations. For the Three Months Ended March 31, 2020 2019 V 2018 V As Reported Net cash provided by operating activities $25.700000000000003 $14.700000000000005 $10.999999999999998 $203.2 $-20.499999999999972 As Reported Net cash (used for) provided by investing activities $9.9000000000000021 $-38 $47.900000000000006 $309.59999999999997 $-,398.69999999999993 Add/(Less): Acquisitions, net - $43 $-43 $22 $34.4 Add: Litigation, net - $3 $-3 - $23 Add/(Less): Environmental Payments (Recoveries), net $1 $-5 $6 $-27 $32 Adjusted Free Cash Flow $36.400000000000006 $17.700000000000003 $18 $235.79999999999995 $8.1999999999999993 1.0564971751412431 3.4775233248515697E-2
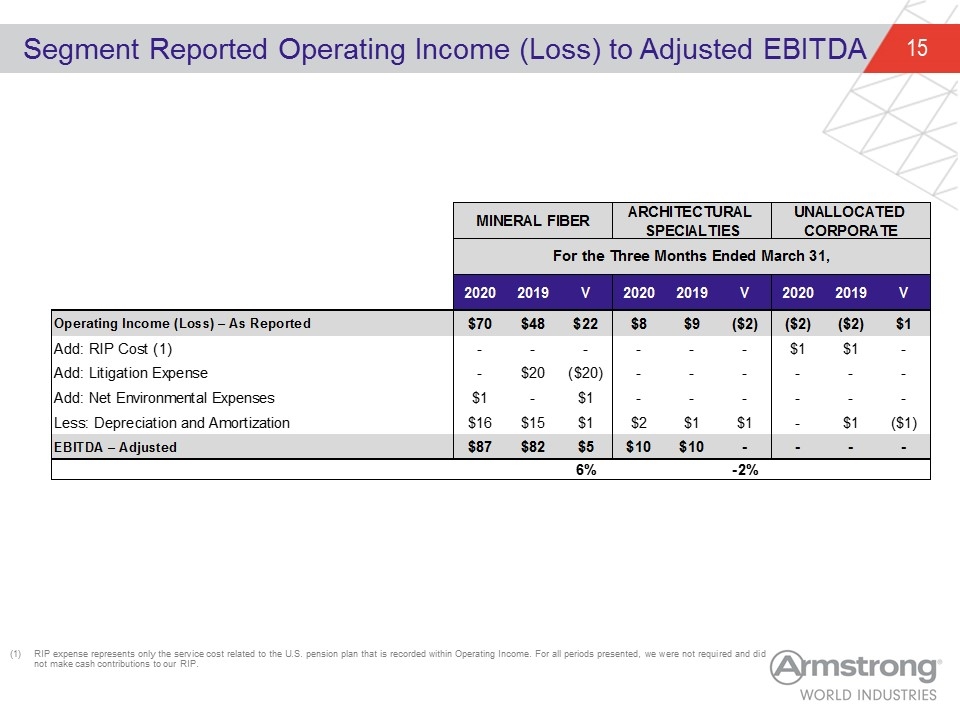
Segment Reported Operating Income (Loss) to Adjusted EBITDA RIP expense represents only the service cost related to the U.S. pension plan that is recorded within Operating Income. For all periods presented, we were not required and did not make cash contributions to our RIP. MINERAL FIBER ARCHITECTURAL SPECIALTIES UNALLOCATED CORPORATE For the Three Months Ended March 31, 2016 V 2020 2019 V 2020 2019 V 2020 2019 V Operating Income (Loss) – As Reported 70 47.6 22.4 7.5149999999999997 9.173 -1.6580000000000004 -1.5 -2.1 0.60000000000000009 Add: RIP Cost (1) 0 0 0 0 0 0 1.3660650000000001 1.1902507499999999 0 Add: Litigation Expense 0 19.7 -19.7 0 0 0 0 0 0 Add: Net Environmental Expenses 1 0 1 0 0 0 0 0 0 Less: Depreciation and Amortization 16 15 1 2.1601369999999998 0.70899999999999963 1.4511370000000001 0 0.90974925000000018 -0.90974925000000018 EBITDA – Adjusted 87 82.3 4.7000000000000028 9.6751369999999994 9.8819999999999997 0 0 0 0 5.7108140947752073E-2 -2.0933313094515293E-2
