Attached files
| file | filename |
|---|---|
| 8-K - 8-K - FULTON FINANCIAL CORP | fult-20200421.htm |
| EX-99.2 - EX-99.2 - FULTON FINANCIAL CORP | exhibit99233120.htm |
| EX-99.1 - EX-99.1 - FULTON FINANCIAL CORP | exhibit99133120.htm |
2020 FIRST QUARTER RESULTS NASDAQ: FULT Data as of March 31, 2020 unless otherwise noted
FORWARD-LOOKING STATEMENTS This presentation may contain forward-looking statements with respect to the Corporation’s financial condition, results of operations and business. Do not unduly rely on forward-looking statements. Forward-looking statements can be identified by the use of words such as "may," "should," "will," "could," "estimates," "predicts," "potential," "continue," "anticipates," "believes," "plans," "expects," "future," "intends," “projects,” the negative of these terms and other comparable terminology. These forward looking statements may include projections of, or guidance on, the Corporation’s future financial performance, expected levels of future expenses, anticipated growth strategies, descriptions of new business initiatives and anticipated trends in the Corporation’s business or financial results. Management’s 2020 Outlook contained herein is comprised of forward-looking statements. Forward-looking statements are neither historical facts, nor assurance of future performance. Instead, they are based on current beliefs, expectations and assumptions regarding the future of the Corporation’s business, future plans and strategies, projections, anticipated events and trends, the economy and other future conditions. Because forward-looking statements relate to the future, they are subject to inherent uncertainties, risks and changes in circumstances that are difficult to predict and many of which are outside of the Corporation’s control, and actual results and financial condition may differ materially from those indicated in the forward-looking statements. Therefore, you should not unduly rely on any of these forward-looking statements. Any forward-looking statement is based only on information currently available and speaks only as of the date when made. The Corporation undertakes no obligation, other than as required by law, to update or revise any forward-looking statements, whether as a result of new information, future events or otherwise. A discussion of certain risks and uncertainties affecting the Corporation, and some of the factors that could cause the Corporation’s actual results to differ materially from those described in the forward-looking statements, can be found in the sections entitled “Risk Factors” and “Management’s Discussion and Analysis of Financial Condition and Results of Operations” in the Corporation’s Annual Report on Form 10-K for the year ended December 31, 2019 which has been filed with the Securities and Exchange Commission and are or will be available in the Investor Relations section of the Corporation’s website (www.fult.com) and on the Securities and Exchange Commission’s website (www.sec.gov). The Quarterly Report on Form 10-Q for the quarter ended March 31, 2020 will address risks and uncertainties associated with the COVID-19 pandemic. In addition, the COVID-19 pandemic is having an adverse impact on the Corporation, its customers and the communities it serves. The adverse effect of the COVID-19 pandemic on the Corporation, its customers and the communities where it operates may adversely affect the Corporation’s business, results of operations and financial condition for an indefinite period of time. The Corporation uses certain non-GAAP financial measures in this presentation. These non-GAAP financial measures are reconciled to the most comparable GAAP measures at the end of this presentation. 2
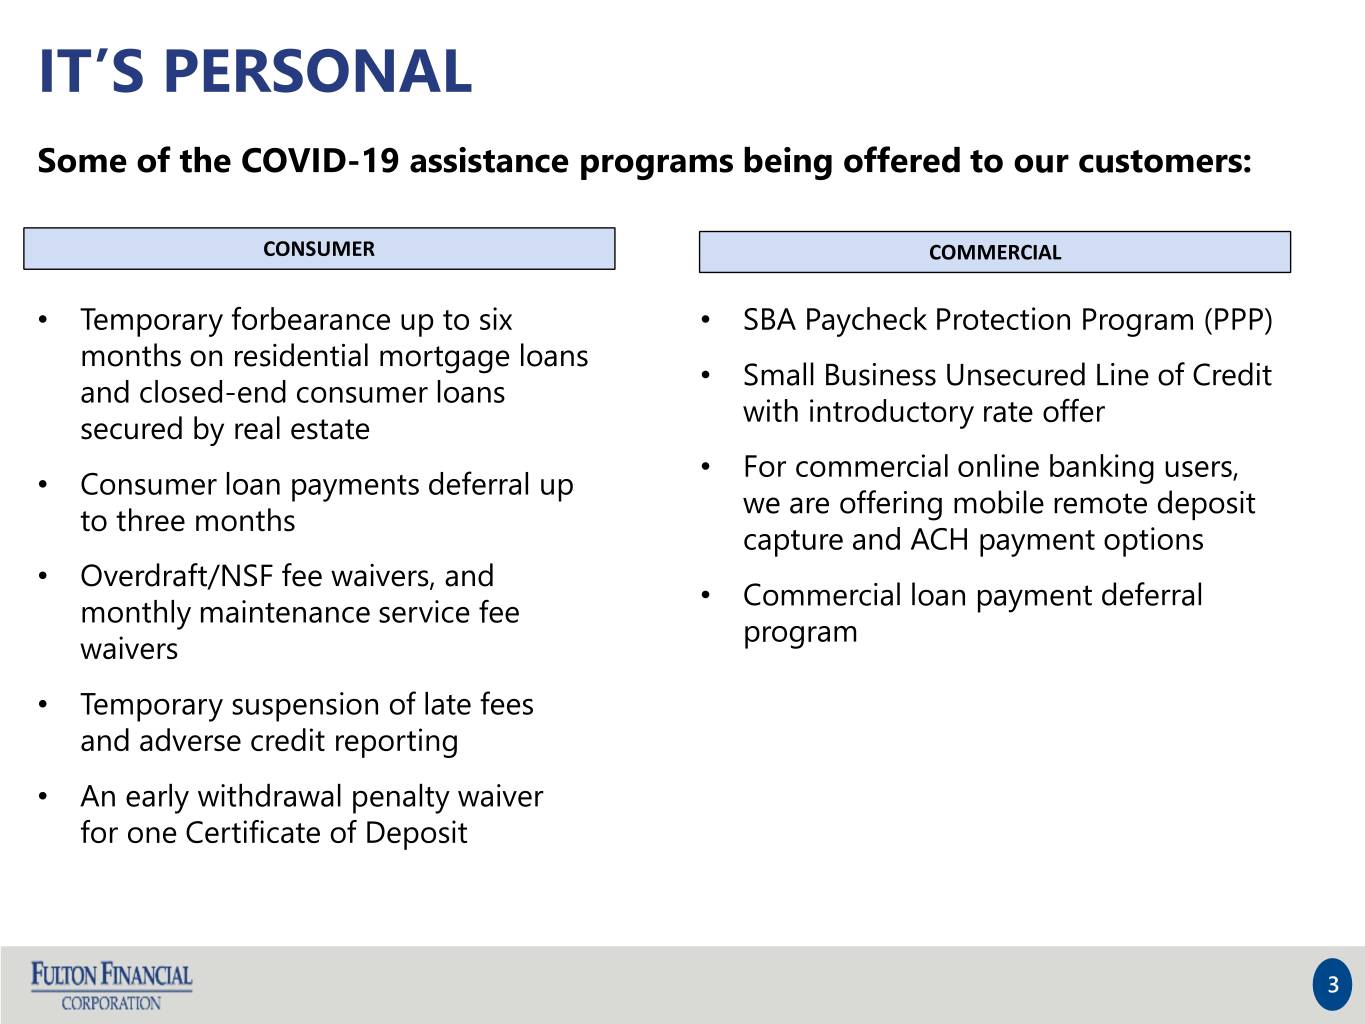
IT’S PERSONAL Some of the COVID-19 assistance programs being offered to our customers: CONSUMER COMMERCIAL • Temporary forbearance up to six • SBA Paycheck Protection Program (PPP) months on residential mortgage loans • Small Business Unsecured Line of Credit and closed-end consumer loans with introductory rate offer secured by real estate • For commercial online banking users, • Consumer loan payments deferral up we are offering mobile remote deposit to three months capture and ACH payment options • Overdraft/NSF fee waivers, and • Commercial loan payment deferral monthly maintenance service fee program waivers • Temporary suspension of late fees and adverse credit reporting • An early withdrawal penalty waiver for one Certificate of Deposit 3
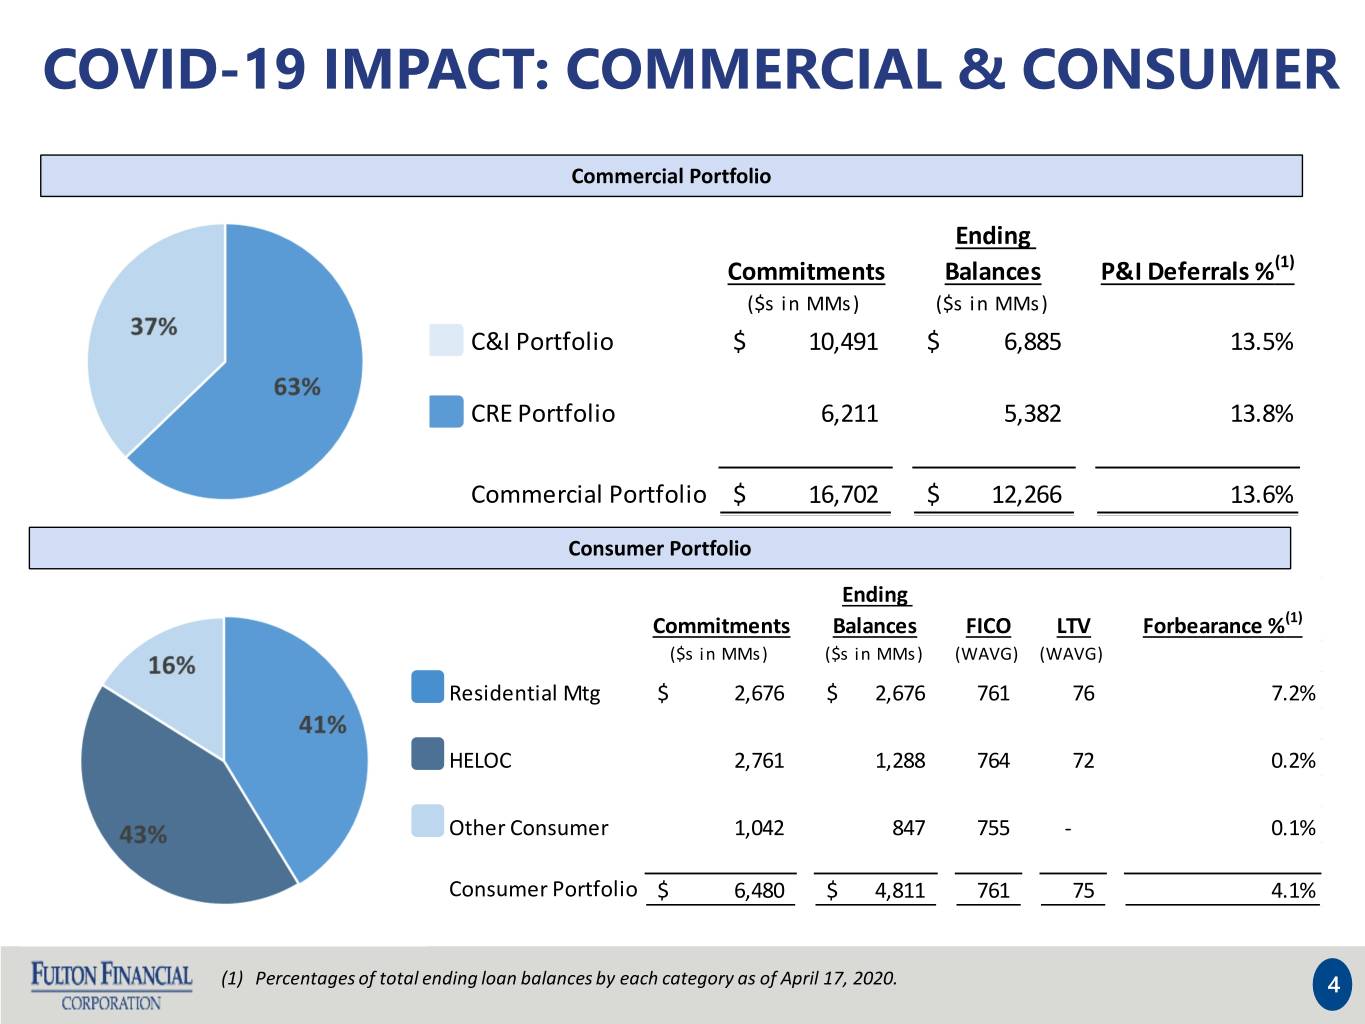
COVID-19 IMPACT: COMMERCIAL & CONSUMER Commercial Portfolio Ending Commitments Balances P&I Deferrals %(1) ($s in MMs) ($s in MMs) C&I Portfolio $ 10,491 $ 6,885 13.5% CRE Portfolio 6,211 5,382 13.8% Commercial Portfolio $ 16,702 $ 12,266 13.6% Consumer Portfolio Ending Commitments Balances FICO LTV Forbearance %(1) ($s in MMs) ($s in MMs) (WAVG) (WAVG) Residential Mtg $ 2,676 $ 2,676 761 76 7.2% HELOC 2,761 1,288 764 72 0.2% Other Consumer 1,042 847 755 - 0.1% Consumer Portfolio $ 6,480 $ 4,811 761 75 4.1% (1) Percentages of total ending loan balances by each category as of April 17, 2020. 4
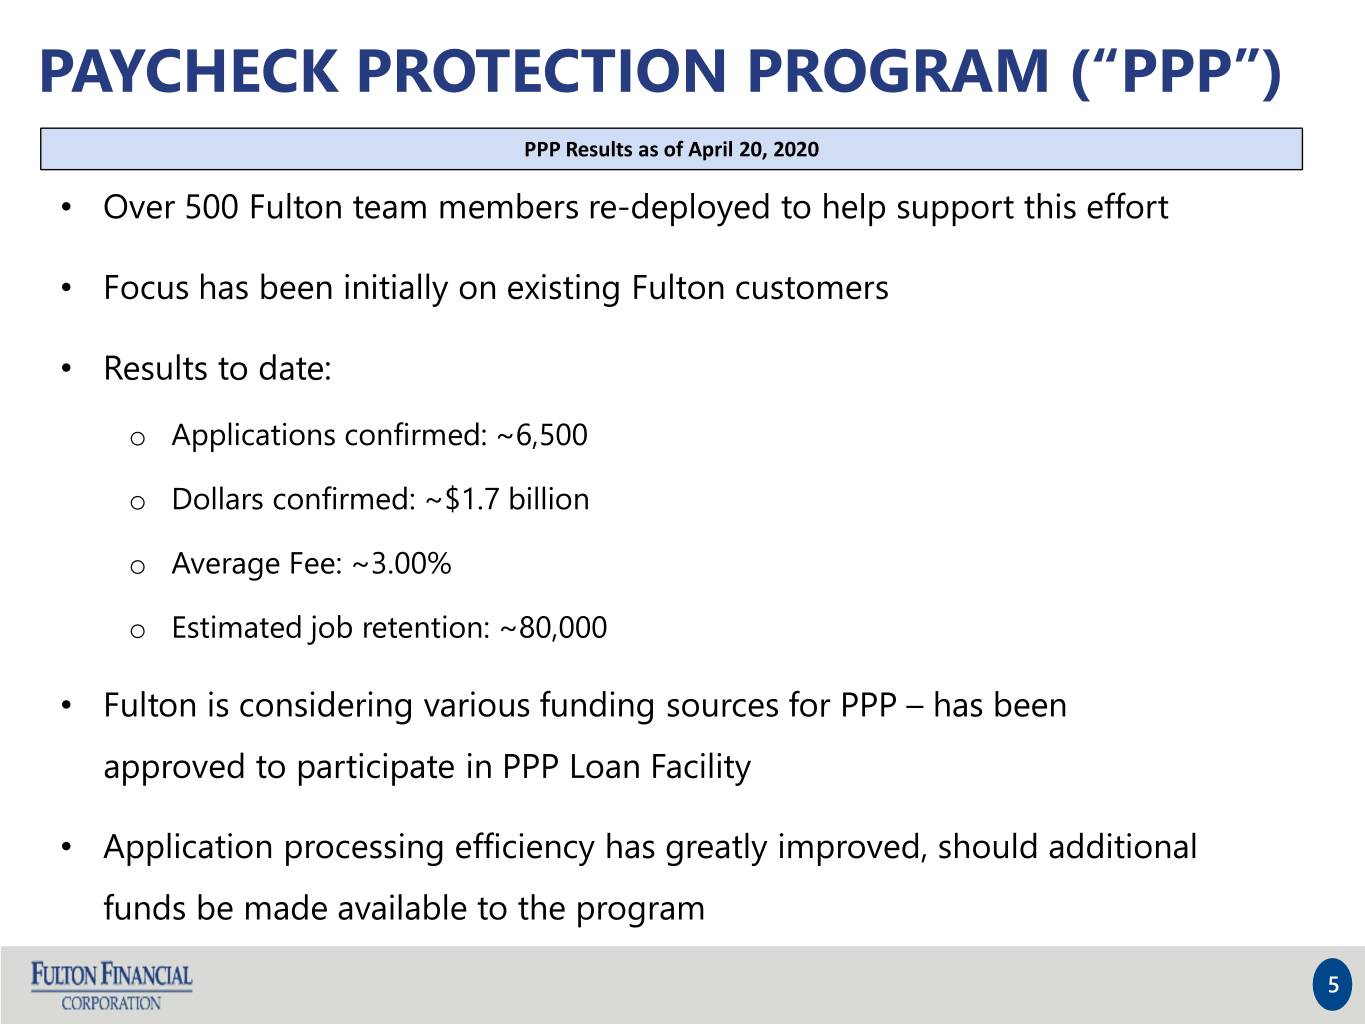
PAYCHECK PROTECTION PROGRAM (“PPP”) PPP Results as of April 20, 2020 • Over 500 Fulton team members re-deployed to help support this effort • Focus has been initially on existing Fulton customers • Results to date: o Applications confirmed: ~6,500 o Dollars confirmed: ~$1.7 billion o Average Fee: ~3.00% o Estimated job retention: ~80,000 • Fulton is considering various funding sources for PPP – has been approved to participate in PPP Loan Facility • Application processing efficiency has greatly improved, should additional funds be made available to the program 5
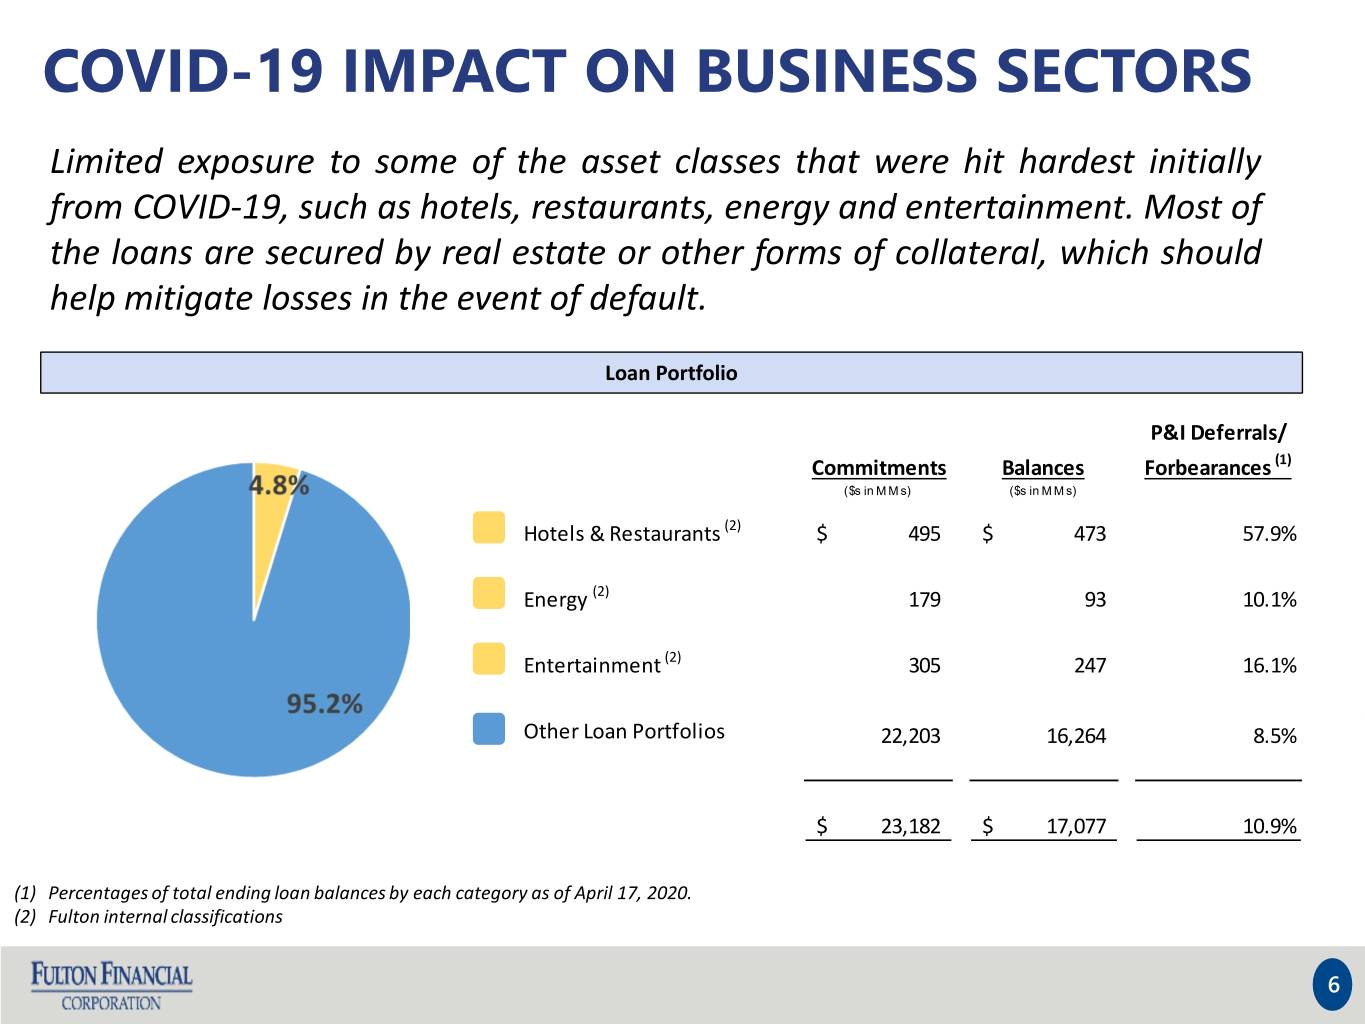
COVID-19 IMPACT ON BUSINESS SECTORS Limited exposure to some of the asset classes that were hit hardest initially from COVID-19, such as hotels, restaurants, energy and entertainment. Most of the loans are secured by real estate or other forms of collateral, which should help mitigate losses in the event of default. Loan Portfolio P&I Deferrals/ Commitments Balances Forbearances (1) ($s in M M s) ($s in M M s) Hotels & Restaurants (2) $ 495 $ 473 57.9% Energy (2) 179 93 10.1% Entertainment (2) 305 247 16.1% Other Loan Portfolios 22,203 16,264 8.5% $ 23,182 $ 17,077 10.9% (1) Percentages of total ending loan balances by each category as of April 17, 2020. (2) Fulton internal classifications 6
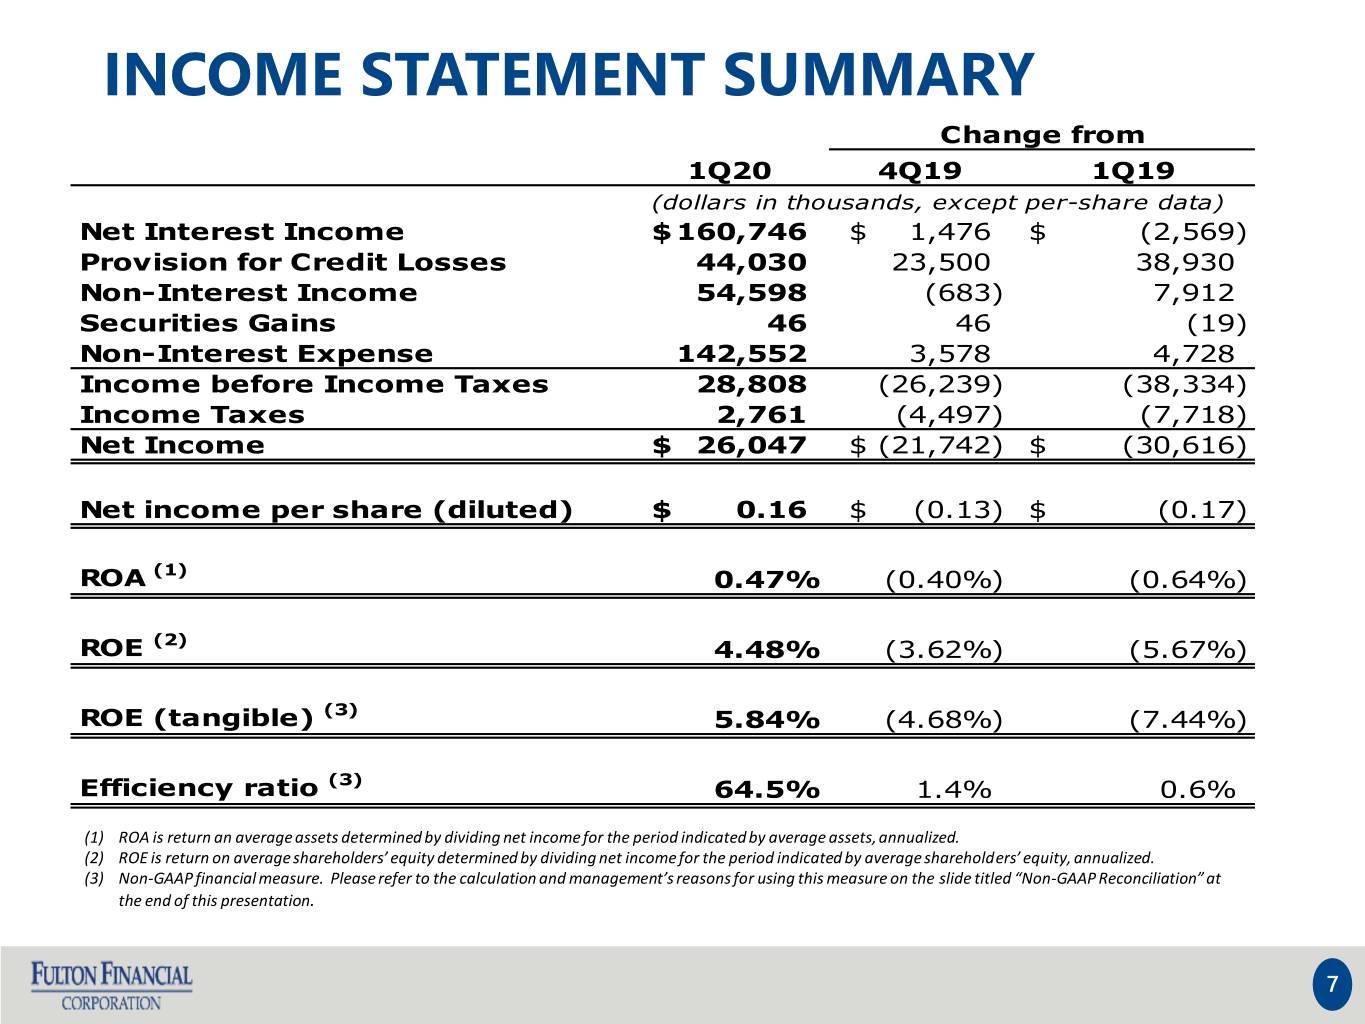
INCOME STATEMENT SUMMARY Change from 1Q20 4Q19 1Q19 (dollars in thousands, except per-share data) Net Interest Income $ 160,746 $ 1,476 $ (2,569) Provision for Credit Losses 44,030 23,500 38,930 Non-Interest Income 54,598 (683) 7,912 Securities Gains 46 46 (19) Non-Interest Expense 142,552 3,578 4,728 Income before Income Taxes 28,808 (26,239) (38,334) Income Taxes 2,761 (4,497) (7,718) Net Income $ 26,047 $ (21,742) $ (30,616) Net income per share (diluted) $ 0.16 $ (0.13) $ (0.17) ROA (1) 0.47% (0.40%) (0.64%) ROE (2) 4.48% (3.62%) (5.67%) ROE (tangible) (3) 5.84% (4.68%) (7.44%) Efficiency ratio (3) 64.5% 1.4% 0.6% (1) ROA is return an average assets determined by dividing net income for the period indicated by average assets, annualized. (2) ROE is return on average shareholders’ equity determined by dividing net income for the period indicated by average shareholders’ equity, annualized. (3) Non-GAAP financial measure. Please refer to the calculation and management’s reasons for using this measure on the slide titled “Non-GAAP Reconciliation” at the end of this presentation. 7
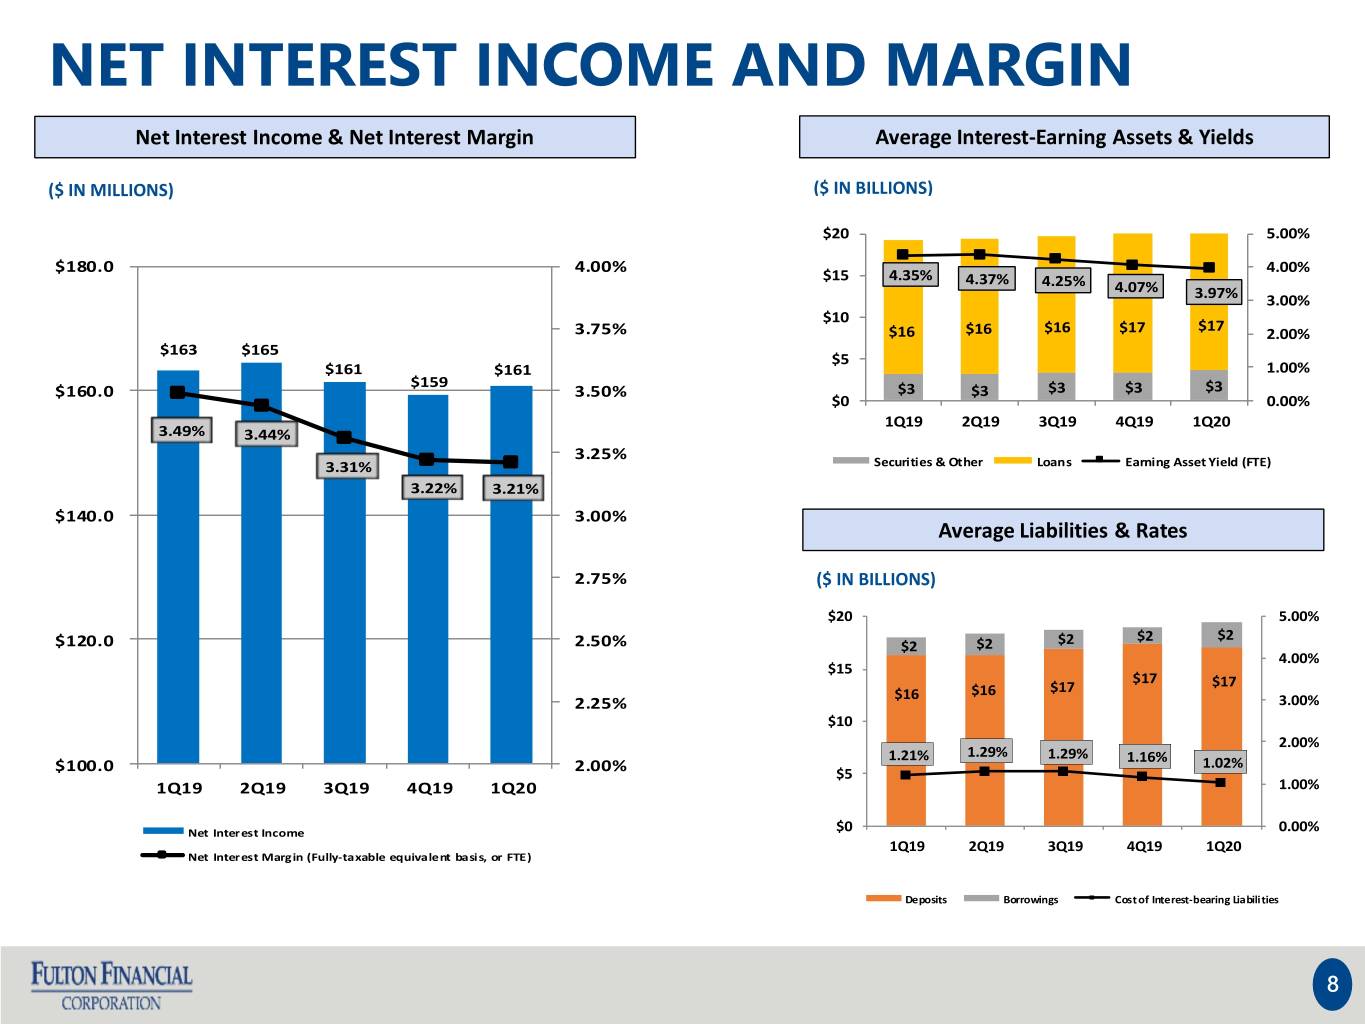
NET INTEREST INCOME AND MARGIN Net Interest Income & Net Interest Margin Average Interest-Earning Assets & Yields ($ IN MILLIONS) ($ IN BILLIONS) $20 5.00% $180.0 4.00% 4.00% $15 4.35% 4.37% 4.25% 4.07% 3.97% 3.00% $10 $17 3.75% $16 $16 $16 $17 2.00% $163 $165 $5 $161 $161 1.00% $159 $160.0 3.50% $3 $3 ~ $730$3 $3 $3 $0 0.00% million 1Q19 2Q19 3Q19 4Q19 1Q20 3.49% 3.44% 3.25% 3.31% Securities & Other Loans Earning Asset~ $610 Yield (FTE) million 3.22% 3.21% $140.0 3.00% Average Liabilities & Rates 2.75% ($ IN BILLIONS) $20 5.00% $2 $2 $120.0 2.50% $2 $2 $2 4.00% $15 $17 $17 $16 $16 $17 2.25% 3.00% $10 2.00% 1.29% 1.29% 1.21% 1.16% 1.02% $100.0 2.00% $5 1Q19 2Q19 3Q19 4Q19 1Q20 1.00% Net Interest Income $0 0.00% 1Q19 2Q19 3Q19 4Q19 1Q20 Net Interest Margin (Fully-taxable equivalent basis, or FTE) Deposits Borrowings Cost of Interest-bearing Liabilities 8
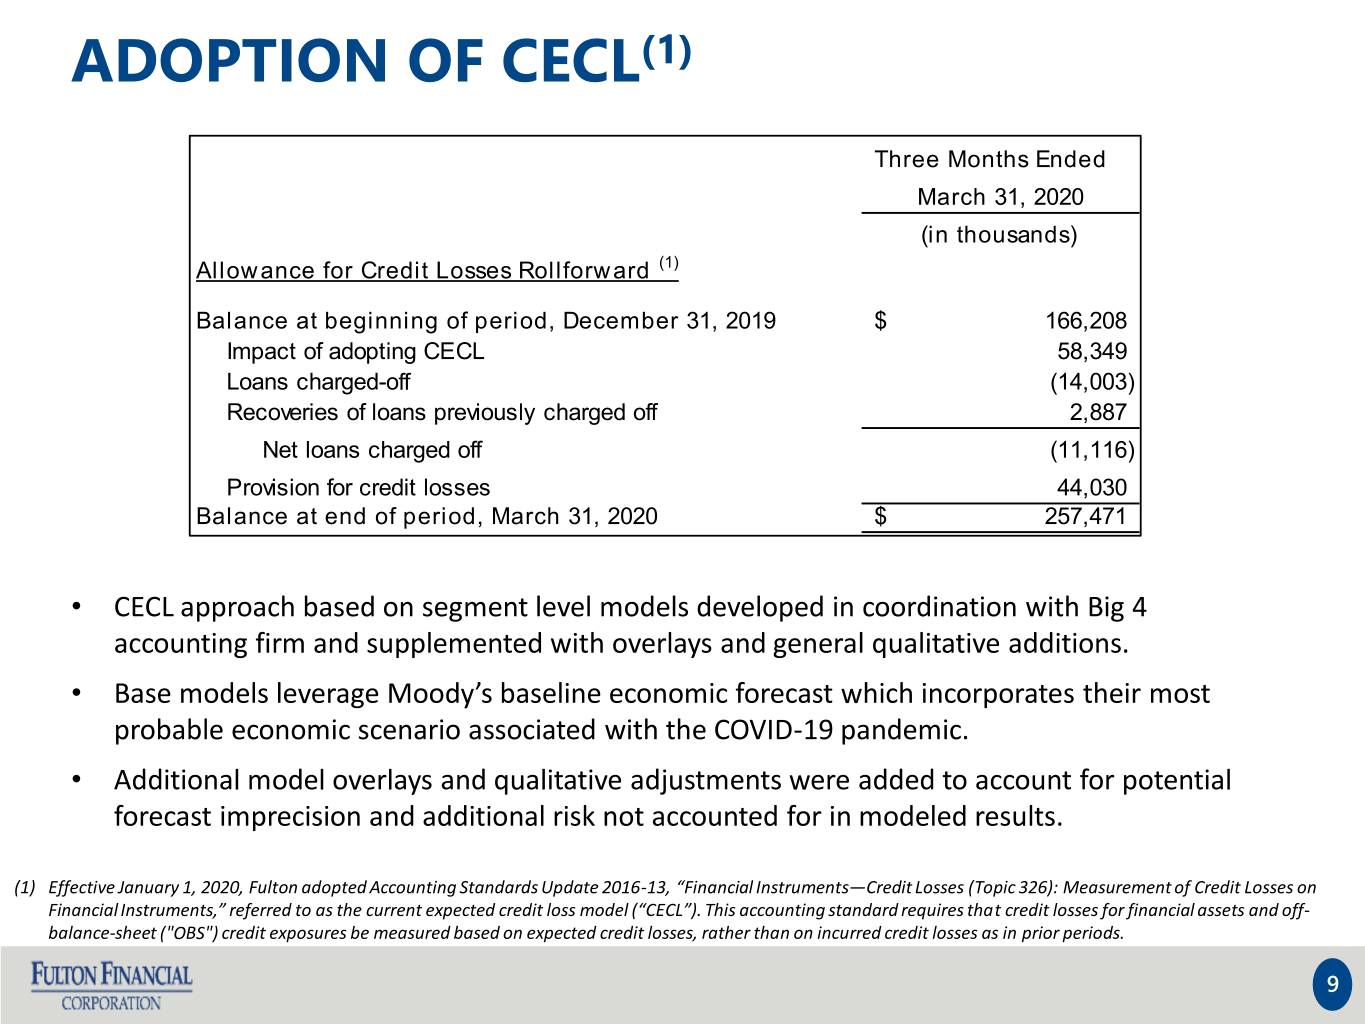
ADOPTION OF CECL(1) Three Months Ended March 31, 2020 (in thousands) Allowance for Credit Losses Rollforward (1) Balance at beginning of period, December 31, 2019 $ 166,208 Impact of adopting CECL 58,349 Loans charged-off (14,003) Recoveries of loans previously charged off 2,887 Net loans charged off (11,116) Provision for credit losses 44,030 Balance at end of period, March 31, 2020 $ 257,471 • CECL approach based on segment level models developed in coordination with Big 4 accounting firm and supplemented with overlays and general qualitative additions. • Base models leverage Moody’s baseline economic forecast which incorporates their most probable economic scenario associated with the COVID-19 pandemic. • Additional model overlays and qualitative adjustments were added to account for potential forecast imprecision and additional risk not accounted for in modeled results. (1) Effective January 1, 2020, Fulton adopted Accounting Standards Update 2016-13, “Financial Instruments—Credit Losses (Topic 326): Measurement of Credit Losses on Financial Instruments,” referred to as the current expected credit loss model (“CECL”). This accounting standard requires that credit losses for financial assets and off- balance-sheet ("OBS") credit exposures be measured based on expected credit losses, rather than on incurred credit losses as in prior periods. 9
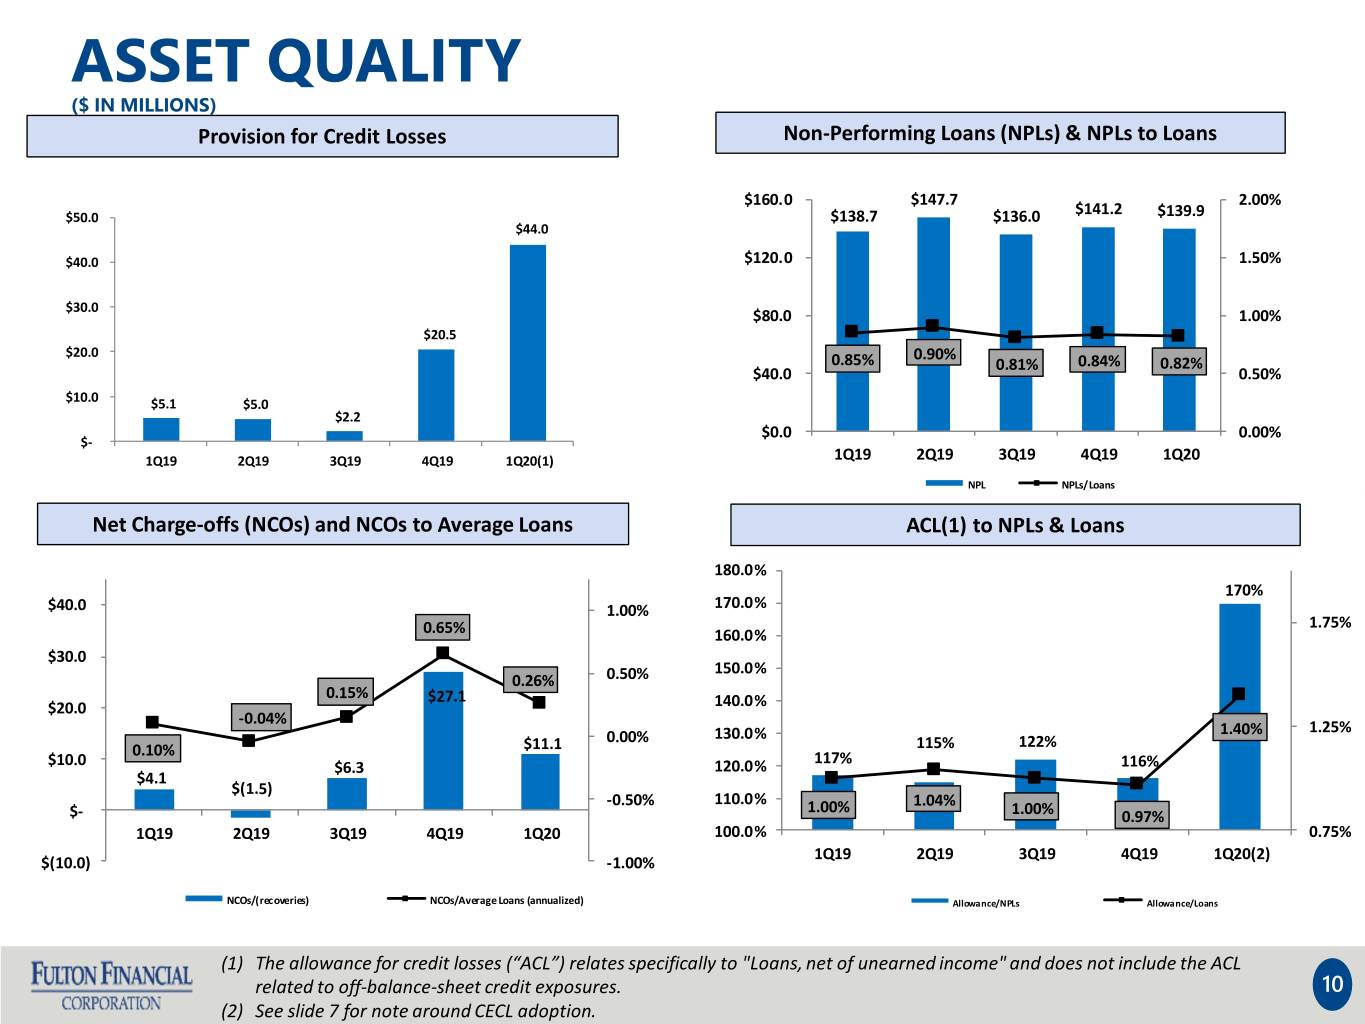
ASSET QUALITY ($ IN MILLIONS) Provision for Credit Losses Non-Performing Loans (NPLs) & NPLs to Loans $160.0 $147.7 2.00% $141.2 $50.0 $138.7 $136.0 $139.9 $44.0 $40.0 $120.0 1.50% $30.0 $80.0 1.00% $20.5 $20.0 0.90% 0.85% 0.81% 0.84% 0.82% $40.0 0.50% $10.0 $5.1 $5.0 $2.2 $0.0 0.00% $- 1Q19 2Q19 3Q19 4Q19 1Q20(1) 1Q19 2Q19 3Q19 4Q19 1Q20 NPL NPLs/Loans Net Charge-offs (NCOs) and NCOs to Average Loans ACL(1) to NPLs & Loans 180.0% 170% $40.0 1.00% 170.0% 1.75% 0.65% 160.0% $30.0 150.0% 0.26% 0.50% 0.15% $27.1 $20.0 140.0% -0.04% 130.0% 1.40% 1.25% $11.1 0.00% 115% 122% 0.10% 117% $10.0 $6.3 120.0% 116% $4.1 $(1.5) -0.50% 110.0% 1.00% 1.04% $- 1.00% 0.97% 1Q19 2Q19 3Q19 4Q19 1Q20 100.0% 0.75% 1Q19 2Q19 3Q19 4Q19 1Q20(2) $(10.0) -1.00% NCOs/(recoveries) NCOs/Average Loans (annualized) Allowance/NPLs Allowance/Loans (1) The allowance for credit losses (“ACL”) relates specifically to "Loans, net of unearned income" and does not include the ACL related to off-balance-sheet credit exposures. 10 (2) See slide 7 for note around CECL adoption.
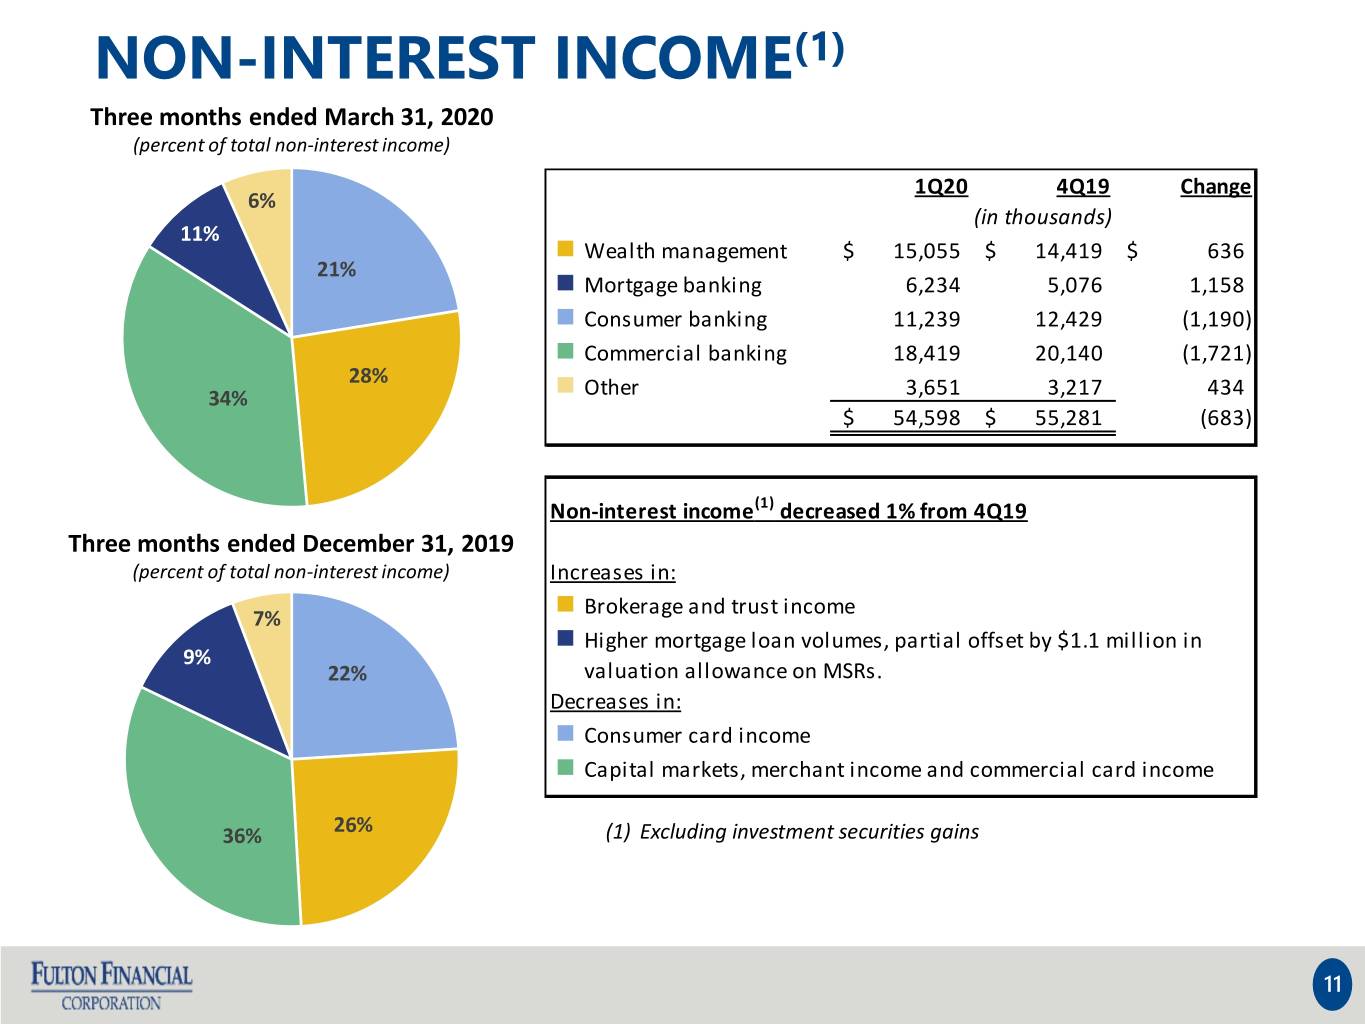
NON-INTEREST INCOME(1) Three months ended March 31, 2020 (percent of total non-interest income) 1Q20 4Q19 Change 6% (in thousands) 11% n Wealth management $ 15,055 $ 14,419 $ 636 21% n Mortgage banking 6,234 5,076 1,158 n Consumer banking 11,239 12,429 (1,190) n Commercial banking 18,419 20,140 (1,721) 28% 34% n Other 3,651 ~ $730 3,217 434 $ 54,598 $ million 55,281 (683) ~ $610 million Non-interest income(1) decreased 1% from 4Q19 Three months ended December 31, 2019 (percent of total non-interest income) Increases in: n Brokerage and trust income 7% n Higher mortgage loan volumes, partial offset by $1.1 million in 9% 22% valuation allowance on MSRs. Decreases in: n Consumer card income n Capital markets, merchant income and commercial card income 36% 26% (1) Excluding investment securities gains 11
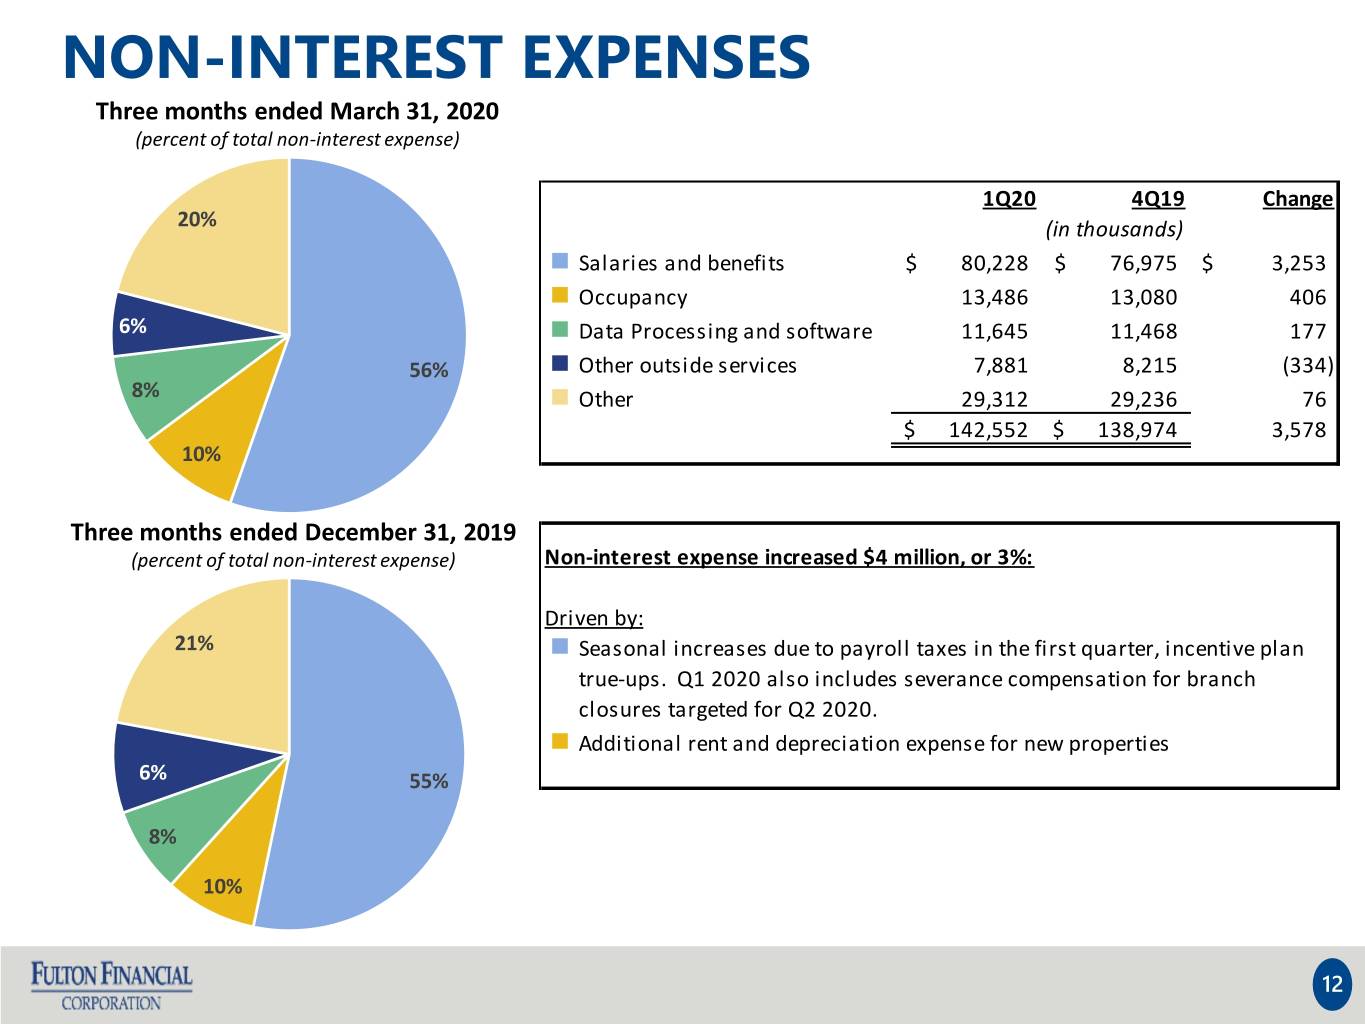
NON-INTEREST EXPENSES Three months ended March 31, 2020 (percent of total non-interest expense) 1Q20 4Q19 Change 20% (in thousands) n Salaries and benefits $ 80,228 $ 76,975 $ 3,253 n Occupancy 13,486 13,080 406 6% n Data Processing and software 11,645 11,468 177 56% n Other outside services 7,881 8,215 (334) 8% n Other 29,312 29,236 76 $ 142,552 $ 138,974 3,578 10% Three months ended December 31, 2019 (percent of total non-interest expense) Non-interest expense increased $4 million, or 3%: Driven by: 21% n Seasonal increases due to payroll taxes in the first quarter, incentive plan true-ups. Q1 2020 also includes severance compensation for branch closures targeted for Q2 2020. n Additional rent and depreciation expense for new properties 6% 55% 8% 10% 12
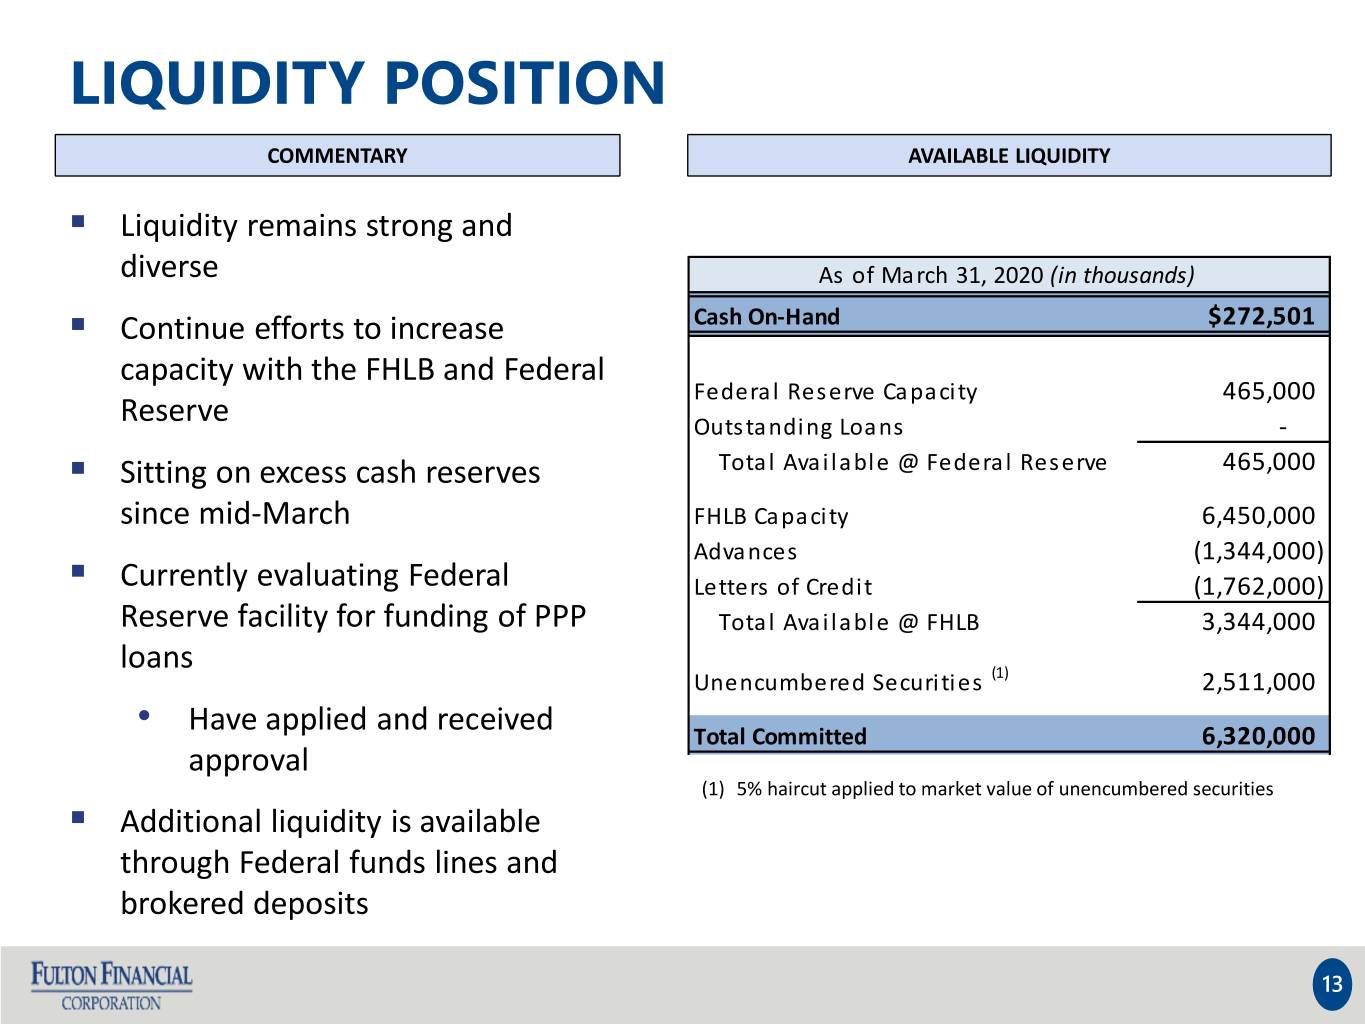
LIQUIDITY POSITION COMMENTARY AVAILABLE LIQUIDITY . Liquidity remains strong and diverse As of March 31, 2020 (in thousands) . Continue efforts to increase Cash On-Hand $272,501 capacity with the FHLB and Federal Federal Reserve Capacity 465,000 Reserve Outstanding Loans - . Sitting on excess cash reserves Total Available @ Federal Reserve 465,000 since mid-March FHLB Capacity 6,450,000 Advances (1,344,000) . Currently evaluating Federal Letters of Credit (1,762,000) Reserve facility for funding of PPP Total Available @ FHLB 3,344,000 loans Unencumbered Securities (1) 2,511,000 • Have applied and received Total Committed 6,320,000 approval (1) 5% haircut applied to market value of unencumbered securities . Additional liquidity is available through Federal funds lines and brokered deposits 13
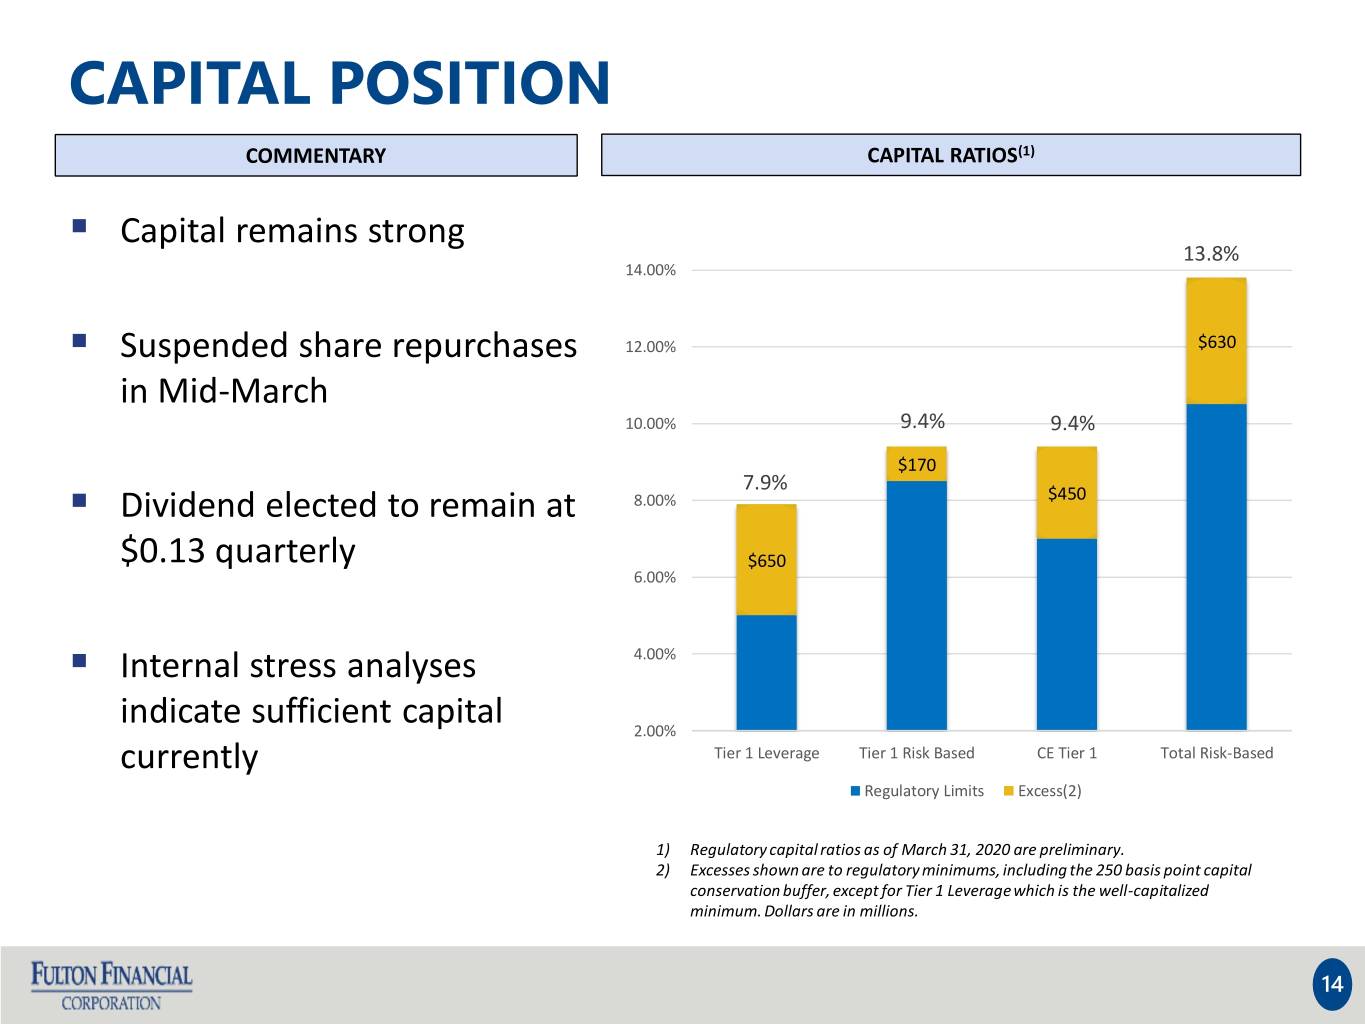
CAPITAL POSITION COMMENTARY CAPITAL RATIOS(1) . Capital remains strong 13.8% 14.00% . Suspended share repurchases 12.00% $630 in Mid-March 10.00% 9.4% 9.4% $170 7.9% . Dividend elected to remain at 8.00% $450 $0.13 quarterly $650 6.00% . Internal stress analyses 4.00% indicate sufficient capital 2.00% currently Tier 1 Leverage Tier 1 Risk Based CE Tier 1 Total Risk-Based Regulatory Limits Excess(2) 1) Regulatory capital ratios as of March 31, 2020 are preliminary. 2) Excesses shown are to regulatory minimums, including the 250 basis point capital conservation buffer, except for Tier 1 Leverage which is the well-capitalized minimum. Dollars are in millions. 14
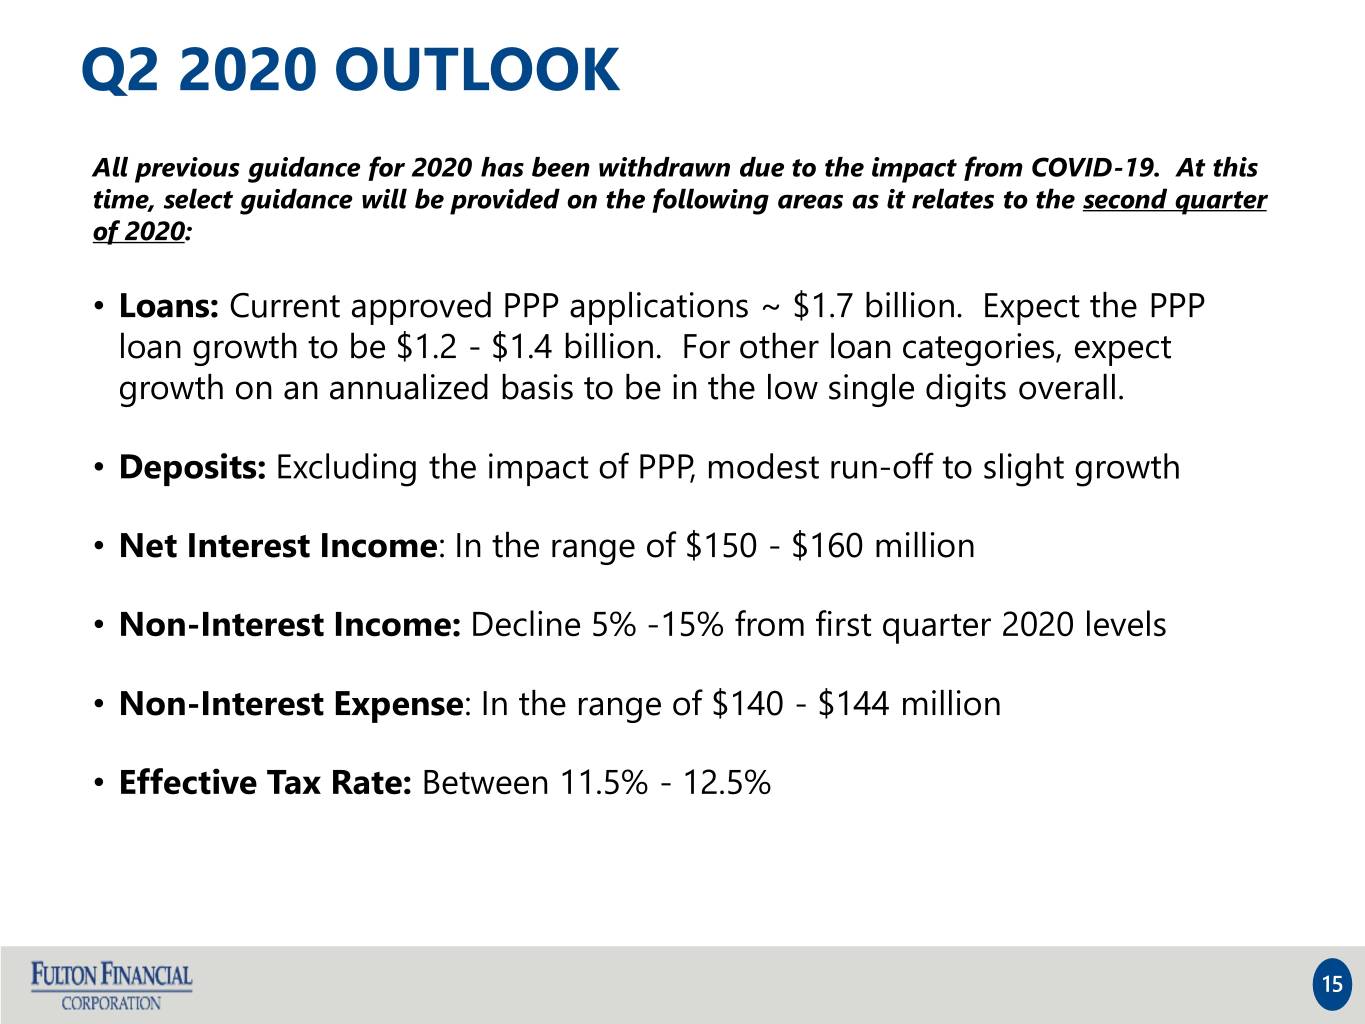
Q2 2020 OUTLOOK All previous guidance for 2020 has been withdrawn due to the impact from COVID-19. At this time, select guidance will be provided on the following areas as it relates to the second quarter of 2020: • Loans: Current approved PPP applications ~ $1.7 billion. Expect the PPP loan growth to be $1.2 - $1.4 billion. For other loan categories, expect growth on an annualized basis to be in the low single digits overall. • Deposits: Excluding the impact of PPP, modest run-off to slight growth • Net Interest Income: In the range of $150 - $160 million • Non-Interest Income: Decline 5% -15% from first quarter 2020 levels • Non-Interest Expense: In the range of $140 - $144 million • Effective Tax Rate: Between 11.5% - 12.5% 15
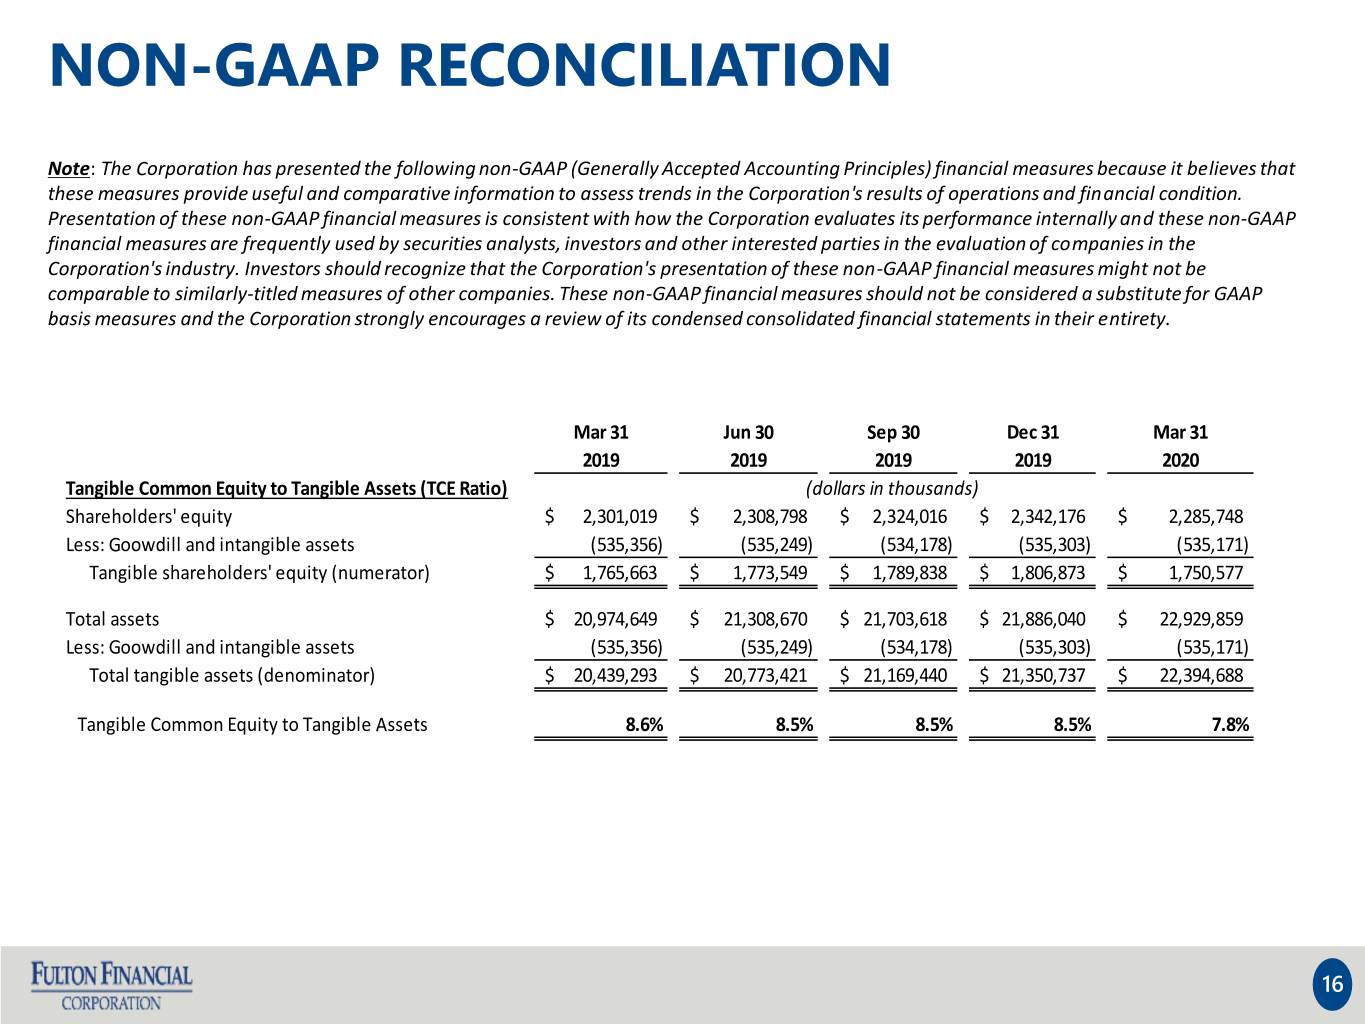
NON-GAAP RECONCILIATION Note: The Corporation has presented the following non-GAAP (Generally Accepted Accounting Principles) financial measures because it believes that these measures provide useful and comparative information to assess trends in the Corporation's results of operations and financial condition. Presentation of these non-GAAP financial measures is consistent with how the Corporation evaluates its performance internally and these non-GAAP financial measures are frequently used by securities analysts, investors and other interested parties in the evaluation of companies in the Corporation's industry. Investors should recognize that the Corporation's presentation of these non-GAAP financial measures might not be comparable to similarly-titled measures of other companies. These non-GAAP financial measures should not be considered a substitute for GAAP basis measures and the Corporation strongly encourages a review of its condensed consolidated financial statements in their entirety. Mar 31 Jun 30 Sep 30 Dec 31 Mar 31 2019 2019 2019 2019 2020 Tangible Common Equity to Tangible Assets (TCE Ratio) (dollars in thousands) Shareholders' equity $ 2,301,019 $ 2,308,798 $ 2,324,016 $ 2,342,176 $ 2,285,748 Less: Goowdill and intangible assets (535,356) (535,249) (534,178) (535,303) (535,171) Tangible shareholders' equity (numerator) $ 1,765,663 $ 1,773,549 $ 1,789,838 $ 1,806,873 $ 1,750,577 Total assets $ 20,974,649 $ 21,308,670 $ 21,703,618 $ 21,886,040 $ 22,929,859 Less: Goowdill and intangible assets (535,356) (535,249) (534,178) (535,303) (535,171) Total tangible assets (denominator) $ 20,439,293 $ 20,773,421 $ 21,169,440 $ 21,350,737 $ 22,394,688 Tangible Common Equity to Tangible Assets 8.6% 8.5% 8.5% 8.5% 7.8% 16
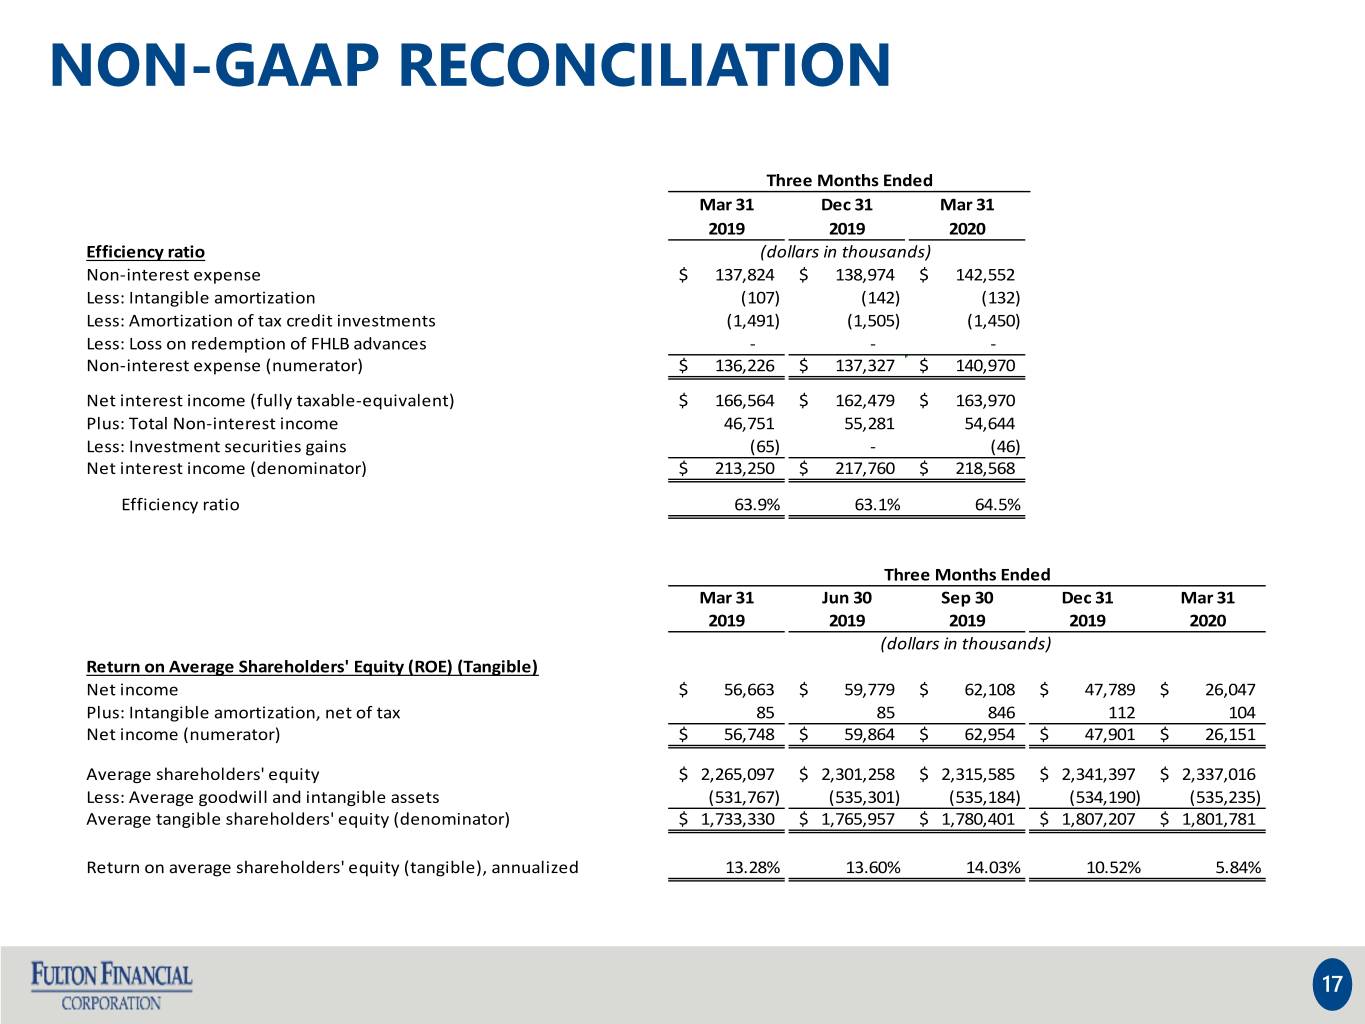
NON-GAAP RECONCILIATION Three Months Ended Mar 31 Dec 31 Mar 31 2019 2019 2020 Efficiency ratio (dollars in thousands) Non-interest expense $ 137,824 $ 138,974 $ 142,552 Less: Intangible amortization (107) (142) (132) Less: Amortization of tax credit investments (1,491) (1,505) (1,450) Less: Loss on redemption of FHLB advances - - - Non-interest expense (numerator) $ 136,226 $ 137,327 $ 140,970 Net interest income (fully taxable-equivalent) $ 166,564 $ 162,479 $ 163,970 Plus: Total Non-interest income 46,751 55,281 54,644 Less: Investment securities gains (65) - (46) Net interest income (denominator) $ 213,250 $ 217,760 $ 218,568 Efficiency ratio 63.9% 63.1% 64.5% Three Months Ended Mar 31 Jun 30 Sep 30 Dec 31 Mar 31 2019 2019 2019 2019 2020 (dollars in thousands) Return on Average Shareholders' Equity (ROE) (Tangible) Net income $ 56,663 $ 59,779 $ 62,108 $ 47,789 $ 26,047 Plus: Intangible amortization, net of tax 85 85 846 112 104 Net income (numerator) $ 56,748 $ 59,864 $ 62,954 $ 47,901 $ 26,151 Average shareholders' equity $ 2,265,097 $ 2,301,258 $ 2,315,585 $ 2,341,397 $ 2,337,016 Less: Average goodwill and intangible assets (531,767) (535,301) (535,184) (534,190) (535,235) Average tangible shareholders' equity (denominator) $ 1,733,330 $ 1,765,957 $ 1,780,401 $ 1,807,207 $ 1,801,781 Return on average shareholders' equity (tangible), annualized 13.28% 13.60% 14.03% 10.52% 5.84% 17
