Attached files
| file | filename |
|---|---|
| 8-K - 8-K - UNITY BANCORP INC /NJ/ | unty-8k1q20earnings.htm |
For Immediate Release | News Media & Financial Analyst Contact: |
Unity Bancorp, Inc. (NSDQ: UNTY) | James A. Hughes, President and CEO |
April 17, 2020 | (908) 713-4306 |
 Unity Bancorp Reports
Quarterly Earnings of $5.4 Million
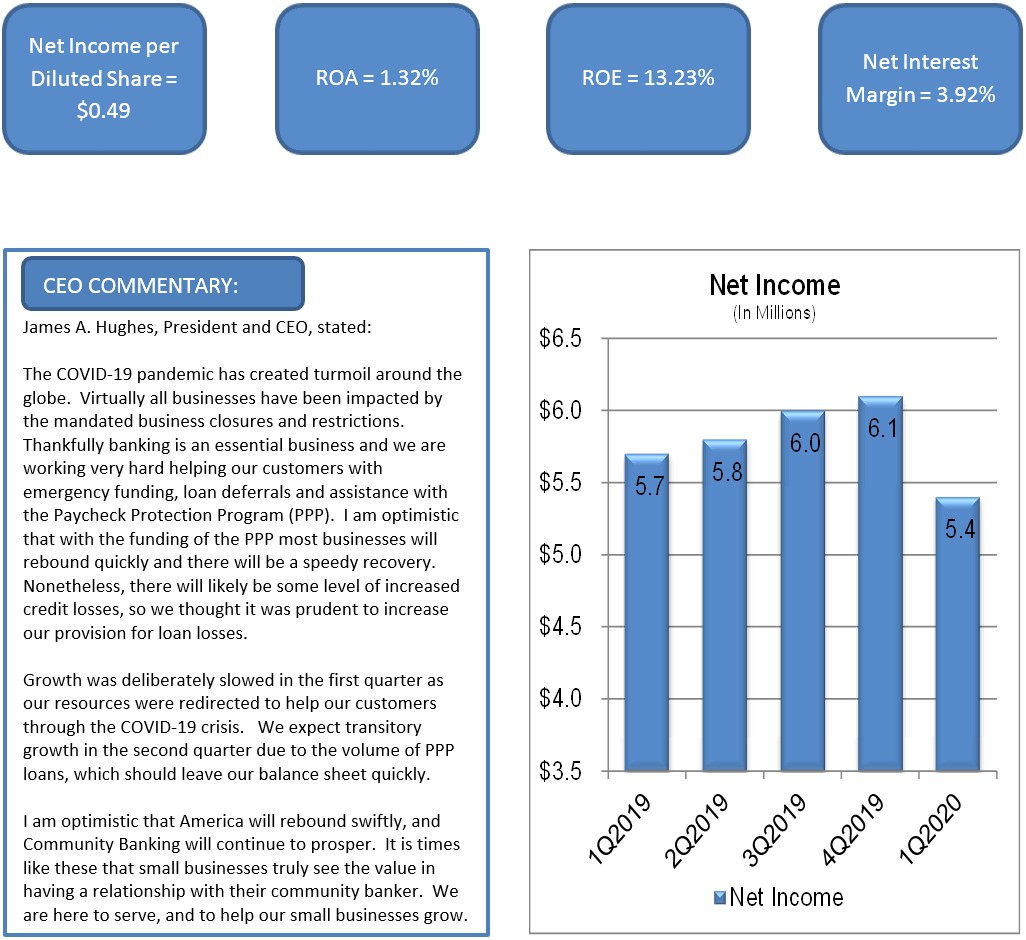
Clinton, NJ, April 17, 2020 - Unity Bancorp, Inc. (NASDAQ: UNTY), parent company of Unity Bank, reported net income of $5.4 million, or $0.49 per diluted share, for the quarter ended March 31, 2020, a 6.5% decrease compared to the $5.7 million, or $0.52 per diluted share reported for the prior year’s first quarter, primarily due to an increase of $1.0 million in our provision for loan losses, necessitated by impacts on the loan portfolio caused by COVID-19.
COVID-19 Impact
Due to the COVID-19 epidemic, results of operations for the first quarter of 2020 do not track with the Company’s historical performance. The impact of COVID-19 is evolving rapidly and its future effects are uncertain at this moment in time. The actual impact will depend on many factors beyond our Company’s control. However, the Company has and is taking every step to protect the health and safety of its employees and customers and to work with its customers experiencing economic hardship resulting from the epidemic. The Company has the majority of non-branch personnel working remotely. Branch lobbies are now closed, and the Company is servicing clients through its drive through facilities, ATM’s or by appointment. The Company has also opted to host our Annual Shareholders Meeting online, in light of government restrictions on group gatherings.
The Bank is working closely with its loan customers to educate and guide them on their options for financial assistance, including disaster loans, the Paycheck Protection Program (PPP) and payment relief through deferrals and waived fees. The Company will continue to provide a fast and flexible response to the quickly changing circumstances and is confident it will navigate successfully through these trying times.
First Quarter Earnings Highlights
• | Net interest income, our primary driver of earnings, increased $1.0 million to $15.2 million for the quarter ended March 31, 2020, compared to the prior year’s quarter, due to strong loan growth. |
• | Net interest margin (NIM) decreased to 3.92% for the quarter ended March 31, 2020, compared to 4.06% for the prior year’s quarter and increased 4 basis points from 3.88% in the prior sequential quarter ended December 31, 2019. Due to the recent significant interest rate cuts by the Federal Reserve Board in response to COVID-19, modest NIM contractions are expected during the remainder of 2020. |
• | The provision for loan losses was $1.5 million for the quarter ended March 31, 2020 an increase of $1.0 million from the prior year’s quarter due to the increased risk of loan defaults as a result of COVID-19. Many of the Company’s customers have been required to close pursuant to governmental restrictions on non-essential businesses, and we expect they will suffer significant cash flow issues. Due to the uncertainty of COVID-19, the Company anticipates an elevated provision until businesses have reopened and deferral periods have expired. |
• | Noninterest income increased $523 thousand to $2.5 million compared to the prior year’s quarter and increased $149 thousand compared to the prior sequential quarter. The increases were primarily due to increased gains on mortgage loan sales, partially offset by amortization on our equity securities. |
• | Noninterest expense increased $845 thousand to $9.3 million compared to the prior year’s quarter and increased $604 thousand compared to the prior sequential quarter. The increases were primarily due to increased compensation accruals, severance payouts and increased consulting expenses in connection with BSA/AML remediation. |
• | The effective tax rate was 22.9% compared to 20.9% in the prior year's quarter. |
Balance Sheet Highlights
• | Total loans increased $14.1 million, or 1.0%, from year-end 2019 to $1.4 billion at March 31, 2020. Commercial and consumer loan portfolios increased $21.0 million and $6.2 million, respectively, partially offset by a decline of $11.6 million in residential mortgage loans and $1.5 million in SBA loans. Loan growth was impacted by payoffs and a $10.0 million sale of portfolio mortgage loans. The Company anticipates slow loan growth through at least the second quarter due to COVID-19. |
• | Total deposits increased $128.5 million, or 10.3%, from year-end 2019 to $1.4 billion at March 31, 2020 primarily due to increased noninterest-bearing demand deposits, resulting from a temporary nonrecurring deposit, and a strategic increase in brokered deposits. |
• | Borrowed funds decreased $114.0 million to $169.0 million at March 31, 2020. |
• | Shareholders’ equity was $164.3 million at March 31, 2020, an increase of $3.6 million from year-end 2019, due to retained net income. On July 16, 2019, the Company authorized the repurchase of up to 5.0% of its outstanding common stock. However, the Company has currently suspended its stock buybacks during the COVID-19 epidemic. |
• | Book value per common share was $15.10 as of March 31, 2020. |
• | At March 31, 2020, the leverage, common equity Tier I, Tier I and Total Risk Based Capital ratios were 10.55%, 11.72%, 12.44% and 13.21% respectively, all in excess of the ratios required to be deemed “well-capitalized.” |
• | Nonperforming assets were $11.2 million, which consisted primarily of $8.4 million of well-secured residential assets. The allowance to total loans ratio was 1.21% at March 31, 2020. Net charge-offs were $519 thousand for the quarter. |
Other Highlights
• | Unity Bank has been named one of the 2020 Best Places to Work in New Jersey by NJBiz - the only bank in New Jersey to make this prestigious list. It is the fourth year in a row that Unity has been honored by the survey and awards program, which identifies, recognizes and honors the top places of employment in New Jersey that benefit the state's economy, workforce and businesses. |
• | Employees of Unity Bank have been completely focused on helping our customers cope with the impacts of COVID-19 by, among other things, participating in SBA sponsored relief programs to assist small businesses. |
Unity Bancorp, Inc. is a financial service organization headquartered in Clinton, New Jersey, with approximately $1.7 billion in assets and $1.4 billion in deposits. Unity Bank provides financial services to retail, corporate and small business customers through its 19 retail service centers located in Bergen, Hunterdon, Middlesex, Somerset, Union and Warren Counties in New Jersey and Northampton County in Pennsylvania. For additional information about Unity, visit our website at www.unitybank.com , or call 800-618-BANK.
This news release contains certain forward-looking statements, either expressed or implied, which are provided to assist the reader in understanding anticipated future financial performance. These statements may be identified by use of the words “believe”, “expect”, “intend”, “anticipate”, “estimate”, “project” or similar expressions. These statements involve certain risks, uncertainties, estimates and assumptions made by management, which are subject to factors beyond the company’s control and could impede its ability to achieve these goals. These factors include those items included in our Annual Report on Form 10-K under the heading “Item IA-Risk Factors” as well as general economic conditions, trends in interest rates, the ability of our borrowers to repay their loans, our ability to manage and reduce the level of our nonperforming assets, and results of regulatory exams, among other factors.
UNITY BANCORP, INC.
SUMMARY FINANCIAL HIGHLIGHTS
March 31, 2020
Mar 31, 2020 vs. | ||||||||||||||||||||
Dec 31, 2019 | Mar 31, 2019 | |||||||||||||||||||
(In thousands, except percentages and per share amounts) | Mar 31, 2020 | Dec 31, 2019 | Mar 31, 2019 | % | % | |||||||||||||||
BALANCE SHEET DATA: | ||||||||||||||||||||
Total assets | $ | 1,740,076 | $ | 1,718,942 | $ | 1,590,046 | 1.2 | % | 9.4 | % | ||||||||||
Total deposits | 1,378,618 | 1,250,114 | 1,226,586 | 10.3 | 12.4 | |||||||||||||||
Total loans | 1,439,645 | 1,425,558 | 1,312,994 | 1.0 | 9.6 | |||||||||||||||
Total securities | 58,002 | 66,564 | 62,962 | (12.9 | ) | (7.9 | ) | |||||||||||||
Total shareholders' equity | 164,305 | 160,709 | 143,717 | 2.2 | 14.3 | |||||||||||||||
Allowance for loan losses | (17,376 | ) | (16,395 | ) | (15,684 | ) | 6.0 | 10.8 | ||||||||||||
FINANCIAL DATA - QUARTER TO DATE: | ||||||||||||||||||||
Income before provision for income taxes | $ | 6,966 | $ | 7,940 | $ | 7,260 | (12.3 | ) | (4.0 | ) | ||||||||||
Provision for income taxes | 1,598 | 1,820 | 1,520 | (12.2 | ) | 5.1 | ||||||||||||||
Net income | $ | 5,368 | $ | 6,120 | $ | 5,740 | (12.3 | ) | (6.5 | ) | ||||||||||
Net income per common share - Basic | $ | 0.49 | $ | 0.56 | $ | 0.53 | (12.5 | ) | (7.5 | ) | ||||||||||
Net income per common share - Diluted | $ | 0.49 | $ | 0.55 | $ | 0.52 | (10.9 | ) | (5.8 | ) | ||||||||||
Performance ratios: | ||||||||||||||||||||
Return on average assets | 1.32 | % | 1.53 | % | 1.55 | % | ||||||||||||||
Return on average equity | 13.23 | % | 15.41 | % | 16.52 | % | ||||||||||||||
Efficiency ratio | 51.92 | % | 51.29 | % | 52.53 | % | ||||||||||||||
Net interest margin | 3.92 | % | 3.88 | % | 4.06 | % | ||||||||||||||
Noninterest expense to average assets | 2.29 | % | 2.17 | % | 2.29 | % | ||||||||||||||
SHARE INFORMATION: | ||||||||||||||||||||
Market price per share | $ | 11.70 | $ | 22.57 | $ | 18.88 | (48.2 | ) | (38.0 | ) | ||||||||||
Dividends paid | $ | 0.08 | $ | 0.08 | $ | 0.07 | — | 14.3 | ||||||||||||
Book value per common share | $ | 15.10 | $ | 14.77 | $ | 13.28 | 2.2 | 13.7 | ||||||||||||
Average diluted shares outstanding (QTD) | 11,037 | 11,057 | 10,955 | (0.2 | ) | 0.7 | ||||||||||||||
CAPITAL RATIOS: | ||||||||||||||||||||
Total equity to total assets | 9.44 | % | 9.35 | % | 9.04 | % | ||||||||||||||
Leverage ratio | 10.56 | % | 10.59 | % | 10.09 | % | ||||||||||||||
Common equity tier 1 risk-based capital ratio | 11.71 | % | 11.59 | % | 11.78 | % | ||||||||||||||
Tier 1 risk-based capital ratio | 12.43 | % | 12.32 | % | 12.62 | % | ||||||||||||||
Total risk-based capital ratio | 13.19 | % | 13.06 | % | 13.87 | % | ||||||||||||||
CREDIT QUALITY AND RATIOS: | ||||||||||||||||||||
Nonperforming assets | $ | 11,178 | $ | 7,372 | $ | 7,547 | 51.6 | 48.1 | ||||||||||||
QTD net chargeoffs (annualized) to QTD average loans | 0.15 | % | 0.03 | % | 0.09 | % | ||||||||||||||
Allowance for loan losses to total loans | 1.21 | % | 1.15 | % | 1.19 | % | ||||||||||||||
Nonperforming assets to total loans | 0.67 | % | 0.40 | % | 0.55 | % | ||||||||||||||
Nonperforming assets to total assets | 0.64 | % | 0.43 | % | 0.47 | % | ||||||||||||||
UNITY BANCORP, INC.
CONSOLIDATED BALANCE SHEETS
March 31, 2020
Mar 31, 2020 vs. | ||||||||||||||||||||
Dec 31, 2019 | Mar 31, 2019 | |||||||||||||||||||
(In thousands, except percentages) | Mar 31, 2020 | Dec 31, 2019 | Mar 31, 2019 | % | % | |||||||||||||||
ASSETS | ||||||||||||||||||||
Cash and due from banks | $ | 20,377 | $ | 21,106 | $ | 20,737 | (3.5 | ) % | (1.7 | ) % | ||||||||||
Federal funds sold, interest-bearing deposits and repos | 158,618 | 136,910 | 128,400 | 15.9 | 23.5 | |||||||||||||||
Cash and cash equivalents | 178,995 | 158,016 | 149,137 | 13.3 | 20.0 | |||||||||||||||
Securities: | ||||||||||||||||||||
Securities available for sale | 56,290 | 64,275 | 45,934 | (12.4 | ) | 22.5 | ||||||||||||||
Securities held to maturity | — | — | 14,780 | — | (100.0 | ) | ||||||||||||||
Equity securities | 1,712 | 2,289 | 2,248 | (25.2 | ) | (23.8 | ) | |||||||||||||
Total securities | 58,002 | 66,564 | 62,962 | (12.9 | ) | (7.9 | ) | |||||||||||||
Loans: | ||||||||||||||||||||
SBA loans held for sale | 16,104 | 13,529 | 8,010 | 19.0 | 101.0 | |||||||||||||||
SBA loans held for investment | 31,697 | 35,767 | 38,815 | (11.4 | ) | (18.3 | ) | |||||||||||||
Commercial loans | 786,077 | 765,032 | 702,235 | 2.8 | 11.9 | |||||||||||||||
Residential mortgage loans | 456,072 | 467,706 | 438,431 | (2.5 | ) | 4.0 | ||||||||||||||
Consumer loans | 149,695 | 143,524 | 125,503 | 4.3 | 19.3 | |||||||||||||||
Total loans | 1,439,645 | 1,425,558 | 1,312,994 | 1.0 | 9.6 | |||||||||||||||
Allowance for loan losses | (17,376 | ) | (16,395 | ) | (15,684 | ) | 6.0 | 10.8 | ||||||||||||
Net loans | 1,422,269 | 1,409,163 | 1,297,310 | 0.9 | 9.6 | |||||||||||||||
Premises and equipment, net | 21,046 | 21,315 | 23,059 | (1.3 | ) | (8.7 | ) | |||||||||||||
Bank owned life insurance ("BOLI") | 26,379 | 26,323 | 24,861 | 0.2 | 6.1 | |||||||||||||||
Deferred tax assets | 6,305 | 5,559 | 5,320 | 13.4 | 18.5 | |||||||||||||||
Federal Home Loan Bank ("FHLB") stock | 9,054 | 14,184 | 10,120 | (36.2 | ) | (10.5 | ) | |||||||||||||
Accrued interest receivable | 7,396 | 6,984 | 6,926 | 5.9 | 6.8 | |||||||||||||||
Other real estate owned ("OREO") | 1,523 | 1,723 | 273 | (11.6 | ) | 457.9 | ||||||||||||||
Goodwill | 1,516 | 1,516 | 1,516 | — | — | |||||||||||||||
Other assets | 7,591 | 7,595 | 8,562 | (0.1 | ) | (11.3 | ) | |||||||||||||
Total assets | $ | 1,740,076 | $ | 1,718,942 | $ | 1,590,046 | 1.2 | % | 9.4 | % | ||||||||||
LIABILITIES AND SHAREHOLDERS' EQUITY | ||||||||||||||||||||
Liabilities: | ||||||||||||||||||||
Deposits: | ||||||||||||||||||||
Noninterest-bearing demand | $ | 334,731 | $ | 279,793 | $ | 259,114 | 19.6 | % | 29.2 | % | ||||||||||
Interest-bearing demand | 166,990 | 176,335 | 166,409 | (5.3 | ) | 0.3 | ||||||||||||||
Savings | 388,213 | 389,795 | 399,006 | (0.4 | ) | (2.7 | ) | |||||||||||||
Time Deposits | 488,684 | 404,191 | 402,057 | 20.9 | 21.5 | |||||||||||||||
Total deposits | 1,378,618 | 1,250,114 | 1,226,586 | 10.3 | 12.4 | |||||||||||||||
Borrowed funds | 169,000 | 283,000 | 195,000 | (40.3 | ) | (13.3 | ) | |||||||||||||
Subordinated debentures | 10,310 | 10,310 | 10,310 | — | — | |||||||||||||||
Accrued interest payable | 237 | 455 | 419 | (47.9 | ) | (43.4 | ) | |||||||||||||
Accrued expenses and other liabilities | 17,606 | 14,354 | 14,014 | 22.7 | 25.6 | |||||||||||||||
Total liabilities | 1,575,771 | 1,558,233 | 1,446,329 | 1.1 | 8.9 | |||||||||||||||
Shareholders' equity: | ||||||||||||||||||||
Common stock | 90,370 | 90,113 | 88,779 | 0.3 | 1.8 | |||||||||||||||
Retained earnings | 74,939 | 70,442 | 55,145 | 6.4 | 35.9 | |||||||||||||||
Treasury stock, at cost | (172 | ) | — | — | (100.0) | (100.0) | ||||||||||||||
Accumulated other comprehensive (loss) income | (832 | ) | 154 | (207 | ) | NM | NM | |||||||||||||
Total shareholders' equity | 164,305 | 160,709 | 143,717 | 2.2 | 14.3 | |||||||||||||||
Total liabilities and shareholders' equity | $ | 1,740,076 | $ | 1,718,942 | $ | 1,590,046 | 1.2 | % | 9.4 | % | ||||||||||
COMMON SHARES AT PERIOD END: | ||||||||||||||||||||
Shares issued | 10,894 | 10,881 | 10,822 | |||||||||||||||||
Shares oustanding | 10,883 | 10,881 | 10,822 | |||||||||||||||||
Treasury shares | 11 | — | — | |||||||||||||||||
NM=Not meaningful
UNITY BANCORP, INC.
QTD CONSOLIDATED STATEMENTS OF INCOME
March 31, 2020
Mar 31, 2020 vs. | ||||||||||||||||||||||||||||
For the three months ended | Dec 31, 2019 | Mar 31, 2019 | ||||||||||||||||||||||||||
(In thousands, except percentages and per share amounts) | Mar 31, 2020 | Dec 31, 2019 | Mar 31, 2019 | $ | % | $ | % | |||||||||||||||||||||
INTEREST INCOME | ||||||||||||||||||||||||||||
Federal funds sold, interest-bearing deposits and repos | $ | 188 | $ | 182 | $ | 221 | $ | 6 | 3.3 | % | $ | (33 | ) | (14.9 | )% | |||||||||||||
FHLB stock | 109 | 110 | 116 | (1 | ) | (0.9 | ) | (7 | ) | (6.0 | ) | |||||||||||||||||
Securities: | ||||||||||||||||||||||||||||
Taxable | 511 | 527 | 475 | (16 | ) | (3.0 | ) | 36 | 7.6 | |||||||||||||||||||
Tax-exempt | 22 | 22 | 29 | — | — | (7 | ) | (24.1 | ) | |||||||||||||||||||
Total securities | 533 | 549 | 504 | (16 | ) | (2.9 | ) | 29 | 5.8 | |||||||||||||||||||
Loans: | ||||||||||||||||||||||||||||
SBA loans | 985 | 900 | 995 | 85 | 9.4 | (10 | ) | (1.0 | ) | |||||||||||||||||||
Commercial loans | 9,933 | 9,684 | 9,069 | 249 | 2.6 | 864 | 9.5 | |||||||||||||||||||||
Residential mortgage loans | 5,770 | 5,782 | 5,560 | (12 | ) | (0.2 | ) | 210 | 3.8 | |||||||||||||||||||
Consumer loans | 2,067 | 2,105 | 2,035 | (38 | ) | (1.8 | ) | 32 | 1.6 | |||||||||||||||||||
Total loans | 18,755 | 18,471 | 17,659 | 284 | 1.5 | 1,096 | 6.2 | |||||||||||||||||||||
Total interest income | 19,585 | 19,312 | 18,500 | 273 | 1.4 | 1,085 | 5.9 | |||||||||||||||||||||
INTEREST EXPENSE | ||||||||||||||||||||||||||||
Interest-bearing demand deposits | 478 | 506 | 409 | (28 | ) | (5.5 | ) | 69 | 16.9 | |||||||||||||||||||
Savings deposits | 851 | 996 | 1,119 | (145 | ) | (14.6 | ) | (268 | ) | (23.9 | ) | |||||||||||||||||
Time deposits | 2,447 | 2,439 | 2,007 | 8 | 0.3 | 440 | 21.9 | |||||||||||||||||||||
Borrowed funds and subordinated debentures | 565 | 608 | 749 | (43 | ) | (7.1 | ) | (184 | ) | (24.6 | ) | |||||||||||||||||
Total interest expense | 4,341 | 4,549 | 4,284 | (208 | ) | (4.6 | ) | 57 | 1.3 | |||||||||||||||||||
Net interest income | 15,244 | 14,763 | 14,216 | 481 | 3.3 | 1,028 | 7.2 | |||||||||||||||||||||
Provision for loan losses | 1,500 | 500 | 500 | 1,000 | 200.0 | 1,000 | 200.0 | |||||||||||||||||||||
Net interest income after provision for loan losses | 13,744 | 14,263 | 13,716 | (519 | ) | (3.6 | ) | 28 | 0.2 | |||||||||||||||||||
NONINTEREST INCOME | ||||||||||||||||||||||||||||
Branch fee income | 317 | 383 | 368 | (66 | ) | (17.2 | ) | (51 | ) | (13.9 | ) | |||||||||||||||||
Service and loan fee income | 376 | 432 | 442 | (56 | ) | (13.0 | ) | (66 | ) | (14.9 | ) | |||||||||||||||||
Gain on sale of SBA loans held for sale, net | 473 | 355 | 316 | 118 | 33.2 | 157 | 49.7 | |||||||||||||||||||||
Gain on sale of mortgage loans, net | 1,051 | 565 | 350 | 486 | 86.0 | 701 | 200.3 | |||||||||||||||||||||
BOLI income | 173 | 152 | 151 | 21 | 13.8 | 22 | 14.6 | |||||||||||||||||||||
Net security (losses) gains | (170 | ) | 157 | 100 | (327 | ) | (208.3 | ) | (270 | ) | (270.0 | ) | ||||||||||||||||
Other income | 325 | 352 | 295 | (27 | ) | (7.7 | ) | 30 | 10.2 | |||||||||||||||||||
Total noninterest income | 2,545 | 2,396 | 2,022 | 149 | 6.2 | 523 | 25.9 | |||||||||||||||||||||
NONINTEREST EXPENSE | ||||||||||||||||||||||||||||
Compensation and benefits | 5,439 | 5,282 | 4,845 | 157 | 3.0 | 594 | 12.3 | |||||||||||||||||||||
Occupancy | 624 | 652 | 694 | (28 | ) | (4.3 | ) | (70 | ) | (10.1 | ) | |||||||||||||||||
Processing and communications | 708 | 711 | 716 | (3 | ) | (0.4 | ) | (8 | ) | (1.1 | ) | |||||||||||||||||
Furniture and equipment | 655 | 806 | 659 | (151 | ) | (18.7 | ) | (4 | ) | (0.6 | ) | |||||||||||||||||
Professional services | 332 | 222 | 288 | 110 | 49.5 | 44 | 15.3 | |||||||||||||||||||||
Loan collection & OREO expenses | 186 | 33 | 66 | 153 | 463.6 | 120 | 181.8 | |||||||||||||||||||||
Other loan expenses | 89 | 70 | 46 | 19 | 27.1 | 43 | 93.5 | |||||||||||||||||||||
Deposit insurance | 88 | — | 167 | 88 | NM | (79 | ) | (47.3 | ) | |||||||||||||||||||
Advertising | 290 | 302 | 348 | (12 | ) | (4.0 | ) | (58 | ) | (16.7 | ) | |||||||||||||||||
Director fees | 200 | 175 | 163 | 25 | 14.3 | 37 | 22.7 | |||||||||||||||||||||
Other expenses | 712 | 466 | 486 | 246 | 52.8 | 226 | 46.5 | |||||||||||||||||||||
Total noninterest expense | 9,323 | 8,719 | 8,478 | 604 | 6.9 | 845 | 10.0 | |||||||||||||||||||||
Income before provision for income taxes | 6,966 | 7,940 | 7,260 | (974 | ) | (12.3 | ) | (294 | ) | (4.0 | ) | |||||||||||||||||
Provision for income taxes | 1,598 | 1,820 | 1,520 | (222 | ) | (12.2 | ) | 78 | 5.1 | |||||||||||||||||||
Net income | $ | 5,368 | $ | 6,120 | $ | 5,740 | $ | (752 | ) | (12.3 | )% | $ | (372 | ) | (6.5 | )% | ||||||||||||
Effective tax rate | 22.9 | % | 22.9 | % | 20.9 | % | ||||||||||||||||||||||
Net income per common share - Basic | $ | 0.49 | $ | 0.56 | $ | 0.53 | ||||||||||||||||||||||
Net income per common share - Diluted | $ | 0.49 | $ | 0.55 | $ | 0.52 | ||||||||||||||||||||||
Weighted average common shares outstanding - Basic | 10,883 | 10,872 | 10,801 | |||||||||||||||||||||||||
Weighted average common shares outstanding - Diluted | 11,037 | 11,057 | 10,955 | |||||||||||||||||||||||||
UNITY BANCORP, INC.
QUARTER TO DATE NET INTEREST MARGIN
March 31, 2020
(Dollar amounts in thousands, interest amounts and interest rates/yields on a fully tax-equivalent basis) | ||||||||||||||||||||||
For the three months ended | ||||||||||||||||||||||
March 31, 2020 | March 31, 2019 | |||||||||||||||||||||
Average Balance | Interest | Rate/Yield | Average Balance | Interest | Rate/Yield | |||||||||||||||||
ASSETS | ||||||||||||||||||||||
Interest-earning assets: | ||||||||||||||||||||||
Federal funds sold, interest-bearing deposits and repos | $ | 69,196 | $ | 188 | 1.09 | % | $ | 38,066 | $ | 221 | 2.35 | % | ||||||||||
FHLB stock | 6,883 | 109 | 6.37 | 6,951 | 116 | 6.77 | ||||||||||||||||
Securities: | ||||||||||||||||||||||
Taxable | 60,243 | 511 | 3.41 | 58,735 | 475 | 3.28 | ||||||||||||||||
Tax-exempt | 3,783 | 31 | 3.30 | 4,588 | 36 | 3.18 | ||||||||||||||||
Total securities (A) | 64,026 | 542 | 3.40 | 63,323 | 511 | 3.27 | ||||||||||||||||
Loans: | ||||||||||||||||||||||
SBA loans | 50,528 | 985 | 7.84 | 50,015 | 995 | 8.07 | ||||||||||||||||
Commercial loans | 769,497 | 9,933 | 5.19 | 697,856 | 9,069 | 5.27 | ||||||||||||||||
Residential mortgage loans | 462,748 | 5,770 | 5.02 | 439,904 | 5,560 | 5.13 | ||||||||||||||||
Consumer loans | 142,284 | 2,067 | 5.84 | 125,987 | 2,035 | 6.55 | ||||||||||||||||
Total loans (B) | 1,425,057 | 18,755 | 5.29 | 1,313,762 | 17,659 | 5.45 | ||||||||||||||||
Total interest-earning assets | $ | 1,565,162 | $ | 19,594 | 5.04 | % | $ | 1,422,102 | $ | 18,507 | 5.28 | % | ||||||||||
Noninterest-earning assets: | ||||||||||||||||||||||
Cash and due from banks | 21,942 | 26,105 | ||||||||||||||||||||
Allowance for loan losses | (16,698 | ) | (15,753 | ) | ||||||||||||||||||
Other assets | 70,381 | 70,586 | ||||||||||||||||||||
Total noninterest-earning assets | 75,625 | 80,938 | ||||||||||||||||||||
Total assets | $ | 1,640,787 | $ | 1,503,040 | ||||||||||||||||||
LIABILITIES AND SHAREHOLDERS' EQUITY | ||||||||||||||||||||||
Interest-bearing liabilities: | ||||||||||||||||||||||
Total interest-bearing demand deposits | $ | 193,016 | $ | 478 | 1.00 | % | $ | 182,080 | $ | 409 | 0.91 | % | ||||||||||
Total savings deposits | 394,082 | 851 | 0.87 | 397,209 | 1,119 | 1.14 | ||||||||||||||||
Total time deposits | 435,705 | 2,447 | 2.26 | 370,990 | 2,007 | 2.19 | ||||||||||||||||
Total interest-bearing deposits | 1,022,803 | 3,776 | 1.48 | 950,279 | 3,535 | 1.51 | ||||||||||||||||
Borrowed funds and subordinated debentures | 131,057 | 565 | 1.73 | 134,877 | 749 | 2.25 | ||||||||||||||||
Total interest-bearing liabilities | $ | 1,153,860 | $ | 4,341 | 1.51 | % | $ | 1,085,156 | $ | 4,284 | 1.60 | % | ||||||||||
Noninterest-bearing liabilities: | ||||||||||||||||||||||
Noninterest-bearing demand deposits | 307,683 | 262,664 | ||||||||||||||||||||
Other liabilities | 16,101 | 14,327 | ||||||||||||||||||||
Total noninterest-bearing liabilities | 323,784 | 276,991 | ||||||||||||||||||||
Total shareholders' equity | 163,143 | 140,893 | ||||||||||||||||||||
Total liabilities and shareholders' equity | $ | 1,640,787 | $ | 1,503,040 | ||||||||||||||||||
Net interest spread | $ | 15,253 | 3.53 | % | $ | 14,223 | 3.68 | % | ||||||||||||||
Tax-equivalent basis adjustment | (9 | ) | (7 | ) | ||||||||||||||||||
Net interest income | $ | 15,244 | $ | 14,216 | ||||||||||||||||||
Net interest margin | 3.92 | % | 4.06 | % | ||||||||||||||||||
(A) | Yields related to securities exempt from federal and state income taxes are stated on a fully tax-equivalent basis. They are reduced by the nondeductable portion of interest expense, assuming a federal tax rate of 21 percent and applicable state rates. |
(B) | The loan averages are stated net of unearned income, and the averages include loans on which the accrual of interest has been discontinued. |
UNITY BANCORP, INC.
QUARTER TO DATE NET INTEREST MARGIN
March 31, 2020
(Dollar amounts in thousands, interest amounts and interest rates/yields on a fully tax-equivalent basis) | ||||||||||||||||||||||
For the three months ended | ||||||||||||||||||||||
March 31, 2020 | December 31, 2019 | |||||||||||||||||||||
Average Balance | Interest | Rate/Yield | Average Balance | Interest | Rate/Yield | |||||||||||||||||
ASSETS | ||||||||||||||||||||||
Interest-earning assets: | ||||||||||||||||||||||
Federal funds sold, interest-bearing deposits and repos | $ | 69,196 | $ | 188 | 1.09 | % | $ | 44,346 | $ | 182 | 1.63 | % | ||||||||||
FHLB stock | 6,883 | 109 | 6.37 | 6,949 | 110 | 6.28 | ||||||||||||||||
Securities: | ||||||||||||||||||||||
Taxable | 60,243 | 511 | 3.41 | 62,787 | 527 | 3.33 | ||||||||||||||||
Tax-exempt | 3,783 | 31 | 3.30 | 4,106 | 27 | 2.61 | ||||||||||||||||
Total securities (A) | 64,026 | 542 | 3.40 | 66,893 | 554 | 3.29 | ||||||||||||||||
Loans: | ||||||||||||||||||||||
SBA loans | 50,528 | 985 | 7.84 | 50,016 | 900 | 7.14 | ||||||||||||||||
Commercial loans | 769,497 | 9,933 | 5.19 | 742,071 | 9,684 | 5.18 | ||||||||||||||||
Residential mortgage loans | 462,748 | 5,770 | 5.02 | 460,450 | 5,782 | 4.98 | ||||||||||||||||
Consumer loans | 142,284 | 2,067 | 5.84 | 140,458 | 2,105 | 5.95 | ||||||||||||||||
Total loans (B) | 1,425,057 | 18,755 | 5.29 | 1,392,995 | 18,471 | 5.26 | ||||||||||||||||
Total interest-earning assets | $ | 1,565,162 | $ | 19,594 | 5.04 | % | $ | 1,511,183 | $ | 19,317 | 5.07 | % | ||||||||||
Noninterest-earning assets: | ||||||||||||||||||||||
Cash and due from banks | 21,942 | 27,964 | ||||||||||||||||||||
Allowance for loan losses | (16,698 | ) | (16,293 | ) | ||||||||||||||||||
Other assets | 70,381 | 69,226 | ||||||||||||||||||||
Total noninterest-earning assets | 75,625 | 80,897 | ||||||||||||||||||||
Total assets | $ | 1,640,787 | $ | 1,592,080 | ||||||||||||||||||
LIABILITIES AND SHAREHOLDERS' EQUITY | ||||||||||||||||||||||
Interest-bearing liabilities: | ||||||||||||||||||||||
Total interest-bearing demand deposits | $ | 193,016 | $ | 478 | 1.00 | % | $ | 196,638 | $ | 506 | 1.02 | % | ||||||||||
Total savings deposits | 394,082 | 851 | 0.87 | 397,401 | 996 | 0.99 | ||||||||||||||||
Total time deposits | 435,705 | 2,447 | 2.26 | 411,445 | 2,439 | 2.35 | ||||||||||||||||
Total interest-bearing deposits | 1,022,803 | 3,776 | 1.48 | 1,005,484 | 3,941 | 1.55 | ||||||||||||||||
Borrowed funds and subordinated debentures | 131,057 | 565 | 1.73 | 132,533 | 608 | 1.82 | ||||||||||||||||
Total interest-bearing liabilities | $ | 1,153,860 | $ | 4,341 | 1.51 | % | $ | 1,138,017 | $ | 4,549 | 1.59 | % | ||||||||||
Noninterest-bearing liabilities: | ||||||||||||||||||||||
Noninterest-bearing demand deposits | 307,683 | 279,925 | ||||||||||||||||||||
Other liabilities | 16,101 | 16,611 | ||||||||||||||||||||
Total noninterest-bearing liabilities | 323,784 | 296,536 | ||||||||||||||||||||
Total shareholders' equity | 163,143 | 157,527 | ||||||||||||||||||||
Total liabilities and shareholders' equity | $ | 1,640,787 | $ | 1,592,080 | ||||||||||||||||||
Net interest spread | $ | 15,253 | 3.53 | % | $ | 14,768 | 3.48 | % | ||||||||||||||
Tax-equivalent basis adjustment | (9 | ) | (5 | ) | ||||||||||||||||||
Net interest income | $ | 15,244 | $ | 14,763 | ||||||||||||||||||
Net interest margin | 3.92 | % | 3.88 | % | ||||||||||||||||||
(A) | Yields related to securities exempt from federal and state income taxes are stated on a fully tax-equivalent basis. They are reduced by the nondeductable portion of interest expense, assuming a federal tax rate of 21 percent and applicable state rates. |
(B) | The loan averages are stated net of unearned income, and the averages include loans on which the accrual of interest has been discontinued. |
UNITY BANCORP, INC.
QUARTERLY ALLOWANCE FOR LOAN LOSSES AND LOAN QUALITY SCHEDULES
March 31, 2020
Amounts in thousands, except percentages | Mar 31, 2020 | Dec 31, 2019 | Sep 30, 2019 | Jun 30, 2019 | Mar 31, 2019 | |||||||||||||||
ALLOWANCE FOR LOAN LOSSES: | ||||||||||||||||||||
Balance, beginning of period | $ | 16,395 | $ | 16,002 | $ | 15,965 | $ | 15,684 | $ | 15,488 | ||||||||||
Provision for loan losses charged to expense | 1,500 | 500 | 750 | 350 | 500 | |||||||||||||||
17,895 | 16,502 | 16,715 | 16,034 | 15,988 | ||||||||||||||||
Less: Chargeoffs | ||||||||||||||||||||
SBA loans | 25 | 43 | 98 | 85 | 308 | |||||||||||||||
Commercial loans | 300 | — | 500 | — | 1 | |||||||||||||||
Residential mortgage loans | 200 | 75 | 130 | — | — | |||||||||||||||
Consumer loans | — | — | — | — | 1 | |||||||||||||||
Total chargeoffs | 525 | 118 | 728 | 85 | 310 | |||||||||||||||
Add: Recoveries | ||||||||||||||||||||
SBA loans | 5 | 7 | 12 | 2 | 1 | |||||||||||||||
Commercial loans | 1 | 4 | 3 | 4 | 5 | |||||||||||||||
Residential mortgage loans | — | — | — | — | — | |||||||||||||||
Consumer loans | — | — | — | 10 | — | |||||||||||||||
Total recoveries | 6 | 11 | 15 | 16 | 6 | |||||||||||||||
Net chargeoffs | 519 | 107 | 713 | 69 | 304 | |||||||||||||||
Balance, end of period | $ | 17,376 | $ | 16,395 | $ | 16,002 | $ | 15,965 | $ | 15,684 | ||||||||||
LOAN QUALITY INFORMATION: | ||||||||||||||||||||
Nonperforming loans: | ||||||||||||||||||||
SBA loans | $ | 1,627 | $ | 1,164 | $ | 503 | $ | 437 | $ | 814 | ||||||||||
Commercial loans | 613 | 529 | 629 | 54 | 1,046 | |||||||||||||||
Residential mortgage loans | 6,910 | 3,936 | 4,427 | 3,924 | 5,243 | |||||||||||||||
Consumer loans | 505 | 20 | 23 | — | 171 | |||||||||||||||
Total nonperforming loans (1) | 9,655 | 5,649 | 5,582 | 4,415 | 7,274 | |||||||||||||||
Other real estate owned ("OREO") | 1,523 | 1,723 | 1,723 | 921 | 273 | |||||||||||||||
Nonperforming assets | 11,178 | 7,372 | 7,305 | 5,336 | 7,547 | |||||||||||||||
Less: Amount guaranteed by SBA | 427 | 59 | 63 | 68 | 68 | |||||||||||||||
Net nonperforming assets | $ | 10,751 | $ | 7,313 | $ | 7,242 | $ | 5,268 | $ | 7,479 | ||||||||||
Loans 90 days past due & still accruing | $ | — | $ | 930 | $ | 140 | $ | — | $ | 39 | ||||||||||
Performing Troubled Debt Restructurings (TDRs) | $ | 694 | $ | 705 | $ | 718 | $ | 728 | $ | 738 | ||||||||||
Allowance for loan losses to: | ||||||||||||||||||||
Total loans at quarter end | 1.21 | % | 1.15 | % | 1.17 | % | 1.19 | % | 1.19 | % | ||||||||||
Nonperforming loans (1) | 179.97 | 290.43 | 286.67 | 361.61 | 215.62 | |||||||||||||||
Nonperforming assets | 155.45 | 222.40 | 219.06 | 299.19 | 207.82 | |||||||||||||||
Net nonperforming assets | 161.62 | 224.19 | 220.96 | 303.06 | 209.71 | |||||||||||||||
QTD net chargeoffs (recoveries) (annualized) to QTD average loans: | ||||||||||||||||||||
SBA loans | 0.16 | % | 0.29 | % | 0.72 | % | 0.70 | % | 2.49 | % | ||||||||||
Commercial loans | 0.16 | — | 0.28 | — | — | |||||||||||||||
Residential mortgage loans | 0.17 | 0.06 | 0.11 | — | — | |||||||||||||||
Consumer loans | — | — | — | (0.03 | ) | — | ||||||||||||||
Total loans | 0.15 | % | 0.03 | % | 0.21 | % | 0.02 | % | 0.09 | % | ||||||||||
Nonperforming loans to total loans | 0.67 | % | 0.40 | % | 0.41 | % | 0.33 | % | 0.55 | % | ||||||||||
Nonperforming assets to total assets | 0.64 | 0.43 | 0.44 | 0.33 | 0.47 | |||||||||||||||
UNITY BANCORP, INC.
QUARTERLY FINANCIAL DATA
March 31, 2020
(In thousands, except percentages and per share amounts) | Mar 31, 2020 | Dec 31, 2019 | Sep 30, 2019 | Jun 30, 2019 | Mar 31, 2019 | |||||||||||||||
SUMMARY OF INCOME: | ||||||||||||||||||||
Total interest income | $ | 19,585 | $ | 19,312 | $ | 19,055 | $ | 18,781 | $ | 18,500 | ||||||||||
Total interest expense | 4,341 | 4,549 | 4,651 | 4,571 | 4,284 | |||||||||||||||
Net interest income | 15,244 | 14,763 | 14,404 | 14,210 | 14,216 | |||||||||||||||
Provision for loan losses | 1,500 | 500 | 750 | 350 | 500 | |||||||||||||||
Net interest income after provision for loan losses | 13,744 | 14,263 | 13,654 | 13,860 | 13,716 | |||||||||||||||
Total noninterest income | 2,545 | 2,396 | 2,710 | 2,411 | 2,022 | |||||||||||||||
Total noninterest expense | 9,323 | 8,719 | 8,729 | 8,791 | 8,478 | |||||||||||||||
Income before provision for income taxes | 6,966 | 7,940 | 7,635 | 7,480 | 7,260 | |||||||||||||||
Provision for income taxes | 1,598 | 1,820 | 1,676 | 1,646 | 1,520 | |||||||||||||||
Net income | $ | 5,368 | $ | 6,120 | $ | 5,959 | $ | 5,834 | $ | 5,740 | ||||||||||
Net income per common share - Basic | $ | 0.49 | $ | 0.56 | $ | 0.55 | $ | 0.54 | $ | 0.53 | ||||||||||
Net income per common share - Diluted | $ | 0.49 | $ | 0.55 | $ | 0.54 | $ | 0.53 | $ | 0.52 | ||||||||||
COMMON SHARE DATA: | ||||||||||||||||||||
Market price per share | $ | 11.70 | $ | 22.57 | $ | 22.15 | $ | 22.70 | $ | 18.88 | ||||||||||
Dividends paid | $ | 0.08 | $ | 0.08 | $ | 0.08 | $ | 0.08 | $ | 0.07 | ||||||||||
Book value per common share | $ | 15.10 | $ | 14.77 | $ | 14.25 | $ | 13.76 | $ | 13.28 | ||||||||||
Weighted average common shares outstanding - Basic | 10,883 | 10,872 | 10,863 | 10,843 | 10,801 | |||||||||||||||
Weighted average common shares outstanding - Diluted | 11,037 | 11,057 | 11,036 | 11,026 | 10,955 | |||||||||||||||
Issued common shares | 10,894 | 10,881 | 10,869 | 10,856 | 10,822 | |||||||||||||||
Outstanding common shares | 10,883 | 10,881 | 10,869 | 10,856 | 10,822 | |||||||||||||||
Treasury shares | 11 | — | — | — | — | |||||||||||||||
PERFORMANCE RATIOS (Annualized): | ||||||||||||||||||||
Return on average assets | 1.32 | % | 1.53 | % | 1.53 | % | 1.54 | % | 1.55 | % | ||||||||||
Return on average equity | 13.23 | 15.41 | 15.57 | 16.01 | 16.52 | |||||||||||||||
Efficiency ratio | 51.92 | 51.29 | 51.06 | 53.20 | 52.53 | |||||||||||||||
Noninterest expense to average assets | 2.29 | 2.17 | 2.24 | 2.32 | 2.29 | |||||||||||||||
BALANCE SHEET DATA: | ||||||||||||||||||||
Total assets | 1,740,076 | 1,718,942 | 1,664,308 | 1,626,737 | 1,590,046 | |||||||||||||||
Total deposits | 1,378,618 | 1,250,114 | 1,273,362 | 1,264,353 | 1,226,586 | |||||||||||||||
Total loans | 1,439,645 | 1,425,558 | 1,368,474 | 1,344,757 | 1,312,994 | |||||||||||||||
Total securities | 58,002 | 66,564 | 63,991 | 62,122 | 62,962 | |||||||||||||||
Total shareholders' equity | 164,305 | 160,709 | 154,884 | 149,383 | 143,717 | |||||||||||||||
Allowance for loan losses | (17,376 | ) | (16,395 | ) | (16,002 | ) | (15,965 | ) | (15,684 | ) | ||||||||||
TAX EQUIVALENT YIELDS AND RATES: | ||||||||||||||||||||
Interest-earning assets | 5.04 | % | 5.07 | % | 5.16 | % | 5.24 | % | 5.28 | % | ||||||||||
Interest-bearing liabilities | 1.51 | 1.59 | 1.68 | 1.69 | 1.60 | |||||||||||||||
Net interest spread | 3.53 | 3.48 | 3.48 | 3.55 | 3.68 | |||||||||||||||
Net interest margin | 3.92 | 3.88 | 3.90 | 3.96 | 4.06 | |||||||||||||||
CREDIT QUALITY: | ||||||||||||||||||||
Nonperforming assets | 11,178 | 7,372 | 7,305 | 5,336 | 7,547 | |||||||||||||||
QTD net chargeoffs (annualized) to QTD average loans | 0.15 | % | 0.03 | % | 0.21 | % | 0.02 | % | 0.09 | % | ||||||||||
Allowance for loan losses to total loans | 1.21 | 1.15 | 1.17 | 1.19 | 1.19 | |||||||||||||||
Nonperforming assets to total loans | 0.67 | 0.40 | 0.41 | 0.33 | 0.55 | |||||||||||||||
Nonperforming assets to total assets | 0.64 | 0.43 | 0.44 | 0.33 | 0.47 | |||||||||||||||
(In thousands, except percentages and per share amounts) | Mar 31, 2020 | Dec 31, 2019 | Sep 30, 2019 | Jun 30, 2019 | Mar 31, 2019 | |||||||||||||||
CAPITAL RATIOS AND OTHER: | ||||||||||||||||||||
Total equity to total assets | 9.44 | % | 9.35 | % | 9.31 | % | 9.18 | % | 9.04 | % | ||||||||||
Leverage ratio | 10.56 | 10.59 | 10.54 | 10.36 | 10.09 | |||||||||||||||
Common equity tier 1 risk-based capital ratio | 11.71 | 11.59 | 12.24 | 11.99 | 11.78 | |||||||||||||||
Tier 1 risk-based capital ratio | 12.43 | 12.32 | 13.04 | 12.81 | 12.62 | |||||||||||||||
Total risk-based capital ratio | 13.19 | 13.06 | 14.28 | 14.06 | 13.87 | |||||||||||||||
Number of banking offices | 19 | 19 | 19 | 19 | 19 | |||||||||||||||
Number of ATMs | 20 | 20 | 20 | 20 | 20 | |||||||||||||||
Number of employees | 205 | 203 | 194 | 185 | 190 | |||||||||||||||