Attached files
| file | filename |
|---|---|
| 8-K - 8-K - 04162020 - Sixth Street Specialty Lending, Inc. | tslx-8k_20200331.htm |
Exhibit 99.1

TPG Specialty Lending, Inc. Provides a Business Update and Preliminary Q1 2020 Financial Results
NEW YORK—(BUSINESS WIRE)—April 16, 2020— TPG Specialty Lending, Inc. (NYSE: TSLX, or the “Company”) today sent the following letter to its stakeholders to provide a business update and preliminary Q1 2020 financial results.
April 16, 2020
Dear Stakeholder,
As uncertainty persists given the COVID-19 pandemic, we remain committed to continuing our ongoing dialogue with all stakeholders of TSLX. In that spirit, please find the following updates: (1) quarter ended March 31, 2020 preliminary financial results; (2) portfolio update; (3) details regarding our portfolio valuation process (that has been unchanged since the formation of TSLX in 2010); (4) preliminary net asset value bridge; (5) our liquidity, funding and capital profile; (6) our Business Continuity efforts, and (7) concluding thoughts including our views on the go-forward investment opportunity set. We believe this update reaffirms the strength of our capital, our strong liquidity profile, and our rigorous approach to risk management. We believe these attributes, in combination with the human capital and culture across the Sixth Street platform, will provide the basis to create value for our stakeholders when the appropriate risk-adjusted opportunity set presents itself.
Summary Preliminary Financial Results for Quarter Ended March 31, 2020
This information is preliminary, based upon information available as of today and is subject to change and finalization as a result of the completion of our financial closing procedures, final adjustments and other developments:
|
|
• |
Net asset value per share at March 31, 2020 was approximately $15.57 per share compared to $16.77 at December 31, 2019 (which includes the impact of the $0.06 per share Q4 2019 supplemental dividend that was paid in Q1), representing a decline of 7.1% over the period |
|
|
• |
Estimated net investment income per share was approximately $0.51 |
|
|
• |
Estimated net loss per share was approximately $0.80, primarily driven by unrealized losses related to the impact of spread widening on the valuation of our portfolio |
|
|
• |
Debt-to-equity at quarter-end was approximately 0.95x, and well below the regulatory threshold of 2.0x |
|
|
• |
Our debt funding mix at quarter end was comprised of approximately 68% unsecured / 32% secured debt, and we had $1.0 billion of undrawn capacity under our revolving credit facility |
|
|
• |
All of our portfolio companies made their scheduled interest payments for the quarter ended March 31, 2020. We had one portfolio company on non-accrual status, Mississippi Resources (“MSR”), representing approximately 0.1% of our portfolio at fair value at quarter end (for the avoidance of doubt, MSR made its regularly scheduled cash interest payment during the quarter, which we have elected to apply to our loan principal instead of recognizing it as income). |
As readers of our previous letters and long-term stakeholders will recognize, we have long operated with a late-cycle mindset and an active risk management framework to mitigate existing and emerging risks across our portfolio. Our portfolio continues to be defensively positioned with approximately 97% of the portfolio on a fair value basis comprised of first lien loans at quarter end. We continue to have limited cyclical exposure of approximately 2.8% of the portfolio on a fair value basis. Note that we classify the cyclicality of our portfolio companies by end-market, and that this excludes our asset-based loans in retail and reserve- and asset-based loans in energy.
Our energy exposure at quarter end was estimated to be 3.9% of the portfolio by fair value. Approximately 75% of this exposure is comprised of our reserve-based loan in Verdad Resources and our asset-based loan in Energy Alloys. We continue to believe that we have strong downside protection on these positions given the significantly hedged production volume through 2023 and hedged collateral value for Verdad Resources and the structural protections of our asset-based loan in Energy Alloy.
Quarter over quarter, we have reduced our retail ABL exposure from 13.8% to 9.1% of the portfolio at fair value. This was due to the full repayment of our $75.8 million loan in Sears at a blended price of 101.3 and a partial $43.5 million repayment of our DIP term loan in Forever 21. We expect repayment on our remaining $6.2 million principal amount outstanding in Forever 21 prior to its maturity in July. Our retail ABL exposure at quarter end comprised of six portfolio companies, half of which, as represented by our investments in 99 Cents, Moran Foods (Save-a-Lot) and Staples, are generally deemed “essential” businesses given their focus on providing groceries, household items such as cleaning and home office supplies and are therefore, performing well in this environment.
Valuation of Portfolio Investments
In our last letter, we provided a detailed framework of our valuation approach, which we believe is the bedrock for effective risk management in our business. In arriving at this quarter’s portfolio marks, we incorporated “market spreads” into the quarterly valuation of our investments, adjusting for the existence of LIBOR floors, expected weighted average life, and other idiosyncratic factors specific to each investment (including issuer-specific credit marks related to idiosyncratic issues, such as outperformance / underperformance). This resulted in a decline in portfolio marks from 98.4% as of December 31, 2019 to an estimated 94.1% as of March 31, 2020. It should be noted, that approximately 8.0% of our portfolio had a remaining weighted average life of only days, rather than months, given contractual maturity and/or our visibility on expected payoffs shortly post quarter-end, and therefore, widening credit spreads during the quarter had little impact on the valuation of these assets. Note that each of these shorter duration assets were repaid subsequent to March 31st.
During Q1, the impact of COVID-19 drove a significant increase in risk premiums across asset classes. LCD first lien spreads widened by 388 basis points and LCD second lien spreads widened by 685 basis points. This would suggest a quarter-over-quarter decline of nearly 40% in net asset value for leveraged loan-oriented BDCs, assuming a predominantly first lien portfolio with no LIBOR floor, a 5-year average remaining maturity, and financial leverage of approximately 1.0x. The decline in valuation marks for our portfolio this quarter was mitigated by the following factors:
|
|
• |
Market spreads: We incorporate sector adjustments into the market spread impact for each of our investments. Approximately 70% of our portfolio as of March 31, 2020 were software/software |
2
|
|
related, a sector that experienced less credit spread widening during Q1 compared to the broader loan market.1 |
|
|
• |
Shorter Weighted Average Life portfolio: Compared to the weighted average remaining contractual life of 4.9 years for the broadly syndicated market (according to LCD), our portfolio’s weighted average remaining contractual life was approximately 3.2 years (~35% shorter weighted average contractual life). At March 31, 2020, the weighted average effective life used in the valuation of our portfolio was even shorter at 1.2 years given the financial covenants, voting control positions and indebtedness/restricted payment limitations that we underwrite into our loan agreements (which have the effect of shortening the effective life of our investments). This was also driven by several idiosyncratic events specific to our borrowers that shortened our view of the effective life of those investments. |
|
|
• |
Existence of LIBOR floors: The average LIBOR floor across our debt investment was approximately 1.2% as of March 31, 2020, compared to approximately 35 basis points for the broadly syndicated market (according to LCD). As such, our portfolio did not experience the same magnitude of the market spread adjustment as would a leveraged loan-oriented portfolio, since these floors allow us to mitigate (to a degree) the impact of spread widening on the valuation of our investments. |
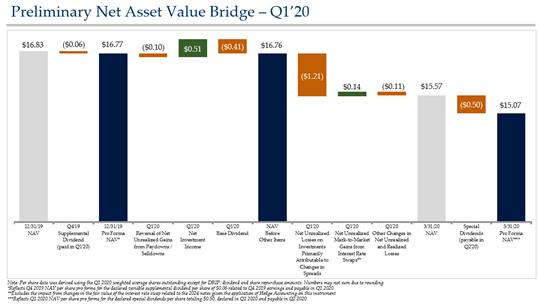
Preliminary NAV Bridge
Based on the preliminary results described above, our net asset value per share declined by approximately 7.1% in Q1 from $16.77 (which includes the impact of the Q4 supplemental dividend) to an estimated $15.57. The following chart depicts the preliminary NAV bridge, which illustrates that the most prominent driver of this quarter’s NAV decline was $1.21 per share of unrealized losses from the impact of credit spread widening on the valuation of our portfolio. All things being equal, absent permanent credit losses related to these unrealized losses attributed to spread widening, you would expect to see a reversal of these unrealized losses over time (effectively pushing earnings into future periods). Other factors that impacted NAV this quarter were: i) a contribution of $0.51 per share from net investment income against a Q1 base dividend of $0.41 per share, ii) a reduction of $0.10 per share as we reversed net unrealized gains on the balance sheet related to investment realizations (and recognized the gains into income), iii) a positive $0.14 per share impact from net unrealized mark-to-market gains on the interest rate swaps on our fixed rate securities due to movements in the forward LIBOR curve during the quarter, and iv) a negative $0.11 impact from “Other Changes” in net realized and unrealized gains, the majority of which was related to our investment in Mississippi Resources.
|
|
1 |
Source: LCD LII Discounted Spreads, as of March 31, 2020 |
3
Liquidity, Funding Profile and Capital
Although slightly nuanced, or perhaps obvious to some, there is a significant difference between liquidity and capital. Let us first tackle liquidity. We think about liquidity as the sum of (1) cash and (2) freely accessible committed credit that together are available to fund operations (operating costs and debt service) and make investments (investments in our existing portfolio, contractual or otherwise, new portfolio investments, and investments into our own capital structure). Unlike typical corporate issuers, BDCs have little “cash flow from operations” to provide liquidity given RIC distribution requirements. As we have flagged for investors over the years (please click here to access), the easiest way to think about this is the delta between “Interest Coverage” of our rated peers (3.4x peer average vs. 3.8x for TSLX) and the “Fixed Charge Coverage” (1.1x peer average vs. 1.3x for TSLX).2 As of March 31, 2020, we had $1.0 billion of undrawn capacity on our revolving credit facility against only approximately $66 million of unfunded commitments available to be drawn based on contractual requirements in the underlying loan agreements. At quarter end, we had meaningful cushions on all applicable financial covenant thresholds under our revolving credit facility, and as a result, expect to continue to be able to access our full revolver capacity.
The following table summarizes our liquidity at March 31, 2020 (estimated) compared to December 31, 2019, including changes to unfunded commitments as described below.
|
|
2 |
Source: SNL Financial and company filings, data as of quarter ended 12/31/2019. Interest coverage defined as (LTM net investment income + LTM interest expense) / LTM interest expense. Fixed charge coverage defined as (LTM net investment income + LTM interest expense) / (LTM interest expense + LTM regular dividends paid); excludes special dividends paid. Peers consist of investment-grade rated BDCs. |
4

As discussed earlier in the valuation section, given the post-quarter repayments of approximately $160 million, our liquidity today has increased to approximately $1.1 billion.
In addition to thinking about our liquidity in terms of funding our normal course operations and making investments, we think about it the context of our funding profile (i.e., the ability to make required principal debt service repayments). We have historically modeled this so-called vector to withstand extreme stress (i.e. we assume all of our contractual unfunded commitments gets drawn, limited access to new funding, etc.). This perspective has informed our policy of extending the maturity our 5-year revolving credit facility every 12-15 months and to fund ourselves in the unsecured market (vs. other markets such as collateralized loan obligations where you may lose access to the net interest spread in your portfolio in a highly stressed or correlated environment). We continue to have ample and flexible funding sources with no near-term maturities. As shared in our prior letter, our earliest maturity is relatively small at $172.5 million and is over 2.25 years away in August 2022. As of March 31, 2020, the estimated weighted average remaining life of investments funded with debt was approximately 2.3 years, compared to a weighted average remaining maturity on our debt of approximately 4.4 years.
5


Let us now turn our focus to capital (which is quite different from liquidity). In terms of our business, we think about capital as the required amount to support our capital structure (i.e. financial leverage), liquidity needs (modeled for stressed and highly correlated environments), and most importantly, to absorb investment losses. Not all BDCs require the same amount of capital. Required capital is a function of investment profile (i.e. where you sit in the capital structure, the quality of the underlying business you are financing), expected losses (default rates coupled with loss severity given defaults), unfunded commitments, historical capital allocation practices (where you set your distribution compared to your core earnings), required excess liquidity, and other factors. We believe we have substantial capital in this environment given the above factors. On a preliminary basis, our debt-to-equity at March 31, 2020 was approximately 0.95x, compared to 1.00x at December 31, 2019. This slight decrease reflects net repayment activity in our portfolio during the first quarter, which was partially offset by the impact of valuation marks on our investments since December 31, 2019. We are currently operating at the bottom of our target leverage range of 0.9x to 1.25x, which coupled with our liquidity profile, has preserved our reinvestment option to create attractive risk-adjusted returns for our stakeholders at the appropriate time.
6
Given our liquidity and capital profile, we wanted to emphasize that we are not making any changes to the dividend policy that we have previously articulated, nor are we making any changes to our previously declared dividends. Our dividend framework provides a quarterly base dividend of $0.41 per share and is supplemented (when applicable) by additional dividends determined by the level of overearnings on a net investment income basis relative to the base dividend level. Our framework takes into account the importance of preserving capital flexibility in periods of volatility, and given the level of unrealized losses experienced during the quarter, the NAV limiter element of our existing dividend policy will result in no supplemental dividend being declared in relation to net investment income generated over the period. Our Board has previously declared a special dividend totaling $0.50 per share, and payable in two installments during Q2; both these special dividend payments will proceed as previously announced. Based on the preliminary results above, inclusive of the impact of the $0.50 aggregate special dividends that were previously declared and payable in Q2, pro forma NAV per share for March 31, 2020 was approximately $15.07.
Business Continuity Update
One of our top priorities in this environment is to protect our people, which in turn allows us to best protect our assets and serve our shareholders/clients. Since we implemented our business continuity plan in early March, the Sixth Street Partners platform has been operating at full capacity with nearly all of our global team members working remotely. As you can see, things are running smoothly as we are able to provide real time updates regarding our financial condition. As an organization, at Sixth Street we believe we have quickly adapted and evolved to become even better communicators and collaborators in our goal to deliver the best outcomes for our stakeholders.
Concluding Thoughts
While our quarter-end closing procedures are not yet complete and remain subject to ordinary course approvals by our Board, we wanted to provide these preliminary estimates as part of our effort to maintain ongoing communications and transparency with our stakeholders. At this point, the many “unknowns” surrounding COVID-19 continue to prevail, including the duration of the economic shutdown and the full impact on the real economy.
Post quarter end, the broader credit markets have rallied on the heels of unprecedent fiscal and monetary stimulus response from the central bank. Since March 31st, LCD 1st lien and 2nd lien spreads have tightened approximately 92 and 50 basis points, respectively. Assuming this trend were to continue and holding all else equal, we would expect to see reversals of Q1 unrealized losses related to market spread widening in future periods. As discussed above, we currently have no intentions to make any changes to our previously announced special dividends, our base dividend level and our overall distribution framework.
Over the past three years, on an annual basis we have been granted approval by our shareholders to issue shares below NAV (subject to board approval at the time of issuance). As disciplined capital allocators, this is a responsibility that we take seriously. Based on the details shared throughout this letter, we have no anticipated need for additional liquidity or capital, and accordingly, we have no plans to issue equity under this authority and dilute our existing shareholders. We believe our risk management framework, both on the left and right-hand side of the balance sheet, has served our stakeholders well to-date.
7
As we look ahead, we believe there will be a significant need for us to be a liquidity and capital provider to companies and management teams. As we continue to observe the rally in the markets, we believe the amount of capital destruction, given the economic decimation related to this pandemic, is being underestimated by market participants. Ultimately, we believe this will provide an opportunity to generate significantly high risk adjusted returns for those who are patient and have the capital to deploy at the appropriate time. We look forward to speaking to you on our earnings call in May. In the meantime, we hope you and your loved ones are safe and healthy.
Sincerely,

Joshua Easterly
Chief Executive Officer and Chairman of the Board
Partner, Sixth Street Partners

8
About TPG Specialty Lending
TSLX is a specialty finance company focused on lending to middle-market companies. The Company seeks to generate current income primarily in U.S.-domiciled middle-market companies through direct originations of senior secured loans and, to a lesser extent, originations of mezzanine loans and investments in corporate bonds and equity securities. The Company has elected to be regulated as a business development company, or a BDC, under the Investment Company Act of 1940 and the rules and regulations promulgated thereunder. TSLX is externally managed by TSL Advisers, LLC, an affiliate of Sixth Street Partners and a Securities and Exchange Commission (“SEC”) registered investment adviser. TSLX leverages the deep investment, sector, and operating resources of Sixth Street Partners, a global finance and investment firm with over $34 billion of assets under management as of December 31, 2019. For more information, visit the Company’s website at www.tpgspecialtylending.com.
About Sixth Street Partners
Sixth Street Partners is a global multi-asset class investment business with over $34 billion in assets under management as of December 31, 2019. Sixth Street operates eight diversified, collaborative investment platforms across our growth investing, direct lending, par liquid credit, fundamental public strategies, infrastructure, agriculture, special situations and adjacencies businesses. Our long-term oriented, highly flexible capital base and “One Team” cultural philosophy allows us to invest thematically across sectors, geographies and asset classes. Founded in 2009, Sixth Street has more than 275 team members including over 140 investment professionals operating from nine locations around the world. For more information, visit www.tssp.com.
Forward-Looking Statements
Statements included herein may constitute “forward-looking statements,” which relate to future events or the Company’s future performance or financial condition, including the Company’s future operating results and liquidity position, the impact of COVID-19 and related changes in base interest rates and market volatility on the Company’s business, the Company’s portfolio companies, the Company’s industry and the global economy. These statements are not guarantees of future performance, conditions or results and involve a number of risks and uncertainties. Actual results may differ materially from those in the forward-looking statements as a result of a number of factors, including those described from time to time in the Company’s filings with the Securities and Exchange Commission. The Company assumes no obligation to update any such forward-looking statements.
The Company’s closing procedures for the three months ended March 31, 2020 are not yet complete and, as a result, these preliminary estimates of the financial information above reflect the Company’s preliminary estimate with respect to such results based on information currently available to management, and may vary from the Company’s actual financial results as of and for the quarter ended March 31, 2020. For example, estimated net asset value per share is based on the value of the Company's total assets, including the Company's investments (some of which are not publicly traded or whose market prices are not readily available, the fair value of which is determined by the Company's board of directors in good faith). The fair value of the Company's investments have not yet been determined by the Company's board of directors or reviewed by its audit committee and the actual fair value of such investments, when determined by the Company's board of directors, may be materially different than the estimates reported herein. Further, these estimates are not a comprehensive statement of the Company’s financial results as of and for the quarter ended March 31, 2020. Accordingly, you should not place undue reliance on this preliminary information.
9
These estimates, which are the responsibility of the Company’s management, were prepared by the Company’s management in connection with the preparation of its financial statements and are based upon a number of assumptions. Additional items that may require adjustments to the preliminary operating results may be identified as a result of the completion of our financial closing procedures, final adjustments and other developments arising between now and the time that our financial results, for the three months ended March 31, 2020 are released, and could result in material changes to the Company’s estimated preliminary operating results. Estimates of operating results are inherently uncertain and we undertake no obligation to update this information. See “Special Note Regarding Forward-Looking Statements,” “Risk Factors” and “Management’s Discussion and Analysis of Financial Condition and Results of Operations” included or incorporated by reference herein for factors that could impact the Company’s actual results of operations. KPMG LLP has not audited, reviewed, compiled or performed any procedures with respect to this preliminary financial information. Accordingly, KPMG LLP does not express an opinion or provide any form of assurance with respect thereto.
Investors:
Lucy Lu, 212–601-4753
Sixth Street Partners
IRTSL@tssp.com
Media:
Patrick Clifford, 617-793-2004
Sixth Street Partners
PClifford@tssp.com
10