Attached files
| file | filename |
|---|---|
| EX-99.1 - EX-99.1 - Sixth Street Specialty Lending, Inc. | tslx-ex991_401.htm |
| EX-32 - EX-32 - Sixth Street Specialty Lending, Inc. | tslx-ex32_8.htm |
| EX-31.2 - EX-31.2 - Sixth Street Specialty Lending, Inc. | tslx-ex312_10.htm |
| EX-31.1 - EX-31.1 - Sixth Street Specialty Lending, Inc. | tslx-ex311_7.htm |
| EX-23.1 - EX-23.1 - Sixth Street Specialty Lending, Inc. | tslx-ex231_400.htm |
| EX-21.1 - EX-21.1 - Sixth Street Specialty Lending, Inc. | tslx-ex211_6.htm |
| EX-10.17 - EX-10.17 - Sixth Street Specialty Lending, Inc. | tslx-ex1017_198.htm |
| EX-4.10 - EX-4.10 - Sixth Street Specialty Lending, Inc. | tslx-ex410_199.htm |
UNITED STATES
SECURITIES AND EXCHANGE COMMISSION
Washington, D.C. 20549
FORM 10-K
|
☒ |
ANNUAL REPORT PURSUANT TO SECTION 13 OR 15(d) OF THE SECURITIES EXCHANGE ACT OF 1934 |
For the fiscal year ended December 31, 2019
or
|
☐ |
TRANSITION REPORT PURSUANT TO SECTION 13 OR 15(d) OF THE SECURITIES EXCHANGE ACT OF 1934 |
Commission file number 001-36364
TPG Specialty Lending, Inc.
(Exact Name of Registrant as Specified in Its Charter)
|
Delaware |
27-3380000 |
|
(State or other jurisdiction of incorporation or organization) |
(I.R.S. Employer Identification No.) |
|
|
|
|
2100 McKinney Avenue, Suite 1500, Dallas, TX |
75201 |
|
(Address of principal executive offices) |
(Zip Code) |
Registrant’s Telephone Number, Including Area Code: (469) 621-3001
Securities registered pursuant to Section 12(b) of the Act:
|
Title of each class |
Trading Symbol(s) |
Name of each exchange on which registered |
|
Common Stock, par value $0.01 per share |
TSLX |
The New York Stock Exchange |
Securities registered pursuant to Section 12(g) of the Act:
None
(Title of class)
Indicate by check mark if the registrant is a well-known seasoned issuer, as defined in Rule 405 of the Securities Act. YES ☒ NO ☐
Indicate by check mark if the registrant is not required to file reports pursuant to Section 13 or Section 15(d) of the Act. YES ☐ NO ☒
Indicate by check mark whether the registrant (1) has filed all reports required to be filed by Section 13 or 15(d) of the Securities Exchange Act of 1934 during the preceding 12 months (or for such shorter period that the registrant was required to file such reports), and (2) has been subject to such filing requirements for the past 90 days. YES ☒ NO ☐
Indicate by check mark whether the registrant has submitted electronically every Interactive Data File required to be submitted pursuant to Rule 405 of Regulation S-T (§232.405 of this chapter) during the preceding 12 months (or for such shorter period that the registrant was required to submit such files). YES ☐ NO ☐
Indicate by check mark whether the registrant is a large accelerated filer, an accelerated filer, a non-accelerated filer, a smaller reporting company, or an emerging growth company. See the definitions of “large accelerated filer,” “accelerated filer,” “smaller reporting company,” and “emerging growth company” in Rule 12b-2 of the Exchange Act.
|
Large accelerated filer |
☒ |
Accelerated filer |
☐ |
|
|
|
|
|
|
Non-Accelerated filer |
☐ |
Smaller reporting company |
☐ |
|
|
|
Emerging growth company |
☐ |
If an emerging growth company, indicate by check mark if the registrant has elected not to use the extended transition period for complying with any new or revised financial accounting standards provided pursuant to Section 13(a) of the Exchange Act. ☐
Indicate by check mark whether the registrant is a shell company (as defined in Rule 12b-2 of the Act). YES ☐ NO ☒
The aggregate market value of the voting stock held by non-affiliates of the registrant on June 30, 2019, based on the closing price on that date of $19.60 on The New York Stock Exchange, was approximately $1,237,412,949. The number of shares of the registrant’s common stock, $.01 par value per share, outstanding at February 19, 2020 was 66,719,061.
DOCUMENTS INCORPORATED BY REFERENCE
Portions of the Registrant’s proxy statement for the 2020 annual meeting of stockholders are incorporated by reference in Part III.
Index to Annual Report on Form 10-K for
Year Ended December 31, 2019
|
|
|
|
PAGE |
|
|
|
|
|
|
ITEM 1. |
|
4 |
|
|
ITEM 1A. |
|
28 |
|
|
ITEM 1B. |
|
52 |
|
|
ITEM 2. |
|
52 |
|
|
ITEM 3. |
|
52 |
|
|
ITEM 4. |
|
52 |
|
|
|
|
|
|
|
|
|
|
|
|
ITEM 5. |
|
53 |
|
|
ITEM 6. |
|
54 |
|
|
ITEM 7. |
|
Management’s Discussion and Analysis of Financial Condition and Results of Operations |
56 |
|
ITEM 7A. |
|
80 |
|
|
ITEM 8. |
|
F-1 |
|
|
ITEM 9. |
|
Changes in and Disagreements with Accountants on Accounting and Financial Disclosure |
81 |
|
ITEM 9A. |
|
81 |
|
|
ITEM 9B. |
|
81 |
|
|
|
|
|
|
|
|
|
|
|
|
ITEM 10. |
|
82 |
|
|
ITEM 11. |
|
82 |
|
|
ITEM 12. |
|
Security Ownership of Certain Beneficial Owners and Management and Related Stockholder Matters |
82 |
|
ITEM 13. |
|
Certain Relationships and Related Transactions, and Director Independence |
82 |
|
ITEM 14. |
|
82 |
|
|
|
|
|
|
|
|
|
|
|
|
ITEM 15. |
|
83 |
|
|
ITEM 16. |
|
85 |
2
CAUTIONARY STATEMENT REGARDING FORWARD-LOOKING STATEMENTS
This report contains forward-looking statements that involve substantial risks and uncertainties. These forward-looking statements are not historical facts, but rather are based on current expectations, estimates and projections about us, our current and prospective portfolio investments, our industry, our beliefs, and our assumptions. Words such as “anticipates,” “expects,” “intends,” “plans,” “believes,” “seeks,” “estimates,” “would,” “should,” “targets,” “projects,” and variations of these words and similar expressions are intended to identify forward-looking statements. These statements are not guarantees of future performance and are subject to risks, uncertainties, and other factors, some of which are beyond our control and difficult to predict, that could cause actual results to differ materially from those expressed or forecasted in the forward-looking statements.
In addition to factors previously identified elsewhere in the reports and other documents TPG Specialty Lending, Inc. has filed with the Securities and Exchange Commission, or SEC, the following factors, among others, could cause actual results to differ materially from forward-looking statements or historical performance:
|
|
• |
an economic downturn could impair our portfolio companies’ abilities to continue to operate, which could lead to the loss of some or all of our investments in those portfolio companies; |
|
|
• |
such an economic downturn could disproportionately impact the companies in which we have invested and others that we intend to target for investment, potentially causing us to experience a decrease in investment opportunities and diminished demand for capital from these companies; |
|
|
• |
such an economic downturn could also impact availability and pricing of our financing; |
|
|
• |
an inability to access the capital markets could impair our ability to raise capital and our investment activities; and |
|
|
• |
the risks, uncertainties and other factors we identify in the section entitled “Risk Factors” in this report and elsewhere in our filings with the SEC. |
Although we believe that the assumptions on which these forward-looking statements are based are reasonable, some of those assumptions are based on the work of third parties and any of those assumptions could prove to be inaccurate; as a result, forward-looking statements based on those assumptions also could prove to be inaccurate. In light of these and other uncertainties, the inclusion of a projection or forward-looking statement in this report should not be regarded as a representation by us that our plans and objectives will be achieved. You should not place undue reliance on these forward-looking statements, which apply only as of the date of this report. We do not undertake any obligation to update or revise any forward-looking statements or any other information contained herein, except as required by applicable law. The safe harbor provisions of Section 21E of the Securities Exchange Act of 1934, as amended, or the Exchange Act, which preclude civil liability for certain forward-looking statements, do not apply to the forward-looking statements in this report because we are an investment company.
3
In this Annual Report, except where the context suggests otherwise, the terms “TSL,” “TSLX,” “we,” “us,” “our,” and “the Company” refer to TPG Specialty Lending, Inc. The term “Adviser” refers to TSL Advisers, LLC, a Delaware limited liability company. The term “TSSP” refers to TPG Sixth Street Partners. The term “TPG” refers to TPG Global, LLC and its affiliates.
General
Our Company
We are a specialty finance company focused on lending to middle-market companies. Since we began our investment activities in July 2011, through December 31, 2019, we have originated more than $12.5 billion aggregate principal amount of investments and retained approximately $6.3 billion aggregate principal amount of these investments on our balance sheet prior to any subsequent exits and repayments. We seek to generate current income primarily in U.S.-domiciled middle-market companies through direct originations of senior secured loans and, to a lesser extent, originations of mezzanine and unsecured loans and investments in corporate bonds and equity securities. By “middle-market companies,” we mean companies that have annual earnings before interest, income taxes, depreciation and amortization, or EBITDA, which we believe is a useful proxy for cash flow, of $10 million to $250 million, although we may invest in larger or smaller companies on occasion. As of December 31, 2019, our core portfolio companies, which exclude certain investments that fall outside of our typical borrower profile and represent 77.2% of our total investments based on fair value, had weighted average annual revenue of $113.9 million and weighted average annual EBITDA of $34.5 million.
We generate revenues primarily in the form of interest income from the investments we hold. In addition, we may generate income from dividends on equity investments, capital gains on the sale of investments and various loan origination and other fees.
We have operated as a business development company, or a BDC, since we began our investment activities in July 2011. In conducting our investment activities, we believe that we benefit from the significant scale and resources of our Adviser and its affiliates.
The companies in which we invest use our capital to support organic growth, acquisitions, market or product expansion and recapitalizations (including restructurings). We invest in first-lien debt, second-lien debt, mezzanine and unsecured debt and equity and other investments. Our first-lien debt may include stand-alone first-lien loans; “last out” first-lien loans, which are loans that have a secondary priority behind super-senior “first out” first-lien loans; “unitranche” loans, which are loans that combine features of first-lien, second-lien and mezzanine debt, generally in a first-lien position; and secured corporate bonds with similar features to these categories of first-lien loans. Our second-lien debt may include secured loans, and, to a lesser extent, secured corporate bonds, with a secondary priority behind first-lien debt. As of December 31, 2019, based on fair value our portfolio consisted of 96.5% first-lien debt investments, 0.6% second-lien debt investments, 0.1% mezzanine investments, and 2.8% equity and other investments. As of December 31, 2019, 99.2% of our debt investments based on fair value bore interest at floating rates (when including investment specific hedges), with 93.5% of these subject to interest rate floors, which we believe helps act as a portfolio-wide hedge against inflation. As of December 31, 2019 we had investments in 63 portfolio companies, with an average investment size of approximately $35.7 million based on fair value. As of December 31, 2019, the largest single investment based on fair value represented 4.0% of our total investment portfolio.
As of December 31, 2019, our portfolio was invested across 19 different industries. The largest industries in our portfolio as of December 31, 2019 were business services, retail and consumer products, and financial services (primarily payment processing and financing technology companies), which represented, as a percentage of our portfolio, 16.8%, 14.9%, and 13.7% respectively, based on fair value.
We are an externally managed, closed-end, non-diversified management investment company that has elected to be regulated as a BDC under the Investment Company Act of 1940, as amended, or the 1940 Act. In addition, for U.S. federal income tax purposes, we have elected to be treated as a regulated investment company, or RIC, under Subchapter M of the Internal Revenue Code of 1986, as amended, which we refer to as the Code. As a consequence of our BDC and RIC elections, our portfolio is and will continue to be subject to diversification and other requirements to maintain such status elections.
We borrow money from time to time within the levels permitted by the 1940 Act to fund investments and for general corporate purposes. Under the 1940 Act, we can incur borrowings, issue debt securities or issue preferred stock if immediately after the borrowing or issuance our ratio of total assets (less total liabilities other than indebtedness) to total indebtedness plus preferred stock is at least 150%. In determining whether to borrow money, we analyze the maturity, covenant package and rate structure of the proposed borrowings, as well as the risks of those borrowings compared to our investment outlook. The use of borrowed funds or the proceeds
4
of preferred stock offerings to make investments has its own specific set of benefits and risks, and all of the costs of borrowing funds or issuing preferred stock are borne by us, and ultimately the holders of our common stock. See “ITEM 1A. Risk Factors—Risks Related to Our Business and Structure—We borrow money, which magnifies the potential for gain or loss and increases the risk of investing in us.” See also “Regulation as a Business Development Company—Senior Securities.”
Our operations comprise only a single reportable segment.
Relationship with our Adviser, and TSSP
Our Adviser is a Delaware limited liability company. Our Adviser acts as our investment adviser and administrator, and is a registered investment adviser with the SEC under the Investment Advisers Act of 1940, as amended, or the Advisers Act. Our Adviser sources and manages our portfolio through a dedicated team of investment professionals predominately focused on us, which we refer to as our Investment Team. Our Investment Team is led by our Chairman and Chief Executive Officer and our Adviser’s Co-Chief Investment Officer Joshua Easterly and our Adviser’s Co-Chief Investment Officer Alan Waxman, both of whom have substantial experience in credit origination, underwriting and asset management. Our investment decisions are made by our Investment Review Committee, which includes senior personnel of our Adviser and TPG Sixth Street Partners, or “TSSP”.
TPG Sixth Street Partners (TSSP) is a global finance and investment business with approximately $33 billion of assets under management as of September 30, 2019. TSSP’s core platforms include TPG Specialty Lending, TSL Europe (TSLE), which is aimed at European middle-market loan originations, TSSP Adjacent Opportunities (TAO), which has the flexibility to invest across all of TSSP’s private credit market investments, TSSP Opportunities Partners (TOP), which focuses on actively managed opportunistic investments across the credit cycle, TPG Institutional Credit Partners (TICP), which is the firm’s “public-side” credit investment platform focused on investment opportunities in broadly syndicated leveraged loan markets, and TSSP Capital Solutions (TCS), which provides financing solutions to growing companies. TSSP has a long-term oriented, highly flexible capital base that allows it to invest across industries, geographies, capital structures and asset classes. TSSP has extensive experience with highly complex, global public and private investments executed through primary originations, secondary market purchases and restructurings, and has a team of over 250 investment and operating professionals. As of December 31, 2019, thirty four (34) of these personnel are dedicated to our business, including twenty six (26) investment professionals.
TSSP was established in 2009 as a strategic partnership with TPG, a global alternative asset management company.
Our Adviser consults with TSSP in connection with a substantial number of our investments. The TSSP platform provides us with the breadth of large and scalable investment resources. We believe we benefit from TSSP’s market expertise, insights into industry, sector and macroeconomic trends and intensive due diligence capabilities, which help us discern market conditions that vary across industries and credit cycles, identify favorable investment opportunities and manage our portfolio of investments. TSSP and its affiliates will refer all middle-market loan origination activities for companies domiciled in the United States to us and conduct those activities through us. The Adviser will determine whether it would be permissible, advisable or otherwise appropriate for us to pursue a particular investment opportunity allocated to us.
On December 16, 2014, we were granted an exemptive order from the SEC that allows us to co-invest, subject to certain conditions and to the extent the size of an investment opportunity exceeds the amount our Adviser has independently determined is appropriate to invest, with certain of our affiliates (including affiliates of TSSP) in middle-market loan origination activities for companies domiciled in the United States and certain “follow-on” investments in companies in which we have already co-invested pursuant to the order and remain invested. On January 16, 2020, we filed a further application for co-investment exemptive relief with the SEC to better align our existing co-investment relief with more recent SEC exemptive orders. There can be no assurance when or if the SEC will grant a further order in response to our application. Until such time a new order is granted, we will continue to operate under the terms of our current exemptive order.
We believe our ability to co-invest with TSSP affiliates is particularly useful where we identify larger capital commitments than otherwise would be appropriate for us. We expect that with the ability to co-invest with TSSP affiliates we will continue to be able to provide “one-stop” financing to a potential portfolio company in these circumstances, which may allow us to capture opportunities where we alone could not commit the full amount of required capital or would have to spend additional time to locate unaffiliated co-investors. See “Regulation as a Business Development Company—Transactions with our affiliates.”
The Adviser is responsible for managing our day-to-day business affairs, including implementing investment policies and strategic initiatives set by our Investment Team and managing our portfolio under the general oversight of our Investment Review Committee.
5
On April 15, 2011, we entered into the Investment Advisory Agreement with our Adviser. The Investment Advisory Agreement was subsequently amended on December 12, 2011. Under the Investment Advisory Agreement, the Adviser provides investment advisory services to us.
The Adviser’s services under the Investment Advisory Agreement are not exclusive, and the Adviser is free to furnish similar or other services to others so long as its services to us are not impaired. Under the terms of the Investment Advisory Agreement, we pay the Adviser the Management Fee and the Incentive Fee. For a discussion of the Management Fee and Incentive Fee payable by us to the Adviser, see “Management Agreements—Investment Advisory Agreement; Administration Agreement; License Agreement.” Our Board monitors the mix and performance of our investments over time and seeks to satisfy itself that the Adviser is acting in our interests and that our fee structure appropriately incentivizes the Adviser to do so.
In November 2019, our Board renewed the Investment Advisory Agreement. Unless earlier terminated, the Investment Advisory Agreement will remain in effect until November 2020, and may be extended subject to required approvals.
Investment Criteria/Guidelines
Investment Decision Process
Our investment approach involves, among other things:
|
|
• |
an assessment of the markets, overall macroeconomic environment and how the assessment may impact industry and investment selection; |
|
|
• |
substantial company-specific research and analysis; and |
|
|
• |
with respect to each individual company, an emphasis on capital preservation, low volatility and management of downside risk. |
The foundation of our investment philosophy incorporates intensive analysis, a management discipline based on both market technicals and fundamental value-oriented research, and consideration of diversification within our portfolio. We follow a rigorous investment process based on:
|
|
• |
a comprehensive analysis of issuer creditworthiness, including a quantitative and qualitative assessment of the issuer’s business; |
|
|
• |
an evaluation of management and its economic incentives; |
|
|
• |
an analysis of business strategy and industry trends; and |
|
|
• |
an in-depth examination of a prospective portfolio company’s capital structure, financial results and projections. |
We seek to identify those companies exhibiting superior fundamental risk-reward profiles and strong defensible business franchises, while focusing on the absolute and relative value of the investment.
Investment Process Overview
Origination and Sourcing
The substantial majority of our investments are not intermediated and are originated without the assistance of investment banks or other traditional Wall Street sources. In addition to executing direct calling campaigns on companies based on the Adviser’s sector and macroeconomic views, our Investment Team also maintains direct contact with financial sponsors, banks, corporate advisory firms, industry consultants, attorneys, investment banks, “club” investors and other potential sources of investment opportunities. The substantial majority of our deals are informed by our current sector views and are sourced directly by our Adviser through our network of contacts. We also identify opportunities through our Adviser’s relationships with TSSP.
Due Diligence Process
The process through which an investment decision is made involves extensive research into the company, its industry, its growth prospects and its ability to withstand adverse conditions. If the investment team responsible for the transaction determines that an investment opportunity should be pursued, we will engage in an intensive due diligence process. Though each transaction will involve a somewhat different approach, our diligence of each opportunity may include:
|
|
• |
understanding the purpose of the capital requirement, the key personnel and variables, as well as the sources and uses of the proceeds; |
6
|
|
• |
meeting the company’s management, including top and middle-level executives, to get an insider’s view of the business, and to probe for potential weaknesses in business prospects; |
|
|
• |
checking management’s backgrounds and references; |
|
|
• |
performing a detailed review of historical financial performance, including performance through various economic cycles, and the quality of earnings; |
|
|
• |
contacting customers and vendors to assess both business prospects and standard practices; |
|
|
• |
conducting a competitive analysis, and comparing the company to its main competitors on an operating, financial, market share and valuation basis; |
|
|
• |
researching the industry for historic growth trends and future prospects as well as to identify future exit alternatives; |
|
|
• |
assessing asset value and the ability of physical infrastructure and information systems to handle anticipated growth; |
|
|
• |
leveraging TSSP internal resources with institutional knowledge of the company’s business; and |
|
|
• |
investigating legal and regulatory risks and financial and accounting systems and practices. |
Selective Investment Process
After an investment has been identified and preliminary diligence has been completed, a credit research and analysis report is prepared. This report is reviewed by senior investment professionals. If these senior and other investment professionals are supportive of pursuing the potential investment, then a more extensive due diligence process is employed. Additional due diligence with respect to any investment may be conducted on our behalf by attorneys, independent accountants, and other third-party consultants and research firms prior to the closing of the investment, as appropriate, on a case-by-case basis.
Issuance of Formal Commitment
Approval of an investment requires the approval of the Investment Review Committee. Once we have determined that a prospective portfolio company is suitable for investment, we work with the management or sponsor of that company and its other capital providers, including senior, junior and equity capital providers, if any, to finalize the structure and terms of the investment.
Portfolio Monitoring
The Adviser monitors our portfolio companies on an ongoing basis. The Adviser monitors the financial trends of each portfolio company to determine if it is meeting its business plans and to assess the appropriate course of action for each company.
The Adviser has a number of methods of evaluating and monitoring the performance of our investments, which may include the following:
|
|
• |
assessment of success of the portfolio company in adhering to its business plan and compliance with covenants; |
|
|
• |
periodic and regular contact with portfolio company management and, if appropriate, the financial or strategic sponsor, to discuss financial position, requirements and accomplishments; |
|
|
• |
comparisons to other companies in the industry; |
|
|
• |
attendance at, and participation in, board meetings; and |
|
|
• |
review of monthly and quarterly financial statements and financial projections for portfolio companies. |
As part of the monitoring process, the Adviser regularly assesses the risk profile of each of our investments and, on a quarterly basis, grades each investment on a risk scale of 1 to 5. Risk assessment is not standardized in our industry and our risk assessment may not be comparable to ones used by our competitors. Our assessment is based on the following categories:
|
|
• |
An investment is rated 1 if, in the opinion of the Adviser, it is performing as agreed and there are no concerns about the portfolio company’s performance or ability to meet covenant requirements. For these investments, the Adviser generally prepares monthly reports on investment performance and intensive quarterly asset reviews. |
7
|
|
• |
An investment will be assigned a rating of 3 if it is paying its obligations to us as agreed but a material covenant violation is expected. For these investments, in addition to monthly reports and quarterly asset reviews, the Adviser also adds the investment to its “watch list” and researches any areas of concern with the objective of early intervention with the portfolio company. |
|
|
• |
An investment will be assigned a rating of 4 if a material covenant has been violated, but the company is making its scheduled payments on its obligations to us. For these investments, the Adviser generally prepares a bi-monthly asset review email and generally has monthly meetings with the portfolio company’s senior management. For investments where there have been material defaults, including bankruptcy filings, failures to achieve financial performance requirements or failure to maintain liquidity or loan-to-value requirements, the Adviser often will take immediate action to protect its position. These remedies may include negotiating for additional collateral, modifying investment terms or structure, or payment of amendment and waiver fees. |
|
|
• |
A rating of 5 indicates an investment is in default on its interest and/or principal payments. For these investments, our Adviser reviews the investment on a bi-monthly basis and, where possible, pursues workouts that achieve an early resolution to avoid further deterioration of our investment. The Adviser retains legal counsel and takes actions to preserve our rights, which may include working with the portfolio company to have the default cured, to have the investment restructured or to have the investment repaid through a consensual workout. |
For more information on the investment performance ratings of our portfolio, see “ITEM 7. MANAGEMENT’S DISCUSSION AND ANALYSIS OF FINANCIAL CONDITION AND RESULTS OF OPERATIONS—Portfolio and Investment Activity.”
Investment Review Committee
The Adviser manages our portfolio under the general oversight of the Investment Review Committee. The Investment Review Committee includes certain individuals who are senior personnel of the Adviser and TSSP, as well as certain other persons appointed by the Adviser from time to time. Our Investment Team and the Investment Review Committee are supported by and have access to the investment professionals, analytical capabilities and support personnel of TSSP.
Structure of Investments
Since beginning our investment activities in July 2011, we have sought to generate current income primarily in U.S.-domiciled middle market companies through direct originations of senior secured loans and, to a lesser extent, originations of mezzanine and unsecured loans and investments in corporate bonds and equity and other investments.
Debt Investments
The terms of our debt investments are tailored to the facts and circumstances of each transaction and prospective portfolio company. We negotiate the structure of each investment to protect our rights and manage our risk while providing funding to help the portfolio company achieve its business plan. We invest in the following types of debt:
|
|
• |
First-lien debt. First-lien debt is typically senior on a lien basis to other liabilities in the issuer’s capital structure and has the benefit of a first-priority security interest in assets of the issuer. The security interest ranks above the security interest of any second-lien lenders in those assets. Our first-lien debt may include stand-alone first-lien loans, “last out” first-lien loans, “unitranche” loans and secured corporate bonds with similar features to these categories of first-lien loans. |
|
|
• |
Stand-alone first-lien loans. Stand-alone first-lien loans are traditional first-lien loans. All lenders in the facility have equal rights to the collateral that is subject to the first-priority security interest. |
|
|
• |
“Last out” first-lien loans. “Last out” first-lien loans have a secondary priority behind super-senior “first out” first-lien loans in the collateral securing the loans in certain circumstances. The arrangements for a “last out” first-lien loan are set forth in an “agreement among lenders,” which provides lenders with “first out” and “last out” payment streams based on a single lien on the collateral. Since the “first out” lenders generally have priority over the “last out” lenders for receiving payment under certain specified events of default, or upon the occurrence of other triggering events under intercreditor agreements or agreements among lenders, the “last out” lenders bear a greater risk and, in exchange, receive a higher effective interest rate, through arrangements among the lenders, than the “first out” lenders or lenders in stand-alone first-lien loans. Agreements among lenders also typically provide greater voting rights to the “last out” lenders than the intercreditor agreements to which second-lien lenders often are subject. |
8
|
|
• |
Second-lien debt. Our second-lien debt may include secured loans, and, to a lesser extent, secured corporate bonds, with a secondary priority behind first-lien debt. Second-lien debt typically is senior on a lien basis to other liabilities in the issuer’s capital structure and has the benefit of a security interest over assets of the issuer, though ranking junior to first-lien debt secured by those assets. First-lien lenders and second-lien lenders typically have separate liens on the collateral, and an intercreditor agreement provides the first-lien lenders with priority over the second-lien lenders’ liens on the collateral. |
|
|
• |
“Mezzanine” and “Unsecured” debt. Structurally, mezzanine debt usually ranks subordinate in priority of payment to first-lien and second-lien debt and may not have the benefit of financial covenants common in first-lien and second-lien debt. Unsecured debt may rank junior as it relates to proceeds in certain liquidations where it does not have the benefit of a lien in specific collateral held by creditors (typically first lien and/or second lien) who have a perfected security interest in such collateral. However, both mezzanine and unsecured debt ranks senior to common and preferred equity in an issuer’s capital structure. Mezzanine and unsecured debt investments generally offer lenders fixed returns in the form of interest payments and mezzanine debt will often provide lenders an opportunity to participate in the capital appreciation, if any, of an issuer through an equity interest. This equity interest typically takes the form of an equity co-investment or warrants. Due to its higher risk profile and often less restrictive covenants compared to senior secured loans, mezzanine and unsecured debt generally bears a higher stated interest rate than first-lien and second-lien debt. |
Our debt investments are typically structured with the maximum seniority and collateral that we can reasonably obtain while seeking to achieve our total return target. We seek to limit the downside potential of our investments by:
|
|
• |
requiring a total return on our investments (including both interest and potential equity appreciation) that compensates us for credit risk; and |
|
|
• |
negotiating covenants in connection with our investments that afford our portfolio companies as much flexibility in managing their businesses as possible, consistent with preservation of our capital. Such restrictions may include affirmative covenants (including reporting requirements), negative covenants (including financial covenants), lien protection, change of control provisions and board rights, including either observation or rights to a seat on the board under some circumstances. |
Among the types of first-lien debt in which we invest, we generally are able to obtain higher effective interest rates on our “last out” first-lien loans than on other types of first-lien loans, since our “last-out” first-lien loans generally are more junior in the capital structure. Within our portfolio, we aim to maintain the appropriate proportion among the various types of first-lien loans, as well as second-lien debt and mezzanine debt, which allows us to achieve our target returns while maintaining our targeted amount of credit risk.
Equity and Other Investments
Our loans may include an equity interest in the issuer, such as a warrant or profit participation right. In certain instances, we also will make equity investments, although those situations are generally limited to those cases where we are also making an investment in a more senior part of the capital structure of the issuer.
Investments
As of December 31, 2019 and 2018, we had made investments with an aggregate fair value of $2,245.9 million and $1,706.0 million, respectively, in 63 and 46 portfolio companies, respectively.
Investments consisted of the following at December 31, 2019 and 2018:
|
|
|
December 31, 2019 |
|
|||||||||
|
|
|
|
|
|
|
|
|
|
|
Net Unrealized |
|
|
|
($ in millions) |
|
Amortized Cost (1) |
|
|
Fair Value |
|
|
Gain (Loss) |
|
|||
|
First-lien debt investments |
|
$ |
2,134.1 |
|
|
$ |
2,166.2 |
|
|
$ |
32.1 |
|
|
Second-lien debt investments |
|
|
13.9 |
|
|
|
14.1 |
|
|
|
0.2 |
|
|
Mezzanine debt investments |
|
|
2.5 |
|
|
|
2.5 |
|
|
|
— |
|
|
Equity and other investments |
|
|
87.5 |
|
|
|
63.1 |
|
|
|
(24.4 |
) |
|
Total Investments |
|
$ |
2,238.0 |
|
|
$ |
2,245.9 |
|
|
$ |
7.9 |
|
9
|
|
|
December 31, 2018 |
|
|||||||||
|
|
|
|
|
|
|
|
|
|
|
Net Unrealized |
|
|
|
($ in millions) |
|
Amortized Cost (1) |
|
|
Fair Value |
|
|
Gain (Loss) |
|
|||
|
First-lien debt investments |
|
$ |
1,642.0 |
|
|
$ |
1,653.9 |
|
|
$ |
11.9 |
|
|
Second-lien debt investments |
|
|
4.1 |
|
|
|
4.1 |
|
|
|
— |
|
|
Mezzanine debt investments |
|
|
2.5 |
|
|
|
2.5 |
|
|
|
— |
|
|
Equity and other investments |
|
|
67.8 |
|
|
|
45.5 |
|
|
|
(22.3 |
) |
|
Total Investments |
|
$ |
1,716.4 |
|
|
$ |
1,706.0 |
|
|
$ |
(10.4 |
) |
|
(1) |
Amortized cost represents the original cost adjusted for the amortization of discounts or premiums, as applicable, on debt investments using the effective interest method. |
The industry composition of investments at fair value at December 31, 2019 and 2018 was as follows:
|
|
|
December 31, 2019 |
|
|
December 31, 2018 |
|
||
|
Beverage, food, and tobacco |
|
|
2.2 |
% |
|
|
2.7 |
% |
|
Business services |
|
|
16.8 |
% |
|
|
19.3 |
% |
|
Chemicals |
|
|
0.3 |
% |
|
|
0.7 |
% |
|
Communications |
|
|
1.5 |
% |
|
— |
|
|
|
Education |
|
|
9.2 |
% |
|
|
9.4 |
% |
|
Electronics |
|
|
0.1 |
% |
|
— |
|
|
|
Financial services |
|
|
13.7 |
% |
|
|
19.2 |
% |
|
Healthcare |
|
|
9.4 |
% |
|
|
8.2 |
% |
|
Hotel, gaming and leisure |
|
|
1.6 |
% |
|
|
2.0 |
% |
|
Human resource support services |
|
|
8.2 |
% |
|
|
3.1 |
% |
|
Insurance |
|
|
2.3 |
% |
|
|
6.6 |
% |
|
Internet services |
|
|
4.8 |
% |
|
|
5.3 |
% |
|
Manufacturing |
|
— |
|
|
|
1.2 |
% |
|
|
Marketing services |
|
|
2.0 |
% |
|
|
2.3 |
% |
|
Office products |
|
|
0.5 |
% |
|
|
0.8 |
% |
|
Oil, gas and consumable fuels |
|
|
4.2 |
% |
|
|
2.3 |
% |
|
Pharmaceuticals |
|
|
3.4 |
% |
|
|
6.4 |
% |
|
Real Estate |
|
|
0.9 |
% |
|
— |
|
|
|
Retail and consumer products |
|
|
14.9 |
% |
|
|
5.6 |
% |
|
Transportation |
|
|
4.0 |
% |
|
|
4.9 |
% |
|
Total |
|
|
100.0 |
% |
|
|
100.0 |
% |
We classify the industries of our portfolio companies by end-market (such as healthcare, and business services) and not by the product or services (such as software) directed to those end-markets.
The geographic composition of investments at fair value at December 31, 2019 and 2018 was as follows:
|
|
|
December 31, 2019 |
|
|
December 31, 2018 |
|
||
|
United States |
|
|
|
|
|
|
|
|
|
Midwest |
|
|
16.9 |
% |
|
|
12.0 |
% |
|
Northeast |
|
|
15.8 |
% |
|
|
23.5 |
% |
|
South |
|
|
19.2 |
% |
|
|
19.6 |
% |
|
West |
|
|
38.8 |
% |
|
|
40.2 |
% |
|
Australia |
|
|
1.6 |
% |
|
|
2.0 |
% |
|
Bermuda |
|
|
1.7 |
% |
|
|
— |
|
|
Canada |
|
|
6.0 |
% |
|
|
2.7 |
% |
|
Total |
|
|
100.0 |
% |
|
|
100.0 |
% |
10
As of December 31, 2019 and 2018, we had the following commitments to fund investments in current portfolio companies:
|
($ in millions) |
|
December 31, 2019 |
|
|
December 31, 2018 |
|
||
|
Alpha Midco, Inc. - Delayed Draw |
|
$ |
19.6 |
|
|
$ |
— |
|
|
AppStar Financial, LLC - Revolver |
|
|
2.0 |
|
|
|
2.0 |
|
|
AvidXchange, Inc. - Delayed Draw |
|
|
5.1 |
|
|
— |
|
|
|
BlueSnap, Inc. - Revolver |
|
|
2.5 |
|
|
— |
|
|
|
Caris Life Sciences, Ltd. - Delayed Draw |
|
— |
|
|
|
2.5 |
|
|
|
ClearCompany, LLC - Delayed Draw |
|
|
1.4 |
|
|
|
3.0 |
|
|
Clinicient, Inc. - Revolver |
|
|
4.0 |
|
|
— |
|
|
|
DaySmart Holdings, LLC - Revolver |
|
|
5.0 |
|
|
— |
|
|
|
DaySmart Holdings, LLC - Delayed Draw |
|
|
17.5 |
|
|
— |
|
|
|
Dye & Durham Corp. - Revolver |
|
|
1.3 |
|
|
— |
|
|
|
Energy Alloys, LLC - Delayed Draw |
|
|
15.0 |
|
|
— |
|
|
|
Ferrellgas, L.P. - Revolver |
|
|
30.0 |
|
|
|
30.0 |
|
|
Frontline Technologies Group, LLC - Delayed Draw |
|
— |
|
|
|
9.4 |
|
|
|
G Treasury SS, LLC - Delayed Draw |
|
|
3.8 |
|
|
|
5.0 |
|
|
G Treasury SS, LLC - Revolver |
|
— |
|
|
|
2.0 |
|
|
|
Gainsight, Inc. - Delayed Draw |
|
|
1.8 |
|
|
— |
|
|
|
Government Brands, LLC - Revolver |
|
— |
|
|
|
5.0 |
|
|
|
Integration Appliance, Inc. - Revolver |
|
|
2.6 |
|
|
|
2.6 |
|
|
IntelePeer Holdings, Inc. - Delayed Draw |
|
|
3.5 |
|
|
— |
|
|
|
IRGSE Holding Corp. - Revolver |
|
|
2.1 |
|
|
|
3.0 |
|
|
Kyriba Corp. - Delayed Draw |
|
|
8.3 |
|
|
— |
|
|
|
Kyriba Corp. - Revolver |
|
|
1.2 |
|
|
— |
|
|
|
Lithium Technologies, LLC - Revolver |
|
|
3.9 |
|
|
|
3.9 |
|
|
Lucidworks, Inc. - Revolver |
|
|
3.3 |
|
|
— |
|
|
|
MD America Energy, LLC - Delayed Draw |
|
— |
|
|
|
15.0 |
|
|
|
Motus, LLC - Revolver |
|
— |
|
|
|
5.6 |
|
|
|
PageUp People, Ltd. - Revolver |
|
|
2.8 |
|
|
|
2.1 |
|
|
PayLease, LLC - Revolver |
|
|
3.3 |
|
|
|
3.3 |
|
|
PayScale Holdings, Inc. - Delayed Draw |
|
|
7.7 |
|
|
— |
|
|
|
PrimeRevenue, Inc. - Revolver |
|
|
6.3 |
|
|
|
6.3 |
|
|
ResMan, LLC - Delayed Draw |
|
|
3.6 |
|
|
— |
|
|
|
ResMan, LLC - Revolver |
|
|
2.0 |
|
|
— |
|
|
|
ScentAir Technologies, Inc. - Revolver |
|
— |
|
|
|
0.8 |
|
|
|
Sovos Compliance, LLC - Delayed Draw |
|
— |
|
|
|
0.5 |
|
|
|
Sovos Compliance, LLC - Revolver |
|
— |
|
|
|
1.7 |
|
|
|
TherapeuticsMD, Inc. - Delayed Draw A1 |
|
|
7.5 |
|
|
— |
|
|
|
TherapeuticsMD, Inc. - Delayed Draw A2 |
|
|
7.5 |
|
|
— |
|
|
|
Valant Medical Solutions, Inc. - Delayed Draw |
|
|
2.6 |
|
|
— |
|
|
|
Valant Medical Solutions, Inc. - Revolver |
|
|
2.0 |
|
|
— |
|
|
|
Verdad Resources Intermediate Holdings, LLC - Delayed Draw |
|
|
7.8 |
|
|
— |
|
|
|
Total Portfolio Company Commitments |
|
$ |
187.0 |
|
|
$ |
103.7 |
|
Other Commitments and Contingencies
As of December 31, 2019 and 2018, we did not have any unfunded commitments to fund investments to new borrowers that were not current portfolio companies as of such date.
From time to time, we may become a party to certain legal proceedings incidental to the normal course of our business. As of December 31, 2019, management is not aware of any material pending or threatened litigation that would require accounting recognition or financial statement disclosure.
11
We compete for investments with a number of capital providers, including BDCs, other investment funds (including private debt and equity funds and venture capital funds), special purpose acquisition company sponsors, investment banks with underwriting activities, hedge funds that invest in private investments in public equities, traditional financial services companies such as commercial banks, and other sources of financing, including the broadly syndicated loan market and high yield capital market. Many of these capital providers have greater financial and managerial resources than we do. In addition, many of our competitors are not subject to the regulatory restrictions that the 1940 Act imposes on us as a BDC. For additional information concerning the competitive risks we expect to face, see “ITEM 1A. RISK FACTORS—Risks Related to Our Business and Structure—We operate in a highly competitive market for investment opportunities.”
Capital Resources and Borrowings
We anticipate generating cash in the future from cash flows from operations, including interest received on our cash and cash equivalents, U.S. government securities and other high-quality debt investments that mature in one year or less, and through issuances of common stock.
Additionally, we are permitted, under specified conditions, to issue multiple classes of indebtedness and one class of shares senior to our common stock if our asset coverage, as defined in the 1940 Act, is at least equal to 150% immediately after each such issuance. As of December 31, 2019 and 2018, our asset coverage was 200.4% and 270.5%, respectively. See “Regulation as a Business Development Company—Senior Securities” below.
Furthermore, while any indebtedness and senior securities remain outstanding, we must make provisions to prohibit any distribution to our stockholders (which may cause us to fail to distribute amounts necessary to avoid entity-level taxation under the Code), or the repurchase of such securities or shares unless we meet the applicable asset coverage ratios at the time of the distribution or repurchase. In addition, we must also comply with positive and negative covenants customary for these types of facilities.
Our debt obligations consisted of the following as of December 31, 2019 and 2018:
|
|
|
December 31, 2019 |
|
|||||||||||||
|
|
|
Aggregate Principal |
|
|
Outstanding |
|
|
Amount |
|
|
Carrying |
|
||||
|
($ in millions) |
|
Amount Committed |
|
|
Principal |
|
|
Available (1) |
|
|
Value (2)(3) |
|
||||
|
Revolving Credit Facility |
|
$ |
1,245.0 |
|
|
$ |
495.7 |
|
|
$ |
749.3 |
|
|
$ |
485.8 |
|
|
2022 Convertible Notes |
|
|
172.5 |
|
|
|
172.5 |
|
|
— |
|
|
|
169.4 |
|
|
|
2023 Notes |
|
|
150.0 |
|
|
|
150.0 |
|
|
— |
|
|
|
148.0 |
|
|
|
2024 Notes |
|
|
300.0 |
|
|
|
300.0 |
|
|
— |
|
|
|
291.3 |
|
|
|
Total Debt |
|
$ |
1,867.5 |
|
|
$ |
1,118.2 |
|
|
$ |
749.3 |
|
|
$ |
1,094.5 |
|
|
(1) |
The amount available may be subject to limitations related to the borrowing base under the Revolving Credit Facility and asset coverage requirements. |
|
(2) |
The carrying values of the Revolving Credit Facility, 2022 Convertible Notes, 2023 Notes, and 2024 Notes are presented net of deferred financing costs and original issue discounts of $10.0 million, $3.1 million, $2.0 million and $6.9 million, respectively. |
|
(3) |
The carrying value of the 2024 Notes is presented net of $1.8 million, which represents a change in the carrying value of the 2024 Notes resulting from a hedge accounting relationship. |
|
|
|
December 31, 2018 |
|
|||||||||||||
|
|
|
Aggregate Principal |
|
|
Outstanding |
|
|
Amount |
|
|
Carrying |
|
||||
|
($ in millions) |
|
Amount Committed |
|
|
Principal |
|
|
Available (1) |
|
|
Value (2) |
|
||||
|
Revolving Credit Facility |
|
$ |
940.0 |
|
|
$ |
187.5 |
|
|
$ |
752.5 |
|
|
$ |
178.8 |
|
|
2019 Convertible Notes |
|
|
115.0 |
|
|
|
115.0 |
|
|
— |
|
|
|
113.6 |
|
|
|
2022 Convertible Notes |
|
|
172.5 |
|
|
|
172.5 |
|
|
— |
|
|
|
168.3 |
|
|
|
2023 Notes |
|
|
150.0 |
|
|
|
150.0 |
|
|
— |
|
|
|
147.3 |
|
|
|
Total Debt |
|
$ |
1,377.5 |
|
|
$ |
625.0 |
|
|
$ |
752.5 |
|
|
$ |
608.0 |
|
|
(1) |
The amount available may be subject to limitations related to the borrowing base under the Revolving Credit Facility and asset coverage requirements. |
|
(2) |
The carrying values of the Revolving Credit Facility, Convertible Notes, and 2023 Notes are presented net of deferred financing costs and original issue discounts of $8.7 million, $5.6 million and $2.7 million, respectively. |
12
For the years ended December 31, 2019, 2018 and 2017, the components of interest expense were as follows:
|
($ in millions) |
|
Year Ended December 31, 2019 |
|
|
Year Ended December 31, 2018 |
|
|
Year Ended December 31, 2017 |
|
|||
|
Interest expense |
|
$ |
39.1 |
|
|
$ |
35.7 |
|
|
$ |
22.9 |
|
|
Commitment fees |
|
|
2.9 |
|
|
|
1.8 |
|
|
|
2.0 |
|
|
Amortization of deferred financing costs |
|
|
4.8 |
|
|
|
4.1 |
|
|
|
3.2 |
|
|
Accretion of original issue discount |
|
|
0.9 |
|
|
|
0.8 |
|
|
|
0.7 |
|
|
Swap settlement |
|
|
1.4 |
|
|
|
0.4 |
|
|
|
(1.4 |
) |
|
Total Interest Expense |
|
$ |
49.1 |
|
|
$ |
42.8 |
|
|
$ |
27.4 |
|
|
Average debt outstanding |
|
$ |
913.4 |
|
|
$ |
874.3 |
|
|
$ |
645.1 |
|
|
Weighted average interest rate |
|
|
4.4 |
% |
|
|
4.1 |
% |
|
|
3.3 |
% |
|
Average 1-month LIBOR rate |
|
|
2.2 |
% |
|
|
2.0 |
% |
|
|
1.1 |
% |
For more information on our debt, see “ITEM 7. MANAGEMENT’S DISCUSSION AND ANALYSIS OF FINANCIAL CONDITION AND RESULTS OF OPERATIONS——Financial Condition, Liquidity and Capital Resources.”
Dividend Policy
To maintain our status as a RIC, we must distribute (or be treated as distributing) in each taxable year dividends for tax purposes of an amount equal to at least 90% of our investment company taxable income (which includes, among other items, dividends, interest, the excess of any net short-term capital gains over net long-term capital losses, as well as other taxable income, excluding any net capital gains reduced by deductible expenses) and 90% of our net tax-exempt income for that taxable year. As a RIC, we generally will not be subject to corporate-level U.S. federal income tax on our investment company taxable income and net capital gains that we distribute to stockholders. In addition, to avoid the imposition of a nondeductible 4% U.S. federal excise tax, we must distribute (or be treated as distributing) in each calendar year an amount at least equal to the sum of:
|
|
• |
98% of our net ordinary income, excluding certain ordinary gains and losses, recognized during a calendar year; |
|
|
• |
98.2% of our capital gain net income, adjusted for certain ordinary gains and losses, recognized for the twelve-month period ending on October 31 of such calendar year; and |
|
|
• |
100% of any income or gains recognized, but not distributed, in preceding years. |
We have previously incurred, and can be expected to incur in the future, such excise tax on a portion of our income and gains. While we intend to distribute income and capital gains to minimize exposure to the 4% excise tax, we may not be able to, or may choose not to, distribute amounts sufficient to avoid the imposition of the excise tax entirely. In that event, we will be liable for the excise tax only on the amount by which we do not meet the foregoing distribution requirement. See “ITEM 1A. RISK FACTORS—Risks Related to Our Business and Structure—We will be subject to corporate-level income tax if we are unable to maintain our qualification as a RIC under Subchapter M of the Code.”
Dividend Reinvestment Plan
We have adopted a dividend reinvestment plan, pursuant to which we will reinvest all cash dividends or distributions declared by the Board on behalf of investors who do not elect to receive their cash dividends or distributions in cash as provided below. As a result, if the Board authorizes, and we declare, a cash dividend or distribution, then our stockholders who have not elected to “opt out” of our dividend reinvestment plan will have their cash dividends or distributions automatically reinvested in additional common stock as described below.
No action is required on the part of a registered stockholder to have its cash dividend or other distribution reinvested in our common stock. A registered stockholder is able to elect to receive an entire cash dividend or distribution in cash by notifying State Street Bank and Trust Company, the plan administrator and our transfer agent and registrar, in writing, so that notice is received by the plan administrator no later than 10 days prior to the record date for the cash dividend or distributions to the stockholders. The plan administrator has set up an account for shares acquired through the plan for each stockholder who has not elected to receive cash dividends or distributions in cash and hold the shares in non-certificated form.
Those stockholders whose shares are held by a broker or other financial intermediary may receive cash dividends and other distributions in cash by notifying their broker or other financial intermediary of their election.
13
We expect to use primarily newly issued shares to implement the plan, whether our shares are trading at a premium or at a discount to net asset value. We reserve the right to purchase shares in the open market in connection with our implementation of the plan. The number of shares to be issued to a stockholder is determined by dividing the total dollar amount of the cash dividend or distribution payable to a stockholder by the market price per share of our common stock at the close of regular trading on the New York Stock Exchange, or “NYSE,” on the payment date of a distribution, or if no sale is reported for such day, the average of the reported bid and ask prices. However, if the market price per share on the payment date of a cash dividend or distribution exceeds the most recently computed net asset value per share, we will issue shares at the greater of (i) the most recently computed net asset value per share and (ii) 95% of the current market price per share (or such lesser discount to the current market price per share that still exceeded the most recently computed net asset value per share). Shares purchased in open market transactions by the plan administrator will be allocated to a stockholder based on the average purchase price, excluding any brokerage charges or other charges, of all shares of common stock purchased in the open market.
The number of shares of our common stock that will be outstanding after giving effect to payment of a cash dividend or distribution cannot be established until the value per share at which additional shares will be issued has been determined and elections of our stockholders have been tabulated. The number of shares to be issued to a stockholder pursuant to the foregoing will be rounded down to the nearest whole share to avoid the issuance of fractional shares, with any fractional shares being paid in cash. For non-U.S. stockholders, the number of shares to be issued to the stockholder will be the amount equal to the total dollar amount of the cash dividend or distribution payable, net of applicable withholding taxes.
There are no brokerage charges or other charges to stockholders who participate in the plan. The plan is terminable by us upon notice in writing mailed to each stockholder of record at least 30 days prior to any record date for the payment of any cash dividend or distribution by us. If a participant elects by written notice to the plan administrator to have the plan administrator sell part or all of the shares held by the plan administrator in the participant’s account and remit the proceeds to the participant, the plan administrator is authorized to deduct a $15.00 transaction fee plus a brokerage commission from the proceeds.
Administration
Each of our executive officers is an employee of our Adviser or its affiliates. We do not currently have any employees and do not expect to have any employees. Individuals who are employees of our Adviser or its affiliates provide services necessary for our business under the terms of the Investment Advisory Agreement and the Administration Agreement. Our day-to-day investment operations are managed by our Adviser and the services necessary for the origination and administration of our investment portfolio are provided by investment professionals employed by our Adviser or its affiliates. Our Investment Team focuses on origination and transaction development and the ongoing monitoring of our investments. In addition, we reimburse the Adviser for the allocable portion of the compensation paid by the Adviser (or its affiliates) to our Chief Compliance Officer, Chief Financial Officer, and other professionals who spend time on those related activities (based on the percentage of time those individuals devote, on an estimated basis, to our business and affairs). See “Investment Advisory Agreement; Administration Agreement; License Agreement” below.
Management Agreements
Investment Advisory Agreement; Administration Agreement; License Agreement
On April 15, 2011, we entered into the Investment Advisory Agreement with our Adviser. The Investment Advisory Agreement was subsequently amended on December 12, 2011.
Under the Investment Advisory Agreement, the Adviser:
|
|
• |
determines the composition of our portfolio, the nature and timing of the changes to our portfolio and the manner of implementing those changes; |
|
|
• |
identifies, evaluates and negotiates the structure of the investments we make (including performing due diligence on our prospective portfolio companies); |
|
|
• |
determines the assets we will originate, purchase, retain or sell; |
|
|
• |
closes, monitors and administers the investments we make, including the exercise of any rights in our capacity as a lender or equity holder; and |
|
|
• |
provides us other investment advisory, research and related services as we may, from time to time, reasonably require for the investment of our funds, including providing operating and managerial assistance to us and our portfolio companies, as required. |
The Adviser’s services under the Investment Advisory Agreement are not exclusive, and the Adviser is free to furnish similar or other services to others so long as its services to us are not impaired.
14
Under the terms of the Investment Advisory Agreement, we pay the Adviser a base management fee, or the “Management Fee,” and may also pay certain incentive fees, or “Incentive Fees”.
The Management Fee is calculated at an annual rate of 1.5% based on the average value of our gross assets calculated using the values at the end of the two most recently completed calendar quarters, adjusted for any share issuances or repurchases during the period. The Management Fee is payable quarterly in arrears.
For each of the years ended December 31, 2019, 2018, and 2017, Management Fees (gross of waivers) were $30.1 million, $28.6 million and $24.3 million, respectively.
The Adviser did not waive any Management Fees for the year ended December 31, 2019. For the years ended December 31, 2018 and 2017, Management Fees of less than $0.1 million were waived consisting solely of Management Fees attributable to our ownership of shares of common stock in Triangle Capital Corp. (the “TCAP Shares”). As of June 30, 2018 we had fully exited our position in the TCAP Shares.
Any waived Management Fees are not subject to recoupment by the Adviser.
The Adviser intends to waive a portion of the Management Fee payable under the Investment Advisory Agreement by reducing the Management Fee on assets financed using leverage over 200% asset coverage (in other words, over 1.0x debt to equity) (the “Leverage Waiver”). Pursuant to the Leverage Waiver, the Adviser intends to waive the portion of the Management Fee in excess of an annual rate of 1.0% (0.250% per quarter) on the average value of our gross assets as of the end of the two most recently completed calendar quarters that exceeds the product of (i) 200% and (ii) the average value of our net asset value at the end of the two most recently completed calendar quarters. As of December 31, 2019, no Management Fees have been waived pursuant to the Leverage Waiver.
The Incentive Fee consists of two parts, as follows:
|
|
(i) |
The first component, payable at the end of each quarter in arrears, equals 100% of the pre-Incentive Fee net investment income in excess of a 1.5% quarterly “hurdle rate,” the calculation of which is further explained below, until the Adviser has received 17.5% of the total pre-Incentive Fee net investment income for that quarter and, for pre-Incentive Fee net investment income in excess of 1.82% quarterly, 17.5% of all remaining pre-Incentive Fee net investment income for that quarter. The 100% “catch-up” provision for pre-Incentive Fee net investment income in excess of the 1.5% “hurdle rate” is intended to provide the Adviser with an Incentive Fee of 17.5% on all pre-Incentive Fee net investment income when that amount equals 1.82% in a quarter (7.28% annualized), which is the rate at which catch-up is achieved. Once the “hurdle rate” is reached and catch-up is achieved, 17.5% of any pre-Incentive Fee net investment income in excess of 1.82% in any quarter is payable to the Adviser. |
Pre-Incentive Fee net investment income means dividends, interest and fee income accrued by us during the calendar quarter, minus our operating expenses for the quarter (including the Management Fee, expenses payable under the Administration Agreement to the Administrator, and any interest expense and dividends paid on any issued and outstanding preferred stock, but excluding the Incentive Fee). Pre-Incentive Fee net investment income includes, in the case of investments with a deferred interest feature (such as original issue discount, debt instruments with pay-in-kind interest and zero coupon securities), accrued income that we may not have received in cash. Pre-Incentive Fee net investment income does not include any realized capital gains, realized capital losses or unrealized capital gain or loss.
|
|
(ii) |
The second component, payable at the end of each fiscal year in arrears, equaled 15% through March 31, 2014 and, beginning April 1, 2014, equals a weighted percentage of cumulative realized capital gains from our inception to the end of that fiscal year, less cumulative realized capital losses and unrealized capital losses. This component of the Incentive Fee is referred to as the Capital Gains Fee. Each year, the fee paid for this component of the Incentive Fee is net of the aggregate amount of any previously paid Capital Gains Fee for prior periods. For capital gains that accrue following March 31, 2014, the Incentive Fee rate is 17.5%. We accrue, but do not pay, a capital gains Incentive Fee with respect to unrealized capital gains because a capital gains Incentive Fee would be owed to the Adviser if we were to sell the relevant investment and realize a capital gain. The weighted percentage is intended to ensure that for each fiscal year following the completion of the IPO, the portion of our realized capital gains that accrued prior to March 31, 2014, is subject to an Incentive Fee rate of 15% and the portion of our realized capital gains that accrued beginning April 1, 2014 is subject to an Incentive Fee rate of 17.5%. |
For purposes of determining whether pre-Incentive Fee net investment income exceeds the hurdle rate, pre-Incentive Fee net investment income is expressed as a rate of return on the value of our net assets at the end of the immediately preceding calendar quarter.
15
Pre-Incentive Fee net investment income does not include any realized capital gains, realized capital losses or unrealized capital gains or losses. Because of the structure of the Incentive Fee, it is possible that we may pay an Incentive Fee in a quarter in which we incur a loss. For example, if we receive pre-Incentive Fee net investment income in excess of the quarterly minimum hurdle rate, we will pay the applicable Incentive Fee even if we have incurred a loss in that quarter due to realized and unrealized capital losses. In addition, because the quarterly minimum hurdle rate is calculated based on our net assets, decreases in our net assets due to realized or unrealized capital losses in any given quarter may increase the likelihood that the hurdle rate is reached and therefore the likelihood of us paying an Incentive Fee for that quarter. Our net investment income used to calculate this component of the Incentive Fee is also included in the amount of our gross assets used to calculate the Management Fee because gross assets are total assets (including cash received) before deducting liabilities (such as declared dividend payments).
Section 205(b)(3) of the Advisers Act, as amended, prohibits the Adviser from receiving the payment of fees on unrealized gains until those gains are realized, if ever. There can be no assurance that such unrealized gains will be realized in the future.
For the years ended December 31, 2019, 2018 and 2017, Incentive Fees (gross of waivers) were $27.2 million, $30.5 million and $25.5 million, respectively, all of which were realized and payable to the Adviser. For the years ended December 31, 2019, 2018 and 2017, no Incentive Fees were accrued related to capital gains.
The Adviser voluntarily waived the Incentive Fees attributable to pre-Incentive Fee net investment income accrued by the Company as a result of our ownership of the TCAP Shares. The Adviser did not waive any part of the Capital Gains Fee attributable to our ownership of the TCAP Shares and, accordingly, any realized capital gains or losses and unrealized capital losses with respect to the TCAP Shares were applied against our cumulative realized capital gains on which the Capital Gains Fee is calculated.
The Adviser did not waive any Incentive Fees for the year ended December 31, 2019. For the years ended December 31 2018 and 2017, Incentive Fees of less than $0.1 million were waived consisting solely of Incentive Fees attributable to our ownership of the TCAP Shares. Any waived Incentive Fees are not subject to recoupment by the Adviser.
Since our IPO, with the exception of its waiver of Management Fees and certain Incentive Fees attributable to our ownership of certain portfolio companies, including the TCAP Shares, the Adviser has not waived its right to receive any Management Fees or Incentive Fees payable pursuant to the Investment Advisory Agreement.
In November 2019, the Board renewed the Investment Advisory Agreement. Unless earlier terminated as described below, the Investment Advisory Agreement will remain in effect until November 2020, and may be extended subject to required approvals. The Investment Advisory Agreement will automatically terminate in the event of an assignment and may be terminated by either party without penalty on 60 days’ written notice to the other party.
Our Board monitors the mix and performance of our investments over time and seeks to satisfy itself that the Adviser is acting in our interests and that our fee structure appropriately incentivizes the Adviser to do so.
On March 15, 2011, we entered into the Administration Agreement with our Adviser. Under the terms of the Administration Agreement, the Adviser provides administrative services to us. These services include providing office space, equipment and office services, maintaining financial records, preparing reports to stockholders and reports filed with the SEC, and managing the payment of expenses and the oversight of the performance of administrative and professional services rendered by others. Certain of these services are reimbursable to the Adviser under the terms of the Administration Agreement. See “—Payment of Our Expenses” below. In addition, the Adviser is permitted to delegate its duties under the Administration Agreement to affiliates or third parties and we pay or reimburse the Adviser expenses incurred by any such affiliates or third parties for work done on our behalf. For the years ended December 31, 2019, 2018, and 2017, we incurred expenses of $4.2 million, $3.4 million, and $3.5 million, respectively, for administrative services payable under the terms of the Administration Agreement.
From time to time, the Adviser may pay amounts owed by us to third-party providers of goods or services, including the Board, and we will subsequently reimburse the Adviser for such amounts paid on our behalf. Amounts payable to the Adviser are settled in the normal course of business without formal payment terms.
In November 2019, the Board renewed the Administration Agreement. Unless earlier terminated as described below, the Administration Agreement will remain in effect until November 2020, and may be extended subject to required approvals. The Administration Agreement may be terminated by either party without penalty on 60 days’ written notice to the other party.
No person who is an officer, director or employee of the Adviser or its affiliates and who serves as our director receives any compensation from us for his or her services as a director. However, we reimburse the Adviser or its affiliates for an allocable portion of the compensation paid by the Adviser or its affiliates to our Chief Compliance Officer, Chief Financial Officer, and other professionals who spend time on those related activities (based on the percentage of time those individuals devote, on an estimated
16
basis, to our business and affairs). Directors who are not affiliated with the Adviser receive compensation for their services and reimbursement of expenses incurred to attend meetings.
The Adviser does not assume any responsibility to us other than to render the services described in, and on the terms of the Investment Advisory Agreement and the Administration Agreement, and is not responsible for any action of our Board in declining to follow the advice or recommendations of the Adviser. Under the terms of the Investment Advisory Agreement and the Administration Agreement, the Adviser (and its members, managers, officers, employees, agents, controlling persons and any other person or entity affiliated with it) shall not be liable to us for any action taken or omitted to be taken by the Adviser in connection with the performance of any of its duties or obligations under the Investment Advisory Agreement, the Administration Agreement or otherwise as an investment adviser of ours (except to the extent specified in Section 36(b) of the 1940 Act concerning loss resulting from a breach of fiduciary duty (as the same is finally determined by judicial proceedings) with respect to the receipt of compensation for services). We shall, to the fullest extent permitted by law, provide indemnification and the right to the advancement of expenses, to each person who was or is made a party or is threatened to be made a party to or is involved (including, without limitation, as a witness) in any actual or threatened action, suit or proceeding, whether civil, criminal, administrative or investigative, by reason of the fact that he or she is or was a member, manager, officer, employee, agent, controlling person of the Adviser or any other person or entity affiliated with the Adviser, or is or was a member of the Adviser’s Investment Review Committee, on the same general terms set forth in Article VIII of our certificate of incorporation.
United States federal and state securities laws may impose liability under certain circumstances on persons who act in good faith. Nothing in the Investment Advisory Agreement will constitute a waiver or limitation of any rights that we may have under any applicable federal or state securities laws.
We also have a license agreement with an affiliate of TPG, pursuant to which we have been granted a non-exclusive license to use the “TPG” name and logo, for a nominal fee, for so long as the Adviser or one of its affiliates remains our investment adviser. Other than with respect to this limited license, we have no legal right to the “TPG” name or logo.
The following is a graphical representation of the calculation of the income-related portion of the Incentive Fee:
Quarterly Incentive Fee Based on Net Investment Income
Pre-Incentive Fee Net Investment Income (expressed as a percentage of the value of net assets)
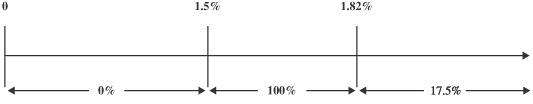
Percentage of pre-Incentive Fee net investment income allocated to income-related portion of Incentive Fee
Examples of Quarterly Incentive Fee Calculation:
Example 1: Income Related Portion of Incentive Fee (*):
Alternative 1
Assumptions
Investment income (including interest, dividends, fees, etc.) = 2%
Hurdle rate (1) = 1.5%
Management Fee (2) = 0.375%
Other expenses (legal, accounting, custodian, transfer agent, etc.) (3) = 0.20%
Pre-Incentive Fee net investment income
(investment income – (Management Fee + other expenses)) = 1.425%
17
Pre-Incentive Fee net investment income does not exceed hurdle rate, therefore there is no Incentive Fee.
Alternative 2
Assumptions
Investment income (including interest, dividends, fees, etc.) = 2.375%
Hurdle rate (1) = 1.5%
Management Fee (2) = 0.375%
Other expenses (legal, accounting, custodian, transfer agent, etc.) (3) = 0.20%
Pre-Incentive Fee net investment income
(investment income – (Management Fee + other expenses)) = 1.8%
Incentive Fee = 100% × pre-Incentive Fee net investment income, subject to the “catch-up” (4)
= 100% × (1.8% – 1.5%)
= 0.3%
Alternative 3
Assumptions
Investment income (including interest, dividends, fees, etc.) = 3.5%
Hurdle rate (1) = 1.5%
Management Fee (2) = 0.375%
Other expenses (legal, accounting, custodian, transfer agent, etc.) (3) = 0.20%
Pre-Incentive Fee net investment income
(investment income – (Management Fee + other expenses)) = 2.925%
Incentive Fee = 17.5% × pre-Incentive Fee net investment income, subject to “catch-up” (4)
Incentive Fee = 100% × “catch-up” + (17.5% × (pre-Incentive Fee net investment income – 1.82%))
Catch-up = 1.82% – 1.5% = 0.32%
Incentive Fee = (100% × 0.32%) + (17.5% × (2.925% – 1.82%))
= 0.32% + (17.5% × 1.105%)
= 0.32% + 0.193%
= 0.513%
|
|
(1) |
Represents 6.0% annualized hurdle rate. |
|
|
(2) |
Represents 1.5% annualized Management Fee. For the purposes of these examples the Management Fee is assumed to be based on net assets, rather than gross assets. |
|
|
(3) |
Excludes organizational and offering expenses. |
|
|
(4) |
The “catch-up” provision is intended to provide the Adviser with an Incentive Fee of 17.5% on all of our pre-Incentive Fee net investment income as if a hurdle rate did not apply when our net investment income exceeds 1.5% in any calendar quarter and is not applied once the Adviser has received 17.5% of investment income in a quarter. The “catch-up” portion of our pre-Incentive Fee Net Investment Income is the portion that exceeds the 1.5% hurdle rate but is less than or equal to approximately 1.82% (that is, 1.5% divided by (1 – 0.175)) in any fiscal quarter. |
|
|
(*) |
The hypothetical amount of pre-Incentive Fee net investment income shown is based on a percentage of total net assets. |
Example 2: Capital Gains Portion of Incentive Fee:
Assumptions
|
|
• |
Year 1: $10 million investment made in Company A (“Investment A”), $10 million investment made in Company B (“Investment B”), $10 million investment made in Company C (“Investment C”), $10 million investment made in Company D (“Investment D”) and $10 million investment made in Company E (“Investment E”). |
|
|
• |
Year 2: Investment A sold for $20 million, fair market value (“FMV”) of Investment B determined to be $8 million, FMV of Investment C determined to be $12 million, and FMV of Investments D and E each determined to be $10 million. |
|
|
• |
Year 3: IPO of the Company occurs. At IPO, FMV of Investment of B determined to be $8 million, FMV of Investment C determined to be $14 million, FMV of Investment D determined to be $14 million and FMV of Investment E determined to be $16 million. |
18
|
|
• |
Year 5: Investment C sold for $20 million, FMV of Investment B determined to be $14 million, FMV of Investment E determined to be $10 million and FMV of Investment F determined to $12 million. |
|
|
• |
Year 6: Investment B sold for $16 million, FMV of Investment E determined to be $8 million and FMV of Investment F determined to be $15 million. |
|
|
• |
Year 7: Investment E sold for $8 million and FMV of Investment F determined to be $17 million. |
|
|
• |
Year 8: Investment F sold for $18 million. |
These assumptions are summarized in the following chart:
|
|
|
|
|
|
|
|
|
|
|
|
|
|
|
Cumulative |
|
Cumulative |
|
Cumulative |
|
|
|
|
|
|
|
|
|
|
|
|
|
|
|
Unrealized |
|
Realized |
|
Realized |
|
|
|
Investment |
|
Investment |
|
Investment |
|
Investment |
|
Investment |
|
Investment |
|
Capital |
|
Capital |
|
Capital |
|
|
|
A |
|
B |
|
C |
|
D |
|
E |
|
F |
|
Depreciation |
|
Losses |
|
Gains |
|
Year 1 |
|
$10 million (cost basis) |
|
$10 million (cost basis) |
|
$10 million (cost basis) |
|
$10 million (cost basis) |
|
$10 million (cost basis) |
|
— |
|
— |
|
— |
|
— |
|
Year 2 |
|
$20 million (sale price) |
|
$8 million FMV |
|
$12 million FMV |
|
$10 million FMV |
|
$10 million FMV |
|
— |
|
$2 million |
|
— |
|
$10 million |
|
Year 3 (IPO) |
|
— |
|
$8 million FMV at IPO |
|
$14 million FMV at IPO |
|
$14 million FMV at IPO |
|
$16 million FMV at IPO |
|
— |
|
$2 million |
|
— |
|
$10 million |
|
Year 4 |
|
— |
|
$10 million FMV |
|
$16 million FMV |
|
$12 million (sale price) |
|
$14 million FMV |
|
$10 million (cost basis) |
|
— |
|
— |
|
$12 million |
|
Year 5 |
|
— |
|
$14 million FMV |
|
$20 million (sale price) |
|
— |
|
$10 million FMV |
|
$12 million FMV |
|
— |
|
— |
|
$22 million |
|
Year 6 |
|
— |
|
$16 million (sale price) |
|
— |
|
— |
|
$8 million FMV |
|
$15 million FMV |
|
$2 million |
|
— |
|
$28 million |
|
Year 7 |
|
— |
|
— |
|
— |
|
— |
|
$8 million (sale price) |
|
$17 million FMV |
|
— |
|
$2 million |
|
$28 million |
|
Year 8 |
|
— |
|
— |
|
— |
|
— |
|
— |
|
$18 million (sale price) |
|
— |
|
$2 million |
|
$36 million |
The capital gains portion of the Incentive Fee would be:
|
|
• |
Year 1: None |
|
|
• |
Year 2: |
Capital Gains Fee = 15% multiplied by ($10 million realized capital gains on sale of Investment A less $2 million cumulative capital depreciation) = $1.2 million
|
|
• |
Year 3: |
Capital Gains Fee = (Weighted Percentage multiplied by ($10 million cumulative realized capital gains less $2 million cumulative capital depreciation)) less $1.2 million cumulative Capital Gains Fee previously paid = $1.2 million less $1.2 million = $0.00
Weighted Percentage = (15% multiplied by ($10 million Pre-IPO Gain Amount divided by $10 million Total Gain Amount )) plus (17.5% multiplied by ($0 Post-IPO Gain Amount divided by $10 million Total Gain Amount)) = 15%
|
|
• |
Year 4: |
Capital Gains Fee = (Weighted Percentage multiplied by ($12 million cumulative realized capital gains)) less $1.2 million cumulative Capital Gains Fee previously paid = $1.8 million less $1.2 million = $0.6 million
Weighted Percentage = (15% multiplied by ($12 million Pre-IPO Gain Amount divided by $12 million Total Gain Amount)) plus (17.5% multiplied by ($0 Post-IPO Gain Amount divided by $12 million Total Gain Amount)) = 15%
19
Capital Gains Fee = (Weighted Percentage multiplied by ($22 million cumulative realized capital gains)) less $1.8 million cumulative Capital Gains Fee previously paid = $3.45 million less $1.8 million = $1.65 million
Weighted Percentage = (15% multiplied by ($16 million Pre-IPO Gain Amount divided by $22 million Total Gain Amount)) plus (17.5% multiplied by ($6 million Post-IPO Gain Amount divided by $22 million Total Gain Amount)) = 15.68%
|
|
• |
Year 6: |
Capital Gains Fee = (Weighted Percentage multiplied by ($28 million cumulative realized capital gains less $2 million cumulative capital depreciation)) less $3.45 million cumulative Capital Gains Fee previously paid = $4.18 million less $3.45 million = $0.73 million
Weighted Percentage = (15% multiplied by ($16 million Pre-IPO Gain Amount divided by $28 million Total Gain Amount)) plus (17.5% multiplied by ($12 million Post-IPO Gain Amount divided by $28 million Total Gain Amount)) = 16.07%
|
|
• |
Year 7: |
Capital Gains Fee = (Weighted Percentage multiplied by ($28 million cumulative realized capital gains less $2 million cumulative realized capital losses)) less $4.18 million cumulative Capital Gains Fee previously paid = $4.18 million less $4.18 million = $0.00
Weighted Percentage = (15% multiplied by ($16 million Pre-IPO Gain Amount divided by $28 million Total Gain Amount)) plus (17.5% multiplied by ($12 million Post-IPO Gain Amount divided by $28 million Total Gain Amount)) = 16.07%
|
|
• |
Year 8: |
Capital Gains Fee = (Weighted Percentage multiplied by ($36 million cumulative realized capital gains less $2 million cumulative realized capital losses)) less $4.18 million cumulative Capital Gains Fee previously paid = $5.57 million less $4.18 million = $1.39 million
Weighted Percentage = (15% multiplied by ($16 million Pre-IPO Gain Amount divided by $36 million Total Gain Amount)) plus (17.5% multiplied by ($20 million Post-IPO Gain Amount divided by $36 million Total Gain Amount)) = 16.39%
Payment of Our Expenses
The costs associated with the Investment Team and staff of the Adviser, when and to the extent engaged in providing us investment advisory and management services are paid for by the Adviser. We bear all other costs and expenses of our operations, administration and transactions, including those relating to:
|
|
• |
calculating individual asset values and our net asset value (including the cost and expenses of any independent valuation firms); |
|
|
• |
expenses, including travel expenses, incurred by the Adviser, or members of our Investment Team, or payable to third parties, in respect of due diligence on prospective portfolio companies and, if necessary, in respect of enforcing our rights with respect to investments in existing portfolio companies; |
|
|
• |
the costs of any public offerings of our common stock and other securities, including registration and listing fees; |
|
|
• |
the Management Fee and any Incentive Fee; |
|
|
• |
certain costs and expenses relating to distributions paid on our shares; |
|
|
• |
administration fees payable under our Administration Agreement; |
|
|
• |
debt service and other costs of borrowings or other financing arrangements; |
|
|
• |
the Adviser’s allocable share of costs incurred in providing significant managerial assistance to those portfolio companies that request it; |
|
|
• |
amounts payable to third parties relating to, or associated with, making or holding investments; |
|
|
• |
transfer agent and custodial fees; |
|
|
• |
costs of hedging; |
|
|
• |
commissions and other compensation payable to brokers or dealers; |
|
|
• |
taxes; |
20
|
|
• |
costs of preparing financial statements and maintaining books and records and filing reports or other documents with the SEC (or other regulatory bodies) and other reporting and compliance costs, and the compensation of professionals responsible for the preparation of the foregoing, including the allocable portion of the compensation of our Chief Financial Officer, Chief Compliance Officer and other professionals who spend time on those related activities (based on the percentage of time those individuals devote, on an estimated basis, to our business and affairs); |
|
|
• |
the costs of any reports, proxy statements or other notices to our stockholders (including printing and mailing costs), the costs of any stockholders’ meetings and the compensation of investor relations personnel responsible for the preparation of the foregoing and related matters; |
|
|
• |
our fidelity bond; |
|
|
• |
directors and officers/errors and omissions liability insurance, and any other insurance premiums; |
|
|
• |
indemnification payments; |
|
|
• |
direct costs and expenses of administration, including audit, accounting, consulting and legal costs; and |
|
|
• |
all other expenses reasonably incurred by us in connection with making investments and administering our business. |
In addition, from time to time, the Adviser pays amounts owed by us to third-party providers of goods or services, including the Board. We subsequently reimburse the Adviser for those amounts paid on our behalf. Amounts payable to the Adviser are settled in the normal course of business without formal payment terms. We also reimburse the Adviser for the allocable portion of the compensation paid by the Adviser or its affiliates to our Chief Compliance Officer, Chief Financial Officer, and other professionals who spend time on those related activities (based on the percentage of time those individuals devote, on an estimated basis, to our business and affairs).
Duration and Termination
Unless earlier terminated as described below, both the Investment Advisory Agreement and the Administration Agreement will remain in effect until November 2020, and each may be extended subject to required approvals. Each agreement will remain in effect from year to year thereafter if approved annually by our Board or by the affirmative vote of the holders of a majority of our outstanding voting securities, and, in either case, if also approved by a majority of the directors of the Board who are not “interested persons” of us, the Adviser or any of our or its respective affiliates, as defined in the 1940 Act (known as Independent Directors). The Investment Advisory Agreement automatically terminates in the event of its assignment, as defined in the 1940 Act, by the Adviser. Each agreement may be terminated by either party without penalty on 60 days’ written notice to the other party. The holders of a majority of our outstanding voting securities may also terminate each agreement without penalty on 60 days’ written notice. See “ITEM 1A. RISK FACTORS—Risks Related to Our Business and Structure—We are dependent upon management personnel of the Adviser, TSSP, and their affiliates for our future success.”
Indemnification
The Investment Advisory Agreement and the Administration Agreement provide that the Adviser and its members, managers, officers, employees, agents, controlling persons and any other person or entity affiliated with it shall not be liable to us for any action taken or omitted to be taken by the Adviser in connection with the performance of any of its duties or obligations under the Investment Advisory Agreement, the Administration Agreement or otherwise as an investment adviser of ours (except to the extent specified in Section 36(b) of the 1940 Act concerning loss resulting from a breach of fiduciary duty (as the same is finally determined by judicial proceedings) with respect to the receipt of compensation for services). We will, to the fullest extent permitted by law, provide indemnification and the right to the advancement of expenses, to each person who was or is made a party or is threatened to be made a party to or is involved (including, without limitation, as a witness) in any actual or threatened action, suit or proceeding, whether civil, criminal, administrative or investigative, because he or she is or was a member, manager, officer, employee, agent, controlling person or any other person or entity affiliated with the Adviser, including without limitation the Administrator, or is or was a member of the Adviser’s Investment Review Committee, on the same general terms set forth in our certificate of incorporation. Our obligation to provide indemnification and advancement of expenses is subject to the requirements of the 1940 Act and Investment Company Act Release No. 11330, which, among other things, preclude indemnification for any liability (whether or not there is an adjudication of liability or the matter has been settled) arising by reason of willful misfeasance, bad faith, gross negligence, or reckless disregard of duties, and require reasonable and fair means for determining whether indemnification will be made.
21
Board Approval of the Investment Advisory Agreement
Our Board, including our Independent Directors, and holders of a majority of our outstanding securities, approved our Investment Advisory Agreement in December 2011. Our Board, including a majority of the Independent Directors, renewed the Investment Advisory Agreement in November 2019. In its consideration of the Investment Advisory Agreement at the time of approval and renewal, the Board focused on information it had received relating to, among other things:
|
|
• |
the nature, quality and extent of the advisory and other services to be provided to us by the Adviser; |
|
|
• |
our investment and financial performance on a standalone basis and against a comparative universe of peers; |
|
|
• |
the extent to which economies of scale would be realized as we grow, and whether the fees payable under the Investment Advisory Agreement reflect these economies of scale for the benefit of our stockholders; |
|
|
• |
comparative data with respect to advisory fees or similar expenses paid by other BDCs with similar investment objectives; |
|
|
• |
our expense ratio compared to BDCs with similar investment objectives; |
|
|
• |
any existing and potential sources of indirect income to the Adviser from its relationships with us and the profitability of those income sources; |
|
|
• |
information about the services to be performed and the personnel performing those services under the Investment Advisory Agreement; |
|
|
• |
the organizational and functional capabilities and financial condition of the Adviser and its respective affiliates; and |
|
|
• |
the possibility of obtaining similar services from other third-party service providers or through an internally managed structure. |
The Board also takes into consideration the reimbursement of expenses incurred by the Adviser on our behalf, which expenses include travel expenses, when determining whether to approve renewal of the Investment Advisory Agreement and the Administration Agreement. No one factor was given greater weight than any others, but rather the Board considered all factors collectively as a whole.
Based on the information reviewed and the discussion thereof, the Board, including a majority of the Independent Directors, concluded that the investment advisory fee rates are reasonable in relation to the services to be provided.
Regulation as a Business Development Company
We are regulated as a BDC under the 1940 Act. A BDC must be organized in the United States for the purpose of investing in or lending to primarily private companies and making significant managerial assistance available to them. A BDC may use capital provided by public stockholders and from other sources to make long-term, private investments in businesses.
As with other companies regulated by the 1940 Act, a BDC must adhere to certain substantive regulatory requirements. A majority of our directors must be persons who are not “interested persons,” as that term is defined in the 1940 Act. Additionally, we are required to provide and maintain a bond issued by a reputable fidelity insurance company to protect us against larceny and embezzlement. Furthermore, as a BDC, we are prohibited from protecting any director or officer against any liability to us or our stockholders arising from willful misfeasance, bad faith, gross negligence or reckless disregard of the duties involved in the conduct of such person’s office.
As a BDC, we are permitted, under specified conditions, to issue multiple classes of indebtedness and one class of shares senior to our common stock if our asset coverage, as defined in the 1940 Act, is at least equal to 150% immediately after any borrowing or issuance (prior to October 9, 2018, our minimum asset coverage requirement was 200%). See “—Senior Securities” for more information. In addition, while any preferred stock or publicly traded debt securities are outstanding, we may be prohibited from making distributions to our stockholders or repurchasing securities or shares unless we meet the applicable asset coverage ratio at the time of the distribution or repurchase. We may also borrow amounts up to 5% of the value of our total assets for temporary or emergency purposes without regard to asset coverage. For a discussion of the risks associated with leverage, see “ITEM 1A. RISK FACTORS—Risks Related to Our Business and Structure—We borrow money, which magnifies the potential for gain or loss and increases the risk of investing in us.” As of December 31, 2019 and 2018, our asset coverage was 200.4% and 270.5% respectively.
We may not change the nature of our business so as to cease to be, or withdraw our election as, a BDC unless authorized by vote of a majority of the outstanding voting securities, as required by the 1940 Act. A majority of the outstanding voting securities of a company is defined under the 1940 Act as the lesser of: (a) 67% or more of such company’s voting securities present at a meeting if more than 50% of the outstanding voting securities of such company are present or represented by proxy, and (b) more than 50% of the outstanding voting securities of such company.
22
We do not anticipate any substantial change in the nature of our business.
We do not intend to acquire securities issued by any investment company that exceed the limits imposed by the 1940 Act. Under these limits, except for registered money market funds, we generally cannot acquire more than 3% of the voting stock of any investment company, invest more than 5% of the value of our total assets in the securities of one investment company or invest more than 10% of the value of our total assets in the securities of investment companies in the aggregate. The portion of our portfolio invested in securities issued by investment companies ordinarily will subject our stockholders to additional expenses. Our investment portfolio is also subject to diversification requirements by virtue of our status as a RIC for U.S. federal income tax purposes. See “—Regulated Investment Company Classification” for more information.
In addition, investment companies registered under the 1940 Act and private funds that are excluded from the definition of “investment company” pursuant to either Section 3(c)(1) or 3(c)(7) of the 1940 Act may not acquire directly or through a controlled entity more than 3% of our total outstanding voting stock (measured at the time of the acquisition), unless the funds comply with an exemption under the 1940 Act. As a result, certain of our investors may hold a smaller position in our shares than if they were not subject to these restrictions.
We are generally not able to issue and sell our common stock at a price below net asset value per share. See “ITEM 1A. RISK FACTORS—Risks Related to Our Business and Structure—Regulations governing our operation as a BDC affect our ability to, and the way in which we, raise additional capital.” We may, however, elect to issue and sell our common stock, or warrants, options or rights to acquire our common stock, at a price below the then-current net asset value of our common stock if our Board determines that the sale is in our best interests and the best interests of our stockholders, and our stockholders have approved our policy and practice of making these sales within the preceding 12 months. Pursuant to approval granted at a special meeting of stockholders held on June 14, 2019, we are currently permitted to sell or otherwise issue shares of our common stock at a price below our then-current net asset value per share, subject to the approval of our Board and certain other conditions. Such stockholder approval expires on June 14, 2020. We may in the future seek such approval again; however, there is no assurance such approval will be obtained. In this case, the price at which our securities are to be issued and sold may not be less than a price that, in the determination of our Board, closely approximates the market value of such securities. In addition, we may generally issue new common stock at a price below net asset value in rights offerings to existing stockholders, in payment of dividends and in certain other limited circumstances.
We are subject to periodic examination by the SEC for compliance with the 1940 Act.
As a BDC, we are subject to certain risks and uncertainties. See “ITEM 1A. RISK FACTORS—Risks Related to Our Business and Structure.”
Transactions with our Affiliates
We may also be prohibited under the 1940 Act from knowingly participating in certain transactions with our affiliates, including our officers, directors, investment adviser, and principal underwriters, and certain of their affiliates, without the prior approval of the members of our Board who are not interested persons and, in some cases, prior approval by the SEC through an exemptive order (other than in certain limited situations pursuant to current regulatory guidance).
On December 16, 2014, we were granted an exemptive order from the SEC that allows us to co-invest, subject to certain conditions and to the extent the size of an investment opportunity exceeds the amount our Adviser has independently determined is appropriate for us to invest, with certain of our affiliates (including affiliates of TSSP) in middle-market loan origination activities for companies domiciled in the United States and certain “follow-on” investments in companies in which we have already co-invested pursuant to the order and remain invested. On January 16, 2020, we filed a further application for co-investment exemptive relief with the SEC to better align our existing co-investment relief with more recent SEC exemptive orders. There can be no assurance when or if the SEC will grant a further order in response to our application. Until such time a new order is granted, we will continue to operate under the terms of our current exemptive order.
We believe our ability to co-invest with TSSP affiliates is particularly useful where we identify larger capital commitments than otherwise would be appropriate for us. We expect that with the ability to co-invest with TSSP affiliates we will continue to be able to provide “one-stop” financing to a potential portfolio company in these circumstances, which may allow us to capture opportunities where we alone could not commit the full amount of required capital or would have to spend additional time to locate unaffiliated co-investors.
23
Further, in accordance with the exemptive order, we have undertaken that, in connection with any commitment to a co-investment or follow-on investment, a “required majority” (as defined in Section 57(o) of the 1940 Act) of Independent Directors must make certain conclusions, including that:
|
|
• |
the terms of the proposed transaction (including the consideration to be paid) are reasonable and fair to us and our stockholders and do not involve overreaching of us or our stockholders on the part of any person concerned; |
|
|
• |
the transaction is consistent with the interests of our stockholders and our investment strategies and policies; |
|
|
• |
the investment by our affiliate would not disadvantage us, and our participation is not on a basis different from or less advantageous than that of our affiliate; and |
|
|
• |
our investment will not benefit any affiliate other than the affiliate participating in the investment, and as otherwise permitted by the order. |
See “ITEM 13. CERTAIN RELATIONSHIPS AND RELATED TRANSACTIONS, AND DIRECTOR INDEPENDENCE.”
Qualifying Assets
Under the 1940 Act, a BDC may not acquire any assets other than assets of the type listed in Section 55(a) of the 1940 Act, which are referred to as qualifying assets, unless, at the time the acquisition is made, qualifying assets represent at least 70% of the company’s total assets. The principal categories of qualifying assets relevant to our business are the following:
|
|
• |
Securities purchased in transactions not involving any public offering from the issuer of such securities, which issuer (subject to certain limited exceptions) is an eligible portfolio company, or from any person who is, or has been during the preceding 13 months, an affiliated person of an eligible portfolio company, or from any other person, subject to such rules as may be prescribed by the SEC. An eligible portfolio company is defined in the 1940 Act as any issuer which: |
|
|
• |
is organized under the laws of, and has its principal place of business in, the United States; |
|
|
• |
is not an investment company (other than a small business investment company wholly owned by us) or a company that would be an investment company but for certain exclusions under the 1940 Act; and |
|
|
• |
satisfies any of the following: |
|
|
• |
has an equity market capitalization of less than $250 million or does not have any class of securities listed on a national securities exchange; |
|
|
• |
is controlled by a BDC or a group of companies including a BDC, the BDC actually exercises a controlling influence over the management or policies of the eligible portfolio company, and, as a result thereof, the BDC has an affiliated person who is a director of the eligible portfolio company; or |
|
|
• |
is a small and solvent company having total assets of not more than $4 million and capital and surplus of not less than $2 million. |
|
|
• |
Securities of any eligible portfolio company that we control. |
|
|
• |
Securities purchased in a private transaction from a U.S. issuer that is not an investment company or from an affiliated person of the issuer, or in transactions incident thereto, if the issuer is in bankruptcy and subject to reorganization or if the issuer, immediately prior to the purchase of its securities was unable to meet its obligations as they came due without material assistance other than conventional lending or financing arrangements. |
|
|
• |
Securities of an eligible portfolio company purchased from any person in a private transaction if there is no ready market for such securities and we already own 60% of the outstanding equity of the eligible portfolio company. |
|
|
• |
Securities received in exchange for or distributed on or with respect to securities described above, or pursuant to the exercise of warrants or rights relating to such securities. |
|
|
• |
Cash, cash equivalents, U.S. Government securities or high-quality debt securities maturing in one year or less from the time of investment. |
Pending investment in other types of “qualifying assets,” as described above, our investments may consist of cash, cash equivalents, U.S. Government securities or high-quality debt securities maturing in one year or less from the time of investment, which we refer to, collectively, as temporary investments, such that at least 70% of our assets are qualifying assets.
24
Managerial Assistance to Portfolio Companies
A BDC must be operated for the purpose of making investments in the types of securities described under “Qualifying Assets” above. However, to count portfolio securities as qualifying assets for the purpose of the 70% test, the BDC must offer to make available to the issuer of the securities (other than small and solvent companies described above) significant managerial assistance; except that, where the BDC purchases such securities in conjunction with one or more other persons acting together, the BDC will satisfy this test if one of the other persons in the group makes available such managerial assistance. Making available managerial assistance means, among other things, either controlling the issuer of the securities or any arrangement whereby the BDC, through its directors, officers or employees, offers to provide, and, if accepted, does in fact provide, significant guidance and counsel concerning the management, operations or business objectives and policies of a portfolio company.
Senior Securities
Under the 1940 Act, a BDC generally is not permitted to incur borrowings, issue debt securities or issue preferred stock unless immediately after the borrowing or issuance the ratio of total assets (less total liabilities other than indebtedness) to total indebtedness plus preferred stock is at least 200%. However, under the Small Business Credit Availability Act ("SBCAA"), which became law in March 2018, BDCs have the ability to elect to become subject to a lower asset coverage requirement of 150%, subject to the receipt of the requisite board or stockholder approvals under the SBCAA and satisfaction of certain other conditions.
On October 8, 2018, our stockholders approved the application of the minimum asset coverage ratio of 150% to us, as set forth in Section 61(a)(2) of the 1940 Act, as amended by the SBCAA. As a result and subject to certain additional disclosure requirements, as of October 9, 2018, our minimum asset coverage ratio was reduced from 200% to 150%. In other words, pursuant to Section 61(a) of the 1940 Act, as amended by the SBCAA, we are permitted to potentially increase our maximum debt-to-equity ratio from an effective level of one-to-one to two-to-one.
We are permitted, under specified conditions, to issue multiple classes of indebtedness and one class of shares senior to our common stock if our asset coverage, as defined in the 1940 Act, is at least equal to 150% immediately after any borrowing or issuance. In addition, while any preferred stock or publicly-traded debt securities are outstanding, we may be prohibited from making distributions to our stockholders or repurchasing securities or shares unless we meet the applicable asset coverage ratio at the time of the distribution or repurchase. We may also borrow amounts up to 5% of the value of our total assets for temporary or emergency purposes without regard to asset coverage.
The 1940 Act imposes limitations on a BDC’s issuance of preferred stock, which is considered a “senior security” and thus is subject to the 150% asset coverage requirement described above.
As of December 31, 2019 and 2018, our asset coverage was 200.4% and 270.5% respectively.
Code of Ethics
As required by the Advisers Act and the 1940 Act, we and the Adviser have adopted codes of ethics which apply to, among others, our and our Adviser’s executive officers, including our Chief Executive Officer and Chief Financial Officer, as well as our Adviser’s officers, directors and employees. The codes of ethics establish procedures for personal investments and restrict certain personal securities transactions. Personnel subject to the codes may invest in securities for their personal investment accounts, including securities that may be purchased or held by us, so long as such investments are made in accordance with the codes’ requirements. There have been no material changes to the codes or material waivers of the codes that apply to our Chief Executive Officer or Chief Financial Officer.
Compliance Policies and Procedures
We and our Adviser have adopted and implemented written policies and procedures reasonably designed to detect and prevent violation of the federal securities laws and we are required to review these compliance policies and procedures annually for their adequacy and the effectiveness of their implementation and designate a Chief Compliance Officer to be responsible for administering the policies and procedures.
25
The Sarbanes-Oxley Act of 2002 imposes a wide variety of regulatory requirements on certain publicly held companies and their insiders. Assuming certain requirements are met, many of these requirements affect us. For example:
|
|
• |
pursuant to Rule 13a-14 of the Exchange Act, our Chief Executive Officer and Chief Financial Officer certify the accuracy of the financial statements contained in our periodic reports; |
|
|
• |
pursuant to Item 307 of Regulation S-K, our periodic reports disclose our conclusions about the effectiveness of our disclosure controls and procedures; |
|
|
• |
pursuant to Rule 13a-15 of the Exchange Act, subject to certain assumptions, our management is required to prepare an annual report regarding its assessment of our internal control over financial reporting, which is required to be audited by our independent registered public accounting firm; and |
|
|
• |
pursuant to Item 308 of Regulation S-K and Rule 13a-15 of the Exchange Act, our periodic reports disclose whether there were significant changes in our internal controls over financial reporting or in other factors that could significantly affect these controls subsequent to the date of their evaluation, including any corrective actions with regard to significant deficiencies and material weaknesses. |
The Sarbanes-Oxley Act requires us to review our policies and procedures to determine whether we comply with the Sarbanes-Oxley Act and the regulations promulgated thereunder. We continue to monitor our compliance with all regulations that are adopted under the Sarbanes-Oxley Act and take actions necessary to ensure that we are in compliance therewith.
The NYSE Corporate Governance Rules
The NYSE has adopted corporate governance rules that listed companies must comply with. We believe we are in compliance with these rules.
Proxy Voting Policies and Procedures
We delegate our proxy voting responsibility to our Adviser. The Proxy Voting Policies and Procedures of our Adviser are set forth below. The guidelines are reviewed periodically by the Adviser and our Independent Directors, and, accordingly, are subject to change.
An investment adviser registered under the Advisers Act has a fiduciary duty to act solely in the best interests of its clients. As part of this duty, the Adviser recognizes that it must vote client securities in a timely manner free of conflicts of interest and in the best interests of its clients. These policies and procedures for voting proxies for the Adviser’s investment advisory clients are intended to comply with Section 206 of, and Rule 206(4)-6 under, the Advisers Act.
The Adviser will vote all proxies based upon the guiding principle of seeking the maximization of the ultimate long-term economic value of our stockholders’ holdings, and ultimately all votes are cast on a case-by-case basis, taking into consideration the contractual obligations under the relevant advisory agreements or comparable documents, and all other relevant facts and circumstances at the time of the vote. All proxy voting decisions will require a mandatory conflicts of interest review by our Chief Compliance Officer in accordance with these policies and procedures, which will include consideration of whether the Adviser or any investment professional or other person recommending how to vote the proxy has an interest in how the proxy is voted that may present a conflict of interest. It is the Adviser’s general policy to vote or give consent on all matters presented to security holders in any proxy, and these policies and procedures have been designed with that in mind. However, the Adviser reserves the right to abstain on any particular vote or otherwise withhold its vote or consent on any matter if, in the judgment of our Chief Compliance Officer or the relevant investment professional(s), the costs associated with voting such proxy outweigh the benefits to our stockholders or if the circumstances make such an abstention or withholding otherwise advisable and in the best interest of the relevant stockholder(s).
Privacy Principles
We are committed to maintaining the confidentiality, integrity and security of nonpublic personal information relating to investors. The following information is provided to help investors understand what personal information we collect, how we protect that information and why, in certain cases, we may share information with select other parties.
We generally will not receive any nonpublic personal information relating to stockholders who purchase common stock. We may collect nonpublic personal information regarding certain investors from sources such as subscription agreements, investor questionnaires and other forms; individual investors’ account histories; and correspondence between us and individual investors. We
26
may share information that we collect regarding an investor with our affiliates and the employees of such affiliates for legitimate business purposes, for example, to service the investor’s accounts or provide the investor with information about other products and services offered by us or our affiliates that may be of interest to the investor. In addition, we may disclose information that we collect regarding investors to third parties who are not affiliated with us (i) as authorized by our investors in investor subscription agreements or our organizational documents; (ii) as required by law or in connection with regulatory or law enforcement inquiries; or, (iii) as otherwise permitted by law to the extent necessary to effect, administer or enforce investor transactions or our transactions.
Any party that receives nonpublic personal information relating to investors from us is permitted to use the information only for legitimate business purposes or as otherwise required or permitted by applicable law or regulation. In this regard, our officers, employees and agents and those of our affiliates, access to such information is restricted to those who need such access to provide services to us and our investors. We maintain physical, electronic and procedural safeguards to seek to guard investor nonpublic personal information.
Reporting Obligations
We will furnish our stockholders with annual reports containing audited financial statements, quarterly reports, and such other periodic reports, as we determine to be appropriate or as may be required by law. We are required to comply with all periodic reporting, proxy solicitation and other applicable requirements under the Exchange Act.
We make available on our website (www.tpgspecialtylending.com) our proxy statements, our annual reports on Form 10-K, quarterly reports on Form 10-Q and our current reports on Form 8-K that we file with the SEC.
The SEC also maintains a website (www.sec.gov) that contains this information.
Regulated Investment Company Classification
As a BDC, we have elected to be treated as a RIC for U.S. federal income tax purposes.
To maintain our status as a RIC, we must, among other things:
|
|
• |
maintain our election under the 1940 Act to be treated as a BDC; |
|
|
• |
derive in each taxable year at least 90% of our gross income from dividends, interest, gains from the sale or other disposition of stock or securities and other specified categories of investment income; and |
|
|
• |
maintain diversified holdings so that, subject to certain exceptions and cure periods, at the end of each quarter of our taxable year: |
|
|
• |
at least 50% of the value of our total gross assets is represented by cash and cash items, U.S. government securities, the securities of other RICs and “other securities,” provided that such “other securities” shall not include any amount of any one issuer, if our holdings of such issuer are greater in value than 5% of our total assets or greater than 10% of the outstanding voting securities of such issuer, and |
|
|
• |
no more than 25% of the value of our assets may be invested in securities of any one issuer, the securities of any two or more issuers that are controlled by us and are engaged in the same or similar or related trades or businesses (excluding U.S. government securities and securities of other RICs), or the securities of one or more “qualified publicly traded partnerships.” |
To maintain our status as a RIC, we must distribute (or be treated as distributing) in each taxable year dividends for tax purposes of an amount equal to at least 90% of our investment company taxable income (which includes, among other items, dividends, interest, the excess of any net short-term capital gains over net long-term capital losses, as well as other taxable income, excluding any net capital gains reduced by deductible expenses) and 90% of our net tax-exempt income for that taxable year. As a RIC, we generally will not be subject to corporate-level U.S. federal income tax on our investment company taxable income and net capital gains that we distribute to stockholders. In addition, to avoid the imposition of a nondeductible 4% U.S. federal excise tax, we must distribute (or be treated as distributing) in each calendar year an amount at least equal to the sum of:
|
|
• |
98% of our net ordinary income, excluding certain ordinary gains and losses, recognized during a calendar year; |
|
|
• |
98.2% of our capital gain net income, adjusted for certain ordinary gains and losses, recognized for the twelve-month period ending on October 31 of such calendar year; and |
|
|
• |
100% of any income or gains recognized, but not distributed, in preceding years. |
27
We have previously incurred, and can be expected to incur in the future, such excise tax on a portion of our income and gains. While we intend to distribute income and capital gains to minimize exposure to the 4% excise tax, we may not be able to, or may choose not to, distribute amounts sufficient to avoid the imposition of the tax entirely. In that event, we will be liable for the tax only on the amount by which we do not meet the foregoing distribution requirement.
We generally expect to distribute substantially all of our earnings on a quarterly basis, but will reinvest dividends on behalf of those investors that do not elect to receive their dividends in cash. See “—Dividend Policy” and “—Dividend Reinvestment Plan” for a description of our dividend policy and obligations. One or more of the considerations described below, however, could result in the deferral of dividend distributions until the end of the fiscal year:
|
|
• |
We may make investments that are subject to tax rules that require us to include amounts in our income before we receive cash corresponding to that income or that defer or limit our ability to claim the benefit of deductions or losses. For example, if we acquire securities issued with original issue discount, that original issue discount may be accrued in income before we receive any corresponding cash payments. |
|
|
• |
In cases where our taxable income exceeds our available cash flow, we will need to fund distributions with the proceeds of sale of securities or with borrowed money, and may raise funds for this purpose opportunistically over the course of the year. |
In certain circumstances (e.g., where we are required to recognize income before or without receiving cash representing such income), we may have difficulty making distributions in the amounts necessary to satisfy the requirements for maintaining RIC status and for avoiding U.S. federal income and excise taxes. Accordingly, we may have to sell investments at times we would not otherwise consider advantageous, raise additional debt or equity capital or reduce new investment originations to meet these distribution requirements. If we are not able to obtain cash from other sources, we may fail to qualify as a RIC and thereby be subject to corporate-level U.S. federal income tax.
If in any particular taxable year, we do not qualify as a RIC, all of our taxable income (including our net capital gains) will be subject to tax at regular corporate rates without any deduction for distributions to stockholders, and distributions will be taxable to our stockholders as ordinary dividends to the extent of our current or accumulated earnings and profits, and distributions would not be required. Distributions in excess of our current and accumulated earnings and profits would be treated first as a return of capital to the extent of the stockholder’s tax basis, and any remaining distributions would be treated as capital gain. If we fail to qualify as a RIC for a period greater than two consecutive taxable years, to qualify as a RIC in a subsequent year we may be subject to regular corporate tax on any net built-in gains with respect to certain of our assets (that is, the excess of the aggregate gains, including items of income, over aggregate losses that would have been realized with respect to such assets if we had sold the property at fair market value at the end of the taxable year) that we elect to recognize on requalification or when recognized over the next five years.
In the event we invest in foreign securities, we may be subject to withholding and other foreign taxes with respect to those securities. We do not expect to satisfy the conditions necessary to pass through to our stockholders their share of the foreign taxes paid by us.
Investing in our securities involves a number of significant risks. Before you invest in our securities, you should be aware of various risks associated with the investment, including those described below. The risks set out below are not the only risks we face. Additional risks and uncertainties not presently known to us or not presently deemed material by us may also impair our operations and performance. If any of the following events occur, our business, financial condition and results of operations could be materially and adversely affected. In such case, our net asset value and the trading price of our securities could decline, and you may lose all or part of your investment.
Risks Related to Our Business and Structure
We are dependent upon management personnel of the Adviser, TSSP and their affiliates for our future success.
We depend on the experience, diligence, skill and network of business contacts of senior members of our Investment Team. Our Investment Team, together with other professionals at TSSP and its affiliates, identifies, evaluates, negotiates, structures, closes, monitors and manages our investments. Our success will depend to a significant extent on the continued service and coordination of the senior members of our Investment Team. The senior members of our Investment Team are not contractually restricted from leaving the Adviser. The departure of any of these key personnel, including members of our Adviser’s Investment Review Committee, could have a material adverse effect on us.
28
In addition, we cannot assure you that the Adviser will remain our investment adviser or that we will continue to have access to TSSP or its investment professionals. The Investment Advisory Agreement may be terminated by either party without penalty on 60 days’ written notice to the other party. The holders of a majority of our outstanding voting securities may also terminate the Investment Advisory Agreement without penalty on 60 days’ written notice.
Regulations governing our operation as a BDC affect our ability to, and the way in which we, raise additional capital.
The 1940 Act imposes numerous constraints on the operations of BDCs. See “ITEM 1. BUSINESS—Regulation as a Business Development Company” for a discussion of BDC limitations. For example, BDCs are required to invest at least 70% of their total assets in securities of nonpublic or thinly traded U.S. companies, cash, cash equivalents, U.S. government securities and other high-quality debt investments that mature in one year or less. These constraints may hinder the Adviser’s ability to take advantage of attractive investment opportunities and to achieve our investment objective.
We may need to periodically access the debt and equity capital markets to raise cash to fund new investments in excess of our repayments, and we may also need to access the capital markets to refinance existing debt obligations to the extent such maturing obligations are not repaid with availability under our revolving credit facilities or cash flows from operations.
Regulations governing our operation as a BDC affect our ability to raise additional capital, and the ways in which we can do so. Raising additional capital may expose us to risks, including the typical risks associated with leverage, and may result in dilution to our current stockholders. The 1940 Act limits our ability to incur borrowings and issue debt securities and preferred stock, which we refer to as senior securities, requiring that after any borrowing or issuance the ratio of total assets (less total liabilities other than indebtedness) to total indebtedness plus preferred stock, is at least 150%.
We may need to continue to borrow from financial institutions and issue additional securities to fund our growth. Unfavorable economic or capital market conditions may increase our funding costs, limit our access to the capital markets or could result in a decision by lenders not to extend credit to us. An inability to successfully access the capital markets may limit our ability to refinance our existing debt obligations as they come due and/or to fully execute our business strategy and could limit our ability to grow or cause us to have to shrink the size of our business, which could decrease our earnings, if any. Consequently, if the value of our assets declines or we are unable to access the capital markets we may be required to sell a portion of our investments and, depending on the nature of our leverage, repay a portion of our indebtedness at a time when this may be disadvantageous. Also, any amounts that we use to service our indebtedness would not be available for distributions to our common stockholders. If we borrow money or issue senior securities, we will be exposed to typical risks associated with leverage, including an increased risk of loss.
If we issue preferred stock, the preferred stock would rank senior to common stock in our capital structure. Preferred stockholders would have separate voting rights on certain matters and may have other rights, preferences or privileges more favorable than those of our common stockholders. The issuance of preferred stock could have the effect of delaying, deferring or preventing a transaction or a change of control that might involve a premium price for holders of our common stock or otherwise be in your best interest. Holders of our common stock will directly or indirectly bear all of the costs associated with offering and servicing any preferred stock that we issue. In addition, any interests of preferred stockholders may not necessarily align with the interests of holders of our common stock and the rights of holders of shares of preferred stock to receive dividends would be senior to those of holders of shares of our common stock.
Our Board may decide to issue additional common stock to finance our operations rather than issuing debt or other senior securities. However, we generally are not able to issue and sell our common stock at a price below net asset value per share. We may, however, elect to issue and sell our common stock, or warrants, options or rights to acquire our common stock, at a price below the then-current net asset value of our common stock if our Board determines that the sale is in our best interests and the best interests of our stockholders, and our stockholders have approved our policy and practice of making these sales within the preceding 12 months. Pursuant to approval granted at a special meeting of stockholders held on June 14, 2019, we are currently permitted to sell or otherwise issue shares of our common stock at a price below our then-current net asset value per share, subject to the approval of our Board and certain other conditions. Such stockholder approval expires on June 14, 2020. We may in the future seek such approval again; however, there is no assurance such approval will be obtained. In any such case, the price at which our securities are to be issued and sold may not be less than a price that, in the determination of our Board, closely approximates the market value of those securities (less any distribution commission or discount). In the event we sell shares of our common stock at a price below net asset value per share, existing stockholders will experience net asset value dilution. This dilution would occur as a result of the sale of shares at a price below the then current net asset value per share of our common stock and would cause a proportionately greater decrease in the stockholders’ interest in our earnings and assets and their voting interest in us than the increase in our assets resulting from such issuance. As a result of any such dilution, our market price per share may decline. Because the number of shares of common stock that could be so issued and the timing of any issuance is not currently known, the actual dilutive effect cannot be predicted.
29
In addition to issuing securities to raise capital as described above, we could securitize our investments to generate cash for funding new investments. To securitize our investments, we likely would create a wholly owned subsidiary, contribute a pool of loans to the subsidiary and have the subsidiary issue primarily investment grade debt securities to purchasers who we would expect would be willing to accept a substantially lower interest rate than the loans earn. We would retain all or a portion of the equity in the securitized pool of loans. Our retained equity would be exposed to any losses on the portfolio of investments before any of the debt securities would be exposed to the losses. An inability to successfully securitize our investment portfolio could limit our ability to grow or fully execute our business and could adversely affect our earnings, if any. The successful securitization of our investment could expose us to losses because the portions of the securitized investments that we would typically retain tend to be those that are riskier and more apt to generate losses. The 1940 Act also may impose restrictions on the structure of any securitization. In connection with any future securitization of investments, we may incur greater set-up and administration fees relating to such vehicles than we have in connection with financing of our investments in the past. See “—Risks Related to Our Portfolio Company Investments—We may securitize certain of our investments, which may subject us to certain structured financing risks.”
We borrow money, which magnifies the potential for gain or loss and increases the risk of investing in us.
As part of our business strategy, we borrow from and may in the future issue additional senior debt securities to banks, insurance companies and other lenders. Holders of these loans or senior securities would have fixed-dollar claims on our assets that have priority over the claims of our stockholders. If the value of our assets decreases, leverage will cause our net asset value to decline more sharply than it otherwise would have without leverage. Similarly, any decrease in our income would cause our net income to decline more sharply than it would have if we had not borrowed. This decline could negatively affect our ability to make dividend payments on our common stock. Our ability to service our borrowings depends largely on our financial performance and is subject to prevailing economic conditions and competitive pressures. In addition, the Management Fee is payable based on our gross assets, including cash and assets acquired through the use of leverage, which may give our Adviser an incentive to use leverage to make additional investments. See “—Risks Related to Our Business and Structure—Even in the event the value of your investment declines, the Management Fee and, in certain circumstances, the Incentive Fee will still be payable to the Adviser.” The amount of leverage that we employ will depend on our Adviser’s and our Board’s assessment of market and other factors at the time of any proposed borrowing. We cannot assure you that we will be able to obtain credit at all or on terms acceptable to us.
Our credit facilities and indentures governing our indebtedness also impose financial and operating covenants that restrict our business activities, remedies on default and similar matters. As of the date of this Annual Report, we are in compliance with the covenants of our credit facilities and indentures. However, our continued compliance with these covenants depends on many factors, some of which are beyond our control. Accordingly, although we believe we will continue to be in compliance, we cannot assure you that we will continue to comply with the covenants in our credit facilities and indentures. Failure to comply with these covenants could result in a default. If we were unable to obtain a waiver of a default from the lenders or holders of that indebtedness, as applicable, those lenders or holders could accelerate repayment under that indebtedness. An acceleration could have a material adverse impact on our business, financial condition and results of operations. Lastly, we may be unable to obtain additional leverage, which would, in turn, affect our return on capital.
As of December 31, 2019, we had $1,118.2 million of outstanding indebtedness, which had an annualized interest cost of 4.4% under the terms of our debt, excluding fees (such as fees on undrawn amounts and amortization of upfront fees) and giving effect to the swap-adjusted interest rates on our 2022 Convertible Notes, 2023 Notes and 2024 Notes. As of December 31, 2019, as adjusted to give effect to the interest rate swaps, the interest rate on the 2022 Convertible Notes was three-month LIBOR plus 2.11% (on a weighted-average basis), the interest rate on the 2023 Notes was three-month LIBOR plus 1.99%, and the interest rate on the 2024 Notes was three-month LIBOR plus 2.25%.
For us to cover these annualized interest payments on indebtedness, we must achieve annual returns on our investments of at least 2.2%. Since we generally pay interest at a floating rate on our debt, an increase in interest rates will generally increase our borrowing costs. We expect that our annualized interest cost and returns required to cover interest will increase if we issue additional debt securities.
30
In order to assist investors in understanding the effects of leverage, the following table illustrates the effect of leverage on returns from an investment in our common stock assuming various annual returns, net of expenses. Leverage generally magnifies the return of stockholders when the portfolio return is positive and magnifies their losses when the portfolio return is negative. Actual returns may be greater or less than those appearing in the table. The calculations in the table below are hypothetical and actual returns may be higher or lower than those appearing below.
Effects of Leverage Based on Actual Amount of Borrowings Incurred by us as of December 31, 2019
|
|
|
Assumed Return on Our Portfolio |
||||||||
|
|
|
-10% |
|
-5% |
|
0% |
|
5% |
|
10% |
|
|
-24.8% |
|
-14.6% |
|
-4.4% |
|
5.8% |
|
16.0% |
|
Our indebtedness could adversely affect our business, financial conditions or results of operations.
We cannot assure you that our business will generate sufficient cash flow from operations or that future borrowings will be available to us under our credit facilities or otherwise in an amount sufficient to enable us to pay our indebtedness or to fund our other liquidity needs. We may need to refinance all or a portion of our indebtedness on or before it matures. We cannot assure you that we will be able to refinance any of our indebtedness on commercially reasonable terms or at all. If we cannot service our indebtedness, we may have to take actions such as selling assets or seeking additional equity. We cannot assure you that any such actions, if necessary, could be effected on commercially reasonable terms or at all, or on terms that would not be disadvantageous to our stockholders or on terms that would not require us to breach the terms and conditions of our existing or future debt agreements.
Legislation allows us to incur additional leverage.
Under the 1940 Act, a BDC generally is not permitted to incur borrowings, issue debt securities or issue preferred stock unless immediately after the borrowing or issuance the ratio of total assets (less total liabilities other than indebtedness) to total indebtedness plus preferred stock is at least 200%. However, under the SBCAA, which became law in March 2018, BDCs have the ability to elect to become subject to a lower asset coverage requirement of 150%, subject to the receipt of the requisite board or stockholder approvals under the SBCAA and satisfaction of certain other conditions.
On October 8, 2018, our stockholders approved the application of the minimum asset coverage ratio of 150% to us, as set forth in Section 61(a)(2) of the 1940 Act, as amended by the SBCAA. As a result and subject to certain additional disclosure requirements, as of October 9, 2018, our minimum asset coverage ratio was reduced from 200% to 150%. In other words, pursuant to Section 61(a) of the 1940 Act, as amended by the SBCAA, we are permitted to potentially increase our maximum debt-to-equity ratio from an effective level of one-to-one to two-to-one.
As a result, you may face increased investment risk. We may not be able to implement our strategy to utilize additional leverage successfully. See “—We operate in a highly competitive environment for investment opportunities.” Any impact on returns or equity or our business associated with additional leverage may not outweigh the additional risk. See “—We borrow money, which magnifies the potential for gain or loss and increases the risk of investing in us.”
We operate in a highly competitive market for investment opportunities.
Other public and private entities, including commercial banks, commercial financing companies, other BDCs and insurance companies compete with us to make the types of investments that we make in middle-market companies. Certain of these competitors may be substantially larger, have considerably greater financial, technical and marketing resources than we have and offer a wider array of financial services. For example, some competitors may have a lower cost of funds and access to funding sources that are not available to us. In addition, some of our competitors may have higher risk tolerances or different risk assessments, which could allow them to consider a wider variety of investments and establish more relationships. We may lose investment opportunities if we do not match our competitors’ pricing, terms and structure. If we match our competitors’ pricing, terms and structure, however, we may experience decreased net interest income and increased risk of credit loss.
31
In addition, many competitors are not subject to the regulatory restrictions that the 1940 Act imposes on us as a BDC or the restrictions that the Code imposes on us as a RIC. As a result, we face additional constraints on our operations, which may put us at a competitive disadvantage. As a result of this existing and potentially increasing competition, we may not be able to take advantage of attractive investment opportunities and we cannot assure you that we will be able to identify and make investments that are consistent with our investment objective. The competitive pressures we face could have a material adverse effect on our ability to achieve our investment objective.
If we are unable to source investments, access financing or manage future growth effectively, we may be unable to achieve our investment objective.
Our ability to achieve our investment objective depends on our Investment Team’s ability to identify, evaluate, finance and invest in suitable companies that meet our investment criteria. Accomplishing this result on a cost-effective basis is largely a function of our marketing capabilities, our management of the investment process, our ability to provide efficient services and our access to financing sources on acceptable terms, including equity financing. Moreover, our ability to structure investments may also depend upon the participation of other prospective investors. For example, our ability to offer loans above a certain size and to structure loans in a certain way may depend on our ability to partner with other investors. As a result, we could fail to capture some investment opportunities if we cannot provide “one-stop” financing to a potential portfolio company either alone or with other investment partners.
In addition to monitoring the performance of our existing investments, members of our Investment Team may also be called upon to provide managerial assistance to our portfolio companies. These demands on their time may distract them or slow the rate of investment. To grow, our Adviser may need to hire, train, supervise and manage new employees. Failure to manage our future growth effectively could have a material adverse effect on our growth prospects and ability to achieve our investment objective.
Even in the event the value of your investment declines, the Management Fee and, in certain circumstances, the Incentive Fee will still be payable to the Adviser.
Even in the event the value of your investment declines, the Management Fee and, in certain circumstances, the Incentive Fee will still be payable to the Adviser. The Management Fee is calculated as a percentage of the value of our gross assets at a specific time, which would include any borrowings for investment purposes, and may give our Adviser an incentive to use leverage to make additional investments. In addition, the Management Fee is payable regardless of whether the value of our gross assets or your investment have decreased. The use of increased leverage may increase the likelihood of default, which would disfavor holders of our common stock. Given the subjective nature of the investment decisions that our Adviser will make on our behalf, we may not be able to monitor this potential conflict of interest.
The Incentive Fee is calculated as a percentage of pre-Incentive Fee net investment income. Since pre-Incentive Fee net investment income does not include any realized capital gains, realized capital losses or unrealized capital gains or losses, it is possible that we may pay an Incentive Fee in a quarter in which we incur a loss. For example, if we receive pre-Incentive Fee net investment income in excess of the quarterly minimum hurdle rate, we will pay the applicable Incentive Fee even if we have incurred a loss in that quarter due to realized and unrealized capital losses. In addition, because the quarterly minimum hurdle rate is calculated based on our net assets, decreases in our net assets due to realized or unrealized capital losses in any given quarter may increase the likelihood that the hurdle rate is reached in that quarter and, as a result, that an Incentive Fee is paid for that quarter. Our net investment income used to calculate this component of the Incentive Fee is also included in the amount of our gross assets used to calculate the Management Fee.
Also, one component of the Incentive Fee is calculated annually based upon our realized capital gains, computed net of realized capital losses and unrealized capital losses on a cumulative basis. As a result, we may owe the Adviser an Incentive Fee during one year as a result of realized capital gains on certain investments, and then incur significant realized capital losses and unrealized capital losses on the remaining investments in our portfolio during subsequent years. Incentive Fees earned in prior years cannot be clawed back even if we later incur losses.
In addition, the Incentive Fee payable by us to the Adviser may create an incentive for the Adviser to make investments on our behalf that are risky or more speculative than would be the case in the absence of such a compensation arrangement. The Adviser receives the Incentive Fee based, in part, upon capital gains realized on our investments. Unlike the portion of the Incentive Fee that is based on income, there is no hurdle rate applicable to the portion of the Incentive Fee based on capital gains. As a result, the Adviser may have an incentive to invest more in companies whose securities are likely to yield capital gains, as compared to income-producing investments. Such a practice could result in our making more speculative investments than would otherwise be the case, which could result in higher investment losses, particularly during cyclical economic downturns.
32
To the extent that we do not realize income or choose not to retain after-tax realized net capital gains, we will have a greater need for additional capital to fund our investments and operating expenses.
To maintain our status as a RIC for U.S. federal income tax purposes, we must distribute (or be treated as distributing) in each taxable year dividends for tax purposes equal to at least 90% of our investment company taxable income and net tax-exempt income for that taxable year, and may either distribute or retain our realized net capital gains from investments. Unless investors elect to reinvest dividends, earnings that we are required to distribute to stockholders will not be available to fund future investments. Accordingly, we may have insufficient funds to make new and follow-on investments, which could have a material adverse effect on our financial condition and results of operations. Because of the structure and objectives of our business, we may experience operating losses and expect to rely on proceeds from sales of investments, rather than on interest and dividend income, to pay our operating expenses. We cannot assure you that we will be able to sell our investments and thereby fund our operating expenses.
We will be subject to corporate-level U.S. federal income tax if we are unable to maintain our qualification as a RIC under Subchapter M of the Code, including as a result of our failure to satisfy the RIC distribution requirements.
We will incur corporate-level U.S. federal income tax costs if we are unable to maintain our qualification as a RIC for U.S. federal income tax purposes, including as a result of our failure to satisfy the RIC distribution requirements. Although we have elected to be treated as a RIC for U.S. federal income tax purposes, we cannot assure you that we will be able to continue to qualify for and maintain RIC status. To maintain RIC status under the Code and to avoid corporate-level U.S. federal income tax, we must meet the following annual distribution, income source and asset diversification requirements:
|
|
• |
We must distribute (or be treated as distributing) dividends for tax purposes in each taxable year equal to at least 90% of each of: |
|
|
• |
the sum of our net ordinary income and realized net short-term capital gains in excess of realized net long-term capital losses or, investment company taxable income, if any, for that taxable year; and |
|
|
• |
our net tax-exempt income for that taxable year. |
The asset coverage ratio requirements under the 1940 Act and financial covenants under our loan and credit agreements could, under certain circumstances, restrict us from making distributions necessary to satisfy the distribution requirement. In addition, as discussed in more detail below, our income for tax purposes may exceed our available cash flow. If we are unable to obtain cash from other sources, we could fail to satisfy the distribution requirements that apply to a RIC. As a result, we could lose our RIC status and become subject to corporate-level U.S. federal income tax.
|
|
• |
We must derive at least 90% of our gross income for each taxable year from dividends, interest, gains from the sale of or other disposition of stock or securities or similar sources. |
|
|
• |
We must meet specified asset diversification requirements at the end of each quarter of our taxable year. The need to satisfy these requirements to prevent the loss of RIC status may result in our having to dispose of certain investments quickly on unfavorable terms. Because most of our investments will be relatively illiquid, any such dispositions could be made at disadvantageous prices and could result in substantial losses. |
If we fail to maintain our qualification for tax treatment as a RIC for any reason, the resulting U.S. federal income tax liability could substantially reduce our net assets, the amount of income available for distribution, and the amount of our distributions.
We can be expected to retain some income and capital gains in excess of what is permissible for excise tax purposes and such amounts will be subject to 4% U.S. federal excise tax.
As of December 31, 2019 and 2018, we elected to retain approximately $106 million and $80 million of taxable income and capital gains, respectively, in order to provide us with additional liquidity and we recorded an expense of $3.8 million and $3.4 million, respectively, for U.S. federal excise tax as a result. We can be expected to retain some income and capital gains in the future, including for purposes of providing us with additional liquidity, which amounts would similarly be subject to the 4% U.S. federal excise tax. In that event, we will be liable for the tax on the amount by which we do not meet the foregoing distribution requirement. See “ITEM 1. BUSINESS—Regulation as a Business Development Company—Regulated Investment Company Classification” for more information.
Our Adviser and its affiliates, officers and employees may face certain conflicts of interest.
TSSP and its affiliates will refer all middle-market loan origination activities for companies domiciled in the United States to us and conduct those activities through us. The Adviser will determine whether it would be permissible, advisable or otherwise appropriate for us to pursue a particular investment opportunity allocated to us. However, the Adviser, its officers and employees and
33
members of its Investment Review Committee serve or may serve as investment advisers, officers, directors or principals of entities or investment funds that operate in the same or a related line of business as us or of investment funds managed by our affiliates. Accordingly, these individuals may have obligations to investors in those entities or funds, the fulfillment of which might not be in our best interests or the best interests of our stockholders.
In addition, any affiliated investment vehicle currently formed or formed in the future and managed by the Adviser or its affiliates, particularly in connection with any future growth of their respective businesses, may have overlapping investment objectives with our own and, accordingly, may invest in asset classes similar to those targeted by us. For example, TSSP has organized a separate investment vehicle, TSL Europe, aimed specifically at European middle-market loan originations and may in the future organize vehicles aimed at other loan origination opportunities outside our primary focus. Our ability to pursue investment opportunities other than middle-market loan originations for companies domiciled in the United States is subject to the contractual and other requirements of these other funds and allocation decisions by their respective senior professionals. As a result, the Adviser and its affiliates may face conflicts in allocating investment opportunities between us and those other entities. It is possible that we may not be given the opportunity to participate in certain investments made by those other entities that would otherwise be suitable for us.
On December 16, 2014, we were granted an exemptive order from the SEC that, if certain conditions are met, allows us to co-invest with certain of our affiliates (including affiliates of TSSP) in middle-market loan origination activities for companies domiciled in the United States and certain “follow-on” investments in companies in which we have already co-invested pursuant to the order and remain invested. These conditions include, among others, prior approval by a majority of our Independent Directors and that the terms and conditions of the investment applicable to those affiliates must be the same as those applicable to us. If the Adviser, TSSP and their affiliates were to determine that an investment is appropriate both for us and for one or more other affiliated vehicles, we would only be able to make the investment in conjunction with another vehicle to the extent the exemptive order granted to us by the SEC permits us to do so or the investment is otherwise permitted under relevant SEC guidance. On January 16, 2020, we filed a further application for co-investment exemptive relief with the SEC to better align our existing co-investment relief with more recent SEC exemptive orders. There can be no assurance when or if the SEC will grant a further order in response to our application. Until such time a new order is granted, we will continue to operate under the terms of our current exemptive order. We cannot assure you when or whether we will apply for any other exemptive relief in the future and whether such orders will be obtained.
Our Adviser can resign on 60 days’ notice. We may not be able to find a suitable replacement within that time, resulting in a disruption in our operations and a loss of the benefits from our relationship with TSSP. Any new investment advisory agreement would require stockholder approval.
The Adviser has the right, under the Investment Advisory Agreement and the Administration Agreement, to resign at any time on 60 days’ written notice, regardless of whether we have found a replacement. In addition, our Board has the authority to remove the Adviser for any reason or for no reason, or may choose not to renew the Investment Advisory Agreement and the Administration Agreement. Furthermore, the Investment Advisory Agreement automatically terminates in the event of its assignment, as defined in the 1940 Act, by the Adviser. If the Adviser resigns or is terminated, or if we do not obtain the requisite approvals of stockholders and our Board to approve an agreement with the Adviser after an assignment, we may not be able to find a new investment adviser or hire internal management with similar expertise and ability to provide the same or equivalent services on acceptable terms within 60 days, or at all. If we are unable to do so quickly, our operations are likely to experience a disruption and costs under any new agreements that we enter into could increase. Our financial condition, business and results of operations, as well as our ability to pay dividends, are likely to be adversely affected, and the value of our common stock may decline.
Any new Investment Advisory Agreement would be subject to approval by our stockholders. Even if we are able to enter into comparable management or administrative arrangements, the integration of a new adviser or administrator and their lack of familiarity with our investment objective may result in additional costs and time delays that may adversely affect our business, financial condition and results of operations.
In addition, if the Adviser resigns or is terminated, we would lose the benefits of our relationship with TSSP, including insights into our existing portfolio, market expertise, sector and macroeconomic views and due diligence capabilities, as well as any investment opportunities referred to us. We also would no longer be able to use TPG’s name and logo because our license agreement would terminate upon the termination of the Investment Advisory Agreement.
34
A modification in the strategic partnership between TSSP and TPG may adversely affect our business.
Our Adviser is managed through TPG Sixth Street Partners. TSSP was founded in 2009 in a strategic partnership with TPG. TSSP and TPG are currently in discussions to modify the nature of their current strategic partnership. Any such modification is not expected to change the governance or personnel of, or our relationship with, our Adviser or TSSP. TSSP and the Adviser do not rely on TPG to provide any services directly to us under the Investment Advisory Agreement and Administration Agreement, including, but not limited to, sourcing of investments, underwriting or asset management.
We expect that our Adviser will continue to utilize certain limited services (such as certain information technology services utilized by the Adviser on our behalf) that are currently provided by TPG. In the event an agreement between TSSP and TPG is reached, we expect that these limited services would continue to be provided to our Adviser by TPG as transition services over a multi-year period.
To date, no formal agreement between TSSP and TPG has been reached and there is no guarantee that an agreement will be finalized. In the event of any modification in the nature of the partnership between TSSP and TPG, there could be an adverse effect on our business, as our investors or business partners may view our business differently as a result of the change, and as we will, over time, rely exclusively on TSSP and our Adviser to provide those limited services described above that are currently provided to them by TPG. Our license to use the TPG name and logo could also be affected.
The Adviser’s liability is limited under the Investment Advisory Agreement, and we are required to indemnify the Adviser against certain liabilities, which may lead the Adviser to act in a riskier manner on our behalf than it would when acting for its own account.
The Adviser has not assumed any responsibility to us other than to render the services described in the Investment Advisory Agreement, and it will not be responsible for any action of our Board in declining to follow the Adviser’s advice or recommendations. Pursuant to the Investment Advisory Agreement, the Adviser and its members, managers, officers, employees, agents, controlling persons and any other person or entity affiliated with it will not be liable to us for any action taken or omitted to be taken by the Adviser in connection with the performance of any of its duties or obligations under the Investment Advisory Agreement or otherwise as our investment adviser (except to the extent specified in Section 36(b) of the 1940 Act concerning loss resulting from a breach of fiduciary duty (as the same is finally determined by judicial proceedings) with respect to the receipt of compensation for services).
We have agreed to the fullest extent permitted by law, to provide indemnification and the right to the advancement of expenses, to each person who was or is made a party or is threatened to be made a party to or is involved (including as a witness) in any actual or threatened action, suit or proceeding, whether civil, criminal, administrative or investigative, because he or she is or was a member, manager, officer, employee, agent, controlling person or any other person or entity affiliated with the Adviser with respect to all damages, liabilities, costs and expenses resulting from acts of the Adviser in the performance of the person’s duties under the Investment Advisory Agreement. Our obligation to provide indemnification and advancement of expenses is subject to the requirements of the 1940 Act and Investment Company Act Release No. 11330, which, among other things, preclude indemnification for any liability (whether or not there is an adjudication of liability or the matter has been settled) arising by reason of willful misfeasance, bad faith, gross negligence, or reckless disregard of duties, and require reasonable and fair means for determining whether indemnification will be made. Despite these limitations, the rights to indemnification and advancement of expenses may lead the Adviser and its members, managers, officers, employees, agents, controlling persons and other persons and entities affiliated with the Adviser to act in a riskier manner than they would when acting for their own account.
Any failure to maintain our status as a BDC would reduce our operating flexibility.
If we do not remain a BDC, we might be regulated as a closed-end investment company under the 1940 Act, which would subject us to substantially more regulatory restrictions under the 1940 Act and correspondingly decrease our operating flexibility. In addition, failure to comply with the requirements imposed on BDCs by the 1940 Act could cause the SEC to bring an enforcement action against us.
We incur significant costs as a result of being a publicly traded company.
As a publicly traded company, we incur legal, accounting, investor relations and other expenses, including costs associated with corporate governance requirements, such as those under the Sarbanes-Oxley Act, other rules implemented by the SEC and the listing standards of the NYSE. Our independent registered public accounting firm is required to attest to the effectiveness of our internal controls over financial reporting pursuant to Section 404 of the Sarbanes-Oxley Act, which increases the costs associated with our periodic reporting requirements.
35
We are obligated to maintain proper and effective internal control over financial reporting. We may not complete our analysis of our internal control over financial reporting in a timely manner, or our internal controls may not be determined to be effective, which may adversely affect investor confidence in our company and, as a result, the value of our securities.
We are required to comply with the independent auditor attestation requirements of Section 404 of the Sarbanes-Oxley Act. Complying with Section 404 requires a rigorous compliance program as well as adequate time and resources. We may not be able to complete our internal control evaluation, testing and any required remediation in a timely fashion. Matters impacting our internal control may cause us to be unable to report our financial information on a timely basis and thereby subject us to adverse regulatory consequences, including sanctions by the SEC or violations of applicable stock exchange listing rules, and result in a breach of the covenants under the agreements governing any of our financing arrangements. Additionally, if we identify one or more material weaknesses in our internal control over financial reporting, we will be unable to assert that our internal controls are effective. If we are unable to assert that our internal control over financial reporting is effective, or if our auditors are unable to attest to management’s report on the effectiveness of our internal controls, we could lose investor confidence in the accuracy and completeness of our financial reports, which would have a material adverse effect on the price of our securities.
We may experience fluctuations in our quarterly results.
We may experience fluctuations in our quarterly operating results as a result of a number of factors, including the pace at which investments are made, rates of repayment, interest rates payable on investments, changes in realized and unrealized gains and losses, syndication and other fees, the level of our expenses and default rates on our investments. As a result of these and other possible factors, results for any period should not be relied upon as being indicative of performance in future periods.
Provisions of the General Corporation Law of the State of Delaware and our certificate of incorporation and bylaws could deter takeover attempts and have an adverse effect on the price of our common stock.
The General Corporation Law of the State of Delaware, or the DGCL, our amended and restated certificate of incorporation, which we refer to as our certificate of incorporation, and bylaws contain provisions that may discourage, delay or make more difficult a change in control of us or the removal of our directors. Among other provisions, we have a staggered board and our directors may be removed for cause only by the affirmative vote of 75% of the holders of our outstanding capital stock. Our Board also is authorized to issue preferred stock in one or more series. In addition, our certificate of incorporation requires the favorable vote of a majority of our Board followed by the favorable vote of the holders of at least 75% of our outstanding shares of common stock, to approve, adopt or authorize certain transactions, including mergers and the sale, lease or exchange of all or any substantial part of our assets with 10% or greater holders of our outstanding common stock and their affiliates or associates, unless the transaction has been approved by at least 80% of our Board, in which case approval by “a majority of the outstanding voting securities” (as defined in the 1940 Act) is required. Our certificate of incorporation further provides that stockholders may not take action by written consent in lieu of a meeting and our bylaws provide that any stockholder action required or permitted at an annual meeting or special meeting of stockholders may only be taken if it is properly brought before such meeting. These provisions may also discourage another person or entity from making a tender offer for our common stock, because such person or entity, even if it acquired a majority of our outstanding voting securities, would be able to take action as a stockholder (such as electing new directors or approving a merger) only at a duly called stockholders’ meeting and not by written consent. We also are subject to Section 203 of the DGCL, which generally prohibits us from engaging in mergers and other business combinations with stockholders that beneficially own 15% or more of our voting stock, or with their affiliates, unless our directors or stockholders approve the business combination in the prescribed manner. These measures may delay, defer or prevent a transaction or a change in control that might otherwise be in the best interests of our stockholders and could have the effect of depriving stockholders of an opportunity to sell their shares at a premium over prevailing market prices.
Certain investors are limited in their ability to make significant investments in us.
Investment companies registered under the 1940 Act are restricted from acquiring directly or through a controlled entity more than 3% of our total outstanding voting stock (measured at the time of the acquisition), unless these funds comply with an exemption under the 1940 Act as well as other limitations under the 1940 Act that would restrict the amount that they are able to invest in our securities. Private funds that are excluded from the definition of “investment company” either pursuant to Section 3(c)(1) or 3(c)(7) of the 1940 Act are also subject to this restriction. As a result, certain investors may be precluded from acquiring additional shares at a time that they might desire to do so.
We are highly dependent on information systems and systems failures could significantly disrupt our business, which may, in turn, negatively affect the market price of our common stock and our ability to pay dividends.
Our business is highly dependent on the communications and information systems of the Adviser, its affiliates and third parties, including certain limited TPG-provided services (such as certain information technology services utilized by the Adviser on our behalf). Further, in the ordinary course of our business we or the Adviser engage certain third party service providers to provide us
36
with services necessary for our business. Any failure or interruption of those systems or services, including as a result of the termination or suspension of an agreement with any third-party service providers, could cause delays or other problems in our activities. Our financial, accounting, data processing, backup or other operating systems and facilities may fail to operate properly or become disabled or damaged as a result of a number of factors including events that are wholly or partially beyond our control and adversely affect our business. There could be:
|
|
• |
sudden electrical or telecommunications outages; |
|
|
• |
natural disasters such as earthquakes, tornadoes and hurricanes; |
|
|
• |
disease pandemics; |
|
|
• |
events arising from local or larger scale political or social matters, including terrorist acts; |
|
|
• |
outages due to idiosyncratic issues at specific providers; and |
|
|
• |
cyber-attacks. |
These events, in turn, could have a material adverse effect on our operating results and negatively affect the market price of our common stock and our ability to pay dividends to our stockholders.
Cybersecurity risks and cyber incidents may adversely affect our business or those of our portfolio companies by causing a disruption to our operations, a compromise or corruption of confidential information and/or damage to business relationships, or those of our portfolio companies, all of which could negatively impact our business, results of operations or financial condition.
A cyber incident is considered to be any adverse event that threatens the confidentiality, integrity or availability of our information resources. These incidents may be an intentional attack or an unintentional event and could involve gaining unauthorized access to, use, alteration or destruction of our information systems for purposes of misappropriating assets, obtaining ransom payments, stealing confidential information, corrupting data or causing operational disruption, or may involve phishing. The result of these incidents may include disrupted operations, misstated or unreliable financial data, liability for stolen information, misappropriation of assets, increased cybersecurity protection and insurance costs, litigation and damage to our business relationships. This could result in significant losses, reputational damage, litigation, regulatory fines or penalties, or otherwise adversely affect our business, financial condition or results of operations. In addition, we may be required to expend significant additional resources to modify our protective measures and to investigate and remediate vulnerabilities or other exposures arising from operational and security risks. The costs related to cybersecurity incidents may not be fully insured or indemnified. As our and our portfolio companies’ reliance on technology has increased, so have the risks posed to our information systems, both internal and those provided by our Adviser and third-party service providers, and the information systems of our portfolio companies. We, our Adviser and its affiliates have implemented processes, procedures and internal controls to help mitigate cybersecurity risks and cyber intrusions, but these measures, as well as our increased awareness of the nature and extent of a risk of a cyber incident, may be ineffective and do not guarantee that a cyber incident will not occur or that our financial results, operations or confidential information will not be negatively impacted by such an incident.
Third parties with which we do business (including, but not limited to, service providers, such as accountants, custodians, transfer agents and administrators, and the issuers of securities in which we invest) may also be sources or targets of cybersecurity or other technological risks. We outsource certain functions and these relationships allow for the storage and processing of our information and assets, as well as certain investor, counterparty, employee and borrower information. While we engage in actions to reduce our exposure resulting from outsourcing, we cannot control the cybersecurity plans and systems put in place by these third parties and ongoing threats may result in unauthorized access, loss, exposure or destruction of data, or other cybersecurity incidents, with increased costs and other consequences, including those described above. Privacy and information security laws and regulation changes, and compliance with those changes, may also result in cost increases due to system changes and the development of new administrative processes.
Our Board may change our investment objective, operating policies and strategies without prior notice or stockholder approval.
Our Board has the authority to change our investment objective and modify or waive certain of our operating policies and strategies without prior notice (except as required by the 1940 Act) and without stockholder approval. However, absent stockholder approval, we may not change the nature of our business so as to cease to be a BDC and we may not withdraw our election as a BDC. We cannot predict the effect any changes to our current operating policies or strategies would have on our business, operating results and value of our common stock. Nevertheless, the effects may adversely affect our business and impact our ability to pay dividends.
37
Changes in laws or regulations governing our operations may adversely affect our business.
We and our portfolio companies are subject to regulation by laws and regulations at the local, state, federal and, in some cases, foreign levels. These laws and regulations, as well as their interpretation, may be changed from time to time, and new laws and regulations may be enacted. Accordingly, any change in these laws or regulations, changes in their interpretation, or newly enacted laws or regulations and any failure by us or our portfolio companies to comply with these laws or regulations, could require changes to certain business practices of us or our portfolio companies, negatively impact the operations, cash flows or financial condition of us or our portfolio companies, impose additional costs on us or our portfolio companies or otherwise adversely affect our business or the business of our portfolio companies. In particular, changes to the laws and regulations governing BDCs or the interpretation of these laws and regulations by the staff of the SEC could disrupt our business model. For example, tax reform legislation could have an adverse impact on us, the credit markets and our portfolio companies, to the extent the reduction in corporate tax rates or limitations on interest expense deductibility impact the credit markets and our portfolio companies. Any changes to the laws and regulations governing our operations or the U.S. federal income tax treatment of our assets may cause us to alter our investment strategy to avail ourselves of new or different opportunities. For more information on tax regulatory risks, see “Risks Related to our Portfolio Company Investments.”
Over the last several years, there has been an increase in regulatory attention to the extension of credit outside of the traditional banking sector, raising the possibility that some portion of the non-bank financial sector will be subject to new regulation. While it cannot be known at this time whether these regulations will be implemented or what form they will take, increased regulation of non-bank credit extension could negatively impact our operations, cash flows or financial condition, impose additional costs on us, intensify the regulatory supervision of us or otherwise adversely affect our business.
The interest rates of our debt investments to our portfolio companies and our indebtedness that extend beyond 2021 might be subject to change based on recent regulatory changes.
LIBOR, the London Interbank Offered Rate, is the basic rate of interest used in lending transactions between banks on the London interbank market and is widely used as a reference for setting the interest rate on loans globally. We typically use LIBOR as a reference rate in term loans we extend to portfolio companies such that the interest due to us pursuant to a term loan extended to a portfolio company is calculated using LIBOR. The terms of our debt investments generally include minimum interest rate floors which are calculated based on LIBOR. Amounts drawn under the Revolving Credit Facility also currently bear interest at LIBOR plus a margin, and obligations under interest rate swaps we enter into are referenced to LIBOR.
On July 27, 2017, the United Kingdom’s Financial Conduct Authority, which regulates LIBOR, announced that it intends to phase out LIBOR by the end of 2021. It is unclear if at that time LIBOR will cease to exist or if new methods of calculating LIBOR will be established such that it continues to exist after 2021. The U.S. Federal Reserve, in conjunction with the Alternative Reference Rates Committee, a steering committee comprised of large U.S. financial institutions, is considering replacing U.S. dollar LIBOR with a new index calculated by short term repurchase agreements, backed by Treasury securities called the Secured Overnight Financing Rate (“SOFR”). The first publication of SOFR was released in April 2018. Whether or not SOFR attains market traction as a LIBOR replacement remains a question and the future of LIBOR at this time is uncertain. Because of this uncertainty, we cannot reasonably estimate the expected impact of a transition away from LIBOR to our business.
If LIBOR ceases to exist or degrades to the degree that it is no longer representative of the underlying market, we may need to renegotiate the credit agreements extending beyond 2021 with our portfolio companies that utilize LIBOR as a factor in determining the interest rate, in order to replace LIBOR with the new standard that is established, which may have an adverse effect on our ability to receive attractive returns. In addition, if LIBOR ceases to exist or degrades to the degree that it is no longer representative of the underlying market, we may need to renegotiate certain terms of our Revolving Credit Facility to replace LIBOR with the new standard that is established in its place. If we are unable to do so, amounts drawn under the Revolving Credit Facility may bear interest at a higher rate, which would increase the cost of our borrowings and, in turn, affect our return on capital. If LIBOR ceases to exist or degrades to the degree that it is no longer representative of the underlying market, we will also have to renegotiate the terms of any outstanding interest rate swaps.
The recently enacted Tax Cuts and Jobs Act may adversely affect our business.
The recently enacted Tax Cuts and Jobs Act (“Tax Reform”) has made significant changes to the U.S. federal income tax system. Among other things, Tax Reform may limit the ability of borrowers to fully deduct interest expense. This could potentially affect the loan market, for example by impacting the demand for loans available from us or the terms of such loans. The changes to interest deductibility, utility of net operating losses and other provisions of Tax Reform could also in certain circumstances increase the U.S. tax burden on our portfolio assets which, in turn, could negatively impact their ability to service their interest expense obligations to us. Prospective investors are urged to consult with their own advisors about the potential effects of Tax Reform on the loan market and about its tax consequences of an investment in us.
38
Risks Related to Economic Conditions
The current state of the economy and financial markets increases the likelihood of adverse effects on our financial position and results of operations.
The U.S. and global capital markets experienced extreme volatility and disruption in recent years, leading to recessionary conditions and depressed levels of consumer and commercial spending. For instance, political uncertainty resulting from recent events, including changes to U.S. trade policies and the impact of the United Kingdom’s exit from the European Union in January 2020 (“Brexit”), has led to disruption and instability in the global markets. Disruptions in the capital markets increased the spread between the yields realized on risk-free and higher risk securities, resulting in illiquidity in parts of the capital markets. We cannot assure you that these conditions will not worsen. If conditions worsen, a prolonged period of market illiquidity could have a material adverse effect on our business, financial condition and results of operations. Unfavorable economic conditions also could increase our funding costs, limit our access to the capital markets or result in a decision by lenders not to extend credit to us. These events could limit our investment originations, limit our ability to grow and negatively impact our operating results.
In addition, to the extent that recessionary conditions return, the financial results of small to mid-sized companies, like those in which we invest, will likely experience deterioration, which could ultimately lead to difficulty in meeting debt service requirements and an increase in defaults. Additionally, the end markets for certain of our portfolio companies’ products and services have experienced, and continue to experience, negative economic trends. The performances of certain of our portfolio companies have been, and may continue to be, negatively impacted by these economic or other conditions, which may ultimately result in:
|
|
• |
our receipt of a reduced level of interest income from our portfolio companies; |
|
|
• |
decreases in the value of collateral securing some of our loans and the value of our equity investments; and |
|
|
• |
ultimately, losses or charge-offs related to our investments. |
Uncertainty about financial stability could have a significant adverse effect on our business, results of operations and financial condition.
Due to federal budget deficit concerns, S&P downgraded the federal government’s credit rating from AAA to AA+ for the first time in history on August 5, 2011. Further, Moody’s and Fitch warned that they may downgrade the federal government’s credit rating. Further downgrades or warnings by S&P or other rating agencies, and the government’s credit and deficit concerns in general, could cause interest rates and borrowing costs to rise, which may negatively impact both the perception of credit risk associated with our debt portfolio and our ability to access the debt markets on favorable terms. In addition, a decreased credit rating could create broader financial turmoil and uncertainty, which may weigh heavily on our financial performance and the value of our common stock. Also, to the extent uncertainty regarding any economic recovery in Europe and Brexit continue to negatively impact consumer confidence and consumer credit factors, our business and results of operations could be significantly and adversely affected.
In October 2014, the Federal Reserve announced that it was concluding its bond-buying program, or quantitative easing, which was designed to stimulate the economy and expand the Federal Reserve’s holdings of long-term securities, suggesting that key economic indicators, such as the unemployment rate, had showed signs of improvement since the inception of the program. It is unclear what effect, if any, the conclusion of the Federal Reserve’s bond-buying program will have on the value of our investments. However, it is possible that, without quantitative easing by the Federal Reserve, these developments, along with the United States government’s credit and deficit concerns and the European sovereign debt crisis, could cause interest rates and borrowing costs to rise, which may negatively impact our ability to access the debt markets on favorable terms. Additionally, after raising the target range for the federal funds rate in 2017 and 2018, the Federal Reserve lowered the target rate three times in 2019. Further changes in key economic indicators, such as the unemployment rate or inflation, could lead to changes to the target range for the federal funds rate that may cause instability or may negatively impact our ability to access the debt markets on favorable terms.
As a result of the 2018 U.S. election, the Republican Party currently controls the executive branch of government and the Senate, while the Democratic Party controls the House. This political division between the Senate and House makes it unclear what legislation may be adopted that could significantly affect the regulation of U.S. financial markets. Areas subject to potential change, amendment or repeal include the Wall Street Reform and Consumer Protection Act, or the Dodd-Frank Act, and the authority of the Federal Reserve and the Financial Stability Oversight Council. These or other regulatory changes could result in greater competition from banks and other lenders with which we compete for lending and other investment opportunities. The United States may also potentially withdraw from or renegotiate various trade agreements and take other actions that would change current trade policies of the United States. We cannot predict which, if any, of these actions will be taken or, if taken, their effect on the financial stability of the United States. Such actions could have a significant adverse effect on our business, financial condition and results of operations.
39
Economic recessions or downturns could impair our portfolio companies and harm our operating results.
Many of the portfolio companies in which we make investments may be susceptible to economic slowdowns or recessions and during these periods may be unable to repay the loans we made to them. Therefore, our non-performing assets may increase and the value of our portfolio may decrease during these periods as we are required to record our investments at their current fair value. Adverse economic conditions also may decrease the value of collateral securing some of our loans and the value of our equity investments. Economic slowdowns or recessions could lead to financial losses in our portfolio and a decrease in revenues, net income and assets. Unfavorable economic conditions also could increase our and our portfolio companies’ funding costs, limit our and our portfolio companies’ access to the capital markets or result in a decision by lenders not to extend credit to us or our portfolio companies. These events could prevent us from increasing investments and harm our operating results.
A portfolio company’s failure to satisfy financial or operating covenants imposed by us or other lenders could lead to defaults and, potentially, acceleration of the time when the loans are due and foreclosure on its secured assets, which could trigger cross-defaults under other agreements and jeopardize the portfolio company’s ability to meet its obligations under the debt that we hold. We may incur additional expenses to the extent necessary to seek recovery upon default or to negotiate new terms with a defaulting portfolio company. In addition, if one of our portfolio companies were to go bankrupt, depending on the facts and circumstances, including the extent to which we will actually provide significant managerial assistance to that portfolio company, a bankruptcy court might subordinate all or a portion of our claim to that of other creditors.
Risks Related to Our Portfolio Company Investments
Our investments are very risky and highly speculative.
We primarily invest in first-lien debt, second-lien debt, mezzanine and unsecured debt or equity or other securities issued by middle-market companies. The companies in which we intend to invest are typically highly leveraged, and, in most cases, our investments in these companies are not rated by any rating agency. If these instruments were rated, we believe that they would likely receive a rating of below investment grade (that is, below BBB- or Baa3, which is often referred to as “junk”). Exposure to below investment grade instruments involves certain risks, including speculation with respect to the borrower’s capacity to pay interest and repay principal.
First-Lien Debt. When we make a first-lien loan, we generally take a security interest in the available assets of the portfolio company, including the equity interests of its subsidiaries, which we expect to help mitigate the risk that we will not be repaid. However, there is a risk that the collateral securing our loans may decrease in value over time, may be difficult to sell in a timely manner, may be difficult to appraise, and may fluctuate in value based upon the success of the business and market conditions, including as a result of the inability of the portfolio company to raise additional capital. In some circumstances, our lien is, or could become, subordinated to claims of other creditors. Consequently, the fact that a loan is secured does not guarantee that we will receive principal and interest payments according to the loan’s terms, or at all, or that we will be able to collect on the loan should we need to enforce our remedies. In addition, in connection with our “last out” first-lien loans, we enter into agreements among lenders. Under these agreements, our interest in the collateral of the first-lien loans may rank junior to those of other lenders in the loan under certain circumstances. This may result in greater risk and loss of principal on these loans.
Second-Lien and Mezzanine Debt. Our investments in second-lien and mezzanine debt generally are subordinated to senior loans and will either have junior security interests or be unsecured. As such, other creditors may rank senior to us in the event of insolvency. This may result in greater risk and loss of principal.
Equity and Other Investments. When we invest in first-lien debt, second-lien debt or mezzanine debt, we may acquire equity securities, such as warrants, options and convertible instruments. In addition, we may invest directly in the equity securities of portfolio companies. We seek to dispose of these equity interests and realize gains upon our disposition of these interests. However, the equity interests we receive may not appreciate in value and, in fact, may decline in value. Accordingly, we may not be able to realize gains from our equity interests, and any gains that we do realize on the disposition of any equity interests may not be sufficient to offset any other losses we experience.
Preferred Stock. To the extent we invest in preferred securities, we may incur particular risks, including:
|
|
• |
preferred securities may include provisions that permit the issuer, at its discretion, to defer distributions for a stated period without any adverse consequences to the issuer. If we own a preferred security that is deferring its distributions, we may be required to report income for U.S. federal income tax purposes before we receive such distributions; |
|
|
• |
preferred securities are subordinated to bonds and other debt instruments in a company’s capital structure in terms of priority to corporate income and liquidation payments, and therefore are subject to greater credit risk than more senior debt instruments; and |
40
In addition, our investments generally involve a number of significant risks, including:
|
|
• |
the companies in which we invest may have limited financial resources and may be unable to meet their obligations under their debt securities that we hold, which may be accompanied by a deterioration in the value of any collateral and a reduction in the likelihood of us realizing any guarantees we may have obtained in connection with our investment; |
|
|
• |
the companies in which we invest typically have shorter operating histories, narrower product lines and smaller market shares than larger businesses, which tend to render them more vulnerable to competitors’ actions and market conditions, as well as general economic downturns; |
|
|
• |
the companies in which we invest are more likely to depend on the management talents and efforts of a small group of persons; therefore, the death, disability, resignation or termination of one or more of these persons could have a material adverse impact on our portfolio company and, in turn, on us; |
|
|
• |
the companies in which we invest generally have less predictable operating results, may be engaged in rapidly changing businesses with products subject to a substantial risk of obsolescence, and may require substantial additional capital to support their operations, finance expansion or maintain their competitive position; |
|
|
• |
the debt investments in our portfolio generally have a significant portion of principal due at the maturity of the investment, which would result in a substantial loss to us if such borrowers are unable to refinance or repay their debt at maturity; |
|
|
• |
our executive officers, directors and Adviser may, in the ordinary course of business, be named as defendants in litigation arising from our investments in the portfolio companies; |
|
|
• |
the companies in which we invest generally have less publicly available information about their businesses, operations and financial condition and, if we are unable to uncover all material information about these companies, we may not make a fully informed investment decision; and |
|
|
• |
the companies in which we invest may have difficulty accessing the capital markets to meet future capital needs, which may limit their ability to grow or to repay their outstanding indebtedness upon maturity. |
The value of most of our portfolio securities will not have a readily available market price and we value these securities at fair value as determined in good faith by our Board, which valuation is inherently subjective, may not reflect what we may actually realize for the sale of the investment and could result in a conflict of interest with the Adviser.
Investments are valued at the end of each fiscal quarter. The majority of our investments are expected to be in loans that do not have readily ascertainable market prices. The fair value of investments that are not publicly traded or whose market prices are not readily available are determined in good faith by the Board, which is supported by the valuation committee of our Adviser and by the audit committee of our Board. The Board has retained independent third-party valuation firms to perform certain limited third-party valuation services that the Board identified and requested them to perform. In accordance with our valuation policy, our Investment Team prepares portfolio company valuations using sources or proprietary models depending on the availability of information on our investments and the type of asset being valued. The participation of the Adviser in our valuation process could result in a conflict of interest, since the Management Fee is based on the value of our gross assets.
Factors that we may consider in determining the fair value of our investments include the nature and realizable value of any collateral, the portfolio company’s earnings and its ability to make payments on its indebtedness, the markets in which the portfolio company does business, comparison to similar publicly traded companies, discounted cash flow and other relevant factors. Because fair valuations, and particularly fair valuations of private securities and private companies, are inherently uncertain, may fluctuate over short periods of time and are often based to a large extent on estimates, comparisons and qualitative evaluations of private information, our determinations of fair value may differ materially from the values that would have been determined if a ready market for these securities existed. This could make it more difficult for investors to value accurately our portfolio investments and could lead to undervaluation or overvaluation of our common stock. In addition, the valuation of these types of securities may result in substantial write-downs and earnings volatility.
Decreases in the market values or fair values of our investments are recorded as unrealized losses. The effect of all of these factors on our portfolio can reduce our net asset value by increasing net unrealized losses in our portfolio. Depending on market conditions, we could incur substantial realized losses and may suffer unrealized losses, which could have a material adverse impact on our business, financial condition and results of operations.
41
The lack of liquidity in our investments may adversely affect our business.
We generally make loans to private companies. There may not be a ready market for our loans and certain loans may contain transfer restrictions, which may also limit liquidity. The illiquidity of these investments may make it difficult for us to sell positions if the need arises. In addition, if we are required to liquidate all or a portion of our portfolio quickly, we may realize significantly less than the value at which we had previously recorded these investments. In addition, we may face other restrictions on our ability to liquidate an investment in a portfolio company to the extent that we hold a significant portion of a company’s equity or if we have material nonpublic information regarding that company.
Our portfolio may be focused on a limited number of portfolio companies or industries, which will subject us to a risk of significant loss if any of these companies defaults on its obligations under any of its debt instruments or if there is a downturn in a particular industry.
Our portfolio is currently invested in a limited number of portfolio companies and industries and may continue to be in the near future. Beyond the asset diversification requirements associated with our qualification as a RIC for U.S. federal income tax purposes, we do not have fixed guidelines for diversification. While we are not targeting any specific industries, our investments may be focused on relatively few industries. For example, although we classify the industries of our portfolio companies by end-market (such as healthcare, and business services) and not by the products or services (such as software) directed to those end-markets, many of our portfolio companies principally provide software products or services, which exposes us to downturns in that sector. As a result, the aggregate returns we realize may be significantly adversely affected if a small number of investments perform poorly or if we need to write down the value of any one investment. Additionally, a downturn in any particular industry in which we are invested could significantly affect our aggregate returns.
We may securitize certain of our investments, which may subject us to certain structured financing risks.
Although we have not done so to date, we may securitize certain of our investments in the future, including through the formation of one or more collateralized loan obligations, or CLOs, while retaining all or most of the exposure to the performance of these investments. This would involve contributing a pool of assets to a special purpose entity, and selling debt interests in that entity on a non-recourse or limited-recourse basis to purchasers.
If we were to create a CLO or other securitization vehicle, we would depend on distributions from the vehicle to pay dividends to our stockholders. The ability of a CLO or other securitization vehicle to make distributions will be subject to various limitations, including the terms and covenants of the debt it issues. For example, tests (based on interest coverage or other financial ratios or other criteria) may restrict our ability, as holder of a CLO or other securitization vehicle equity interest, to receive cash flow from these investments. We cannot assure you that any such performance tests would be satisfied. Also, a CLO or other securitization vehicle may take actions that delay distributions to preserve ratings and to keep the cost of present and future financings lower or the financing vehicle may be obligated to retain cash or other assets to satisfy over-collateralization requirements commonly provided for holders of its debt. As a result, there may be a lag, which could be significant, between the repayment or other realization on a loan or other assets in, and the distribution of cash out of, a CLO or other securitization vehicle, or cash flow may be completely restricted for the life of the CLO or other securitization vehicle.
In addition, a decline in the credit quality of loans in a CLO or other securitization vehicle due to poor operating results of the relevant borrower, declines in the value of loan collateral or increases in defaults, among other things, may force the sale of certain assets at a loss, reducing their earnings and, in turn, cash potentially available for distribution to us for distribution to our stockholders. If we were to form a CLO or other securitization vehicle, to the extent that any losses were incurred by the financing vehicle in respect of any collateral, these losses would be borne first by us as owners of its equity interests. Any equity interests that we were to retain in a CLO or other securitization vehicle would not be secured by its assets and we would rank behind all of its creditors.
A CLO or other securitization vehicle, if created, also would likely be consolidated in our financial statements and consequently affect our asset coverage ratio, which may limit our ability to incur additional leverage. See “ITEM 1. BUSINESS – Regulation as a Business Development Company.”
Because we generally do not hold controlling interests in our portfolio companies, we may not be in a position to exercise control over those portfolio companies or prevent decisions by management of those portfolio companies that could decrease the value of our investments.
We are a lender, and loans (and any equity investments we make) typically will be non-controlling investments, meaning we will not be in a position to control the management, operation and strategic decision-making of the companies we invest in (outside of, potentially, the context of a restructuring, insolvency or similar event). As a result, we will be subject to the risk that a portfolio company we do not control, or in which we do not have a majority ownership position, may make business decisions with which we
42
disagree, and the equity holders and management of such a portfolio company may take risks or otherwise act in ways that are adverse to our interests. We may not be able to dispose of our investments in the event that we disagree with the actions of a portfolio company, and may therefore suffer a decrease in the value of our investments.
We are exposed to risks associated with changes in interest rates.
The majority of our debt investments are based on floating rates, such as LIBOR, EURIBOR, the Federal Funds Rate or the Prime Rate. General interest rate fluctuations may have a substantial negative impact on our investments, the value of our common stock and our rate of return on invested capital. On one hand, a reduction in the interest rates on new investments relative to interest rates on current investments could have an adverse impact on our net interest income, which also could be negatively impacted by our borrowers making prepayments on their loans. On the other hand, an increase in interest rates could increase the interest repayment obligations of our borrowers and result in challenges to their financial performance and ability to repay their obligations.
An increase in interest rates could also decrease the value of any investments we hold that earn fixed interest rates, including subordinated loans, senior and junior secured and unsecured debt securities and loans and high yield bonds, and also could increase our interest expense, thereby decreasing our net income. Moreover, an increase in interest rates available to investors could make investment in our common stock less attractive if we are not able to increase our dividend rate, which could reduce the value of our common stock. Federal Reserve policy, including with respect to certain interest rates and the decision to end its quantitative easing policy, may also adversely affect the value, volatility and liquidity of dividend- and interest-paying securities. Market volatility, rising interest rates and/or a return to unfavorable economic conditions could adversely affect our business. See “—Risks Related to Economic Conditions—Uncertainty about financial stability could have a significant adverse effect on our business, results of operations and financial condition.”
A rise in the general level of interest rates typically leads to higher interest rates applicable to our debt investments. Accordingly, an increase in interest rates may result in an increase in the amount of the Incentive Fee payable to the Adviser.
We may use interest rate risk management techniques in an effort to limit our exposure to interest rate fluctuations. These techniques may include various interest rate hedging activities to the extent permitted by the 1940 Act. See “—Risks Related to Our Portfolio Company Investments—We expose ourselves to risks when we engage in hedging transactions.”
We may not be able to realize expected returns on our invested capital.
We may not realize expected returns on our investment in a portfolio company due to changes in the portfolio company’s financial position or due to an acquisition of the portfolio company. If a portfolio company repays our loans prior to their maturity, we may not receive our expected returns on our invested capital. Many of our investments are structured to provide a disincentive for the borrower to pre-pay or call the security, but this call protection may not cover the full expected value of an investment if that investment is repaid prior to maturity.
Middle-market companies operate in a highly acquisitive market with frequent mergers and buyouts. If a portfolio company is acquired or merged with another company prior to drawing on our commitment, we would not realize our expected return. Similarly, in many cases companies will seek to restructure or repay their debt investments or buy our other equity ownership positions as part of an acquisition or merger transaction, which may result in a repayment of debt or other reduction of our investment.
By originating loans to companies that are experiencing significant financial or business difficulties, we may be exposed to distressed lending risks.
As part of our lending activities, we may originate loans to companies that are experiencing significant financial or business difficulties, including companies involved in bankruptcy or other reorganization and liquidation proceedings. Although the terms of such financing may result in significant financial returns to us, they involve a substantial degree of risk. The level of analytical sophistication, both financial and legal, necessary for successful financing to companies experiencing significant business and financial difficulties is unusually high. We cannot assure you that we will correctly evaluate the value of the assets collateralizing our loans or the prospects for a successful reorganization or similar action. In any reorganization or liquidation proceeding relating to a company that we fund, we may lose all or part of the amounts advanced to the borrower or may be required to accept collateral with a value less than the amount of the loan advanced by us to the borrower.
43
Our portfolio companies in some cases may incur debt or issue equity securities that rank equally with, or senior to, our investments in those companies.
Our portfolio companies may have, or may be permitted to incur, other debt, or issue other equity securities that rank equally with, or senior to, our investments. By their terms, those instruments may provide that the holders are entitled to receive payment of dividends, interest or principal on or before the dates on which we are entitled to receive payments in respect of our investments. These debt instruments would usually prohibit the portfolio companies from paying interest on or repaying our investments in the event and during the continuance of a default under the debt. Also, in the event of insolvency, liquidation, dissolution, reorganization or bankruptcy of a portfolio company, holders of securities ranking senior to our investment in that portfolio company typically would be entitled to receive payment in full before we receive any distribution in respect of our investment. After repaying those holders, the portfolio company may not have any remaining assets to use for repaying its obligation to us. In the case of securities ranking equally with our investments, we would have to share on an equal basis any distributions with other security holders in the event of an insolvency, liquidation, dissolution, reorganization or bankruptcy of the relevant portfolio company.
The rights we may have with respect to the collateral securing certain loans we make to our portfolio companies may also be limited pursuant to the terms of one or more intercreditor agreements or agreements among lenders. Under these agreements, we may forfeit certain rights with respect to the collateral to holders with prior claims. These rights may include the right to commence enforcement proceedings against the collateral, the right to control the conduct of those enforcement proceedings, the right to approve amendments to collateral documents, the right to release liens on the collateral and the right to waive past defaults under collateral documents. We may not have the ability to control or direct such actions, even if as a result our rights as lenders are adversely affected.
We may be exposed to special risks associated with bankruptcy cases.
One or more of our portfolio companies may be involved in bankruptcy or other reorganization or liquidation proceedings. Many of the events within a bankruptcy case are adversarial and often beyond the control of the creditors. While creditors generally are afforded an opportunity to object to significant actions, we cannot assure you that a bankruptcy court would not approve actions that may be contrary to our interests. There also are instances where creditors can lose their ranking and priority if they are considered to have taken over management of a borrower. If one of our portfolio companies were to go bankrupt, depending on the facts and circumstances, including the extent to which we will actually provide significant managerial assistance to that portfolio company, a bankruptcy court might subordinate all or a portion of our claim to that of other creditors.
The reorganization of a company can involve substantial legal, professional and administrative costs to a lender and the borrower. It is subject to unpredictable and lengthy delays, and during the process a company’s competitive position may erode, key management may depart and a company may not be able to invest adequately. In some cases, the debtor company may not be able to reorganize and may be required to liquidate assets. The debt of companies in financial reorganization will, in most cases, not pay current interest, may not accrue interest during reorganization and may be adversely affected by an erosion of the issuer’s fundamental value.
In addition, lenders can be subject to lender liability claims for actions taken by them where they become too involved in the borrower’s business or exercise control over the borrower. For example, we could become subject to a lender liability claim (alleging that we misused our influence on the borrower for the benefit of its lenders), if, among other things, the borrower requests significant managerial assistance from us and we provide that assistance.
Our failure to make follow-on investments in our portfolio companies could impair the value of our investments.
Following an initial investment in a portfolio company, we may make additional investments in that portfolio company as “follow-on” investments to:
|
|
• |
increase or maintain in whole or in part our equity ownership percentage; |
|
|
• |
exercise warrants, options or convertible securities that were acquired in the original or subsequent financing; or |
|
|
• |
attempt to preserve or enhance the value of our investment. |
We may elect not to make follow-on investments, may be constrained in our ability to employ available funds, or otherwise may lack sufficient funds to make those investments. We have the discretion to make any follow-on investments, subject to the availability of capital resources. However, doing so could be placing even more capital at risk in existing portfolio companies.
44
The failure to make follow-on investments may, in some circumstances, jeopardize the continued viability of a portfolio company and our initial investment, or may result in a missed opportunity for us to increase our participation in a successful operation. Even if we have sufficient capital to make a desired follow-on investment, we may elect not to make a follow-on investment because we may not want to increase our concentration of risk, because we prefer other opportunities or because we are inhibited by compliance with BDC requirements or the desire to maintain our tax status.
Our ability to enter into transactions with our affiliates is restricted.
We are prohibited under the 1940 Act from participating in certain transactions with certain of our affiliates without the prior approval of our Independent Directors and, in some cases, exemptive relief from the SEC. Any person that owns, directly or indirectly, 5% or more of our outstanding voting securities is our affiliate for purposes of the 1940 Act, and we generally are prohibited from buying or selling any security from or to such affiliate, absent the prior approval of our Independent Directors. The 1940 Act also prohibits certain “joint” transactions with certain of our affiliates, which could include investments in the same portfolio company (whether at the same or different times), without prior approval of our Independent Directors and, in some cases, exemptive relief from the SEC. If a person acquires more than 25% of our voting securities, we are prohibited from buying or selling any security from or to such person or certain of that person’s affiliates, or entering into prohibited joint transactions with such persons, absent the prior approval of the SEC. Similar restrictions limit our ability to transact business with our officers or directors or their affiliates.
The decision by TSSP, our Adviser or their affiliates to allocate an opportunity to another entity could cause us to forgo an investment opportunity that we otherwise would have made. We also generally will be unable to invest in any issuer in which TSSP and its other affiliates or a fund managed by TSSP or its other affiliates has previously invested or in which they are making an investment. Similar restrictions limit our ability to transact business with our officers or directors or their affiliates. These restrictions may limit the scope of investment opportunities that would otherwise be available to us.
On December 16, 2014, we were granted an exemptive order from the SEC that allows us to co-invest, subject to certain conditions, with certain of our affiliates (including affiliates of TSSP) in middle-market loan origination activities for companies domiciled in the United States and certain “follow-on” investments in companies in which we have already co-invested pursuant to the order and remain invested. We and our affiliates, including investment funds managed by our affiliates, are only permitted to co-invest in accordance with the terms of the exemptive order or in the limited circumstances otherwise currently permitted by regulatory guidance. On January 16, 2020, we filed a further application for co-investment exemptive relief with the SEC to better align our existing co-investment relief with more recent SEC exemptive orders. There can be no assurance when or if the SEC will grant a further order in response to our application. Until such time a new order is granted, we will continue to operate under the terms of our current exemptive order.
Any acquisitions or strategic investments that we pursue are subject to risks and uncertainties.
We have pursued and may continue to pursue growth through acquisitions or strategic investments in new businesses. Completion and timing of any such acquisitions or strategic investments may be subject to a number of contingencies, including the uncertainty in reaching a commercial agreement with our counterparty, our ability to obtain required board, shareholder and regulatory approvals, as well as any required financing (or the risk that these are obtained subject to terms and conditions that are not anticipated). The announcement or consummation of any transaction also may adversely impact our business relationships or engender competitive responses.
Acquisitions could involve numerous additional risks, such as unanticipated litigation, unexpected costs, liabilities, charges or expenses resulting from a transaction, the inability to generate sufficient revenue to offset acquisition costs and any changes in general economic or industry specific conditions. There can be no assurance that the integration of an acquired business will be successful or that an acquired business will prove to be profitable or sustainable. The failure to integrate successfully or to manage the challenges presented by an integration process may adversely impact our financial results. In addition, the proposal and negotiation of acquisitions or strategic investments, whether or not completed, as well as the integration of those businesses into our existing portfolio, could result in substantial expenses and the diversion of our Adviser’s time, attention and resources from our day-to-day operations.
Our ability to manage our growth through acquisitions or strategic investments will depend, in part, on our success in addressing these risks. Any failure to effectively implement our acquisition or strategic investment strategies could have a material adverse effect on our business, financial condition or results of operations.
45
We cannot guarantee that we will be able to obtain various required licenses in U.S. states or in any other jurisdiction where they may be required in the future.
We are required to have and may be required in the future to obtain various state licenses to, among other things, originate commercial loans, and may be required to obtain similar licenses from other authorities, including outside of the United States, in the future in connection with one or more investments. Applying for and obtaining required licenses can be costly and take several months. We cannot assure you that we will maintain or obtain all of the licenses that we need on a timely basis. We also are and will be subject to various information and other requirements to maintain and obtain these licenses, and we cannot assure you that we will satisfy those requirements. Our failure to maintain or obtain licenses that we require, now or in the future, might restrict investment options and have other adverse consequences.
Our investments in foreign companies may involve significant risks in addition to the risks inherent in U.S. investments.
Our investment strategy may include potential investments in foreign companies. Investing in foreign companies may expose us to additional risks not typically associated with investing in U.S. companies. These risks include changes in exchange control regulations, U.S. trade policy, political and social instability, expropriation, imposition of foreign taxes (potentially at confiscatory levels), less liquid markets, less available information than is generally the case in the United States, higher transaction costs, less government supervision of exchanges, brokers and issuers, less developed bankruptcy laws, difficulty in enforcing contractual obligations, lack of uniform accounting and auditing standards and greater price volatility. Uncertainty in the wake of Brexit could also have negative impacts on both the U.K. economy and the economies of other countries in Europe. In addition, interest income derived from loans to foreign companies is not eligible to be distributed to our non-U.S. stockholders free from withholding taxes.
Although most of our investments will be U.S. dollar-denominated, our investments that are denominated in a foreign currency will be subject to the risk that the value of a particular currency will change in relation to one or more other currencies. Among the factors that may affect currency values are trade balances, the level of short-term interest rates, differences in relative values of similar assets in different currencies, long-term opportunities for investment and capital gains and political developments. We may employ hedging techniques to minimize these risks, but we cannot assure you that such strategies will be effective or without risk to us.
We expose ourselves to risks when we engage in hedging transactions.
We have entered, and may in the future enter, into hedging transactions, which may expose us to risks associated with such transactions. We may seek to utilize instruments such as forward contracts, currency options and interest rate swaps, caps, collars and floors to seek to hedge against fluctuations in the relative values of our portfolio positions from changes in currency exchange rates and market interest rates and the relative value of certain debt securities from changes in market interest rates. Use of these hedging instruments may include counter-party credit risk. To the extent we have non-U.S. investments, particularly investments denominated in non-U.S. currencies, our hedging costs will increase.
We also have the ability to borrow in certain foreign currencies under the second amended and restated senior secured revolving credit agreement, as amended, with Truist Bank (as a successor by merger to SunTrust Bank), as administrative agent, and certain lenders, which we refer to as the Revolving Credit Facility. Instead of entering into a foreign exchange forward contract in connection with loans or other investments we have made that are denominated in a foreign currency, we may borrow in that currency to establish a natural hedge against our loan or investment. To the extent the loan or investment is based on a floating rate other than a rate under which we can borrow under our Revolving Credit Facility, we may seek to utilize interest rate derivatives to hedge our exposure to changes in the associated rate.
Hedging against a decline in the values of our portfolio positions would not eliminate the possibility of fluctuations in the values of such positions or prevent losses if the values of such positions were to decline. However, such hedging can establish other positions designed to gain from those same developments, thereby offsetting the decline in the value of such portfolio positions. Such hedging transactions may also limit the opportunity for gain if the values of the underlying portfolio positions were to increase. It also may not be possible to hedge against an exchange rate or interest rate fluctuation that is so generally anticipated that we are not able to enter into a hedging transaction at an acceptable price.
The success of our hedging strategy will depend on our ability to correctly identify appropriate exposures for hedging. To date, we have entered into hedging transactions to seek to reduce currency exchange rate risk and interest rate risk related to specific portfolio companies. In addition, in connection with our 2022 Convertible Notes, 2023 Notes, and 2024 Notes which bear interest at fixed rates, we entered into fixed-to-floating interest rate swaps to continue to align the interest rates of our liabilities with our investment portfolio, which consists of predominately floating rate loans. However, unanticipated changes in currency exchange rates or other exposures that we might hedge may result in poorer overall investment performance than if we had not engaged in any such hedging transactions. In addition, the degree of correlation between price movements of the instruments used in a hedging strategy and price movements in the portfolio positions being hedged may vary, as may the time period in which the hedge is effective relative to the time period of the related exposure.
46
For a variety of reasons, we may not seek to (or be able to) establish a perfect correlation between such hedging instruments and the positions being hedged. Any such imperfect correlation may prevent us from achieving the intended hedge and expose us to risk of loss. In addition, it may not be possible to hedge fully or perfectly against currency fluctuations affecting the value of securities denominated in non-U.S. currencies because the value of those securities is likely to fluctuate as a result of factors not related to currency fluctuations. Income derived from hedging transactions also is not eligible to be distributed to non-U.S. stockholders free from withholding taxes. Changes to the regulations applicable to the financial instruments we use to accomplish our hedging strategy could affect the effectiveness of that strategy. For additional information on these regulatory changes, see “—Risks Related to Our Portfolio Company Investments—The new market structure applicable to derivatives imposed by the Dodd-Frank Act may affect our ability to use over-the-counter (“OTC”) derivatives for hedging purposes.” See also “—Risks Related to Our Portfolio Company Investments—We are exposed to risks associated with changes in interest rates” and “ITEM 7. MANAGEMENT’S DISCUSSION AND ANALYSIS OF FINANCIAL CONDITION AND RESULTS OF OPERATIONS—Results of Operations—Hedging.”
Finally, the SEC has reissued a proposed rule, Rule 18f-4, that if adopted would potentially constrain our ability to use swaps and other derivatives. Among other requirements, the proposed rule could potentially force us to reduce our use of derivatives if the value-at-risk of our investment portfolio including our swap or derivative positions, exceeds 150 percent of a “designated reference index” that is unleveraged and reflects the market or asset classes in which we invest. If we could not identify a suitable reference index, our value-at-risk would not be permitted to exceed 15% of our net assets. In addition, we may be required under the proposed rule to establish a risk management program for our use of swaps or other derivative positions. We cannot assure you when or if the proposed rule will be adopted by the SEC, and if adopted, whether the final rule will similarly constrain our ability to utilize swaps and derivatives in the future.
The new market structure applicable to derivatives imposed by the Dodd-Frank Act may affect our ability to use over-the-counter (“OTC”) derivatives for hedging purposes.
The Dodd-Frank Act enacted, and the Commodity Futures Trading Commission, or CFTC, and SEC have issued or proposed rules to implement, both broad new regulatory requirements and broad new structural requirements applicable to OTC derivatives markets and, to a lesser extent, listed commodity futures (and futures options) markets. Similar changes are in the process of being implemented in other major financial markets.
Recent and anticipated regulatory changes require that certain types of OTC derivatives, including those that we may use for hedging activities such as interest rate and credit default swaps, be cleared and traded on regulated platforms, and these regulatory changes are expected to apply to foreign exchange transactions in the future. Our cleared OTC derivatives (such as the interest rate swaps we entered into in connection with certain investments in portfolio companies and our 2022 Convertible Notes, 2023 Notes, and 2024 Notes) are subject to margin requirements established by regulated clearinghouses, including daily exchanges of cash variation (or mark-to-market) margin and an upfront posting of cash or securities initial margin to cover the clearinghouse’s potential future exposure to the default of a party to a particular OTC derivatives transaction. U.S. regulators have also adopted rules imposing margin requirements for OTC derivatives executed with registered swap dealers that are not cleared. The margin requirements for cleared and uncleared OTC derivatives may require that our Adviser, in order to maintain its exemption from commodity pool operator (“CPO”) registration under the CFTC No-Action Letter 12-40 (as codified by CFTC Rule 4.5), limit our ability to enter into hedging transactions or to obtain synthetic investment exposures, in either case adversely affecting our ability to mitigate risk. Furthermore, any failure by us to fulfill any collateral requirement (e.g., a so-called “margin call”) may result in a default and could have a material adverse impact on our business, financial condition and results of operations.
The Dodd-Frank Act also imposed requirements relating to real-time public and regulatory reporting of OTC derivative transactions, enhanced documentation requirements, position limits on an expanded array of derivatives, and recordkeeping requirements. Taken as a whole, these changes could significantly increase the cost of using uncleared OTC derivatives to hedge risks, including interest rate and foreign exchange risk; reduce the level of exposure we are able to obtain for risk management purposes through OTC derivatives (including as the result of the CFTC imposing position limits on additional products); reduce the amounts available to us to make non-derivatives investments; impair liquidity in certain OTC derivatives; and adversely affect the quality of execution pricing obtained by us, all of which could adversely impact our investment returns.
If we cease to be eligible for an exemption from regulation as a commodity pool operator, our compliance expenses could increase substantially.
Our Adviser has been granted relief under a no-action letter, known as Letter 12-40, issued by the staff of the CFTC. Letter 12-40 relieves our Adviser from registering with the CFTC as the commodity pool operator of us, so long as we:
|
|
• |
continue to be regulated by the SEC as a BDC; |
|
|
• |
confine our trading in CFTC-regulated derivatives within specified thresholds; and |
|
|
• |
are not marketed to the public as a commodity pool or as a vehicle for trading in CFTC-regulated derivatives. |
47
Letter 12-40 has been superseded by recently finalized rules. Pursuant to such recently finalized rules, we will file with the National Futures Association (the “NFA”) a notice of exclusion from registration with the CFTC as a CPO pursuant to CFTC Rule 4.5, which generally imposes the same conditions as Letter 12-40 on us. If we were unable to satisfy the conditions of CFTC Rule 4.5 in the future, our Adviser may be subject to registration with the CFTC as a CPO. Registered CPOs must comply with numerous substantive regulations related to disclosure, reporting and recordkeeping, and are required to become members of the NFA, and be subject to the NFA’s rules and bylaws. Compliance with these additional registration and regulatory requirements could increase our expenses and impact performance.
Our portfolio investments may present special tax issues.
Investments in below-investment grade debt instruments and certain equity securities may present special tax issues for us. U.S. federal income tax rules are not entirely clear about certain issues, including when we may cease to accrue interest, original issue discount or market discount, when and to what extent certain deductions may be taken for bad debts or worthless equity securities, how payments received on obligations in default should be allocated between principal and interest income, as well as whether exchanges of debt instruments in a bankruptcy or workout context are taxable. These matters could cause us to recognize taxable income for U.S. federal income tax purposes, even in the absence of cash or economic gain, and require us to make taxable distributions to our stockholders to maintain our RIC status or preclude the imposition of either U.S. federal corporate income or excise taxation. Additionally, because such taxable income may not be matched by corresponding cash received by us, we may be required to borrow money or dispose of other investments to be able to make distributions to our stockholders. These and other issues will be considered by us, to the extent determined necessary, so that we aim to minimize the level of any U.S. federal income or excise tax that we would otherwise incur. See “ITEM 1. BUSINESS—Regulation as a Business Development Company—Regulated Investment Company Classification” for more information.
If we are not treated as a publicly offered regulated investment company, certain U.S. stockholders will be treated as having received a dividend from us in the amount of such U.S. stockholders’ allocable share of the Management and Incentive Fees paid to our investment adviser and certain of our other expenses, and these fees and expenses will be treated as miscellaneous itemized deductions of such U.S. stockholders.
We expect to be treated as a “publicly offered regulated investment company” as a result of shares of our common stock being treated as regularly traded on an established securities market. However, we cannot assure you that we will be treated as a publicly offered regulated investment company for all years. For example, if our shares are not treated as regularly traded and we are not held by more than 500 persons at all times during the taxable year, we might not be treated as a publicly offered regulated investment company. If we are not treated as a publicly offered regulated investment company for any calendar year, each U.S. stockholder that is an individual, trust or estate will be treated as having received a dividend from us in the amount of such U.S. stockholder’s allocable share of the Management Fees and Incentive Fees paid to our Adviser and certain of our other expenses for the calendar year, and these fees and expenses will be treated as miscellaneous itemized deductions of such U.S. stockholder. Miscellaneous itemized deductions generally are not deductible by individuals, trusts or estates for taxable years beginning after December 31, 2017 and before January 1, 2026.
There are certain risks associated with holding debt obligations that have original issue discount or payment-in-kind interest.
Original issue discount, or OID, may arise if we hold securities issued at a discount, receive warrants in connection with the making of a loan, or in certain other circumstances. OID creates the risk that Incentive Fees will be paid to the Adviser based on non-cash accruals that ultimately may not be realized, while the Adviser will be under no obligation to reimburse us for these fees.
The higher interest rates of OID instruments reflect the payment deferral and increased credit risk associated with these instruments, and OID instruments generally represent a significantly higher credit risk than coupon loans. Even if the accounting conditions for income accrual are met, the borrower could still default when our actual collection is supposed to occur at the maturity of the obligation.
OID instruments may have unreliable valuations because their continuing accruals require continuing judgments about the collectability of the deferred payments and the value of any associated collateral. OID income may also create uncertainty about the source of our cash dividends.
For accounting purposes, any cash dividends to stockholders representing OID income are not treated as coming from paid-in capital, even if the cash to pay them comes from the proceeds of issuances of our common stock. As a result, despite the fact that a dividend representing OID income could be paid out of amounts invested by our stockholders, the 1940 Act does not require that stockholders be given notice of this fact by reporting it as a return of capital.
48
Payment-in-kind, or PIK, interest has the effect of generating investment income at a compounding rate, thereby further increasing the Incentive Fees payable to the Adviser. Similarly, all things being equal, the deferral associated with PIK interest also increases the loan-to-value ratio at a compounding rate.
Risks Related to our Securities
There is a risk that investors in our common stock may not receive dividends or that our dividends may not grow over time.
We intend to continue paying dividends on a quarterly basis to our stockholders out of assets legally available for distribution. We cannot assure you that we will achieve investment results or maintain a tax status that will allow or require any specified level of cash dividends or year-to-year increases in cash dividends. Our ability to pay dividends might be adversely affected by the impact of one or more of the risk factors described in this Annual Report. Due to the asset coverage test applicable to us under the 1940 Act as a BDC or restrictions under our credit facilities, we may be limited in our ability to pay dividends. Although a portion of our expected earnings and dividend distributions will be attributable to net interest income, we do not expect to generate capital gains from the sale of our portfolio investments on a level or uniform basis from quarter to quarter. This may result in substantial fluctuations in our quarterly dividend payments.
In some cases where we receive certain upfront fees in connection with loans we originate, we treat the loan as having OID under applicable accounting and tax regulations, even though we have received the corresponding cash. In other cases, however, we may recognize income before or without receiving the corresponding cash, including in connection with the accretion of OID. For other risks associated with debt obligations treated as having OID, see “—Risks Related to Our Portfolio Company Investments—There are certain risks associated with holding debt obligations that have original issue discount or payment-in-kind interest.”
Therefore, we may be required to make a distribution to our stockholders in order to satisfy the annual distribution requirement necessary to qualify for and maintain RIC tax treatment under Subchapter M of the Code, even though we may not have received the corresponding cash amount. Accordingly, we may have to sell investments at times we would not otherwise consider advantageous, raise additional debt or equity capital or reduce new investment originations to meet these distribution requirements for this purpose. If we are not able to obtain cash from other sources, we may fail to qualify as a RIC and thereby be subject to corporate-level income tax.
To the extent that the amounts distributed by us exceed our current and accumulated earnings and profits, these excess distributions will be treated first as a return of capital to the extent of a stockholder’s tax basis in his or her shares and then as capital gain. Reducing a stockholder’s tax basis will have the effect of increasing his or her gain (or reducing loss) on a subsequent sale of shares.
The part of the Incentive Fee payable by us that relates to our net investment income is computed and paid on income that may include interest that has been accrued but not yet received in cash. If a portfolio company defaults on a loan, it is possible that accrued interest previously used in the calculation of the Incentive Fee will become uncollectible. Consequently, while we may make Incentive Fee payments on income accruals that we may not collect in the future and with respect to which we do not have a clawback right against our Adviser, the amount of accrued income written off in any period will reduce the income in the period in which the write-off is taken and thereby reduce that period’s Incentive Fee payment, if any.
In addition, the middle-market companies in which we intend to invest may be more susceptible to economic downturns than larger operating companies, and therefore may be more likely to default on their payment obligations to us during recessionary periods. Any such defaults could substantially reduce our net investment income available for distribution in the form of dividends to our stockholders.
Investing in our securities may involve a high degree of risk.
The investments we make in accordance with our investment objective may result in a higher amount of risk than alternative investment options and volatility or loss of principal. Our investments in portfolio companies may be highly speculative and aggressive and, therefore, an investment in our securities may not be suitable for someone with lower risk tolerance.
The market price of our common stock may fluctuate significantly.
The market price and liquidity of the market for shares of our common stock may be significantly affected by numerous factors, some of which are beyond our control and may not be directly related to our operating performance. These factors include:
|
|
• |
significant volatility in the market price and trading volume of securities of BDCs or other companies in our sector, which is not necessarily related to the operating performance of these companies; |
49
|
|
• |
the exclusion of BDC common stock from certain market indices, which could reduce the ability of certain investment funds to own our common stock and put short term selling pressure on our common stock; |
|
|
• |
loss of RIC or BDC status; |
|
|
• |
changes or perceived changes in earnings or variations in operating results; |
|
|
• |
changes in our portfolio of investments; |
|
|
• |
changes or perceived changes in the value of our portfolio of investments; |
|
|
• |
changes in accounting guidelines governing valuation of our investments; |
|
|
• |
any shortfall in revenue or net income or any increase in losses from levels expected by investors or securities analysts; |
|
|
• |
any downgrades to our credit rating or placement on a negative watch status by a credit rating agency; |
|
|
• |
departure of the Adviser’s or any of its affiliates’ key personnel; |
|
|
• |
operating performance of companies comparable to us; |
|
|
• |
short-selling pressure with respect to shares of our common stock or BDCs generally; |
|
|
• |
future sales of our securities convertible into or exchangeable or exercisable for our common stock or the conversion of such securities, including our 2022 Convertible Notes; |
|
|
• |
uncertainty surrounding the strength of the U.S. economic recovery; |
|
|
• |
concerns regarding European sovereign debt and Brexit; |
|
|
• |
concerns regarding volatility in the Chinese stock market and Chinese currency; |
|
|
• |
concerns regarding U.S. and global tariffs and trade policy; |
|
|
• |
fluctuations in base interest rates, such as LIBOR, EURIBOR, the Federal Funds Rate or the Prime Rate; |
|
|
• |
the impact of public health epidemics on the global economy, such as the coronavirus currently impacting China; |
|
|
• |
general economic trends and other external factors; and |
|
|
• |
loss of a major funding source. |
In the past, following periods of volatility in the market price of a company’s securities, securities class action litigation has often been brought against that company. If our stock price fluctuates significantly, we may be the target of securities litigation in the future. Securities litigation could result in substantial costs and divert management’s attention and resources from our business.
We cannot assure you that the market price of shares of our common stock will not decline.
Shares of closed-end investment companies, including BDCs, frequently trade at a discount from their net asset value and our stock may also be discounted in the market. This characteristic of closed-end investment companies is separate and distinct from the risk that our net asset value per share of common stock may decline. In the past, shares of BDCs, including at times shares of our common stock, have traded at prices per share below net asset value per share. We cannot predict whether our common stock will trade at a price per share above, at or below net asset value per share. In addition, if our common stock trades below its net asset value per share, we will generally not be able to sell additional shares of our common stock to the public at its market price without first obtaining the approval of a majority of our stockholders (including a majority of our unaffiliated stockholders) and our Independent Directors for such issuance. See“—Risks Related to Our Business and Structure—Regulations governing our operation as a BDC affect our ability to, and the way in which we, raise additional capital.”
Sales of substantial amounts of our common stock in the public market may have an adverse effect on the market price of our common stock.
Sales of substantial amounts of our common stock, the availability of such common stock for sale (including as a result of the conversion of our 2022 Convertible Notes into common stock) or the perception that such sales could occur could adversely affect the prevailing market prices for our common stock. If this occurs, it could impair our ability to raise additional capital through the sale of equity securities should we desire to do so. We cannot predict what effect, if any, future sales of securities or the availability of securities for future sales will have on the market price of our common stock prevailing from time to time.
50
Our stockholders may experience dilution upon the conversion of the 2022 Convertible Notes.
Our 2022 Convertible Notes are convertible into shares of our common stock beginning on February 1, 2022, or earlier, under certain circumstances. Upon conversion of our 2022 Convertible Notes, we have the choice to pay or deliver, as the case may be, at our election, cash, shares of our common stock or a combination of cash and shares of our common stock. The estimated adjusted conversion price of the 2022 Convertible Notes is $20.66 per share, in each case taking into account certain de minimis adjustments that will be made on the conversion date and subject to further adjustment in certain circumstances. If we elect to deliver shares of common stock upon a conversion at the time our tangible book value per share exceeds the conversion price in effect at such time, our stockholders may incur dilution. In addition, our stockholders will experience dilution in their ownership percentage of common stock upon our issuance of common stock in connection with the conversion of the 2022 Convertible Notes and any dividends paid on our common stock will also be paid on shares issued in connection with such conversion after such issuance.
Our stockholders will experience dilution in their ownership percentage if they opt out of our dividend reinvestment plan.
We have adopted a dividend reinvestment plan, pursuant to which we will reinvest all cash dividends and distributions declared by the Board on behalf of investors who do not elect to receive their dividends in cash. As a result, if the Board authorizes, and we declare, a cash dividend or other distribution, then our stockholders who have not opted out of our dividend reinvestment plan will have their cash distributions automatically reinvested in additional common stock, rather than receiving the cash dividend or other distribution. See “ITEM 1. BUSINESS—Dividend Policy” and “ITEM 1. BUSINESS—Dividend Reinvestment Plan” for a description of our dividend policy and obligations.
In addition, the number of shares issued pursuant to the dividend reinvestment plan will be determined based on the market price of shares of our common stock, except in circumstances where the market price exceeds our most recently computed net asset value per share, in which case we will issue shares at the greater of (i) the most recently computed net asset value per share and (ii) 95% of the current market price per share or such lesser discount to the current market price per share that still exceeds the most recently computed net asset value per share. Accordingly, participants in the dividend reinvestment plan may receive a greater number of shares of our common stock than the number of shares associated with the market price of our common stock, resulting in dilution for other stockholders. Stockholders that opt out of our dividend reinvestment plan will experience dilution in their ownership percentage of our common stock over time.
Purchases of our common stock by us under the Company 10b5-1 Plan may result in the price of our common stock being higher than the price that otherwise might exist in the open market.
We have entered into an agreement with Goldman Sachs & Co. LLC, which we refer to as the Company 10b5-1 Plan, in accordance with Rules 10b5-1 and 10b-18 under the Exchange Act, under which Goldman Sachs & Co. LLC, as agent for us, will buy up to $50 million of our common stock in the aggregate during the period ending on the earlier of the date on which all the capital committed to the plan has been exhausted or May 31, 2020.
Whether purchases will be made under the Company 10b5-1 Plan and how much will be purchased at any time is uncertain, dependent on prevailing market prices and trading volumes, all of which we cannot predict. These activities may have the effect of maintaining the market price of our common stock or retarding a decline in the market price of the common stock, and, as a result, the price of our common stock may be higher than the price that otherwise might exist in the open market.
Purchases of our common stock by us under the Company 10b5-1 Plan may result in dilution to our net asset value per share.
On May 2, 2019, the Board authorized an amendment to the Company 10b5-1 Plan to, among other things, revise the market prices at which Goldman Sachs & Co. LLC, as our agent, is required to repurchase shares of common stock on our behalf from just below our most recently reported net asset value per share to just below 1.05 times the most recently reported net asset value per share, less the amount of any supplemental dividend declared for that quarter but not yet reflected in the most recently reported net asset value per share (including any updates, corrections or adjustments publicly announced by us to any previously announced net asset value per share or supplemental dividend). Under the Company 10b5-1 Plan, the agent will increase the volume of purchases made as the price of our common stock declines, subject to volume restrictions.
Dilution to our net asset value per share will occur if we purchase shares of our common stock at a price above the net asset value per share, as it would cause a proportionately smaller increase in our stockholders’ interest in our earnings and assets and their voting interest in us than the decrease in our assets resulting from such repurchase.
As a result of any such dilution, our market price per share may decline. The actual dilutive effect will depend on the number of shares of common stock that could be so repurchased, the price and the timing of any repurchases under the Company 10b5-1 Plan.
51
ITEM 1B. UNRESOLVED STAFF COMMENTS
None.
We maintain our principal executive office at 2100 McKinney Avenue, Suite 1500, Dallas, Texas 75201. We do not own any real estate.
From time to time, we may be a party to certain legal proceedings in the ordinary course of business, including proceedings relating to the enforcement of our rights under loans to or other contracts with our portfolio companies. We are not currently subject to any material legal proceedings, nor, to our knowledge, is any material legal proceeding threatened against us.
ITEM 4. MINE SAFETY DISCLOSURES
Not applicable.
52
ITEM 5. MARKET FOR REGISTRANT’S COMMON EQUITY, RELATED STOCKHOLDER MATTERS AND ISSUER PURCHASES OF EQUITY SECURITIES
Price Range of Common Stock
Our common stock is traded on the NYSE under the symbol “TSLX.” Our common stock has historically traded at prices both above and below our net asset value per share. It is not possible to predict whether our common stock will trade at a price per share at, above or below net asset value per share. See “ITEM 1A. RISK FACTORS—Risks Related to our Securities—We cannot assure you that the market price of shares of our common stock will not decline.”
Holders
As of February 19, 2020, there were approximately 5 holders of record of our common stock (including Cede & Co.).
Issuer Purchases of Equity Securities
None.
Stock Performance Graph
The following graph compares the total return on our common stock from December 31, 2014 (the date of our IPO) to December 31, 2019 with that of the Standard & Poor’s BDC Index, the Standard & Poor’s 500 Stock Index, the S&P LSTA Leveraged Loan Index (“Leverage Loan Index”), and the Bloomberg Barclays US Corporate High Yield Total Return Index (“High Yield Bond Index”). This graph assumes that on December 31, 2014, $100 was invested in our common stock, the Standard & Poor’s BDC Index, the Standard & Poor’s 500 Stock Index, the Leverage Loan Index and the High Yield Bond Index. The graph also assumes the reinvestment of all cash dividends prior to any tax effect. The graph and other information furnished under this Part II Item 5 of this annual report on Form 10-K shall not be deemed to be “soliciting material” or to be “filed” with the SEC or subject to Regulation 14A or 14C under, or to the liabilities of Section 18 of, the Exchange Act. The performance included in the below graph is not necessarily indicative of future performance.
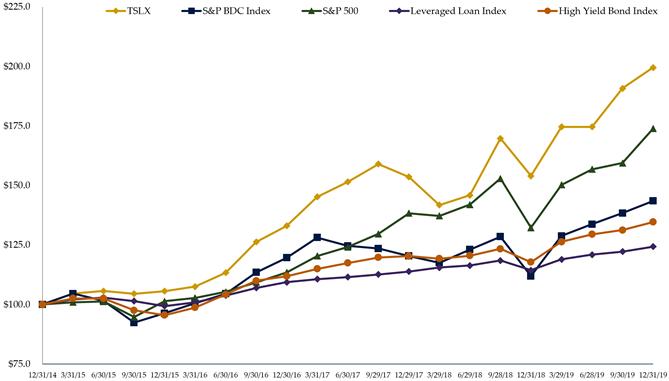
53
Information about our senior securities is shown in the following table as of the end of each fiscal year ended December 31 since we commenced operations. The report of our independent registered public accounting firm, KPMG LLP, on the senior securities table as of December 31, 2019 is attached as an exhibit to this annual report on Form 10-K.
|
Class and Year/Period |
|
Total Amount Outstanding Exclusive of Treasury Securities (1) ($ in millions) |
|
|
Asset Coverage Per Unit |
|
|
Involuntary Liquidating Preference Per Unit |
|
|
Average Market Value Per Unit |
|||
|
Revolving Credit Facilities |
|
|
|
|
|
|
|
|
|
|
|
|
|
|
|
December 31, 2019 |
|
$ |
495.7 |
|
|
$ |
2,004.1 |
|
|
$ |
— |
|
|
N/A |
|
December 31, 2018 |
|
|
187.5 |
|
|
|
2,705.2 |
|
|
|
— |
|
|
N/A |
|
December 31, 2017 |
|
|
486.8 |
|
|
|
2,355.3 |
|
|
|
— |
|
|
N/A |
|
December 31, 2016 |
|
|
578.7 |
|
|
|
2,376.6 |
|
|
|
— |
|
|
N/A |
|
December 31, 2015 |
|
|
540.3 |
|
|
|
2,257.3 |
|
|
|
— |
|
|
N/A |
|
December 31, 2014 |
|
|
283.9 |
|
|
|
3,110.3 |
|
|
|
— |
|
|
N/A |
|
December 31, 2013 |
|
|
432.3 |
|
|
|
2,329.5 |
|
|
|
— |
|
|
N/A |
|
December 31, 2012 |
|
|
331.8 |
|
|
|
2,445.9 |
|
|
|
— |
|
|
N/A |
|
December 31, 2011 |
|
|
155.0 |
|
|
|
2,116.7 |
|
|
|
— |
|
|
N/A |
|
Convertible Senior Notes due 2019 |
|
|
|
|
|
|
|
|
|
|
|
|
|
|
|
December 31, 2019 |
|
$ |
— |
|
|
$ |
— |
|
|
$ |
— |
|
|
N/A |
|
December 31, 2018 |
|
|
114.3 |
|
|
|
2,705.2 |
|
|
|
— |
|
|
N/A |
|
December 31, 2017 |
|
|
113.7 |
|
|
|
2,355.3 |
|
|
|
— |
|
|
N/A |
|
December 31, 2016 |
|
|
113.1 |
|
|
|
2,376.6 |
|
|
|
— |
|
|
N/A |
|
December 31, 2015 |
|
|
112.5 |
|
|
|
2,257.3 |
|
|
|
— |
|
|
N/A |
|
December 31, 2014 |
|
|
111.9 |
|
|
|
3,110.3 |
|
|
|
— |
|
|
N/A |
|
Convertible Senior Notes due 2022 |
|
|
|
|
|
|
|
|
|
|
|
|
|
|
|
December 31, 2019 |
|
$ |
171.9 |
|
|
$ |
2,004.1 |
|
|
$ |
— |
|
|
N/A |
|
December 31, 2018 |
|
|
171.7 |
|
|
|
2,705.2 |
|
|
|
— |
|
|
N/A |
|
December 31, 2017 |
|
|
114.7 |
|
|
|
2,355.3 |
|
|
|
— |
|
|
N/A |
|
2023 Notes |
|
|
|
|
|
|
|
|
|
|
|
|
|
|
|
December 31, 2019 |
|
$ |
150.0 |
|
|
$ |
2,004.1 |
|
|
$ |
— |
|
|
N/A |
|
December 31, 2018 |
|
|
150.0 |
|
|
|
2,705.2 |
|
|
|
— |
|
|
N/A |
|
2024 Notes |
|
|
|
|
|
|
|
|
|
|
|
|
|
|
|
December 31, 2019 |
|
$ |
297.2 |
|
|
$ |
2,004.1 |
|
|
$ |
— |
|
|
N/A |
|
(1) |
Total amount of each class of senior securities outstanding at carrying value, excluding the impact of deferred financing costs and hedge accounting relationships, at the end of the period presented. |
|
(2) |
Asset coverage per unit is the ratio of the carrying value of our total assets, less all liabilities excluding indebtedness represented by senior securities in this table, to the aggregate amount of senior securities representing indebtedness. Asset coverage per unit is expressed in terms of dollar amounts per $1,000 of indebtedness and is calculated on a consolidated basis. |
|
(3) |
The amount to which such class of senior security would be entitled upon our involuntary liquidation in preference to any security junior to it. The “-” in this column indicates information that the SEC expressly does not require to be disclosed for certain types of senior securities. |
|
(4) |
Not applicable because the senior securities are not registered for public trading. |
ITEM 6. SELECTED FINANCIAL DATA
The table below sets forth our selected consolidated historical financial data for the periods indicated. The selected consolidated financial data for the years ended December 31, 2019, 2018, 2017, 2016 and 2015 have been derived from our audited consolidated financial statements, which are included elsewhere in this Form 10-K and our SEC filings.
54
The selected consolidated financial information and other data presented below should be read in conjunction with the information contained in “ITEM 7. MANAGEMENT’S DISCUSSION AND ANALYSIS OF FINANCIAL CONDITION AND RESULTS OF OPERATIONS,” the audited consolidated financial statements and the notes thereto included elsewhere in this annual report on Form 10-K.
|
|
|
Year Ended |
|
|
Year Ended |
|
|
Year Ended |
|
|
Year Ended |
|
|
Year Ended |
|
|||||
|
|
|
December 31, |
|
|
December 31, |
|
|
December 31, |
|
|
December 31, |
|
|
December 31, |
|
|||||
|
($ in millions, except per share amounts) |
|
2019 |
|
|
2018 |
|
|
2017 |
|
|
2016 |
|
|
2015 |
|
|||||
|
Consolidated Statements of Operations Data |
|
|
|
|
|
|
|
|
|
|
|
|
|
|
|
|
|
|
|
|
|
Income |
|
|
|
|
|
|
|
|
|
|
|
|
|
|
|
|
|
|
|
|
|
Total Investment Income |
|
$ |
251.5 |
|
|
$ |
261.9 |
|
|
$ |
210.9 |
|
|
$ |
192.4 |
|
|
$ |
173.4 |
|
|
Expenses |
|
|
|
|
|
|
|
|
|
|
|
|
|
|
|
|
|
|
|
|
|
Net Expenses |
|
|
119.4 |
|
|
|
114.6 |
|
|
|
87.8 |
|
|
|
82.8 |
|
|
|
76.6 |
|
|
Net Investment Income Before Income Taxes |
|
|
132.1 |
|
|
|
147.3 |
|
|
|
123.1 |
|
|
|
109.6 |
|
|
|
96.8 |
|
|
Net Investment Income |
|
|
128.3 |
|
|
|
143.9 |
|
|
|
120.3 |
|
|
|
107.3 |
|
|
|
95.3 |
|
|
Total Change in Net Unrealized Gain (Loss) |
|
|
24.3 |
|
|
|
(14.2 |
) |
|
|
5.3 |
|
|
|
29.8 |
|
|
|
(28.5 |
) |
|
Total Net Realized Gain (Loss) |
|
|
2.0 |
|
|
|
(10.7 |
) |
|
|
(14.0 |
) |
|
|
(0.1 |
) |
|
|
(3.2 |
) |
|
Increase in Net Assets Resulting from Operations |
|
|
154.6 |
|
|
|
119.0 |
|
|
|
111.6 |
|
|
|
137.0 |
|
|
|
63.6 |
|
|
Earnings per common share—basic and diluted (1) |
|
$ |
2.34 |
|
|
$ |
1.86 |
|
|
$ |
1.86 |
|
|
$ |
2.34 |
|
|
$ |
1.18 |
|
|
|
|
For the Year Ended December 31, |
|
|||||||||||||||||
|
($ in millions, except per share amounts) |
|
2019 |
|
|
2018 |
|
|
2017 |
|
|
2016 |
|
|
2015 |
|
|||||
|
Consolidated Balance Sheet Data |
|
|
|
|
|
|
|
|
|
|
|
|
|
|
|
|
|
|
|
|
|
Cash and cash equivalents |
|
$ |
14.1 |
|
|
$ |
10.6 |
|
|
$ |
6.7 |
|
|
$ |
6.0 |
|
|
$ |
7.5 |
|
|
Investments at fair value |
|
$ |
2,245.9 |
|
|
$ |
1,706.0 |
|
|
$ |
1,693.7 |
|
|
$ |
1,657.4 |
|
|
$ |
1,485.7 |
|
|
Total assets |
|
$ |
2,280.9 |
|
|
$ |
1,730.3 |
|
|
$ |
1,720.2 |
|
|
$ |
1,675.5 |
|
|
$ |
1,506.5 |
|
|
Total debt |
|
$ |
1,094.5 |
|
|
$ |
608.0 |
|
|
$ |
703.4 |
|
|
$ |
680.7 |
|
|
$ |
642.4 |
|
|
Total liabilities |
|
$ |
1,161.6 |
|
|
$ |
667.1 |
|
|
$ |
750.9 |
|
|
$ |
723.3 |
|
|
$ |
685.8 |
|
|
Total net assets |
|
$ |
1,119.3 |
|
|
$ |
1,063.2 |
|
|
$ |
969.3 |
|
|
$ |
952.2 |
|
|
$ |
820.7 |
|
|
Net asset value per share |
|
$ |
16.83 |
|
|
$ |
16.25 |
|
|
$ |
16.09 |
|
|
$ |
15.95 |
|
|
$ |
15.15 |
|
|
Other Data: |
|
|
|
|
|
|
|
|
|
|
|
|
|
|
|
|
|
|
|
|
|
Number of portfolio companies at year end |
|
|
63 |
|
|
|
46 |
|
|
|
45 |
|
|
|
52 |
|
|
|
46 |
|
|
Dividends declared per share |
|
$ |
1.81 |
|
|
$ |
1.78 |
|
|
$ |
1.75 |
|
|
$ |
1.56 |
|
|
$ |
1.56 |
|
|
Total return based on net asset value (2) |
|
|
14.7 |
% |
|
|
12.1 |
% |
|
|
11.9 |
% |
|
|
15.5 |
% |
|
|
7.6 |
% |
|
Weighted average yield of debt and income producing securities at fair value (3) |
|
|
10.5 |
% |
|
|
11.6 |
% |
|
|
10.7 |
% |
|
|
10.4 |
% |
|
|
10.3 |
% |
|
Weighted average yield of debt and income producing securities at amortized cost (3) |
|
|
10.7 |
% |
|
|
11.7 |
% |
|
|
10.8 |
% |
|
|
10.4 |
% |
|
|
10.1 |
% |
|
Fair value of debt investments as a percentage of principal |
|
|
99.8 |
% |
|
|
99.4 |
% |
|
|
99.4 |
% |
|
|
98.5 |
% |
|
|
96.7 |
% |
|
Weighted average fair value of debt investments as a percentage of call price |
|
|
96.2 |
% |
|
|
95.9 |
% |
|
|
95.6 |
% |
|
|
95.0 |
% |
|
|
92.1 |
% |
|
(1) |
Earnings per common share is based on weighted average shares of common stock outstanding during the period. |
|
(2) |
U.S. Generally Accepted Accounting Principles (“U.S. GAAP”) requires that total return be calculated as the change in net asset value per share during the period plus declared dividends per share, divided by the beginning net asset value per share. Our total return set forth in the table above for the years ended December 31, 2019, 2018, 2017, 2016, and 2015 reflects the Adviser’s waivers of its right to receive a portion of the Management Fee and Incentive Fees with respect to our ownership of shares of common stock of Triangle Capital Corp. and Oxford Square Capital Corp. The Management Fee, excluding the effects of the waivers, would have been $28.6 million, $24.3 million, $24.3 million, and $21.3 million for the years ended December 31, 2018, 2017, 2016, and 2015, respectively. The Incentive Fee excluding the effects of the waiver would have been $30.5 million, $25.5 million, $22.7 million, and $20.2 million for the years ended December 31, 2018, 2017, 2016, and 2015, respectively. The Adviser did not waive any Management Fees or Incentive Fees for the year ended December 31, 2019. The corresponding impact on the total return calculation is not material. |
|
(3) |
Weighted average yield on debt and income producing securities at fair value is computed as (a) the annual stated interest rate or yield earned plus additional interest, if any, as a result of arrangements between us and other lenders in any syndication plus the net annual amortization of original issue discount and market discount earned on accruing debt and income producing securities, divided by (b) total debt and income producing securities at fair value. Weighted average yield on debt and income producing securities at amortized cost is computed as (a) the annual stated interest rate or yield earned plus additional interest, if any, as a result of arrangements between us and other lenders in any syndication plus the net annual amortization of original issue discount and market discount earned on accruing debt and income producing securities, divided by (b) total debt and income producing securities at amortized cost. |
55
ITEM 7. MANAGEMENT’S DISCUSSION AND ANALYSIS OF FINANCIAL CONDITION AND RESULTS OF OPERATIONS
Introduction
Management’s Discussion and Analysis should be read in conjunction with ITEM 8. CONSOLIDATED FINANCIAL STATEMENTS AND SUPPLEMENTARY DATA. This discussion contains forward-looking statements and involves numerous risks and uncertainties, including, but not limited to, those described in “ITEM 1A. RISK FACTORS.” Actual results may differ materially from those contained in any forward-looking statements.
Overview
TPG Specialty Lending, Inc. is a Delaware corporation formed on July 21, 2010. The Adviser is our external manager. We have three wholly owned subsidiaries, TC Lending, LLC, a Delaware limited liability company, which holds a California finance lender and broker license, TPG SL SPV, LLC, a Delaware limited liability company, in which we hold assets that were previously used to support our asset-backed credit facility, and TSL MR, LLC, a Delaware limited liability company, in which we hold certain investments.
We have elected to be regulated as a BDC under the 1940 Act and as a RIC under the Code. We made our BDC election on April 15, 2011. As a result, we are required to comply with various statutory and regulatory requirements, such as:
|
|
• |
the requirement to invest at least 70% of our assets in “qualifying assets”; |
|
|
• |
source of income limitations; |
|
|
• |
asset diversification requirements; and |
|
|
• |
the requirement to distribute (or be treated as distributing) in each taxable year at least 90% of our investment company taxable income and tax-exempt interest for that taxable year. |
Our shares are currently listed on the NYSE under the symbol “TSLX.”
On August 4, 2015, our Board authorized us to enter into a stock repurchase plan, the Company 10b5-1 Plan, to acquire up to $50 million in the aggregate of our common stock at prices just below our net asset value per share over an initial six month period, in accordance with the guidelines specified in Rule 10b-18 and Rule 10b5-1 of the Exchange Act, and has continued to authorize extensions of the plan termination date prior to its expiration since that time. We put the Company 10b5-1 Plan in place because we believe that, in current market conditions, if our common stock is trading below our then-current net asset value per share, it is in the best interest of our stockholders for us to reinvest in our portfolio and increase our leverage ratio through share repurchases.
The Company 10b5-1 Plan is designed to allow us to repurchase our common stock at times when we otherwise might be prevented from doing so under insider trading laws. The Company 10b5-1 Plan, as currently in effect requires Goldman Sachs & Co. LLC, as our agent, to repurchase shares of common stock on our behalf when the market price per share is just below 1.05x the most recently reported net asset value per share in our public financial statements or publicly announced by us, less the amount of any supplemental dividend that has been publicly announced by us but that has yet to be reflected in the net asset value per share most recently reported in our public financial statements (including any updates, corrections or adjustments publicly announced by us to any such net asset value per share or supplemental dividend). Under the Company 10b5-1 Plan, the agent will increase the volume of purchases made as the price of our common stock declines, subject to volume restrictions. The timing and amount of any stock repurchases depend on the terms and conditions of the Company 10b5-1 Plan, the market price of our common stock and trading volumes, and no assurance can be given that any particular amount of common stock will be repurchased.
On November 5, 2019, the Board authorized the extension of the termination date of the Company 10b5-1 Plan to May 31, 2020. Unless extended or terminated by the Board, the Company 10b5-1 Plan will be in effect through the earlier of May 31, 2020 or such time as the current approved repurchase amount of up to $50 million has been fully utilized, subject to certain conditions.
Our Investment Framework
We are a specialty finance company focused on lending to middle-market companies. Since we began our investment activities in July 2011, through December 31, 2019, we have originated more than $12.5 billion aggregate principal amount of investments and retained approximately $6.3 billion aggregate principal amount of these investments on our balance sheet prior to any subsequent exits and repayments. We seek to generate current income primarily in U.S.-domiciled middle-market companies through direct originations of senior secured loans and, to a lesser extent, originations of mezzanine and unsecured loans and investments in corporate bonds and equity securities.
56
By “middle-market companies,” we mean companies that have annual EBITDA, which we believe is a useful proxy for cash flow, of $10 million to $250 million, although we may invest in larger or smaller companies on occasion. As of December 31, 2019, our core portfolio companies, which excludes certain investments that fall outside of our typical borrower profile and represent 77.2% of our total investments based on fair value, had weighted average annual revenue of $113.9 million and weighted average annual EBITDA of $34.5 million.
We invest in first-lien debt, second-lien debt, mezzanine and unsecured debt and equity and other investments. Our first-lien debt may include stand-alone first-lien loans; “last out” first-lien loans, which are loans that have a secondary priority behind super-senior “first out” first-lien loans; “unitranche” loans, which are loans that combine features of first-lien, second-lien and mezzanine debt, generally in a first-lien position; and secured corporate bonds with similar features to these categories of first-lien loans. Our second-lien debt may include secured loans, and, to a lesser extent, secured corporate bonds, with a secondary priority behind first-lien debt.
The debt in which we invest typically is not rated by any rating agency, but if these instruments were rated, they would likely receive a rating of below investment grade (that is, below BBB- or Baa3 as defined by Standard & Poor’s and Moody’s Investors Services, respectively), which is often referred to as “junk.”
The companies in which we invest use our capital to support organic growth, acquisitions, market or product expansion and recapitalizations (including restructurings). As of December 31, 2019, the largest single investment based on fair value represented 4.0% of our total investment portfolio.
As of December 31, 2019, the average investment size in each of our portfolio companies was approximately $35.7 million based on fair value.
Through our Adviser, we consider potential investments utilizing a four-tiered investment framework and against our existing portfolio as a whole:
Business and sector selection. We focus on companies with enterprise value between $50 million and $1 billion. When reviewing potential investments, we seek to invest in businesses with high marginal cash flow, recurring revenue streams and where we believe credit quality will improve over time. We look for portfolio companies that we think have a sustainable competitive advantage in growing industries or distressed situations. We also seek companies where our investment will have a low loan-to-value ratio.
We currently do not limit our focus to any specific industry and we may invest in larger or smaller companies on occasion. We classify the industries of our portfolio companies by end-market (such as healthcare, and business services) and not by the products or services (such as software) directed to those end-markets.
As of December 31, 2019, the largest industry represented 16.8% of our total investment portfolio based on fair value.
Investment Structuring. We focus on investing at the top of the capital structure and protecting that position. As of December 31, 2019, approximately 97.1% of our portfolio was invested in secured debt, including 96.5% in first-lien debt investments. We carefully perform diligence and structure investments to include strong investor covenants. As a result, we structure investments with a view to creating opportunities for early intervention in the event of non-performance or stress. In addition, we seek to retain effective voting control in investments over the loans or particular class of securities in which we invest through maintaining affirmative voting positions or negotiating consent rights that allow us to retain a blocking position. We also aim for our loans to mature on a medium term, between two to six years after origination. For the year ended December 31, 2019, the weighted average term on new investment commitments in new portfolio companies was 4.6 years.
Deal Dynamics. We focus on, among other deal dynamics, direct origination of investments, where we identify and lead the investment transaction. A substantial majority of our portfolio investments are sourced through our direct or proprietary relationships.
Risk Mitigation. We seek to mitigate non-credit-related risk on our returns in several ways, including call protection provisions to protect future interest income. As of December 31, 2019, we had call protection on 87.8% of our debt investments based on fair value, with weighted average call prices of 105.5% for the first year, 103.1% for the second year and 101.1% for the third year, in each case from the date of the initial investment. As of December 31, 2019, 99.2% of our debt investments based on fair value bore interest at floating rates (when including investment specific hedges), with 93.5% of these subject to interest rate floors, which we believe helps act as a portfolio-wide hedge against inflation.
57
Relationship with our Adviser and TSSP
Our Adviser is a Delaware limited liability company. Our Adviser acts as our investment adviser and administrator and is a registered investment adviser with the SEC under the Advisers Act. Our Adviser sources and manages our portfolio through a dedicated team of investment professionals predominately focused on us. Our Investment Team is led by our Chairman and Chief Executive Officer and our Adviser’s Co-Chief Investment Officer Joshua Easterly and our Adviser’s Co-Chief Investment Officer Alan Waxman, both of whom have substantial experience in credit origination, underwriting and asset management. Our investment decisions are made by our Investment Review Committee, which includes senior personnel of our Adviser and TPG Sixth Street Partners, or TSSP.
TSSP is a global finance and investment business with approximately $33 billion of assets under management as of September 30, 2019. TSSP’s core platforms include TPG Specialty Lending, TSL Europe (TSLE), which is aimed at European middle-market loan originations, TSSP Adjacent Opportunities (TAO), which has the flexibility to invest across all of TSSP’s private credit market investments, TSSP Opportunities Partners (TOP), which focuses on actively managed opportunistic investments across the credit cycle, TPG Institutional Credit Partners (TICP), which is the firm’s “public-side” credit investment platform focused on investment opportunities in broadly syndicated leveraged loan markets, and TSSP Capital Solutions (TCS), which provides financing solutions to growing companies. TSSP has a long-term oriented, highly flexible capital base that allows it to invest across industries, geographies, capital structures and asset classes. TSSP has extensive experience with highly complex, global public and private investments executed through primary originations, secondary market purchases and restructurings, and has a team of over 250 investment and operating professionals. As of December 31, 2019, thirty four (34) of these personnel are dedicated to our business, including twenty six (26) investment professionals.
Our Adviser consults with TSSP in connection with a substantial number of our investments. The TSSP platform provides us with a breadth of large and scalable investment resources. We believe we benefit from TSSP’s market expertise, insights into industry, sector and macroeconomic trends and intensive due diligence capabilities, which help us discern market conditions that vary across industries and credit cycles, identify favorable investment opportunities and manage our portfolio of investments. TSSP and its affiliates will refer all middle-market loan origination activities for companies domiciled in the United States to us and conduct those activities through us. The Adviser will determine whether it would be permissible, advisable or otherwise appropriate for us to pursue a particular investment opportunity allocated to us.
On December 16, 2014, we were granted an exemptive order from the SEC that allows us to co-invest, subject to certain conditions and to the extent the size of an investment opportunity exceeds the amount our Adviser has independently determined is appropriate to invest, with certain of our affiliates (including affiliates of TSSP) in middle-market loan origination activities for companies domiciled in the United States and certain “follow-on” investments in companies in which we have already co-invested pursuant to the order and remain invested. On January 16, 2020, we filed a further application for co-investment exemptive relief with the SEC to better align our existing co-investment relief with more recent SEC exemptive orders. There can be no assurance when or if the SEC will grant a further order in response to our application. Until such time a new order is granted, we will continue to operate under the terms of our current exemptive order.
We believe our ability to co-invest with TSSP affiliates is particularly useful where we identify larger capital commitments than otherwise would be appropriate for us. We expect that with the ability to co-invest with TSSP affiliates we will continue to be able to provide “one-stop” financing to a potential portfolio company in these circumstances, which may allow us to capture opportunities where we alone could not commit the full amount of required capital or would have to spend additional time to locate unaffiliated co-investors.
Under the terms of the Investment Advisory Agreement and Administration Agreement, the Adviser’s services are not exclusive, and the Adviser is free to furnish similar or other services to others, so long as its services to us are not impaired. Under the terms of the Investment Advisory Agreement, we will pay the Adviser the base management fee, or the Management Fee, and may also pay certain incentive fees, or the Incentive Fees.
Under the terms of the Administration Agreement, the Adviser also provides administrative services to us. These services include providing office space, equipment and office services, maintaining financial records, preparing reports to stockholders and reports filed with the SEC, and managing the payment of expenses and the oversight of the performance of administrative and professional services rendered by others. Certain of these services are reimbursable to the Adviser under the terms of the Administration Agreement.
58
Key Components of Our Results of Operations
Investments
We focus primarily on the direct origination of loans to middle-market companies domiciled in the United States.
Our level of investment activity (both the number of investments and the size of each investment) can and does vary substantially from period to period depending on many factors, including the amount of debt and equity capital generally available to middle-market companies, the level of merger and acquisition activity for such companies, the general economic environment and the competitive environment for the types of investments we make.
In addition, as part of our risk strategy on investments, we may reduce certain levels of investments through partial sales or syndication to additional investors.
Revenues
We generate revenues primarily in the form of interest income from the investments we hold. In addition, we may generate income from dividends on direct equity investments, capital gains on the sale of investments and various loan origination and other fees. Our debt investments typically have a term of two to six years, and, as of December 31, 2019, 99.2% of these investments based on fair value bore interest at a floating rate (when including investment specific hedges), with 93.5% of these subject to interest rate floors. Interest on debt investments is generally payable quarterly or semiannually. Some of our investments provide for deferred interest payments or PIK interest. For the year ended December 31, 2019, 3.0% of our total investment income was comprised of PIK interest.
Changes in our net investment income are primarily driven by the spread between the payments we receive from our investments in our portfolio companies against our cost of funding, rather than by changes in interest rates. Our investment portfolio primarily consists of floating rate loans, and our credit facilities, 2022 Convertible Notes, 2023 Notes and 2024 Notes, after taking into account the effect of the interest rate swaps we have entered into in connection with these securities, all bear interest at floating rates. Macro trends in base interest rates like LIBOR or other alternate reference rates may affect our net investment income over the long term. However, because we generally originate loans to a small number of portfolio companies each quarter, and those investments also vary in size, our results in any given period—including the interest rate on investments that were sold or repaid in a period compared to the interest rate of new investments made during that period—often are idiosyncratic, and reflect the characteristics of the particular portfolio companies that we invested in or exited during the period and not necessarily any trends in our business.
In addition to interest income, our net investment income is also driven by prepayment and other fees, which also can vary significantly from quarter to quarter. The level of prepayment fees is generally correlated to the movement in credit spreads and risk premiums, but also will vary based on corporate events that may take place at an individual portfolio company in a given period—e.g., merger and acquisition activity, initial public offerings and restructurings. As noted above, generally a small but varied number of portfolio companies may make prepayments in any quarter, meaning that changes in the amount of prepayment fees received can vary significantly between periods and can vary without regard to underlying credit trends.
Loan origination fees, original issue discount and market discount or premium are capitalized, and we accrete or amortize such amounts as interest income using the effective interest method for term instruments and the straight-line method for revolving or delayed draw instruments. Repayments of our debt investments can reduce interest income from period to period. We record prepayment premiums on loans as interest income when earned. We also may generate revenue in the form of commitment, amendment, structuring, syndication or due diligence fees, fees for providing managerial assistance and consulting fees. The frequency or volume of these repayments may fluctuate significantly.
Dividend income on common equity investments is recorded on the record date for private portfolio companies or on the ex-dividend date for publicly traded portfolio companies.
Our portfolio activity also reflects the proceeds of sales of investments. We recognize realized gains or losses on investments based on the difference between the net proceeds from the disposition and the amortized cost basis of the investment without regard to unrealized gains or losses previously recognized. We record current period changes in fair value of investments that are measured at fair value as a component of the net change in unrealized gains (losses) on investments in the consolidated statements of operations.
59
Our primary operating expenses include the payment of fees to our Adviser under the Investment Advisory Agreement, expenses reimbursable under the Administration Agreement and other operating costs described below. Additionally, we pay interest expense on our outstanding debt. We bear all other costs and expenses of our operations, administration and transactions, including those relating to:
|
|
• |
calculating individual asset values and our net asset value (including the cost and expenses of any independent valuation firms); |
|
|
• |
expenses, including travel expenses, incurred by the Adviser, or members of our Investment Team, or payable to third parties, in respect of due diligence on prospective portfolio companies and, if necessary, in respect of enforcing our rights with respect to investments in existing portfolio companies; |
|
|
• |
the costs of any public offerings of our common stock and other securities, including registration and listing fees; |
|
|
• |
the Management Fee and any Incentive Fee; |
|
|
• |
certain costs and expenses relating to distributions paid on our shares; |
|
|
• |
administration fees payable under our Administration Agreement; |
|
|
• |
costs of preparing financial statements and maintaining books and records and filing reports or other documents with the SEC (or other regulatory bodies) and other reporting and compliance costs, and the compensation of professionals responsible for the preparation of the foregoing, including the allocable portion of the compensation of our Chief Financial Officer, Chief Compliance Officer and other professionals who spend time on those related activities (based on the percentage of time those individuals devote, on an estimated basis, to our business and affairs); |
|
|
• |
debt service and other costs of borrowings or other financing arrangements; |
|
|
• |
the Adviser’s allocable share of costs incurred in providing significant managerial assistance to those portfolio companies that request it; |
|
|
• |
amounts payable to third parties relating to, or associated with, making or holding investments; |
|
|
• |
transfer agent and custodial fees; |
|
|
• |
costs of hedging; |
|
|
• |
commissions and other compensation payable to brokers or dealers; |
|
|
• |
taxes; |
|
|
• |
Independent Director fees and expenses; |
|
|
• |
the costs of any reports, proxy statements or other notices to our stockholders (including printing and mailing costs), the costs of any stockholders’ meetings and the compensation of investor relations personnel responsible for the preparation of the foregoing and related matters; |
|
|
• |
our fidelity bond; |
|
|
• |
directors and officers/errors and omissions liability insurance, and any other insurance premiums; |
|
|
• |
indemnification payments; |
|
|
• |
direct costs and expenses of administration, including audit, accounting, consulting and legal costs; and |
|
|
• |
all other expenses reasonably incurred by us in connection with making investments and administering our business. |
We expect that during periods of asset growth, our general and administrative expenses will be relatively stable or will decline as a percentage of total assets, and will increase as a percentage of total assets during periods of asset declines.
Leverage
While as a BDC the amount of leverage that we are permitted to use is limited in significant respects, we use leverage to increase our ability to make investments. The amount of leverage we use in any period depends on a variety of factors, including cash available for investing, the cost of financing and general economic and market conditions, however, under the 1940 Act, our total borrowings are limited so that our asset coverage ratio cannot fall below 150% immediately after any borrowing, as defined in the 1940 Act. In any period, our interest expense will depend largely on the extent of our borrowing and we expect interest expense will increase as we increase leverage over time within the limits of the 1940 Act. In addition, we may dedicate assets as collateral to financing facilities from time to time.
60
On October 8, 2018, our stockholders approved the application of the minimum asset coverage ratio of 150% to us, as set forth in Section 61(a)(2) of the 1940 Act, as amended by the SBCAA. As a result and subject to certain additional disclosure requirements, as of October 9, 2018, our minimum asset coverage ratio was reduced from 200% to 150%. In other words, pursuant to Section 61(a) of the 1940 Act, as amended by the SBCAA, we are permitted to potentially increase our maximum debt-to-equity ratio from an effective level of one-to-one to two-to-one. The Adviser intends to waive a portion of the Management Fee payable under the Investment Advisory Agreement by reducing the Management Fee on assets financed using leverage over 200% asset coverage (in other words, over 1.0x debt to equity). Pursuant to the waiver, the Adviser intends to waive the portion of the Management Fee in excess of an annual rate of 1.0% (0.250% per quarter) on the average value of our gross assets as of the end of the two most recently completed calendar quarters that exceeds the product of (i) 200% and (ii) the average value of our net asset value at the end of the two most recently completed calendar quarters.
Market Trends
We believe trends in the middle-market lending environment, including the limited availability of capital, strong demand for debt capital and specialized lending requirements, are likely to continue to create favorable opportunities for us to invest at attractive risk-adjusted rates.
The limited number of dedicated providers of capital to middle-market companies, combined with increases in required capital levels for regulated financial institutions, reduces the capacity of traditional lenders to serve middle-market companies. We believe that the limited availability of capital creates a significant opportunity for us to directly originate investments. We also believe that the large amount of uninvested capital held by private equity firms will continue to drive deal activity, which may in turn create additional demand for debt capital.
The limited number of dedicated providers is further exacerbated by the specialized due diligence and underwriting capabilities, as well as extensive ongoing monitoring, required for middle-market lending. We believe middle-market lending is generally more labor-intensive than lending to larger companies due to smaller investment sizes and the lack of publicly available information on these companies.
An imbalance between the supply of, and demand for, middle-market debt capital creates attractive pricing dynamics for investors such as BDCs. The negotiated nature of middle-market financings also generally provides for more favorable terms to the lenders, including stronger covenant and reporting packages, better call protection and lender-protective change of control provisions. We believe that BDCs have flexibility to develop loans that reflect each borrower’s distinct situation, provide long-term relationships and a potential source for future capital, which renders BDCs, including us, attractive lenders.
Portfolio and Investment Activity
As of December 31, 2019, our portfolio based on fair value consisted of 96.5% first-lien debt investments, 0.6% second-lien debt investments, 0.1% mezzanine investments and 2.8% equity and other investments. As of December 31, 2018, our portfolio based on fair value consisted of 96.9% first-lien debt investments, 0.2% second-lien debt investments, 0.2% mezzanine investments, and 2.7% equity and other investments.
As of December 31, 2019 and December 31, 2018, our weighted average total yield of debt and income producing securities at fair value (which includes interest income and amortization of fees and discounts) was 10.5% and 11.6%, respectively, and our weighted average total yield of debt and income-producing securities at amortized cost (which includes interest income and amortization of fees and discounts) was 10.7% and 11.7%, respectively.
As of December 31, 2019 and December 31, 2018, we had investments in 63 and 46 portfolio companies, respectively, with an aggregate fair value of $2,245.9 million and $1,706.0 million, respectively.
For the year ended December 31, 2019, the principal amount of new investments funded was $1,087.6 million in 32 new portfolio companies and 14 existing portfolio companies. For this period, we had $575.2 million aggregate principal amount in exits and repayments.
For the year ended December 31, 2018, the principal amount of new investments funded was $816.9 million in 19 new portfolio companies and 14 existing portfolio companies. For this period, we had $790.3 million aggregate principal amount in exits and repayments.
61
For the year ended December 31, 2017, the principal amount of new investments funded was $989.3 million in 22 new portfolio companies and 12 existing portfolio companies. For this period, we had $951.5 million aggregate principal amount in exits and repayments.
Our investment activity for the years ended December 31, 2019, 2018 and 2017 is presented below (information presented herein is at par value unless otherwise indicated).
|
|
|
For the Year Ended December 31, |
|
|||||||||
|
($ in millions) |
|
2019 |
|
|
2018 |
|
|
2017 |
|
|||
|
New investment commitments: |
|
|
|
|
|
|
|
|
|
|
|
|
|
Gross originations |
|
$ |
3,007.0 |
|
|
$ |
2,199.4 |
|
|
$ |
2,251.5 |
|
|
Less: Syndications/sell downs |
|
|
1,773.5 |
|
|
|
1,291.2 |
|
|
|
1,178.9 |
|
|
Total new investment commitments |
|
$ |
1,233.5 |
|
|
$ |
908.2 |
|
|
$ |
1,072.6 |
|
|
Principal amount of investments funded: |
|
|
|
|
|
|
|
|
|
|
|
|
|
First-lien |
|
$ |
1,055.7 |
|
|
$ |
798.2 |
|
|
$ |
958.9 |
|
|
Second-lien |
|
|
12.4 |
|
|
|
0.8 |
|
|
|
— |
|
|
Mezzanine |
|
|
— |
|
|
|
2.5 |
|
|
— |
|
|
|
Equity and other |
|
|
19.5 |
|
|
|
15.4 |
|
|
|
30.4 |
|
|
Total |
|
$ |
1,087.6 |
|
|
$ |
816.9 |
|
|
$ |
989.3 |
|
|
Principal amount of investments sold or repaid: |
|
|
|
|
|
|
|
|
|
|
|
|
|
First-lien |
|
$ |
567.1 |
|
|
$ |
702.5 |
|
|
$ |
906.0 |
|
|
Second-lien |
|
|
0.8 |
|
|
|
59.6 |
|
|
|
15.7 |
|
|
Mezzanine |
|
|
— |
|
|
|
— |
|
|
|
11.5 |
|
|
Equity and other |
|
|
7.3 |
|
|
|
28.2 |
|
|
|
18.3 |
|
|
Total |
|
$ |
575.2 |
|
|
$ |
790.3 |
|
|
$ |
951.5 |
|
|
Number of new investment commitments in new portfolio companies |
|
|
32 |
|
|
|
26 |
|
|
|
22 |
|
|
Average new investment commitment amount in new portfolio companies |
|
$ |
28.7 |
|
|
$ |
31.8 |
|
|
$ |
39.2 |
|
|
Weighted average term for new investment commitments in new portfolio companies (in years) |
|
|
4.6 |
|
|
|
5.2 |
|
|
|
4.8 |
|
|
Percentage of new debt investment commitments at floating rates (1) |
|
|
98.7 |
% |
|
|
99.1 |
% |
|
|
100.0 |
% |
|
Percentage of new debt investment commitments at fixed rates |
|
|
1.3 |
% |
|
|
0.9 |
% |
|
— |
|
|
|
Weighted average interest rate of new investment commitments |
|
|
10.2 |
% |
|
|
10.5 |
% |
|
|
9.5 |
% |
|
Weighted average spread over LIBOR of new floating rate investment commitments |
|
|
8.0 |
% |
|
|
8.1 |
% |
|
|
8.3 |
% |
|
Weighted average interest rate on investments sold or paid down |
|
|
11.8 |
% |
|
|
10.6 |
% |
|
|
9.5 |
% |
|
(1) |
Includes two fixed rate investments for the years ended December 31, 2019, 2018 and 2017 for which we entered into interest rate swap agreements to swap to floating rates. |
As of December 31, 2019 and 2018, our investments consisted of the following:
|
|
|
December 31, 2019 |
|
|
December 31, 2018 |
|
||||||||||
|
($ in millions) |
|
Fair Value |
|
|
Amortized Cost |
|
|
Fair Value |
|
|
Amortized Cost |
|
||||
|
First-lien debt investments |
|
$ |
2,166.2 |
|
|
$ |
2,134.1 |
|
|
$ |
1,653.9 |
|
|
$ |
1,642.0 |
|
|
Second-lien debt investments |
|
|
14.1 |
|
|
|
13.9 |
|
|
|
4.1 |
|
|
|
4.1 |
|
|
Mezzanine debt investments |
|
|
2.5 |
|
|
|
2.5 |
|
|
|
2.5 |
|
|
|
2.5 |
|
|
Equity and other investments |
|
|
63.1 |
|
|
|
87.5 |
|
|
|
45.5 |
|
|
|
67.8 |
|
|
Total |
|
$ |
2,245.9 |
|
|
$ |
2,238.0 |
|
|
$ |
1,706.0 |
|
|
$ |
1,716.4 |
|
62
The following tables show the fair value and amortized cost of our performing and non-accrual investments as of December 31, 2019 and 2018:
|
|
|
December 31, 2019 |
|
|
December 31, 2018 |
|
||||||||||
|
($ in millions) |
|
Fair Value |
|
|
Percentage |
|
|
Fair Value |
|
|
Percentage |
|
||||
|
Performing |
|
$ |
2,245.9 |
|
|
|
100.0 |
% |
|
$ |
1,706.0 |
|
|
|
100.0 |
% |
|
Non-accrual (1) |
|
— |
|
|
— |
|
|
— |
|
|
— |
|
||||
|
Total |
|
$ |
2,245.9 |
|
|
|
100.0 |
% |
|
$ |
1,706.0 |
|
|
|
100.0 |
% |
|
|
|
December 31, 2019 |
|
|
December 31, 2018 |
|
||||||||||
|
($ in millions) |
|
Amortized Cost |
|
|
Percentage |
|
|
Amortized Cost |
|
|
Percentage |
|
||||
|
Performing |
|
$ |
2,238.0 |
|
|
|
100.0 |
% |
|
$ |
1,716.4 |
|
|
|
100.0 |
% |
|
Non-accrual (1) |
|
— |
|
|
— |
|
|
— |
|
|
— |
|
||||
|
Total |
|
$ |
2,238.0 |
|
|
|
100.0 |
% |
|
$ |
1,716.4 |
|
|
|
100.0 |
% |
|
(1) |
Loans are generally placed on non-accrual status when principal or interest payments are past due 30 days or more or when management has reasonable doubt that the borrower will pay principal or interest in full. Accrued and unpaid interest is generally reversed when a loan is placed on non-accrual status. Non-accrual loans are restored to accrual status when past due principal and interest has been paid and, in management’s judgment, the borrower is likely to make principal and interest payments in the future. Management may determine to not place a loan on non-accrual status if, notwithstanding any failure to pay, the loan has sufficient collateral value and is in the process of collection. See “–Critical Accounting Policies – Interest and Dividend Income Recognition.” |
The weighted average yields and interest rates of our performing debt investments at fair value as of December 31, 2019 and 2018 were as follows:
|
|
|
December 31, 2019 |
|
|
December 31, 2018 |
|
||
|
Weighted average total yield of debt and income producing securities (1) |
|
|
10.5 |
% |
|
|
11.6 |
% |
|
Weighted average interest rate of debt and income producing securities |
|
|
9.9 |
% |
|
|
11.1 |
% |
|
Weighted average spread over LIBOR of all floating rate investments (2) |
|
|
8.1 |
% |
|
|
8.6 |
% |
|
(1) |
Weighted average total portfolio yield at fair value was 10.3% at December 31, 2019 and 11.3% at December 31, 2018. |
|
(2) |
Includes fixed rate investments for which we entered into interest rate swap agreements to swap to floating rates. |
The Adviser monitors our portfolio companies on an ongoing basis. The Adviser monitors the financial trends of each portfolio company to determine if it is meeting its business plans and to assess the appropriate course of action for each company. The Adviser has a number of methods of evaluating and monitoring the performance of our investments, which may include the following:
|
|
• |
assessment of success of the portfolio company in adhering to its business plan and compliance with covenants; |
|
|
• |
periodic and regular contact with portfolio company management and, if appropriate, the financial or strategic sponsor, to discuss financial position, requirements and accomplishments; |
|
|
• |
comparisons to other companies in the industry; |
|
|
• |
attendance at, and participation in, board meetings; and |
|
|
• |
review of monthly and quarterly financial statements and financial projections for portfolio companies. |
As part of the monitoring process, the Adviser regularly assesses the risk profile of each of our investments and, on a quarterly basis, grades each investment on a risk scale of 1 to 5. Risk assessment is not standardized in our industry and our risk assessment may not be comparable to ones used by our competitors. Our assessment is based on the following categories:
|
|
• |
An investment is rated 1 if, in the opinion of the Adviser, it is performing as agreed and there are no concerns about the portfolio company’s performance or ability to meet covenant requirements. For these investments, the Adviser generally prepares monthly reports on investment performance and intensive quarterly asset reviews. |
63
|
|
• |
An investment will be assigned a rating of 3 if it is paying its obligations to us as agreed but a material covenant violation is expected. For these investments, in addition to monthly reports and quarterly asset reviews, the Adviser also adds the investment to its “watch list” and researches any areas of concern with the objective of early intervention with the portfolio company. |
|
|
• |
An investment will be assigned a rating of 4 if a material covenant has been violated, but the company is making its scheduled payments on its obligations to us. For these investments, the Adviser generally prepares a bi-monthly asset review email and generally has monthly meetings with the portfolio company’s senior management. For investments where there have been material defaults, including bankruptcy filings, failures to achieve financial performance requirements or failure to maintain liquidity or loan-to-value requirements, the Adviser often will take immediate action to protect its position. These remedies may include negotiating for additional collateral, modifying investment terms or structure, or payment of amendment and waiver fees. |
|
|
• |
A rating of 5 indicates an investment is in default on its interest and/or principal payments. For these investments, our Adviser reviews the investments on a bi-monthly basis and, where possible, pursues workouts that achieve an early resolution to avoid further deterioration of our investment. The Adviser retains legal counsel and takes actions to preserve our rights, which may include working with the portfolio company to have the default cured, to have the investment restructured or to have the investment repaid through a consensual workout. |
The following table shows the distribution of our investments on the 1 to 5 investment performance rating scale at fair value as of December 31, 2019 and 2018. Investment performance ratings are accurate only as of those dates and may change due to subsequent developments relating to a portfolio company’s business or financial condition, market conditions or developments, and other factors.
|
|
|
December 31, 2019 |
|
|
December 31, 2018 |
|
||||||||||
|
Investment |
|
Investments at |
|
|
|
|
|
|
Investments at |
|
|
|
|
|
||
|
Performance |
|
Fair Value |
|
|
Percentage of |
|
|
Fair Value |
|
|
Percentage of |
|
||||
|
Rating |
|
($ in millions) |
|
|
Total Portfolio |
|
|
($ in millions) |
|
|
Total Portfolio |
|
||||
|
1 |
|
$ |
1,968.0 |
|
|
|
87.6 |
% |
|
$ |
1,531.4 |
|
|
|
89.8 |
% |
|
2 |
|
|
230.0 |
|
|
|
10.3 |
|
|
|
118.1 |
|
|
|
6.9 |
|
|
3 |
|
|
47.9 |
|
|
|
2.1 |
|
|
|
56.5 |
|
|
|
3.3 |
|
|
4 |
|
|
— |
|
|
|
— |
|
|
|
— |
|
|
|
— |
|
|
5 |
|
|
— |
|
|
|
— |
|
|
|
— |
|
|
|
— |
|
|
Total |
|
$ |
2,245.9 |
|
|
|
100.0 |
% |
|
$ |
1,706.0 |
|
|
|
100.0 |
% |
Results of Operations
Operating results for the years ended December 31, 2019, 2018 and 2017 were as follows:
|
|
|
Year Ended December 31, |
|
|||||||||
|
($ in millions) |
|
2019 |
|
|
2018 |
|
|
2017 |
|
|||
|
Total investment income |
|
$ |
251.5 |
|
|
$ |
261.9 |
|
|
$ |
210.9 |
|
|
Less: Net expenses |
|
|
119.4 |
|
|
|
114.6 |
|
|
|
87.8 |
|
|
Net investment income before income taxes |
|
|
132.1 |
|
|
|
147.3 |
|
|
|
123.1 |
|
|
Less: Income taxes, including excise taxes |
|
|
3.8 |
|
|
|
3.4 |
|
|
|
2.8 |
|
|
Net investment income |
|
|
128.3 |
|
|
|
143.9 |
|
|
|
120.3 |
|
|
Net realized gains (losses) (1) |
|
|
2.0 |
|
|
|
(10.7 |
) |
|
|
(14.0 |
) |
|
Net change in unrealized gains (losses) (1) |
|
|
24.3 |
|
|
|
(14.2 |
) |
|
|
5.3 |
|
|
Net increase in net assets resulting from operations |
|
$ |
154.6 |
|
|
$ |
119.0 |
|
|
$ |
111.6 |
|
|
(1) |
Includes foreign exchange hedging activity. |
64
|
|
|
For the Year Ended December 31, |
|
|||||||||
|
($ in millions) |
|
2019 |
|
|
2018 |
|
|
2017 |
|
|||
|
Interest from investments |
|
$ |
237.2 |
|
|
$ |
249.9 |
|
|
$ |
200.7 |
|
|
Dividend income |
|
|
0.4 |
|
|
|
0.2 |
|
|
|
0.4 |
|
|
Other income |
|
|
13.9 |
|
|
|
11.8 |
|
|
|
9.8 |
|
|
Total investment income |
|
$ |
251.5 |
|
|
$ |
261.9 |
|
|
$ |
210.9 |
|
Interest from investments, which includes amortization of upfront fees and prepayment fees, decreased from $249.9 million for the year ended December 31, 2018 to $237.2 million for the year ended December 31, 2019, primarily due to a decrease in accelerated amortization of upfront fees and prepayment fees due to fewer paydowns which was partially offset by an increase in the average portfolio size for the year ended December 31, 2019. Accelerated amortization of upfront fees, primarily from unscheduled paydowns, decreased from $13.4 million for the year ended December 31, 2018 to $6.7 million for the year ended December 31, 2019, and prepayment fees decreased from $25.6 million for the year ended December 31, 2018 to $12.0 million for the year ended December 31, 2019. The accelerated amortization and prepayment fees primarily resulted from full paydowns on 16 portfolio investments, partial paydowns on three portfolio investments, partial realizations on two portfolio investments and prepayment fees on 15 portfolio investments during the year ended December 31, 2018, and full paydowns on 13 portfolio investments, partial paydowns on five portfolio investments, and prepayment fees on 11 portfolio investments during the year ended December 31, 2019. Dividend income increased from $0.2 million for the year ended December 31, 2018 to $0.4 million for the year ended December 31, 2019 due to increased investment in dividend yielding securities in 2019. Other income increased from $11.8 million for the year ended December 31, 2018 to $13.9 million for the year ended December 31, 2019, primarily due to higher amendment fees earned during 2019.
Interest from investments, which includes amortization of upfront fees and prepayment fees, increased from $200.7 million for the year ended December 31, 2017 to $249.9 million for the year ended December 31, 2018, primarily due to an increase in the average size of our investment portfolio which increased from $1.6 billion for the year ended December 31, 2017 to $1.9 billion for the year ended December 31, 2018. Accelerated amortization of upfront fees, primarily from unscheduled paydowns, decreased from $21.1 million for the year ended December 31, 2017 to $13.4 million for the year ended December 31, 2018, and prepayment fees increased from $12.8 million for the year ended December 31, 2017 to $25.6 million for the year ended December 31, 2018. The accelerated amortization and prepayment fees primarily resulted from full paydowns on 22 portfolio investments, partial paydowns on seven portfolio investments and prepayment fees on 12 portfolio investments during the year ended December 31, 2017, and full paydowns on 16 portfolio investments, partial paydowns on three portfolio investments, partial realizations on two portfolio investments and prepayment fees on 15 portfolio investments during the year ended December 31, 2018. Dividend income decreased from $0.4 million for the year ended December 31, 2017 to $0.2 million for the year ended December 31, 2018 due to a partial realization of dividend yielding investments in 2018. Other income increased from $9.8 million for the year ended December 31, 2017 to $11.8 million for the year ended December 31, 2018, primarily due to higher commitment and other fees earned during 2018.
Expenses
Operating expenses for the years ended December 31, 2019, 2018 and 2017 were as follows:
|
|
|
For the Year Ended December 31, |
|
|||||||||
|
($ in millions) |
|
2019 |
|
|
2018 |
|
|
2017 |
|
|||
|
Interest |
|
$ |
49.1 |
|
|
$ |
42.8 |
|
|
$ |
27.4 |
|
|
Management fees (net of waivers) |
|
|
30.1 |
|
|
|
28.5 |
|
|
|
24.3 |
|
|
Incentive fees related to pre-incentive fee net investment income (net of waivers) |
|
|
27.2 |
|
|
|
30.5 |
|
|
|
25.5 |
|
|
Incentive fees related to realized/unrealized capital gains |
|
— |
|
|
— |
|
|
— |
|
|||
|
Professional fees |
|
|
6.5 |
|
|
|
7.2 |
|
|
|
5.4 |
|
|
Directors fees |
|
|
0.6 |
|
|
|
0.4 |
|
|
|
0.4 |
|
|
Other general and administrative |
|
|
5.9 |
|
|
|
5.2 |
|
|
|
4.8 |
|
|
Net Expenses |
|
$ |
119.4 |
|
|
$ |
114.6 |
|
|
$ |
87.8 |
|
65
Interest expense, including other debt financing expenses, increased from $42.8 million for the year ended December 31, 2018 to $49.1 million for the year ended December 31, 2019. This increase was primarily due to an increase in the average debt outstanding for the year ended December 31, 2018 from $874.3 million to $913.4 million for the year ended December 31, 2019 and an increase in our average interest rate on debt outstanding due to a change in the mix of our debt financing sources. The average interest rate on our debt outstanding increased from 4.1% for the year ended December 31, 2018 to 4.4% for the year ended December 31, 2019 due to a change in the mix of our debt financing sources and a change in LIBOR. For the years ended December 31, 2018 and 2019, weighted average one-month LIBOR for the year was 2.0% and 2.2%, respectively.
Interest expense, including other debt financing expenses, increased from $27.4 million for the year ended December 31, 2017 to $42.8 million for the year ended December 31, 2018. This increase was primarily due to an increase in the average debt outstanding for the year ended December 31, 2017 from $645.1 million to $874.3 million for the year ended December 31, 2018 and an increase in our average interest rate on debt outstanding due to a change in the mix of our debt financing sources. The average interest rate on our debt outstanding increased from 3.3% for the year ended December 31, 2017 to 4.1% for the year ended December 31, 2018 due to the increase in LIBOR and a change in the mix of our debt financing sources.
Management Fees
Management Fees (net of waivers) increased from $28.5 million for the year ended December 31, 2018 to $30.1 million for the year ended December 31, 2019. Management Fees (gross of waivers) increased from $28.5 million for the year ended December 31, 2018 to $30.1 million for the year ended December 31, 2019 due to average total assets increasing from $1.9 billion for the year ended December 31, 2018 to $2.1 billion for the year ended December 31, 2019. Management Fees waived were less than $0.1 million for the year ended December 31, 2018 consisting solely of Management Fees attributable to our ownership of TCAP shares. The Adviser did not waive any Management Fees for the year ended December 31, 2019.
Management Fees (net of waivers) increased from $24.3 million for the year ended December 31, 2017 to $28.5 million for the year ended December 31, 2018. Management Fees (gross of waivers) increased from $24.3 million for the year ended December 31, 2017 to $28.5 million for the year ended December 31, 2018 due to average total assets increasing from $1.6 billion for the year ended December 31, 2017 to $1.9 billion for the year ended December 31, 2018. Management Fees waived remained flat at less than $0.1 million for the years ended December 31, 2017 and December 31, 2018. Management Fees waived during the years ended December 31, 2017 and December 31, 2018 were solely attributable to our ownership of TCAP Shares.
Any waived Management Fees are not subject to recoupment by the Adviser.
Incentive Fees
Incentive Fees (net of waivers) related to pre-Incentive Fee net investment income decreased from $30.5 million for the year ended December 31, 2018 to $27.2 million for the year ended December 31, 2019. This decrease resulted primarily from a decrease in interest from investments received during the year ended December 31, 2019 and the related decrease in net investment income. For the year ended December 31, 2018, Incentive Fees related to pre-Incentive Fee net investment income of less than $0.1 million were waived, consisting solely of Incentive Fees attributable to our ownership of the TCAP Shares. There were no Incentive Fees related to pre-incentive Fee net investment income waived for the year ended December 31, 2019. There were no Incentive Fees related to net capital gains and losses for the year ended December 31, 2018 and the year ended December 31, 2019 due to cumulative realized and unrealized losses on our investments.
Incentive Fees (net of waivers) related to pre-Incentive Fee net investment income increased from $25.5 million for the year ended December 31, 2017 to $30.5 million for the year ended December 31, 2018. This increase resulted primarily from an increase in interest from investments received during the year ended December 31, 2018 and the related increase in net investment income. Incentive Fees waived related to pre-Incentive Fee net investment income remained less than $0.1 million for the years ended December 31, 2017 and 2018, consisting solely of Incentive Fees attributable to our ownership of the TCAP Shares. There were no Incentive Fees related to capital gains and losses for the year ended December 31, 2017 and the year ended December 31, 2018 due to cumulative realized and unrealized losses on our investments.
Any waived Incentive Fees are not subject to recoupment by the Adviser.
Professional Fees and Other General and Administrative Expenses
Professional fees decreased from $7.2 million for the year ended December 31, 2018 to $6.5 million for the year ended December 31, 2019 due to recognition of remaining non-recurring expenses associated with the initial shelf registration statement in 2018 that were previously recorded as deferred financing cost. Other general and administrative fees increased from $5.2 million for the year ended December 31, 2018 to $5.9 million for the year ended December 31, 2019.
66
Professional fees increased from $5.4 million for the year ended December 31, 2017 to $7.2 million for the year ended December 31, 2018 due to recognition in 2018 of remaining non-recurring expenses associated with the initial shelf registration statement that were previously recorded as deferred financing costs and costs associated with shareholder meetings. Other general and administrative fees increased from $4.8 million for the year ended December 31, 2017 to $5.2 million for the year ended December 31, 2018.
Income Taxes, Including Excise Taxes
We have elected to be treated as a RIC under Subchapter M of the Code, and we intend to operate in a manner so as to continue to qualify for the tax treatment applicable to RICs. To qualify as a RIC, we must, among other things, distribute to our stockholders in each taxable year generally at least 90% of our investment company taxable income, as defined by the Code, and net tax-exempt income for that taxable year. To maintain our RIC status, we, among other things, have made and intend to continue to make the requisite distributions to our stockholders, which generally relieve us from corporate-level U.S. federal income taxes.
Depending on the level of taxable income earned in a tax year, we can be expected to carry forward taxable income (including net capital gains, if any) in excess of current year dividend distributions from the current tax year into the next tax year and pay a nondeductible 4% U.S. federal excise tax on such taxable income, as required. To the extent that we determine that our estimated current year annual taxable income will be in excess of estimated current year dividend distributions from such income, we accrue excise tax on estimated excess taxable income.
For the calendar years ended December 31, 2019, 2018 and 2017 we recorded a net expense of $3.8 million, $3.4 million and $2.8 million, respectively, for U.S. federal excise tax.
Net Realized and Unrealized Gains and Losses
The following table summarizes our net realized and unrealized gains (losses) for the years ended December 31, 2019, 2018 and 2017:
|
|
|
For the Year Ended December 31, |
|
|||||||||
|
($ in millions) |
|
2019 |
|
|
2018 |
|
|
2017 |
|
|||
|
Net realized gains (losses) on investments |
|
$ |
1.9 |
|
|
$ |
(11.4 |
) |
|
$ |
(14.3 |
) |
|
Net realized gains on foreign currency transactions |
|
|
0.1 |
|
|
|
0.2 |
|
|
|
0.0 |
|
|
Net realized losses on foreign currency investments |
|
|
(0.4 |
) |
|
|
(2.2 |
) |
|
|
(1.4 |
) |
|
Net realized gains on foreign currency borrowings |
|
|
0.4 |
|
|
|
2.7 |
|
|
|
1.7 |
|
|
Net realized gains on interest rate swaps |
|
|
0.0 |
|
|
— |
|
|
— |
|
||
|
Net Realized Gains (Losses) |
|
$ |
2.0 |
|
|
$ |
(10.7 |
) |
|
$ |
(14.0 |
) |
|
|
|
|
|
|
|
|
|
|
|
|
|
|
|
Change in unrealized gains on investments |
|
$ |
45.6 |
|
|
$ |
44.9 |
|
|
$ |
66.7 |
|
|
Change in unrealized losses on investments |
|
|
(27.3 |
) |
|
|
(62.8 |
) |
|
|
(48.9 |
) |
|
Net Change in Unrealized Gains (Losses) on Investments |
|
$ |
18.3 |
|
|
$ |
(17.9 |
) |
|
$ |
17.8 |
|
|
Unrealized gains (losses) on foreign currency borrowings |
|
|
(3.2 |
) |
|
|
5.4 |
|
|
|
(11.5 |
) |
|
Unrealized gains (losses) on foreign currency cash and forward contracts |
|
|
0.0 |
|
|
|
(0.0 |
) |
|
|
0.0 |
|
|
Unrealized gains (losses) on interest rate swaps |
|
|
9.2 |
|
|
|
(1.7 |
) |
|
|
(1.0 |
) |
|
Net Change in Unrealized Gains (Losses) on Foreign Currency Transactions and Interest Rate Swaps |
|
$ |
6.0 |
|
|
$ |
3.7 |
|
|
$ |
(12.5 |
) |
|
|
|
|
|
|
|
|
|
|
|
|
|
|
|
Net Change in Unrealized Gains (Losses) |
|
$ |
24.3 |
|
|
$ |
(14.2 |
) |
|
$ |
5.3 |
|
For the year ended December 31, 2019, we had net realized gains on investments of $1.9 million and for the years ended December 31, 2018 and 2017, we had net realized losses on investments, $11.4 million and $14.3 million, respectively. For the years ended December 31, 2019, 2018, and 2017, we had net realized gains of $0.1 million, $0.2 million and less than $0.1 million, respectively, on foreign currency transactions, primarily as a result of translating foreign currency related to our non-USD denominated investments. For the years ended December 31, 2019, 2018 and 2017, we had net realized losses on foreign currency investments of $0.4 million, $2.2 million and $1.4 million, respectively. For the years ended December 31, 2019, 2018, and 2017 we had net realized gains on foreign currency borrowings of $0.4 million, $2.7 million and $1.7 million, respectively. For the year ended December 31, 2019 we had net realized gains of less than $0.1 million on interest rate swaps.
67
For the year ended December 31, 2019 we had $45.6 million in unrealized gains on 53 portfolio company investments, which was offset by $27.3 million in unrealized losses on 23 portfolio company investments. Unrealized gains for the year ended December 31, 2019 resulted from an increase in fair value, primarily due to positive valuation adjustments and changes in credit spreads. Unrealized losses for the year ended December 31, 2019 resulted from the reversal of prior period unrealized gains and in some instances negative credit-related adjustments.
For the year ended December 31, 2018 we had $44.9 million in unrealized gains on 17 portfolio company investments, which was offset by $62.8 million in unrealized losses on 50 portfolio company investments. Unrealized gains for the year ended December 31, 2018 resulted from an increase in fair value, primarily due to reversal of prior period unrealized losses and positive valuation adjustments. Unrealized losses for the year ended December 31, 2018 resulted from the reversal of prior period unrealized gains on realized investments, widening credit spreads, and in some instances negative credit-related adjustments.
For the year ended December 31, 2017 we had $66.7 million in unrealized gains on 43 portfolio company investments, which was offset by $48.9 million in unrealized losses on 32 portfolio company investments. Unrealized gains for the year ended December 31, 2017 resulted from an increase in fair value, primarily due to reversal of prior period unrealized losses, positive valuation adjustments and tightening credit spreads. Unrealized losses for the year ended December 31, 2017 resulted from the reversal of prior period unrealized gains on realized investments and in some instances negative credit-related adjustments.
For the years ended December 31, 2019 and December 31, 2017 we had unrealized losses on foreign currency borrowings of $3.2 million and $11.5 million, respectively, primarily as a result of fluctuations in the AUD, CAD, GBP, and EUR exchange rates. For the year ended December 31, 2018, we had unrealized gains on foreign currency borrowings of $5.4 million, primarily as a result of fluctuations in the AUD, CAD, and EUR exchange rate. For the years ended December 31, 2019 and 2017, we had unrealized gains on foreign currency cash and forward contracts of less than $0.1 million and less than $0.1 million, respectively, primarily as a result of settling our foreign currency forward contracts. For the year ended December 31, 2018 we had unrealized losses on foreign currency cash and forward contracts of less than $0.1 million, primarily as a result of settling our foreign currency forward contracts. For the year ended December 31, 2019 we had unrealized gains on interest rate swaps of $9.2 million and for the years ended December 31, 2018 and 2017, we had unrealized losses on interest rate swaps of $1.7 million, and $1.0 million, respectively, due to fluctuations in interest rates.
Realized Gross Internal Rate of Return
Since we began investing in 2011 through December 31, 2019, weighted by capital invested, our exited investments have generated an average realized gross internal rate of return to us of 18.6% (based on total capital invested of $4.0 billion and total proceeds from these exited investments of $5.0 billion). Eighty-nine percent of these exited investments resulted in a realized gross internal rate of return to us of 10% or greater.
Gross IRR, with respect to an investment, is calculated based on the dates that we invested capital and dates we received distributions, regardless of when we made distributions to our stockholders. Initial investments are assumed to occur at time zero, and all cash flows are deemed to occur on the fifteenth of each month in which they occur.
Gross IRR reflects historical results relating to our past performance and is not necessarily indicative of our future results. In addition, gross IRR does not reflect the effect of Management Fees, expenses, Incentive Fees or taxes borne, or to be borne, by us or our stockholders, and would be lower if it did.
Average gross IRR is the average of the gross IRR for each of our exited investments (each calculated as described above), weighted by the total capital invested for each of those investments.
Average gross IRR on our exited investments reflects only invested and realized cash amounts as described above, and does not reflect any unrealized gains or losses in our portfolio.
Internal rate of return, or IRR, is a measure of our discounted cash flows (inflows and outflows). Specifically, IRR is the discount rate at which the net present value of all cash flows is equal to zero. That is, IRR is the discount rate at which the present value of total capital invested in each of our investments is equal to the present value of all realized returns from that investment. Our IRR calculations are unaudited.
Capital invested, with respect to an investment, represents the aggregate cost basis allocable to the realized or unrealized portion of the investment, net of any upfront fees paid at closing for the term loan portion of the investment. Capital invested also includes realized losses on hedging activity, with respect to an investment, which represents any inception-to-date realized losses on foreign currency forward contracts allocable to the investment, if any.
68
Realized returns, with respect to an investment, represents the total cash received with respect to each investment, including all amortization payments, interest, dividends, prepayment fees, upfront fees, administrative fees, agent fees, amendment fees, accrued interest, and other fees and proceeds. Realized returns also include realized gains on hedging activity, with respect to an investment, which represents any inception-to-date realized gains on foreign currency forward contracts allocable to the investment, if any.
Foreign Currency Hedging
Our current approach to hedging the foreign currency exposure in our non-U.S. dollar denominated investments is primarily to borrow the par amount in local currency under our Revolving Credit Facility to fund these investments. For the years ended December 31, 2019 and 2017, we had $3.2 million and $11.5 million of unrealized losses, respectively, and for the year ended December 31, 2018 we had $5.4 million of unrealized gains on the translation of our non-U.S. dollar denominated debt into U.S. dollars; such amounts approximate the corresponding unrealized gains and losses on the translation of our non-U.S. dollar denominated investments into U.S. dollars for the years ended December 31, 2019, 2018 and 2017. See Note 2 for additional disclosure regarding our accounting for foreign currency. See Note 7 for additional disclosure regarding the amounts of outstanding debt denominated in each foreign currency at December 31, 2019. See our consolidated schedule of investments for additional disclosure regarding the foreign currency amounts (in both par and fair value) of our non-U.S. dollar denominated investments.
Financial Condition, Liquidity and Capital Resources
Our liquidity and capital resources are derived primarily from proceeds from equity issuances, advances from our credit facilities, and cash flows from operations. The primary uses of our cash and cash equivalents are:
|
|
• |
investments in portfolio companies and other investments and to comply with certain portfolio diversification requirements; |
|
|
• |
the cost of operations (including paying our Adviser); |
|
|
• |
debt service, repayment, and other financing costs; and |
|
|
• |
cash dividends to the holders of our shares. |
We intend to continue to generate cash primarily from cash flows from operations, future borrowings and future offerings of securities. We may from time to time enter into additional debt facilities, increase the size of existing facilities or issue debt securities. Any such incurrence or issuance would be subject to prevailing market conditions, our liquidity requirements, contractual and regulatory restrictions and other factors. In accordance with the 1940 Act, with certain limited exceptions, we are only allowed to incur borrowings, issue debt securities or issue preferred stock if immediately after the borrowing or issuance our ratio of total assets (less total liabilities other than indebtedness) to total indebtedness plus preferred stock, is at least 150%. For more information, see “Key Components of Our Results of Operations —Leverage” above. As of December 31, 2019, 2018 and 2017, our asset coverage ratio was 200.4%, 270.5%, and 235.5%, respectively. We carefully consider our unfunded commitments for the purpose of planning our capital resources and ongoing liquidity including our financial leverage. Further, we maintain sufficient borrowing capacity within the 150% asset coverage limitation under the 1940 Act and the asset coverage limitation under our credit facilities to cover any outstanding unfunded commitments we are required to fund.
Cash and cash equivalents as of December 31, 2019, taken together with cash available under our credit facilities, is expected to be sufficient for our investing activities and to conduct our operations in the near term. As of December 31, 2019, we had approximately $749.3 million of availability on our Revolving Credit Facility, subject to asset coverage limitations.
As of December 31, 2019, we had $14.1 million in cash and cash equivalents. During the year ended December 31, 2019, we used $378.0 million in cash for operating activities, primarily as a result of purchases and originations of investments of $1,118.1 billion and other operating activity of $36.5 million partially offset by repayments on investments of $622.0 million and an increase in net assets resulting from operations of $154.6 million. Lastly, cash provided in financing activities was $381.6 million during the period, primarily due to borrowings of $1,742.6 million (including the issuance of $300.0 million principal amount of our 2024 Notes), which were partially offset by paydowns on our Revolving Credit Facility of $1,255.2 million, dividends paid of $98.1 million, and deferred financing costs of $7.7 million.
As of December 31, 2018, we had $10.6 million in cash and cash equivalents. During the year ended December 31, 2018, we provided $119.2 million in cash for operating activities, primarily as a result of proceeds from investments of $34.6 million, repayments on investments of $789.4 million, other operating activity of $14.4 million and an increase in net assets resulting from operations of $119.0 million, which was partially offset by funding portfolio investments of $838.2 million. Lastly, cash used in financing activities was $115.3 million during the period, primarily due to paydowns on our Revolving Credit Facility of $1,179.0 million, dividends paid of $95.9 million, and deferred financing costs of $7.8 million, which were partially offset by borrowings of $1,095.6 million (including the issuance of $150.0 million principal amount of our 2023 Notes and $57.5 million principal amount of our 2022 Convertible Notes in a reopening), and proceeds from issuance of common stock, net of offering and underwriting costs, of $71.8 million.
69
As of December 31, 2019, we had $9.3 million of restricted cash pledged as collateral under our interest rate swap agreements, compared to $7.3 million as of December 31, 2018.
Equity
On March 21, 2018, we issued 3,750,000 shares of common stock at $17.45 per share. Net of underwriting fees and offering costs, we received total cash proceeds of $63.0 million. Subsequent to the offering we issued an additional 522,224 shares in April 2018 pursuant to the overallotment option granted to underwriters and received, net of underwriting fees, total cash proceeds of $8.8 million.
During the years ended December 31, 2019 and 2018, we also issued 1,111,774 and 893,392 shares of our common stock, respectively, to investors who have not opted out of our dividend reinvestment plan for proceeds of $21.1 million and $16.0 million, respectively. On January 15, 2020, we issued 194,470 shares of our common stock through our dividend reinvestment plan for proceeds of $4.0 million, which is not reflected in the number of shares issued for the year ended December 31, 2019 in this section or the consolidated financial statements for the year ended December 31, 2019.
On August 4, 2015, our Board authorized us to enter into a stock repurchase plan, the Company 10b5-1 Plan, to acquire up to $50 million in the aggregate of our common stock at prices just below our net asset value per share over an initial six month period, in accordance with the guidelines specified in Rule 10b-18 and Rule 10b5-1 of the Exchange Act, and has continued to authorize extensions of the plan termination date prior to its expiration since that time. We put the Company 10b5-1 Plan in place because we believe that, in current market conditions, if our common stock is trading below our then-current net asset value per share, it is in the best interest of our stockholders for us to reinvest in our portfolio and increase our leverage ratio through share repurchases.
The Company 10b5-1 Plan is designed to allow us to repurchase our common stock at times when we otherwise might be prevented from doing so under insider trading laws. The Company 10b5-1 Plan, as currently in effect requires Goldman Sachs & Co. LLC, as our agent, to repurchase shares of common stock on our behalf when the market price per share is just below 1.05x the most recently reported net asset value per share in our public financial statements or publicly announced by us, less the amount of any supplemental dividend that has been publicly announced by us but that has yet to be reflected in the net asset value per share most recently reported in our public financial statements (including any updates, corrections or adjustments publicly announced by us to any such net asset value per share or supplemental dividend). Under the Company 10b5-1 Plan, the agent will increase the volume of purchases made as the price of our common stock declines, subject to volume restrictions. The timing and amount of any stock repurchases depend on the terms and conditions of the Company 10b5-1 Plan, the market price of our common stock and trading volumes, and no assurance can be given that any particular amount of common stock will be repurchased.
The purchase of shares pursuant to the Company 10b5-1 Plan is intended to satisfy the conditions of Rule 10b5-1 and Rule 10b-18 under the Exchange Act, and will otherwise be subject to applicable law, including Regulation M, which may prohibit purchases under certain circumstances.
On November 5, 2019, the Board authorized the extension of the termination date of the Company 10b5-1 Plan to May 31, 2020. Unless extended or terminated by the Board, the Company 10b5-1 Plan will be in effect through the earlier of May 31, 2020 or such time as the current approved repurchase amount of up to $50 million has been fully utilized, subject to certain conditions.
For the year ended December 31, 2019 and December 31, 2018 no shares were repurchased under the Company 10b5-1 Plan.
Debt
Debt obligations consisted of the following as of December 31, 2019 and 2018:
|
|
|
December 31, 2019 |
|
|||||||||||||
|
|
|
Aggregate Principal |
|
|
Outstanding |
|
|
Amount |
|
|
Carrying |
|
||||
|
($ in millions) |
|
Amount Committed |
|
|
Principal |
|
|
Available (1) |
|
|
Value (2)(3) |
|
||||
|
Revolving Credit Facility |
|
$ |
1,245.0 |
|
|
$ |
495.7 |
|
|
$ |
749.3 |
|
|
$ |
485.8 |
|
|
2022 Convertible Notes |
|
|
172.5 |
|
|
|
172.5 |
|
|
— |
|
|
|
169.4 |
|
|
|
2023 Notes |
|
|
150.0 |
|
|
|
150.0 |
|
|
— |
|
|
|
148.0 |
|
|
|
2024 Notes |
|
|
300.0 |
|
|
|
300.0 |
|
|
— |
|
|
|
291.3 |
|
|
|
Total Debt |
|
$ |
1,867.5 |
|
|
$ |
1,118.2 |
|
|
$ |
749.3 |
|
|
$ |
1,094.5 |
|
|
(1) |
The amount available may be subject to limitations related to the borrowing base under the Revolving Credit Facility and asset coverage requirements. |
70
|
(3) |
The carrying value of the 2024 Notes is presented net of $1.8 million, which represents a change in the carrying value of the 2024 Notes resulting from a hedge accounting relationship. |
|
|
|
December 31, 2018 |
|
|||||||||||||
|
|
|
Aggregate Principal |
|
|
Outstanding |
|
|
Amount |
|
|
Carrying |
|
||||
|
($ in millions) |
|
Amount Committed |
|
|
Principal |
|
|
Available (1) |
|
|
Value (2) |
|
||||
|
Revolving Credit Facility |
|
$ |
940.0 |
|
|
$ |
187.5 |
|
|
$ |
752.5 |
|
|
$ |
178.8 |
|
|
2019 Convertible Notes |
|
|
115.0 |
|
|
|
115.0 |
|
|
— |
|
|
|
113.6 |
|
|
|
2022 Convertible Notes |
|
|
172.5 |
|
|
|
172.5 |
|
|
— |
|
|
|
168.3 |
|
|
|
2023 Notes |
|
|
150.0 |
|
|
|
150.0 |
|
|
— |
|
|
|
147.3 |
|
|
|
Total Debt |
|
$ |
1,377.5 |
|
|
$ |
625.0 |
|
|
$ |
752.5 |
|
|
$ |
608.0 |
|
|
(1) |
The amount available may be subject to limitations related to the borrowing base under the Revolving Credit Facility and asset coverage requirements. |
|
(2) |
The carrying values of the Revolving Credit Facility, Convertible Notes, and 2023 Notes are presented net of deferred financing costs and original issue discounts of $8.7 million, $5.6 million and $2.7 million, respectively. |
As of December 31, 2019 and December 31, 2018, we were in compliance with the terms of our debt arrangements. We intend to continue to utilize our credit facilities to fund investments and for other general corporate purposes.
Revolving Credit Facility
On August 23, 2012, we entered into a senior secured revolving credit agreement with Truist Bank (as a successor by merger to SunTrust Bank), as administrative agent, and J.P. Morgan Chase Bank, N.A., as syndication agent, and certain other lenders (as amended and restated, the “Revolving Credit Facility”).
As of December 31 2019, aggregate commitments under the facility were $1,245 million. Pursuant to an amendment to the Revolving Credit Facility dated as of January 31, 2020 (the “Ninth Amendment”), the aggregate commitments under the facility were increased to $1,315 million. The facility includes an uncommitted accordion feature that allows us, under certain circumstances, to increase the size of the facility to up to $1,750 million.
Pursuant to the Ninth Amendment, the revolving period, during which period we, subject to certain conditions, may make borrowings under the facility, was extended from February 14, 2023 to January 31, 2024 and the stated maturity date was extended from February 14, 2024 to January 31, 2025.
We may borrow amounts in U.S. dollars or certain other permitted currencies. As of December 31, 2019, we had outstanding debt denominated in Australian dollars (AUD) of 52.5 million, Canadian dollars (CAD) of 131.4 million, and Euro (EUR) of 7.6 million on our Revolving Credit Facility, included in the Outstanding Principal amount in the table above.
The Revolving Credit Facility also provides for the issuance of letters of credit up to an aggregate amount of $75 million. As of December 31, 2019 and December 31, 2018, we had no outstanding letters of credit issued through the Revolving Credit Facility. The amount available for borrowing under the Revolving Credit Facility is reduced by any letters of credit issued through the Revolving Credit Facility.
Amounts drawn under the Revolving Credit Facility, including amounts drawn in respect of letters of credit, bear interest at either LIBOR plus a margin of either 1.75% or 1.875%, or the base rate plus a margin of either 0.75% or 0.875%, in each case, based on the total amount of the borrowing base relative to the sum of the total commitments (or, if greater, the total exposure) under the Revolving Credit Facility plus certain other designated secured debt. We may elect either the LIBOR or base rate at the time of drawdown, and loans may be converted from one rate to another at any time, subject to certain conditions. We also pay a fee of 0.375% on undrawn amounts and, in respect of each undrawn letter of credit, a fee and interest rate equal to the then applicable margin while the letter of credit is outstanding.
The Revolving Credit Facility is guaranteed by TPG SL SPV, LLC, TC Lending, LLC and TSL MR, LLC and may be guaranteed by certain domestic subsidiaries in the future. The Revolving Credit Facility is secured by a perfected first-priority security interest in substantially all the portfolio investments held by us and each guarantor. Proceeds from borrowings may be used for general corporate purposes, including the funding of portfolio investments.
71
The Revolving Credit Facility includes customary events of default, as well as customary covenants, including restrictions on certain distributions and financial covenants. The financial covenants require:
|
|
• |
an asset coverage ratio of no less than 1.5 to 1 on the last day of any fiscal quarter; |
|
|
• |
a liquidity test under which we must not maintain cash and liquid investments of less than 10% of the covered debt amount for more than 30 consecutive business days under circumstances where our adjusted covered debt balance is greater than 90% of our adjusted borrowing base under the facility; |
|
|
• |
stockholders’ equity of at least $500 million plus 25% of the net proceeds of the sale of equity interests after November 5, 2018; |
|
|
• |
a minimum asset coverage ratio of no less than 2 to 1 with respect to (i) the consolidated assets of the Company and the subsidiary guarantors (including certain limitations on the contribution of equity in financing subsidiaries) to (ii) the secured debt of the Company and its subsidiary guarantors plus unsecured senior securities of the Company and its subsidiary guarantors that mature within 90 days of the date of determination (the “Obligor Asset Coverage Ratio”); and |
|
|
• |
minimum consolidated assets of the Company and the subsidiary guarantors (including certain limitations on the contribution of equity in financing subsidiaries), less total secured debt of the Company and the subsidiary guarantors, of at least $350 million at the last day of any fiscal quarter. |
The Revolving Credit Facility also contains certain additional concentration limits in connection with the calculation of the borrowing base, based on the Obligor Asset Coverage Ratio.
Net proceeds received from our common stock issuance in March 2018 and net proceeds received from the issuance of the 2022 Convertible Notes, 2023 Notes and 2024 Notes were used to pay down borrowings on the Revolving Credit Facility.
2019 Convertible Notes
In June 2014, we issued in a private offering $115 million aggregate principal amount convertible notes due December 2019 (the “2019 Convertible Notes”). The 2019 Convertible Notes were issued in a private placement only to qualified institutional buyers pursuant to Rule 144A under the Securities Act. The 2019 Convertible Notes were unsecured and bore interest at a rate of 4.50% per year, payable semiannually. The 2019 Convertible Notes matured on December 15, 2019 and were fully repaid in cash. The swap transaction associated with the issuance of the 2019 Convertible Notes also matured on December 15, 2019.
2022 Convertible Notes
In February 2017, we issued in a private offering $115 million aggregate principal amount convertible notes due August 2022 (the “2022 Convertible Notes” and, together with the 2019 Convertible Notes, the “Convertible Notes”). The 2022 Convertible Notes were issued in a private placement only to qualified institutional buyers pursuant to Rule 144A under the Securities Act. The 2022 Convertible Notes are unsecured, and bear interest at a rate of 4.50% per year, payable semiannually. The 2022 Convertible Notes will mature on August 1, 2022. In certain circumstances, the 2022 Convertible Notes will be convertible into cash, shares of our common stock or a combination of cash and shares of our common stock, at our election, at an initial conversion rate of 46.8516 shares of common stock per $1,000 principal amount of 2022 Convertible Notes, which is equivalent to an initial conversion price of approximately $21.34 per share of our common stock, subject to customary anti-dilution adjustments. As of December 31, 2019, the estimated adjusted conversion price was approximately $20.66 per share of common stock. The sale of the 2022 Convertible Notes generated net proceeds of approximately $111.2 million. We used the net proceeds of the offering to pay down debt under the Revolving Credit Facility. In connection with the offering of 2022 Convertible Notes, we have entered into an interest rate swap to continue to align the interest rates of our liabilities with our investment portfolio, which consists of predominately floating rate loans. As a result of the swaps, our effective interest rate on the original issuance of 2022 Convertible Notes is three-month LIBOR plus 2.37%.
In June 2018, we issued an additional $57.5 million aggregate principal amount of 2022 Convertible Notes. The additional 2022 Convertible Notes were issued with identical terms, and are fungible with and are part of a single series with the previously outstanding $115 million aggregate principal amount of our 2022 Convertible Notes issued in February 2017. In connection with the reopening of the 2022 Convertible Notes, we entered into interest rate swaps to continue to align the interest rates of its liabilities with its investment portfolio, which consists of predominantly floating rate loans. As a result of the additional swaps, our effective interest rate on the additional 2022 Convertible Notes is approximately three-month LIBOR plus 1.60%. See Note 5 for further information related to our interest rate swaps.
Holders may convert their 2022 Convertible Notes at their option at any time prior to February 1, 2022 only under the following circumstances: (1) during any calendar quarter commencing after the calendar quarter ending on June 30, 2017 (and only during such calendar quarter), if the last reported sale price of the common stock for at least 20 trading days (whether or not consecutive) during a
72
period of 30 consecutive trading days ending on the last trading day of the immediately preceding calendar quarter is greater than or equal to 130% of the conversion price on each applicable trading day; (2) during the five business day period after any five consecutive trading day period (the “measurement period”) in which the trading price (as defined in the indenture governing the 2022 Convertible Notes) per $1,000 principal amount of notes for each trading day of the measurement period was less than 98% of the product of the last reported sale price of our common stock and the conversion rate on each such trading day; or (3) upon the occurrence of specified corporate events. On or after February 1, 2022 until the close of business on the scheduled trading day immediately preceding the maturity date, holders may convert their notes at any time, regardless of the occurrence or nonoccurrence of any of the foregoing circumstances.
The 2022 Convertible Notes are our unsecured obligations and rank senior in right of payment to our future indebtedness that is expressly subordinated in right of payment to the 2022 Convertible Notes; equal in right of payment to our existing and future indebtedness that is not so subordinated; effectively junior in right of payment to any of our secured indebtedness (including unsecured indebtedness that we later secure) to the extent of the value of the assets securing such indebtedness; and structurally junior to all existing and future indebtedness (including trade payables) incurred by our subsidiaries, financing vehicles or similar facilities.
As of December 31, 2019, the principal amount of the 2022 Convertible Notes was exceeded by the value of the underlying shares multiplied by the per share closing price of our common stock. However, the conditions required for conversion prior to maturity had not been satisfied. As of December 31, 2018, the principal amount of the 2022 Convertible Notes exceeded the value of the underlying shares multiplied by the per share closing price of our common stock.
The indenture governing the 2022 Convertible Notes contains certain covenants, including covenants requiring us to comply with the applicable asset coverage ratio requirement under the 1940 Act and to provide financial information to the holders of the 2022 Convertible Notes under certain circumstances. These covenants are subject to important limitations and exceptions that are described in the indenture governing the 2022 Convertible Notes. As of December 31, 2019 and 2018, we were in compliance with the terms of the indenture governing the 2022 Convertible Notes.
The 2022 Convertible Notes are accounted for in accordance with Accounting Standards Codification (“ASC”) 470-20. Upon conversion of any of the 2022 Convertible Notes, we intend to pay the outstanding principal amount in cash and, to the extent that the conversion value exceeds the principal amount, we have the option to pay in cash or shares of our common stock (or a combination of cash and shares) in respect of the excess amount, subject to the requirements of the indenture governing the 2022 Convertible Notes. We have determined that the embedded conversion options in the 2022 Convertible Notes are not required to be separately accounted for as a derivative under U.S. GAAP. In accounting for the 2022 Convertible Notes, we estimated at the time of issuance separate debt and equity components of the 2022 Convertible Notes. An original issue discount equal to the equity components of the 2022 Convertible Notes was recorded in “additional paid-in capital” in the accompanying consolidated balance sheet. Additionally, the issuance costs associated with the 2022 Convertible Notes were allocated to the debt and equity components in proportion to the allocation of the proceeds and accounted for as deferred financing costs and equity issuance costs, respectively.
2023 Notes
In January 2018, we issued $150.0 million aggregate principal amount of unsecured notes that mature on January 22, 2023 (the “2023 Notes”). The principal amount of the 2023 Notes is payable at maturity. The 2023 Notes bear interest at a rate of 4.50% per year, payable semi-annually commencing on July 22, 2018, and may be redeemed in whole or in part at our option at any time at par plus a “make whole” premium. Total proceeds from the issuance of the 2023 Notes, net of underwriting discounts and offering costs, were $146.9 million. We used the net proceeds of the 2023 Notes to repay outstanding indebtedness under the Revolving Credit Facility.
In connection with the 2023 Notes offering, we entered into an interest rate swap to continue to align the interest rates of our liabilities with our investment portfolio, which consists of predominately floating rate loans. As a result of the swap, our effective interest rate on the 2023 Notes is three-month LIBOR plus 1.99%.
2024 Notes
In November 2019, we issued $300.0 million aggregate principal amount of unsecured notes that mature on November 1, 2024 (the “2024 Notes”). The principal amount of the 2024 Notes is payable at maturity. The 2024 Notes bear interest at a rate of 3.875% per year, payable semi-annually commencing on May 1, 2020, and may be redeemed in whole or in part at our option at any time at par plus a “make whole” premium. Total proceeds from the issuance of the 2024 Notes, net of underwriting discounts and offering costs, were $293.1 million. We used the net proceeds of the 2024 Notes to repay outstanding indebtedness under the Revolving Credit Facility.
73
In connection with the 2024 Notes offering, we entered into an interest rate swap to continue to align the interest rates of our liabilities with our investment portfolio, which consists of predominately floating rate loans. As a result of the swap, our effective interest rate on the 2024 Notes is three-month LIBOR plus 2.25%.
On February 5, 2020, we issued $50.0 million aggregate principal amount of unsecured notes that mature on November 1, 2024 (the “Reopened 2024 Notes”). The Reopened 2024 Notes are a further issuance of, fungible with, rank equally in right of payment with and have the same terms (other than the issue date and the public offering price) as the initial issuance of 2024 Notes. Total proceeds from the issuance of the Reopened 2024 Notes, net of underwriting discounts and estimated offering costs, were approximately $50.1 million. We used the net proceeds of the 2024 Notes to repay outstanding indebtedness under the Revolving Credit Facility.
In connection with the issuance of the Reopened 2024 Notes, we entered into an interest rate swap to continue to align the interest rates of our liabilities with our investment portfolio, which consists of predominantly floating rate loans. As a result of the swap, our effective interest rate on the Reopened 2024 Notes is three-month LIBOR plus 2.46%.
74
Off-Balance Sheet Arrangements
Portfolio Company Commitments
From time to time, we may enter into commitments to fund investments. We incorporate these commitments into our assessment of our liquidity position. Our senior secured revolving loan commitments are generally available on a borrower’s demand and may remain outstanding until the maturity date of the applicable loan. Our senior secured term loan commitments are generally available on a borrower’s demand and, once drawn, generally have the same remaining term as the associated loan agreement. Undrawn senior secured term loan commitments generally have a shorter availability period than the term of the associated loan agreement. As of December 31, 2019 and 2018, we had the following commitments to fund investments in current portfolio companies:
|
($ in millions) |
|
December 31, 2019 |
|
|
December 31, 2018 |
|
||
|
Alpha Midco, Inc. - Delayed Draw |
|
$ |
19.6 |
|
|
$ |
— |
|
|
AppStar Financial, LLC - Revolver |
|
|
2.0 |
|
|
|
2.0 |
|
|
AvidXchange, Inc. - Delayed Draw |
|
|
5.1 |
|
|
— |
|
|
|
BlueSnap, Inc. - Revolver |
|
|
2.5 |
|
|
— |
|
|
|
Caris Life Sciences, Ltd. - Delayed Draw |
|
— |
|
|
|
2.5 |
|
|
|
ClearCompany, LLC - Delayed Draw |
|
|
1.4 |
|
|
|
3.0 |
|
|
Clinicient, Inc. - Revolver |
|
|
4.0 |
|
|
— |
|
|
|
DaySmart Holdings, LLC - Revolver |
|
|
5.0 |
|
|
— |
|
|
|
DaySmart Holdings, LLC - Delayed Draw |
|
|
17.5 |
|
|
— |
|
|
|
Dye & Durham Corp. - Revolver |
|
|
1.3 |
|
|
— |
|
|
|
Energy Alloys, LLC - Delayed Draw |
|
|
15.0 |
|
|
— |
|
|
|
Ferrellgas, L.P. - Revolver |
|
|
30.0 |
|
|
|
30.0 |
|
|
Frontline Technologies Group, LLC - Delayed Draw |
|
— |
|
|
|
9.4 |
|
|
|
G Treasury SS, LLC - Delayed Draw |
|
|
3.8 |
|
|
|
5.0 |
|
|
G Treasury SS, LLC - Revolver |
|
— |
|
|
|
2.0 |
|
|
|
Gainsight, Inc. - Delayed Draw |
|
|
1.8 |
|
|
— |
|
|
|
Government Brands, LLC - Revolver |
|
— |
|
|
|
5.0 |
|
|
|
Integration Appliance, Inc. - Revolver |
|
|
2.6 |
|
|
|
2.6 |
|
|
IntelePeer Holdings, Inc. - Delayed Draw |
|
|
3.5 |
|
|
— |
|
|
|
IRGSE Holding Corp. - Revolver |
|
|
2.1 |
|
|
|
3.0 |
|
|
Kyriba Corp. - Delayed Draw |
|
|
8.3 |
|
|
— |
|
|
|
Kyriba Corp. - Revolver |
|
|
1.2 |
|
|
— |
|
|
|
Lithium Technologies, LLC - Revolver |
|
|
3.9 |
|
|
|
3.9 |
|
|
Lucidworks, Inc. - Revolver |
|
|
3.3 |
|
|
— |
|
|
|
MD America Energy, LLC - Delayed Draw |
|
— |
|
|
|
15.0 |
|
|
|
Motus, LLC - Revolver |
|
— |
|
|
|
5.6 |
|
|
|
PageUp People, Ltd. - Revolver |
|
|
2.8 |
|
|
|
2.1 |
|
|
PayLease, LLC - Revolver |
|
|
3.3 |
|
|
|
3.3 |
|
|
PayScale Holdings, Inc. - Delayed Draw |
|
|
7.7 |
|
|
— |
|
|
|
PrimeRevenue, Inc. - Revolver |
|
|
6.3 |
|
|
|
6.3 |
|
|
ResMan, LLC - Delayed Draw |
|
|
3.6 |
|
|
— |
|
|
|
ResMan, LLC - Revolver |
|
|
2.0 |
|
|
— |
|
|
|
ScentAir Technologies, Inc. - Revolver |
|
— |
|
|
|
0.8 |
|
|
|
Sovos Compliance, LLC - Delayed Draw |
|
— |
|
|
|
0.5 |
|
|
|
Sovos Compliance, LLC - Revolver |
|
— |
|
|
|
1.7 |
|
|
|
TherapeuticsMD, Inc. - Delayed Draw A1 |
|
|
7.5 |
|
|
— |
|
|
|
TherapeuticsMD, Inc. - Delayed Draw A2 |
|
|
7.5 |
|
|
— |
|
|
|
Valant Medical Solutions, Inc. - Delayed Draw |
|
|
2.6 |
|
|
— |
|
|
|
Valant Medical Solutions, Inc. - Revolver |
|
|
2.0 |
|
|
— |
|
|
|
Verdad Resources Intermediate Holdings, LLC - Delayed Draw |
|
|
7.8 |
|
|
— |
|
|
|
Total Portfolio Company Commitments |
|
$ |
187.0 |
|
|
$ |
103.7 |
|
75
Other Commitments and Contingencies
As of December 31, 2019 and December 31, 2018, we did not have any unfunded commitments to fund investments to new borrowers that were not current portfolio companies as of such date.
From time to time, we may become a party to certain legal proceedings incidental to the normal course of our business. As of December 31, 2019, management is not aware of any material pending or threatened litigation that would require accounting recognition or financial statement disclosure.
We have certain contracts under which we have material future commitments. Under the Investment Advisory Agreement, our Adviser provides us with investment advisory and management services. For these services, we pay the Management Fee and the Incentive Fee.
Under the Administration Agreement, our Adviser furnishes us with office facilities and equipment, provides us clerical, bookkeeping and record keeping services at such facilities and provides us with other administrative services necessary to conduct our day-to-day operations. We reimburse our Adviser for the allocable portion (subject to the review and approval of our Board) of expenses incurred by it in performing its obligations under the Administration Agreement, the fees and expenses associated with performing compliance functions and our allocable portion of the compensation of our Chief Compliance Officer, Chief Financial Officer and other professionals who spend time on those related activities (based on a percentage of time those individuals devote, on an estimated basis, to our business and affairs). Our Adviser also offers on our behalf significant managerial assistance to those portfolio companies to which we are required to offer to provide such assistance.
Contractual Obligations
A summary of our contractual payment obligations as of December 31, 2019 is as follows:
|
|
|
Payments Due by Period |
|
|||||||||||||||||
|
|
|
|
|
|
|
Less than |
|
|
|
|
|
|
|
|
|
|
|
|
|
|
|
($ in millions) |
|
Total |
|
|
1 year |
|
|
1-3 years |
|
|
3-5 years |
|
|
After 5 years |
|
|||||
|
Revolving Credit Facility |
|
$ |
495.7 |
|
|
$ |
— |
|
|
$ |
— |
|
|
$ |
495.7 |
|
|
$ |
— |
|
|
2022 Convertible Notes |
|
|
172.5 |
|
|
|
— |
|
|
|
172.5 |
|
|
|
— |
|
|
|
— |
|
|
2023 Notes |
|
|
150.0 |
|
|
|
— |
|
|
|
— |
|
|
|
150.0 |
|
|
|
— |
|
|
2024 Notes |
|
|
300.0 |
|
|
|
— |
|
|
|
— |
|
|
|
300.0 |
|
|
|
— |
|
|
Total Contractual Obligations |
|
$ |
1,118.2 |
|
|
$ |
— |
|
|
$ |
172.5 |
|
|
$ |
945.7 |
|
|
$ |
— |
|
In addition to the contractual payment obligations in the tables above, we also have commitments to fund investments and to pledge assets as collateral under the terms of our derivatives agreements.
Distributions
We have elected and qualified to be treated for U.S. federal income tax purposes as a RIC under subchapter M of the Code. To maintain our RIC status, we must distribute (or be treated as distributing) in each taxable year dividends for tax purposes equal to at least 90 percent of the sum of our:
|
|
• |
investment company taxable income (which is generally our ordinary income plus the excess of realized net short-term capital gains over realized net long-term capital losses), determined without regard to the deduction for dividends paid, for such taxable year; and |
|
|
• |
net tax-exempt interest income (which is the excess of our gross tax exempt interest income over certain disallowed deductions) for such taxable year. |
As a RIC, we (but not our stockholders) generally will not be subject to U.S. federal income tax on investment company taxable income and net capital gains that we distribute to our stockholders.
We intend to distribute annually all or substantially all of such income. To the extent that we retain our net capital gains or any investment company taxable income, we generally will be subject to corporate-level U.S. federal income tax. We may choose to retain our net capital gains or any investment company taxable income, and pay the U.S. federal excise tax described below.
76
Amounts not distributed on a timely basis in accordance with a calendar year distribution requirement are subject to a nondeductible 4% U.S. federal excise tax payable by us. To avoid this tax, we must distribute (or be treated as distributing) during each calendar year an amount at least equal to the sum of:
|
|
• |
98% of our net ordinary income excluding certain ordinary gains or losses for that calendar year; |
|
|
• |
98.2% of our capital gain net income, adjusted for certain ordinary gains and losses, recognized for the twelve-month period ending on October 31 of that calendar year; and |
|
|
• |
100% of any income or gains recognized, but not distributed, in preceding years. |
While we intend to distribute any income and capital gains in the manner necessary to minimize imposition of the 4% U.S. federal excise tax, sufficient amounts of our taxable income and capital gains may not be distributed to avoid entirely the imposition of this tax. In that event, we will be liable for this tax only on the amount by which we do not meet the foregoing distribution requirement.
We intend to pay quarterly dividends to our stockholders out of assets legally available for distribution. All dividends will be paid at the discretion of our Board and will depend on our earnings, financial condition, maintenance of our RIC status, compliance with applicable BDC regulations and such other factors as our Board may deem relevant from time to time.
To the extent our current taxable earnings for a year fall below the total amount of our distributions for that year, a portion of those distributions may be deemed a return of capital to our stockholders for U.S. federal income tax purposes. Thus, the source of a distribution to our stockholders may be the original capital invested by the stockholder rather than our income or gains. Stockholders should read any written disclosure carefully and should not assume that the source of any distribution is our ordinary income or gains.
We have adopted an “opt out” dividend reinvestment plan for our common stockholders. As a result, if we declare a cash dividend or other distribution, each stockholder that has not “opted out” of our dividend reinvestment plan will have their dividends or distributions automatically reinvested in additional shares of our common stock rather than receiving cash dividends. Stockholders who receive distributions in the form of shares of common stock will be subject to the same U.S. federal, state and local tax consequences as if they received cash distributions.
Related-Party Transactions
We have entered into a number of business relationships with affiliated or related parties, including the following:
|
|
• |
the Investment Advisory Agreement; |
|
|
• |
the Administration Agreement; and |
|
|
• |
a license agreement with an affiliate of TPG under which the affiliate granted us a non-exclusive license to use the “TPG” name and logo, for a nominal fee, for so long as the Adviser or one of its affiliates remains our investment adviser. Other than with respect to this limited license, we have no legal right to the “TPG” name or logo. |
Critical Accounting Policies
The preparation of our consolidated financial statements requires us to make estimates and assumptions that affect the reported amounts of assets, liabilities, revenues, and expenses. Changes in the economic environment, financial markets, and any other parameters used in determining such estimates could cause actual results to differ. Our critical accounting policies, including those relating to the valuation of our investment portfolio, are described below. The critical accounting policies should be read in connection with our risk factors as disclosed in “ITEM 1A. RISK FACTORS.”
Investments at Fair Value
Loan originations are recorded on the date of the binding commitment, which is generally the funding date. Investment transactions purchased through the secondary markets are recorded on the trade date. Realized gains or losses are measured by the difference between the net proceeds received (excluding prepayment fees, if any) and the amortized cost basis of the investment without regard to unrealized gains or losses previously recognized, and include investments charged off during the period, net of recoveries. The net change in unrealized gains or losses primarily reflects the change in investment values and also includes the reversal of previously recorded unrealized gains or losses with respect to investments realized during the period.
77
Investments for which market quotations are readily available are typically valued at those market quotations. To validate market quotations, we utilize a number of factors to determine if the quotations are representative of fair value, including the source and number of the quotations. Debt and equity securities that are not publicly traded or whose market prices are not readily available, as is the case for substantially all of our investments, are valued at fair value as determined in good faith by our Board, based on, among other things, the input of the Adviser, our Audit Committee and independent third-party valuation firms engaged at the direction of the Board.
As part of the valuation process, the Board takes into account relevant factors in determining the fair value of our investments, including and in combination of:
|
|
• |
the estimated enterprise value of a portfolio company (that is, the total value of the portfolio company’s net debt and equity); |
|
|
• |
the nature and realizable value of any collateral; |
|
|
• |
the portfolio company’s ability to make payments based on its earnings and cash flow; |
|
|
• |
the markets in which the portfolio company does business; |
|
|
• |
a comparison of the portfolio company’s securities to any similar publicly traded securities; and |
|
|
• |
overall changes in the interest rate environment and the credit markets that may affect the price at which similar investments may be made in the future. |
When an external event, such as a purchase transaction, public offering or subsequent equity sale occurs, the Board considers whether the pricing indicated by the external event corroborates our valuation.
The Board undertakes a multi-step valuation process, which includes, among other procedures, the following:
|
|
• |
The valuation process begins with each investment being initially valued by the investment professionals responsible for the portfolio investment in conjunction with the portfolio management team. |
|
|
• |
The Adviser’s management reviews the preliminary valuations with the investment professionals. Agreed-upon valuation recommendations are presented to the Audit Committee. |
|
|
• |
The Audit Committee reviews the valuations presented and recommends values for each investment to the Board. |
|
|
• |
The Board reviews the recommended valuations and determines the fair value of each investment; valuations that are not based on readily available market quotations are valued in good faith based on, among other things, the input of the Adviser, Audit Committee and, where applicable, other third parties, including independent third party valuation firms engaged at the direction of the Board. |
We conduct this valuation process on a quarterly basis.
The Board has engaged independent third-party valuation firms to perform certain limited procedures that the Board has identified and requested them to perform in connection with the valuation process. At December 31, 2019, the independent third-party valuation firms performed their procedures over substantially all of our investments. Upon completion of such limited procedures, the third-party valuation firms determined that the fair value, as determined by the Board, of those investments subjected to their limited procedures, appeared reasonable.
We apply Financial Accounting Standards Board Accounting Standards Codification 820, Fair Value Measurement (“ASC 820”), as amended, which establishes a framework for measuring fair value in accordance with U.S. GAAP and required disclosures of fair value measurements. ASC 820 determines fair value to be the price that would be received for an investment in a current sale, which assumes an orderly transaction between market participants on the measurement date. Market participants are defined as buyers and sellers in the principal or most advantageous market (which may be a hypothetical market) that are independent, knowledgeable, and willing and able to transact. In accordance with ASC 820, we consider our principal market to be the market that has the greatest volume and level of activity. ASC 820 specifies a fair value hierarchy that prioritizes and ranks the level of observability of inputs used in determination of fair value. In accordance with ASC 820, these levels are summarized below:
|
|
• |
Level 1—Valuations based on quoted prices in active markets for identical assets or liabilities that we have the ability to access. |
|
|
• |
Level 2—Valuations based on quoted prices in markets that are not active or for which all significant inputs are observable, either directly or indirectly. |
|
|
• |
Level 3—Valuations based on inputs that are unobservable and significant to the overall fair value measurement. |
78
Transfers between levels, if any, are recognized at the beginning of the quarter in which the transfers occur. In addition to using the above inputs in investment valuations, we apply the valuation policy approved by our Board that is consistent with ASC 820. Consistent with the valuation policy, we evaluate the source of inputs, including any markets in which our investments are trading (or any markets in which securities with similar attributes are trading), in determining fair value. When a security is valued based on prices provided by reputable dealers or pricing services (that is, broker quotes), we subject those prices to various additional criteria in making the determination as to whether a particular investment would qualify for treatment as a Level 2 or Level 3 investment. For example, we review pricing and methodologies provided by dealers or pricing services in order to determine if observable market information is being used, versus unobservable inputs. Some additional factors considered include the number of prices obtained, as well as an assessment as to their quality, such as the depth of the relevant market relative to the size of the Company’s position.
Our accounting policy on the fair value of our investments is critical because the determination of fair value involves subjective judgments and estimates. Accordingly, the notes to our consolidated financial statements express the uncertainty with respect to the possible effect of these valuations, and any change in these valuations, on the consolidated financial statements.
See Note 6 to our consolidated financial statements included in this Form 10-K for more information on the fair value of our investments.
Interest and Dividend Income Recognition
Interest income is recorded on an accrual basis and includes the amortization of discounts and premiums. Discounts and premiums to par value on securities purchased or originated are amortized into interest income over the contractual life of the respective security using the effective interest method. The amortized cost of investments represents the original cost adjusted for the amortization of discounts and premiums, if any.
Unless providing services in connection with an investment, such as syndication, structuring or diligence, all or a portion of any loan fees received by us will be deferred and amortized over the investment’s life using the effective interest method.
Loans are generally placed on non-accrual status when principal or interest payments are past due 30 days or more or when management has reasonable doubt that the borrower will pay principal or interest in full. Accrued and unpaid interest is generally reversed when a loan is placed on non-accrual status. Interest payments received on non-accrual loans may be recognized as income or applied to principal depending upon management’s judgment regarding collectability. Non-accrual loans are restored to accrual status when past due principal and interest has been paid and, in management’s judgment, the borrower is likely to make principal and interest payments in the future. Management may determine to not place a loan on non-accrual status if, notwithstanding any failure to pay, the loan has sufficient collateral value and is in the process of collection.
Dividend income on preferred equity securities is recorded on an accrual basis to the extent that such amounts are payable by the portfolio company and are expected to be collected. Dividend income on common equity securities is recorded on the record date for private portfolio companies or on the ex-dividend date for publicly traded portfolio companies.
Our accounting policy on interest and dividend income recognition is critical because it involves the primary source of our revenue and accordingly is significant to the financial results as disclosed in our consolidated financial statements.
U.S. Federal Income Taxes
We have elected to be treated as a BDC under the 1940 Act. We also have elected to be treated as a RIC under the Code. So long as we maintain our status as a RIC, we will generally not pay corporate-level U.S. federal income or excise taxes on any ordinary income or capital gains that we distribute at least annually to our stockholders as dividends. As a result, any tax liability related to income earned and distributed by us represents obligations of our stockholders and will not be reflected in our consolidated financial statements.
We evaluate tax positions taken or expected to be taken in the course of preparing our financial statements to determine whether the tax positions are “more-likely-than-not” to be sustained by the applicable tax authority. Tax positions not deemed to meet the “more-likely-than-not” threshold are reversed and recorded as a tax benefit or expense in the current year. All penalties and interest associated with income taxes are included in income tax expense. Conclusions regarding tax positions are subject to review and may be adjusted at a later date based on factors including, but not limited to, on-going analyses of tax laws, regulations and interpretations thereof. As of December 31, 2019, the Company did not have any uncertain tax positions that met the recognition or measurement criteria, nor did the Company have any unrecognized tax benefits. Our 2018, 2017 and 2016 tax year returns remain subject to examination by the relevant federal, state, and local tax authorities.
Our accounting policy on income taxes is critical because if we are unable to maintain our status as a RIC, we would be required to record a provision for corporate-level U.S. federal income taxes which may be significant to our financial results.
79
ITEM 7A. QUANTITATIVE AND QUALITATIVE DISCLOSURES ABOUT MARKET RISK
We are subject to financial market risks, including valuation risk, interest rate risk and currency risk.
Valuation Risk
We have invested, and plan to continue to invest, primarily in illiquid debt and equity securities of private companies. Most of our investments will not have a readily available market price, and we value these investments at fair value as determined in good faith by our Board in accordance with our valuation policy. There is no single standard for determining fair value. As a result, determining fair value requires that judgment be applied to the specific facts and circumstances of each portfolio investment while employing a consistently applied valuation process for the types of investments we make. If we were required to liquidate a portfolio investment in a forced or liquidation sale, we may realize amounts that are different from the amounts presented and such differences could be material.
Interest Rate Risk
Interest rate sensitivity refers to the change in earnings that may result from changes in the level of interest rates. We also fund portions of our investments with borrowings. Our net investment income is affected by the difference between the rate at which we invest and the rate at which we borrow. Accordingly, we cannot assure you that a significant change in market interest rates will not have a material adverse effect on our net investment income.
We regularly measure our exposure to interest rate risk. We assess interest rate risk and manage our interest rate exposure on an ongoing basis by comparing our interest rate-sensitive assets to our interest rate-sensitive liabilities. Based on that review, we determine whether or not any hedging transactions are necessary to mitigate exposure to changes in interest rates.
As of December 31, 2019, 99.2% of our debt investments based on fair value in our portfolio bore interest at floating rates (when including investment specific hedges), with 93.5% of these subject to interest rate floors. Our credit facilities also bear interest at floating rates, and in connection with our 2022 Convertible Notes, 2023 Notes and 2024 Notes, which bear interest at fixed rates, we entered into fixed-to-floating interest rate swaps in order to continue to align the interest rates of our liabilities with our investment portfolio.
Assuming that our consolidated balance sheet as of December 31, 2019 were to remain constant and that we took no actions to alter our existing interest rate sensitivity, the following table shows the annualized impact of hypothetical base rate changes in interest rates (considering interest rate floors for floating rate instruments):
|
($ in millions) |
|
|
|
|
|
|
|
|
|
|
|
|
|
Basis Point Change |
|
Interest Income |
|
|
Interest Expense |
|
|
Net Income |
|
|||
|
Up 300 basis points |
|
$ |
65.2 |
|
|
$ |
33.5 |
|
|
$ |
31.7 |
|
|
Up 200 basis points |
|
$ |
43.4 |
|
|
$ |
22.4 |
|
|
$ |
21.0 |
|
|
Up 100 basis points |
|
$ |
21.5 |
|
|
$ |
11.2 |
|
|
$ |
10.3 |
|
|
Down 25 basis points |
|
$ |
(5.2 |
) |
|
$ |
(2.8 |
) |
|
$ |
(2.4 |
) |
Although we believe that this analysis is indicative of our existing sensitivity to interest rate changes, it does not adjust for changes in the credit market, credit quality, the size and composition of the assets in our portfolio and other business developments that could affect our net income. Accordingly, we cannot assure you that actual results would not differ materially from the analysis above.
We may in the future hedge against interest rate fluctuations by using hedging instruments such as additional interest rate swaps, futures, options and forward contracts. While hedging activities may mitigate our exposure to adverse fluctuations in interest rates, certain hedging transactions that we may enter into in the future, such as interest rate swap agreements, may also limit our ability to participate in the benefits of changes in interest rates with respect to our portfolio investments.
Currency Risk
From time to time, we may make investments that are denominated in a foreign currency. These investments are translated into U.S. dollars at each balance sheet date, exposing us to movements in foreign exchange rates. We may employ hedging techniques to minimize these risks, but we cannot assure you that such strategies will be effective or without risk to us. We may seek to utilize instruments such as, but not limited to, forward contracts to seek to hedge against fluctuations in the relative values of our portfolio positions from changes in currency exchange rates. We also have the ability to borrow in certain foreign currencies under our Revolving Credit Facility. Instead of entering into a foreign exchange forward contract in connection with loans or other investments we have made that are denominated in a foreign currency, we may borrow in that currency to establish a natural hedge against our loan or investment. To the extent the loan or investment is based on a floating rate other than a rate under which we can borrow under our Revolving Credit Facility, we may seek to utilize interest rate derivatives to hedge our exposure to changes in the associated rate.
80
ITEM 8. CONSOLIDATED FINANCIAL STATEMENTS AND SUPPLEMENTARY DATA
TPG SPECIALTY LENDING, INC.
INDEX TO CONSOLIDATED FINANCIAL STATEMENTS
F-1
Report of Independent Registered Public Accounting Firm
To the Stockholders and Board of Directors
TPG Specialty Lending, Inc.:
Opinions on the Consolidated Financial Statements and Internal Control Over Financial Reporting
We have audited the accompanying consolidated balance sheets of TPG Specialty Lending, Inc. and subsidiaries (the Company), including the consolidated schedules of investments, as of December 31, 2019 and 2018, the related consolidated statements of operations, changes in net assets, and cash flows for each of the years in the three-year period ended December 31, 2019, and the related notes (collectively, the consolidated financial statements). We also have audited the Company’s internal control over financial reporting as of December 31, 2019, based on criteria established in Internal Control – Integrated Framework (2013) issued by the Committee of Sponsoring Organizations of the Treadway Commission.
In our opinion, the consolidated financial statements referred to above present fairly, in all material respects, the financial position of the Company as of December 31, 2019 and 2018, and the results of its operations, changes in net assets, and cash flows for each of the years in the three-year period ended December 31, 2019, in conformity with U.S. generally accepted accounting principles. Also in our opinion, the Company maintained, in all material respects, effective internal control over financial reporting as of December 31, 2019, based on criteria established in Internal Control – Integrated Framework (2013) issued by the Committee of Sponsoring Organizations of the Treadway Commission.
Basis for Opinions
The Company’s management is responsible for these consolidated financial statements, for maintaining effective internal control over financial reporting, and for its assessment of the effectiveness of internal control over financial reporting, included in the accompanying Management’s Report on Internal Control over Financial Reporting. Our responsibility is to express an opinion on the Company’s consolidated financial statements and an opinion on the Company’s internal control over financial reporting based on our audits. We are a public accounting firm registered with the Public Company Accounting Oversight Board (United States) (PCAOB) and are required to be independent with respect to the Company in accordance with the U.S. federal securities laws and the applicable rules and regulations of the Securities and Exchange Commission and the PCAOB.
We conducted our audits in accordance with the standards of the PCAOB. Those standards require that we plan and perform the audits to obtain reasonable assurance about whether the consolidated financial statements are free of material misstatement, whether due to error or fraud, and whether effective internal control over financial reporting was maintained in all material respects.
Our audits of the consolidated financial statements included performing procedures to assess the risks of material misstatement of the consolidated financial statements, whether due to error or fraud, and performing procedures that respond to those risks. Such procedures included examining, on a test basis, evidence regarding the amounts and disclosures in the consolidated financial statements. Such procedures also included confirmation of securities owned as of December 31, 2019 and 2018, by correspondence with custodians, or by other appropriate auditing procedures. Our audits also included evaluating the accounting principles used and significant estimates made by management, as well as evaluating the overall presentation of the consolidated financial statements. Our audit of internal control over financial reporting included obtaining an understanding of internal control over financial reporting, assessing the risk that a material weakness exists, and testing and evaluating the design and operating effectiveness of internal control based on the assessed risk. Our audits also included performing such other procedures as we considered necessary in the circumstances. We believe that our audits provide a reasonable basis for our opinions.
Definition and Limitations of Internal Control Over Financial Reporting
A company’s internal control over financial reporting is a process designed to provide reasonable assurance regarding the reliability of financial reporting and the preparation of financial statements for external purposes in accordance with generally accepted accounting principles. A company’s internal control over financial reporting includes those policies and procedures that (1) pertain to the maintenance of records that, in reasonable detail, accurately and fairly reflect the transactions and dispositions of the assets of the company; (2) provide reasonable assurance that transactions are recorded as necessary to permit preparation of financial statements in accordance with generally accepted accounting principles, and that receipts and expenditures of the company are being made only in accordance with authorizations of management and directors of the company; and (3) provide reasonable assurance regarding prevention or timely detection of unauthorized acquisition, use, or disposition of the company’s assets that could have a material effect on the financial statements.
Because of its inherent limitations, internal control over financial reporting may not prevent or detect misstatements. Also, projections of any evaluation of effectiveness to future periods are subject to the risk that controls may become inadequate because of changes in conditions, or that the degree of compliance with the policies or procedures may deteriorate.
F-2
The critical audit matter communicated below is a matter arising from the current period audit of the consolidated financial statements that was communicated or required to be communicated to the audit committee and that: (1) relates to accounts or disclosures that are material to the consolidated financial statements and (2) involved our especially challenging, subjective, or complex judgments. The communication of a critical audit matter does not alter in any way our opinion on the consolidated financial statements, taken as a whole, and we are not, by communicating the critical audit matter below, providing a separate opinion on the critical audit matter or on the accounts or disclosures to which it relates.
Determining the fair value of investments
As discussed in Notes 2, 4 and 6 to the consolidated financial statements, the Company measures substantially all of its investments at fair value utilizing unobservable inputs as there is no readily determinable market value. As of December 31, 2019, total investments at fair value was $2.2 billion, or 98% of total assets.
We identified determining the fair value of investments that are not publicly traded or whose market prices are not readily available as a critical audit matter because evaluating the use of specific valuation techniques, inputs, and assumptions, involved a high degree of subjective auditor judgment and changes in these techniques, inputs, and assumptions could have a significant impact on the fair value of investments. In particular, the more subjective judgments were related to market yields for investments with similar terms and risks used in yield analyses, comparable financial performance multiples used in determining enterprise values, and discount rates and expected lives used in discounted cash flow analyses.
The primary procedures we performed to address this critical audit matter included the following. We tested certain internal controls over the Company's determination of the valuation techniques, market yields, financial performance multiples, discount rates, and expected lives used to estimate the fair value of investments. We involved valuation professionals with specialized skills and knowledge who, for a selection of the Company’s investments, evaluated the Company’s estimate of fair value by developing an independent estimate of fair value through the use of relevant market information to develop a range of comparable financial performance multiples and discount rate assumptions. For a selection of investments, we tested the Company’s process to determine the fair value by testing the fair value derived from the Company’s models and comparing the inputs and assumptions to supporting documentation. We evaluated the Company’s historical ability to estimate fair value by comparing the transaction price of available transactions occurring subsequent to the prior period valuation date with the fair value estimate determined by the Company in the prior period.
/s/ KPMG LLP
We have served as the Company’s auditor since 2010.
New York, New York
February 19, 2020
F-3
(Amounts in thousands, except share and per share amounts)
|
|
|
December 31, |
|
|
December 31, |
|
||
|
|
|
2019 |
|
|
2018 |
|
||
|
Assets |
|
|
|
|
|
|
|
|
|
Investments at fair value |
|
|
|
|
|
|
|
|
|
Non-controlled, non-affiliated investments (amortized cost of $2,099,781 and $1,546,780, respectively) |
|
$ |
2,147,876 |
|
|
$ |
1,565,532 |
|
|
Non-controlled, affiliated investments (amortized cost of $49,445 and $84,602, respectively) |
|
|
50,136 |
|
|
|
83,932 |
|
|
Controlled, affiliated investments (amortized cost of $88,811 and $85,018, respectively) |
|
|
47,916 |
|
|
|
56,505 |
|
|
Total investments at fair value (amortized cost of $2,238,037 and $1,716,400, respectively) |
|
|
2,245,928 |
|
|
|
1,705,969 |
|
|
Cash and cash equivalents (restricted cash of $9,315 and $7,303, respectively) |
|
|
14,143 |
|
|
|
10,575 |
|
|
Interest receivable |
|
|
13,055 |
|
|
|
8,829 |
|
|
Prepaid expenses and other assets |
|
|
7,805 |
|
|
|
4,951 |
|
|
Total Assets |
|
$ |
2,280,931 |
|
|
$ |
1,730,324 |
|
|
Liabilities |
|
|
|
|
|
|
|
|
|
Debt (net of deferred financing costs of $18,471 and $15,508, respectively) |
|
$ |
1,094,467 |
|
|
$ |
608,007 |
|
|
Management fees payable to affiliate |
|
|
8,234 |
|
|
|
7,069 |
|
|
Incentive fees payable to affiliate |
|
|
7,161 |
|
|
|
9,356 |
|
|
Dividends payable |
|
|
25,927 |
|
|
|
25,499 |
|
|
Other payables to affiliate |
|
|
1,948 |
|
|
|
1,621 |
|
|
Other liabilities |
|
|
23,897 |
|
|
|
15,570 |
|
|
Total Liabilities |
|
|
1,161,634 |
|
|
|
667,122 |
|
|
Commitments and contingencies (Note 8) |
|
|
|
|
|
|
|
|
|
Net Assets |
|
|
|
|
|
|
|
|
|
Preferred stock, $0.01 par value; 100,000,000 shares authorized; no shares issued and outstanding |
|
|
— |
|
|
|
— |
|
|
Common stock, $0.01 par value; 400,000,000 shares authorized, 66,613,671 and 65,501,897 shares issued, respectively; and 66,524,591 and 65,412,817 shares outstanding, respectively |
|
|
666 |
|
|
|
655 |
|
|
Additional paid-in capital |
|
|
1,009,270 |
|
|
|
991,919 |
|
|
Treasury stock at cost; 89,080 and 89,080 shares held, respectively |
|
|
(1,359 |
) |
|
|
(1,359 |
) |
|
Distributable earnings |
|
|
110,720 |
|
|
|
71,987 |
|
|
Total Net Assets |
|
|
1,119,297 |
|
|
|
1,063,202 |
|
|
Total Liabilities and Net Assets |
|
$ |
2,280,931 |
|
|
$ |
1,730,324 |
|
|
Net Asset Value Per Share |
|
$ |
16.83 |
|
|
$ |
16.25 |
|
The accompanying notes are an integral part of these consolidated financial statements.
F-4
Consolidated Statements of Operations
(Amounts in thousands, except share and per share amounts)
|
|
|
|
Year Ended |
|
|
Year Ended |
|
|
Year Ended |
|
|||
|
|
|
|
December 31, 2019 |
|
|
December 31, 2018 |
|
|
December 31, 2017 |
|
|||
|
Income |
|
|
|
|
|
|
|
|
|
|
|
|
|
|
Investment income from non-controlled, non-affiliated investments: |
|
|
|
|
|
|
|
|
|
|
|
|
|
|
Interest from investments |
|
|
$ |
224,810 |
|
|
$ |
232,517 |
|
|
$ |
191,288 |
|
|
Dividend income |
|
|
|
420 |
|
|
|
196 |
|
|
|
345 |
|
|
Other income |
|
|
|
13,838 |
|
|
|
11,298 |
|
|
|
9,617 |
|
|
Total investment income from non-controlled, non-affiliated investments |
|
|
|
239,068 |
|
|
|
244,011 |
|
|
|
201,250 |
|
|
Investment income from non-controlled, affiliated investments: |
|
|
|
|
|
|
|
|
|
|
|
|
|
|
Interest from investments |
|
|
|
6,370 |
|
|
|
3,652 |
|
|
— |
|
|
|
Other income |
|
|
|
88 |
|
|
|
398 |
|
|
— |
|
|
|
Total investment income from non-controlled, affiliated investments |
|
|
|
6,458 |
|
|
|
4,050 |
|
|
— |
|
|
|
Investment income from controlled, affiliated investments: |
|
|
|
|
|
|
|
|
|
|
|
|
|
|
Interest from investments |
|
|
|
5,958 |
|
|
|
13,763 |
|
|
|
9,443 |
|
|
Other income |
|
|
|
11 |
|
|
|
90 |
|
|
|
204 |
|
|
Total investment income from controlled, affiliated investments |
|
|
|
5,969 |
|
|
|
13,853 |
|
|
|
9,647 |
|
|
Total Investment Income |
|
|
|
251,495 |
|
|
|
261,914 |
|
|
|
210,897 |
|
|
Expenses |
|
|
|
|
|
|
|
|
|
|
|
|
|
|
Interest |
|
|
|
49,110 |
|
|
|
42,761 |
|
|
|
27,441 |
|
|
Management fees |
|
|
|
30,104 |
|
|
|
28,589 |
|
|
|
24,287 |
|
|
Incentive fees |
|
|
|
27,211 |
|
|
|
30,515 |
|
|
|
25,497 |
|
|
Professional fees |
|
|
|
6,530 |
|
|
|
7,208 |
|
|
|
5,431 |
|
|
Directors’ fees |
|
|
|
595 |
|
|
|
414 |
|
|
|
405 |
|
|
Other general and administrative |
|
|
|
5,912 |
|
|
|
5,226 |
|
|
|
4,827 |
|
|
Total expenses |
|
|
|
119,462 |
|
|
|
114,713 |
|
|
|
87,888 |
|
|
Management and incentive fees waived (Note 3) |
|
|
|
— |
|
|
|
(63 |
) |
|
|
(85 |
) |
|
Net Expenses |
|
|
|
119,462 |
|
|
|
114,650 |
|
|
|
87,803 |
|
|
Net Investment Income Before Income Taxes |
|
|
|
132,033 |
|
|
|
147,264 |
|
|
|
123,094 |
|
|
Income taxes, including excise taxes |
|
|
|
3,750 |
|
|
|
3,375 |
|
|
|
2,835 |
|
|
Net Investment Income |
|
|
|
128,283 |
|
|
|
143,889 |
|
|
|
120,259 |
|
|
Unrealized and Realized Gains (Losses) |
|
|
|
|
|
|
|
|
|
|
|
|
|
|
Net change in unrealized gains (losses): |
|
|
|
|
|
|
|
|
|
|
|
|
|
|
Non-controlled, non-affiliated investments |
|
|
|
29,432 |
|
|
|
(15,207 |
) |
|
|
10,090 |
|
|
Non-controlled, affiliated investments |
|
|
|
1,272 |
|
|
|
(670 |
) |
|
— |
|
|
|
Controlled, affiliated investments |
|
|
|
(12,381 |
) |
|
|
(2,028 |
) |
|
|
7,668 |
|
|
Translation of other assets and liabilities in foreign currencies |
|
|
|
(3,255 |
) |
|
|
5,455 |
|
|
|
(11,432 |
) |
|
Interest rate swaps |
|
|
|
9,194 |
|
|
|
(1,701 |
) |
|
|
(1,031 |
) |
|
Total net change in unrealized gains (losses) |
|
|
|
24,262 |
|
|
|
(14,151 |
) |
|
|
5,295 |
|
|
Realized gains (losses): |
|
|
|
|
|
|
|
|
|
|
|
|
|
|
Non-controlled, non-affiliated investments |
|
|
|
5,482 |
|
|
|
3,457 |
|
|
|
7,481 |
|
|
Controlled, affiliated investments |
|
|
|
(3,594 |
) |
|
|
(14,890 |
) |
|
|
(21,776 |
) |
|
Interest rate swaps |
|
|
|
41 |
|
|
— |
|
|
— |
|
||
|
Foreign currency transactions |
|
|
|
109 |
|
|
|
712 |
|
|
|
350 |
|
|
Total net realized gains (losses) |
|
|
|
2,038 |
|
|
|
(10,721 |
) |
|
|
(13,945 |
) |
|
Total Unrealized and Realized Gains (Losses) |
|
|
|
26,300 |
|
|
|
(24,872 |
) |
|
|
(8,650 |
) |
|
Increase in Net Assets Resulting from Operations |
|
|
$ |
154,583 |
|
|
$ |
119,017 |
|
|
$ |
111,609 |
|
|
Earnings per common share—basic and diluted |
|
|
$ |
2.34 |
|
|
$ |
1.86 |
|
|
$ |
1.86 |
|
|
Weighted average shares of common stock outstanding—basic and diluted |
|
|
|
66,069,305 |
|
|
|
64,028,137 |
|
|
|
59,995,387 |
|
The accompanying notes are an integral part of these consolidated financial statements.
F-5
Consolidated Schedule of Investments as of December 31, 2019
(Amounts in thousands, except share amounts)
|
Company (1) |
|
Investment |
|
Initial Acquisition Date |
|
Reference Rate and Spread |
|
|
Interest Rate |
|
|
Amortized Cost (2)(8) |
|
|
Fair Value (10) |
|
|
Percentage of Net Assets |
|
|||||
|
Debt Investments |
|
|
|
|
|
|
|
|
|
|
|
|
|
|
|
|
|
|
|
|
|
|
|
|
|
Beverage, food and tobacco |
|
|
|
|
|
|
|
|
|
|
|
|
|
|
|
|
|
|
|
|
|
|
|
|
|
AFS Technologies, Inc. (3)(5)(6) |
|
First-lien loan ($45,559 par, due 10/2023) |
|
10/16/2018 |
|
|
L + 6.25 |
% |
|
|
8.05 |
% |
|
$ |
45,004 |
|
|
$ |
45,673 |
|
|
|
4.1 |
% |
|
Business services |
|
|
|
|
|
|
|
|
|
|
|
|
|
|
|
|
|
|
|
|
|
|
|
|
|
Acceo Solutions, Inc. (3)(4)(5) |
|
First-lien loan (CAD 64,025 par, due 7/2023) |
|
7/6/2018 |
|
|
C + 4.75 |
% |
|
|
6.83 |
% |
|
|
48,001 |
|
|
49,497 (CAD 64,185) |
|
|
|
4.4 |
% |
|
|
Alpha Midco, Inc. (3)(5) |
|
First-lien loan ($45,296 par, due 8/2025) |
|
8/15/2019 |
|
|
L + 6.75 |
% |
|
|
8.75 |
% |
|
|
43,921 |
|
|
|
44,061 |
|
|
|
3.9 |
% |
|
Dye & Durham Corp. (3)(4) |
|
First-lien loan (CAD 65,669 par, due 7/2024) |
|
7/11/2019 |
|
|
C + 7.00 |
% |
|
|
9.03 |
% |
|
|
49,015 |
|
|
49,628 (CAD 64,355) |
|
|
|
4.4 |
% |
|
|
|
|
First-lien revolving loan (CAD 1,750 par, due 7/2024) |
|
7/11/2019 |
|
|
P + 6.00 |
% |
|
|
10.00 |
% |
|
|
1,269 |
|
|
1,296 (CAD 1,680) |
|
|
|
0.1 |
% |
|
|
Integration Appliance, Inc. (3) |
|
First-lien loan ($71,500 par, due 8/2023) |
|
8/13/2018 |
|
|
L + 7.25 |
% |
|
|
9.43 |
% |
|
|
70,619 |
|
|
|
71,685 |
|
|
|
6.4 |
% |
|
Motus, LLC (3)(5) |
|
First-lien loan ($59,853 par, due 1/2024) |
|
1/17/2018 |
|
|
L + 5.50 |
% |
|
|
7.45 |
% |
|
|
58,764 |
|
|
|
60,451 |
|
|
|
5.4 |
% |
|
Netwrix Corp. and Concept Searching, Inc. (3)(5) |
|
First-lien loan ($20,000 par, due 10/2024) |
|
10/17/2019 |
|
|
L + 5.88 |
% |
|
|
7.67 |
% |
|
|
19,541 |
|
|
|
19,650 |
|
|
|
1.8 |
% |
|
Nintex Global, Ltd. (3)(5) |
|
First-lien loan ($74,223 par, due 4/2024) |
|
3/30/2018 |
|
|
L + 6.25 |
% |
|
|
8.05 |
% |
|
|
72,844 |
|
|
|
75,151 |
|
|
|
6.7 |
% |
|
|
|
|
|
|
|
|
|
|
|
|
|
|
|
|
363,974 |
|
|
|
371,419 |
|
|
|
33.1 |
% |
|
Chemicals |
|
|
|
|
|
|
|
|
|
|
|
|
|
|
|
|
|
|
|
|
|
|
|
|
|
Vertellus Specialties, Inc. (3) |
|
Second-lien loan ($4,147 par, due 10/2021) |
|
10/31/2016 |
|
|
L + 12.00 |
% |
|
|
13.63 |
% |
|
|
4,147 |
|
|
|
4,147 |
|
|
|
0.4 |
% |
|
Communications |
|
|
|
|
|
|
|
|
|
|
|
|
|
|
|
|
|
|
|
|
|
|
|
|
|
IntelePeer Holdings, Inc. (3) |
|
First-lien loan ($35,000 par, due 12/2024) |
|
12/2/2019 |
|
|
L + 8.00 |
% |
|
|
9.91 |
% |
|
|
35,000 |
|
|
|
34,711 |
|
|
|
3.1 |
% |
|
Education |
|
|
|
|
|
|
|
|
|
|
|
|
|
|
|
|
|
|
|
|
|
|
|
|
|
Curriculum Associates, LLC (3)(5) |
|
First-lien loan ($75,000 par, due 9/2025) |
|
2/28/2018 |
|
|
L + 5.50 |
% |
|
|
7.30 |
% |
|
|
72,055 |
|
|
|
77,438 |
|
|
|
6.9 |
% |
|
Frontline Technologies Group, LLC (3) |
|
First-lien loan ($65,798 par, due 9/2023) |
|
9/18/2017 |
|
|
L + 5.75 |
% |
|
|
7.55 |
% |
|
|
65,395 |
|
|
|
65,963 |
|
|
|
5.9 |
% |
|
Illuminate Education, Inc.(3)(5) |
|
First-lien loan ($64,025 par, due 8/2022) |
|
8/25/2017 |
|
|
L + 7.25 |
% |
|
|
9.05 |
% |
|
|
63,227 |
|
|
|
63,545 |
|
|
|
5.7 |
% |
|
|
|
|
|
|
|
|
|
|
|
|
|
|
|
|
200,677 |
|
|
|
206,946 |
|
|
|
18.5 |
% |
|
Electronics |
|
|
|
|
|
|
|
|
|
|
|
|
|
|
|
|
|
|
|
|
|
|
|
|
|
APX Group, Inc. (11) |
|
Secured note ($1,000 par, due 12/2022) |
|
5/31/2019 |
|
|
7.88 |
% |
|
|
7.88 |
% |
|
|
938 |
|
|
|
1,009 |
|
|
|
0.1 |
% |
|
Financial services |
|
|
|
|
|
|
|
|
|
|
|
|
|
|
|
|
|
|
|
|
|
|
|
|
|
AppStar Financial, LLC (3) |
|
First-lien loan ($15,855 par, due 8/2020) |
|
8/18/2015 |
|
|
L + 7.50 |
% |
|
|
9.30 |
% |
|
|
15,794 |
|
|
|
15,944 |
|
|
|
1.4 |
% |
|
AvidXchange, Inc. (3)(5) |
|
First-lien loan ($10,350 par, due 4/2024) |
|
10/1/2019 |
|
|
L + 9.00 |
% |
|
|
11.00 |
% |
|
|
10,195 |
|
|
|
10,236 |
|
|
|
0.9 |
% |
|
Bear OpCo, LLC (3)(5) |
|
First-lien loan ($17,456 par, due 10/2024) |
|
10/10/2019 |
|
|
L + 5.00 |
% |
|
|
6.80 |
% |
|
|
16,978 |
|
|
|
17,063 |
|
|
|
1.5 |
% |
|
BlueSnap, Inc. (3) |
|
First-lien loan ($35,000 par, due 10/2024) |
|
10/25/2019 |
|
|
L + 7.00 |
% |
|
|
8.80 |
% |
|
|
34,273 |
|
|
|
34,531 |
|
|
|
3.1 |
% |
|
G Treasury SS, LLC (3)(5) |
|
First-lien loan ($30,000 par, due 4/2023) |
|
4/9/2018 |
|
|
L + 8.25 |
% |
|
|
10.03 |
% |
|
|
29,643 |
|
|
|
30,000 |
|
|
|
2.7 |
% |
|
GC Agile Holdings, Ltd. (3)(4) |
|
First-lien loan ($39,724 par, due 6/2025) |
|
1/31/2019 |
|
|
L + 7.00 |
% |
|
|
8.95 |
% |
|
|
39,099 |
|
|
|
39,128 |
|
|
|
3.5 |
% |
|
Kyriba Corp.(3) |
|
First-lien loan ($12,717 par, due 4/2025) |
|
4/9/2019 |
|
|
L + 9.00 |
% |
|
10.94% (incl. 9.00% PIK) |
|
|
|
12,391 |
|
|
|
12,866 |
|
|
|
1.1 |
% |
|
|
|
|
First-lien loan (EUR 7,571 par, due 4/2025) |
|
4/9/2019 |
|
|
E + 9.00 |
% |
|
9.00% (incl. 9.00% PIK) |
|
|
|
8,258 |
|
|
7,759 (EUR 6,912) |
|
|
|
0.7 |
% |
||
F-6
|
|
First-lien revolving loan ($427 par, due 4/2025) |
|
4/9/2019 |
|
|
L + 7.25 |
% |
|
|
9.17 |
% |
|
|
384 |
|
|
|
536 |
|
|
|
0.0 |
% |
|
|
|
|
First-lien revolving loan (EUR 183 par, due 4/2025) |
|
4/9/2019 |
|
|
E + 7.25 |
% |
|
|
7.25 |
% |
|
|
197 |
|
|
60 (EUR 54) |
|
|
|
0.0 |
% |
|
|
PayLease, LLC (3) |
|
First-lien loan ($64,327 par, due 7/2022) |
|
7/28/2017 |
|
|
L + 7.25 |
% |
|
|
9.05 |
% |
|
|
63,518 |
|
|
|
65,511 |
|
|
|
5.9 |
% |
|
PrimeRevenue, Inc. (3) |
|
First-lien loan ($21,144 par, due 12/2023) |
|
12/31/2018 |
|
|
L + 8.50 |
% |
|
10.30% (incl. 5.50% PIK) |
|
|
|
20,877 |
|
|
|
21,213 |
|
|
|
1.9 |
% |
|
|
Swift Gift, Ltd. (3)(5) |
|
First-lien loan ($28,146 par, due 1/2022) |
|
7/31/2017 |
|
|
L + 6.50 |
% |
|
|
8.31 |
% |
|
|
27,776 |
|
|
|
28,849 |
|
|
|
2.6 |
% |
|
|
|
|
|
|
|
|
|
|
|
|
|
|
|
|
279,383 |
|
|
|
283,696 |
|
|
|
25.3 |
% |
|
Healthcare |
|
|
|
|
|
|
|
|
|
|
|
|
|
|
|
|
|
|
|
|
|
|
|
|
|
Caris Life Sciences, Ltd. |
|
First-lien loan ($5,000 par, due 9/2023) |
|
9/21/2018 |
|
|
11.30 |
% |
|
|
11.30 |
% |
|
|
4,855 |
|
|
|
4,956 |
|
|
|
0.4 |
% |
|
|
|
Convertible note ($2,500 par, due 9/2023) |
|
9/21/2018 |
|
|
8.00 |
% |
|
|
8.00 |
% |
|
|
2,500 |
|
|
|
2,550 |
|
|
|
0.2 |
% |
|
Clinicient, Inc.(3) |
|
First-lien loan ($15,000 par, due 5/2024) |
|
5/31/2019 |
|
|
L + 7.00 |
% |
|
|
8.94 |
% |
|
|
14,829 |
|
|
|
14,858 |
|
|
|
1.3 |
% |
|
Integrated Practice Solutions, Inc. (3)(5) |
|
First-lien loan ($49,875 par, due 10/2024) |
|
6/30/2017 |
|
|
L + 7.50 |
% |
|
|
9.30 |
% |
|
|
48,104 |
|
|
|
49,875 |
|
|
|
4.5 |
% |
|
MedeAnalytics, Inc. (3)(5) |
|
First-lien loan ($40,773 par, due 9/2020) |
|
9/30/2015 |
|
|
L + 7.50 |
% |
|
|
9.30 |
% |
|
|
40,556 |
|
|
|
40,875 |
|
|
|
3.7 |
% |
|
Quantros, Inc. (3)(5) |
|
First-lien loan ($18,444 par, due 12/2020) |
|
2/29/2016 |
|
|
L + 8.50 |
% |
|
|
10.41 |
% |
|
|
18,326 |
|
|
|
18,444 |
|
|
|
1.6 |
% |
|
TherapeuticsMD, Inc. (3)(4) |
|
First-lien loan ($30,000 par, due 3/2024) |
|
4/24/2019 |
|
|
L + 7.75 |
% |
|
|
10.45 |
% |
|
|
29,333 |
|
|
|
29,100 |
|
|
|
2.6 |
% |
|
Valant Medical Solutions, Inc. (3) |
|
First-lien loan ($27,936 par, due 4/2024) |
|
4/8/2019 |
|
|
L + 8.75 |
% |
|
|
10.55 |
% |
|
|
27,117 |
|
|
|
27,372 |
|
|
|
2.4 |
% |
|
Vita Bidco, Inc. (3)(5) |
|
First-lien loan ($21,773 par, due 2/2024) |
|
2/11/2019 |
|
|
L + 6.50 |
% |
|
|
8.30 |
% |
|
|
21,237 |
|
|
|
21,773 |
|
|
|
1.9 |
% |
|
|
|
|
|
|
|
|
|
|
|
|
|
|
|
|
206,857 |
|
|
|
209,803 |
|
|
|
18.6 |
% |
|
Hotel, gaming, and leisure |
|
|
|
|
|
|
|
|
|
|
|
|
|
|
|
|
|
|
|
|
|
|
|
|
|
IRGSE Holding Corp. (3)(7) |
|
First-lien loan ($31,600 par, due 9/2021) |
|
9/29/2015 |
|
|
L + 9.50 |
% |
|
11.44% (incl. 5.00% PIK) |
|
|
|
29,746 |
|
|
|
31,047 |
|
|
|
2.8 |
% |
|
|
|
|
First-lien revolving loan ($3,221 par, due 9/2021) |
|
9/29/2015 |
|
|
L + 9.50 |
% |
|
11.44% (incl. 5.00% PIK) |
|
|
|
3,221 |
|
|
|
3,128 |
|
|
|
0.3 |
% |
|
|
|
|
|
|
|
|
|
|
|
|
|
|
|
|
|
32,967 |
|
|
|
34,175 |
|
|
|
3.1 |
% |
|
Human resource support services |
|
|
|
|
|
|
|
|
|
|
|
|
|
|
|
|
|
|
|
|
|
|
|
|
|
Absorb Software, Inc. (3)(4)(5) |
|
First-lien loan ($34,837 par, due 5/2024) |
|
7/31/2019 |
|
|
L + 6.50 |
% |
|
|
8.30 |
% |
|
|
34,122 |
|
|
|
34,228 |
|
|
|
3.1 |
% |
|
ClearCompany, LLC (3) |
|
First-lien loan ($19,192 par, due 7/2023) |
|
7/23/2018 |
|
|
L + 8.50 |
% |
|
10.34% (incl. 2.50% PIK) |
|
|
|
18,993 |
|
|
|
19,140 |
|
|
|
1.7 |
% |
|
|
DaySmart Holdings, LLC. (3) |
|
First-lien loan ($30,247 par, due 10/2024) |
|
10/1/2019 |
|
|
L + 7.25 |
% |
|
|
9.05 |
% |
|
|
29,370 |
|
|
|
29,456 |
|
|
|
2.6 |
% |
|
PageUp People, Ltd. (3)(4) |
|
First-lien loan (AUD 51,401 par, due 12/2022) |
|
1/11/2018 |
|
|
B + 7.25 |
% |
|
8.50% (incl. 1.25% PIK) |
|
|
|
39,391 |
|
|
36,042 (AUD 51,273) |
|
|
|
3.2 |
% |
||
|
|
|
First-lien revolving loan (AUD 1,000 par, due 12/2022) |
|
1/11/2018 |
|
|
B + 7.25 |
% |
|
|
8.50 |
% |
|
|
714 |
|
|
694 (AUD 988) |
|
|
|
0.1 |
% |
|
|
PayScale Holdings, Inc. (3)(5) |
|
First-lien loan ($39,900 par, due 5/2024) |
|
5/3/2019 |
|
|
L + 7.00 |
% |
|
|
8.80 |
% |
|
|
38,914 |
|
|
|
39,187 |
|
|
|
3.5 |
% |
|
Shaker International, Inc. (3)(5) |
|
First-lien loan ($22,388 par, due 5/2024) |
|
5/15/2019 |
|
|
L + 7.00 |
% |
|
|
8.94 |
% |
|
|
21,879 |
|
|
|
21,940 |
|
|
|
2.0 |
% |
|
|
|
|
|
|
|
|
|
|
|
|
|
|
|
|
183,383 |
|
|
|
180,687 |
|
|
|
16.2 |
% |
|
Insurance |
|
|
|
|
|
|
|
|
|
|
|
|
|
|
|
|
|
|
|
|
|
|
|
|
|
Riskonnect, Inc. (3)(5) |
|
First-lien loan ($49,813 par, due 10/2023) |
|
6/30/2017 |
|
|
L + 7.00 |
% |
|
|
8.95 |
% |
|
|
49,346 |
|
|
|
50,186 |
|
|
|
4.5 |
% |
|
|
|
|
|
|
|
|
|
|
|
|
|
|
|
|
|
|
|
|
|
|
|
|
|
|
|
Internet services |
|
|
|
|
|
|
|
|
|
|
|
|
|
|
|
|
|
|
|
|
|
|
|
|
|
Gainsight, Inc. (9) |
|
First-lien loan ($3,322 par, due 7/2025) |
|
7/29/2019 |
|
|
13.00 |
% |
|
13.00% (incl. 13.00% PIK) |
|
|
|
3,255 |
|
|
|
3,284 |
|
|
|
0.3 |
% |
|
F-7
|
|
First-lien loan ($37,430 par, due 1/2022) |
|
6/18/2018 |
|
|
L + 6.00 |
% |
|
|
7.80 |
% |
|
|
37,034 |
|
|
|
37,243 |
|
|
|
3.3 |
% |
|
|
Lithium Technologies, LLC (3) |
|
First-lien loan ($54,700 par, due 10/2022) |
|
10/3/2017 |
|
|
L + 8.00 |
% |
|
|
10.04 |
% |
|
|
53,888 |
|
|
|
53,967 |
|
|
|
4.8 |
% |
|
Lucidworks, Inc. (9) |
|
First-lien loan ($12,018 par, due 7/2024) |
|
7/31/2019 |
|
|
12.00 |
% |
|
12.00% (incl. 7.00% PIK) |
|
|
|
11,879 |
|
|
|
11,941 |
|
|
|
1.1 |
% |
|
|
|
|
|
|
|
|
|
|
|
|
|
|
|
|
|
106,056 |
|
|
|
106,435 |
|
|
|
9.5 |
% |
|
Marketing Services |
|
|
|
|
|
|
|
|
|
|
|
|
|
|
|
|
|
|
|
|
|
|
|
|
|
Acoustic, L.P. (3) |
|
First-lien note ($33,000 par, due 6/2024) |
|
12/17/2019 |
|
|
L + 7.00 |
% |
|
|
8.80 |
% |
|
|
32,230 |
|
|
|
32,175 |
|
|
|
2.9 |
% |
|
Office products |
|
|
|
|
|
|
|
|
|
|
|
|
|
|
|
|
|
|
|
|
|
|
|
|
|
USR Parent, Inc. (3)(5) |
|
ABL FILO term loan ($11,500 par, due 9/2022) |
|
9/12/2017 |
|
|
L + 7.75 |
% |
|
|
9.45 |
% |
|
|
11,338 |
|
|
|
11,701 |
|
|
|
1.0 |
% |
|
Oil, gas and consumable fuels |
|
|
|
|
|
|
|
|
|
|
|
|
|
|
|
|
|
|
|
|
|
|
|
|
|
Energy Alloys, LLC (3)(5) |
|
ABL FILO term loan ($22,000 par, due 8/2024) |
|
8/28/2019 |
|
|
L + 6.25 |
% |
|
|
8.25 |
% |
|
|
21,171 |
|
|
|
21,260 |
|
|
|
1.9 |
% |
|
MD America Energy, LLC (3) |
|
First-lien loan ($19,069 par, due 11/2023) |
|
11/14/2018 |
|
|
L + 7.75 |
% |
|
|
9.67 |
% |
|
|
18,836 |
|
|
|
18,640 |
|
|
|
1.7 |
% |
|
Mississippi Resources, LLC (3)(7) |
|
First-lien loan ($8,000 par, due 6/2020) |
|
6/29/2018 |
|
|
L + 9.00 |
% |
|
|
10.80 |
% |
|
|
7,998 |
|
|
|
8,000 |
|
|
|
0.7 |
% |
|
Verdad Resources Intermediate Holdings, LLC (3) |
|
First-lien loan ($42,222 par, due 10/2023) |
|
4/10/2019 |
|
|
L + 7.50 |
% |
|
|
9.50 |
% |
|
|
41,257 |
|
|
|
41,347 |
|
|
|
3.7 |
% |
|
|
|
|
|
|
|
|
|
|
|
|
|
|
|
|
89,262 |
|
|
|
89,247 |
|
|
|
8.0 |
% |
|
Pharmaceuticals |
|
|
|
|
|
|
|
|
|
|
|
|
|
|
|
|
|
|
|
|
|
|
|
|
|
Nektar Therapeutics (4)(5)(9) |
|
Secured note ($74,950 par, due 10/2020) |
|
10/5/2015 |
|
|
7.75 |
% |
|
|
7.75 |
% |
|
|
74,774 |
|
|
|
76,074 |
|
|
|
6.8 |
% |
|
Real Estate |
|
|
|
|
|
|
|
|
|
|
|
|
|
|
|
|
|
|
|
|
|
|
|
|
|
ResMan, LLC (3) |
|
First-lien loan ($20,648 par, due 10/2024) |
|
10/3/2019 |
|
|
L + 8.00 |
% |
|
|
9.94 |
% |
|
|
20,208 |
|
|
|
20,303 |
|
|
|
1.8 |
% |
|
Retail and consumer products |
|
|
|
|
|
|
|
|
|
|
|
|
|
|
|
|
|
|
|
|
|
|
|
|
|
99 Cents Only Stores LLC (3) |
|
ABL FILO term loan ($32,500 par, due 4/2021) |
|
9/6/2017 |
|
|
L + 7.75 |
% |
|
|
9.64 |
% |
|
|
32,303 |
|
|
|
32,581 |
|
|
|
2.9 |
% |
|
American Achievement, Corp. (3)(5) |
|
First-lien loan ($22,619 par, due 9/2022) |
|
9/30/2015 |
|
|
L + 8.25 |
% |
|
|
9.95 |
% |
|
|
22,540 |
|
|
|
22,167 |
|
|
|
2.0 |
% |
|
Forever 21, Inc. (3) |
|
ABL DIP term loan ($50,000 par, due 7/2020) |
|
10/2/2019 |
|
|
L + 12.00 |
% |
|
|
13.81 |
% |
|
|
48,970 |
|
|
|
48,500 |
|
|
|
4.3 |
% |
|
J.C. Penney Company, Inc. (4)(11) |
|
First-lien loan ($6,201 par, due 6/2023)(3) |
|
6/5/2019 |
|
|
L + 4.25 |
% |
|
|
6.16 |
% |
|
|
5,358 |
|
|
|
5,451 |
|
|
|
0.5 |
% |
|
|
|
Second-lien secured note ($11,559 par, due 7/2023) |
|
6/5/2019 |
|
|
5.88 |
% |
|
|
5.88 |
% |
|
|
9,761 |
|
|
|
9,911 |
|
|
|
0.9 |
% |
|
Maurices, Inc. (3)(5) |
|
ABL FILO term loan ($27,778 par, due 5/2024) |
|
5/6/2019 |
|
|
L + 6.50 |
% |
|
|
8.21 |
% |
|
|
27,014 |
|
|
|
28,958 |
|
|
|
2.6 |
% |
|
Moran Foods, LLC (3) |
|
ABL FILO term loan ($39,138 par, due 12/2021) |
|
6/21/2019 |
|
|
L + 6.75 |
% |
|
|
8.69 |
% |
|
|
38,750 |
|
|
|
39,138 |
|
|
|
3.5 |
% |
|
Neiman Marcus Group Ltd LLC (3) |
|
ABL FILO term loan ($72,000 par, due 7/2021) |
|
9/11/2019 |
|
|
L + 6.00 |
% |
|
|
7.89 |
% |
|
|
71,086 |
|
|
|
71,100 |
|
|
|
6.4 |
% |
|
|
|
First-lien loan ($996 par, due 10/2023) (11) |
|
9/12/2019 |
|
|
L + 6.00 |
% |
|
|
7.71 |
% |
|
|
799 |
|
|
|
819 |
|
|
|
0.1 |
% |
|
Transform SR Holdings, LLC (3) |
|
ABL FILO term loan ($75,000 par, due 2/2024) |
|
2/11/2019 |
|
|
L + 7.25 |
% |
|
|
9.18 |
% |
|
|
74,359 |
|
|
|
75,750 |
|
|
|
6.8 |
% |
|
|
|
|
|
|
|
|
|
|
|
|
|
|
|
|
330,940 |
|
|
|
334,375 |
|
|
|
30.0 |
% |
|
Transportation |
|
|
|
|
|
|
|
|
|
|
|
|
|
|
|
|
|
|
|
|
|
|
|
|
|
Ferrellgas, L.P. (3)(4)(5) |
|
First-lien loan ($85,159 par, due 5/2023) |
|
5/4/2018 |
|
|
L + 5.75 |
% |
|
|
7.45 |
% |
|
|
83,994 |
|
|
|
90,053 |
|
|
|
8.0 |
% |
|
Total Debt Investments |
|
|
|
|
|
|
|
|
|
|
|
|
|
|
2,150,478 |
|
|
|
2,182,815 |
|
|
|
195.0 |
% |
|
|
|
|
|
|
|
|
|
|
|
|
|
|
|
|
|
|
|
|
|
|
|
|
|
|
|
Equity and Other Investments |
|
|
|
|
|
|
|
|
|
|
|
|
|
|
|
|
|
|
|
|
|
|
|
|
|
Beverage, food and tobacco |
|
|
|
|
|
|
|
|
|
|
|
|
|
|
|
|
|
|
|
|
|
|
|
|
|
AFS Technologies, Inc. (6)(13) |
|
Preferred Units (4,441,090 units) |
|
10/16/2018 |
|
|
|
|
|
|
|
|
|
|
4,441 |
|
|
|
4,463 |
|
|
|
0.4 |
% |
|
Business Services |
|
|
|
|
|
|
|
|
|
|
|
|
|
|
|
|
|
|
|
|
|
|
|
|
|
Motus, LLC (13) |
|
Class A Units (1,262 units) |
|
1/17/2018 |
|
|
|
|
|
|
|
|
|
|
1,262 |
|
|
|
2,738 |
|
|
|
0.2 |
% |
F-8
|
|
Class B Units (517,020 units) |
|
1/17/2018 |
|
|
|
|
|
|
|
|
|
|
— |
|
|
|
— |
|
|
|
0.0 |
% |
|
|
Nintex Global, Ltd. (13) |
|
Class A Shares (1,197 shares) |
|
3/30/2018 |
|
|
|
|
|
|
|
|
|
|
1,197 |
|
|
|
1,939 |
|
|
|
0.2 |
% |
|
|
|
Class B Shares (398,557 shares) |
|
3/30/2018 |
|
|
|
|
|
|
|
|
|
|
12 |
|
|
|
20 |
|
|
|
0.0 |
% |
|
|
|
|
|
|
|
|
|
|
|
|
|
|
|
|
2,471 |
|
|
|
4,697 |
|
|
|
0.4 |
% |
|
Chemicals |
|
|
|
|
|
|
|
|
|
|
|
|
|
|
|
|
|
|
|
|
|
|
|
|
|
Vertellus Specialties, Inc. (13)(14) |
|
Common Units (3,386,630 units) |
|
10/31/2016 |
|
|
|
|
|
|
|
|
|
|
4,575 |
|
|
|
3,614 |
|
|
|
0.3 |
% |
|
Financial services |
|
|
|
|
|
|
|
|
|
|
|
|
|
|
|
|
|
|
|
|
|
|
|
|
|
AvidXchange, Inc. (14) |
|
Preferred Shares (293,232 shares) |
|
10/1/2019 |
|
|
|
|
|
|
|
|
|
|
14,423 |
|
|
|
14,423 |
|
|
|
1.3 |
% |
|
Oxford Square Capital Corp. (4)(12) |
|
Common Shares (1,059 shares) |
|
8/5/2015 |
|
|
|
|
|
|
|
|
|
|
7 |
|
|
|
6 |
|
|
|
0.0 |
% |
|
Swift Gift, Ltd. (13) |
|
Common Shares (35,000 shares) |
|
7/31/2017 |
|
|
|
|
|
|
|
|
|
|
3,500 |
|
|
|
10,255 |
|
|
|
0.9 |
% |
|
|
|
|
|
|
|
|
|
|
|
|
|
|
|
|
17,930 |
|
|
|
24,684 |
|
|
|
2.2 |
% |
|
Healthcare |
|
|
|
|
|
|
|
|
|
|
|
|
|
|
|
|
|
|
|
|
|
|
|
|
|
Caris Life Sciences, Ltd. (13) |
|
633,376 Warrants |
|
9/21/2018 |
|
|
|
|
|
|
|
|
|
|
192 |
|
|
|
192 |
|
|
|
0.0 |
% |
|
Quantros, Inc. (13)(14) |
|
4,685,068 Warrants |
|
10/7/2019 |
|
|
|
|
|
|
|
|
|
|
139 |
|
|
|
139 |
|
|
|
0.0 |
% |
|
Valant Medical Solutions, Inc. (13)(14)(15) |
|
954,478 Warrants |
|
4/8/2019 |
|
|
|
|
|
|
|
|
|
|
281 |
|
|
|
281 |
|
|
|
0.0 |
% |
|
Vita Topco, Inc. (13)(14)(15) |
|
Common Shares (1,000 shares) |
|
2/11/2019 |
|
|
|
|
|
|
|
|
|
|
1,000 |
|
|
|
1,442 |
|
|
|
0.1 |
% |
|
|
|
|
|
|
|
|
|
|
|
|
|
|
|
|
1,612 |
|
|
|
2,054 |
|
|
|
0.1 |
% |
|
Hotel, gaming, and leisure |
|
|
|
|
|
|
|
|
|
|
|
|
|
|
|
|
|
|
|
|
|
|
|
|
|
IRGSE Holding Corp. (7)(13) |
|
Class A Units (29,440,171 units) (14) |
|
12/21/2018 |
|
|
|
|
|
|
|
|
|
|
21,813 |
|
|
|
589 |
|
|
|
0.1 |
% |
|
|
|
Common Shares (8,800,000 shares) |
|
12/21/2018 |
|
|
|
|
|
|
|
|
|
|
100 |
|
|
|
48 |
|
|
|
0.0 |
% |
|
|
|
|
|
|
|
|
|
|
|
|
|
|
|
|
21,913 |
|
|
|
637 |
|
|
|
0.1 |
% |
|
Human resource support services |
|
|
|
|
|
|
|
|
|
|
|
|
|
|
|
|
|
|
|
|
|
|
|
|
|
ClearCompany, LLC (13)(15) |
|
Class A Units (44,944 units) |
|
8/24/2018 |
|
|
|
|
|
|
|
|
|
|
2,014 |
|
|
|
2,255 |
|
|
|
0.2 |
% |
|
DaySmart Holdings, LLC. (13)(14)(15) |
|
Class A Units (125,810 units) |
|
10/1/2019 |
|
|
|
|
|
|
|
|
|
|
1,000 |
|
|
|
1,000 |
|
|
|
0.1 |
% |
|
|
|
|
|
|
|
|
|
|
|
|
|
|
|
|
3,014 |
|
|
|
3,255 |
|
|
|
0.3 |
% |
|
Insurance |
|
|
|
|
|
|
|
|
|
|
|
|
|
|
|
|
|
|
|
|
|
|
|
|
|
Riskonnect, Inc. (13) |
|
Common Shares Class A (1,020 units) |
|
6/30/2017 |
|
|
|
|
|
|
|
|
|
|
1,020 |
|
|
|
1,412 |
|
|
|
0.1 |
% |
|
|
|
Common Shares Class B (987,929 units) |
|
6/30/2017 |
|
|
|
|
|
|
|
|
|
|
10 |
|
|
|
14 |
|
|
|
0.0 |
% |
|
|
|
|
|
|
|
|
|
|
|
|
|
|
|
|
1,030 |
|
|
|
1,426 |
|
|
|
0.1 |
% |
|
Internet Services |
|
|
|
|
|
|
|
|
|
|
|
|
|
|
|
|
|
|
|
|
|
|
|
|
|
Lucidworks, Inc. (13)(14) |
|
Series F Preferred Shares (199,054 shares) |
|
8/2/2019 |
|
|
|
|
|
|
|
|
|
|
800 |
|
|
|
800 |
|
|
|
0.1 |
% |
|
Marketing services |
|
|
|
|
|
|
|
|
|
|
|
|
|
|
|
|
|
|
|
|
|
|
|
|
|
Validity, Inc. (13) |
|
Series A Preferred Shares (3,840,000 shares) |
|
5/31/2018 |
|
|
|
|
|
|
|
|
|
|
3,840 |
|
|
|
12,379 |
|
|
|
1.1 |
% |
|
Oil, gas and consumable fuels |
|
|
|
|
|
|
|
|
|
|
|
|
|
|
|
|
|
|
|
|
|
|
|
|
|
Mississippi Resources, LLC (7)(13) |
|
Class A-0 Member Units (1,000 units) (14) |
|
12/12/2019 |
|
|
|
|
|
|
|
|
|
|
6,693 |
|
|
|
5,104 |
|
|
|
0.5 |
% |
|
|
|
Class A-1 Member Units (1,360 units) |
|
5/3/2017 |
|
|
|
|
|
|
|
|
|
|
10,366 |
|
|
— |
|
|
|
0.0 |
% |
|
|
|
|
Class A-2 Member Units (933 units) |
|
6/4/2014 |
|
|
|
|
|
|
|
|
|
|
8,874 |
|
|
— |
|
|
|
0.0 |
% |
|
|
|
|
|
|
|
|
|
|
|
|
|
|
|
|
|
25,933 |
|
|
|
5,104 |
|
|
|
0.5 |
% |
|
Total Equity and Other Investments |
|
|
|
|
|
|
|
|
|
|
|
|
|
|
87,559 |
|
|
|
63,113 |
|
|
|
5.6 |
% |
|
Total Investments |
|
|
|
|
|
|
|
|
|
|
|
|
|
$ |
2,238,037 |
|
|
$ |
2,245,928 |
|
|
|
200.6 |
% |
F-9
|
|
|
Interest Rate Swaps as of December 31, 2019 |
|
|||||||||||||||||||||||
|
|
|
Company Receives |
|
|
Company Pays |
|
|
Maturity Date |
|
Notional Amount |
|
|
Fair Market Value |
|
|
Upfront Payments / Receipts |
|
|
Change in Unrealized Gains / (Losses) |
|
||||||
|
Interest rate swap (a) |
|
L |
|
|
1.97% |
|
|
6/25/2020 |
|
$ |
91,500 |
|
|
$ |
(75 |
) |
|
$ |
— |
|
|
$ |
(75 |
) |
||
|
Interest rate swap (a) |
|
L |
|
|
1.47% |
|
|
7/30/2021 |
|
|
11,700 |
|
|
|
38 |
|
|
|
— |
|
|
|
38 |
|
||
|
Interest rate swap (a) |
|
L |
|
|
1.36% |
|
|
7/29/2022 |
|
|
3,200 |
|
|
|
24 |
|
|
|
— |
|
|
|
24 |
|
||
|
Interest rate swap (a) |
|
4.50% |
|
|
L + 2.37% |
|
|
8/1/2022 |
|
|
115,000 |
|
|
|
1,221 |
|
|
|
— |
|
|
|
3,098 |
|
||
|
Interest rate swap (a) |
|
4.50% |
|
|
L + 1.59% |
|
|
8/1/2022 |
|
|
50,000 |
|
|
|
1,533 |
|
|
|
— |
|
|
|
994 |
|
||
|
Interest rate swap (a) |
|
4.50% |
|
|
L + 1.60% |
|
|
8/1/2022 |
|
|
7,500 |
|
|
|
228 |
|
|
|
— |
|
|
|
150 |
|
||
|
Interest rate swap (a) |
|
4.50% |
|
|
L + 1.99% |
|
|
1/22/2023 |
|
|
150,000 |
|
|
|
3,562 |
|
|
|
— |
|
|
|
4,100 |
|
||
|
Interest rate swap (a)(c) |
|
3.88% |
|
|
L + 2.25% |
|
|
11/1/2024 |
|
|
300,000 |
|
|
|
(1,787 |
) |
|
|
— |
|
|
|
— |
|
||
|
Interest rate swap (a)(b) |
|
L |
|
|
1.72% |
|
|
1/10/2020 |
|
|
— |
|
|
|
— |
|
|
|
— |
|
|
|
(378 |
) |
||
|
Interest rate swap (a)(b) |
|
4.50% |
|
|
L + 2.86% |
|
|
12/15/2019 |
|
|
— |
|
|
|
— |
|
|
|
— |
|
|
|
1,285 |
|
||
|
Interest rate swap (a)(b) |
|
L |
|
|
2.66% |
|
|
6/27/2019 |
|
|
— |
|
|
|
— |
|
|
|
— |
|
|
|
(42 |
) |
||
|
Cash collateral |
|
|
|
|
|
|
|
|
|
|
|
|
— |
|
|
|
(3,737 |
) |
|
|
— |
|
|
|
— |
|
|
Total |
|
|
|
|
|
|
|
|
|
|
|
$ |
728,900 |
|
|
$ |
1,007 |
|
|
$ |
— |
|
|
$ |
9,194 |
|
|
|
(a) |
Contains a variable rate structure. Bears interest at a rate determined by three-month LIBOR. |
|
|
(b) |
Interest rate swap was terminated or matured in 2019. |
|
|
(c) |
Instrument is used in a hedge accounting relationship. The associated change in fair value is recorded along with the change in fair value of the hedged item within interest expense. |
|
(1) |
Certain portfolio company investments are subject to contractual restrictions on sales. |
|
(2) |
The amortized cost represents the original cost adjusted for the amortization of discounts and premiums, as applicable, on debt investments using the effective interest method. |
|
(3) |
Investment contains a variable rate structure, subject to an interest rate floor. Variable rate investments bear interest at a rate that may be determined by reference to either London Interbank Offered Rate (“LIBOR” or “L”) (which can include one-, two-, three- or six-month LIBOR), Euro Interbank Offer Rate (“Euribor” or “E”) (which can include one-, two-, three-, or six-month Euribor), Canadian Dollar Offered Rate (“CDOR” or “C”), Bank Bill Swap Bid Rate (“BBSY” or “B”) or an alternate base rate (which can include the Federal Funds Effective Rate, the Toronto-Dominion Bank rate, or the Prime Rate or “P”), at the borrower’s option, which reset periodically based on the terms of the credit agreement. For investments with multiple interest rate contracts, the interest rate shown is the weighted average interest rate in effect at December 31, 2019. |
|
(4) |
This portfolio company is not a qualifying asset under Section 55(a) of the Investment Company Act of 1940, as amended (the “1940 Act”). Under the 1940 Act, the Company may not acquire any non-qualifying asset unless, at the time such acquisition is made, qualifying assets represent at least 70% of total assets. Non-qualifying assets represented 18.5% of total assets as of December 31, 2019. |
|
(5) |
In addition to the interest earned based on the stated interest rate of this investment, which is the amount reflected in this schedule, the Company may be entitled to receive additional interest as a result of an arrangement with other members in the syndicate to the extent an investment has been allocated to “first out” and “last out” tranches, whereby the “first out” tranche will have priority as to the “last out” tranche with respect to payments of principal, interest and any amounts due thereunder and the Company hold the “last out” tranche. |
|
(6) |
Under the 1940 Act, the Company is deemed to be an “Affiliated Person” of, as defined in the 1940 Act, this portfolio company, as the Company owns more than 5% of the portfolio company’s outstanding voting securities. Transactions during the year ended December 31, 2019 in which the Company was an Affiliated Person of the portfolio company are as follows: |
Non-controlled, Affiliated Investments during the year ended December 31, 2019
|
Company |
|
Fair Value at December 31, 2018 |
|
|
Gross Additions (a) |
|
|
Gross Reductions (b) |
|
|
Net Change In Unrealized Gain/(Loss) |
|
|
Realized Gain/(Losses) |
|
|
Transfers |
|
|
Fair Value at December 31, 2019 |
|
|
Other Income |
|
|
Interest Income |
|
|||||||||
|
AFS Technologies, Inc. |
|
$ |
45,342 |
|
|
$ |
4,845 |
|
|
$ |
(1,175 |
) |
|
$ |
1,124 |
|
|
$ |
— |
|
|
$ |
— |
|
|
$ |
50,136 |
|
|
$ |
76 |
|
|
$ |
5,207 |
|
|
Validity, Inc. |
|
|
38,590 |
|
|
|
1,489 |
|
|
|
(234 |
) |
|
|
148 |
|
|
— |
|
|
|
(39,993 |
) |
|
— |
|
|
|
12 |
|
|
|
1,163 |
|
||
|
Total |
|
$ |
83,932 |
|
|
$ |
6,334 |
|
|
$ |
(1,409 |
) |
|
$ |
1,272 |
|
|
$ |
— |
|
|
$ |
(39,993 |
) |
|
$ |
50,136 |
|
|
$ |
88 |
|
|
$ |
6,370 |
|
F-10
|
|
(a) |
Gross additions include increases in the cost basis of investments resulting from new investments, payment-in-kind interest or dividends, the amortization of any unearned income or discounts on debt investments, as applicable. |
|
|
(b) |
Gross reductions include decreases in the cost basis of investments resulting from principal collections related to investment repayments or sales, and the amortization of any premiums on debt investments, as applicable. When an investment is placed on non-accrual status, any cash flows received by the Company are applied to the outstanding principal balance. |
|
(7) |
Under the 1940 Act, the Company is deemed to be both an “Affiliated Person” of and “Control,” as such terms are defined in the 1940 Act, this portfolio company, as the Company owns more than 25% of the portfolio company’s outstanding voting securities or has the power to exercise control over management or policies of such portfolio company (including through a management agreement). Transactions during the year ended December 31, 2019 in which the issuer was an Affiliated Person of and was deemed to Control a portfolio company are as follows: |
Controlled, Affiliated Investments during the year ended December 31, 2019
|
Company |
|
Fair Value at December 31, 2018 |
|
|
Gross Additions (a) |
|
|
Gross Reductions (b) |
|
|
Net Change In Unrealized Gain/(Loss) |
|
|
Realized Gain/(Losses) |
|
|
Transfers |
|
|
Fair Value at December 31, 2019 |
|
|
Other Income |
|
|
Interest Income |
|
|||||||||
|
AFS Technologies, Inc. |
|
$ |
— |
|
|
$ |
— |
|
|
$ |
— |
|
|
$ |
— |
|
|
$ |
570 |
|
|
$ |
— |
|
|
$ |
— |
|
|
$ |
— |
|
|
$ |
— |
|
|
IRGSE Holding Corp. |
|
|
34,527 |
|
|
|
8,279 |
|
|
|
(1,750 |
) |
|
|
(6,244 |
) |
|
— |
|
|
— |
|
|
|
34,812 |
|
|
|
11 |
|
|
|
3,963 |
|
||
|
Mississippi Resources, LLC |
|
|
21,978 |
|
|
|
1,427 |
|
|
— |
|
|
|
(6,137 |
) |
|
|
(4,164 |
) |
|
— |
|
|
|
13,104 |
|
|
— |
|
|
|
1,995 |
|
|||
|
Total |
|
$ |
56,505 |
|
|
$ |
9,706 |
|
|
$ |
(1,750 |
) |
|
$ |
(12,381 |
) |
|
$ |
(3,594 |
) |
|
$ |
— |
|
|
$ |
47,916 |
|
|
$ |
11 |
|
|
$ |
5,958 |
|
|
|
(a) |
Gross additions include increases in the cost basis of investments resulting from new investments, payment-in-kind interest or dividends, the amortization of any unearned income or discounts on debt investments, as applicable. |
|
|
(b) |
Gross reductions include decreases in the cost basis of investments resulting from principal collections related to investment repayments or sales, and the amortization of any premiums on debt investments, as applicable. When an investment is placed on non-accrual status, any cash flows received by the Company are applied to the outstanding principal balance. |
|
(8) |
As of December 31, 2019, the estimated cost basis of investments for U.S. federal tax purposes was $2,230,116, resulting in estimated gross unrealized gains and losses of $87,386 and $78,478, respectively. |
|
(9) |
These investments contain a fixed rate structure. The Company entered into an interest rate swap agreement to swap to a floating rate. Refer to Note 5 for further information related to the Company’s interest rate swaps on investments. |
|
(10) |
In accordance with Financial Accounting Standards Board Accounting Standards Codification 820, Fair Value Measurements (“ASC 820”), unless otherwise indicated, the fair values of all investments were determined using significant unobservable inputs and are considered Level 3 investments. See Note 6 for further information related to investments at fair value. |
|
(11) |
This investment is valued using observable inputs and is considered a Level 2 investment. See Note 6 for further information related to investments at fair value. |
|
(12) |
This investment is valued using observable inputs and is considered a Level 1 investment. See Note 6 for further information related to investments at fair value. |
|
(13) |
This equity investment is non-income producing. |
|
(14) |
All or a portion of this security was acquired in transaction exempt from registration under the Securities Act of 1933, and may be deemed to be “restricted securities” under the Securities Act. As of December 31, 2019, the aggregate fair value of these securities is $23,986, or 2.1% of the Company’s net assets. |
|
(15) |
Ownership of equity investments may occur through a holding company or partnership. |
The accompanying notes are an integral part of these consolidated financial statements.
F-11
Consolidated Schedule of Investments as of December 31, 2018
(Amounts in thousands, except share amounts)
|
Company (1) |
|
Investment |
|
Initial Acquisition Date |
|
Reference Rate and Spread |
|
|
Interest Rate |
|
|
Amortized Cost (2)(8) |
|
|
Fair Value (10) |
|
|
Percentage of Net Assets |
|
|||||
|
Debt Investments |
|
|
|
|
|
|
|
|
|
|
|
|
|
|
|
|
|
|
|
|
|
|
|
|
|
Beverage, food and tobacco |
|
|
|
|
|
|
|
|
|
|
|
|
|
|
|
|
|
|
|
|
|
|
|
|
|
AFS Technologies, Inc. (3)(5)(6) |
|
First-lien loan ($42,234 par, due 10/2023) |
|
10/16/2018 |
|
|
L + 6.25 |
% |
|
|
8.77 |
% |
|
$ |
41,611 |
|
|
$ |
41,179 |
|
|
|
3.9 |
% |
|
Business services |
|
|
|
|
|
|
|
|
|
|
|
|
|
|
|
|
|
|
|
|
|
|
|
|
|
Acceo Solutions, Inc. (3)(4)(5) |
|
First-lien loan (CAD 64,675 par, due 7/2023) |
|
7/6/2018 |
|
|
C + 5.25 |
% |
|
|
7.41 |
% |
|
|
48,275 |
|
|
46,051 (CAD 62,896) |
|
|
|
4.3 |
% |
|
|
Integration Appliance, Inc. (3) |
|
First-lien loan ($52,381 par, due 8/2023) |
|
8/13/2018 |
|
|
L + 7.25 |
% |
|
|
9.60 |
% |
|
|
51,608 |
|
|
|
51,281 |
|
|
|
4.8 |
% |
|
Jive Software, Inc. (3)(5) |
|
First-lien loan ($52,110 par, due 6/2022) |
|
6/12/2017 |
|
|
L + 9.25 |
% |
|
|
11.77 |
% |
|
|
50,656 |
|
|
|
54,194 |
|
|
|
5.1 |
% |
|
Motus, LLC (3) |
|
First-lien loan ($68,880 par, due 1/2024) |
|
1/17/2018 |
|
|
L + 6.75 |
% |
|
|
9.22 |
% |
|
|
67,262 |
|
|
|
69,624 |
|
|
|
6.5 |
% |
|
Nintex Global, Ltd. (3)(5) |
|
First-lien loan ($71,975 par, due 4/2024) |
|
3/30/2018 |
|
|
L + 6.75 |
% |
|
|
9.28 |
% |
|
|
70,382 |
|
|
|
70,176 |
|
|
|
6.6 |
% |
|
Sovos Compliance, LLC (3) |
|
First-lien loan ($36,453 par, due 3/2022) |
|
7/1/2016 |
|
|
L + 6.00 |
% |
|
|
8.52 |
% |
|
|
36,032 |
|
|
|
36,453 |
|
|
|
3.4 |
% |
|
|
|
|
|
|
|
|
|
|
|
|
|
|
|
|
324,215 |
|
|
|
327,779 |
|
|
|
30.7 |
% |
|
Chemicals |
|
|
|
|
|
|
|
|
|
|
|
|
|
|
|
|
|
|
|
|
|
|
|
|
|
Vertellus Specialties, Inc. (3) |
|
First-lien loan ($4,967 par, due 1/2019) |
|
10/31/2016 |
|
|
L + 9.00 |
% |
|
|
11.42 |
% |
|
|
4,967 |
|
|
|
4,967 |
|
|
|
0.5 |
% |
|
|
|
Second-lien loan ($3,341 par, due 10/2021) |
|
10/31/2016 |
|
|
L + 12.00 |
% |
|
|
14.42 |
% |
|
|
3,341 |
|
|
|
3,350 |
|
|
|
0.3 |
% |
|
|
|
|
|
|
|
|
|
|
|
|
|
|
|
|
8,308 |
|
|
|
8,317 |
|
|
|
0.8 |
% |
|
Education |
|
|
|
|
|
|
|
|
|
|
|
|
|
|
|
|
|
|
|
|
|
|
|
|
|
Curriculum Associates, LLC (3)(5) |
|
First-lien loan ($49,875 par, due 2/2024) |
|
2/28/2018 |
|
|
L + 6.00 |
% |
|
|
8.52 |
% |
|
|
48,497 |
|
|
|
50,374 |
|
|
|
4.7 |
% |
|
Frontline Technologies Group, LLC (3) |
|
First-lien loan ($47,225 par, due 9/2023) |
|
9/18/2017 |
|
|
L + 6.50 |
% |
|
|
9.02 |
% |
|
|
46,713 |
|
|
|
46,801 |
|
|
|
4.4 |
% |
|
Illuminate Education, Inc.(3)(5) |
|
First-lien loan ($64,675 par, due 8/2022) |
|
8/25/2017 |
|
|
L + 7.25 |
% |
|
|
9.78 |
% |
|
|
63,611 |
|
|
|
63,544 |
|
|
|
6.0 |
% |
|
|
|
|
|
|
|
|
|
|
|
|
|
|
|
|
158,821 |
|
|
|
160,719 |
|
|
|
15.1 |
% |
|
Financial services |
|
|
|
|
|
|
|
|
|
|
|
|
|
|
|
|
|
|
|
|
|
|
|
|
|
AppStar Financial, LLC (3) |
|
First-lien loan ($18,506 par, due 8/2020) |
|
8/18/2015 |
|
|
L + 7.50 |
% |
|
|
10.02 |
% |
|
|
18,333 |
|
|
|
18,609 |
|
|
|
1.8 |
% |
|
AvidXchange, Inc. (3) |
|
First-lien loan ($54,449 par, due 8/2020) |
|
8/7/2015 |
|
|
L + 9.50 |
% |
|
|
12.06 |
% |
|
|
54,080 |
|
|
|
54,994 |
|
|
|
5.2 |
% |
|
G Treasury SS, LLC (3) |
|
First-lien loan ($30,515 par, due 4/2022) |
|
4/9/2018 |
|
|
L + 9.25 |
% |
|
11.78% (incl. 3.00% PIK) |
|
|
|
29,914 |
|
|
|
29,765 |
|
|
|
2.8 |
% |
|
|
Government Brands, LLC (3) |
|
First-lien loan ($45,870 par, due 3/2023) |
|
3/15/2018 |
|
|
L + 9.25 |
% |
|
11.81% (incl. 2.50% PIK) |
|
|
|
45,001 |
|
|
|
44,853 |
|
|
|
4.2 |
% |
|
|
PayLease, LLC (3) |
|
First-lien loan ($55,958 par, due 7/2022) |
|
7/28/2017 |
|
|
L + 7.00 |
% |
|
|
9.52 |
% |
|
|
55,065 |
|
|
|
55,810 |
|
|
|
5.2 |
% |
|
PaySimple, Inc. (3)(5) |
|
First-lien loan ($59,395 par, due 3/2022) |
|
4/17/2018 |
|
|
L + 8.25 |
% |
|
10.81% (incl. 1.75% PIK) |
|
|
|
59,121 |
|
|
|
58,652 |
|
|
|
5.5 |
% |
|
|
PrimeRevenue, Inc. (3) |
|
First-lien loan ($20,000 par, due 12/2023) |
|
12/31/2018 |
|
|
L + 8.50 |
% |
|
11.02% (incl. 5.50% PIK) |
|
|
|
19,672 |
|
|
|
19,672 |
|
|
|
1.9 |
% |
|
|
Swift Gift, Ltd. (3)(5) |
|
First-lien loan ($28,875 par, due 1/2022) |
|
7/31/2017 |
|
|
L + 6.50 |
% |
|
|
9.06 |
% |
|
|
28,335 |
|
|
|
29,958 |
|
|
|
2.8 |
% |
|
|
|
|
|
|
|
|
|
|
|
|
|
|
|
|
309,521 |
|
|
|
312,313 |
|
|
|
29.4 |
% |
|
Healthcare |
|
|
|
|
|
|
|
|
|
|
|
|
|
|
|
|
|
|
|
|
|
|
|
|
|
Caris Life Sciences, Ltd. |
|
First-lien loan ($2,500 par, due 9/2023) |
|
9/21/2018 |
|
|
11.30 |
% |
|
|
11.30 |
% |
|
|
2,305 |
|
|
|
2,206 |
|
|
|
0.2 |
% |
F-12
|
|
Convertible note ($2,500 par, due 9/2023) |
|
9/21/2018 |
|
|
8.00 |
% |
|
|
8.00 |
% |
|
|
2,500 |
|
|
|
2,481 |
|
|
|
0.2 |
% |
|
|
Integrated Practice Solutions, Inc. (3)(5) |
|
First-lien loan ($36,501 par, due 6/2022) |
|
6/30/2017 |
|
|
L + 8.00 |
% |
|
|
10.52 |
% |
|
|
35,696 |
|
|
|
36,136 |
|
|
|
3.4 |
% |
|
MedeAnalytics, Inc. (3)(5) |
|
First-lien loan ($41,884 par, due 9/2020) |
|
9/30/2015 |
|
|
L + 7.50 |
% |
|
|
10.02 |
% |
|
|
41,384 |
|
|
|
41,884 |
|
|
|
3.9 |
% |
|
InterOperability Bidco, Inc. (3)(5) |
|
First-lien loan ($29,925 par, due 10/2023) |
|
10/30/2018 |
|
|
L + 7.00 |
% |
|
|
9.52 |
% |
|
|
28,729 |
|
|
|
28,578 |
|
|
|
2.7 |
% |
|
Quantros, Inc. (3)(5) |
|
First-lien loan ($27,965 par, due 9/2019) |
|
2/29/2016 |
|
|
L + 7.75 |
% |
|
|
10.55 |
% |
|
|
26,650 |
|
|
|
27,475 |
|
|
|
2.6 |
% |
|
|
|
|
|
|
|
|
|
|
|
|
|
|
|
|
137,264 |
|
|
|
138,760 |
|
|
|
13.0 |
% |
|
Hotel, gaming, and leisure |
|
|
|
|
|
|
|
|
|
|
|
|
|
|
|
|
|
|
|
|
|
|
|
|
|
IRGSE Holding Corp. (3)(7) |
|
First-lien loan ($30,042 par, due 9/2019) |
|
9/29/2015 |
|
|
L + 9.50 |
% |
|
12.30% (incl. 5.00% PIK) |
|
|
|
28,187 |
|
|
|
29,959 |
|
|
|
2.8 |
% |
|
|
Human resource support services |
|
|
|
|
|
|
|
|
|
|
|
|
|
|
|
|
|
|
|
|
|
|
|
|
|
ClearCompany, LLC (3) |
|
First-lien loan ($17,154 par, due 7/2023) |
|
7/23/2018 |
|
|
L + 8.50 |
% |
|
11.21% (incl. 2.50% PIK) |
|
|
|
16,885 |
|
|
|
16,751 |
|
|
|
1.6 |
% |
|
|
PageUp People Limited. (3)(4) |
|
First-lien loan (AUD 46,848 par, due 12/2022) |
|
1/11/2018 |
|
|
B + 7.25 |
% |
|
9.17% (incl. 2.25% PIK) |
|
|
|
36,234 |
|
|
32,486 (AUD 46,145) |
|
|
|
3.1 |
% |
||
|
|
|
First-lien revolving loan (AUD 2,000 par, due 12/2022) |
|
1/11/2018 |
|
|
B + 7.25 |
% |
|
|
9.23 |
% |
|
|
1,429 |
|
|
1,355 (AUD 1,925) |
|
|
|
0.1 |
% |
|
|
|
|
|
|
|
|
|
|
|
|
|
|
|
|
|
54,548 |
|
|
|
50,592 |
|
|
|
4.8 |
% |
|
Insurance |
|
|
|
|
|
|
|
|
|
|
|
|
|
|
|
|
|
|
|
|
|
|
|
|
|
Insurity, Inc. (3)(5) |
|
First-lien loan ($61,665 par, due 10/2020) |
|
10/31/2014 |
|
|
L + 6.75 |
% |
|
|
9.47 |
% |
|
|
61,384 |
|
|
|
62,127 |
|
|
|
5.8 |
% |
|
Riskonnect, Inc. (3)(5) |
|
First-lien loan ($50,000 par, due 10/2023) |
|
6/30/2017 |
|
|
L + 7.75 |
% |
|
|
10.56 |
% |
|
|
49,432 |
|
|
|
49,000 |
|
|
|
4.6 |
% |
|
|
|
|
|
|
|
|
|
|
|
|
|
|
|
|
110,816 |
|
|
|
111,127 |
|
|
|
10.4 |
% |
|
Internet services |
|
|
|
|
|
|
|
|
|
|
|
|
|
|
|
|
|
|
|
|
|
|
|
|
|
Higher Logic, LLC (3)(5) |
|
First-lien loan ($37,810 par, due 1/2022) |
|
6/18/2018 |
|
|
L + 6.00 |
% |
|
|
8.81 |
% |
|
|
37,236 |
|
|
|
36,959 |
|
|
|
3.5 |
% |
|
Lithium Technologies, LLC (3) |
|
First-lien loan ($54,700 par, due 10/2022) |
|
10/3/2017 |
|
|
L + 8.00 |
% |
|
|
10.39 |
% |
|
|
53,639 |
|
|
|
53,967 |
|
|
|
5.1 |
% |
|
|
|
|
|
|
|
|
|
|
|
|
|
|
|
|
90,875 |
|
|
|
90,926 |
|
|
|
8.6 |
% |
|
Manufacturing |
|
|
|
|
|
|
|
|
|
|
|
|
|
|
|
|
|
|
|
|
|
|
|
|
|
ScentAir Technologies, Inc. (3) |
|
First-lien loan ($19,986 par, due 12/2019) |
|
12/30/2014 |
|
|
L + 7.25 |
% |
|
|
9.77 |
% |
|
|
19,897 |
|
|
|
19,886 |
|
|
|
1.9 |
% |
|
|
|
First-lien revolving loan ($1,393 par, due 12/2019) |
|
12/30/2014 |
|
|
L + 7.25 |
% |
|
|
9.77 |
% |
|
|
1,385 |
|
|
|
1,382 |
|
|
|
0.1 |
% |
|
|
|
|
|
|
|
|
|
|
|
|
|
|
|
|
21,282 |
|
|
|
21,268 |
|
|
|
2.0 |
% |
|
Marketing services |
|
|
|
|
|
|
|
|
|
|
|
|
|
|
|
|
|
|
|
|
|
|
|
|
|
Validity, Inc. (3)(5)(6) |
|
First-lien loan ($35,550 par, due 5/2023) |
|
5/31/2018 |
|
|
L + 6.50 |
% |
|
|
9.25 |
% |
|
|
34,988 |
|
|
|
34,750 |
|
|
|
3.3 |
% |
|
Office products |
|
|
|
|
|
|
|
|
|
|
|
|
|
|
|
|
|
|
|
|
|
|
|
|
|
USR Parent Inc. (3)(5) |
|
ABL FILO term loan ($13,500 par, due 9/2022) |
|
9/12/2017 |
|
|
L + 7.75 |
% |
|
|
10.09 |
% |
|
|
13,251 |
|
|
|
13,331 |
|
|
|
1.3 |
% |
|
Oil, gas and consumable fuels |
|
|
|
|
|
|
|
|
|
|
|
|
|
|
|
|
|
|
|
|
|
|
|
|
|
MD America Energy, LLC (3) |
|
First-lien loan ($15,000 par, due 11/2023) |
|
11/14/2018 |
|
|
L + 7.75 |
% |
|
|
10.37 |
% |
|
|
14,530 |
|
|
|
14,325 |
|
|
|
1.3 |
% |
|
Mississippi Resources, LLC (3)(7) |
|
First-lien loan ($17,429 par, due 6/2020) |
|
6/29/2018 |
|
|
L + 9.00 |
% |
|
|
11.52 |
% |
|
|
17,429 |
|
|
|
17,080 |
|
|
|
1.6 |
% |
|
|
|
|
|
|
|
|
|
|
|
|
|
|
|
|
31,959 |
|
|
|
31,405 |
|
|
|
2.9 |
% |
|
Pharmaceuticals |
|
|
|
|
|
|
|
|
|
|
|
|
|
|
|
|
|
|
|
|
|
|
|
|
|
Ironwood Pharmaceuticals, Inc. (4)(5)(9) |
|
Secured note ($33,333 par, due 9/2026) |
|
1/5/2017 |
|
|
8.38 |
% |
|
|
8.38 |
% |
|
|
33,202 |
|
|
|
33,833 |
|
|
|
3.2 |
% |
|
Nektar Therapeutics (4)(5)(9) |
|
Secured note ($74,950 par, due 10/2020) |
|
10/5/2015 |
|
|
7.75 |
% |
|
|
7.75 |
% |
|
|
74,559 |
|
|
|
76,074 |
|
|
|
7.2 |
% |
|
|
|
|
|
|
|
|
|
|
|
|
|
|
|
|
107,761 |
|
|
|
109,907 |
|
|
|
10.4 |
% |
|
Retail and consumer products |
|
|
|
|
|
|
|
|
|
|
|
|
|
|
|
|
|
|
|
|
|
|
|
|
F-13
|
|
ABL FILO term loan ($32,500 par, due 4/2021) |
|
9/6/2017 |
|
|
L + 7.75 |
% |
|
|
10.49 |
% |
|
|
32,164 |
|
|
|
32,338 |
|
|
|
3.0 |
% |
|
|
American Achievement, Corp. (3)(5) |
|
First-lien loan ($22,403 par, due 9/2020) |
|
9/30/2015 |
|
|
L + 8.25 |
% |
|
|
10.60 |
% |
|
|
22,277 |
|
|
|
22,179 |
|
|
|
2.1 |
% |
|
|
|
Secured Promissory Note ($795 par, due 12/2020) |
|
12/19/2018 |
|
|
L + 8.25 |
% |
|
|
10.64 |
% |
|
|
787 |
|
|
|
787 |
|
|
|
0.1 |
% |
|
PayLess Inc. (3)(5) |
|
ABL FILO term loan ($14,063 par, due 8/2022) |
|
3/1/2018 |
|
|
L + 8.00 |
% |
|
|
10.38 |
% |
|
|
13,806 |
|
|
|
13,957 |
|
|
|
1.3 |
% |
|
Sears (3)(4)(11) |
|
First-lien ABL DIP loan ($25,394 par, due 10/2019) |
|
3/18/2016 |
|
|
L + 8.00 |
% |
|
|
10.42 |
% |
|
|
25,176 |
|
|
|
25,870 |
|
|
|
2.4 |
% |
|
|
|
|
|
|
|
|
|
|
|
|
|
|
|
|
94,210 |
|
|
|
95,131 |
|
|
|
8.9 |
% |
|
Transportation |
|
|
|
|
|
|
|
|
|
|
|
|
|
|
|
|
|
|
|
|
|
|
|
|
|
Ferrellgas, L.P. (3)(4)(5) |
|
First-lien loan ($82,500 par, due 5/2023) |
|
5/4/2018 |
|
|
L + 5.75 |
% |
|
|
8.10 |
% |
|
|
81,026 |
|
|
|
83,062 |
|
|
|
7.8 |
% |
|
|
|
|
|
|
|
|
|
|
|
|
|
|
|
|
|
|
|
|
|
|
|
|
|
|
|
Total Debt Investments |
|
|
|
|
|
|
|
|
|
|
|
|
|
|
1,648,643 |
|
|
|
1,660,525 |
|
|
|
156.1 |
% |
|
Equity and Other Investments |
|
|
|
|
|
|
|
|
|
|
|
|
|
|
|
|
|
|
|
|
|
|
|
|
|
Beverage, food and tobacco |
|
|
|
|
|
|
|
|
|
|
|
|
|
|
|
|
|
|
|
|
|
|
|
|
|
AFS Technologies, Inc. (6)(13)(14) |
|
Preferred Units (4,163,090 Units) |
|
10/16/2018 |
|
|
|
|
|
|
|
|
|
|
4,163 |
|
|
|
4,163 |
|
|
|
0.4 |
% |
|
Business Services |
|
|
|
|
|
|
|
|
|
|
|
|
|
|
|
|
|
|
|
|
|
|
|
|
|
Motus, LLC (13)(14) |
|
Class A Units (1,262 Units) |
|
1/17/2018 |
|
|
|
|
|
|
|
|
|
|
1,262 |
|
|
|
1,262 |
|
|
|
0.1 |
% |
|
|
|
Class B Units (517,020 Units) |
|
1/17/2018 |
|
|
|
|
|
|
|
|
|
|
— |
|
|
|
— |
|
|
|
0.0 |
% |
|
Nintex Global Limited (13)(14) |
|
Class A Shares (1,197 Shares) |
|
3/30/2018 |
|
|
|
|
|
|
|
|
|
|
1,197 |
|
|
|
1,197 |
|
|
|
0.1 |
% |
|
|
|
Class B Shares (398,557 Shares) |
|
3/30/2018 |
|
|
|
|
|
|
|
|
|
|
12 |
|
|
|
12 |
|
|
|
0.0 |
% |
|
|
|
|
|
|
|
|
|
|
|
|
|
|
|
|
2,471 |
|
|
|
2,471 |
|
|
|
0.2 |
% |
|
Chemicals |
|
|
|
|
|
|
|
|
|
|
|
|
|
|
|
|
|
|
|
|
|
|
|
|
|
Vertellus Specialties, Inc. (13) |
|
Common Units (2,672,990 units) |
|
10/31/2016 |
|
|
|
|
|
|
|
|
|
|
3,828 |
|
|
|
3,503 |
|
|
|
0.3 |
% |
|
Financial services |
|
|
|
|
|
|
|
|
|
|
|
|
|
|
|
|
|
|
|
|
|
|
|
|
|
AvidXchange, Inc. (13) |
|
Series E Preferred Equity (214,132 shares) |
|
8/7/2015 |
|
|
|
|
|
|
|
|
|
|
3,846 |
|
|
|
7,481 |
|
|
|
0.7 |
% |
|
Oxford Square Capital Corp. (4)(12) |
|
Common Shares (1,059 shares) |
|
8/5/2015 |
|
|
|
|
|
|
|
|
|
|
7 |
|
|
|
7 |
|
|
|
0.0 |
% |
|
Swift Gift Limited (13) |
|
Common Shares (35,000 shares) |
|
7/31/2017 |
|
|
|
|
|
|
|
|
|
|
3,500 |
|
|
|
7,998 |
|
|
|
0.8 |
% |
|
|
|
|
|
|
|
|
|
|
|
|
|
|
|
|
7,353 |
|
|
|
15,486 |
|
|
|
1.5 |
% |
|
Healthcare |
|
|
|
|
|
|
|
|
|
|
|
|
|
|
|
|
|
|
|
|
|
|
|
|
|
Caris Life Sciences, Ltd. (13)(14) |
|
Warrants |
|
9/21/2018 |
|
|
|
|
|
|
|
|
|
|
192 |
|
|
|
192 |
|
|
|
0.0 |
% |
|
SRS Parent Corp. (13) |
|
Common Shares Class A (1,980 shares) |
|
12/28/2012 |
|
|
|
|
|
|
|
|
|
|
1,980 |
|
|
|
1,064 |
|
|
|
0.1 |
% |
|
|
|
Common Shares Class B (2,953,020 shares) |
|
12/28/2012 |
|
|
|
|
|
|
|
|
|
|
20 |
|
|
|
11 |
|
|
|
0.0 |
% |
|
|
|
|
|
|
|
|
|
|
|
|
|
|
|
|
2,192 |
|
|
|
1,267 |
|
|
|
0.1 |
% |
|
Hotel, gaming, and leisure |
|
|
|
|
|
|
|
|
|
|
|
|
|
|
|
|
|
|
|
|
|
|
|
|
|
IRGSE Holding Corp. (7)(13) |
|
Class A Units (27,690,171 units) (14) |
|
12/21/2018 |
|
|
|
|
|
|
|
|
|
|
20,063 |
|
|
|
4,520 |
|
|
|
0.4 |
% |
|
|
|
Common Shares (8,800,000 shares) |
|
12/21/2018 |
|
|
|
|
|
|
|
|
|
|
100 |
|
|
|
48 |
|
|
|
0.0 |
% |
|
|
|
|
|
|
|
|
|
|
|
|
|
|
|
|
20,163 |
|
|
|
4,568 |
|
|
|
0.4 |
% |
|
Human resource support services |
|
|
|
|
|
|
|
|
|
|
|
|
|
|
|
|
|
|
|
|
|
|
|
|
|
ClearCompany, LLC (13)(14)(15) |
|
Class A Units (44,944 units) |
|
8/24/2018 |
|
|
|
|
|
|
|
|
|
|
2,014 |
|
|
|
2,014 |
|
|
|
0.2 |
% |
|
Insurance |
|
|
|
|
|
|
|
|
|
|
|
|
|
|
|
|
|
|
|
|
|
|
|
|
|
Riskonnect, Inc. (13)(14) |
|
Common Shares Class A (1,020 units) |
|
6/30/2017 |
|
|
|
|
|
|
|
|
|
|
1,020 |
|
|
|
1,020 |
|
|
|
0.1 |
% |
|
|
|
Common Shares Class B (987,929 units) |
|
6/30/2017 |
|
|
|
|
|
|
|
|
|
|
10 |
|
|
|
10 |
|
|
|
0.0 |
% |
F-14
|
|
|
|
|
|
|
|
|
|
|
|
|
|
|
1,030 |
|
|
|
1,030 |
|
|
|
0.1 |
% |
|
|
Marketing services |
|
|
|
|
|
|
|
|
|
|
|
|
|
|
|
|
|
|
|
|
|
|
|
|
|
Validity, Inc. (6)(13)(14) |
|
Series A Preferred Shares (3,840,000 shares) |
|
5/31/2018 |
|
|
|
|
|
|
|
|
|
|
3,840 |
|
|
|
3,840 |
|
|
|
0.4 |
% |
|
Oil, gas and consumable fuels |
|
|
|
|
|
|
|
|
|
|
|
|
|
|
|
|
|
|
|
|
|
|
|
|
|
Mississippi Resources, LLC (7)(13)(14) |
|
Class A-1 Member Units (1,360 units) |
|
5/3/2017 |
|
|
|
|
|
|
|
|
|
|
10,366 |
|
|
|
4,898 |
|
|
|
0.5 |
% |
|
|
|
Class A-2 Member Units (933 units) |
|
6/4/2014 |
|
|
|
|
|
|
|
|
|
|
8,874 |
|
|
— |
|
|
|
0.0 |
% |
|
|
Northern Oil and Gas, Inc. (12)(13) |
|
Common Shares (975,000 shares) |
|
5/15/2018 |
|
|
|
|
|
|
|
|
|
|
1,463 |
|
|
|
2,204 |
|
|
|
0.2 |
% |
|
|
|
|
|
|
|
|
|
|
|
|
|
|
|
|
20,703 |
|
|
|
7,102 |
|
|
|
0.7 |
% |
|
Total Equity and Other Investments |
|
|
|
|
|
|
|
|
|
|
|
|
|
|
67,757 |
|
|
|
45,444 |
|
|
|
4.3 |
% |
|
Total Investments |
|
|
|
|
|
|
|
|
|
|
|
|
|
$ |
1,716,400 |
|
|
$ |
1,705,969 |
|
|
|
160.4 |
% |
|
|
|
Interest Rate Swaps as of December 31, 2018 |
|
|||||||||||||||||||||||
|
|
|
Company Receives |
|
|
Company Pays |
|
|
Maturity Date |
|
Notional Amount |
|
|
Fair Market Value |
|
|
Upfront Payments / Receipts |
|
|
Change in Unrealized Gains / (Losses) |
|
||||||
|
Interest rate swap (b) |
|
L |
|
|
2.66% |
|
|
6/27/2019 |
|
$ |
91,500 |
|
|
$ |
42 |
|
|
$ |
— |
|
|
$ |
(438 |
) |
||
|
Interest rate swap (b) |
|
4.50% |
|
|
L + 2.86% |
|
|
12/15/2019 |
|
|
115,000 |
|
|
|
(1,285 |
) |
|
|
— |
|
|
|
(261 |
) |
||
|
Interest rate swap (a)(b) |
|
L |
|
|
1.72% |
|
|
1/10/2020 |
|
|
33,333 |
|
|
|
378 |
|
|
|
— |
|
|
|
86 |
|
||
|
Interest rate swap (b) |
|
4.50% |
|
|
L + 2.37% |
|
|
8/1/2022 |
|
|
115,000 |
|
|
|
(1,877 |
) |
|
|
— |
|
|
|
(1,167 |
) |
||
|
Interest rate swap (b) |
|
4.50% |
|
|
L + 1.59% |
|
|
8/1/2022 |
|
|
50,000 |
|
|
|
539 |
|
|
|
— |
|
|
|
539 |
|
||
|
Interest rate swap (b) |
|
4.50% |
|
|
L + 1.60% |
|
|
8/1/2022 |
|
|
7,500 |
|
|
|
78 |
|
|
|
— |
|
|
|
78 |
|
||
|
Interest rate swap (b) |
|
4.50% |
|
|
L + 1.99% |
|
|
1/22/2023 |
|
|
150,000 |
|
|
|
(538 |
) |
|
|
— |
|
|
|
(538 |
) |
||
|
Cash collateral |
|
|
|
|
|
|
|
|
|
|
|
|
— |
|
|
|
2,663 |
|
|
|
— |
|
|
|
— |
|
|
Total |
|
|
|
|
|
|
|
|
|
|
|
$ |
562,333 |
|
|
$ |
— |
|
|
$ |
— |
|
|
$ |
(1,701 |
) |
|
|
(a) |
Contract terms are shown net of Company receiving 6.65% and paying 8.38%. |
|
|
(b) |
Contains a variable rate structure. Bears interest at a rate determined by three-month LIBOR. |
|
(1) |
Certain portfolio company investments are subject to contractual restrictions on sales. |
|
(2) |
The amortized cost represents the original cost adjusted for the amortization of discounts and premiums, as applicable, on debt investments using the effective interest method. |
|
(3) |
Investment contains a variable rate structure, subject to an interest rate floor. Variable rate investments bear interest at a rate that may be determined by reference to either London Interbank Offered Rate (“LIBOR” or “L”) (which can include one-, two-, three- or six-month LIBOR), Canadian Dollar Offered Rate (“CDOR” or “C”), Bank Bill Swap Bid Rate (“BBSY” or “B”) or an alternate base rate (which can include the Federal Funds Effective Rate or the Prime Rate or “P”), at the borrower’s option, which reset periodically based on the terms of the credit agreement. For investments with multiple interest rate contracts, the interest rate shown is the weighted average interest rate in effect at December 31, 2018. |
|
(4) |
This portfolio company is not a qualifying asset under Section 55(a) of the Investment Company Act of 1940, as amended (the “1940 Act”). Under the 1940 Act, the Company may not acquire any non-qualifying asset unless, at the time such acquisition is made, qualifying assets represent at least 70% of total assets. Non-qualifying assets represented 17.3% of total assets as of December 31, 2018. |
|
(5) |
In addition to the interest earned based on the stated interest rate of this investment, which is the amount reflected in this schedule, the Company may be entitled to receive additional interest as a result of an arrangement with other members in the syndicate to the extent an investment has been allocated to “first out” and “last out” tranches, whereby the “first out” tranche will have priority as to the “last out” tranche with respect to payments of principal, interest and any amounts due thereunder and the Company hold the “last out” tranche. |
|
(6) |
Under the 1940 Act, the Company is deemed to be an “Affiliated Person” of, as defined in the 1940 Act, this portfolio company, as the Company owns more than 5% of the portfolio company’s outstanding voting securities. Transactions during the year ended December 31, 2018 in which the Company was an Affiliated Person of the portfolio company are as follows: |
F-15
Non-controlled, Affiliated Investments during the year ended December 31, 2018
|
Company |
|
Fair Value at December 31, 2017 |
|
|
Gross Additions (a) |
|
|
Gross Reductions (b) |
|
|
Net Change In Unrealized Gain/(Loss) |
|
|
Realized Gain/(Losses) |
|
|
Fair Value at December 31, 2018 |
|
|
Other Income |
|
|
Interest Income |
|
||||||||
|
AFS Technologies, Inc. |
|
$ |
— |
|
|
$ |
46,040 |
|
|
$ |
(266 |
) |
|
$ |
(432 |
) |
|
$ |
— |
|
|
$ |
45,342 |
|
|
$ |
16 |
|
|
$ |
1,032 |
|
|
Validity, Inc. |
|
— |
|
|
|
39,278 |
|
|
|
(450 |
) |
|
|
(238 |
) |
|
— |
|
|
|
38,590 |
|
|
|
382 |
|
|
|
2,620 |
|
||
|
Total |
|
$ |
— |
|
|
$ |
85,318 |
|
|
$ |
(716 |
) |
|
$ |
(670 |
) |
|
$ |
— |
|
|
$ |
83,932 |
|
|
$ |
398 |
|
|
$ |
3,652 |
|
|
|
(a) |
Gross additions include increases in the cost basis of investments resulting from new investments, payment-in-kind interest or dividends, the amortization of any unearned income or discounts on debt investments, as applicable. |
|
|
(b) |
Gross reductions include decreases in the cost basis of investments resulting from principal collections related to investment repayments or sales, and the amortization of any premiums on debt investments, as applicable. When an investment is placed on non-accrual status, any cash flows received by the Company are applied to the outstanding principal balance. |
|
(7) |
Under the 1940 Act, the Company is deemed to be both an “Affiliated Person” of and “Control,” as such terms are defined in the 1940 Act, this portfolio company, as the Company owns more than 25% of the portfolio company’s outstanding voting securities or has the power to exercise control over management or policies of such portfolio company (including through a management agreement). Transactions during the year ended December 31, 2018 in which the issuer was an Affiliated Person of and was deemed to Control a portfolio company are as follows: |
Controlled, Affiliated Investments during the year ended December 31, 2018
|
Company |
|
Fair Value at December 31, 2017 |
|
|
Gross Additions (a) |
|
|
Gross Reductions (b) |
|
|
Net Change In Unrealized Gain/(Loss) |
|
|
Realized Gain/(Losses) |
|
|
Fair Value at December 31, 2018 |
|
|
Other Income |
|
|
Interest Income |
|
||||||||
|
AFS Technologies, Inc. |
|
$ |
75,780 |
|
|
$ |
900 |
|
|
$ |
(75,438 |
) |
|
$ |
(3,658 |
) |
|
$ |
2,416 |
|
|
$ |
— |
|
|
$ |
— |
|
|
$ |
5,334 |
|
|
IRGSE Holding Corp. |
|
|
34,748 |
|
|
|
8,653 |
|
|
— |
|
|
|
(496 |
) |
|
|
(8,378 |
) |
|
|
34,527 |
|
|
|
5 |
|
|
|
5,582 |
|
|
|
Mississippi Resources, LLC |
|
|
25,392 |
|
|
|
4,192 |
|
|
|
(143 |
) |
|
|
2,126 |
|
|
|
(9,589 |
) |
|
|
21,978 |
|
|
|
85 |
|
|
|
2,847 |
|
|
Total |
|
$ |
135,920 |
|
|
$ |
13,745 |
|
|
$ |
(75,581 |
) |
|
$ |
(2,028 |
) |
|
$ |
(15,551 |
) |
|
$ |
56,505 |
|
|
$ |
90 |
|
|
$ |
13,763 |
|
|
|
(a) |
Gross additions include increases in the cost basis of investments resulting from new investments, payment-in-kind interest or dividends, the amortization of any unearned income or discounts on debt investments, as applicable. |
|
|
(b) |
Gross reductions include decreases in the cost basis of investments resulting from principal collections related to investment repayments or sales, and the amortization of any premiums on debt investments, as applicable. When an investment is placed on non-accrual status, any cash flows received by the Company are applied to the outstanding principal balance. |
|
(8) |
As of December 31, 2018, the tax cost of the Company’s investments approximates the amortized cost. |
|
(9) |
These investments contain a fixed rate structure. The Company entered into an interest rate swap agreement to swap to a floating rate. Refer to Note 5 for further information related to the Company’s interest rate swaps on investments. |
|
(10) |
In accordance with Financial Accounting Standards Board Accounting Standards Codification 820, Fair Value Measurements (“ASC 820”), unless otherwise indicated, the fair values of all investments were determined using significant unobservable inputs and are considered Level 3 investments. See Note 6 for further information related to investments at fair value. |
|
(11) |
This investment is valued using observable inputs and is considered a Level 2 investment. See Note 6 for further information related to investments at fair value. |
|
(12) |
This investment is valued using observable inputs and is considered a Level 1 investment. See Note 6 for further information related to investments at fair value. |
|
(13) |
This equity investment is non-income producing. |
|
(14) |
All or a portion of this security was acquired in transaction exempt from registration under the Securities Act of 1933, and may be deemed to be “restricted securities” under the Securities Act. As of December 31, 2018, the aggregate fair value of these securities is $23,128, or 2.2% of the Company’s net assets. |
|
(15) |
Ownership of equity investments may occur through a holding company or partnership. |
The accompanying notes are an integral part of these consolidated financial statements.
F-16
Consolidated Statements of Changes in Net Assets
(Amounts in thousands, except share amounts)
|
|
|
Common Stock |
|
|
Treasury Stock |
|
|
|
|
|
|
|
|
|
|
|
|
|
||||||||||
|
|
|
Shares |
|
|
Par Amount |
|
|
Shares |
|
|
Cost |
|
|
Paid in Capital in Excess of Par |
|
|
Distributable Earnings |
|
|
Total Net Assets |
|
|||||||
|
Balance at December 31, 2016 |
|
|
59,716,205 |
|
|
$ |
598 |
|
|
|
89,080 |
|
|
$ |
(1,359 |
) |
|
$ |
898,868 |
|
|
$ |
54,105 |
|
|
$ |
952,212 |
|
|
Net increase in net assets resulting from operations: |
|
|
|
|
|
|
|
|
|
|
|
|
|
|
|
|
|
|
|
|
|
|
|
|
|
|
|
|
|
Net investment income |
|
|
— |
|
|
|
— |
|
|
|
— |
|
|
|
— |
|
|
|
— |
|
|
|
120,259 |
|
|
|
120,259 |
|
|
Net change in unrealized gains on investments and foreign currency translation |
|
|
— |
|
|
|
— |
|
|
|
— |
|
|
|
— |
|
|
|
— |
|
|
|
5,295 |
|
|
|
5,295 |
|
|
Net realized loss on investments and foreign currency transactions |
|
|
— |
|
|
|
— |
|
|
|
— |
|
|
|
— |
|
|
|
— |
|
|
|
(13,945 |
) |
|
|
(13,945 |
) |
|
Increase in Net Assets Resulting from Capital Share Transactions: |
|
|
|
|
|
|
|
|
|
|
|
|
|
|
|
|
|
|
|
|
|
|
|
|
|
|
|
|
|
Issuance of convertible notes |
|
|
— |
|
|
|
— |
|
|
|
— |
|
|
|
— |
|
|
|
356 |
|
|
|
— |
|
|
|
356 |
|
|
Dividends to stockholders: |
|
|
|
|
|
|
|
|
|
|
|
|
|
|
|
|
|
|
|
|
|
|
|
|
|
|
|
|
|
Stock issued in connection with dividend reinvestment plan |
|
|
530,996 |
|
|
|
5 |
|
|
|
— |
|
|
|
— |
|
|
|
10,153 |
|
|
|
— |
|
|
|
10,158 |
|
|
Dividends declared from distributable earnings |
|
|
— |
|
|
|
— |
|
|
|
— |
|
|
|
— |
|
|
|
— |
|
|
|
(105,051 |
) |
|
|
(105,051 |
) |
|
Tax reclassification of stockholders' equity in accordance with GAAP (1) |
|
|
— |
|
|
|
— |
|
|
|
— |
|
|
|
— |
|
|
|
(2,856 |
) |
|
|
2,856 |
|
|
|
— |
|
|
Balance at December 31, 2017 |
|
|
60,247,201 |
|
|
$ |
603 |
|
|
|
89,080 |
|
|
$ |
(1,359 |
) |
|
$ |
906,521 |
|
|
$ |
63,519 |
|
|
$ |
969,284 |
|
|
Net increase in net assets resulting from operations: |
|
|
|
|
|
|
|
|
|
|
|
|
|
|
|
|
|
|
|
|
|
|
|
|
|
|
|
|
|
Net investment income |
|
|
— |
|
|
|
— |
|
|
|
— |
|
|
|
— |
|
|
|
— |
|
|
|
143,889 |
|
|
|
143,889 |
|
|
Net change in unrealized losses on investments and foreign currency translation |
|
|
— |
|
|
|
— |
|
|
|
— |
|
|
|
— |
|
|
|
— |
|
|
|
(14,151 |
) |
|
|
(14,151 |
) |
|
Net realized losses on investments and foreign currency transactions |
|
|
— |
|
|
|
— |
|
|
|
— |
|
|
|
— |
|
|
|
— |
|
|
|
(10,721 |
) |
|
|
(10,721 |
) |
|
Increase in Net Assets Resulting from Capital Share Transactions: |
|
|
|
|
|
|
|
|
|
|
|
|
|
|
|
|
|
|
|
|
|
|
|
|
|
|
|
|
|
Issuance of common shares, net of offering and underwriting costs |
|
|
4,272,224 |
|
|
|
43 |
|
|
|
— |
|
|
|
— |
|
|
|
71,770 |
|
|
|
— |
|
|
|
71,813 |
|
|
Issuance of convertible notes |
|
|
— |
|
|
|
— |
|
|
|
— |
|
|
|
— |
|
|
|
1,010 |
|
|
|
— |
|
|
|
1,010 |
|
|
Dividends to stockholders: |
|
|
|
|
|
|
|
|
|
|
|
|
|
|
|
|
|
|
|
|
|
|
|
|
|
|
|
|
|
Stock issued in connection with dividend reinvestment plan |
|
|
893,392 |
|
|
|
9 |
|
|
|
— |
|
|
|
— |
|
|
|
16,015 |
|
|
|
— |
|
|
|
16,024 |
|
|
Dividends declared from distributable earnings |
|
|
— |
|
|
|
— |
|
|
|
— |
|
|
|
— |
|
|
|
— |
|
|
|
(113,946 |
) |
|
|
(113,946 |
) |
|
Tax reclassification of stockholders' equity in accordance with GAAP (1) |
|
|
— |
|
|
|
— |
|
|
|
— |
|
|
|
— |
|
|
|
(3,397 |
) |
|
|
3,397 |
|
|
|
— |
|
|
Balance at December 31, 2018 |
|
|
65,412,817 |
|
|
$ |
655 |
|
|
|
89,080 |
|
|
$ |
(1,359 |
) |
|
$ |
991,919 |
|
|
$ |
71,987 |
|
|
$ |
1,063,202 |
|
|
Net increase in net assets resulting from operations: |
|
|
|
|
|
|
|
|
|
|
|
|
|
|
|
|
|
|
|
|
|
|
|
|
|
|
|
|
|
Net investment income |
|
|
— |
|
|
|
— |
|
|
|
— |
|
|
|
— |
|
|
|
— |
|
|
|
128,283 |
|
|
|
128,283 |
|
|
Net change in unrealized gains on investments and foreign currency translation |
|
|
— |
|
|
|
— |
|
|
|
— |
|
|
|
— |
|
|
|
— |
|
|
|
24,262 |
|
|
|
24,262 |
|
|
Net realized gain on investments and foreign currency transactions |
|
|
— |
|
|
|
— |
|
|
|
— |
|
|
|
— |
|
|
|
— |
|
|
|
2,038 |
|
|
|
2,038 |
|
|
Dividends to stockholders: |
|
|
|
|
|
|
|
|
|
|
|
|
|
|
|
|
|
|
|
|
|
|
|
|
|
|
|
|
|
Stock issued in connection with dividend reinvestment plan |
|
|
1,111,774 |
|
|
|
11 |
|
|
|
— |
|
|
|
— |
|
|
|
21,124 |
|
|
|
— |
|
|
|
21,135 |
|
|
Dividends declared from distributable earnings |
|
|
— |
|
|
|
— |
|
|
|
— |
|
|
|
— |
|
|
|
— |
|
|
|
(119,623 |
) |
|
|
(119,623 |
) |
|
Tax reclassification of stockholders' equity in accordance with GAAP (1) |
|
|
— |
|
|
|
— |
|
|
|
— |
|
|
|
— |
|
|
|
(3,773 |
) |
|
|
3,773 |
|
|
|
— |
|
|
Balance at December 31, 2019 |
|
|
66,524,591 |
|
|
$ |
666 |
|
|
|
89,080 |
|
|
$ |
(1,359 |
) |
|
$ |
1,009,270 |
|
|
$ |
110,720 |
|
|
$ |
1,119,297 |
|
|
(1) |
The Company’s tax year end is March 31st. |
The accompanying notes are an integral part of these consolidated financial statements.
F-17
Consolidated Statements of Cash Flows
(Amounts in thousands)
|
|
|
Year Ended |
|
|
Year Ended |
|
|
Year Ended |
|
|||
|
|
|
December 31, 2019 |
|
|
December 31, 2018 |
|
|
December 31, 2017 |
|
|||
|
Cash Flows from Operating Activities |
|
|
|
|
|
|
|
|
|
|
|
|
|
Increase in net assets resulting from operations |
|
$ |
154,583 |
|
|
$ |
119,017 |
|
|
$ |
111,609 |
|
|
Adjustments to reconcile increase in net assets resulting from operations to net cash provided by (used) in operating activities: |
|
|
|
|
|
|
|
|
|
|
|
|
|
Net change in unrealized (gains) losses on investments |
|
|
(18,323 |
) |
|
|
17,905 |
|
|
|
(17,758 |
) |
|
Net change in unrealized (gains) losses on foreign currency transactions |
|
|
3,255 |
|
|
|
(5,455 |
) |
|
|
11,432 |
|
|
Net change in unrealized (gains) losses on interest rate swaps |
|
|
(9,194 |
) |
|
|
1,701 |
|
|
|
1,031 |
|
|
Net realized (gains) losses on investments |
|
|
(1,888 |
) |
|
|
11,433 |
|
|
|
14,295 |
|
|
Net realized gains on foreign currency transactions |
|
|
1 |
|
|
|
(462 |
) |
|
|
(359 |
) |
|
Net realized gains on interest rate swaps |
|
|
(41 |
) |
|
— |
|
|
— |
|
||
|
Net amortization of discount on investments |
|
|
(16,565 |
) |
|
|
(23,315 |
) |
|
|
(29,606 |
) |
|
Amortization of deferred financing costs |
|
|
4,784 |
|
|
|
4,051 |
|
|
|
3,172 |
|
|
Amortization of discount on debt |
|
|
968 |
|
|
|
851 |
|
|
|
674 |
|
|
Purchases and originations of investments, net |
|
|
(1,118,116 |
) |
|
|
(838,206 |
) |
|
|
(1,027,978 |
) |
|
Proceeds from investments, net |
|
|
38,043 |
|
|
|
34,593 |
|
|
|
103,599 |
|
|
Repayments on investments |
|
|
583,927 |
|
|
|
789,384 |
|
|
|
922,473 |
|
|
Paid-in-kind interest |
|
|
(7,468 |
) |
|
|
(6,251 |
) |
|
|
(6,206 |
) |
|
Changes in operating assets and liabilities: |
|
|
|
|
|
|
|
|
|
|
|
|
|
Interest receivable |
|
|
(4,336 |
) |
|
|
(1,763 |
) |
|
|
2,619 |
|
|
Interest receivable paid-in-kind |
|
|
110 |
|
|
|
(304 |
) |
|
|
297 |
|
|
Prepaid expenses and other assets |
|
|
(59 |
) |
|
|
8,137 |
|
|
|
(10,660 |
) |
|
Management fees payable to affiliate |
|
|
1,165 |
|
|
|
850 |
|
|
|
(50 |
) |
|
Incentive fees payable to affiliate |
|
|
(2,195 |
) |
|
|
3,728 |
|
|
|
(261 |
) |
|
Payable to affiliate |
|
|
327 |
|
|
|
(280 |
) |
|
|
346 |
|
|
Other liabilities |
|
|
12,981 |
|
|
|
3,579 |
|
|
|
3,719 |
|
|
Net Cash Provided by (Used) in Operating Activities |
|
|
(378,041 |
) |
|
|
119,193 |
|
|
|
82,388 |
|
|
Cash Flows from Financing Activities |
|
|
|
|
|
|
|
|
|
|
|
|
|
Borrowings on debt |
|
|
1,742,585 |
|
|
|
1,095,561 |
|
|
|
1,188,532 |
|
|
Repayments on debt |
|
|
(1,255,169 |
) |
|
|
(1,178,959 |
) |
|
|
(1,171,592 |
) |
|
Deferred financing costs |
|
|
(7,747 |
) |
|
|
(7,789 |
) |
|
|
(3,922 |
) |
|
Proceeds from issuance of common stock, net of offering and underwriting costs |
|
— |
|
|
|
71,813 |
|
|
— |
|
||
|
Dividends paid to stockholders |
|
|
(98,060 |
) |
|
|
(95,909 |
) |
|
|
(94,695 |
) |
|
Net Cash Provided by (Used) in Financing Activities |
|
|
381,609 |
|
|
|
(115,283 |
) |
|
|
(81,677 |
) |
|
Net Increase in Cash, Cash Equivalents, and Restricted Cash |
|
|
3,568 |
|
|
|
3,910 |
|
|
|
711 |
|
|
Cash, cash equivalents, and restricted cash, beginning of period |
|
|
10,575 |
|
|
|
6,665 |
|
|
|
5,954 |
|
|
Cash, Cash Equivalents, and Restricted Cash, End of Period |
|
$ |
14,143 |
|
|
$ |
10,575 |
|
|
$ |
6,665 |
|
|
Supplemental Information: |
|
|
|
|
|
|
|
|
|
|
|
|
|
Interest paid during the period |
|
$ |
41,132 |
|
|
$ |
34,370 |
|
|
$ |
21,148 |
|
|
Excise taxes paid during the period |
|
$ |
3,445 |
|
|
$ |
2,500 |
|
|
$ |
2,100 |
|
|
Dividends declared during the period |
|
$ |
119,623 |
|
|
$ |
113,946 |
|
|
$ |
105,051 |
|
|
Reinvestment of dividends during the period |
|
$ |
21,135 |
|
|
$ |
16,024 |
|
|
$ |
10,158 |
|
The accompanying notes are an integral part of these consolidated financial statements.
F-18
Notes to Consolidated Financial Statements
(Amounts in thousands, unless otherwise indicated)
1. Organization and Basis of Presentation
Organization
TPG Specialty Lending, Inc. (“TSLX” or the “Company”) is a Delaware corporation formed on July 21, 2010. The Company was formed primarily to lend to, and selectively invest in, middle-market companies in the United States. The Company has elected to be regulated as a business development company (“BDC”) under the 1940 Act. In addition, for tax purposes, the Company has elected to be treated as a regulated investment company (“RIC”) under Subchapter M of the Internal Revenue Code of 1986, as amended (the “Code”). TSLX is managed by TSL Advisers, LLC (the “Adviser”). On June 1, 2011, the Company formed a wholly-owned subsidiary, TC Lending, LLC, a Delaware limited liability company. On March 22, 2012, the Company formed a wholly-owned subsidiary, TPG SL SPV, LLC, a Delaware limited liability company (“TPG SL SPV”). On May 19, 2014, the Company formed a wholly-owned subsidiary, TSL MR, LLC, a Delaware limited liability company.
On March 21, 2014, the Company completed its initial public offering (“IPO”) and the Company’s shares began trading on the New York Stock Exchange (“NYSE”) under the symbol “TSLX.”
Basis of Presentation
The accompanying consolidated financial statements are prepared in accordance with accounting principles generally accepted in the United States of America (“U.S. GAAP”), and include the accounts of the Company and its subsidiaries. In the opinion of management all adjustments considered necessary for the fair presentation of the consolidated financial statements for the periods presented have been included. All intercompany balances and transactions have been eliminated in consolidation.
The Company is an investment company and, therefore, applies the specialized accounting and reporting guidance in Accounting Standards Codification (“ASC”) Topic 946, Financial Services – Investment Companies.
Fiscal Year End
The Company’s fiscal year ends on December 31.
2. Significant Accounting Policies
Use of Estimates
The preparation of financial statements in conformity with U.S. GAAP requires management to make estimates and assumptions that affect the reported amounts of assets and liabilities and disclosure of contingent assets and liabilities at the date of the consolidated financial statements. Actual amounts could differ from those estimates and such differences could be material.
Cash and Cash Equivalents
Cash and cash equivalents may consist of demand deposits, highly liquid investments (e.g., money market funds, U.S. Treasury notes, and similar type instruments) with original maturities of three months or less, and restricted cash pledged as collateral. Cash and cash equivalents denominated in U.S. dollars are carried at cost, which approximates fair value. The Company deposits its cash and cash equivalents with highly-rated banking corporations and, at times, cash deposits may exceed the insured limits under applicable law.
Investments at Fair Value
Loan originations are recorded on the date of the binding commitment, which is generally the funding date. Investment transactions purchased through the secondary markets are recorded on the trade date. Realized gains or losses are measured by the difference between the net proceeds received (excluding prepayment fees, if any) and the amortized cost basis of the investment without regard to unrealized gains or losses previously recognized, and include investments charged off during the period, net of recoveries. The net change in unrealized gains or losses primarily reflects the change in investment values and also includes the reversal of previously recorded unrealized gains or losses with respect to investments realized during the period.
F-19
Investments for which market quotations are readily available are typically valued at those market quotations. To validate market quotations, the Company utilizes a number of factors to determine if the quotations are representative of fair value, including the source and number of the quotations. Debt and equity securities that are not publicly traded or whose market prices are not readily available, as is the case for substantially all of our investments, are valued at fair value as determined in good faith by the Company’s Board of Directors (the “Board”), based on, among other things, the input of the Adviser, the Company’s Audit Committee and independent third-party valuation firms engaged at the direction of the Board.
As part of the valuation process, the Board takes into account relevant factors in determining the fair value of its investments, including and in combination of: the estimated enterprise value of a portfolio company (that is, the total value of the portfolio company’s net debt and equity), the nature and realizable value of any collateral, the portfolio company’s ability to make payments based on its earnings and cash flow, the markets in which the portfolio company does business, a comparison of the portfolio company’s securities to any similar publicly traded securities, and overall changes in the interest rate environment and the credit markets that may affect the price at which similar investments may be made in the future. When an external event such as a purchase transaction, public offering or subsequent equity sale occurs, the Board considers whether the pricing indicated by the external event corroborates its valuation.
The Board undertakes a multi-step valuation process, which includes, among other procedures, the following:
|
|
• |
The valuation process begins with each investment being initially valued by the investment professionals responsible for the portfolio investment in conjunction with the portfolio management team. |
|
|
• |
The Adviser’s management reviews the preliminary valuations with the investment professionals. Agreed upon valuation recommendations are presented to the Audit Committee. |
|
|
• |
The Audit Committee reviews the valuations presented and recommends values for each investment to the Board. |
|
|
• |
The Board reviews the recommended valuations and determines the fair value of each investment; valuations that are not based on readily available market quotations are valued in good faith based on, among other things, the input of the Adviser, Audit Committee and, where applicable, other third parties including independent third-party valuation firms engaged at the direction of the Board. |
The Company conducts this valuation process on a quarterly basis.
The Board has engaged independent third-party valuation firms to perform certain limited procedures that the Board has identified and requested them to perform in connection with the valuation process. At December 31, 2019, the independent third-party valuation firms performed their procedures over substantially all of the Company’s investments. Upon completion of such limited procedures, the third-party valuation firms concluded that the fair value, as determined by the Board, of those investments subjected to their limited procedures, appeared reasonable.
The Company applies Financial Accounting Standards Board Accounting Standards Codification 820, Fair Value Measurement (“ASC 820”), as amended, which establishes a framework for measuring fair value in accordance with U.S. GAAP and required disclosures of fair value measurements. ASC 820 determines fair value to be the price that would be received for an investment in a current sale, which assumes an orderly transaction between market participants on the measurement date. Market participants are defined as buyers and sellers in the principal or most advantageous market (which may be a hypothetical market) that are independent, knowledgeable, and willing and able to transact. In accordance with ASC 820, the Company considers its principal market to be the market that has the greatest volume and level of activity. ASC 820 specifies a fair value hierarchy that prioritizes and ranks the level of observability of inputs used in determination of fair value. In accordance with ASC 820, these levels are summarized below:
|
|
• |
Level 1—Valuations based on quoted prices in active markets for identical assets or liabilities that the Company has the ability to access. |
|
|
• |
Level 2—Valuations based on quoted prices in markets that are not active or for which all significant inputs are observable, either directly or indirectly. |
|
|
• |
Level 3—Valuations based on inputs that are unobservable and significant to the overall fair value measurement. |
Transfers between levels, if any, are recognized at the beginning of the quarter in which the transfers occur. In addition to using the above inputs in investment valuations, the Company applies the valuation policy approved by its Board that is consistent with ASC 820. Consistent with the valuation policy, the Company evaluates the source of inputs, including any markets in which its investments are trading (or any markets in which securities with similar attributes are trading), in determining fair value. When a security is valued based on prices provided by reputable dealers or pricing services (that is, broker quotes), the Company subjects those prices to various additional criteria in making the determination as to whether a particular investment would qualify for treatment as a Level 2 or Level
F-20
3 investment. For example, the Company reviews pricing provided by dealers or pricing services in order to determine if observable market information is being used, versus unobservable inputs. Some additional factors considered include the number of prices obtained as well as an assessment as to their quality, such as the depth of the relevant market relative to the size of the Company’s position.
Due to the inherent uncertainty of determining the fair value of investments that do not have a readily available market value, the fair value of the Company’s investments may fluctuate from period to period. Additionally, the fair value of such investments may differ significantly from the values that would have been used had a ready market existed for such investments and may differ materially from the values that may ultimately be realized. Further, such investments are generally less liquid than publicly traded securities and may be subject to contractual and other restrictions on resale. If the Company were required to liquidate a portfolio investment in a forced or liquidation sale, it could realize amounts that are different from the amounts presented and such differences could be material.
In addition, changes in the market environment including the impact of changes in broader market indices and credit spreads and other events that may occur over the life of the investments may cause the gains or losses ultimately realized on these investments to be different than the unrealized gains or losses reflected herein.
Financial and Derivative Instruments
The Company recognizes all derivative instruments as assets or liabilities at fair value in its consolidated financial statements, pursuant to ASC 815 Derivatives and Hedging, further clarified by the FASB’s issuance of the Accounting Standards Update (“ASU”) No. 2017-12, Derivatives and Hedging, which was adopted in 2019 by the Company. For all derivative instruments designated in a hedge accounting relationship, the entire change in the fair value of the hedging instrument shall be recorded in the same line item of the Consolidated Statements of Operations as the hedged item. The Company uses certain interest rate swaps as derivative instruments to hedge the Company’s fixed rate debt, and therefore both the periodic payment and the change in fair value for the effective hedge, if applicable, will be recognized as components of interest expense in the Consolidated Statements of Operations.
In the normal course of business, the Company has commitments and risks resulting from its investment transactions, which may include those involving derivative instruments. Derivative instruments are measured in terms of the notional contract amount and derive their value based upon one or more underlying instruments. While the notional amount gives some indication of the Company’s derivative activity, it generally is not exchanged, but is only used as the basis on which interest and other payments are exchanged. Derivative instruments are subject to various risks similar to non-derivative instruments including market, credit, liquidity, and operational risks. The Company manages these risks on an aggregate basis as part of its risk management process.
Derivatives, including the Company’s interest rate swaps, for which broker quotes are available are typically valued at those broker quotes.
Offsetting Assets and Liabilities
Foreign currency forward contract and interest rate swap receivables or payables pending settlement are offset, and the net amount is included with receivable or payable for foreign currency forward contracts or interest rate swaps in the consolidated balance sheets when, and only when, they are with the same counterparty, the Company has the legal right to offset the recognized amounts, and it intends to either settle on a net basis or realize the asset and settle the liability simultaneously.
Foreign Currency
Foreign currency amounts are translated into U.S. dollars on the following basis:
|
|
• |
cash and cash equivalents, market value of investments, outstanding debt on revolving credit facilities, other assets and liabilities: at the spot exchange rate on the last business day of the period; and |
|
|
• |
purchases and sales of investments, borrowings and repayments of such borrowings, income and expenses: at the rates of exchange prevailing on the respective dates of such transactions. |
Although net assets and fair values are presented based on the applicable foreign exchange rates described above, the Company does not isolate that portion of the results of operations resulting from changes in foreign exchange rates on investments from the fluctuations arising from changes in fair values of investments held. Such fluctuations are included with the net realized and unrealized gain or loss from investments. The Company’s current approach to hedging the foreign currency exposure in its non-U.S. dollar denominated investments is primarily to borrow the par amount in local currency under the Company’s Revolving Credit Facility to fund these investments. Fluctuations arising from the translation of foreign currency borrowings are included with the net change in unrealized gains (losses) on translation of assets and liabilities in foreign currencies on the Consolidated Statements of Operations.
F-21
Investments denominated in foreign currencies and foreign currency transactions may involve certain considerations and risks not typically associated with those of domestic origin, including unanticipated movements in the value of the foreign currency relative to the U.S. dollar.
Equity Offering Expenses
The Company records expenses related to equity offerings as a reduction of capital upon completion of an offering of registered securities. The costs associated with renewals of the Company’s shelf registration statement are expensed as incurred.
Debt Issuance Costs
The Company records origination and other expenses related to its debt obligations as deferred financing costs, which are presented as a direct deduction from the carrying value of the related debt liability. These expenses are deferred and amortized using the effective interest method, or straight-line method, over the stated maturity of the obligation.
Interest and Dividend Income Recognition
Interest income is recorded on an accrual basis and includes the amortization of discounts and premiums. Discounts and premiums to par value on securities purchased or originated are amortized into interest income over the contractual life of the respective security using the effective interest method. The amortized cost of investments represents the original cost adjusted for the amortization of discounts and premiums, if any.
Unless providing services in connection with an investment, such as syndication, structuring or diligence, all or a portion of any loan fees received by the Company will be deferred and amortized over the investment’s life using the effective interest method.
Loans are generally placed on non-accrual status when principal or interest payments are past due 30 days or more or when management has reasonable doubt that the borrower will pay principal or interest in full. Accrued and unpaid interest is generally reversed when a loan is placed on non-accrual status. Interest payments received on non-accrual loans may be recognized as income or applied to principal depending upon management’s judgment regarding collectability. Non-accrual loans are restored to accrual status when past due principal and interest has been paid and, in management’s judgment, the borrower is likely to make principal and interest payments in the future. Management may determine to not place a loan on non-accrual status if, notwithstanding any failure to pay, the loan has sufficient collateral value and is in the process of collection.
Dividend income on preferred equity securities is recorded on an accrual basis to the extent that such amounts are payable by the portfolio company and are expected to be collected. Dividend income on common equity securities is recorded on the record date for private portfolio companies or on the ex-dividend date for publicly-traded portfolio companies.
Other Income
From time to time, the Company may receive fees for services provided to portfolio companies by the Adviser. The services that the Adviser provides vary by investment, but may include syndication, structuring, diligence fees, or other service-based fees and fees for providing managerial assistance to our portfolio companies and are recognized as revenue when earned.
Reimbursement of Transaction-Related Expenses
The Company may receive reimbursement for certain transaction-related expenses in pursuing investments. Transaction-related expenses, which are expected to be reimbursed by third parties, are typically deferred until the transaction is consummated and are recorded in Prepaid expenses and other assets on the date incurred. The transaction-related costs of pursuing investments not otherwise reimbursed are borne by the Company and for successfully completed investments included as a component of the investment’s cost basis.
Cash advances received in respect of transaction-related expenses are recorded as cash and cash equivalents with an offset to Other liabilities or Payables to affiliates. Other liabilities or Payables to affiliates are relieved as reimbursable expenses are incurred.
F-22
Income Taxes, Including Excise Taxes
The Company has elected to be treated as a RIC under Subchapter M of the Code, and the Company intends to operate in a manner so as to continue to qualify for the tax treatment applicable to RICs. To qualify as a RIC, the Company must, among other things, distribute to its stockholders in each taxable year generally at least 90% of its investment company taxable income, as defined by the Code, and net tax-exempt income for that taxable year. To maintain its RIC status, the Company, among other things, has made and intends to continue to make the requisite distributions to its stockholders, which generally relieves the Company from corporate-level U.S. federal income taxes.
The Company evaluates tax positions taken or expected to be taken in the course of preparing its financial statements to determine whether the tax positions are “more-likely-than-not” to be sustained by the applicable tax authority. Tax positions not deemed to meet the “more-likely-than-not” threshold are reserved and recorded as a tax benefit or expense in the current year. All penalties and interest associated with income taxes are included in income tax expense. Conclusions regarding tax positions are subject to review and may be adjusted at a later date based on factors including, but not limited to, on-going analyses of tax laws, regulations and interpretations thereof. As of December 31, 2019, the Company did not have any uncertain tax positions that met the recognition or measurement criteria, nor did the Company have any unrecognized tax benefits. The Company’s 2018, 2017 and 2016 tax year returns remain subject to examination by the relevant federal, state, and local tax authorities.
Depending on the level of taxable income earned in a tax year, the Company can be expected to carry forward taxable income (including net capital gains, if any) in excess of current year dividend distributions from the current tax year into the next tax year and pay a nondeductible 4% U.S. federal excise tax on such taxable income, as required. To the extent that the Company determines that the estimated current year annual taxable income will be in excess of estimated current year dividend distributions from such income, the Company accrues excise tax on estimated excess taxable income.
For the calendar years ended December 31, 2019, 2018 and 2017 we recorded a net expense of $3.8 million, $3.4 million and $2.8 million, respectively, for U.S. federal excise tax.
Dividends to Common Stockholders
The amount to be paid out as a dividend is determined by the Board and is generally based upon the earnings estimated by the Adviser. Net realized long-term capital gains, if any, would generally be distributed at least annually, although the Company may decide to retain such capital gains.
The Company has adopted a dividend reinvestment plan that provides for reinvestment of any dividends declared in cash on behalf of stockholders, unless a stockholder elects to receive cash. As a result, if the Board authorizes, and it declares, a cash dividend, then the stockholders who have not “opted out” of the dividend reinvestment plan will have their cash dividends automatically reinvested in additional shares of the Company’s common stock, rather than receiving the cash dividend. The Company expects to use newly issued shares to satisfy the dividend reinvestment plan.
Recent Accounting Standards and Regulatory Updates
In May 2014, the Financial Accounting Standards Board issued Accounting Standards Update 2014-09 (“ASU 2014-09”), “Revenue from Contracts with Customers (Topic 606).” The guidance in this ASU supersedes the revenue recognition requirements in Topic 605, Revenue Recognition. Under the new guidance, an entity should recognize revenue to depict the transfer of promised goods or services to customers in an amount that reflects the consideration to which the entity expects to be entitled in exchange for those goods or services. The amendments in ASU 2014-09 were effective for public companies for interim and annual periods in fiscal years beginning after December 15, 2017. The Company’s adoption of this guidance did not have a material impact on the Company’s financial position, results of operations, cash flows or notes to the consolidated financial statements.
In August 2018, the Securities and Exchange Commission (the “SEC”) adopted the final rule under SEC Release No. 33-10532, Disclosure Update and Simplification amending certain disclosure requirements that were redundant, duplicative, overlapping, outdated or superseded. The amendments are intended to facilitate the disclosure of information to investors and simplify compliance. The SEC Release requires presentation changes to the Company's Consolidated Balance Sheets and Consolidated Statements of Changes in Net Assets. The final rule is effective for all filings on or after November 5, 2018. The Company has adopted the SEC guidance in the current annual period. In accordance with previous SEC rules, the Company had presented distributable earnings on the Consolidated Balance Sheet, as three components: 1) undistributed net investment income; 2) net unrealized gains (losses) on investments and 3) net realized gains (losses) on investments and presented dividends from distributable earnings on the Consolidated Statements of Changes in Net Assets as two components: 1) dividends declared from net investment income; and 2) dividends declared from realized gains. In accordance with the SEC release, distributable earnings and dividends from distributable earnings are shown in total on the Consolidated Balance Sheets and Consolidated Statements of Changes in Net Assets, respectively. The changes
F-23
in presentation have been retrospectively applied to the Consolidated Balance Sheets as of December 31, 2017 and to the Consolidated Statements of Changes in Net Assets for the years ended December 30, 2017 and 2016.
In August 2017, the Financial Accounting Standards Board issued Accounting Standards Update 2017-12 (“ASU 2017-12”) “Derivatives and Hedging (Topic 815), Targeted Improvements to Accounting for Hedging Activities.” Among other things, the new guidance includes updates to the alignment of risk management activities and financial reporting, risk component hedging, accounting for the hedged item in fair value hedges of interest rate risk, recognition and presentation of the effects of hedging instruments, amounts excluded from the assessment of hedge effectiveness, and other simplifications of hedge accounting guidance. The amendments of ASU 2017-12 were effective for fiscal years beginning after December 15, 2018, and interim periods therein. The Company’s adoption of this guidance did not have a material impact on the Company’s financial position, results of operations, cash flows or notes to the consolidated financial statements.
New Accounting Pronouncements
In August 2018, the Financial Accounting Standards Board issued Accounting Standards Update 2018-13 (“ASU 2018-13”) “Fair Value Measurement (Topic 820): Disclosure Framework – Changes to the Disclosure Requirements for Fair Value Measurement.” This guidance modifies the disclosure requirements on fair value measurements in ASC Topic 820, by eliminating, amending, and adding certain disclosure requirements. ASU 2018-13 is effective for financial statements issued for fiscal years beginning after December 15, 2019, including interim periods within those fiscal years. Early adoption is permitted for any period for which financial statements have not yet been issued or have not yet been made available for issuance. The Company is currently evaluating the impact, if any, of adopting this ASU on our financial statements.
3. Agreements and Related Party Transactions
Administration Agreement
On March 15, 2011, the Company entered into the Administration Agreement with the Adviser. Under the terms of the Administration Agreement, the Adviser provides administrative services to the Company. These services include providing office space, equipment and office services, maintaining financial records, preparing reports to stockholders and reports filed with the SEC, and managing the payment of expenses and the oversight of the performance of administrative and professional services rendered by others. Certain of these services are reimbursable to the Adviser under the terms of the Administration Agreement. In addition, the Adviser is permitted to delegate its duties under the Administration Agreement to affiliates or third parties and the Company pays or reimburses the Adviser for certain expenses incurred by any such affiliates or third parties for work done on its behalf.
In February 2017, the Board of Directors of the Company and the Adviser entered into an amended and restated administration agreement (the “Administration Agreement”) reflecting certain clarifications to the agreement to provide greater detail regarding the scope of the reimbursable costs and expenses of the Administrator’s services.
In November 2019, the Board renewed the Administration Agreement. Unless earlier terminated as described below, the Administration Agreement will remain in effect until November 2020, and may be extended subject to required approvals. The Administration Agreement may be terminated by either party without penalty on 60 days’ written notice to the other party.
No person who is an officer, director or employee of the Adviser or its affiliates and who serves as a director of the Company receives any compensation from the Company for his or her services as a director. However, the Company reimburses the Adviser (or its affiliates) for an allocable portion of the compensation paid by the Adviser or its affiliates to the Company’s Chief Financial Officer, Chief Compliance Officer, and other professionals who spend time on such related activities (based on the percentage of time those individuals devote, on an estimated basis, to the business and affairs of the Company). Directors who are not affiliated with the Adviser receive compensation for their services and reimbursement of expenses incurred to attend meetings.
For the years ended December 31, 2019, 2018 and 2017, the Company incurred expenses of $4.2 million, $3.4 million and $3.5 million, respectively, for administrative services payable to the Adviser under the terms of the Administration Agreement.
Investment Advisory Agreement
On April 15, 2011, the Company entered into the Investment Advisory Agreement with the Adviser. The Investment Advisory Agreement was subsequently amended on December 12, 2011. Under the terms of the Investment Advisory Agreement, the Adviser provides investment advisory services to the Company. The Adviser’s services under the Investment Advisory Agreement are not exclusive, and the Adviser is free to furnish similar or other services to others so long as its services to the Company are not impaired. Under the terms of the Investment Advisory Agreement, the Company will pay the Adviser the Management Fee and may also pay certain Incentive Fees.
F-24
The Management Fee is calculated at an annual rate of 1.5% based on the average value of the Company’s gross assets calculated using the values at the end of the two most recently completed calendar quarters, adjusted for any share issuances or repurchases during the period. The Management Fee is payable quarterly in arrears.
For the years ended December 31, 2019, 2018 and 2017, Management Fees (gross of waivers) were $30.1 million, $28.6 million and $24.3 million, respectively.
The Adviser did not waive any Management Fees for the year ended December 31, 2019. For the years ended December 31, 2018 and 2017, Management Fees of less than $0.1 million were waived consisting solely of Management Fees attributable to the Company’s ownership of shares of common stock in Triangle Capital Corp. (the “TCAP Shares”). As of June 30, 2018 the Company had fully exited its position in the TCAP Shares. Any waived Management Fees are not subject to recoupment by the Adviser.
The Adviser intends to waive a portion of the Management Fee payable under the Investment Advisory Agreement by reducing the Management Fee on assets financed using leverage over 200% asset coverage (in other words, over 1.0x debt to equity) (the “Leverage Waiver”). Pursuant to the Leverage Waiver, the Adviser intends to waive the portion of the Management Fee in excess of an annual rate of 1.0% (0.250% per quarter) on the average value of the Company’s gross assets as of the end of the two most recently completed calendar quarters that exceeds the product of (i) 200% and (ii) the average value of our net asset value at the end of the two most recently completed calendar quarters. As of December 31, 2019, no Management Fees have been waived pursuant to the Leverage Waiver.
The Incentive Fee consists of two parts, as follows:
|
|
(i) |
The first component, payable at the end of each quarter in arrears, equals 100% of the pre-Incentive Fee net investment income in excess of a 1.5% quarterly “hurdle rate,” the calculation of which is further explained below, until the Adviser has received 17.5% of the total pre-Incentive Fee net investment income for that quarter and, for pre-Incentive Fee net investment income in excess of 1.82% quarterly, 17.5% of all remaining pre-Incentive Fee net investment income for that quarter. The 100% “catch-up” provision for pre-Incentive Fee net investment income in excess of the 1.5% “hurdle rate” is intended to provide the Adviser with an Incentive Fee of 17.5% on all pre-Incentive Fee net investment income when that amount equals 1.82% in a quarter (7.28% annualized), which is the rate at which catch-up is achieved. Once the “hurdle rate” is reached and catch-up is achieved, 17.5% of any pre-Incentive Fee net investment income in excess of 1.82% in any quarter is payable to the Adviser. |
Pre-Incentive Fee net investment income means dividends, interest and fee income accrued by the Company during the calendar quarter, minus the Company’s operating expenses for the quarter (including the Management Fee, expenses payable under the Administration Agreement to the Administrator, and any interest expense and dividends paid on any issued and outstanding preferred stock, but excluding the Incentive Fee). Pre-Incentive Fee net investment income includes, in the case of investments with a deferred interest feature (such as original issue discount, debt instruments with pay-in-kind interest and zero coupon securities), accrued income that the Company may not have received in cash. Pre-Incentive Fee net investment income does not include any realized capital gains, realized capital losses or unrealized capital gains or losses.
|
|
(ii) |
The second component, payable at the end of each fiscal year in arrears, equaled 15% through March 31, 2014 and, beginning April 1, 2014, equals a weighted percentage of cumulative realized capital gains from the Company’s inception to the end of that fiscal year, less cumulative realized capital losses and unrealized capital losses. This component of the Incentive Fee is referred to as the Capital Gains Fee. Each year, the fee paid for this component of the Incentive Fee is net of the aggregate amount of any previously paid Capital Gains Fee for prior periods. For capital gains that accrue following March 31, 2014, the Incentive Fee rate is 17.5%. The Company accrues, but does not pay, a capital gains Incentive Fee with respect to unrealized capital gains because a capital gains Incentive Fee would be owed to the Adviser if the Company were to sell the relevant investment and realize a capital gain. The weighted percentage is intended to ensure that for each fiscal year following the completion of the IPO, the portion of the Company’s realized capital gains that accrued prior to March 31, 2014, is subject to an Incentive Fee rate of 15% and the portion of the Company’s realized capital gains that accrued beginning April 1, 2014 is subject to an Incentive Fee rate of 17.5%. |
For purposes of determining whether pre-Incentive Fee net investment income exceeds the hurdle rate, pre-Incentive Fee net investment income is expressed as a rate of return on the value of the Company’s net assets at the end of the immediately preceding calendar quarter.
Section 205(b)(3) of the Investment Advisers Act of 1940, as amended, prohibits the Adviser from receiving the payment of fees on unrealized gains until those gains are realized, if ever. There can be no assurance that such unrealized gains will be realized in the future.
F-25
For the years ended December 31, 2019, 2018 and 2017, Incentive Fees (gross of waivers) were $27.2 million, $30.5 million and $25.5 million, respectively, all of which were realized and payable to the Adviser. For the years ended December 31, 2019, 2018 and 2017, no Incentive Fees were accrued related to capital gains.
The Adviser voluntarily waived the Incentive Fees attributable to pre-Incentive Fee net investment income accrued by the Company as a result of its ownership of the TCAP Shares. The Adviser did not waive any part of the Capital Gains Fee attributable to the Company’s ownership of the TCAP Shares and, accordingly, any realized capital gains or losses and unrealized capital losses with respect to the TCAP Shares were applied against the Company’s cumulative realized capital gains on which the Capital Gains Fee is calculated.
The Adviser did not waive any Incentive Fees for the year ended December 31, 2019. For each of the years ended December 31, 2018 and 2017, Incentive Fees of less than $0.1 million were waived, respectively, consisting solely of Incentive Fees attributable to the Company’s ownership of the TCAP Shares.
Since the Company’s IPO, with the exception of its waiver of Management Fees and certain Incentive Fees attributable to the Company’s ownership of certain portfolio companies, including the TCAP Shares, the Adviser has not waived its right to receive any Management Fees or Incentive Fees payable pursuant to the Investment Advisory Agreement.
In November 2019, the Board renewed the Investment Advisory Agreement. Unless earlier terminated as described below, the Investment Advisory Agreement will remain in effect until November 2020, and may be extended subject to required approvals. The Investment Advisory Agreement will automatically terminate in the event of an assignment and may be terminated by either party without penalty on 60 days’ written notice to the other party.
From time to time, the Adviser may pay amounts owed by the Company to third-party providers of goods or services, including the Board, and the Company will subsequently reimburse the Adviser for such amounts paid on its behalf. Amounts payable to the Adviser are settled in the normal course of business without formal payment terms.
4. Investments at Fair Value
Under the 1940 Act, the Company is required to separately identify non-controlled investments where it owns 5% or more of a portfolio company’s outstanding voting securities as investments in “affiliated” companies. In addition, under the 1940 Act, the Company is required to separately identify investments where it owns more than 25% of a portfolio company’s outstanding voting securities and/or had the power to exercise control over the management or policies of such portfolio company as investments in “controlled” companies. Detailed information with respect to the Company’s non-controlled, non-affiliated; non-controlled, affiliated; and controlled affiliated investments is contained in the accompanying consolidated financial statements, including the consolidated schedules of investments. The information in the tables below is presented on an aggregate portfolio basis, without regard to whether they are non-controlled, non-affiliated; non-controlled, affiliated; or controlled, affiliated investments.
Investments consisted of the following at December 31, 2019 and 2018:
|
|
|
December 31, 2019 |
|
|||||||||
|
|
|
Amortized Cost (1) |
|
|
Fair Value |
|
|
Net Unrealized Gain (Loss) |
|
|||
|
First-lien debt investments |
|
$ |
2,134,071 |
|
|
$ |
2,166,207 |
|
|
$ |
32,136 |
|
|
Second-lien debt investments |
|
|
13,907 |
|
|
|
14,058 |
|
|
|
151 |
|
|
Mezzanine debt investments |
|
|
2,500 |
|
|
|
2,550 |
|
|
|
50 |
|
|
Equity and other investments |
|
|
87,559 |
|
|
|
63,113 |
|
|
|
(24,446 |
) |
|
Total Investments |
|
$ |
2,238,037 |
|
|
$ |
2,245,928 |
|
|
$ |
7,891 |
|
|
|
|
December 31, 2018 |
|
|||||||||
|
|
|
Amortized Cost (1) |
|
|
Fair Value |
|
|
Net Unrealized Gain (Loss) |
|
|||
|
First-lien debt investments |
|
$ |
1,642,015 |
|
|
$ |
1,653,907 |
|
|
$ |
11,892 |
|
|
Second-lien debt investments |
|
|
4,128 |
|
|
|
4,137 |
|
|
|
9 |
|
|
Mezzanine debt investments |
|
|
2,500 |
|
|
|
2,481 |
|
|
|
(19 |
) |
|
Equity and other investments |
|
|
67,757 |
|
|
|
45,444 |
|
|
|
(22,313 |
) |
|
Total Investments |
|
$ |
1,716,400 |
|
|
$ |
1,705,969 |
|
|
$ |
(10,431 |
) |
|
(1) |
The amortized cost represents the original cost adjusted for the amortization of discounts or premiums, as applicable, on debt investments using the effective interest method. |
F-26
The industry composition of Investments at fair value at December 31, 2019 and 2018 is as follows:
|
|
|
December 31, 2019 |
|
|
December 31, 2018 |
|
||
|
Beverage, food and tobacco |
|
|
2.2 |
% |
|
|
2.7 |
% |
|
Business services |
|
|
16.8 |
% |
|
|
19.3 |
% |
|
Chemicals |
|
|
0.3 |
% |
|
|
0.7 |
% |
|
Communications |
|
|
1.5 |
% |
|
— |
|
|
|
Education |
|
|
9.2 |
% |
|
|
9.4 |
% |
|
Electronics |
|
|
0.1 |
% |
|
— |
|
|
|
Financial services |
|
|
13.7 |
% |
|
|
19.2 |
% |
|
Healthcare |
|
|
9.4 |
% |
|
|
8.2 |
% |
|
Hotel, gaming and leisure |
|
|
1.6 |
% |
|
|
2.0 |
% |
|
Human resource support services |
|
|
8.2 |
% |
|
|
3.1 |
% |
|
Insurance |
|
|
2.3 |
% |
|
|
6.6 |
% |
|
Internet services |
|
|
4.8 |
% |
|
|
5.3 |
% |
|
Manufacturing |
|
— |
|
|
|
1.2 |
% |
|
|
Marketing services |
|
|
2.0 |
% |
|
|
2.3 |
% |
|
Office products |
|
|
0.5 |
% |
|
|
0.8 |
% |
|
Oil, gas and consumable fuels |
|
|
4.2 |
% |
|
|
2.3 |
% |
|
Pharmaceuticals |
|
|
3.4 |
% |
|
|
6.4 |
% |
|
Real Estate |
|
|
0.9 |
% |
|
— |
|
|
|
Retail and consumer products |
|
|
14.9 |
% |
|
|
5.6 |
% |
|
Transportation |
|
|
4.0 |
% |
|
|
4.9 |
% |
|
Total |
|
|
100.0 |
% |
|
|
100.0 |
% |
The geographic composition of Investments at fair value at December 31, 2019 and 2018 is as follows:
|
|
|
December 31, 2019 |
|
|
December 31, 2018 |
|
||
|
United States |
|
|
|
|
|
|
|
|
|
Midwest |
|
|
16.9 |
% |
|
|
12.0 |
% |
|
Northeast |
|
|
15.8 |
% |
|
|
23.5 |
% |
|
South |
|
|
19.2 |
% |
|
|
19.6 |
% |
|
West |
|
|
38.8 |
% |
|
|
40.2 |
% |
|
Australia |
|
|
1.6 |
% |
|
|
2.0 |
% |
|
Bermuda |
|
|
1.7 |
% |
|
|
— |
|
|
Canada |
|
|
6.0 |
% |
|
|
2.7 |
% |
|
Total |
|
|
100.0 |
% |
|
|
100.0 |
% |
5. Derivatives
Interest Rate Swaps
In January 2015, in connection with its 2019 Convertible Notes, the Company entered into two interest rate swap transactions, each with a $57.5 million notional amount. The Company received fixed rate interest at 4.50% and paid variable rate interest based on the three-month London Interbank Offered Rate (“LIBOR”) plus 2.86%. The swap transactions matured on December 15, 2019, matching the maturity date of the 2019 Convertible Notes.
In February 2017, in connection with the issuance of the 2022 Convertible Notes, the Company entered into an interest rate swap transaction with a $115 million notional amount. The Company receives fixed rate interest at 4.50% and pays variable rate interest based on the three-month LIBOR plus 2.37%. The swap transaction matures on August 1, 2022, matching the maturity date of the 2022 Convertible Notes.
In January 2018, in connection with the issuance of the 2023 Notes, the Company entered into an interest rate swap transaction with a $150.0 million notional amount. The Company receives fixed rate interest at 4.50% and pays variable rate interest based on three-month LIBOR plus 1.99%. The swap transaction matures on January 22, 2023, matching the maturity of the 2023 Notes.
F-27
In June 2018, in connection with the reopening and issuance of additional 2022 Convertible Notes, the Company entered into two interest rate swap transactions with notional amounts of $50.0 million and $7.5 million, respectively. The Company receives fixed rate interest on each swap at 4.50%, and pays variable rate interest based on three-month LIBOR plus 1.59%, and 1.60%, respectively. The swap transactions mature on August 1, 2022, matching the maturity date of the 2022 Convertible Notes.
In June 2019, upon maturity of the original swap transaction on an existing fixed rate investment, the Company entered into an interest rate swap transaction with a $91.5 million notional amount. The Company receives three-month LIBOR and pays fixed rate interest at 1.97%. The swap transaction matures on June 25, 2020, matching the current expected repayment date of the investment.
In August 2019, in connection with two fixed rate investments, the Company entered into two interest rate swap transactions with notional amounts of $11.7 million and $3.2 million, respectively. The Company receives three-month LIBOR and pays fixed rate interest at 1.47% and 1.36%, respectively. The swap transactions mature on July 30, 2021 and July 29, 2022, respectively, matching the current expected repayment dates of each investment.
In September 2019, in connection with the repayment of a fixed rate investment, the Company closed out of a $33.3 million notional amount interest rate swap transaction resulting in a realized gain of less than $0.1 million.
In November 2019, in connection with the issuance of the 2024 Notes, the Company entered into an interest rate swap transaction with a $300.0 million notional amount. The Company receives fixed rate interest at 3.88% and pays variable rate interest based on three-month LIBOR plus 2.25%. The swap transaction matures on November 1, 2024, matching the maturity date of the 2024 Notes. The Company designated this interest rate swap as the hedging instrument in a hedge accounting relationship with the 2024 Notes.
The following tables present the amounts paid and received on the Company’s interest rate swap transactions for the year ended December 31, 2019 and 2018:
|
|
|
|
|
|
|
|
|
For the Year Ended December 31, 2019 |
|
|||||||||
|
|
|
Maturity Date |
|
Notional Amount |
|
|
Paid |
|
|
Received |
|
|
Net |
|
||||
|
Interest rate swap (1)(2) |
|
6/27/2019 |
|
$ |
91,500 |
|
|
$ |
(1,233 |
) |
|
$ |
1,256 |
|
|
$ |
23 |
|
|
Interest rate swap (2) |
|
12/15/2019 |
|
|
115,000 |
|
|
|
(6,210 |
) |
|
|
5,175 |
|
|
|
(1,035 |
) |
|
Interest rate swap (2) |
|
1/10/2020 |
|
|
33,333 |
|
|
|
(2,094 |
) |
|
|
2,339 |
|
|
|
245 |
|
|
Interest rate swap (1) |
|
6/25/2020 |
|
|
91,500 |
|
|
|
(907 |
) |
|
|
1,027 |
|
|
|
120 |
|
|
Interest rate swap (1) |
|
7/30/2021 |
|
|
11,700 |
|
|
|
(58 |
) |
|
|
83 |
|
|
|
25 |
|
|
Interest rate swap (1) |
|
7/29/2022 |
|
|
3,200 |
|
|
|
(15 |
) |
|
|
24 |
|
|
|
9 |
|
|
Interest rate swap |
|
8/1/2022 |
|
|
115,000 |
|
|
|
(5,613 |
) |
|
|
5,175 |
|
|
|
(438 |
) |
|
Interest rate swap |
|
8/1/2022 |
|
|
50,000 |
|
|
|
(2,047 |
) |
|
|
2,250 |
|
|
|
203 |
|
|
Interest rate swap |
|
8/1/2022 |
|
|
7,500 |
|
|
|
(308 |
) |
|
|
338 |
|
|
|
30 |
|
|
Interest rate swap |
|
1/22/2023 |
|
|
150,000 |
|
|
|
(6,749 |
) |
|
|
6,750 |
|
|
|
1 |
|
|
Interest rate swap |
|
11/1/2024 |
|
|
300,000 |
|
|
|
(1,876 |
) |
|
|
1,744 |
|
|
|
(132 |
) |
|
Total |
|
|
|
$ |
968,733 |
|
|
$ |
(27,110 |
) |
|
$ |
26,161 |
|
|
$ |
(949 |
) |
|
(1) |
The notional amount of certain interest rate swaps may be more or less than the Company’s investment in individual portfolio companies as a result of arrangements with other lenders in the syndicate, amortization, or interest income paid-in-kind. |
|
(2) |
As of December 31, 2019 these interest rate swaps had either matured or been terminated due to repayment of the underlying investment or security. |
F-28
|
|
|
|
|
|
|
|
|
For the Year Ended December 31, 2018 |
|
|||||||||
|
|
|
Maturity Date |
|
Notional Amount |
|
|
Paid |
|
|
Received |
|
|
Net |
|
||||
|
Interest rate swap (1)(2) |
|
10/5/2018 |
|
$ |
92,500 |
|
|
$ |
(1,062 |
) |
|
$ |
1,742 |
|
|
$ |
680 |
|
|
Interest rate swap (1) |
|
6/27/2019 |
|
|
91,500 |
|
|
|
(562 |
) |
|
|
502 |
|
|
|
(60 |
) |
|
Interest rate swap |
|
12/15/2019 |
|
|
115,000 |
|
|
|
(5,815 |
) |
|
|
5,175 |
|
|
|
(640 |
) |
|
Interest rate swap |
|
1/10/2020 |
|
|
33,333 |
|
|
|
(2,792 |
) |
|
|
2,974 |
|
|
|
182 |
|
|
Interest rate swap |
|
8/1/2022 |
|
|
115,000 |
|
|
|
(5,339 |
) |
|
|
5,175 |
|
|
|
(164 |
) |
|
Interest rate swap |
|
8/1/2022 |
|
|
50,000 |
|
|
|
(1,065 |
) |
|
|
1,188 |
|
|
|
123 |
|
|
Interest rate swap |
|
8/1/2022 |
|
|
7,500 |
|
|
|
(153 |
) |
|
|
169 |
|
|
|
16 |
|
|
Interest rate swap |
|
1/22/2023 |
|
|
150,000 |
|
|
|
(6,008 |
) |
|
|
6,319 |
|
|
|
311 |
|
|
Total |
|
|
|
$ |
654,833 |
|
|
$ |
(22,796 |
) |
|
$ |
23,244 |
|
|
$ |
448 |
|
|
(1) |
The notional amount of certain interest rate swaps may be more or less than the Company’s investment in individual portfolio companies as a result of arrangements with other lenders in the syndicate, amortization, or interest income paid-in-kind. |
|
(2) |
As of December 31, 2018 these interest rate swaps had either matured or been terminated due to repayment of the underlying investment or security. |
For the years ended December 31, 2019 and 2018, the Company recognized $9.2 million in unrealized gains and $1.7 million in unrealized losses, respectively, in net change in unrealized gains/(losses) on interest rate swaps in the consolidated statement of operations related to the swap transactions. As of December 31, 2019, the swap transactions had a fair value of $4.7 million which is netted against cash collateral on the Company’s consolidated balance sheet. As of December 31, 2018, the swap transactions had a fair value of ($2.7) million which is netted against restricted cash collateral on the Company’s consolidated balance sheet.
The Company is required under the terms of its derivatives agreements to pledge assets as collateral to secure its obligations under the derivatives. The amount of collateral required varies over time based on the mark-to-market value, notional amount and remaining term of the derivatives, and may exceed the amount owed by the Company on a mark-to-market basis. Any failure by the Company to fulfill any collateral requirement (e.g., a so-called “margin call”) may result in a default. In the event of a default by a counterparty, the Company would be an unsecured creditor to the extent of any such overcollateralization.
As of December 31, 2019, $9.3 million of cash is pledged as collateral under the Company’s derivative instruments and is included in restricted cash as a component of cash and cash equivalents on the Company’s consolidated balance sheet. The Company had $10.0 million of cash collateral posted as of December 31, 2018, of which $7.3 million is included in restricted cash as a component of cash and cash equivalents on the Company’s consolidated balance sheet.
The Company may enter into other derivative instruments and incur other exposures with the same or other counterparties in the future.
6. Fair Value of Financial Instruments
Investments
The following tables present fair value measurements of investments as of December 31, 2019 and 2018:
|
|
|
Fair Value Hierarchy at December 31, 2019 |
|
|||||||||||||
|
|
|
Level 1 |
|
|
Level 2 |
|
|
Level 3 |
|
|
Total |
|
||||
|
First-lien debt investments |
|
$ |
— |
|
|
$ |
7,280 |
|
|
$ |
2,158,927 |
|
|
$ |
2,166,207 |
|
|
Second-lien debt investments |
|
|
— |
|
|
|
9,911 |
|
|
|
4,147 |
|
|
|
14,058 |
|
|
Mezzanine debt investments |
|
|
— |
|
|
|
— |
|
|
|
2,550 |
|
|
|
2,550 |
|
|
Equity and other investments |
|
|
6 |
|
|
|
— |
|
|
|
63,107 |
|
|
|
63,113 |
|
|
Total investments at fair value |
|
$ |
6 |
|
|
$ |
17,191 |
|
|
$ |
2,228,731 |
|
|
$ |
2,245,928 |
|
|
Interest rate swaps |
|
|
— |
|
|
|
4,744 |
|
|
|
— |
|
|
|
4,744 |
|
|
Total |
|
$ |
6 |
|
|
$ |
21,935 |
|
|
$ |
2,228,731 |
|
|
$ |
2,250,672 |
|
F-29
|
|
|
Fair Value Hierarchy at December 31, 2018 |
|
|||||||||||||
|
|
|
Level 1 |
|
|
Level 2 |
|
|
Level 3 |
|
|
Total |
|
||||
|
First-lien debt investments |
|
$ |
— |
|
|
$ |
25,870 |
|
|
$ |
1,628,037 |
|
|
$ |
1,653,907 |
|
|
Second-lien debt investments |
|
|
— |
|
|
|
— |
|
|
|
4,137 |
|
|
|
4,137 |
|
|
Mezzanine debt investments |
|
|
— |
|
|
|
— |
|
|
|
2,481 |
|
|
|
2,481 |
|
|
Equity and other investments |
|
|
2,210 |
|
|
|
— |
|
|
|
43,234 |
|
|
|
45,444 |
|
|
Total investments at fair value |
|
$ |
2,210 |
|
|
$ |
25,870 |
|
|
$ |
1,677,889 |
|
|
$ |
1,705,969 |
|
|
Interest rate swaps |
|
|
— |
|
|
|
(2,663 |
) |
|
|
— |
|
|
|
(2,663 |
) |
|
Total |
|
$ |
2,210 |
|
|
$ |
23,207 |
|
|
$ |
1,677,889 |
|
|
$ |
1,703,306 |
|
Transfers between levels, if any, are recognized at the beginning of the quarter in which the transfers occur.
The following tables present the changes in the fair value of investments for which Level 3 inputs were used to determine the fair value as of and for the year ended December 31, 2019 and 2018:
|
|
|
As of and for the Year Ended |
|
|||||||||||||||||
|
|
|
December 31, 2019 |
|
|||||||||||||||||
|
|
|
First-lien debt investments |
|
|
Second-lien debt investments |
|
|
Mezzanine debt investments |
|
|
Equity and other investments |
|
|
Total |
|
|||||
|
Balance, beginning of period |
|
$ |
1,628,037 |
|
|
$ |
4,137 |
|
|
$ |
2,481 |
|
|
$ |
43,234 |
|
|
$ |
1,677,889 |
|
|
Purchases or originations |
|
|
1,076,667 |
|
|
|
806 |
|
|
|
— |
|
|
|
20,415 |
|
|
|
1,097,888 |
|
|
Repayments / redemptions |
|
|
(578,764 |
) |
|
|
(796 |
) |
|
|
— |
|
|
|
(10,238 |
) |
|
|
(589,798 |
) |
|
Paid-in-kind interest |
|
|
7,468 |
|
|
|
— |
|
|
|
— |
|
|
|
— |
|
|
|
7,468 |
|
|
Net change in unrealized gains (losses) |
|
|
20,752 |
|
|
|
(8 |
) |
|
|
69 |
|
|
|
(1,389 |
) |
|
|
19,424 |
|
|
Net realized gains (losses) |
|
|
(4,617 |
) |
|
|
— |
|
|
|
— |
|
|
|
4,392 |
|
|
|
(225 |
) |
|
Net amortization of discount on securities |
|
|
16,077 |
|
|
|
8 |
|
|
|
— |
|
|
|
— |
|
|
|
16,085 |
|
|
Transfers within Level 3 |
|
|
(6,693 |
) |
|
|
— |
|
|
|
— |
|
|
|
6,693 |
|
|
|
— |
|
|
Transfers into (out of) Level 3 |
|
|
— |
|
|
|
— |
|
|
|
— |
|
|
|
— |
|
|
|
— |
|
|
Balance, End of Period |
|
$ |
2,158,927 |
|
|
$ |
4,147 |
|
|
$ |
2,550 |
|
|
$ |
63,107 |
|
|
$ |
2,228,731 |
|
|
|
|
As of and for the Year Ended |
|
|||||||||||||||||
|
|
|
December 31, 2018 |
|
|||||||||||||||||
|
|
|
First-lien debt investments |
|
|
Second-lien debt investments |
|
|
Mezzanine debt investments |
|
|
Equity and other investments |
|
|
Total |
|
|||||
|
Balance, beginning of period |
|
$ |
1,563,972 |
|
|
$ |
60,900 |
|
|
$ |
— |
|
|
$ |
38,322 |
|
|
$ |
1,663,194 |
|
|
Purchases or originations |
|
|
808,032 |
|
|
|
788 |
|
|
|
2,500 |
|
|
|
13,625 |
|
|
|
824,945 |
|
|
Repayments / redemptions |
|
|
(726,497 |
) |
|
|
(59,621 |
) |
|
|
— |
|
|
|
(17,213 |
) |
|
|
(803,331 |
) |
|
Paid-in-kind interest |
|
|
6,251 |
|
|
|
— |
|
|
|
— |
|
|
|
— |
|
|
|
6,251 |
|
|
Net change in unrealized gains (losses) |
|
|
(8,462 |
) |
|
|
2,070 |
|
|
|
(19 |
) |
|
|
(12,796 |
) |
|
|
(19,207 |
) |
|
Net realized gains (losses) |
|
|
(20,043 |
) |
|
|
— |
|
|
|
— |
|
|
|
2,918 |
|
|
|
(17,125 |
) |
|
Net amortization of discount on securities |
|
|
23,162 |
|
|
|
— |
|
|
|
— |
|
|
|
— |
|
|
|
23,162 |
|
|
Transfers within Level 3 |
|
|
(18,378 |
) |
|
|
— |
|
|
|
— |
|
|
|
18,378 |
|
|
|
— |
|
|
Transfers into (out of) Level 3 |
|
|
— |
|
|
|
— |
|
|
|
— |
|
|
|
— |
|
|
|
— |
|
|
Balance, End of Period |
|
$ |
1,628,037 |
|
|
$ |
4,137 |
|
|
$ |
2,481 |
|
|
$ |
43,234 |
|
|
$ |
1,677,889 |
|
F-30
The following table presents information with respect to net change in unrealized gains or losses on investments for which Level 3 inputs were used in determining fair value that are still held by the Company at December 31, 2019 and 2018:
|
|
|
Net Change in Unrealized |
|
|
Net Change in Unrealized |
|
||
|
|
|
Gains or (Losses) |
|
|
Gains or (Losses) |
|
||
|
|
|
for the Year Ended |
|
|
for the Year Ended |
|
||
|
|
|
December 31, 2019 on |
|
|
December 31, 2018 on |
|
||
|
|
|
Investments Held at |
|
|
Investments Held at |
|
||
|
|
|
December 31, 2019 |
|
|
December 31, 2018 |
|
||
|
First-lien debt investments |
|
$ |
26,258 |
|
|
$ |
(2,139 |
) |
|
Second-lien debt investments |
|
|
(8 |
) |
|
|
(17 |
) |
|
Mezzanine debt investments |
|
|
69 |
|
|
|
(19 |
) |
|
Equity and other investments |
|
|
1,322 |
|
|
|
(10,448 |
) |
|
Total |
|
$ |
27,641 |
|
|
$ |
(12,623 |
) |
The following tables present the fair value of Level 3 Investments and the significant unobservable inputs used in the valuations as of December 31, 2019 and 2018. The tables are not intended to be all-inclusive, but instead capture the significant unobservable inputs relevant to the Company’s determination of fair values.
|
|
|
December 31, 2019 |
||||||||||
|
|
|
|
|
|
|
Valuation |
|
Unobservable |
|
Range (Weighted |
|
Impact to Valuation from an |
|
|
|
Fair Value |
|
|
Technique |
|
Input |
|
Average) |
|
Increase to Input |
|
|
First-lien debt investments |
|
$ |
2,158,927 |
|
|
Income approach (1) |
|
Discount rate |
|
5.5% — 17.9% (10.0%) |
|
Decrease |
|
Second-lien debt investments |
|
|
4,147 |
|
|
Income approach |
|
Discount rate |
|
14.9% — 14.9% (14.9%) |
|
Decrease |
|
Mezzanine debt investments |
|
|
2,550 |
|
|
Income approach |
|
Discount rate |
|
16.4% — 16.4% (16.4%) |
|
Decrease |
|
Equity and other investments |
|
|
63,107 |
|
|
Market Multiple (2) |
|
Comparable multiple |
|
3.0x — 14.5x (11.3x) |
|
Increase |
|
Total |
|
$ |
2,228,731 |
|
|
|
|
|
|
|
|
|
|
(1) |
Includes $32.2 million of first-lien debt investments which, due to the proximity of the transactions relative to the measurement date, were valued using the cost of the investments. |
|
(2) |
Includes $5.7 million of equity investments which were valued using a weighted valuation approach and $16.6 million of equity investments which, due to the proximity of the transactions relative to the measurement date, were valued using the cost of the investments. |
|
|
|
December 31, 2018 |
||||||||||
|
|
|
|
|
|
|
Valuation |
|
Unobservable |
|
Range (Weighted |
|
Impact to Valuation from an |
|
|
|
Fair Value |
|
|
Technique |
|
Input |
|
Average) |
|
Increase to Input |
|
|
First-lien debt investments |
|
$ |
1,628,037 |
|
|
Income approach (1) |
|
Discount rate |
|
6.8% — 15.8% (11.8%) |
|
Decrease |
|
Second-lien debt investments |
|
|
4,137 |
|
|
Income approach (2) |
|
Discount rate |
|
15.8% — 15.8% (15.8%) |
|
Decrease |
|
Mezzanine debt investments |
|
|
2,481 |
|
|
Income approach |
|
Discount rate |
|
16.4% — 16.4% (16.4%) |
|
Decrease |
|
Equity and other investments |
|
|
43,234 |
|
|
Market Multiple (3) |
|
Comparable multiple |
|
3.0x — 13.2x (10.6x) |
|
Increase |
|
Total |
|
$ |
1,677,889 |
|
|
|
|
|
|
|
|
|
|
(1) |
Includes $19.7 million of first-lien debt investments which, due to the proximity of the transactions relative to the measurement date, were valued using the cost of the investments. |
|
(2) |
Includes $0.8 million of second-lien debt investments which, due to the proximity of the transactions relative to the measurement date, were valued using the cost of the investments. |
|
(3) |
Includes $9.5 million of equity investments which were valued using a weighted valuation approach and $4.2 million of equity investments which, due to the proximity of the transactions relative to the measurement date, were valued using the cost of the investments. |
F-31
The Company typically determines the fair value of its performing Level 3 debt investments utilizing a yield analysis. In a yield analysis, a price is ascribed for each investment based upon an assessment of current and expected market yields for similar investments and risk profiles. Additional consideration is given to the expected life, portfolio company performance since close, and other terms and risks associated with an investment. Among other factors, a determinant of risk is the amount of leverage used by the portfolio company relative to the total enterprise value of the company, and the rights and remedies of our investment within each portfolio company’s capital structure.
Significant unobservable quantitative inputs typically considered in the fair value measurement of the Company’s Level 3 debt investments primarily include current market yields, including relevant market indices, but may also include quotes from brokers, dealers, and pricing services as indicated by comparable investments. If debt investments are credit impaired, an enterprise value analysis may be used to value such debt investments; however, in addition to the methods outlined above, other methods such as a liquidation or wind-down analysis may be utilized to estimate enterprise value. For the Company’s Level 3 equity investments, multiples of similar companies’ revenues, earnings before income taxes, depreciation and amortization (“EBITDA”) or some combination thereof and comparable market transactions are typically used.
Financial Instruments Not Carried at Fair Value
Debt
The fair value of the Company’s Revolving Credit Facility, which is categorized as Level 3 within the fair value hierarchy, as of December 31, 2019, approximates its carrying value as the outstanding balance is callable at carrying value. The fair value of the Company’s 2022 Convertible Notes, 2023 Notes and 2024 Notes, which are categorized as Level 2 within the fair value hierarchy, as of December 31, 2019, was $640.1 million, based on broker quotes received by the Company. The aggregate principal amount of the Company’s 2022 Convertible Notes, 2023 Notes and 2024 Notes, as of December 31, 2019, was $622.5 million. The fair value of the Company’s Convertible Notes and 2023 Notes, as of December 31, 2018, was $428.9 million, based on broker quotes received by the Company. The aggregate principal amount of the Company’s Convertible Notes and 2023 Notes, as of December 31, 2018, was $437.5 million.
Other Financial Assets and Liabilities
The carrying amounts of the Company’s assets and liabilities, other than investments at fair value and the Convertible Notes, 2023 Notes and 2024 Notes, approximate fair value due to their short maturities or their close proximity of the originations to the measurement date. Under the fair value hierarchy, cash and cash equivalents are classified as Level 1 while the Company’s other assets and liabilities, other than investments at fair value and Revolving Credit Facility, are classified as Level 2.
7. Debt
In accordance with the 1940 Act, with certain limitations, the Company is allowed to borrow amounts such that its asset coverage, as defined in the 1940 Act, is at least 150% after such borrowing. As of December 31, 2019 and 2018, the Company’s asset coverage was 200.4% and 270.5%, respectively.
On October 8, 2018, the Company’s stockholders approved the application of the minimum asset coverage ratio of 150% to the Company, as set forth in Section 61(a)(2) of the 1940 Act, as amended by the Small Business Credit Availability Act (the “SBCAA”). As a result and subject to certain additional disclosure requirements, as of October 9, 2018, the Company’s minimum asset coverage ratio was reduced from 200% to 150%. In other words, pursuant to Section 61(a) of the 1940 Act, as amended by the SBCAA, the Company is permitted to potentially increase its maximum debt-to-equity ratio from an effective level of one-to-one to two-to-one.
Debt obligations consisted of the following as of December 31, 2019 and 2018:
|
|
|
December 31, 2019 |
|
|||||||||||||
|
|
|
Aggregate Principal Amount Committed |
|
|
Outstanding Principal |
|
|
Amount Available (1) |
|
|
Carrying Value (2)(3) |
|
||||
|
Revolving Credit Facility |
|
$ |
1,245,000 |
|
|
$ |
495,689 |
|
|
$ |
749,311 |
|
|
$ |
485,711 |
|
|
2022 Convertible Notes |
|
|
172,500 |
|
|
|
172,500 |
|
|
|
— |
|
|
|
169,420 |
|
|
2023 Notes |
|
|
150,000 |
|
|
|
150,000 |
|
|
|
— |
|
|
|
147,998 |
|
|
2024 Notes |
|
|
300,000 |
|
|
|
300,000 |
|
|
|
— |
|
|
|
291,338 |
|
|
Total Debt |
|
$ |
1,867,500 |
|
|
$ |
1,118,189 |
|
|
$ |
749,311 |
|
|
$ |
1,094,467 |
|
|
(1) |
The amount available may be subject to limitations related to the borrowing base under the Revolving Credit Facility and asset coverage requirements. |
F-32
|
(3) |
The carrying value of the 2024 Notes is presented net of $1.8 million, which represents a change in the carrying value of the 2024 Notes resulting from a hedge accounting relationship. |
|
|
|
December 31, 2018 |
|
|||||||||||||
|
|
|
Aggregate Principal Amount Committed |
|
|
Outstanding Principal |
|
|
Amount Available (1) |
|
|
Carrying Value (2) |
|
||||
|
Revolving Credit Facility |
|
$ |
940,000 |
|
|
$ |
187,543 |
|
|
$ |
752,457 |
|
|
$ |
178,807 |
|
|
2019 Convertible Notes |
|
|
115,000 |
|
|
|
115,000 |
|
|
|
— |
|
|
|
113,606 |
|
|
2022 Convertible Notes |
|
|
172,500 |
|
|
|
172,500 |
|
|
|
— |
|
|
|
168,251 |
|
|
2023 Notes |
|
|
150,000 |
|
|
|
150,000 |
|
|
|
— |
|
|
|
147,343 |
|
|
Total Debt |
|
$ |
1,377,500 |
|
|
$ |
625,043 |
|
|
$ |
752,457 |
|
|
$ |
608,007 |
|
|
(1) |
The amount available may be subject to limitations related to the borrowing base under the Revolving Credit Facility and asset coverage requirements. |
|
(2) |
The carrying values of the Revolving Credit Facility, Convertible Notes, and 2023 Notes are presented net of deferred financing costs and original issue discounts of $8.7 million, $5.6 million and $2.7 million, respectively. |
For the years ended December 31, 2019, 2018 and 2017, the components of interest expense were as follows:
|
|
|
Year Ended |
|
|
Year Ended |
|
|
Year Ended |
|
|||
|
|
|
December 31, 2019 |
|
|
December 31, 2018 |
|
|
December 31, 2017 |
|
|||
|
Interest expense |
|
$ |
39,097 |
|
|
$ |
35,713 |
|
|
$ |
22,933 |
|
|
Commitment fees |
|
|
2,890 |
|
|
|
1,790 |
|
|
|
2,041 |
|
|
Amortization of deferred financing costs |
|
|
4,784 |
|
|
|
4,051 |
|
|
|
3,172 |
|
|
Accretion of original issue discount |
|
|
968 |
|
|
|
851 |
|
|
|
674 |
|
|
Swap settlements |
|
|
1,371 |
|
|
|
356 |
|
|
|
(1,379 |
) |
|
Total Interest Expense |
|
$ |
49,110 |
|
|
$ |
42,761 |
|
|
$ |
27,441 |
|
|
Average debt outstanding (in millions) |
|
$ |
913.4 |
|
|
$ |
874.3 |
|
|
$ |
645.1 |
|
|
Weighted average interest rate |
|
|
4.4 |
% |
|
|
4.1 |
% |
|
|
3.3 |
% |
|
Average 1-month LIBOR rate |
|
|
2.2 |
% |
|
|
2.0 |
% |
|
|
1.1 |
% |
Revolving Credit Facility
On August 23, 2012, the Company entered into a senior secured revolving credit agreement with Truist Bank (as a successor by merger to SunTrust Bank), as administrative agent, and J.P. Morgan Chase Bank, N.A., as syndication agent, and certain other lenders (as amended and restated, the “Revolving Credit Facility”).
As of December 31 2019, aggregate commitments under the facility were $1,245 million. Pursuant to an amendment to the Revolving Credit Facility dated as of January 31, 2020 (the “Ninth Amendment”), the aggregate commitments under the facility were increased to $1,315 million. The facility includes an uncommitted accordion feature that allows the Company, under certain circumstances, to increase the size of the facility to up to $1,750 million.
Pursuant to the Ninth Amendment, the revolving period, during which period the Company, subject to certain conditions, may make borrowings under the facility, was extended from February 14, 2023 to January 31, 2024 and the stated maturity date was extended from February 14, 2024 to January 31, 2025.
The Company may borrow amounts in U.S. dollars or certain other permitted currencies. As of December 31, 2019, the Company had outstanding debt denominated in Australian dollars (AUD) of 52.5 million, Canadian dollars (CAD) of 131.4 million, and Euro (EUR) of 7.6 million on its Revolving Credit Facility, included in the Outstanding Principal amount in the table above.
The Revolving Credit Facility also provides for the issuance of letters of credit up to an aggregate amount of $75 million. As of December 31, 2019 and December 31, 2018, the Company had no outstanding letters of credit issued through the Revolving Credit Facility. The amount available for borrowing under the Revolving Credit Facility is reduced by any letters of credit issued through the Revolving Credit Facility.
F-33
Amounts drawn under the Revolving Credit Facility, including amounts drawn in respect of letters of credit, bear interest at either LIBOR plus a margin of either 1.75% or 1.875%, or the base rate plus a margin of either 0.75% or 0.875%, in each case, based on the total amount of the borrowing base relative to the sum of the total commitments (or, if greater, the total exposure) under the Revolving Credit Facility plus certain other designated secured debt. The Company may elect either the LIBOR or base rate at the time of drawdown, and loans may be converted from one rate to another at any time, subject to certain conditions. The Company also pays a fee of 0.375% on undrawn amounts and, in respect of each undrawn letter of credit, a fee and interest rate equal to the then applicable margin while the letter of credit is outstanding.
The Revolving Credit Facility is guaranteed by TPG SL SPV, LLC, TC Lending, LLC and TSL MR, LLC and may be guaranteed by certain domestic subsidiaries in the future. The Revolving Credit Facility is secured by a perfected first-priority security interest in substantially all the portfolio investments held by the Company and each guarantor. Proceeds from borrowings may be used for general corporate purposes, including the funding of portfolio investments.
The Revolving Credit Facility includes customary events of default, as well as customary covenants, including restrictions on certain distributions and financial covenants. The financial covenants require:
|
|
• |
an asset coverage ratio of no less than 1.5 to 1 on the last day of any fiscal quarter; |
|
|
• |
a liquidity test under which the Company must not maintain cash and liquid investments of less than 10% of the covered debt amount for more than 30 consecutive business days under circumstances where the Company’s adjusted covered debt balance is greater than 90% of the Company’s adjusted borrowing base under the facility; |
|
|
• |
stockholders’ equity of at least $500 million plus 25% of the net proceeds of the sale of equity interests after November 5, 2018; |
|
|
• |
a minimum asset coverage ratio of no less than 2 to 1 with respect to (i) the consolidated assets of the Company and the subsidiary guarantors (including certain limitations on the contribution of equity in financing subsidiaries) to (ii) the secured debt of the Company and its subsidiary guarantors plus unsecured senior securities of the Company and its subsidiary guarantors that mature within 90 days of the date of determination (the “Obligor Asset Coverage Ratio”); and |
|
|
• |
minimum consolidated assets of the Company and the subsidiary guarantors (including certain limitations on the contribution of equity in financing subsidiaries), less total secured debt of the Company and the subsidiary guarantors, of at least $350 million at the last day of any fiscal quarter. |
The Revolving Credit Facility also contains certain additional concentration limits in connection with the calculation of the borrowing base, based on the Obligor Asset Coverage Ratio.
Net proceeds received from the Company’s common stock issuance in March 2018 and net proceeds received from the issuance of the 2022 Convertible Notes, 2023 Notes and 2024 Notes were used to pay down borrowings on the Revolving Credit Facility.
As of December 31, 2019, the Company was in compliance with the terms of the Revolving Credit Facility.
2019 Convertible Notes
In June 2014, the Company issued in a private offering $115 million aggregate principal amount convertible notes due December 2019 (the “2019 Convertible Notes”). The 2019 Convertible Notes were issued in a private placement only to qualified institutional buyers pursuant to Rule 144A under the Securities Act. The 2019 Convertible Notes were unsecured, and bore interest at a rate of 4.50% per year, payable semiannually. The 2019 Convertible Notes matured on December 15, 2019 and were fully repaid in cash. The swap transaction associated with the issuance of the 2019 Convertible Notes also matured on December 15, 2019.
2022 Convertible Notes
In February 2017, the Company issued in a private offering $115 million aggregate principal amount convertible notes due August 2022 (the “2022 Convertible Notes” and, together with the 2019 Convertible Notes, the “Convertible Notes”). The 2022 Convertible Notes were issued in a private placement only to qualified institutional buyers pursuant to Rule 144A under the Securities Act. The 2022 Convertible Notes are unsecured, and bear interest at a rate of 4.50% per year, payable semiannually. The 2022 Convertible Notes will mature on August 1, 2022. In certain circumstances, the 2022 Convertible Notes will be convertible into cash, shares of the Company’s common stock or a combination of cash and shares of the Company’s common stock, at the Company’s election, at an initial conversion rate of 46.8516 shares of common stock per $1,000 principal amount of 2022 Convertible Notes, which is equivalent to an initial conversion price of approximately $21.34 per share of the Company’s common stock, subject to customary anti-dilution adjustments. As of December 31, 2019, the estimated adjusted conversion price was approximately $20.66 per share of common stock. The sale of the 2022 Convertible Notes generated net proceeds of approximately $111.2 million. The Company used the net proceeds of the offering to pay down debt under the Revolving Credit Facility. In connection with the offering of 2022 Convertible
F-34
Notes, the Company has entered into an interest rate swap to continue to align the interest rates of its liabilities with its investment portfolio, which consists of predominately floating rate loans. As a result of the swap, the Company’s effective interest rate on the original issuance of 2022 Convertible Notes is three-month LIBOR plus 2.37%. See Note 5 for further information related to the Company’s interest rate swaps.
In June 2018, the Company issued an additional $57.5 million aggregate principal amount of 2022 Convertible Notes. The additional 2022 Convertible Notes were issued with identical terms, and are fungible with and are part of a single series with the previously outstanding $115 million aggregate principal amount of the Company’s existing 2022 Convertible Notes issued in February 2017. In connection with the reopening of the 2022 Convertible Notes, the Company entered into interest rate swaps to continue to align the interest rates of its liabilities with its investment portfolio, which consists of predominantly floating rate loans. As a result of the additional swaps, the Company’s effective interest rate on the additional 2022 Convertible Notes is approximately three-month LIBOR plus 1.60%. See Note 5 for further information related to the Company’s interest rate swaps.
Holders may convert their 2022 Convertible Notes at their option at any time prior to February 1, 2022 only under the following circumstances: (1) during any calendar quarter commencing after the calendar quarter ending on June 30, 2017 (and only during such calendar quarter), if the last reported sale price of the common stock for at least 20 trading days (whether or not consecutive) during a period of 30 consecutive trading days ending on the last trading day of the immediately preceding calendar quarter is greater than or equal to 130% of the conversion price on each applicable trading day; (2) during the five business day period after any five consecutive trading day period (the “measurement period”) in which the trading price (as defined in the indenture governing the 2022 Convertible Notes) per $1,000 principal amount of notes for each trading day of the measurement period was less than 98% of the product of the last reported sale price of the Company’s common stock and the conversion rate on each such trading day; or (3) upon the occurrence of specified corporate events. On or after February 1, 2022 until the close of business on the scheduled trading day immediately preceding the maturity date, holders may convert their notes at any time, regardless of the occurrence or nonoccurrence of any of the foregoing circumstances.
The 2022 Convertible Notes are the Company’s unsecured obligations and rank senior in right of payment to the Company’s future indebtedness that is expressly subordinated in right of payment to the 2022 Convertible Notes; equal in right of payment to the Company’s existing and future indebtedness that is not so subordinated; effectively junior in right of payment to any of the Company’s secured indebtedness (including unsecured indebtedness that the Company later secures) to the extent of the value of the assets securing such indebtedness; and structurally junior to all existing and future indebtedness (including trade payables) incurred by the Company’s subsidiaries, financing vehicles or similar facilities.
For the years ended December 31, 2019, 2018, and 2017 the components of interest expense related to the Convertible Notes were as follows:
|
|
|
December 31, 2019 |
|
|
December 31, 2018 |
|
|
December 31, 2017 |
|
|||
|
Interest expense |
|
$ |
12,722 |
|
|
$ |
11,713 |
|
|
$ |
9,919 |
|
|
Accretion of original issue discount |
|
|
872 |
|
|
|
843 |
|
|
|
674 |
|
|
Amortization of deferred financing costs |
|
|
1,690 |
|
|
|
1,603 |
|
|
|
1,408 |
|
|
Total Interest Expense |
|
$ |
15,284 |
|
|
$ |
14,159 |
|
|
$ |
12,001 |
|
Total interest expense in the table above does not include the effect of the interest rate swaps. During the years ended December 31, 2019, 2018 and 2017, the Company received $12.9 million, $11.7 million, and $9.9 million, respectively, and paid $14.2 million, $12.4 million, and $8.5 million, respectively, related to the quarterly settlement of its interest rate swaps. These net amounts are included in interest expense in the Company’s consolidated statements of operations.
As of December 31, 2019, the principal amount of the 2022 Convertible Notes was exceeded by the value of the underlying shares multiplied by the per share closing price of the Company’s common stock. However, the conditions required for conversion prior to maturity had not been satisfied. As of December 31, 2018, the principal amount of the Convertible Notes exceeded the value of the underlying shares multiplied by the per share closing price of the Company’s common stock.
F-35
As of December 31, 2019 and December 31, 2018, the components of the carrying value of the Convertible Notes and the stated interest rate were as follows:
|
|
|
December 31, 2019 |
|
|||||
|
|
|
2019 |
|
|
2022 |
|
||
|
|
|
Convertible Notes |
|
|
Convertible Notes |
|
||
|
Principal amount of debt |
|
$ |
— |
|
|
$ |
172,500 |
|
|
Original issue discount, net of accretion |
|
— |
|
|
|
(617 |
) |
|
|
Deferred financing costs |
|
— |
|
|
|
(2,463 |
) |
|
|
Carrying value of debt |
|
$ |
— |
|
|
$ |
169,420 |
|
|
Stated interest rate |
|
— |
|
|
|
4.50 |
% |
|
|
|
|
December 31, 2018 |
|
|||||
|
|
|
2019 |
|
|
2022 |
|
||
|
|
|
Convertible Notes |
|
|
Convertible Notes |
|
||
|
Principal amount of debt |
|
$ |
115,000 |
|
|
$ |
172,500 |
|
|
Original issue discount, net of accretion |
|
|
(656 |
) |
|
|
(833 |
) |
|
Deferred financing costs |
|
|
(738 |
) |
|
|
(3,416 |
) |
|
Carrying value of debt |
|
$ |
113,606 |
|
|
$ |
168,251 |
|
|
Stated interest rate |
|
|
4.50 |
% |
|
|
4.50 |
% |
The stated interest rate in the table above does not include the effect of the interest rate swaps. The Company’s swap-adjusted interest rate was three month LIBOR plus 2.86% for the 2019 Convertible Notes, and three month LIBOR plus 2.11% (on a weighted average basis) for the 2022 Convertible Notes. Please see Note 5 for further information about the Company’s interest rate swaps.
The indenture governing the 2022 Convertible Notes contains certain covenants, including covenants requiring the Company to comply with the applicable asset coverage ratio requirement under the 1940 Act and to provide financial information to the holders of the 2022 Convertible Notes under certain circumstances. These covenants are subject to important limitations and exceptions that are described in the indenture governing the 2022 Convertible Notes. As of December 31, 2019, and 2018 the Company was in compliance with the terms of the indenture governing the 2022 Convertible Notes.
The 2022 Convertible Notes are accounted for in accordance with Accounting Standards Codification (“ASC”) 470-20. Upon conversion of any of the 2022 Convertible Notes, the Company intends to pay the outstanding principal amount in cash and, to the extent that the conversion value exceeds the principal amount, the Company has the option to pay in cash or shares of the Company’s common stock (or a combination of cash and shares) in respect of the excess amount, subject to the requirements of the indenture governing the 2022 Convertible Notes. The Company has determined that the embedded conversion options in the 2022 Convertible Notes are not required to be separately accounted for as a derivative under U.S. GAAP. In accounting for the 2022 Convertible Notes, the Company estimated at the time of issuance separate debt and equity components of the 2022 Convertible Notes. An original issue discount equal to the equity components of the 2022 Convertible Notes was recorded in “additional paid-in capital” in the accompanying consolidated balance sheet. Additionally, the issuance costs associated with the 2022 Convertible Notes were allocated to the debt and equity components in proportion to the allocation of the proceeds and accounted for as deferred financing costs and equity issuance costs, respectively.
2023 Notes
In January 2018, the Company issued $150.0 million aggregate principal amount of unsecured notes that mature on January 22, 2023 (the “2023 Notes”). The principal amount of the 2023 Notes is payable at maturity. The 2023 Notes bear interest at a rate of 4.50% per year, payable semi-annually commencing on July 22, 2018, and may be redeemed in whole or in part at the Company’s option at any time at par plus a “make whole” premium. Total proceeds from the issuance of the 2023 Notes, net of underwriting discounts and offering costs, were $146.9 million. The Company used the net proceeds of the 2023 Notes to repay outstanding indebtedness under the Revolving Credit Facility.
In connection with the 2023 Notes offering, the Company entered into an interest rate swap to continue to align the interest rates of its liabilities with the Company’s investment portfolio, which consists of predominately floating rate loans. As a result of the swap, the Company’s effective interest rate on the 2023 Notes is three-month LIBOR plus 1.99%. Please see Note 5 for further information about the Company’s interest rate swaps.
F-36
In November 2019, the Company issued $300.0 million aggregate principal amount of unsecured notes that mature on November 1, 2024 (the “2024 Notes”). The principal amount of the 2024 Notes is payable at maturity. The 2024 Notes bear interest at a rate of 3.875% per year, payable semi-annually commencing on May 1, 2020, and may be redeemed in whole or in part at our option at any time at par plus a “make whole” premium. Total proceeds from the issuance of the 2024 Notes, net of underwriting discounts and offering costs, were $295.8 million. The Company used the net proceeds of the 2024 Notes to repay outstanding indebtedness under the Revolving Credit Facility.
In connection with the 2024 Notes offering, the Company entered into an interest rate swap to continue to align the interest rates of its liabilities with the Company’s investment portfolio, which consists of predominately floating rate loans. As a result of the swap, the Company’s effective interest rate on the 2024 Notes is three-month LIBOR plus 2.25%. The interest expense related to the 2024 Notes is offset by proceeds received from the interest rate swap designated as a hedge. The swap adjusted interest expense is included as a component of interest expense on the Company’s Consolidated Statement of Operations. As of December 31, 2019 the effective hedge interest rate swap had a fair value of ($1.8) million, which is offset within interest expense by an equal, but opposite, fair value change for the hedged risk on the 2024 Notes.
On February 5, 2020, the Company issued $50.0 million aggregate principal amount of unsecured notes that mature on November 1, 2024 (the “Reopened 2024 Notes”). The Reopened 2024 Notes are a further issuance of, fungible with, rank equally in right of payment with and have the same terms (other than the issue date and the public offering price) as the initial issuance of 2024 Notes. Total proceeds from the issuance of the Reopened 2024 Notes, net of underwriting discounts and estimated offering costs, were approximately $50.1 million. The Company used the net proceeds of the 2024 Notes to repay outstanding indebtedness under the Revolving Credit Facility.
In connection with the issuance of the Reopened 2024 Notes, the Company entered into an interest rate swap to continue to align the interest rates of its liabilities with the Company’s investment portfolio, which consists of predominantly floating rate loans. As a result of the swap, the Company’s effective interest rate on the Reopened 2024 Notes is three-month LIBOR plus 2.46%.
For the years ended December 31, 2019 and 2018 the components of interest expense related to the 2023 Notes and 2024 Notes were as follows:
|
|
|
December 31, 2019 |
|
|
December 31, 2018 |
|
||
|
Interest expense |
|
$ |
8,688 |
|
|
$ |
6,356 |
|
|
Accretion of original issue discount |
|
|
96 |
|
|
|
8 |
|
|
Amortization of deferred financing costs |
|
|
781 |
|
|
|
582 |
|
|
Total Interest Expense |
|
$ |
9,565 |
|
|
$ |
6,946 |
|
Total interest expense in the table above does not include the effect of the interest rate swaps related to the 2023 Notes and 2024 Notes. During the years ended December 31, 2019 and 2018, the Company received $8.5 million and $6.3 million, respectively, and paid $8.6 million and $6.0 million, respectively, related to the settlements of its interest rate swaps related to the Notes. These net amounts are included in interest expense in the Company’s consolidated statements of operations. Please see Note 5 for further information about the Company’s interest rate swaps.
As of December 31, 2019, the components of the carrying value of the 2023 Notes and 2024 Notes and the stated interest rates were as follows:
|
|
|
December 31, 2019 |
|
|||||
|
|
|
2023 Notes |
|
|
2024 Notes |
|
||
|
Principal amount of debt |
|
$ |
150,000 |
|
|
$ |
300,000 |
|
|
Original issue discount, net of accretion |
|
|
(29 |
) |
|
|
(2,818 |
) |
|
Deferred financing costs |
|
|
(1,973 |
) |
|
|
(4,057 |
) |
|
Change in fair value of an effective hedge |
|
— |
|
|
|
(1,787 |
) |
|
|
Carrying value of debt |
|
$ |
147,998 |
|
|
$ |
291,338 |
|
|
Stated interest rate |
|
|
4.50 |
% |
|
|
3.88 |
% |
The stated interest rate in the table above does not include the effect of the interest rate swaps. The Company’s swap-adjusted interest rate on the 2023 Notes and 2024 Notes is three month LIBOR plus 1.99% and 2.25% respectively.
F-37
As of December 31, 2018, the components of the carrying value of the 2023 Notes and the stated interest rate were as follows:
|
|
|
December 31, 2018 |
|
|
|
Principal amount of debt |
|
$ |
150,000 |
|
|
Original issue discount, net of accretion |
|
|
(38 |
) |
|
Deferred financing costs |
|
|
(2,619 |
) |
|
Carrying value of debt |
|
$ |
147,343 |
|
|
Stated interest rate |
|
|
4.50 |
% |
The stated interest rate in the table above does not include the effect of the interest rate swaps. The Company’s swap-adjusted interest rate on the 2023 Notes is three month LIBOR plus 1.99%.
As of December 31, 2019 and December 31, 2018, the Company was in compliance with the terms of the indentures governing the 2023 Notes and 2024 Notes.
8. Commitments and Contingencies
Portfolio Company Commitments
From time to time, the Company may enter into commitments to fund investments; such commitments are incorporated into the Company’s assessment of its liquidity position. The Company’s senior secured revolving loan commitments are generally available on a borrower’s demand and may remain outstanding until the maturity date of the applicable loan. The Company’s senior secured term loan commitments are generally available on a borrower’s demand and, once drawn, generally have the same remaining term as the associated loan agreement. Undrawn senior secured delayed draw term loan commitments generally have a shorter availability period than the term of the associated loan agreement.
F-38
As of December 31, 2019 and December 31, 2018, the Company had the following commitments to fund investments in current portfolio companies:
|
|
|
December 31, 2019 |
|
|
December 31, 2018 |
|
||
|
Alpha Midco, Inc. - Delayed Draw |
|
$ |
19,598 |
|
|
$ |
— |
|
|
AppStar Financial, LLC - Revolver |
|
|
2,000 |
|
|
|
2,000 |
|
|
AvidXchange, Inc. - Delayed Draw |
|
|
5,108 |
|
|
— |
|
|
|
BlueSnap, Inc. - Revolver |
|
|
2,500 |
|
|
— |
|
|
|
Caris Life Sciences, Ltd. - Delayed Draw |
|
— |
|
|
|
2,500 |
|
|
|
ClearCompany, LLC - Delayed Draw |
|
|
1,400 |
|
|
|
3,000 |
|
|
Clinicient, Inc. - Revolver |
|
|
4,000 |
|
|
— |
|
|
|
DaySmart Holdings, LLC - Revolver |
|
|
5,000 |
|
|
— |
|
|
|
DaySmart Holdings, LLC - Delayed Draw |
|
|
17,503 |
|
|
— |
|
|
|
Dye & Durham Corp. - Revolver |
|
|
1,349 |
|
|
— |
|
|
|
Energy Alloys, LLC - Delayed Draw |
|
|
15,000 |
|
|
— |
|
|
|
Ferrellgas, L.P. - Revolver |
|
|
30,000 |
|
|
|
30,000 |
|
|
Frontline Technologies Group, LLC - Delayed Draw |
|
— |
|
|
|
9,377 |
|
|
|
G Treasury SS, LLC - Delayed Draw |
|
|
3,750 |
|
|
|
5,000 |
|
|
G Treasury SS, LLC - Revolver |
|
— |
|
|
|
2,000 |
|
|
|
Gainsight, Inc. - Delayed Draw |
|
|
1,785 |
|
|
— |
|
|
|
Government Brands, LLC - Revolver |
|
— |
|
|
|
5,000 |
|
|
|
Integration Appliance, Inc. - Revolver |
|
|
2,619 |
|
|
|
2,619 |
|
|
IntelePeer Holdings, Inc. - Delayed Draw |
|
|
3,500 |
|
|
— |
|
|
|
IRGSE Holding Corp. - Revolver |
|
|
2,079 |
|
|
|
3,000 |
|
|
Kyriba Corp. - Delayed Draw |
|
|
8,323 |
|
|
— |
|
|
|
Kyriba Corp. - Revolver |
|
|
1,202 |
|
|
— |
|
|
|
Lithium Technologies, LLC - Revolver |
|
|
3,959 |
|
|
|
3,959 |
|
|
Lucidworks, Inc. - Revolver |
|
|
3,333 |
|
|
— |
|
|
|
MD America Energy, LLC - Delayed Draw |
|
— |
|
|
|
15,000 |
|
|
|
Motus, LLC - Revolver |
|
— |
|
|
|
5,619 |
|
|
|
PageUp People, Ltd. - Revolver |
|
|
2,812 |
|
|
|
2,112 |
|
|
PayLease, LLC - Revolver |
|
|
3,333 |
|
|
|
3,333 |
|
|
PayScale Holdings, Inc. - Delayed Draw |
|
|
7,667 |
|
|
— |
|
|
|
PrimeRevenue, Inc. - Revolver |
|
|
6,250 |
|
|
|
6,250 |
|
|
ResMan, LLC - Delayed Draw |
|
|
3,602 |
|
|
— |
|
|
|
ResMan, LLC - Revolver |
|
|
2,000 |
|
|
— |
|
|
|
ScentAir Technologies, Inc. - Revolver |
|
— |
|
|
|
750 |
|
|
|
Sovos Compliance, LLC - Delayed Draw |
|
— |
|
|
|
545 |
|
|
|
Sovos Compliance, LLC - Revolver |
|
— |
|
|
|
1,657 |
|
|
|
TherapeuticsMD, Inc. - Delayed Draw A1 |
|
|
7,500 |
|
|
— |
|
|
|
TherapeuticsMD, Inc. - Delayed Draw A2 |
|
|
7,500 |
|
|
— |
|
|
|
Valant Medical Solutions, Inc. - Delayed Draw |
|
|
2,564 |
|
|
— |
|
|
|
Valant Medical Solutions, Inc. - Revolver |
|
|
2,000 |
|
|
— |
|
|
|
Verdad Resources Intermediate Holdings, LLC - Delayed Draw |
|
|
7,778 |
|
|
— |
|
|
|
Total Portfolio Company Commitments |
|
$ |
187,014 |
|
|
$ |
103,721 |
|
Other Commitments and Contingencies
As of December 31, 2019 and 2018, the Company did not have any unfunded commitments to fund investments to new borrowers that were not current portfolio companies as of such date.
From time to time, the Company may become a party to certain legal proceedings incidental to the normal course of its business. As of December 31, 2019 and 2018, management is not aware of any material pending or threatened litigation that would require accounting recognition or financial statement disclosure.
F-39
In March 2018, the Company issued a total of 3,750,000 shares of common stock at $17.45 per share. Net of underwriting fees and offering costs, the Company received total cash proceeds of $63.0 million. Subsequent to the offering the Company issued an additional 522,224 shares in April 2018 pursuant to the overallotment option granted to underwriters and received, net of underwriting fees, total cash proceeds of $8.8 million.
The Company has a dividend reinvestment plan, whereby the Company may buy shares of its common stock in the open market or issue new shares in order to satisfy dividend reinvestment requests. The number of shares to be issued to a stockholder is determined by dividing the total dollar amount of the cash dividend or distribution payable to a stockholder by the market price per share of the Company’s common stock at the close of regular trading on the NYSE on the payment date of a distribution, or if no sale is reported for such day, the average of the reported bid and ask prices. However, if the market price per share on the payment date of a cash dividend or distribution exceeds the most recently computed net asset value per share, the Company will issue shares at the greater of (i) the most recently computed net asset value per share and (ii) 95% of the current market price per share (or such lesser discount to the current market price per share that still exceeded the most recently computed net asset value per share). Shares purchased in open market transactions by the plan administrator will be allocated to a stockholder based on the average purchase price, excluding any brokerage charges or other charges, of all shares of common stock purchased in the open market.
Pursuant to the Company’s dividend reinvestment plan, the following tables summarize the shares issued to stockholders who have not opted out of the Company’s dividend reinvestment plan during the year ended December 31, 2019 and 2018. All shares issued to stockholders in the tables below are newly issued shares.
|
|
|
Year Ended |
|
|||||||
|
|
|
December 31, 2019 |
|
|||||||
|
|
|
|
|
|
|
Date |
|
|
|
|
|
Date Declared |
|
Dividend (1) |
|
Record Date |
|
Shares Issued |
|
Shares Issued |
|
|
|
November 6, 2018 |
|
Base |
|
December 14, 2018 |
|
January 15, 2019 |
|
|
212,818 |
|
|
February 20, 2019 |
|
Supplemental |
|
February 28, 2019 |
|
March 29, 2019 |
|
|
87,327 |
|
|
February 20, 2019 |
|
Base |
|
March 15, 2019 |
|
April 15, 2019 |
|
|
318,114 |
|
|
May 2, 2019 |
|
Supplemental |
|
May 31, 2019 |
|
June 28, 2019 |
|
|
7,214 |
|
|
May 2, 2019 |
|
Base |
|
June 14, 2019 |
|
July 15, 2019 |
|
|
232,427 |
|
|
July 31, 2019 |
|
Supplemental |
|
August 30, 2019 |
|
September 30, 2019 |
|
|
22,656 |
|
|
July 31, 2019 |
|
Base |
|
September 13, 2019 |
|
October 15, 2019 |
|
|
187,202 |
|
|
November 5, 2019 |
|
Supplemental |
|
November 29, 2019 |
|
December 31, 2019 |
|
|
44,016 |
|
|
Total Shares Issued |
|
|
|
|
|
|
|
|
1,111,774 |
|
|
|
|
Year Ended |
|
|||||||
|
|
|
December 31, 2018 |
|
|||||||
|
|
|
|
|
|
|
Date |
|
|
|
|
|
Date Declared |
|
Dividend (1) |
|
Record Date |
|
Shares Issued |
|
Shares Issued |
|
|
|
November 7, 2017 |
|
Base |
|
December 15, 2017 |
|
January 12, 2018 |
|
|
153,295 |
|
|
February 21, 2018 |
|
Supplemental |
|
February 28, 2018 |
|
March 30, 2018 |
|
|
16,455 |
|
|
February 21, 2018 |
|
Base |
|
March 15, 2018 |
|
April 13, 2018 |
|
|
198,296 |
|
|
May 3, 2018 |
|
Supplemental |
|
May 31, 2018 |
|
June 29, 2018 |
|
|
33,055 |
|
|
May 3, 2018 |
|
Base |
|
June 15, 2018 |
|
July 13, 2018 |
|
|
206,556 |
|
|
August 1, 2018 |
|
Supplemental |
|
August 31, 2018 |
|
September 28, 2018 |
|
|
41,169 |
|
|
August 1, 2018 |
|
Base |
|
September 14, 2018 |
|
October 15, 2018 |
|
|
214,573 |
|
|
November 6, 2018 |
|
Supplemental |
|
November 30, 2018 |
|
December 31, 2018 |
|
|
29,993 |
|
|
Total Shares Issued |
|
|
|
|
|
|
|
|
893,392 |
|
|
(1) |
See Note 11 for further information on base and supplemental dividends. |
On August 4, 2015, the Company's Board approved a stock repurchase plan, the Company 10b5-1 Plan, to acquire up to $50 million in the aggregate of the Company’s common stock at prices just below the Company’s net asset value per share over an initial six month period, in accordance with the guidelines specified in Rule 10b-18 and Rule 10b5-1 of the Exchange Act, and has continued to authorize extensions of the plan termination date prior to its expiration since that time.
F-40
The Company 10b5-1 Plan is designed to allow the Company to repurchase its common stock at times when it otherwise might be prevented from doing so under insider trading laws. The Company 10b5-1 Plan, as currently in effect, requires Goldman Sachs & Co. LLC, as agent, to repurchase shares of common stock on the Company’s behalf when the market price per share is just below 1.05x the most recently reported net asset value per share in the Company’s public financial statements or publicly announced by the Company, less the amount of any supplemental dividend that has been publicly announced by the Company but that has yet to be reflected in the net asset value per share most recently reported in public financial statements (including any updates, corrections or adjustments publicly announced by the Company to any such net asset value per share or supplemental dividend). Under the Company 10b5-1 Plan, the agent will increase the volume of purchases made as the price of the Company’s common stock declines, subject to volume restrictions. The timing and amount of any stock repurchases depend on the terms and conditions of the Company 10b5-1 Plan, the market price of the common stock and trading volumes, and no assurance can be given that any particular amount of common stock will be repurchased.
The purchase of shares pursuant to the Company 10b5-1 Plan is intended to satisfy the conditions of Rule 10b5-1 and Rule 10b-18 under the Exchange Act, and will otherwise be subject to applicable law, including Regulation M, which may prohibit purchases under certain circumstances.
On November 5, 2019, the Board authorized the extension of the termination date of the Company 10b5-1 Plan to May 31, 2020. Unless extended or terminated by the Board, the Company 10b5-1 Plan will be in effect through the earlier of May 31, 2020 or such time as the current approved repurchase amount of up to $50 million has been fully utilized, subject to certain conditions.
During the years ended December 31, 2019 and 2018, no shares were repurchased under the Company 10b5-1 Plan.
10. Earnings per share
The following table sets forth the computation of basic and diluted earnings per common share:
|
|
|
Year Ended |
|
|||||||||
|
|
|
December 31, 2019 |
|
|
December 31, 2018 |
|
|
December 31, 2017 |
|
|||
|
Increase in net assets resulting from operations |
|
$ |
154,583 |
|
|
$ |
119,017 |
|
|
$ |
111,609 |
|
|
Weighted average shares of common stock outstanding—basic and diluted |
|
|
66,069,305 |
|
|
|
64,028,137 |
|
|
|
59,995,387 |
|
|
Earnings per common share—basic and diluted |
|
$ |
2.34 |
|
|
$ |
1.86 |
|
|
$ |
1.86 |
|
For the purpose of calculating diluted earnings per common share, the average closing price of the Company’s common stock for the year ended December 31, 2019 was less than the conversion price for the 2022 Convertible Notes outstanding as of December 31, 2019, and the average closing price of the Company’s common stock for the years ended December 31, 2018 and 2017, was less than the conversion price for the Convertible Notes outstanding as of December 31, 2018 and 2017. Therefore, for all periods presented in the consolidated financial statements, the underlying shares for the intrinsic value of the embedded options in the Convertible Notes have no impact on the computation of diluted earnings per common share.
F-41
The Company has historically paid a dividend to stockholders on a quarterly basis. Following the completion of the quarter ended March 31, 2017, the Company introduced a dividend framework that provides for a quarterly base dividend and a variable supplemental dividend, subject to satisfaction of certain measurement tests and the approval of the Board.
The following tables summarize dividends declared during the years ended December 31, 2019, 2018 and 2017:
|
|
|
Year Ended |
|
|||||||
|
|
|
December 31, 2019 |
|
|||||||
|
Date Declared |
|
Dividend |
|
Record Date |
|
Payment Date |
|
Dividend per Share |
|
|
|
February 20, 2019 |
|
Supplemental |
|
February 28, 2019 |
|
March 29, 2019 |
|
$ |
0.12 |
|
|
February 20, 2019 |
|
Base |
|
March 15, 2019 |
|
April 15, 2019 |
|
|
0.39 |
|
|
May 2, 2019 |
|
Supplemental |
|
May 31, 2019 |
|
June 28, 2019 |
|
|
0.01 |
|
|
May 2, 2019 |
|
Base |
|
June 14, 2019 |
|
July 15, 2019 |
|
|
0.39 |
|
|
July 31, 2019 |
|
Supplemental |
|
August 30, 2019 |
|
September 30, 2019 |
|
|
0.04 |
|
|
July 31, 2019 |
|
Base |
|
September 13, 2019 |
|
October 15, 2019 |
|
|
0.39 |
|
|
November 5, 2019 |
|
Supplemental |
|
November 29, 2019 |
|
December 31, 2019 |
|
|
0.08 |
|
|
November 5, 2019 |
|
Base |
|
December 13, 2019 |
|
January 15, 2020 |
|
|
0.39 |
|
|
Total Dividends Declared |
|
|
|
|
|
|
|
$ |
1.81 |
|
|
|
|
Year Ended |
|
|||||||
|
|
|
December 31, 2018 |
|
|||||||
|
Date Declared |
|
Dividend |
|
Record Date |
|
Payment Date |
|
Dividend per Share |
|
|
|
February 21, 2018 |
|
Supplemental |
|
February 28, 2018 |
|
March 30, 2018 |
|
$ |
0.03 |
|
|
February 21, 2018 |
|
Base |
|
March 15, 2018 |
|
April 13, 2018 |
|
|
0.39 |
|
|
May 3, 2018 |
|
Supplemental |
|
May 31, 2018 |
|
June 29, 2018 |
|
|
0.06 |
|
|
May 3, 2018 |
|
Base |
|
June 15, 2018 |
|
July 13, 2018 |
|
|
0.39 |
|
|
August 1, 2018 |
|
Supplemental |
|
August 31, 2018 |
|
September 28, 2018 |
|
|
0.08 |
|
|
August 1, 2018 |
|
Base |
|
September 14, 2018 |
|
October 15, 2018 |
|
|
0.39 |
|
|
November 6, 2018 |
|
Supplemental |
|
November 30, 2018 |
|
December 31, 2018 |
|
|
0.05 |
|
|
November 6, 2018 |
|
Base |
|
December 14, 2018 |
|
January 15, 2019 |
|
|
0.39 |
|
|
Total Dividends Declared |
|
|
|
|
|
|
|
$ |
1.78 |
|
|
|
|
|
|
|
|
|||||
|
|
|
|
|
Year Ended |
|
|||||
|
|
|
|
|
December 31, 2017 |
|
|||||
|
Date Declared |
|
Dividend |
|
Record Date |
|
Payment Date |
|
Dividend per Share |
|
|
|
February 22, 2017 |
|
Base |
|
April 7, 2017 (1) |
|
April 28, 2017 |
|
$ |
0.39 |
|
|
May 3, 2017 |
|
Supplemental |
|
May 31, 2017 |
|
June 30, 2017 |
|
|
0.04 |
|
|
May 3, 2017 |
|
Base |
|
June 15, 2017 |
|
July 14, 2017 |
|
|
0.39 |
|
|
August 2, 2017 |
|
Supplemental |
|
August 31, 2017 |
|
September 29, 2017 |
|
|
0.09 |
|
|
August 2, 2017 |
|
Base |
|
September 15, 2017 |
|
October 13, 2017 |
|
|
0.39 |
|
|
November 7, 2017 |
|
Supplemental |
|
November 30, 2017 |
|
December 29, 2017 |
|
|
0.06 |
|
|
November 7, 2017 |
|
Base |
|
December 15, 2017 |
|
January 12, 2018 |
|
|
0.39 |
|
|
Total Dividends Declared |
|
|
|
|
|
|
|
$ |
1.75 |
|
|
(1) |
Subsequent to the declaration date, the record date for the dividend declared on February 22, 2017 was moved from its original date of March 31, 2017 to a revised date of April 7, 2017 in order to ensure compliance with notification requirements promulgated by the NYSE. The dividend payable associated with this declaration was recognized in the Company’s consolidated balance sheet as of March 31, 2017. There was no change to the dividend amount or payment date. |
The dividends declared during the years ended December 31, 2019, 2018, and 2017, were derived from net investment income and long-term capital gains, determined on a tax basis.
F-42
The tax character of shareholder distributions attributable to the fiscal years ended December 31, 2019, 2018 and 2017 were as follows:
|
|
|
Year Ended |
|
|
Year Ended |
|
|
Year Ended |
|
|||
|
|
|
December 31, 2019 |
|
|
December 31, 2018 |
|
|
December 31, 2017 |
|
|||
|
Ordinary Income (1) |
|
$ |
119,623 |
|
|
$ |
113,946 |
|
|
$ |
102,400 |
|
|
Long-Term Capital Gains |
|
|
— |
|
|
|
— |
|
|
|
2,651 |
|
|
Total |
|
$ |
119,623 |
|
|
$ |
113,946 |
|
|
$ |
105,051 |
|
|
(1) |
For the years ended December 31, 2019, 2018 and 2017, 80.49%, 87.16%, and 89.16% of ordinary income qualified as interest related dividend which is exempt from U.S. withholding tax applicable to non-U.S. shareholders. |
The tax basis components of distributable earnings for the years ended December 31, 2019, 2018 and 2017 were as follows:
|
|
|
Year Ended |
|
|
Year Ended |
|
|
Year Ended |
|
|||
|
|
|
December 31, 2019 |
|
|
December 31, 2018 |
|
|
December 31, 2017 |
|
|||
|
Undistributed net investment income - tax basis |
|
$ |
124,292 |
|
|
$ |
105,601 |
|
|
$ |
87,826 |
|
|
Undistributed net realized gains (losses) - tax basis |
|
|
7,863 |
|
|
|
— |
|
|
|
(3,877 |
) |
|
Net unrealized gains (losses) on investments |
|
|
8,908 |
|
|
|
(3,598 |
) |
|
|
7,673 |
|
|
Other temporary differences |
|
|
(30,343 |
) |
|
|
(30,016 |
) |
|
|
(28,103 |
) |
|
Total distributable earnings - book basis |
|
$ |
110,720 |
|
|
$ |
71,987 |
|
|
$ |
63,519 |
|
The following reconciles increase in net assets resulting from operations for the fiscal years ended December 31, 2019, 2018 and 2017, to taxable income at December 31, 2019, 2018 and 2017:
|
|
|
Year Ended |
|
|
Year Ended |
|
|
Year Ended |
|
|||
|
|
|
December 31, 2019 |
|
|
December 31, 2018 |
|
|
December 31, 2017 |
|
|||
|
Increase in net assets resulting from operations |
|
$ |
154,583 |
|
|
$ |
119,017 |
|
|
$ |
111,609 |
|
|
Adjustments: |
|
|
|
|
|
|
|
|
|
|
|
|
|
Net unrealized (gain) loss on investments |
|
|
(24,262 |
) |
|
|
14,151 |
|
|
|
(5,295 |
) |
|
Other income for tax purposes, not book |
|
|
2,167 |
|
|
|
512 |
|
|
|
644 |
|
|
Deferred organization costs |
|
|
(100 |
) |
|
|
(100 |
) |
|
|
(100 |
) |
|
Other expenses not currently deductible |
|
|
3,773 |
|
|
|
3,398 |
|
|
|
2,855 |
|
|
Other book-tax differences |
|
|
9,589 |
|
|
|
(1,618 |
) |
|
|
2,311 |
|
|
Taxable Income |
|
$ |
145,750 |
|
|
$ |
135,360 |
|
|
$ |
112,024 |
|
Note: Taxable income is an estimate and is not fully determined until the Company’s tax return is filed. The Company’s tax year end is March 31st.
Taxable income generally differs from increase in net assets resulting from operations due to temporary and permanent differences in the recognition of income and expenses, and generally excludes net unrealized gains or losses, as unrealized gains or losses are generally not included in taxable income until they are realized.
The Company makes certain adjustments to the classification of stockholders’ equity as a result of permanent book-to-tax differences, which include differences in the book and tax basis of certain assets and liabilities, and nondeductible federal taxes or losses among other items. To the extent these differences are permanent, they are charged or credited to additional paid in capital, or distributable earnings, as appropriate. In addition, due to the Company’s differing fiscal, tax, and excise tax year ends, the best estimates available are recorded to the above accounts in the period that such differences arise or are identifiable.
During the period April 1, 2019 through December 31, 2019, the Company increased distributable earnings and decreased additional paid in capital by $3.5 million attributable to U.S. federal excise taxes.
During the period April 1, 2018 through December 31, 2018, the Company increased distributable earnings and decreased additional paid in capital by $2.5 million attributable to U.S. federal excise taxes.
F-43
During the period April 1, 2017 through December 31, 2017, the Company increased distributable earnings and decreased additional paid in capital by $2.1 million attributable to U.S. federal excise taxes.
The Company’s wholly-owned subsidiary, TSL MR, LLC, is a taxable subsidiary in which the Company holds certain equity investments. TSL MR, LLC is not consolidated for U.S. federal income tax purposes and may generate income tax expense as a result of its ownership of certain portfolio companies. The income tax expense, or benefit, and the related tax assets and liabilities, if any, are reflected in our Statement of Operations.
As of December 31, 2019, the Company had a deferred tax asset of $5.9 million pertaining to operating losses, related to one of its investments. Given the losses generated by the entity, the deferred tax asset has been offset by a valuation allowance of $5.9 million.
As of December 31, 2018, the Company had a deferred tax asset of $4.4 million pertaining to operating losses, related to one of its investments. Given the losses generated by the entity, the deferred tax asset has been offset by a valuation allowance of $4.4 million.
As of December 31, 2017, the Company had a deferred tax asset of $2.9 million pertaining to operating losses, related to one of its investments. Given the losses generated by the entity, the deferred tax asset has been offset by a valuation allowance of $2.9 million.
The tax cost of the Company’s investments as of December 31, 2019 was $2,230,116, resulting in estimated gross unrealized gains and losses of $87,386 and $78,478, respectively. The tax cost of the Company’s investments as of December 31, 2018 and 2017, approximates their amortized cost.
13. Financial Highlights
The following per share data and ratios have been derived from information provided in the consolidated financial statements. The following are the financial highlights for one share of common stock outstanding during the years ended December 31, 2019, 2018, 2017, 2016, and 2015.
|
|
|
Year Ended |
|
|
Year Ended |
|
|
Year Ended |
|
|
Year Ended |
|
|
Year Ended |
|
|||||
|
|
|
December 31, 2019 |
|
|
December 31, 2018 |
|
|
December 31, 2017 |
|
|
December 31, 2016 |
|
|
December 31, 2015 |
|
|||||
|
Per Share Data (6) |
|
|
|
|
|
|
|
|
|
|
|
|
|
|
|
|
|
|
|
|
|
Net asset value, beginning of period |
|
$ |
16.25 |
|
|
$ |
16.09 |
|
|
$ |
15.95 |
|
|
$ |
15.15 |
|
|
$ |
15.53 |
|
|
|
|
|
|
|
|
|
|
|
|
|
|
|
|
|
|
|
|
|
|
|
|
Net investment income (1) |
|
|
1.94 |
|
|
|
2.25 |
|
|
|
2.00 |
|
|
|
1.83 |
|
|
|
1.76 |
|
|
Net realized and unrealized gain (loss) (1) |
|
|
0.40 |
|
|
|
(0.39 |
) |
|
|
(0.14 |
) |
|
|
0.51 |
|
|
|
(0.58 |
) |
|
Total from operations |
|
|
2.34 |
|
|
|
1.86 |
|
|
|
1.86 |
|
|
|
2.34 |
|
|
|
1.18 |
|
|
Issuance of common stock, net of offering costs (2) |
|
|
0.04 |
|
|
|
0.08 |
|
|
|
0.03 |
|
|
|
0.03 |
|
|
|
— |
|
|
Dividends declared from net investment income (2) |
|
|
(1.81 |
) |
|
|
(1.77 |
) |
|
|
(1.53 |
) |
|
|
(1.39 |
) |
|
|
(1.15 |
) |
|
Dividends declared from realized gains (2) |
|
|
— |
|
|
|
(0.01 |
) |
|
|
(0.22 |
) |
|
|
(0.17 |
) |
|
|
(0.41 |
) |
|
Total increase in net assets |
|
|
0.58 |
|
|
|
0.16 |
|
|
|
0.14 |
|
|
|
0.81 |
|
|
|
(0.38 |
) |
|
Net Asset Value, End of Period |
|
$ |
16.83 |
|
|
$ |
16.25 |
|
|
$ |
16.09 |
|
|
$ |
15.95 |
|
|
$ |
15.15 |
|
|
Per share market value at end of period |
|
$ |
21.47 |
|
|
$ |
18.09 |
|
|
$ |
19.80 |
|
|
$ |
18.68 |
|
|
$ |
16.22 |
|
|
Total return based on market value (3) |
|
|
28.69 |
% |
|
|
0.35 |
% |
|
|
15.36 |
% |
|
|
24.78 |
% |
|
|
5.71 |
% |
|
Total return based on net asset value (4) |
|
|
14.71 |
% |
|
|
12.06 |
% |
|
|
11.87 |
% |
|
|
15.54 |
% |
|
|
7.62 |
% |
|
Shares Outstanding, End of Period |
|
|
66,524,591 |
|
|
|
65,412,817 |
|
|
|
60,247,201 |
|
|
|
59,716,205 |
|
|
|
54,163,960 |
|
|
Ratios / Supplemental Data (5) |
|
|
|
|
|
|
|
|
|
|
|
|
|
|
|
|
|
|
|
|
|
Ratio of net expenses to average net assets |
|
|
11.27 |
% |
|
|
11.32 |
% |
|
|
9.41 |
% |
|
|
9.39 |
% |
|
|
9.31 |
% |
|
Ratio of net investment income to average net assets |
|
|
11.73 |
% |
|
|
13.80 |
% |
|
|
12.49 |
% |
|
|
11.84 |
% |
|
|
11.35 |
% |
|
Portfolio turnover |
|
|
30.89 |
% |
|
|
44.57 |
% |
|
|
58.08 |
% |
|
|
37.40 |
% |
|
|
34.51 |
% |
|
Net assets, end of period |
|
$ |
1,119,297 |
|
|
$ |
1,063,202 |
|
|
$ |
969,284 |
|
|
$ |
952,212 |
|
|
$ |
820,741 |
|
|
(1) |
The per share data was derived by using the weighted average shares outstanding during the period. |
F-44
|
(2) |
The per share data was derived by using the actual shares outstanding at the date of the relevant transactions. |
|
(3) |
Total return based on market value is calculated as the change in market value per share during the period plus declared dividends per share, divided by the beginning market value per share. |
|
(4) |
Total return based on net asset value is calculated as the change in net asset value per share during the period plus declared dividends per share, divided by the beginning net asset value per share. |
|
(5) |
The ratio of net expenses to average net assets in the table above reflects the Adviser’s waivers of its right to receive a portion of the Management Fee and Incentive Fees with respect to the Company’s ownership of shares of common stock of Oxford Square Capital Corp. and Triangle Capital Corp. Excluding the effects of the waivers, the ratio of net expenses to average net assets would have been 11.33%, 9.42%, 9.43% and 9.33% for the years ended December 31, 2018, 2017, 2016 and 2015, respectively. The Adviser did not waive any Management Fees or Incentive Fees for the year ended December 31, 2019. |
|
(6) |
Table may not sum due to rounding. |
14. Selected Quarterly Financial Data (Unaudited)
|
|
|
2019 |
|
|||||||||||||
|
|
|
Q4 |
|
|
Q3 |
|
|
Q2 |
|
|
Q1 |
|
||||
|
Investment Income |
|
$ |
66,531 |
|
|
$ |
70,050 |
|
|
$ |
62,427 |
|
|
$ |
52,487 |
|
|
Net Expenses (1) |
|
$ |
32,771 |
|
|
$ |
33,307 |
|
|
$ |
31,285 |
|
|
$ |
25,849 |
|
|
Net Investment Income |
|
$ |
33,760 |
|
|
$ |
36,743 |
|
|
$ |
31,142 |
|
|
$ |
26,638 |
|
|
Total unrealized and realized gains (losses) |
|
$ |
3,942 |
|
|
$ |
(6,402 |
) |
|
$ |
16,653 |
|
|
$ |
12,107 |
|
|
Increase in Net Assets Resulting from Operations |
|
$ |
37,702 |
|
|
$ |
30,341 |
|
|
$ |
47,795 |
|
|
$ |
38,745 |
|
|
Net Asset Value per Share as of the End of the Quarter |
|
$ |
16.83 |
|
|
$ |
16.72 |
|
|
$ |
16.68 |
|
|
$ |
16.34 |
|
|
|
|
2018 |
|
|||||||||||||
|
|
|
Q4 |
|
|
Q3 |
|
|
Q2 |
|
|
Q1 |
|
||||
|
Investment Income |
|
$ |
74,741 |
|
|
$ |
63,004 |
|
|
$ |
66,401 |
|
|
$ |
57,768 |
|
|
Net Expenses (1) |
|
$ |
30,634 |
|
|
$ |
30,711 |
|
|
$ |
30,099 |
|
|
$ |
26,581 |
|
|
Net Investment Income |
|
$ |
44,107 |
|
|
$ |
32,293 |
|
|
$ |
36,302 |
|
|
$ |
31,187 |
|
|
Total unrealized and realized gains (losses) |
|
$ |
(29,875 |
) |
|
$ |
5,087 |
|
|
$ |
(2,733 |
) |
|
$ |
2,649 |
|
|
Increase in Net Assets Resulting from Operations |
|
$ |
14,232 |
|
|
$ |
37,380 |
|
|
$ |
33,569 |
|
|
$ |
33,836 |
|
|
Net Asset Value per Share as of the End of the Quarter |
|
$ |
16.25 |
|
|
$ |
16.47 |
|
|
$ |
16.36 |
|
|
$ |
16.27 |
|
|
|
|
2017 |
|
|||||||||||||
|
|
|
Q4 |
|
|
Q3 |
|
|
Q2 |
|
|
Q1 |
|
||||
|
Investment Income |
|
$ |
48,825 |
|
|
$ |
52,305 |
|
|
$ |
58,819 |
|
|
$ |
50,948 |
|
|
Net Expenses (1) |
|
$ |
21,946 |
|
|
$ |
21,376 |
|
|
$ |
24,887 |
|
|
$ |
22,429 |
|
|
Net Investment Income |
|
$ |
26,879 |
|
|
$ |
30,929 |
|
|
$ |
33,932 |
|
|
$ |
28,519 |
|
|
Total unrealized and realized losses |
|
$ |
(133) |
|
|
$ |
(6,170) |
|
|
$ |
(2,106) |
|
|
$ |
(241 |
) |
|
Increase in Net Assets Resulting from Operations |
|
$ |
26,746 |
|
|
$ |
24,759 |
|
|
$ |
31,826 |
|
|
$ |
28,278 |
|
|
Net Asset Value per Share as of the End of the Quarter |
|
$ |
16.09 |
|
|
$ |
16.09 |
|
|
$ |
16.15 |
|
|
$ |
16.04 |
|
|
(1) |
Net expenses include income taxes, including excise taxes. |
15. Subsequent Events
The Company’s management has evaluated subsequent events through the date of issuance of the consolidated financial statements included herein. There have been no subsequent events, except as already disclosed, that occurred during such period that would require disclosure in this Form 10-K or would be required to be recognized in the consolidated financial statements as of and for the year ended December 31, 2019.
F-45
ITEM 9. CHANGES IN AND DISAGREEMENTS WITH ACCOUNTANTS ON ACCOUNTING AND FINANCIAL DISCLOSURE
None.
ITEM 9A. CONTROLS AND PROCEDURES
Evaluation of Disclosure Controls and Procedures. As of the end of the period covered by this report, we carried out an evaluation, under the supervision and with the participation of our management, including our Chief Executive Officer and Chief Financial Officer, of the effectiveness of the design and operation of our disclosure controls and procedures (as defined in Rule 13a-15 under the Exchange Act). Based on that evaluation, our Chief Executive Officer and Chief Financial Officer have concluded that our current disclosure controls and procedures are effective in timely alerting them to material information relating to us that is required to be disclosed by us in the reports we file or submit under the Exchange Act.
Management’s Report on Internal Control Over Financial Reporting. Our management is responsible for establishing and maintaining adequate internal control over financial reporting (as defined in Rules 13a-15(f) and 15d-15(f) of the Exchange Act). Under the supervision and with the participation of management, including the Chief Executive Officer and Chief Financial Officer, we conducted an evaluation of the effectiveness of our internal control over financial reporting based on the criteria established in Internal Control—Integrated Framework (2013) issued by the Committee of Sponsoring Organizations of the Treadway Commission (2013 COSO Framework). Based on our evaluation under the framework in Internal Control—Integrated Framework, management concluded that our internal control over financial reporting was effective as of December 31, 2019.
Because of its inherent limitations, internal control over financial reporting may not prevent or detect misstatements. Also, projections of any evaluation of effectiveness to future periods are subject to the risk that controls may become inadequate because of changes in conditions, or that the degree of compliance with the policies or procedures may deteriorate.
Attestation Report of the Independent Registered Public Accounting Firm. Our independent registered public accounting firm, KPMG LLP, has issued an audit report on the effectiveness of our internal control over financial reporting, which is set forth under the heading “Report of Independent Registered Public Accounting Firm” on page F-2.
Changes in Internal Control over Financial Reporting. There have been no changes in our internal control over financial reporting that occurred during our most recently completed fiscal quarter that have materially affected, or are reasonably likely to materially affect, our internal control over financial reporting.
None.
81
ITEM 10. DIRECTORS, EXECUTIVE OFFICERS AND CORPORATE GOVERNANCE
Except for the information regarding the SOX Code of Business Conduct and Ethics (which is set forth below), information in response to this item is incorporated by reference from our Proxy Statement relating to our 2020 annual meeting of stockholders. The Proxy Statement will be filed with the SEC within 120 days after the end of the fiscal year covered by this Form 10-K pursuant to Regulation 14A under the Exchange Act.
Our SOX Code of Business Conduct and Ethics may be found at http://www.tpgspecialtylending.com in the “Investor Resources” section of our website. We intend to disclose any substantive amendments to or waivers of required provisions of the SOX Code of Business Conduct and Ethics on our website or on a current report on Form 8-K.
ITEM 11. EXECUTIVE COMPENSATION
Information in response to this item is incorporated by reference from our Proxy Statement relating to our 2020 annual meeting of stockholders.
ITEM 12. SECURITY OWNERSHIP OF CERTAIN BENEFICIAL OWNERS AND MANAGEMENT AND RELATED STOCKHOLDER MATTERS
Information in response to this item is incorporated by reference from our Proxy Statement relating to our 2020 annual meeting of stockholders.
ITEM 13. CERTAIN RELATIONSHIP AND RELATED TRANSACTION, AND DIRECTOR INDEPENDENCE
Information in response to this item is incorporated by reference from our Proxy Statement relating to our 2020 annual meeting of stockholders.
ITEM 14. PRINCIPAL ACCOUNTANT FEES AND SERVICES
Information in response to this item is incorporated by reference from our Proxy Statement relating to our 2020 annual meeting of stockholders.
82
ITEM 15. EXHIBITS AND FINANCIAL STATEMENT SCHEDULES
The following documents are filed as part of this Annual Report:
|
(1) |
Financial Statements—Financial statements are included in Item 8. See the Index to the Consolidated Financial Statements on page F-1 of this annual report on Form 10-K. |
|
(2) |
Financial Statement Schedules—None. We have omitted financial statements schedules because they are not required or are not applicable, or the required information is shown in the consolidated financial statements or notes to the consolidated financial statements included in this annual report on Form 10-K. |
|
(3) |
Exhibits—The following is a list of all exhibits filed as a part of this annual report on Form 10-K, including those incorporated by reference. |
|
Exhibit No |
|
Description of Exhibits |
|
|
|
|
|
3.1 |
|
|
|
|
|
|
|
3.2 |
|
|
|
|
|
|
|
3.3 |
|
|
|
|
|
|
|
3.4 |
|
|
|
|
|
|
|
4.1 |
|
|
|
|
|
|
|
4.2 |
|
|
|
|
|
|
|
4.3 |
|
|
|
|
|
|
|
4.4 |
|
|
|
|
|
|
|
4.5 |
|
|
|
|
|
|
|
4.6 |
|
|
|
|
|
|
|
4.7 |
|
|
|
|
|
|
|
4.8 |
|
|
|
|
|
|
|
4.9 |
|
|
|
|
|
|
|
4.10 |
|
|
|
|
|
|
|
10.1 |
|
|
|
|
|
|
83
|
Exhibit No |
|
Description of Exhibits |
|
|
|
|
|
|
||
|
|
|
|
|
10.3 |
|
|
|
|
|
|
|
10.4 |
|
|
|
|
|
|
|
10.5 |
|
|
|
|
|
|
|
10.6 |
|
|
|
|
|
|
|
10.7 |
|
|
|
|
|
|
|
10.8 |
|
|
|
|
|
|
|
10.9 |
|
|
|
|
|
|
|
10.10 |
|
|
|
|
|
|
|
10.11 |
|
|
|
|
|
|
|
10.12 |
|
|
|
|
|
|
|
10.13 |
|
|
|
|
|
|
|
10.14 |
|
|
|
|
|
|
|
10.15 |
|
|
|
|
|
|
84
|
Exhibit No |
|
Description of Exhibits |
|
|
|
|
|
|
||
|
|
|
|
|
10.17 |
|
|
|
|
|
|
|
21.1 |
|
|
|
|
|
|
|
23.1 |
|
|
|
|
|
|
|
31.1 |
|
|
|
|
|
|
|
31.2 |
|
|
|
|
|
|
|
32 |
|
|
|
|
|
|
|
99.1 |
|
Report of Independent Registered Public Accounting Firm on Supplemental Information. |
|
|
|
|
Not applicable.
85
Pursuant to the requirements of Section 13 or 15(d) of the Securities Exchange Act of 1934, the registrant has duly caused this report to be signed on its behalf by the undersigned, thereunto duly authorized.
|
Date: February 19, 2020 |
|
TPG SPECIALTY LENDING, INC. |
|
|
|
|
|
|
|
/s/ Joshua Easterly |
|
|
|
Chief Executive Officer |
Each person whose signature appears below constitutes and appoints Michael Fishman, Joshua Easterly, Ian Simmonds, David Stiepleman and Jennifer Gordon, and each of them, such person’s true and lawful attorney-in-fact and agent, with full power of substitution and revocation, for such person and in such person’s name, place and stead, in any and all capacities, to sign one or more Annual Reports on Form 10-K for the fiscal year ended December 31, 2019, and any and all amendments thereto, and to file same with all exhibits thereto, and other documents in connection therewith, with the Securities and Exchange Commission, granting unto said attorneys-in-fact and agents, and each of them, full power and authority to do and perform each and every act and thing requisite and necessary to be done in connection therewith, as fully to all intents and purposes as such person might or could do in person, hereby ratifying and confirming all that said attorneys-in-fact and agents and each of them, or their or his substitute or substitutes, may lawfully do or cause to be done by virtue hereof.
Pursuant to the requirements of the Securities Exchange Act of 1934, this report has been signed below by the following persons on behalf of the registrant and in the capacities indicated on February 19, 2020.
|
Signature |
|
Title |
|
|
|
|
|
/s/ Joshua Easterly Joshua Easterly
|
|
Chief Executive Officer, Director and Chairman of the Board of Directors |
|
/s/ Ian Simmonds Ian Simmonds
|
|
Chief Financial Officer (Principal Financial Officer) |
|
/s/ Michael Graf Michael Graf |
|
Vice President (Principal Accounting Officer) |
|
/s/ John A. Ross John A. Ross
|
|
Director and Chairman of the Audit Committee |
|
/s/ Hurley Doddy Hurley Doddy
|
|
Director |
|
/s/ Michael Fishman Michael Fishman
|
|
Director |
|
/s/ Jennifer Gordon Jennifer Gordon |
|
Director |
|
/s/ Richard A. Higginbotham Richard A. Higginbotham
|
|
Director |
|
/s/ Judy Slotkin Judy Slotkin
|
|
Director |
|
/s/ David Stiepleman David Stiepleman
|
|
Director |
|
/s/ Ronald K. Tanemura Ronald K. Tanemura |
|
Director |
86