Attached files
| file | filename |
|---|---|
| EX-32.2 - EX-32.2 - Techpoint, Inc. | ck0001556898-ex322_9.htm |
| EX-32.1 - EX-32.1 - Techpoint, Inc. | ck0001556898-ex321_11.htm |
| EX-31.2 - EX-31.2 - Techpoint, Inc. | ck0001556898-ex312_7.htm |
| EX-31.1 - EX-31.1 - Techpoint, Inc. | ck0001556898-ex311_8.htm |
| EX-23.1 - EX-23.1 - Techpoint, Inc. | ck0001556898-ex231_10.htm |
| EX-10.7 - EX-10.7 - Techpoint, Inc. | ck0001556898-ex107_82.htm |
| EX-4.4 - EX-4.4 - Techpoint, Inc. | ck0001556898-ex44_310.htm |
UNITED STATES
SECURITIES AND EXCHANGE COMMISSION
Washington, D.C. 20549
FORM 10-K
(Mark One)
|
☒ |
ANNUAL REPORT PURSUANT TO SECTION 13 OR 15(d) OF THE SECURITIES EXCHANGE ACT OF 1934 |
For the fiscal year ended December 31, 2019
OR
|
☐ |
TRANSITION REPORT PURSUANT TO SECTION 13 OR 15(d) OF THE SECURITIES EXCHANGE ACT OF 1934 |
For The Transition Period From TO
Commission File Number 000-55843
Techpoint, Inc.
(Exact name of Registrant as specified in its Charter)
|
Delaware |
80-0806545 |
|
(State or other jurisdiction of incorporation or organization) |
(I.R.S. Employer |
|
2550 N. First Street, #550 |
|
San Jose, CA 95131 USA |
|
(408) 324-0588 |
|
(Address, including zip code, and telephone number, including area code, of registrant’s principal executive offices) |
Securities registered pursuant to Section 12(b) of the Act:
|
Title of Each Class |
|
Trading Symbol(s) |
|
Name of Exchange on Which Registered |
|
Japanese Depositary Shares, each representing one |
|
M-6697 |
|
Tokyo Stock Exchange (Mothers Market) |
|
Common Stock Share, Par Value $0.0001 Per Share |
|
|
|
|
|
Securities registered pursuant to Section 12(g) of the Act: |
|
None |
Indicate by check mark if the Registrant is a well-known seasoned issuer, as defined in Rule 405 of the Securities Act. YES ☐ NO ☒
Indicate by check mark if the Registrant is not required to file reports pursuant to Section 13 or 15(d) of the Act. YES ☐ NO ☒
Indicate by check mark whether the Registrant: (1) has filed all reports required to be filed by Section 13 or 15(d) of the Securities Exchange Act of 1934 during the preceding 12 months (or for such shorter period that the Registrant was required to file such reports), and (2) has been subject to such filing requirements for the past 90 days. YES ☒ NO ☐
Indicate by check mark whether the registrant has submitted electronically every Interactive Data File required to be submitted pursuant to Rule 405 of Regulation S-T (§232.405 of this chapter) during the preceding 12 months (or for such shorter period that the registrant was required to submit such files). YES ☒ NO ☐
Indicate by check mark whether the registrant is a large accelerated filer, an accelerated filer, a non-accelerated filer, smaller reporting company, or an emerging growth company. See the definitions of “large accelerated filer,” “accelerated filer,” “smaller reporting company,” and “emerging growth company” in Rule 12b-2 of the Exchange Act.
|
Large accelerated filer |
|
☐ |
|
Accelerated filer |
|
☒ |
|
Non-accelerated filer |
|
☐ |
|
Smaller reporting company |
|
☒ |
|
Emerging growth company |
|
☒ |
|
|
|
|
If an emerging growth company, indicate by check mark if the registrant has elected not to use the extended transition period for complying with any new or revised financial accounting standards provided pursuant to Section 13(a) of the Exchange Act. ☒
Indicate by check mark whether the Registrant is a shell company (as defined in Rule 12b-2 of the Exchange Act). YES ☐ NO ☒
The aggregate market value of the voting and non-voting common equity held by non-affiliates of the Registrant on June 28, 2019 (the last business day of the registrant's most recently completed second fiscal quarter), based on the closing price of the shares of JDS on the Tokyo Stock Exchange of $5.91, was $54.3 million.
As of March 9, 2020, the registrant had 17,539,572 shares of common stock, $0.0001 par value per share, outstanding and 5,571,322 shares of JDSs outstanding.
Portions of the Registrant’s Definitive Proxy Statement relating to the Annual Meeting of Shareholders, scheduled to be held on June 4, 2020, are incorporated by reference into Part III of this Report.
|
|
|
Page |
|
PART I |
|
|
|
Item 1. |
2 |
|
|
Item 1A. |
8 |
|
|
Item 1B. |
28 |
|
|
Item 2. |
28 |
|
|
Item 3. |
29 |
|
|
Item 4. |
29 |
|
|
|
|
|
|
PART II |
|
|
|
Item 5. |
30 |
|
|
Item 6. |
31 |
|
|
Item 7. |
Management’s Discussion and Analysis of Financial Condition and Results of Operations |
33 |
|
Item 7A. |
44 |
|
|
Item 8. |
45 |
|
|
Item 9. |
Changes in and Disagreements With Accountants on Accounting and Financial Disclosure |
72 |
|
Item 9A. |
72 |
|
|
Item 9B. |
72 |
|
|
|
|
|
|
PART III |
|
|
|
Item 10. |
73 |
|
|
Item 11. |
73 |
|
|
Item 12. |
Security Ownership of Certain Beneficial Owners and Management and Related Stockholder Matters |
73 |
|
Item 13. |
Certain Relationships and Related Transactions, and Director Independence |
73 |
|
Item 14. |
73 |
|
|
|
|
|
|
PART IV |
|
|
|
Item 15. |
74 |
|
|
Item 16. |
76 |
Information Regarding Forward-Looking Statements
This Annual Report on Form 10-K includes forward-looking statements. All statements other than statements of historical facts contained in this Annual Report on Form 10-K, including statements regarding our future results of operations and financial position, strategy and plans, and our expectations for future operations, are forward-looking statements. The words “believe,” “may,” “will,” “estimate,” “continue,” “anticipate,” “design,” “plan,” “project,” “intend,” “expect” or the negative version of these words and similar expressions are intended to identify forward-looking statements. We have based these forward-looking statements largely on our current expectations and projections about future events and trends that we believe may affect our financial condition, results of operations, strategy, short-term and long-term business operations and objectives, and financial needs. These forward-looking statements are subject to a number of risks, uncertainties and assumptions, including those described in “Risk Factors” in this Annual Report on Form 10-K. In light of these risks, uncertainties and assumptions, the forward-looking events and circumstances discussed in this Annual Report on Form 10-K may not occur, and actual results could differ materially and adversely from those anticipated or implied in the forward-looking statements. Forward-looking statements include, but are not limited to, statements about:
|
|
• |
our future financial performance, including our revenue, cost of sales and operating expenses; |
|
|
• |
our market opportunity and our ability to effectively manage or sustain our growth; |
|
|
• |
our ability to attract and retain end-customers in our current or future target markets; |
|
|
• |
our ability to continue to develop new technologies and obtain and maintain intellectual property rights protecting such technologies; |
|
|
• |
our ability to form and expand partnerships with technology partners and consulting partners; |
|
|
• |
our ability to maintain, protect and enhance our intellectual property; |
|
|
• |
our ability to successfully defend litigation brought against us; |
|
|
• |
new product releases and timing; |
|
|
• |
anticipated trends, key factors and challenges in our business and the competition that we face; |
|
|
• |
our liquidity and working capital requirements; and |
|
|
• |
our expectations regarding future expenses and investments. |
Although we believe that the expectations reflected in the forward-looking statements are reasonable, we cannot guarantee future results, level of activity, performance or achievements. Any forward-looking statement made by us in this Annual Report on Form 10-K speaks only as of the date on which it is made. We disclaim any duty to update any of these forward-looking statements after the date of this Annual Report on Form 10-K, except as required by law.
The following information should be read together with our consolidated financial statements and the notes to those statements that appear in this Annual Report on Form 10-K. Unless otherwise specified or the context otherwise requires, “Techpoint,” “we,” “us,” and “our” refer to Techpoint, Inc. and its consolidated subsidiaries.
We have obtained or are in the process of obtaining registered trademarks for Techpoint and HD-TVI. This report contains references to our trademarks and to trademarks belonging to other entities. Solely for convenience, trademarks and trade names referred to in this report, including logos, artwork and other visual displays, may appear without the ® or ™ symbols, but such references are not intended to indicate, in any way, that we will not assert, to the fullest extent under applicable law, our rights or the rights of the applicable licensor to these trademarks and trade names. We do not intend our use or display of other companies’ trade names or trademarks to imply a relationship with, or endorsement or sponsorship of us by, any other companies.
1
We are a fabless semiconductor company that designs, markets and sells mixed-signal integrated circuits for multiple video applications in the security surveillance and automotive markets. Our integrated circuits are enabling the transition from standard definition, or SD, video to high definition, or HD, video in the security surveillance and automotive industries. We target specific video applications that receive and process high definition analog video signals, including surveillance cameras, surveillance digital video recorders, or DVRs, as well as cameras in automobiles. We design application specific products that utilize our HD analog transmission technology and perform advanced digital video processing to facilitate the display, transmission and storage of video content. We believe designing our integrated circuits for specific applications allows us to better address varying end-customer requirements, fully leverage our technological capabilities and achieve greater share within our target markets.
We were originally incorporated in California in April 2012, and we reincorporated in Delaware in July 2017. During September 2017, we completed our initial public offering of Japanese Depositary Shares, or JDSs. We have decided to issue to the public, and list on the Mothers market of the Tokyo Stock Exchange, utilizing JDSs, instead of our common stock. JDSs are a representative security, and each JDS represents one share of common stock.
Application Specific Products
We design, market and sell integrated circuits that enable the transmission of high definition video content over long cable distances to facilitate the display, storage or processing of video content. Our application specific products currently include our security surveillance and automotive product lines. We intend to continue to develop new generations of products for each of these application specific product lines.
Security Surveillance. We have three subgroups of products for security surveillance consisting of HD-TVI transmitters, HD-TVI receivers and HD-SDI receivers.
HD-TVI Transmitters. Our HD-TVI transmitters are used within the camera, and take the HD digital signal from an HD camera processor and converts it to HD-TVI analog signals. We integrate the HD camera processor and HD-TVI transmitter into the same integrated circuit to save cost and save space in a camera. We also market standalone HD-TVI transmitters to increase our flexibility to work with other camera processors in the market. This allows a customer either to purchase our combined HD-TVI transmitter with both a processor and transmitter or our standalone transmitter to be paired with a third-party processor.
HD-TVI Receivers. Our HD-TVI receivers are used in DVRs, and convert the HD-TVI analog signal into digital signals to be processed by a DVR system, which can then transmit the image to a display. To improve the cost and performance of our HD-TVI receivers, we integrate multiple HD-TVI receivers along with standard definition analog video decoders as well as analog audio decoders into the same integrated circuit. This allows HD DVR makers to support HD video and standard definition video for backward compatibility at the same time.
HD-SDI Receivers. Our HD-SDI receivers perform similar functions for HD video as our HD-TVI receivers, except these HD-SDI receivers use serial digital transmission technology used in video broadcasting instead of our HD-TVI technology. Having both HD-TVI and HD-SDI receiver products in our product portfolio allows us to address both the analog and digital HD security surveillance market segments at the same time.
Automotive. We optimize our automotive HD-TVI transmitters and receivers to work with current automotive camera processors and navigation systems in the automotive market.
Automotive HD-TVI Transmitters: Our automotive HD-TVI transmitters are designed to work specifically with current automotive camera processors and image sensors.
Automotive HD-TVI Camera Processors: We also provide automotive camera processors that integrates our HD-TVI transmitters to provide higher integration for better cost and smaller camera module size.
Automotive HD-TVI Receivers: Similar to our security surveillance products, our automotive HD-TVI receiver also integrates standard definition analog video decoders so that automotive vendors have the flexibility of
2
supporting both HD and standard definition video. We also integrate multiple HD-TVI receivers for multiple camera applications inside the car.
Automotive LCD Controllers: We provide HD LCD controllers that allows us to support LCD panels for the HD E-mirror as well as for various HD LCD panel displays inside the car.
The following table summarizes the features of our application specific integrated circuit product lines:
|
Product Line |
|
Key Features |
Representative Applications |
|
Security Surveillance |
|
|
|
|
|
|
|
|
|
HD-TVI Transmitters |
- |
Converts HD Camera signals to HD-TVI analog signals |
HD-TVI Surveillance Cameras |
|
|
|
|
|
|
HD-TVI Camera Processors |
- |
Integrates HD Camera processor supporting advanced video processing such as Wide Dynamic Range, Low light noise Reduction, and other advanced camera functions |
HD-TVI Surveillance Cameras |
|
|
|
|
|
|
HD-TVI Receivers |
- |
Converts HD-TVI analog signal into digital signal |
HD-TVI DVR application |
|
|
|
|
|
|
|
- |
Integrates four HD-TVI receivers |
|
|
|
|
|
|
|
|
- |
Integrated Standard Definition analog |
|
|
|
|
video decoder and audio codec |
|
|
|
|
|
|
|
HD-SDI Receivers |
- |
Integrates four HD-SDI receivers |
HD-SDI DVR application |
|
|
|
|
|
|
|
- |
Integrates four HD-SDI transmitters |
|
|
Automotive |
|
|
|
|
|
|
|
|
|
HD-TVI Transmitter |
- |
Interfaces with most automotive camera |
Automotive HD Backup Camera |
|
|
|
processors on the market
|
Automotive HD Surround View Camera |
|
HD-TVI Camera Processors
|
‐ |
Integrated HD Camera processor supporting advanced video processing such as High Dynamic Range, Low light noise Reduction, and other advanced camera functions
|
Automotive HD Backup Camera Automotive HD Surround View Camera Automotive HD Drive Recorder Camera |
|
|
|
|
|
|
HD-TVI Receivers |
‐ |
Integrated Standard Definition analog video decoder |
Automotive HD Backup Camera |
|
|
‐ |
Integrates four channel HD-TVI Receivers
|
Automotive HD Surround View System Automotive HD Drive Recorder
|
|
HD LCD controller |
- |
Integrated HD-TVI Receiver |
Automotive HD Display |
|
|
- |
Integrated Standard Definition analog video decoder |
Automotive E-Mirrors |
|
- |
Integrated Advanced Graphics |
Technology
We have several core competencies that enable us to design analog, mixed signal and digital technologies that can be implemented across our application specific product lines. We have internally developed the combination of technologies, expertise and capabilities necessary for the conversion and processing of HD video signals. We do not depend on third parties for any material technology, expertise or design capability.
3
We have developed a proprietary high definition analog video transmission technology called high definition transport video interface, or HD-TVI. Our HD analog technology operates at the same 1080p HD resolution as digital HD technologies, but transmits the information in a continuous format, or wave, instead of a binary 0 or 1 format. When transmitted information in an analog system encounters interference or other degradation, the video quality is impacted, this is in contrast to a digital transmission where once a threshold level of interference or other degradation is encountered the image is cutoff completely. Our HD-TVI technology uses analog transmission techniques that are an extension of legacy analog video broadcasting technology used in traditional analog televisions but which can deliver high definition video transmission over long cable distances. Our HD-TVI transmitter interfaces with a high definition camera processor or image sensor and converts the digital HD content to an HD analog signal. After transmission, our HD-TVI receiver converts this analog signal back into a digital signal for processing by a standard display processor.
As a result of our advanced analog design capability, we have developed multiple technologies that enable analog video signals to be processed digitally. One of the key analog technologies we have developed internally is our high performance and cost effective analog front-end that conditions and converts analog video signals into a digital format for display. The multiple core functions performed within our integrated circuits featuring an analog front-end are anti-aliasing filtering, automatic gain control signal clamping and analog to digital conversion. Other key analog technologies we have developed internally are analog equalizers, phase lock loops, high frequency and delta sigma analog to digital converters, video and audio digital to analog converters and low voltage differential signaling.
We have also developed a number of digital technologies specific to the security surveillance and automotive markets. For example, we have developed image signal processing technologies such as wide dynamic range, noise reduction, as well as de-interlacing, scaling, and other video enhancement algorithms, which are important technologies for HD cameras and HD video display technologies for security surveillance and automotive HD video applications. We also possess digital HD transmission technologies such as serializer and de-serializer interface technologies, which we can offer as an alternative to our HD analog transmission technologies.
Customers
We principally sell our products to distributors who, in turn, sell to original design manufacturers, or ODMs, contract manufacturers and design houses. In addition, we sell our products, though to a lesser extent, directly to ODMs. ODMs typically design and manufacture electronic products to sell to original equipment manufacturers, or OEMs. Our agreements to sell our products through distribution channels generally provide for a non-exclusive right to sell, promote and develop a market for our products in a specified geographic area. These agreements generally may be terminated by either party on 60 days’ notice and do not require price protection.
In both the security surveillance and automotive markets, we have significant engagement with our end-customers prior to completion of a sale. In the security surveillance market, our end-customer is the OEM or system designer who manufacturers or designs the end product, such as a camera or DVR, that will be purchased for placement into a security surveillance system. Our integrated circuits are used by security surveillance manufacturers, such as Hikvision in China, IDIS in South Korea and AVTech in Taiwan. These three manufacturers are each a leading security surveillance manufacturer in their respective countries. In the automotive market, our end-customer is the automobile manufacturer, but we also typically engage with system designers and manufacturers who sell systems, such as navigation or backup video camera systems, to automobile manufacturers. Our sales representatives and engineers engage directly with these end-customers, even if we do not sell directly to them, because these end-customers exert significant influence over the design of the products or systems that are ultimately placed into their products. We currently have design wins for future generations of automobiles with major automotive equipment manufacturers. A design win will not necessarily result in future revenue, but we believe it is a strong indicator that our integrated circuits will be incorporated into a future model for that particular automotive equipment manufacturer.
Sales and Marketing
We sell our products worldwide through multiple channels, primarily through our network of domestic and international independent distributors and sales representatives. Each of these sales channels is supported by our
4
customer service and marketing organizations. We have sales and customer support personnel in the United States, China, Japan, South Korea and Taiwan. We intend to expand our sales and support capabilities and our network of independent sales representatives in key regions worldwide.
Our sales cycles typically range from three to six months for the security surveillance market and one to three years for the automotive industry. We work directly with system designers to create demand for our products by providing them with application specific product information for their system design, engineering and procurement groups. We actively engage these groups during their design processes to introduce them to our integrated circuits. We endeavor to design our products to meet anticipated, increasingly complex and specific design requirements, but which will also support widespread demand for the products and future enhancements to them. If successful, this process culminates in a system designer deciding to use our products in their system, which we refer to as a design win. Once our product is accepted and designed into an application, we believe the system designer is likely to continue to use the same or enhanced versions of our product across a number of their models, which tends to extend the life cycle of our product. This is particularly true in the automotive industry, which typically experiences multi-year product lifecycles, sometimes up to four years or longer. In addition, a design win into a particular model of car for a specific manufacturer may translate into design wins for different models from the same auto manufacturer. If we fail to achieve an initial design win, we may lose the opportunity for sales to an end-customer for a number of its products and for a lengthy period of time.
Backlog
Our sales are made primarily pursuant to standard individual purchase orders. Our backlog consists of orders that we have received from customers that have not yet shipped. Historically, management has not used backlog as an indicator of future business. As our order lead times may vary and as industry practice allows customers to reschedule or cancel orders on relatively short notice, we believe that backlog is not necessarily a good indicator of future sales. In addition, our quarterly revenue depends on orders booked and shipped in that quarter. As a result, we have not experienced material backlog at the end of a quarter, and any backlog at that time would be more indicative of the timing of the order, rather than anything that may predict future performance.
Research and Development
Our research and development efforts are focused on the development of new technologies as well as application specific products. Our engineering team has expertise in advanced analog design, mixed signal digital processing, video decoding and software engineering. Our research and development expense was $6.5 million, $7.3 million, and $5.4 million for the years ended December 31, 2019, 2018, and 2017, respectively.
Intellectual Property
We seek to protect our proprietary technology, documentation and other written materials primarily under trade secret and copyright laws. We also typically require employees with access to our proprietary information to execute confidentiality agreements. The steps taken by us to protect our proprietary information may not be adequate to prevent misappropriation of our technology.
Although we rely primarily on trade secret laws and contractual restrictions to protect the technology in the integrated circuits we currently design and market, our success and ability to compete in the future may also depend to a significant degree upon obtaining and enforcing patent protection for our HD analog and other mixed signal technologies. As of December 31, 2019, we have two patent applications pending in the United States. These patent applications cover aspects of the technology in the integrated circuits we currently design and market. Our future patents, if any are issued, may provide only limited protection for our technology and may not be sufficient to provide competitive advantages to us. For example, competitors could be successful in challenging any issued patents or, alternatively, could develop similar or more advantageous technologies on their own or design around our patents.
The laws of various countries in which we market our integrated circuits may offer little or no protection for our proprietary technologies. Reverse engineering, unauthorized copying or other misappropriation of our
5
proprietary technologies could enable third parties to benefit from our technologies without paying us for doing so. Any inability to protect our proprietary rights could harm our ability to compete, generate revenue and grow our business.
We may be required to resort to litigation to enforce our intellectual property rights. We may also be subject to legal proceedings and claims relating to our intellectual property in the ordinary course of our business. Intellectual property litigation is expensive and time-consuming and could divert management’s attention away from running our business. This litigation could also require us to pay substantial damages to the party claiming infringement, stop selling products or using technology that contains the allegedly infringing intellectual property, develop non-infringing technology or enter into royalty or license arrangements.
Manufacturing
We do not own or operate a semiconductor fabrication, packaging or testing facility. We depend on third-party vendors to manufacture, package and test our products. By outsourcing manufacturing, we are able to avoid the cost associated with owning and operating our own manufacturing facility. This allows us to focus our efforts on the design and marketing of our products.
Integrated Circuit Fabrication. We currently outsource the manufacturing of our integrated circuits to Taiwan Semiconductor Manufacturing Company, or TSMC, and Fujitsu Electronics America, Inc., or Fujitsu. We work closely with TSMC and Fujitsu to forecast on a monthly basis our manufacturing capacity requirements. Our integrated circuits are currently fabricated in several advanced manufacturing processes. Because smaller geometry process technologies lead to enhanced performance, smaller silicon chip size and lower power requirements, we continually evaluate the benefits and feasibility of migrating to smaller geometry process technologies in order to reduce cost and improve performance. We believe that our fabless manufacturing approach provides us with the benefits of superior manufacturing capability as well as flexibility to move the manufacturing, assembly and testing of our products to those vendors that offer the best capability, with adequate capacity at an attractive price. Nevertheless, because we do not have a formal, long-term pricing agreement with TSMC or Fujitsu, our wafer costs and services are subject to sudden price fluctuations based on the cyclical demand for semiconductors. Our engineers work closely with TSMC and Fujitsu to increase yields, lower manufacturing costs and improve quality. We intend to qualify and retain additional foundries to manufacture our semiconductors in the future.
Assembly and Test. Our products are shipped from TSMC or Fujitsu to third-party sort, assembly and test facilities where they are assembled into finished integrated circuits and tested. We outsource all packaging and testing of our products to assembly and test subcontractors, principally Advanced Semiconductor Engineering, Inc., or ASE, and Sigurd Microelectronics Corporation, or Sigurd. Our products are designed to use low cost, standard packages and to be tested with widely available test equipment.
Quality Assurance. We are committed to maintaining the highest level of quality in our products. We have designed and implemented a quality management system that provides the framework for continual improvement of products, processes and customer service. We also rely on in-depth simulation studies, testing and practical application testing to validate and verify our integrated circuits. To ensure consistent product quality, reliability and yield, together with our manufacturing logistics partners, we closely monitor the production cycle by reviewing manufacturing process data from each wafer foundry and assembly subcontractor. We are certified for ISO 9001 and ISO 14001.
Competition
The market in which we operate is extremely competitive, and is characterized by rapid technological change, continuously evolving end-customer requirements and declining average selling prices. We may not be able to compete successfully against current or potential competitors. We compete with numerous domestic and international semiconductor manufacturers and designers. In our automotive market, we principally compete with Maxim Integrated Products, Inc. and Texas Instruments Incorporated. In selling our integrated circuits into the surveillance market, we principally compete against Nextchip Co., Ltd in South Korea, Pixelplus Co., Ltd in South Korea, Dahua Technology Co. Ltd in China, and Fullhan Microelectronic Co., Ltd in China. Some of our current and potential competitors have longer operating histories, significantly greater resources and name recognition and a
6
larger base of customers than we do. They may also have a larger presence and more significant relationships within certain geographical areas, such as in Asia where many of our end-customers operate. This may allow them to respond more quickly than us to new or emerging technologies or changes in customer requirements. Some of our competitors currently offer product features or technologies that we do not currently offer but intend to sell in the future, such as Ultra HD advanced camera image signal processors. We must, therefore, compete against competitors that have more experience in developing and selling products and technologies that we do not currently offer but intend to offer in the future. Some of our competitors also use smaller geometry process technologies in their products, which can result in better manufacturing yields and decreased costs. In addition, these competitors may have greater credibility with our existing and potential end-customers. Increased competition could harm our business, by, for example, increasing pressure on our profit margins or causing us to lose end-customers. In addition, delivery of products with defects or reliability, quality or compatibility problems may damage our reputation and competitive position. Our ability to compete successfully depends in part on our ability to deliver products without reliability, quality or compatibility problems and on a number of other factors such as performance and robustness, functionality, price and cost effectiveness, rapid time-to-market and customer service and support.
We believe we currently compete favorably with respect to these factors in the aggregate. However, we cannot provide assurance that our products will continue to compete favorably or that we will be successful in the face of increasing competition from new products and enhancements introduced by existing competitors or new companies entering our market.
Employees
As of December 31, 2019, we employed 78 employees. We have never had a work stoppage, and none of our employees are represented by a labor organization or under any collective bargaining arrangements. We consider our employee relations to be good.
Segment, Geographic Areas and Concentration Information
We operate under one reportable segment which is comprised of one operating segment. See Note 4 “Segment Information” of this Annual Report on Form 10-K for further segment and geographic information. For concentration information, see Note 1 “Organization and Summary of Significant Accounting Policies” of this Annual Report on Form 10-K.
Facilities
Our corporate headquarters and primary research and development and operations facilities occupy approximately 8,512 square feet in San Jose, California, under a lease that expires in February 2022. We also lease properties in China, Japan, South Korea and Taiwan. We do not own any manufacturing facilities, and we contract and license to third parties the production and distribution of our semiconductors. We believe our space is adequate for our current needs and that suitable additional or substitute space will be available to accommodate foreseeable expansion of our operations.
Corporate Information
We were originally incorporated in California in April 2012, and we reincorporated in Delaware in July 2017. Our principal executive offices are located at 2550 N. First Street, #550, San Jose, California 95131, and our telephone number is (408) 324-0588. Our website is www.techpoint.co.jp. Information contained on, or that can be accessed through, our website is not incorporated by reference into this Annual Report on Form 10-K, and you should not consider information on our website to be part of this Annual Report on Form 10-K.
We make available free of charge on our website our annual reports on Form 10‑K, quarterly reports on Form 10‑Q, current reports on Form 8‑K and amendments to those reports, as soon as reasonably practicable after we electronically file or furnish such materials to the U.S. Securities and Exchange Commission (“SEC”). You may obtain a free copy of these reports in the Investor Relations section of our website, www.techpoint.co.jp. All reports that we file are also available at www.sec.gov.
7
Investing in Japanese Depositary Shares (“JDS”) and our underlying common stock involves a high degree of risk. You should consider carefully the risks and uncertainties described below, together with all of the other information in this Annual Report on Form 10-K, including our consolidated financial statements and related notes included elsewhere in this Annual Report on Form 10-K, before making an investment decision. If any of the following risks are realized, our business, financial condition, results of operations and prospects could be materially and adversely affected. In that event, the trading price of the JDSs could decline and you could lose part or all of your investment.
Risks Related to Our Business and Industry
Our limited operating history makes it difficult to evaluate our current business and future prospects.
We were incorporated in 2012 and began shipping our integrated circuits in 2013. Our limited operating history and limited experience selling products, combined with the rapidly evolving and competitive nature of our markets, makes it difficult to evaluate our current business and future prospects. In addition, we have limited insight into emerging trends that may adversely affect our business, financial condition, results of operations and prospects. We have encountered and will continue to encounter risks and difficulties frequently experienced by growing companies in rapidly changing industries, including unpredictable and volatile revenue and increased expenses as we continue to grow our business. The viability and demand for our products may be affected by many factors outside of our control, such as the factors affecting the growth of the security surveillance and automotive industries in general, and the growth and adoption of new security surveillance technologies and automotive video applications in particular, and changes in macroeconomic conditions. Our future revenue growth rate, and the success of our business, will depend in particular upon the success of our automotive video business. If we do not manage these risks and overcome these difficulties successfully, our business will suffer.
We face intense competition, including from our end-customers and potential end-customers, and we may not be able to compete effectively, which could reduce our market share and decrease our revenue and profitability.
The markets in which we operate are extremely competitive and are characterized by rapid technological change, continuous evolving end-customer requirements and declining average selling prices. We may not be able to compete successfully against current or potential competitors, which include our current or potential end-customers as they seek to internally develop solutions competitive with ours. If we do not compete successfully, our market share and revenue may decline. We compete with large semiconductor manufacturers and designers, large automotive equipment manufacturers’ internally developed solutions, and others, and our current and potential competitors have longer operating histories, significantly greater resources and name recognition and a larger base of customers than we do. This may allow them to respond more quickly than we can to new or emerging technologies or changes in customer requirements. In addition, these competitors may have greater credibility with our existing and potential end-customers. Some of our current and potential end-customers with their own internally developed solutions may choose not to purchase products from third-party suppliers like us.
We primarily sell our products through a limited number of distributors and to a limited number of end-customers, and if our relationships with one or more of those distributors or end-customers were to terminate, our operating results may be harmed.
We market and distribute our products primarily through a limited number of distributors, most of whom are located in Asia. This distribution channel has been characterized by rapid change and consolidations. Distributors have accounted for a significant portion of our revenue in the past. Sales to our distributors represented substantially all of our revenue for the years ended December 31, 2019, 2018, and 2017. We do not have any long-term contractual commitments with our distributors.
One of our end-customers, Hikvision, the largest security surveillance manufacturer in China, accounted for 50%, 62%, and 59% of our revenue for the years ended December 31, 2019, 2018, and 2017, respectively. Our sales to Hikvision primarily occur through Phitec, as distributor, who purchases our products as a result of demand from Hikvision for our specific products. We do not have any long-term contractual commitment with Hikvision. Losing
8
Hikvision as an end-customer, or if they decide to scale back use of our products, could have a material and adverse effect on our business.
Our operating results and financial condition could be significantly disrupted by the loss of one or more of our current end-customers, distributors and sales representatives, volume pricing discounts, order cancellations, delays in shipment by one of our major distributors, end-customers or sales representatives, or the failure of our distributors or sales representatives to successfully sell our products. Additionally, customer buying patterns change and can fluctuate from quarter to quarter and impact our results of operations, particularly for significant end-customers. These buying patterns can change as a result of factors beyond our control, including inventory adjustments by our end-customers, or changes in demand, which could materially harm our results of operations.
Our revenue and operating results will fluctuate from period to period, which could cause the market price of our JDSs to decline.
Our revenue and operating results are difficult to predict, have in the past fluctuated, and may in the future fluctuate from period to period. It is possible that our operating results in some periods will be below market expectations. This would likely cause the market price of our JDSs to decline. Our operating results in any given period may be affected by a number of factors, including:
|
|
• |
unpredictable volume and timing of end-customer orders, which are not fixed by contract and vary on a purchase order basis; |
|
|
• |
uncertain demand in our primary end markets for our products; |
|
|
• |
the loss of one or more of our distributors or end-customers, causing a significant reduction or postponement of orders from these end-customers; |
|
|
• |
decreases in the overall average selling prices of our products; |
|
|
• |
changes in the relative sales mix of our products; |
|
|
• |
changes in our cost of finished goods; |
|
|
• |
the availability, pricing and timeliness of delivery of other components used in our end-customers’ products; |
|
|
• |
our end-customers’ sales outlook, purchasing patterns and inventory adjustments based on demands and general economic conditions; |
|
|
• |
changes in end-customer order patterns including order cancellations; |
|
|
• |
product obsolescence and our ability to manage product transitions; |
|
|
• |
our ability to successfully develop, introduce and sell new or enhanced products in a timely manner; |
|
|
• |
the timing of new product announcements or introductions by us or by our competitors; |
|
|
• |
changes in business and economic conditions that could affect consumer confidence; and |
|
|
• |
fluctuations in our effective tax rate. |
We base our planned operating expenses in part on our expectations of future revenue, and a significant portion of our expenses is relatively fixed in the short-term. We have limited historical financial data from which to predict future sales for our products. As a result, it is difficult for us to forecast our future revenue and budget our operating expenses accordingly. If revenue for a particular period is lower than we expect, we likely will be unable to proportionately reduce our operating expenses for that period, which would harm our operating results for that period.
9
If the growth of demand for video applications for the security surveillance and automotive markets does not continue, or if we are unsuccessful in selling into the automotive market our ability to increase our revenue and operating results could suffer.
Our ability to increase our revenue will depend on increased demand for video applications in the security surveillance and automotive markets. For the years ended December 31, 2019, 2018, and 2017; 66%, 85%, and 90% of our revenue was derived from the sale of our products designed for the security surveillance market, respectively. If our products sold into this market decline or do not increase, or if demand slows in this market generally, our operating results would suffer. In addition, we have increased our focus on the automotive market and have devoted substantial resources to the development of products for video applications that address this market. We expect that the automotive market will be a substantial driver of our future business, however, we may not be successful developing and marketing our solutions for this market, or gain significant market share. If we are not successful in selling our products into this market, or if the automotive industry in general experiences weak demand, we may not recover the costs associated with our efforts in this area and our operating results could suffer.
The growth of our target markets is uncertain and will depend in particular upon:
|
|
• |
the pace at which new HD video applications are adopted; |
|
|
• |
evolving regulation in different jurisdictions governing backup cameras in automotive applications; |
|
|
• |
a continued reduction in the costs of products in these markets; |
|
|
• |
the availability, at a reasonable price, of components required by such products, such as LCD panels; and |
|
|
• |
consumer confidence and the continued increase of consumer spending levels. |
We depend on key and highly skilled personnel to operate our business, and if we are unable to retain our current personnel and hire additional personnel, our ability to develop and market our products could be harmed.
We believe our future success will depend in large part upon our ability to attract and retain highly skilled managerial, engineering and sales and marketing personnel. We operate in locations where competition for engineering talent is particularly intense, including the Silicon Valley. If we are unable to recruit and retain skilled personnel, our business could suffer and our financial results could decline. The loss of any key personnel or the inability to attract or retain qualified personnel could delay the development and introduction of, and harm our ability to sell, our products and harm the market’s perception of us. We do not have long-term employment contracts with any of our employees, including our key personnel, and their knowledge of our business and industry would be extremely difficult to replace.
We may not sustain or increase profitability in the future, which may cause the market price of our JDSs to decline.
To sustain or increase profitability, we will need to generate and sustain substantially higher revenue while maintaining reasonable cost and expense levels. These expenditures may not result in increased revenue or end-customer growth. Because many of our expenses are fixed in the short-term, or are incurred in advance of anticipated sales, we may not be able to decrease our expenses in a timely manner to offset any shortfall of sales. This will harm our future financial results and negatively impact our profitability. We may not be able to sustain or increase profitability on a quarterly or an annual basis. This may, in turn, cause the price of our JDSs to decline.
We may not be able to manage our future growth effectively, and we may need to incur significant expenditures to address the additional operational and control requirements of our growth.
We have experienced a period of significant growth and expansion, which has placed, and any future expansion will continue to place, a significant strain on management, personnel, systems and financial resources. We have hired additional employees to support an increase in research and development as well as increase our sales and marketing and general and accounting efforts, which resulted in increasing our headcount from 21 employees as
10
of December 31, 2013 to 78 employees as of December 31, 2019. To manage our growth successfully, we believe we must effectively:
|
|
• |
train, integrate and manage additional qualified engineers for research and development activities, sales and marketing personnel and financial and information technology personnel; |
|
|
• |
continue to enhance our customer resource management and manufacturing management systems; |
|
|
• |
implement additional and improve existing administrative, financial and operations systems, procedures and controls, including the requirements of the U.S. Sarbanes-Oxley Act of 2002 and other regulations we are subject to in the United States and in Japan; |
|
|
• |
expand and upgrade our technological capabilities; and |
|
|
• |
manage multiple relationships with our end-customers, distributors, suppliers and other third-parties. |
Our efforts may require substantial managerial and financial resources and may increase our operating costs even though these efforts may not be successful. If we are unable to manage our growth effectively, we may not be able to take advantage of market opportunities, develop new products, satisfy end-customer requirements, execute our business plan or respond to competitive pressures.
Changes to industry standards and technical requirements relevant to our products and markets could adversely affect our business, results of operations and prospects.
Our products are only a part of larger electronic systems. All products incorporated into these systems must comply with various industry standards and technical requirements created by regulatory bodies or industry participants in order to operate efficiently together. Industry standards and technical requirements in our markets are evolving and may change significantly over time. In addition, large industry-leading semiconductor and electronics companies play a significant role in developing standards and technical requirements for the product ecosystems within which our products can be used. Automotive companies typically have exacting requirements for components in their vehicles, which must meet a variety of standards. Our end-customers also may design certain specifications and other technical requirements specific to their products and solutions. These technical requirements may change as the end-customer introduces new or enhanced products and solutions.
Our ability to compete in the future will depend in part on our ability to identify and comply with evolving industry standards and technical requirements. The emergence of new industry standards and technical requirements could render our products incompatible with products developed by other suppliers or make it difficult for our products to meet the requirements of certain of our end-customers in consumer, industrial, automotive and other markets. As a result, we could be required to invest significant time and effort and to incur significant expense to redesign our products to ensure compliance with relevant standards and requirements. If our products are not in compliance with prevailing industry standards and technical requirements for a significant period of time, we could miss opportunities to achieve crucial design wins, our revenue may decline and we may incur significant expenses to redesign our products to meet the relevant standards, which could adversely affect our business, results of operations and prospects.
The market for HD video application integrated circuits is characterized by declines in average selling prices as products mature, and which could negatively affect our revenue and margins.
Our end-customers expect the average selling price of our products to decrease year-over-year and we expect this trend to continue. When such pricing declines occur, we may not be able to mitigate the effects by selling more or higher margin units, or by reducing our manufacturing costs. In such circumstances, our operating results could be materially and adversely affected. Our products have experienced declining average selling prices over their life cycle. The rate of decline may be affected by a number of factors, including relative supply and demand, the level of competition, production costs and technological changes. As a result of the decreasing average selling prices of our products following their launch, our ability to increase or maintain our margins depends on our ability to introduce new or enhanced products with higher average selling prices and to reduce our per-unit cost of sales and our operating costs. We may not be able to reduce our costs as rapidly as companies that operate their own manufacturing, assembly and testing facilities, and our costs may even increase because we do not operate our own
11
manufacturing, assembly or testing facilities, which could also reduce our gross margins. In addition, our new or enhanced products may not be as successful or enjoy as high margins as we expect. If we are unable to offset any reductions in average selling prices by introducing new products with higher average selling prices or reducing our costs, our revenue and margins will be negatively affected and may decrease.
We have engaged in acquisitions in the past and may continue to expand through acquisitions of, or investments in, other companies, which may divert our management’s attention, harm our operating results, result in additional dilution to stockholders and use resources that are necessary to operate our business.
In the past, we have grown our business through acquisitions and we may in the future seek to acquire or invest in businesses, products or technologies that we believe could complement or expand our business, enhance our technical capabilities or otherwise offer growth opportunities. For example, in 2013, we acquired certain high-definition video assets from a third party. Such acquisitions or investments could create risks for us, including:
|
|
• |
difficulties in assimilating acquired personnel, operations and technologies or realizing synergies expected in connection with an acquisition, particularly with acquisitions of companies with large and widespread operations, complex products or that operate in markets in which we historically have had limited experience; |
|
|
• |
unanticipated costs or liabilities, including possible litigation, associated with the acquisition; |
|
|
• |
incurrence of acquisition-related costs and goodwill; |
|
|
• |
diversion of management’s attention from other business concerns; |
|
|
• |
use of resources that are needed in other parts of our business; and |
|
|
• |
use of substantial portions of our available cash to consummate an acquisition. |
A significant portion of the purchase price of companies we acquire may be allocated to acquired goodwill or other intangible assets, which must be assessed for impairment at least annually. If such acquisitions do not yield expected returns, we may be required to take charges to our earnings based on this impairment assessment process, which could harm our results of operations.
We may be unable to complete acquisitions at all or on commercially reasonable terms, which could limit our future growth. Acquisitions could also result in dilutive issuances of equity securities or the incurrence of debt, which could adversely affect our operating results and result in a decline in our stock price and further restrict our ability to pursue business opportunities, including potential acquisitions. In addition, if an acquired business fails to meet our expectations, our operating results may suffer.
We manufacture our products based on our estimates of end-customer demand, and if our estimates are incorrect or our end-customers cancel their orders our financial results could be negatively impacted.
Our sales are made on the basis of purchase orders rather than long-term purchase commitments. In addition, our distributors may cancel purchase orders or defer the shipments of our products. We manufacture our products according to our estimates of end-customer demand. This process requires us to make multiple demand forecast assumptions, each of which may introduce error into our estimates. If we overestimate end-customer demand, we may manufacture products that we may not be able to sell. As a result, we would have excess inventory, which would increase our losses. Conversely, if we underestimate end-customer demand or if sufficient manufacturing capacity were unavailable, we would forego revenue opportunities, lose market share and damage our relationships.
If we fail to develop new products and enhance our existing products in order to react to rapid technological change and market demands, our business will suffer.
We must develop new products and enhance our existing products with improved technologies to meet rapidly evolving end-customer requirements. We need to design products for end-customers who continually require higher performance and functionality at lower costs. For example, we anticipate that sales of 1080p products will decrease as the market moves to higher resolution displays, such as 4K, in the coming years. We must, therefore, continue to
12
cost-effectively add features that enhance performance and functionality to our products. The development process for these advancements is lengthy and requires us to accurately anticipate market trends. Our failure to accurately anticipate market trends in a timely manner will harm the market acceptance of our products and the sales of our products.
Developing and enhancing these products is uncertain and can be time-consuming, costly and complex. There is a risk that these developments and enhancements will be late, fail to meet end-customer or market specifications or not be competitive with products from our competitors that offer comparable or superior performance and functionality. Any new products or product enhancements may not be accepted in new or existing markets. Our business will suffer if we fail to develop and introduce new products or product enhancements on a cost-effective basis.
We rely on a limited number of independent subcontractors for the manufacture, assembly and testing of our semiconductors, and the failure of any of these third-party vendors to deliver products or otherwise perform as requested could damage our relationships with our end-customers, decrease our sales and limit our growth.
We do not have our own manufacturing or assembly facilities and have very limited in-house testing facilities. Therefore, we must rely on third-party vendors to manufacture, assemble and test the products we design. We currently rely TSMC and Fujitsu to produce almost all of our semiconductors. We rely on ASE and Sigurd to assemble, package and test almost all of our products. If these vendors do not provide us with high-quality products, services and production and test capacity in a timely manner, or if one or more of these vendors terminates its relationship with us, we may be unable to obtain satisfactory replacements to fulfill end-customer orders on a timely basis, our relationships with our end-customers could suffer and our sales could decrease. Other significant risks associated with relying on these third-party vendors include:
|
|
• |
reduced control over product cost, delivery schedules and product quality; |
|
|
• |
potential price increases; |
|
|
• |
inability to achieve required production or test capacity and achieve acceptable yields on a timely basis; |
|
|
• |
longer delivery times; |
|
|
• |
increased exposure to potential misappropriation of our intellectual property; |
|
|
• |
shortages of materials that foundries use to manufacture products; |
|
|
• |
labor shortages or labor strikes; and |
|
|
• |
quarantines or closures of manufacturing facilities due to the outbreak of viruses, such as a novel coronavirus first identified in Wuhan, Hubei Province, China (“COVID-19”), SARS, MERS, the avian flu or any similar future outbreaks in Asia. |
We currently do not have long-term supply contracts with any of our third-party vendors. Therefore, they are not obligated to perform services or supply products to us for any specific period, in any specific quantities or at any specific price, except as may be provided in a particular purchase order. Neither TSMC, Fujitsu, ASE nor Sigurd have provided contractual assurances to us that adequate capacity will be available for us to meet future demand for our products. These third-party vendors may allocate capacity to the production of other companies’ products while reducing deliveries to us on short notice. In particular, other customers that are larger and better financed than we are or that have long-term agreements with TSMC, Fujitsu, ASE or Sigurd may cause either or both of them to reallocate capacity to those customers, decreasing the capacity available to us.
Changes to industry regulations relevant to our products and markets could adversely affect our business, results of operations and prospects.
The U.S. National Highway Traffic Safety Administration requires new cars sold after May 2018 in the United States to have backup cameras. There is no guarantee that other jurisdictions will follow the lead of the United States and require backup cameras on vehicles. While we currently anticipate that consumers and regulators in other jurisdictions, including the European Union, will adopt backup cameras, there is no guarantee that this will
13
happen within a time frame that we can take advantage of, or at all. If automotive backup cameras do not become widespread our target market may be much smaller than we anticipate, limiting our potential growth and revenue.
We rely on our relationships with Original Design Manufacturers, or ODMs, to enhance our solutions and market position, and our failure to continue to develop or maintain such relationships in the future would harm our ability to remain competitive.
We develop our products for ODMs that serve a variety of end markets including home and office security surveillance, and automotive applications. For each application, manufacturers create products that incorporate specialized semiconductor technology, which producers further down the supply chain integrate into their products. For example, our solutions may be integrated into a more comprehensive video product that is incorporated into an automotive vehicle or aftermarket system and sold to consumers. We must work closely with manufacturers to ensure that each new generation of our solutions becomes qualified for use in their products. As a result, maintaining close relationships with leading product manufacturers in our target markets is crucial to the long-term success of our business. We could lose these relationships for a variety of reasons, including our failure to qualify as a vendor, our failure to demonstrate the value of our new solutions, declines in product quality, or if ODMs seek to work with vendors with broader product suites, greater production capacity or greater financial resources. If our relationships with key industry participants were to deteriorate or if our solutions were not qualified by our end-customers, our market position and revenue could be materially and adversely affected.
Our business depends on customers, suppliers and operations in Asia, and as a result we are subject to regulatory, operational, financial and political risks, which could adversely affect our financial results.
The percentage of our revenue attributable to sales to customers in Asia was greater than 99% for the years ended December 31, 2019, 2018, and 2017. We derived 73%, 84%, and 85% of our revenue from sales to customers in China for the years ended December 31, 2019, 2018, and 2017, respectively. We expect that revenue from customers in Asia will continue to account for substantially all of our revenue. All our sales currently are denominated in U.S. dollars. As a result, an increase in the value of the U.S. dollar relative to foreign currencies could make our products less competitive in international markets.
Currently, we rely on a network of sales representatives to sell our products internationally. We also have offices in Japan, China, South Korea and Taiwan, which serve various aspects of our business. Moreover, we have in the past relied on, and expect to continue to rely on, suppliers, manufacturers and subcontractors primarily located in Taiwan. Accordingly, we are subject to several risks and challenges, any of which could harm our business and financial results. These risks and challenges include:
|
|
• |
difficulties and costs of staffing and managing international operations across different geographic areas and cultures; |
|
|
• |
compliance with a wide variety of domestic and foreign laws and regulations, including those relating to the import or export of semiconductor products; |
|
|
• |
legal uncertainties regarding taxes, tariffs, quotas, export controls, export licenses and other trade barriers; |
|
|
• |
foreign currency exchange fluctuations relating to our international operating activities; |
|
|
• |
our ability to receive timely payment and collect our accounts receivable; |
|
|
• |
political, legal and economic instability, foreign conflicts and the impact of regional and global infectious illnesses in the countries in which we and our customers, end-customers, suppliers, manufacturers and subcontractors are located; |
|
|
• |
legal uncertainties regarding protection for intellectual property rights in some countries; and |
|
|
• |
fluctuations in freight rates and transportation disruptions. |
14
We have operations outside of the United States and intend to expand our international operations, which exposes us to significant risks.
We have offices in the United States, Japan, South Korea, China and Taiwan. We presently intend to expand our operations in Asia, specifically in Japan. The success of our business depends, in large part, on our ability to operate successfully from geographically disparate locations and to further expand our international operations and sales. Operating in international markets requires significant resources and management attention and subjects us to regulatory, economic and political risks that are different from those we face in the United States. We cannot be sure that further international expansion will be successful. In addition, we face risks in doing business internationally that could expose us to reduced demand for our products, lower prices for our products or other adverse effects on our operating results. Among the risks we believe are most likely to affect us are:
|
|
• |
difficulties, inefficiencies and costs associated with staffing and managing foreign operations, including the regulations we are subject to as a U.S. company with securities publicly traded in Japan; |
|
|
• |
longer and more difficult end-customer qualification and credit checks; |
|
|
• |
greater difficulty collecting accounts receivable and longer payment cycles; |
|
|
• |
the need for various local approvals to operate in some countries; |
|
|
• |
difficulties in entering some foreign markets without larger-scale local operations; |
|
|
• |
compliance with local laws and regulations; |
|
|
• |
unexpected changes in regulatory requirements; |
|
|
• |
reduced protection for intellectual property rights in some countries; |
|
|
• |
adverse tax consequences as a result of repatriating cash generated from foreign operations to the United States; |
|
|
• |
adverse tax consequences, including potential additional tax exposure if we are deemed to have established a permanent establishment outside of the United States; |
|
|
• |
the effectiveness of our policies and procedures designed to ensure compliance with the U.S. Foreign Corrupt Practices Act and similar regulations, and foreign laws generally; |
|
|
• |
fluctuations in currency exchange rates, which could increase the prices of our products to end-customers outside of the United States, increase the expenses of our international operations by reducing the purchasing power of the U.S. dollar and expose us to foreign currency exchange rate risk if, in the future, we denominate our international sales in currencies other than the U.S. dollar; |
|
|
• |
new and different sources of competition; |
|
|
• |
public health emergencies, such as the COVID-19 outbreak in China and other countries; and |
|
|
• |
political and economic instability, and terrorism. |
Our failure to manage any of these risks successfully could harm our operations and reduce our revenue.
We face risks related to health epidemics which could adversely affect our business and results of operations.
Our business could be materially adversely affected by a widespread outbreak of contagious disease, including the recent outbreak of respiratory illness caused by a novel coronavirus first identified in Wuhan, Hubei Province, China, known as COVID-19. We currently have offices in Japan, China, South Korea and Taiwan, and have sales and customer support personnel in such countries, which have each been impacted by COVID-19. We have significant operations in China and derived 73% of our revenue from sales to customers in China, including one end customer that accounted for 50% of our revenue for the year ended December 31, 2019. In addition, we rely on suppliers, manufacturers and subcontractors located in Taiwan, including TSMC for manufacturing our integrated circuits. The effects of this outbreak could include disruptions or restrictions on our employees’ ability to travel in Asia and other affected regions, as well as temporary closures of our offices or the facilities of our
15
suppliers, customers, or other vendors in our supply chain, which could impact our business, interactions and relationships with our customers, third-party suppliers and contractors, and results of operations. In addition, a significant outbreak of contagious diseases in the human population could result in a widespread health crisis that could adversely affect the economies and financial markets of many countries, resulting in an economic downturn that could reduce the demand for our products and likely impact our results of operations.
We face risks associated with doing business in China.
We derived 73%, 84%, and 85% of our revenue for the years ended December 31, 2019, 2018, and 2017, respectively, from distributors located in China. Additionally, for the years ended December 31, 2019, 2018, and 2017, we derived 50%, 62%, and 59%, respectively, of our revenue from sales to one of our China based end-customers, which we primarily sell through one of our China based distributors. As a result, the economic, political, legal and social conditions in China could have a material adverse effect on our business, results of operations and financial condition. In recent years, the Chinese economy has experienced periods of rapid expansion and high rates of inflation. These factors have led to the adoption by the Chinese government, from time to time, of various corrective measures designed to restrict the availability of credit or regulate growth and contain inflation. Various factors may in the future cause the Chinese government to impose controls on credit or prices, or to take other action, which could inhibit economic activity in China, and thereby harm the market for our products. In addition, the legal system in China has inherent uncertainties that may limit the legal protections available in the event of any claims or disputes that we have with third parties, including our ability to protect the intellectual property we develop in China or elsewhere. As China’s legal system is still evolving, the interpretation of many laws, regulations and rules is not always uniform and enforcement of these laws, regulations and rules involve uncertainties, which may limit the remedies available in the event of any claims or disputes with third parties. In addition, any litigation in China may be protracted and result in substantial costs and diversion of resources and management attention. The recent outbreak of COVID-19 in China could adversely impact our business and results of operations. Some of the other risks related to doing business in China include:
|
|
• |
the Chinese government exerts substantial influence over the manner in which we must conduct our business activities; |
|
|
• |
restrictions on currency exchange may limit our ability to receive and use our cash effectively; |
|
|
• |
increased uncertainties related to the enforcement of intellectual property rights; |
|
|
• |
the Chinese government may favor local businesses and make it more difficult for foreign businesses to operate in China on an equal footing, or generally; |
|
|
• |
increased uncertainties related to the enforcement of contracts with certain parties; and |
|
|
• |
more restrictive rules on foreign investment could adversely affect our ability to expand our operations in China. |
As a result of our growing operations in China, these risks could have a material adverse effect on our business, results of operations and financial condition.
Changes in the U.S. trade environment, including potential changes in international trade relations between China and the United States, could adversely affect the amount or timing of our revenues, results of operations or cash flows.
The current U.S. presidential administration has called for substantial changes to U.S. foreign trade policy, and in particular with respect to China, including the possibility of imposing greater restrictions on international trade and significant increases in tariffs on goods imported into the United States. A significant percentage of our sales are made to customers located in Asia, and in particular China. The percentage of our revenue attributable to sales to customers in Asia and in China was greater than 99% and 73% of our revenue for the year ended December 31, 2019, respectively. In addition, our largest end customer, Hikvision, who accounted for 50% of our revenue for the year December 31, 2019, is located in China and is currently included in recent trade legislation described below.
16
There is significant uncertainty about the future relationship between the United States and China, including with respect to trade policies, treaties, government regulations and tariffs. On August 13, 2018, President Trump enacted the John S. McCain National Defense Authorization Act for Fiscal Year 2019 (“NDAA”), which includes a prohibition on U.S. government agencies from procuring certain covered telecommunications equipment or entering into a contract with any entity that uses any equipment, system or service as a substantial or essential component of any system, or as critical technology as party of any system. Video surveillance equipment produced by Hikvision is included in the specified telecommunications equipment under the NDAA. The products that we sell Hikvision are used in its video surveillance equipment. The NDAA does not prohibit commercial sales into the United States by Hikvision. However, these new restrictions placed on United States government procurement could negatively impact our business. In addition, on October 7, 2019, Hikvision was added to the BIS Entity List, which imposes a requirement to obtain an export license for all items subject to the Export Administration Regulations (EAR) in order to be shipped to Hikvision. Although our products are not currently subject to the EAR, and thus, do not require an export license for export to Hikvision, we may face additional requirements in the future now that Hikvision has been placed on the BIS Entity List. These new regulations also illustrate the uncertain regulatory environment our business faces by doing a significant portion of our business in China and with Hikvision.
In addition, the U.S. government recently proposed new or higher tariffs on specified imported products originating from China in response to what it characterizes as unfair trade practices, and China has responded by proposing new or higher tariffs on specified products imported from the United States. There is a risk of further escalation and retaliatory actions between the two countries. If significant tariffs or other restrictions are placed on goods imported into the United States from China or any related counter-measures are taken by China, our revenue and results of operations may be materially harmed. These tariffs may also make our products more expensive for consumers, which may reduce consumer demand. We may need to offset the financial impact by, among other things, modifying other business practices or raising prices. If we are not successful in offsetting the impact of any such tariffs, our business and financial results may be adversely affected.
The current U.S. presidential administration, certain members of Congress and federal officials have stated that the United States may seek to implement more protective trade measures, not just with respect to China but with respect to other countries in the Asia Pacific region as well. This could include new or higher tariffs and even more restrictive trade barriers, such as prohibiting certain types of, or all sales of certain products or products sold by certain parties into the United States. Any increased trade barriers or restrictions on global trade, especially trade with China, could have a materially adverse impact on our business and financial results.
Due to the cyclical nature of the semiconductor, electronics and automotive industries, our operating results may fluctuate significantly, which could adversely affect the market price of our JDSs.
The semiconductor, electronics and automotive industries are highly cyclical and subject to rapid change and evolving industry standards and, from time to time, have experienced significant downturns. These downturns are characterized by decreases in product demand, excess customer inventory and in certain instances accelerated erosion of prices. Any downturns in any of these industries may be severe and prolonged, and any failure of any of these industries to fully recover from downturns could harm our business. The semiconductor industry, in particular, also periodically experiences increased demand and production capacity constraints, which may affect our ability to ship products. Accordingly, our operating results have varied and may vary significantly as a result of the general conditions in the semiconductor, electronics and automotive industries, which could cause the market price of our JDSs to decline.
Our headquarters are located in the State of California and we have operations in Japan, which we intend to expand, which are areas subject to significant earthquake risks and other natural disasters. Any disruption to our or our third-party vendors’ operations resulting from earthquakes or other natural disasters could cause significant delays in the production or shipment of our product.
Our headquarters are located in Northern California and we have operations in Japan, which we intend to expand. Additionally, our third-party vendors, including TSMC, Fujitsu, ASE and Sigurd, are also located in the Pacific Rim region. The risk of an earthquake, typhoon, tsunami or other extreme weather in the Pacific Rim region including California, Japan, and Taiwan where some of our third-party vendors are located, is significant due to the proximity of major earthquake fault lines. We are also vulnerable to damage from other types of disasters, such as power loss, disruption due to nuclear disaster, fire, floods and similar events. If any such disaster were to occur, our
17
ability to operate our business could be seriously impaired. In addition, we may not have adequate insurance to cover our losses resulting from disasters or other similar significant business interruptions. Any significant losses that are not recoverable under our insurance policies could seriously impair our business and financial condition.
Uncertain geopolitical conditions could have a material adverse effect on our business and the market on which our JDSs currently trade, which could cause the market price of our JDSs to decline.
Our JDSs are listed on the Mothers market on the Tokyo Stock Exchange. In addition, a significant portion of our business is conducted internationally, particularly in Japan. The Japanese economy is exposed to uncertainty in geopolitical conditions, including concerns over North Korea’s nuclear weapons program. Given Japan’s close proximity to North Korea, continuing tensions between North Korea and other countries could have adverse consequences in Japan. There continues to be heightened security concerns regarding North Korea’s nuclear weapons and long-range ballistic missile programs. This has resulted in increased uncertainty regarding both North Korea’s actions and those of the United States. If North Korea were to take an aggressive action, including acts of war, trading on the Mothers market may be disrupted and our business operations in Japan and elsewhere could be disrupted as well. In addition, terrorist acts and other acts of violence and political unrest could have an adverse impact on our business. If our business and the trading of our JDSs on the Mothers market is disrupted as a result of acts of war, hostilities, terrorism or other conditions leading to geopolitical unrest, particularly in the region surrounding Japan, the market price of our JDSs could decline.
Our sales cycle can be lengthy, which could result in uncertainty and delays in generating revenue.
We have experienced a lengthy sales cycle for some of our products, particularly those designed for HD video applications in the automotive market. Our sales cycles typically ranges from three to six months for the security surveillance market and one to three years for the automotive industry. We may experience a delay between the time we increase expenditures for research and development, sales and marketing efforts and inventory to the time we generate revenue, if any, from these expenditures. In addition, because we do not have long-term commitments from our end-customers, we must repeat our sales process on a continual basis even for current end-customers looking to purchase a new product. As a result, our business could be harmed if an end-customer reduces or delays its orders, chooses not to release products incorporating our semiconductors or elects not to purchase a new product or product enhancements from us.
We may experience difficulties in transitioning to new wafer fabrication process technologies or in achieving higher levels of design integration, which may result in reduced manufacturing yields, delays in product deliveries and increased expenses.
We periodically evaluate the benefits of migrating our solutions to other technologies in order to improve performance and reduce costs. These ongoing efforts require us from time to time to modify the manufacturing processes for our products and to redesign some products, which in turn may result in delays in product deliveries. We may face difficulties, delays and increased expense as we transition our products to new processes, and potentially to new foundries. We will depend on our third-party foundries as we transition to new processes. We cannot assure you that our third-party foundries will be able to effectively manage such transitions or that we will be able to maintain our relationship with our third-party foundries or develop relationships with new third-party foundries. If we or any of our third-party foundries experience significant delays in transitioning to new processes or fail to efficiently implement transitions, we could experience reduced manufacturing yields, delays in product deliveries and increased expenses, any of which could harm our relationships with our end-customers and our operating results.
As smaller line width geometry manufacturing processes become more prevalent, we intend to move our future products to increasingly smaller geometries in order to reduce costs while integrating greater levels of functionality into our products. This transition will require us and our third-party foundries to migrate to new designs and manufacturing processes for smaller geometry products. We may not be able to achieve smaller geometries with higher levels of design integration or to deliver new integrated products on a timely basis. We periodically evaluate the benefits, on a product-by-product basis, of migrating to smaller geometry process technologies to reduce our costs and increase performance. We are dependent on our relationships with our third-party foundries to transition to smaller geometry processes successfully. We cannot assure you that our third-party
18
foundries will be able to effectively manage any such transition. If we or our third-party foundries experience significant delays in any such transition or fail to implement a transition, our business, financial condition and results of operations could be materially harmed.
The complexity of our products may lead to errors, defects and bugs, which could negatively impact our reputation with end-customers and result in liability or a product recall, particularly in the automotive industry.
Products as complex as ours may contain errors, defects and bugs when first introduced to end-customers or as new versions are released. Our products have in the past experienced such errors, defects and bugs. Delivery of products with production defects or reliability, quality or compatibility problems could significantly delay or hinder market acceptance of the products or result in a costly recall and could damage our reputation and adversely affect our ability to retain existing end-customers and attract new end-customers. Errors, defects or bugs could cause problems with the functionality of our products, resulting in interruptions, delays or cessation of sales of these products to our end-customers. We may also be required to make significant expenditures of capital and resources to resolve such problems. We cannot assure you that problems will not be found in new products, both before and after commencement of commercial production, despite testing by us, our suppliers or our end-customers. Any such problems could result in:
|
|
• |
delays in development, manufacture and roll-out of new products; |
|
|
• |
additional development costs; |
|
|
• |
loss of, or delays in, market acceptance; |
|
|
• |
diversion of technical and other resources from our other development efforts; |
|
|
• |
claims for damages by our end-customers or others against us; and |
|
|
• |
loss of credibility with our current and prospective end-customers. |
Any such event could have a material adverse effect on our business, financial condition and results of operations.
The automotive industry, in particular, experiences a significant number of product liability claims. As a supplier of products into the automotive market, we face an inherent business risk of exposure to product liability claims in the event that our products, or the equipment into which our products are incorporated, malfunction and result in personal injury or death. We may be named in product liability claims even if there is no evidence that our systems or components caused the accidents. Product liability claims could result in significant losses as a result of expenses incurred in defending claims or the award of damages. The sale of systems and components for the automotive industry entails a high risk of these claims. In addition, we may be required to participate in recalls involving these systems if any of our systems prove to be defective, or we may voluntarily initiate a recall or make payments related to such claims as a result of various industry or business practices or the need to maintain good end-customer relationships. Our other products may also be subject to product liability claims or recalls.
Our costs may increase substantially if our third-party manufacturing contractors do not achieve satisfactory product yields or quality.
The fabrication process is extremely complicated and small changes in design, specifications or materials can result in material decreases in product yields or even the suspension of production. From time to time, the third-party foundries that we contract to manufacture our products may experience manufacturing defects and reduced manufacturing yields related to errors or problems in their manufacturing processes or the interrelationship of their processes with our designs. In some cases, our third-party foundries may not be able to detect these defects early in the fabrication process or determine the cause of such defects in a timely manner.
Generally, in pricing our products, we assume that manufacturing yields will continue to improve, even as the complexity of our products increases. Once our products are initially qualified with our third-party foundries, minimum acceptable yields are established. We are responsible for the costs of the units if the actual yield is above the minimum. If actual yields are below the minimum we are not required to purchase the units. Typically, minimum
19
acceptable yields for our new products are lower at first and gradually improve as we achieve full production. Unacceptably low product yields or other product manufacturing problems could substantially increase overall production time and costs and adversely impact our operating results. Product yield losses will increase our costs and reduce our gross margin. In addition to significantly harming our results of operations and cash flow, poor yields may delay shipment of our products and harm our relationships with existing and potential end-customers.
If we fail to achieve initial design wins for our products, we may lose the opportunity for sales for a significant period of time to end-customers and be unable to recoup our investments in our products.
We expend considerable resources in order to achieve design wins for our products, especially our new products and product enhancements. Once an end-customer designs our solution into a product, it is likely to continue to use the same version of that component for a lengthy period of time due to the significant costs associated with qualifying a new supplier and potentially redesigning the product to incorporate a different component, particularly in the automotive market. If we fail to achieve an initial design win in an end-customer’s qualification process, we may lose the opportunity for significant sales to that end-customer for a number of its products and for a lengthy period of time. Additionally, manufacturers in certain markets, including the automotive market, may require that third-party vendors undergo extensive qualification processes. This qualification process may take up to six months for the security surveillance market and up to three years for the automotive industry, or even longer for some end-customers. If we experience difficulties qualifying our solutions, we may experience delayed or reduced revenue. Furthermore, even if we successfully qualify our solutions with an end-customer, such end-customer may need to qualify other components being sourced for its system and qualify its system as a whole with its end-customers. This may cause us to be unable to recoup our investments in our products, which would harm our business.
If sales of our end-customers’ products decline or if their products do not achieve market acceptance, our business and operating results could be adversely affected.
Our revenue depends on our end-customers’ ability to commercialize their products successfully. The markets for our end-customers’ products are extremely competitive and are characterized by rapid technological change, and in certain instances, government regulation. Competition in our end-customers’ markets is based on a variety of factors including price, performance, product quality, marketing and distribution capability, customer support, name recognition and financial strength. As a result of rapid technological change, the markets for our end-customers’ products, particularly in the security surveillance market, are characterized by frequent product introductions, short product life cycles, fluctuating demand and increasing product capabilities. As a result, our end-customers’ products may not achieve market success or may become obsolete. We cannot assure you that our end-customers will dedicate the resources necessary to promote and commercialize their products, successfully execute their business strategies for such products, or be able to manufacture such products in quantities sufficient to meet demand or cost-effectively manufacture products at a high volume. Our end-customers do not have contracts with us that require them to manufacture, distribute or sell any products. Moreover, our end-customers, or their customers, may develop internally, or in collaboration with our competitors, technology that they may utilize instead of the technology available to them through us. Our end-customers’ failure to achieve market success for their products, including as a result of general declines in our end-customers’ markets or industries, could negatively affect their willingness to utilize our products, which may result in a decrease in our revenue and negatively affect our business and operating results.
Our revenue also depends on the timely introduction, quality and market acceptance of our end-customers’ products that incorporate our solutions. Our end-customers’ products are often very complex and subject to design complexities that may result in design flaws, as well as potential defects, errors and bugs. We incur significant design and development costs in connection with designing our solutions for end-customers’ products. If our end-customers discover design flaws, defects, errors or bugs in their products, or if they experience changing market requirements, failed evaluations or field trials, or issues with other vendors, they may delay, change or cancel a project. If we have already incurred significant development costs, we may not be able to recoup those costs, which in turn would adversely affect our business and financial results.
20
Intellectual property litigation, which is common in our industry, could be costly, harm our reputation, limit our ability to sell our products and divert the attention of management and technical personnel.
Our industry is characterized by frequent litigation regarding patent and other intellectual property rights. For example, in the past, we received a letter inviting us to license technology from a third party, which may be a prelude to claims of infringement and a potential lawsuit. We have certain indemnification obligations to end-customers under our contract development projects with respect to any infringement of third-party patents and intellectual property rights by our products. If a lawsuit were to be filed against us in connection with claims of infringement, our business would be harmed.
Questions of infringement in the HD video applications market involve highly technical and subjective analyses. Litigation may be necessary in the future to enforce any patents we may receive and other intellectual property rights, to protect our trade secrets, to determine the validity and scope of the proprietary rights of others or to defend against claims of infringement or invalidity, and we may not prevail in any future litigation. Litigation, whether or not determined in our favor or settled, could be costly, could harm our reputation, could cause our end-customers to use our competitors’ products and could divert the efforts and attention of management and technical personnel from normal business operations. In addition, adverse determinations in litigation could result in the loss of our proprietary rights, subject us to significant liabilities, require us to seek licenses from third parties or prevent us from licensing our technology or selling our products, any of which could seriously harm our business.
Failure to protect our intellectual property could substantially harm our business.
Our success and ability to compete depend in part upon our ability to protect our intellectual property. We currently rely on a combination of intellectual property rights, including mask work protection, copyrights, trademarks, trade secrets and know-how, in the United States and other jurisdictions. We have filed patent applications to help us protect our intellectual property, but there is no assurance that these applications will be successful. The steps we take to protect our intellectual property rights may not be adequate, particularly in foreign jurisdictions such as China. In addition, any patents we hold in the future may not adequately protect our intellectual property rights or our products against competitors, and third parties may challenge the scope, validity or enforceability of our issued patents. In addition, other parties may independently develop similar or competing technologies designed around any patents or patent applications that we may hold. Some of our products and technologies are not covered by any patent or patent application, as we do not believe patent protection of these products and technologies is critical to our business strategy at this time. A failure to timely seek patent protection on products or technologies generally precludes us from seeking future patent protection on these products or technologies.
In addition to patent applications, we also rely on contractual protections with our end-customers, suppliers, distributors, employees and consultants, and we implement security measures designed to protect our trade secrets and know-how. However, we cannot assure you that these contractual protections and security measures will not be breached, that we will have adequate remedies for any such breach or that our end-customers, suppliers, distributors, employees or consultants will not assert rights to intellectual property or damages arising out of such contracts.
We may initiate claims against third parties to protect our intellectual property rights if we are unable to resolve matters satisfactorily through negotiation. Litigation brought to protect and enforce our intellectual property rights could be costly, time-consuming and distracting to management. It could also result in the impairment or loss of portions of our intellectual property, as an adverse decision could limit our ability to assert our intellectual property rights, limit the value of our technology or otherwise negatively impact our business, financial condition and results of operations. Additionally, any enforcement of our patents or other intellectual property may provoke third parties to assert counterclaims against us. Our failure to secure, protect and enforce our intellectual property rights could materially harm our business.
A breach of our information and physical security systems may damage our reputation, subject us to lawsuits and adversely affect our business.
Our security systems are designed to protect our end-customers’, suppliers’ and employees’ confidential information, as well as maintain the physical security of our facilities. We also rely on a number of third-party
21
“cloud-based” service providers of corporate infrastructure services relating to, among other things, human resources, electronic communication services and some finance functions, and we are, of necessity, dependent on the security systems of these providers. Any security breaches or other unauthorized access by third parties to the systems of our cloud-based service providers or the existence of computer viruses in their data or software could expose us to a risk of information loss and misappropriation of confidential information. Accidental or willful security breaches or other unauthorized access by third parties to our information systems or facilities, or the existence of computer viruses in our data or software, could expose us to a risk of information loss and misappropriation of proprietary and confidential information belonging to us, our end-customers or our suppliers. Any theft or misuse of this information could result in, among other things, unfavorable publicity, damage to our reputation, difficulty in marketing our products, allegations by our end-customers that we have not performed our contractual obligations, litigation by affected parties and possible financial obligations for liabilities and damages related to the theft or misuse of this information, any of which could have a material adverse effect on our business, financial condition, our reputation, and our relationships with our end-customers and partners. Since the techniques used to obtain unauthorized access or to sabotage systems change frequently and are often not recognized until launched against a target, we may be unable to anticipate these techniques or to implement adequate preventative measures.
We may not be able to secure additional financing on favorable terms, or at all, to meet our future capital needs.
We have funded our operations since inception through equity financings and through sales of our products. In the future, we may require additional capital to fund our ongoing operations, respond to business opportunities, challenges, acquisitions or unforeseen circumstances and may decide to engage in equity or debt financings or enter into credit facilities, but we may not be able to timely secure additional debt or equity financing on favorable terms or at all.
Any debt financing obtained by us in the future could also involve restrictive covenants relating to our capital-raising activities and other financial and operational matters, which may make it more difficult for us to obtain additional capital and to pursue business opportunities, including potential acquisitions.
If we raise additional funds through issuances of equity, convertible debt securities or other securities convertible into equity, our existing stockholders could suffer significant dilution in their percentage ownership of our company, and any new equity securities we issue could have rights, preferences and privileges senior to those of holders of our common stock. If we are unable to obtain adequate financing or financing on terms satisfactory to us, when we require it, our ability to continue to grow or support our business and to respond to business challenges could be significantly limited.
If we fail to hire additional finance personnel and strengthen our financial reporting systems and infrastructure, we may not be able to timely and accurately report our financial results or comply with the requirements of being a public company, including compliance with the U.S. Sarbanes-Oxley Act, the SEC, and Japanese reporting requirements.
We intend to hire additional accounting and finance staff with technical accounting, SEC and Japanese reporting, and U.S. Sarbanes-Oxley Act compliance expertise. Any inability to recruit and retain such staff would have an adverse impact on our ability to accurately and timely prepare our financial statements. We may be unable to locate and hire qualified professionals with requisite technical, language and public company experience when and as needed. In addition, new employees will require time and training to learn our business and operating processes and procedures. If our finance and accounting organization is unable for any reason to respond adequately to the increased demands that will result from being a public company, the quality and timeliness of our financial reporting may suffer, which could result in the identification of material weaknesses in our internal controls. Any consequences resulting from inaccuracies or delays in our reported financial statements could cause the trading price of our common stock to decline and could harm our business, operating results and financial condition.
If we fail to strengthen our financial reporting systems and infrastructure to meet the demands placed upon us as a public company, including the requirements of the U.S. Sarbanes-Oxley Act and the requirement to comply with public disclosure regulations in both the U.S. and in Japan, we may be unable to report our financial results timely and accurately and prevent fraud. We have and expect to continue to incur significant expense and devote
22
substantial management effort toward ensuring compliance with reporting requirements in Japan and the U.S., including the Sarbanes-Oxley Act.
We will continue to incur significantly increased costs and devote substantial management time as a result of operating as a public company that is subject to both U.S. and Japanese regulations.
As a public U.S. company listed in Japan, we will continue to incur significant legal, accounting and other expenses that we did not incur as a private company and even beyond that of a domestic company listed in the United States. For example, we are subject to the reporting requirements of the U.S. Securities Exchange Act of 1934 (the “Exchange Act”), and are required to comply with the applicable requirements of the U.S. Sarbanes-Oxley Act and the U.S. Dodd-Frank Wall Street Reform and Consumer Protection Act, or the Dodd-Frank Act, as well as rules and regulations subsequently implemented by the SEC, including the establishment and maintenance of effective disclosure and internal controls and the establishment corporate governance practices. Additionally, we are required to comply with applicable securities and disclosure laws in Japan in accordance with the Financial Instruments and Exchange Act of Japan and related regulations, including a requirement to file periodic reports in Japanese, and the rules of the Tokyo Stock Exchange. Compliance with these requirements will continue to increase our legal and financial compliance costs and make some activities more time consuming and costly. We cannot predict or estimate the amount of additional costs we may incur or the timing of such costs. We also expect that it will continue to be expensive for us to maintain director and officer liability insurance.
If we are unable to implement and maintain effective internal control over financial reporting in the future, investors may lose confidence in the accuracy and completeness of our financial reports and the market price of the JDSs may be negatively affected.
As a public company, we are required to maintain internal controls over financial reporting and to report any material weaknesses in such internal controls. Section 404 of the U.S. Sarbanes-Oxley Act requires that we evaluate and determine the effectiveness of our internal control over financial reporting and provide a management report on our internal control over financial reporting, which must be attested to by our independent registered public accounting firm to the extent we are no longer an “emerging growth company,” as defined by the JOBS Act. If we have one or more material weaknesses in our internal control over financial reporting, we may not detect errors on a timely basis and our financial statements may be materially misstated. If we identify material weaknesses in our internal control over financial reporting, if we are unable to comply with the requirements of Section 404 in a timely manner, if we are unable to determine that our internal control over financial reporting is effective, or if our independent registered public accounting firm is unable to express an opinion as to the effectiveness of our internal control over financial reporting, investors may lose confidence in the accuracy and completeness of our financial reports, the market price of the JDSs could be negatively affected, and we could become subject to investigations by the TSE, the SEC, Japanese securities authorities, or other regulatory authorities, which could require additional financial and management resources.
Regulations related to “conflict minerals” may force us to incur additional expenses, may make our supply chain more complex and may result in damage to our reputation with end-customers.
Pursuant to the Dodd-Frank Act, the SEC has adopted requirements for companies that use certain minerals and metals, known as conflict minerals, in their products, whether or not these products are manufactured by third parties. The Dodd-Frank Act requires companies to perform due diligence, disclose and report whether or not such minerals originate from the Democratic Republic of Congo and adjoining countries. The implementation of these requirements could adversely affect the sourcing, availability and pricing of minerals used in the manufacture of our products, and affect our costs and relationships with end-customers, distributors and suppliers as we must obtain additional information from them to ensure our compliance with the disclosure requirement. Since our supply chain is complex, we may not be able to sufficiently verify the origins for these minerals and metals used in our products through the due diligence procedures that we implement, which may harm our reputation. In such event, we may also face difficulties in satisfying end-customers who require that all of the components of our products are certified as conflict mineral free and these end-customers may discontinue, or materially reduce, purchases of our products, which could result in a material adverse effect on our results of operations and our financial condition may be adversely affected.
23
We are an emerging growth company. We cannot be certain if the reduced disclosure requirements applicable to emerging growth companies will make our JDSs less attractive to investors.
We are an emerging growth company. Under the JOBS Act, emerging growth companies can delay adopting new or revised accounting standards until such time as those standards apply to private companies. For as long as we continue to be an emerging growth company, we also intend to take advantage of certain other exemptions from various reporting requirements that are applicable to other public companies including the exemption from the auditor attestation requirements of Section 404 of the U.S. Sarbanes-Oxley Act, the reduced disclosure obligations regarding executive compensation, and exemptions from the requirements of holding a nonbinding advisory vote on executive compensation and stockholder approval of any golden parachute payments not previously approved. We cannot predict if investors will find our JDSs less attractive because we will rely on these exemptions. If some investors find our JDSs less attractive as a result, there may be a less active trading market for our JDS and the trading price of our JDSs may be more volatile.
In order to comply with environmental laws and regulations, we may need to modify our activities or incur substantial costs, and if we fail to comply with environmental regulations we could be subject to substantial fines or be required to have our suppliers alter their processes.
The HD video application semiconductor industry is subject to a variety of international, federal, state and local governmental regulations directed at preventing or mitigating environmental harm, as well as to the storage, discharge, handling, generation, disposal and labeling of toxic or other hazardous substances. Failure to comply with environmental regulations could subject us to civil or criminal sanctions and property damage or personal injury claims. Compliance with current or future environmental laws and regulations could restrict our ability to expand our business or require us to modify processes or incur other substantial expenses which could harm our business. In response to environmental concerns, some end-customers and government agencies impose requirements for the elimination of hazardous substances, such as lead (which is widely used in soldering connections in the process of semiconductor packaging and assembly), from electronic equipment. For example, the European Union adopted its Restriction on Hazardous Substance Directive which prohibits, with specified exceptions, the sale in the EU market of new electrical and electronic equipment containing more than agreed levels of lead or other hazardous materials and China has enacted similar regulations. Environmental laws and regulations such as these could become more stringent over time, causing a need to redesign technologies, imposing greater compliance costs and increasing risks and penalties associated with violations, which could seriously harm our business.
The issuance of new accounting standards or future interpretations of existing accounting standards could adversely affect our operating results.
We prepare our financial statements in accordance with U.S. Generally Accepted Accounting Principles, or GAAP. A change in those principles could have a significant effect on our reported results and might affect our reporting of transactions completed before a change is announced. GAAP is issued and subject to interpretation by the U.S. Financial Accounting Standards Board, the SEC and various other bodies formed to promulgate and interpret accounting principles. A change in these principles or interpretations could have a significant effect on our reported financial results, and could affect the reporting of transactions completed before the announcement of a change. The issuance of new accounting standards or future interpretations of existing accounting standards, or changes in our business practices or estimates, could result in future changes in our revenue recognition or other accounting policies that could have a material adverse effect on our results of operations.
Management may apply our cash and cash equivalents to uses that do not increase our market value or improve our operating results.
We intend to use our cash and cash equivalents for general corporate purposes, including working capital and capital expenditures. We may also use a portion of our cash and cash equivalents to acquire or invest in complementary technologies, businesses or other assets. We have not reserved or allocated our cash and cash equivalents for any specific purpose, and we cannot state with certainty how management will use our cash and cash equivalents. Accordingly, management has considerable discretion in applying our cash and cash equivalents and may use our cash and cash equivalents for purposes that do not result in any increase in our results of operations or
24
market value. Until the cash and cash equivalents are used, they may be placed in investments that do not produce income or lose value.
Risks Related to Ownership of the JDSs and our Underlying Common Stock
Japanese Depositary Shares are a relatively new form of security and there could be unforeseen difficulties or risks associated with JDSs.
Our initial public offering of JDSs, a form of representative instrument recently authorized by Japanese law was a unique offering for capital stock in a single non-Japanese issuer. The complexity of JDSs as described in these “Risk Factors”, or other unforeseen difficulties or risks associated with JDSs, could increase volatility, decrease liquidity or otherwise negatively affect the trading price of our JDSs. For a further description of the JDSs, please read the “Description of Japanese Depositary Shares” found in our prospectus filed pursuant to Rule 424(b)(4), on September 20, 2017.
Prior to our initial public offering in September 2017, there was no prior public market for the JDSs or our underlying common stock, and the market price of our JDSs may be volatile or may decline regardless of our operating performance.
Prior to our initial public offering in September 2017, there was no public market for our common stock, and an active and liquid public market for our stock may not develop or be sustained. The market price of our JDSs may fluctuate significantly in response to numerous factors, many of which are beyond our control, including:
|
|
• |
overall performance of the equity markets in general, in our industry or in the markets we address; |
|
|
• |
our operating performance and the performance of other similar companies; |
|
|
• |
changes in the estimates of our results of operations that we provide to the public, our failure to meet these projected results or changes in recommendations by securities analysts that elect to follow our company; |
|
|
• |
announcements of technological innovations, new products or enhancements to products, acquisitions, strategic alliances or significant agreements by us or by our competitors; |
|
|
• |
announcements of new business partners, on the termination of existing business partner arrangements or changes to our relationships with such business partners; |
|
|
• |
recruitment or departure of key personnel; |
|
|
• |
announcements of litigation or claims against us; |
|
|
• |
changes in legal requirements relating to our business; |
|
|
• |
the economy as a whole, market conditions in our industry, and the industries of our customers and end-customers; |
|
|
• |
the effectiveness and willingness of investors to adopt the JDS instrument; |
|
|
• |
trading activity by our principal stockholders; |
|
|
• |
the size of our market float; and |
|
|
• |
any other factors discussed in this Annual Report on Form 10-K. |
In addition, the stock markets have experienced extreme price and volume fluctuations that have affected and continue to affect the market prices of equity securities of many technology companies. Stock prices of many technology companies have fluctuated in a manner unrelated or disproportionate to the operating performance of those companies. In the past, stockholders have filed securities class action litigation following periods of market volatility. If we were to become involved in securities litigation, it could subject us to substantial costs, divert resources and the attention of management from our business, and adversely affect our business.
25
Due to daily price range limitations under Japanese stock exchange rules, our JDSs may not be sold at a particular price on any particular trading day, or at all.
The JDSs are listed on the Mothers market of the Tokyo Stock Exchange and traded as though the JDSs are shares of Japanese companies. Stock prices on Japanese stock exchanges are determined on a real-time basis by the equilibrium between bids and offers. These exchanges are order-driven markets without specialists or market makers to guide price formation. To prevent excessive volatility, these exchanges set daily upward and downward price fluctuation limits for each stock, based on the previous day’s closing price. Although transactions may continue at the upward or downward limit price if the limit price is reached on a particular trading day, no transactions may take place outside these limits. Consequently, a stockholder wishing to sell their JDSs at a price above or below the relevant daily limit may not be able to sell their JDSs at such price on a particular trading day, or at all.
If securities analysts do not publish research or reports about our business or if they downgrade the JDSs, the trading price of our JDSs could decline.
The trading market for our JDSs will rely in part on the research and reports that industry or financial analysts publish about us or our business. We do not control these analysts. If fewer analysts provide coverage of our company, the price and trading volume of the JDSs could suffer. If one or more of the analysts who cover us downgrade the JDSs, or publish unfavorable research about our business, the trading price of our JDSs would likely decline rapidly. If one or more of these analysts cease coverage of our company or fail to publish regularly, we could lose visibility in the market, which in turn could cause the trading price of our JDSs to decline.
Because the trading market for our JDSs is the Mothers market of the Tokyo Stock Exchange, the corporate governance rules of the major U.S. stock exchanges will not apply to us. As a result, our governance practices may differ from those of a company listed on such U.S. exchanges.
Our governance practices may not comply with certain New York Stock Exchange and NASDAQ corporate governance standards, including:
|
|
• |
the requirement that a majority of our board of directors consist of independent directors; |
|
|
• |
the requirement that we have an audit committee that is composed entirely of independent directors with a written charter addressing the committee’s purpose and responsibilities; and |
|
|
• |
the requirement that we have a compensation committee that is composed entirely of independent directors with a written charter addressing the committee’s purpose and responsibilities. |
There can be no assurance that we will voluntarily comply with any of the foregoing requirements. Accordingly, you may not have the same protections afforded to stockholders of companies that are subject to such corporate governance requirements.
JDS holders do not have stockholders’ rights.
JDS holders are not treated as our stockholders, other than as required by law, and accordingly, a JDS holder will not have a stockholder’s rights, including the right to bring a stockholders’ derivative lawsuit against our directors and officers. JDS holders have the rights as beneficiaries as set forth in the trust agreement with Mitsubishi UFJ Trust and Banking Corporation, as Trustee, and Mizuho Securities Co., Ltd., as Initial Settlor, of the trust. JDS holders may exercise voting rights with respect to the common stock underlying their JDSs only in accordance with the provisions of the trust agreement. The Trustees will notify JDS holders of the upcoming vote and arrange to deliver our voting materials. Upon receipt of voting instructions from our JDS holders in the manner set forth in the trust agreement, the Trustees for the JDSs will endeavor to vote the underlying common stock in accordance with these instructions. If an instruction form does not specify any instructions, the Trustees will be deemed to have been instructed to vote in favor of our proposal. The Trustees may not vote in accordance with an instruction or submit a proxy to us unless the Trustees receive the relevant documents necessary to vote the common stock underlying the JDSs at least five business days prior to the date of the stockholders meeting. Should the Trustees not receive information from a JDS holder for any reason, the JDS holders may not be able to receive the necessary documents
26
to exercise their voting rights. As a result, JDS holders may not be able to exercise their right to vote and may lack recourse if their shares of common stock are not voted as requested.
We do not presently intend to facilitate secondary trading of our JDSs or common stock in the United States and we are not taking any of the steps necessary to register our JDSs or common stock with the securities division of any state within the United States or seek an exemption for such secondary trading.
We have not applied to register our JDSs or common stock under the laws of any state or other jurisdiction of the United States other than under the U.S. Securities Act of 1933, nor do we intend to make such an application. Until our JDSs and/or common stock are listed for trading on a U.S. national securities exchange, trading in, or the offer and sale of, our JDSs or common stock will be subject to the securities laws of the various states and jurisdictions of the United States in addition to U.S. federal securities law. As a result, investors may not resell their JDSs or common stock in the United States without satisfying the applicable state securities law or qualifying for an exemption therefrom, including the exemptions provided under the U.S. National Securities Markets Improvement Act of 1996. These restrictions and potential costs could be significant burdens to our stockholders seeking to effect resales of our JDSs or common stock within the United States.
If we decide to directly list our common stock in the future, the trading price of our JDSs could decline.
We may decide in the future to directly list our common stock for quotation on an exchange, including in a different country, such as the United States. If we do so, the trading price of our JDSs may decline because a market would develop in our common stock, the security underlying the JDSs, and that market may become more liquid due to a number of factors. If, following this dual-listing investors prefer trading in our common stock, on a different exchange or in a different currency, liquidity in the JDSs may sharply decline and as a result the trading price could decline.
We do not intend to pay dividends for the foreseeable future.
We have never declared nor paid cash dividends on our capital stock. We currently intend to retain any future earnings to finance the operation and expansion of our business, and we do not expect to declare or pay any dividends in the foreseeable future. In addition, our ability to pay cash dividends on our capital stock could be restricted by the terms of any future debt financing arrangement. Any return to stockholders will therefore be limited to increases in the price of our JDSs, if any.
Holders of our JDSs may not receive distributions on our common stock or any value for them if it is illegal or impractical to make them available to JDS holders.
The Trustees of the JDSs have agreed to pay cash dividends or other distributions they or the custodian for the JDSs receives on our common stock after deducting fees and expenses. Our JDS holders will receive these distributions in proportion to the number of shares of our common stock that such JDSs represent. However, the Trustees are not responsible for making such payments or distributions if it is unlawful or impractical to make a distribution available to any holders of JDSs. For example, it would be unlawful to make a distribution to a holder of JDSs if it consists of securities that require registration under the U.S. Securities Act but that are not properly registered or distributed pursuant to an applicable exemption from registration. The Trustees are not responsible for making a distribution available to any holders of JDSs if any government approval or registration required for such distribution cannot be obtained after reasonable efforts made by the Trustees. We have no obligation to take any other action to permit the distribution of the JDSs, common stock, rights or anything else to holders of the JDSs. This means that holders of our JDSs may not receive the distributions we make on our common stock or any value for them if it is illegal or impractical for us to make them available. These restrictions may materially reduce the value of the JDSs.
27
Provisions in our restated certificate of incorporation and bylaws or Delaware law might discourage, delay or prevent a change of control of our company or changes in our management.
Delaware corporate law and our restated certificate of incorporation and bylaws contain provisions that could discourage, delay or prevent a change in control of our company or changes in our board of directors that the stockholders of our company may deem advantageous. Among other things, these provisions:
|
|
• |
require super-majority voting to amend some provisions in our amended and restated certificate of incorporation and bylaws; |
|
|
• |
authorize the issuance of “blank check” preferred stock that our board could issue to increase the number of outstanding shares and to discourage a takeover attempt; |
|
|
• |
eliminate the ability of our stockholders to call special meetings of stockholders; |
|
|
• |
prohibit stockholder action by written consent, which means that all stockholder actions will be required to be taken at a meeting of our stockholders; |
|
|
• |
provide that our board of directors is expressly authorized to make, alter or repeal our bylaws; and |
|
|
• |
establish advance notice requirements for nominations for election to our board or for proposing matters that can be acted upon by stockholders at stockholder meetings. |
These provisions may frustrate or prevent any attempts by our stockholders to replace or remove our current management by making it more difficult for stockholders to replace members of our board of directors, which is responsible for appointing the members of our management. In addition, we are governed by the provisions of Section 203 of the Delaware General Corporation Law, which generally prohibits a Delaware corporation from engaging in a broad range of business combinations with any “interested” stockholder for a period of three years following the date on which the stockholder became an “interested” stockholder. Any delay or prevention of a change of control transaction or changes in our management could cause the market price of the JDSs to decline.
Our restated certificate of incorporation provides that the Court of Chancery of the State of Delaware is the exclusive forum for substantially all disputes between us and our stockholders, which could limit our stockholders’ ability to obtain a favorable judicial forum for disputes with us or our directors, officers or employees.
Our restated certificate of incorporation provides that the Court of Chancery of the State of Delaware is the exclusive forum for any derivative action or proceeding brought on our behalf, any action asserting a breach of fiduciary duty, any action asserting a claim against us arising pursuant to the Delaware General Corporation Law, our restated certificate of incorporation or our bylaws or any action asserting a claim against us that is governed by the internal affairs doctrine. This choice of forum provision may limit a stockholder’s ability to bring a claim in a judicial forum that it finds favorable for disputes with us or our directors, officers or other employees. This limitation may discourage these types of lawsuits against us and our directors, officers and other employees. Alternatively, if a court were to find the choice of forum provision contained in our amended and restated certificate of incorporation to be inapplicable or unenforceable in an action, we may incur additional costs associated with resolving such action in other jurisdictions.
Item 1B. Unresolved Staff Comments
Not applicable.
Our corporate headquarters and primary research and development and operations facilities occupy approximately 8,512 square feet in San Jose, California, under a lease that expires in February 2022. We also lease properties in China, Japan, South Korea and Taiwan. We do not own any manufacturing facilities, and we contract and license to third parties the production and distribution of our semiconductors. We believe our space is adequate
28
for our current needs and that suitable additional or substitute space will be available to accommodate foreseeable expansion of our operations.
Although the Company is not currently subject to any litigation, and no litigation is currently threatened against it, the Company may be subject to legal proceedings, claims and litigation, including intellectual property litigation, arising in the ordinary course of business. Such matters are subject to many uncertainties and outcomes and are not predictable with assurance. The Company accrues amounts that it believes are adequate to address any liabilities related to legal proceedings and other loss contingencies that the Company believes will result in a probable loss that is reasonably estimable.
Item 4. Mine Safety Disclosures
Not applicable.
29
Item 5. Market for Registrant’s Common Equity, Related Stockholder Matters and Issuer Purchases of Equity Securities
Market Information
Our JDSs are quoted in Japanese yen on the Mothers market of the Tokyo Stock Exchange under the identification code “M-6697” and began trading publicly in September 2017. Prior to that time, there was no market for our JDSs.
Dividend Policy
We have never declared nor paid cash dividends on our capital stock. We currently intend to retain any future earnings to finance the operation and expansion of our business, and we do not expect to declare or pay any dividends in the foreseeable future. In addition, our ability to pay cash dividends on our capital stock could be restricted by the terms of any future debt financing arrangement. Any return to stockholders will therefore be limited to increases in the price of our JDSs, if any.
Holders of Record
As of December 31, 2019, there were approximately 81 holders of record of our common stock. This figure does not include holders of our common stock nor holders of our JDS, as represented by common stock, whose shares are held of record by banks, brokers or other financial institutions.
Recent Sale of Unregistered Securities
None.
Issuer Purchases of Equity Securities
We issued shares of common stock related to exercises of unvested stock options, or early exercised stock options. The shares of common stock issued in connection with the early exercised stock options are subject to our repurchase right at the original purchase price. The proceeds are initially recorded as a liability and reclassified to common stock and additional paid in capital as our repurchase right lapses. For the year ended December 31, 2019, we repurchased 5,584 shares related to unvested early exercised stock options due to termination.
|
Period |
(a) Total number of shares (or units) purchased |
(b) Average price paid per share (or unit) |
(c) Total number of shares (or units) purchased as part of publicly announced plans or programs |
(d) Maximum number (or approximate dollar value) of shares (or units) that may yet be purchased under the plans or programs |
|
October 2019 |
5,584 |
$ 0.37 |
- |
- |
Purchases of Unregistered Equity Securities by the Issuer
None.
30
The following graph shows a comparison from September 29, 2017 (the date our JDSs commenced trading on the Mothers market of the Tokyo Stock Exchange) through December 31, 2019 of the cumulative total return for our JDSs. The graph assumes that $100 was invested on September 29, 2017 in the JDS of Techpoint, Inc., the NASDAQ Composite Index and the Japan TOPIX Index, and assumes reinvestment of any dividends. The stock price performance on the following graph is not necessarily indicative of future stock price performance.
The closing price of our JDSs on December 30, 2019, the last trading day of the year ended December 31, 2019, was ¥708 or $6.46 based on the Telegraphic Transfer Middle Rate quoted by Mitsubishi UFJ Financial Group’s official index as of December 30, 2019.
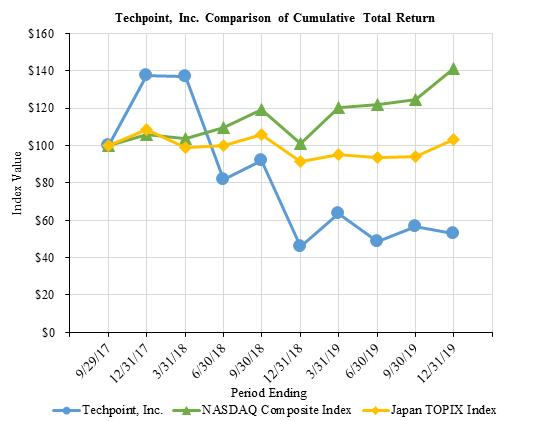
The information on the above graph shall not be deemed to be “filed” for purposes of Section 18 of the Exchange Act, or otherwise subject to the liabilities of that section or Sections 11 and 12(a)(2) of the Securities Act, and shall not be incorporated by reference into any registration statement or other document filed by us with the SEC, whether made before or after the date of this Annual Report on Form 10-K, regardless of any general incorporation language in such filing, except as shall be expressly set forth by specific reference in such filing.
Securities Authorized for Issuance Under Equity Compensation Plans
The information required by this item is incorporated herein by reference to our definitive proxy statement for our 2020 annual meeting of stockholders, which will be filed not later than 120 days after the end of our fiscal year ended December 31, 2019.
Item 6. Selected Financial Data
The selected consolidated statement of operations data for the years ended December 31, 2019, 2018, and 2017 and the consolidated balance sheet data as of December 31, 2019 and 2018 are derived from our audited
31
consolidated financial statements included elsewhere in this Annual Report on Form 10-K. The selected consolidated statement of operations data for the year ended December 31, 2016 and December 31, 2015 and the selected consolidated balance sheet data as of December 31, 2017, December 31, 2016 and December 31, 2015 were derived from audited financial statements not included in this Annual Report on Form 10-K.
Our historical results are not necessarily indicative of the results that may be expected in the future. The selected consolidated financial data below should be read in conjunction with the section entitled “Management’s Discussion and Analysis of Financial Condition and Results of Operations” included in Part II, Item 7 of this Annual Report on Form 10-K and our consolidated financial statements and related notes included in Part II, Item 8 of this Annual Report on Form 10-K.
|
|
|
Year Ended |
|
|||||||||||||||||
|
|
|
December 31, |
|
|||||||||||||||||
|
|
|
2019 |
|
|
2018 |
|
|
2017 |
|
|
2016 |
|
|
2015 |
|
|||||
|
Revenue |
|
$ |
32,027 |
|
|
$ |
31,098 |
|
|
$ |
31,142 |
|
|
$ |
27,156 |
|
|
$ |
20,245 |
|
|
Cost of revenue |
|
|
16,387 |
|
|
|
15,316 |
|
|
|
13,221 |
|
|
|
12,735 |
|
|
|
8,803 |
|
|
Gross profit |
|
|
15,640 |
|
|
|
15,782 |
|
|
|
17,921 |
|
|
|
14,421 |
|
|
|
11,442 |
|
|
Operating expenses |
|
|
|
|
|
|
|
|
|
|
|
|
|
|
|
|
|
|
|
|
|
Research and development |
|
|
6,468 |
|
|
|
7,331 |
|
|
|
5,383 |
|
|
|
4,380 |
|
|
|
4,964 |
|
|
Selling, general and administrative |
|
|
6,777 |
|
|
|
6,636 |
|
|
|
6,193 |
|
|
|
4,678 |
|
|
|
2,592 |
|
|
Total operating expenses |
|
|
13,245 |
|
|
|
13,967 |
|
|
|
11,576 |
|
|
|
9,058 |
|
|
|
7,556 |
|
|
Income from operations |
|
|
2,395 |
|
|
|
1,815 |
|
|
|
6,345 |
|
|
|
5,363 |
|
|
|
3,886 |
|
|
Other income (expense) |
|
|
54 |
|
|
|
229 |
|
|
|
(73 |
) |
|
|
— |
|
|
|
3 |
|
|
Income before income taxes |
|
|
2,449 |
|
|
|
2,044 |
|
|
|
6,272 |
|
|
|
5,363 |
|
|
|
3,889 |
|
|
Provision for (benefit from) income taxes |
|
|
255 |
|
|
|
159 |
|
|
|
2,515 |
|
|
|
1,882 |
|
|
|
(168 |
) |
|
Net income |
|
$ |
2,194 |
|
|
$ |
1,885 |
|
|
$ |
3,757 |
|
|
$ |
3,481 |
|
|
$ |
4,057 |
|
|
Net income allocable to preferred stockholders |
|
$ |
— |
|
|
$ |
— |
|
|
$ |
1,936 |
|
|
$ |
2,627 |
|
|
$ |
3,170 |
|
|
Net income allocable to common stockholders |
|
$ |
2,194 |
|
|
$ |
1,885 |
|
|
$ |
1,821 |
|
|
$ |
854 |
|
|
$ |
887 |
|
|
Net income per share allocable to common stockholders: |
|
|
|
|
|
|
|
|
|
|
|
|
|
|
|
|
|
|
|
|
|
Basic |
|
$ |
0.13 |
|
|
$ |
0.11 |
|
|
$ |
0.25 |
|
|
$ |
0.24 |
|
|
$ |
0.30 |
|
|
Diluted |
|
$ |
0.12 |
|
|
$ |
0.10 |
|
|
$ |
0.24 |
|
|
$ |
0.23 |
|
|
$ |
0.28 |
|
|
Weighted-average shares outstanding in computing net income per share allocable to common stockholders |
|
|
|
|
|
|
|
|
|
|
|
|
|
|
|
|
|
|
|
|
|
Basic |
|
|
17,283,133 |
|
|
|
16,982,648 |
|
|
|
7,145,641 |
|
|
|
3,493,946 |
|
|
|
3,007,311 |
|
|
Diluted |
|
|
17,875,971 |
|
|
|
17,991,131 |
|
|
|
8,056,329 |
|
|
|
4,358,387 |
|
|
|
3,774,146 |
|
|
|
|
December 31, |
|
|||||||||||||||||
|
|
|
2019 |
|
|
2018 |
|
|
2017 |
|
|
2016 |
|
|
2015 |
|
|||||
|
Cash and cash equivalents |
|
$ |
11,391 |
|
|
$ |
25,941 |
|
|
$ |
21,536 |
|
|
$ |
10,006 |
|
|
$ |
9,463 |
|
|
Short-term investments |
|
$ |
9,475 |
|
|
$ |
— |
|
|
$ |
— |
|
|
$ |
— |
|
|
$ |
— |
|
|
Property and equipment - net |
|
$ |
535 |
|
|
$ |
611 |
|
|
$ |
325 |
|
|
$ |
401 |
|
|
$ |
170 |
|
|
Total assets |
|
$ |
38,546 |
|
|
$ |
30,706 |
|
|
$ |
26,592 |
|
|
$ |
15,552 |
|
|
$ |
12,483 |
|
|
Total current liabilities |
|
$ |
5,534 |
|
|
$ |
1,919 |
|
|
$ |
1,491 |
|
|
$ |
2,226 |
|
|
$ |
3,181 |
|
|
Convertible preferred stock |
|
$ |
— |
|
|
$ |
— |
|
|
$ |
— |
|
|
$ |
8,794 |
|
|
$ |
8,794 |
|
|
Total stockholders’ equity |
|
$ |
32,380 |
|
|
$ |
28,631 |
|
|
$ |
24,968 |
|
|
$ |
13,236 |
|
|
$ |
9,240 |
|
32
Item 7. Management’s Discussion and Analysis of Financial Condition and Results of Operations
You should read the following discussion and analysis of our financial condition and results of operations together with the consolidated financial statements and related notes that are included elsewhere in this Annual Report on Form 10-K. This discussion contains forward-looking statements based upon current expectations that involve risks and uncertainties. Our actual results may differ materially from those anticipated in these forward-looking statements as a result of various factors, including those set forth under “Risk Factors” included in Part I, Item 1A or in other parts of this Annual Report on Form 10-K.
Overview
We are a fabless semiconductor company that designs, markets and sells mixed-signal integrated circuits for multiple video applications in the security surveillance and automotive markets. Our integrated circuits are enabling the transition from standard definition, or SD, video to high definition, or HD, video in the security surveillance and automotive industries.
Our solutions take HD video signals from a camera and convert them into analog signals for reliable long distance transmission, then convert the HD analog signal into the appropriate format for video processing and display. Our HD analog technology operates at the same 1080p HD resolution as digital HD, but processes video in an HD analog format and transmits the video in this same analog format, thereby eliminating the need for any compression or decompression. Our integrated circuits are based on our proprietary architecture and mixed signal technologies that we believe provide high video quality, enable high levels of integration and are cost effective. Our integrated circuits are used by security surveillance manufacturers, such as Hikvision in China, IDIS in South Korea and AVTech in Taiwan. These three manufacturers are each a leading security surveillance manufacturer in their respective countries.
We derive our revenue from sales of our mixed-signal integrated circuits into the security surveillance and automotive markets. We have secured design wins with major automotive equipment manufacturers to sell our solutions to them for automotive backup cameras. We began shipping our products in 2013 and to date, we have sold over 135 million integrated circuits. Our revenue was $32.0 million and $31.1 million for the years ended December 31, 2019 and 2018, respectively. We recognized $21.2 million and $26.3 million of revenue on sales into the security surveillance market for the years ended December 31, 2019 and 2018, respectively. In addition, we recognized $10.8 million and $4.8 million of revenue on sales into the automotive market for the years ended December 31, 2019 and 2018, respectively. We recorded net income of $2.2 million and $1.9 million for the years ended December 31, 2019 and 2018, respectively.
We sell our products to distributors that fulfill third-party orders for our products. We also sell directly to ODMs. For the years ended December 31, 2019, 2018 and 2017, we derived substantially all of our revenue from products sold to distributors as compared to products sold to ODMs directly.
We undertake significant product development efforts well in advance of a product’s release, and in advance of receiving purchase orders. Our product development efforts, which are focused on developing new designs with broad demand and potential for future derivative products, typically take from six to twenty-four months until production begins, depending on the product’s complexity. If we secure a design win, we believe the system designer is likely to continue to use the same or enhanced versions of our product across a number of their models, tending to extend the life cycles of our products. Conversely, if a competitor secures the design win, it may be difficult for us to sell into the end-customer’s application for an extended period. Our sales cycle typically ranges from three to six months for the security surveillance market and one to three years for the automotive industry. Due to the length of our product development and sales cycle, the majority of our revenue for any period is likely to be weighted toward products introduced for sale in the prior one or two years. As a result, our present revenue is not necessarily representative of future sales because our future sales are likely to be comprised of a different mix of products, some of which are now in the development stage.
We employ a fabless manufacturing strategy and use market-leading suppliers for all phases of the manufacturing process, including wafer fabrication, assembly, testing and packaging. This strategy significantly reduces the capital investment that would otherwise be required to operate manufacturing facilities of our own.
33
We have made significant investments in research and development in order to develop our products to attract and retain end-customers. For the years ended December 31, 2019 and 2018, our research and development expense was $6.5 million and $7.3 million, respectively. As of December 31, 2019, we had 78 employees, 25 of whom are in research and development. Our headquarters are located in San Jose, California, with additional operations in Japan, Taiwan, China and South Korea.
Key Factors Affecting Our Results of Operations
The following are key factors that impact our results of operations:
Ability to attract and retain customers that make large orders. While we expect the composition of our end-customers to change over time, our business and operating results depends on our ability to continually target new and retain existing end-customers that make large orders. For the years ended December 31, 2019 and 2018, Hikvision, the largest security surveillance manufacturer in China and one of our end-customers, accounted for 50% and 62% of our revenue, respectively. Although large customers can help us increase our revenue and improve our results of operations, reliance on large customers is a risk to our business. For example, the U.S. Senate’s recent passage of the 2019 National Defense Authorization Act (“NDAA”) could adversely impact our business with Hikvision because the NDAA includes a provision barring U.S. government agencies from purchasing video surveillance products from certain Chinese manufacturers, including Hikvision. Although this does not prohibit commercial sales of video surveillance products by Hikvision in the U.S., which we understand is the predominant business Hikvision does in the U.S with video surveillance products that incorporate our products, the impact of these new regulations and the uncertainty of U.S. and China trade relations may adversely impact our business in the future with Hikvision and other significant customers.
Design wins with new and existing customers. We believe our products provide high-quality HD video with an attractive combination of characteristics, at a lower overall cost than competing solutions. In order to get our solutions designed into our end-customer’s products, we work with our end-customers and potential end-customers to understand their product roadmaps and strategies. We consider design wins to be critical to our future success. We define a design win as the successful completion of the evaluation stage, where an end-customer has tested our product, verified that our product meets its requirements and qualified our integrated circuits for their products. We have secured design wins with major automotive manufacturers to sell our solutions to them for automotive backup cameras. The revenue that we generate, if any, from each design win can vary significantly. Our long-term sales expectations are based on forecasts from end-customers, internal estimates of end-customer demand factoring in expected time to market for end-customer products incorporating our solutions and associated revenue potential and internal estimates of overall demand based on historical trends.
Pricing, product cost and gross margins of our products. Our gross margin has been and will continue to be affected by a variety of factors, including the timing of changes in pricing, shipment volumes, new product introductions, changes in product mixes, changes in our purchase price of fabricated wafers and assembly and test service costs, manufacturing yields and inventory write downs, if any. In general, newly introduced products and products with higher performance and more features tend to be priced higher than older, more mature products. Average selling prices in the semiconductor industry typically decline as products mature. Consistent with this historical trend, we expect that the average selling prices of our products will decline as they mature. In the normal course of business, we will seek to offset the effect of declining average selling prices on existing products by reducing manufacturing costs and introducing new and higher value-added products. If we are unable to maintain overall average selling prices or offset any declines in average selling prices with realized savings on product costs, our gross margin will decline.
Product adoption and safety regulations in the automotive market. We have secured design wins with major automotive equipment manufacturers to sell our solutions to them for automotive backup cameras. Certain jurisdictions, including the United States, have passed laws and regulations requiring that all new cars sold after May 2018 must contain back-up cameras. If these jurisdictions do not maintain and implement these rules, or if back-up cameras are not put into automobiles sold in other locations as well, or do so more slowly than we expect, our financial results could be adversely affected.
34
Investment in growth. We have invested, and intend to continue to invest, in expanding our operations, increasing our headcount, developing our products and differentiated technologies to support our growth and expanding our infrastructure. We expect our total operating expenses to increase significantly in the foreseeable future to meet our growth objectives. We plan to continue to invest in our sales and support operations throughout the world, with a particular focus in the near term of adding additional sales and field applications personnel in the Asia-Pacific region to further broaden our support and coverage of our existing end-customer base, in addition to developing new end-customer relationships and generating design wins. We also intend to continue to invest additional resources in research and development to support the development of our products and differentiated technologies. Any investments we make in our sales and marketing organization or research and development will occur in advance of experiencing any benefits from such investments, and the return on these investments may be lower than we expect. In addition, as we invest in expanding our operations into new areas internationally, our business and results will become further subject to the risks and challenges of operations in those locations, including potentially higher operating expenses and the impact of legal and regulatory developments.
Components of Consolidated Statements of Operations
Revenue
We derive substantially all of our revenue through the sale of our products to distributors who, in turn, sell to our end-customers, which consists of ODMs, contract manufacturers and design houses. Prior to the adoption of Accounting Standards Codification (“ASC”) Topic 606, or ASC 606, Revenue from Contracts with Customers, on January 1, 2018, revenue was recognized from product sales when persuasive evidence of an arrangement exists and all other revenue recognition criteria are met, which generally occurs when we ship our products to the distributors. Upon adoption of ASC 606, revenue was recognized after we (1) identify the contract with a customer; (2) identify the performance obligations in the contract; (3) determine the transaction price; (4) allocate the transaction price to the performance obligations in the contract; and (5) satisfy the performance obligation when control is transferred to the customer.
Cost of revenue
Cost of revenue primarily consists of costs paid to our third-party manufacturers for wafer fabrication, assembly and testing of our products. To a lesser extent, cost of revenue also includes write-downs of inventory for excess and obsolete inventory, depreciation of test equipment, and expenses relating to manufacturing support activities, including personnel-related costs, logistics and quality assurance and shipping.
Research and Development Expenses
Research and development expenses consist primarily of compensation and associated costs of employees engaged in research and development, contractor costs, tape-out costs, development testing and evaluation costs, and depreciation expense. Before releasing new products, we incur charges for mask sets, prototype wafers and mask set revisions, which we refer to as tape-out costs. Tape-out costs may cause our research and development costs to increase in absolute dollars in the future as we increase our investment in new product developments and headcount to support our development efforts.
Selling, General and Administrative Expenses
Selling expenses consist primarily of personnel-related costs for our sales, business development, marketing, and applications engineering activities, promotional and other marketing expenses, and travel expenses. We expect selling expenses to increase in absolute dollars for the foreseeable future as we continue to expand our sales teams and increase our marketing activities.
General and administrative expenses consist primarily of personnel-related costs, consulting expenses and professional fees. Professional fees principally consist of legal, audit, tax and accounting services. We expect general and administrative expenses to increase in absolute dollars for the foreseeable future as we hire additional personnel, make improvements to our infrastructure and incur significant additional costs for the compliance requirements of operating as a public company, including higher legal, insurance and accounting expenses, particularly with respect to operating as a U.S. company that is publicly traded in Japan.
35
Personnel-related costs, including salaries, benefits, bonuses and stock-based compensation, are the most significant component of each of selling expenses and general and administrative expenses.
Income Tax Provision
The provision for income taxes consists of our estimated federal, state and foreign income taxes based on our pre-tax income. Our provision differs from the federal statutory rate primarily due to the research tax credit, foreign derived intangible income (FDII) deduction, net non-deductible stock-based compensation, and the change to deferred tax assets resulting from the reduction in the U.S. federal tax rate from 34% to 21% in fiscal 2017.
Due to tax law changes in December 2017, our income tax provision for the year ended December 31, 2017 includes a $0.3 million one-time remeasurement charge for deferred taxes. Please see Note 10 of Part II, Item 8 of this Annual Report on Form 10-K for further discussion.
Results of Operations
The following table sets forth our consolidated results of operations for the periods shown (in thousands):
|
|
|
Year Ended |
|
|||||||||
|
|
December 31, |
|
||||||||||
|
|
|
2019 |
|
|
2018 |
|
|
2017 |
|
|||
|
Revenue |
|
$ |
32,027 |
|
|
$ |
31,098 |
|
|
$ |
31,142 |
|
|
Cost of revenue (1) |
|
|
16,387 |
|
|
|
15,316 |
|
|
|
13,221 |
|
|
Gross profit |
|
|
15,640 |
|
|
|
15,782 |
|
|
|
17,921 |
|
|
Operating expenses: (1) |
|
|
|
|
|
|
|
|
|
|
|
|
|
Research and development |
|
|
6,468 |
|
|
|
7,331 |
|
|
|
5,383 |
|
|
Selling, general and administrative |
|
|
6,777 |
|
|
|
6,636 |
|
|
|
6,193 |
|
|
Total operating expenses |
|
|
13,245 |
|
|
|
13,967 |
|
|
|
11,576 |
|
|
Income from operations |
|
|
2,395 |
|
|
|
1,815 |
|
|
|
6,345 |
|
|
Other income (expense) |
|
|
54 |
|
|
|
229 |
|
|
|
(73 |
) |
|
Income before income taxes |
|
|
2,449 |
|
|
|
2,044 |
|
|
|
6,272 |
|
|
Provision for income taxes |
|
|
255 |
|
|
|
159 |
|
|
|
2,515 |
|
|
Net income |
|
$ |
2,194 |
|
|
$ |
1,885 |
|
|
$ |
3,757 |
|
|
(1) |
Includes stock-based compensation expense as follows (in thousands): |
|
|
Year Ended |
|
||||||||||
|
|
December 31, |
|
||||||||||
|
|
|
2019 |
|
|
2018 |
|
|
2017 |
|
|||
|
Cost of revenue |
|
$ |
117 |
|
|
$ |
68 |
|
|
$ |
31 |
|
|
Research and development |
|
|
502 |
|
|
|
355 |
|
|
|
273 |
|
|
Selling, general and administrative |
|
|
796 |
|
|
|
941 |
|
|
|
1,144 |
|
|
Total |
|
$ |
1,415 |
|
|
$ |
1,364 |
|
|
$ |
1,448 |
|
36
The following table sets forth the consolidated statements of operations data for each of the periods presented as a percentage of revenue:
|
|
|
Year Ended |
|
|||||||||
|
|
December 31, |
|
||||||||||
|
|
|
2019 |
|
|
2018 |
|
|
2017 |
|
|||
|
Revenue |
|
|
100 |
% |
|
|
100 |
% |
|
|
100 |
% |
|
Cost of revenue |
|
|
51 |
|
|
|
49 |
|
|
|
42 |
|
|
Gross profit |
|
|
49 |
|
|
|
51 |
|
|
|
58 |
|
|
Operating expenses: |
|
|
|
|
|
|
|
|
|
|
|
|
|
Research and development |
|
|
20 |
|
|
|
24 |
|
|
|
18 |
|
|
Selling, general and administrative |
|
|
21 |
|
|
|
21 |
|
|
|
20 |
|
|
Total operating expenses |
|
|
41 |
|
|
|
45 |
|
|
|
38 |
|
|
Income from operations |
|
|
8 |
|
|
|
6 |
|
|
|
20 |
|
|
Other income (expense) |
|
|
0 |
|
|
|
1 |
|
|
|
0 |
|
|
Income before income taxes |
|
|
8 |
|
|
|
7 |
|
|
|
20 |
|
|
Provision for income taxes |
|
|
1 |
|
|
|
1 |
|
|
|
8 |
|
|
Net income |
|
|
7 |
% |
|
|
6 |
% |
|
|
12 |
% |
Revenue
|
|
Year Ended December 31, |
|
|
Change |
|
|
Year Ended December 31, |
|
|
Change |
|
|||||||||||||||||||||
|
|
|
2019 |
|
|
2018 |
|
|
Amount |
|
|
% |
|
|
2018 |
|
|
2017 |
|
|
Amount |
|
|
% |
|
||||||||
|
|
|
(dollars in thousands) |
|
|||||||||||||||||||||||||||||
|
Revenue |
|
$ |
32,027 |
|
|
$ |
31,098 |
|
|
$ |
929 |
|
|
|
3 |
% |
|
$ |
31,098 |
|
|
$ |
31,142 |
|
|
$ |
(44 |
) |
|
|
(0 |
)% |
Revenue increased by $0.9 million, or 3% for the year ended December 31, 2019 as compared to the year ended December 31, 2018. This was mainly due to a $6.1 million increase in automotive market revenue resulting from a 147% increase in volume of shipments offset by changes in product mix due to a higher concentration of lower priced products. This increase in automotive market revenue was partially offset by a $5.1 million decrease in security surveillance market revenue due to changes in product mix due to a higher concentration of lower priced products.
Revenue decreased by $44,000 for the year ended December 31, 2018 as compared to the year ended December 31, 2017. This decrease was driven by a shift in product mix as we continue to develop and expand our product offerings particularly in the automotive market and the demand increases for our integrated HD-TVI transmitters and Image Signal Processor products which resulted in a 24% decrease in overall average selling prices, partially offset by a 31% increase in volume of shipments as a result of increased demand for these newer generation products. For the years ended December 31, 2018 and 2017, we recorded revenue of $4.8 million and $3.0 million from sales into the automotive market, respectively. For the years ended December 31, 2018 and 2017, we derived 15% and 10% of our revenue from sales into the automotive market, respectively.
We have determined that pricing of our products remains stable in our target markets. Fluctuation in our overall average selling price is directly attributable to changes in product mix given the natural pricing variation of the products in our portfolio. When the product mix shifts towards the higher priced products in our portfolio, the average selling price will be higher than when the product mix shifts towards the lower price point products.
37
The table below sets forth the major components of the revenue by geographic region for the years ended December 31, 2019, 2018 and 2017:
|
|
Year Ended |
|
||||||||||
|
|
|
December 31, |
|
|||||||||
|
|
|
2019 |
|
|
2018 |
|
|
2017 |
|
|||
|
China |
|
|
73 |
% |
|
|
84 |
% |
|
|
85 |
% |
|
Taiwan |
|
13 |
|
|
|
3 |
|
|
|
3 |
|
|
|
South Korea |
|
11 |
|
|
|
9 |
|
|
|
9 |
|
|
|
Japan |
|
3 |
|
|
|
4 |
|
|
|
3 |
|
|
|
Other |
|
|
- |
|
|
|
- |
|
|
|
- |
|
|
Total revenue |
|
|
100 |
% |
|
|
100 |
% |
|
|
100 |
% |
Cost of revenue and gross margin
|
|
Year Ended December 31, |
|
|
Change |
|
|
Year Ended December 31, |
|
|
Change |
|
|||||||||||||||||||||
|
|
|
2019 |
|
|
2018 |
|
|
Amount |
|
|
% |
|
|
2018 |
|
|
2017 |
|
|
Amount |
|
|
% |
|
||||||||
|
|
|
(dollars in thousands) |
|
|||||||||||||||||||||||||||||
|
Cost of revenue |
|
$ |
16,387 |
|
|
$ |
15,316 |
|
|
$ |
1,071 |
|
|
|
7 |
% |
|
$ |
15,316 |
|
|
$ |
13,221 |
|
|
$ |
2,095 |
|
|
|
16 |
% |
|
Gross margin |
|
|
49 |
% |
|
|
51 |
% |
|
|
|
|
|
|
|
|
|
|
51 |
% |
|
|
58 |
% |
|
|
|
|
|
|
|
|
Cost of revenue increased $1.1 million, or 7%, for the year ended December 31, 2019 as compared to the year ended December 31, 2018. Gross margin decreased to 49% for the year ended December 31, 2019 from 51% for the year ended December 31, 2018. The increase in cost of revenue was primarily driven by a 23% increase in volume of shipments and a $0.4 million increase in inventory write downs. The decrease in gross margin was driven by the increase in inventory write downs and changes in product mix.
Cost of revenue increased $2.1 million, or 16%, for the year ended December 31, 2018 as compared to the year ended December 31, 2017. Gross margin decreased to 51% for the year ended December 31, 2018 from 58% for the year ended December 31, 2017. The increase in cost of revenue was primarily driven by a 31% increase in unit sales offset by changes in product mix. The decrease in gross margin was driven by the shift in product mix causing a 24% decrease in overall average selling prices.
We expect gross margins to fluctuate in future periods due to changes in product mix, average unit selling prices, manufacturing costs, manufacturing yields, levels of inventory valuation, if any, and levels of product demand.
Research and development expense
|
|
Year Ended December 31, |
|
|
Change |
|
|
Year Ended December 31, |
|
|
Change |
|
|||||||||||||||||||||
|
|
|
2019 |
|
|
2018 |
|
|
Amount |
|
|
% |
|
|
2018 |
|
|
2017 |
|
|
Amount |
|
|
% |
|
||||||||
|
|
|
(dollars in thousands) |
|
|||||||||||||||||||||||||||||
|
Research and development |
|
$ |
6,468 |
|
|
$ |
7,331 |
|
|
$ |
(863 |
) |
|
|
(12 |
)% |
|
$ |
7,331 |
|
|
$ |
5,383 |
|
|
$ |
1,948 |
|
|
|
36 |
% |
Research and development expense decreased $0.9 million, or 12%, for the year ended December 31, 2019 as compared to the year ended December 31, 2018. This decrease was primarily due to a $1.5 million decrease in tape-out expenses offset by a $0.3 million increase in personnel costs due to a 4% increase in headcount as a result of expanding operations, a $0.2 million increase in product development costs relating to design, prototype and software expense and a $0.1 million increase in stock-based compensation expense.
Research and development expenses increased $1.9 million, or 36%, for the year ended December 31, 2018 as compared to the year ended December 31, 2017. This increase was primarily due to a $1.1 million increase in tape-
38
out expenses, a $0.4 million increase in personnel costs due to a 14% increase in headcount as a result of expanding operations, and a $0.2 million increase in product development costs relating to design, prototype, and software expenses.
Selling, general and administrative expense
|
|
Year Ended December 31, |
|
|
Change |
|
|
Year Ended December 31, |
|
|
Change |
|
|||||||||||||||||||||
|
|
|
2019 |
|
|
2018 |
|
|
Amount |
|
|
% |
|
|
2018 |
|
|
2017 |
|
|
Amount |
|
|
% |
|
||||||||
|
|
|
(dollars in thousands) |
|
|||||||||||||||||||||||||||||
|
Selling, general and administrative |
|
$ |
6,777 |
|
|
$ |
6,636 |
|
|
$ |
141 |
|
|
|
2 |
% |
|
$ |
6,636 |
|
|
$ |
6,193 |
|
|
$ |
443 |
|
|
|
7 |
% |
Selling, general and administrative expenses increased by $0.1 million, or 2%, for the year ended December 31, 2019 as compared to the year ended December 31, 2018. This increase was primarily due to a $0.3 million increase in personnel costs, rent, and other office expenses due to a 9% increase in headcount as a result of expanding operations, offset by a $0.1 million decrease in stock-based compensation.
Selling, general and administrative expenses increased by $0.4 million, or 7%, for the year ended December 31, 2018 as compared to the year ended December 31, 2017. This increase was primarily due to a $0.3 million increase in professional service fees due to costs associated with being a public company, a $0.3 million increase in personnel costs, rent and other office expenses due to a 10% increase in headcount as a result of expanding operations, offset by a $0.2 million decrease in stock-based compensation.
Other income and expense
|
|
Year Ended December 31, |
|
|
Change |
|
|
Year Ended December 31, |
|
|
Change |
|
|||||||||||||||||||||
|
|
|
2019 |
|
|
2018 |
|
|
Amount |
|
|
% |
|
|
2018 |
|
|
2017 |
|
|
Amount |
|
|
% |
|
||||||||
|
|
|
(dollars in thousands) |
|
|||||||||||||||||||||||||||||
|
Other income (expense) |
|
$ |
54 |
|
|
$ |
229 |
|
|
$ |
(175 |
) |
|
|
(76 |
)% |
|
$ |
229 |
|
|
$ |
(73 |
) |
|
$ |
302 |
|
|
|
(414 |
)% |
Other income for the year ended December 31, 2019 decreased by $0.2 million, or 76% as compared to the year ended December 31, 2018 primarily due to foreign currency exchange transactions and foreign currency fluctuations.
Other income for the year ended December 31, 2018 was $0.2 million and other expense for the year ended December 31, 2017 was $0.1 million, respectively. This change was primarily due to the foreign currency exchange transactions and foreign currency fluctuations from IPO proceeds received in Japanese yen in September 2017.
Provision for income taxes
|
|
|
Year Ended December 31, |
|
|
Change |
|
|
Year Ended December 31, |
|
|
Change |
|
||||||||||||||||||||
|
|
2019 |
|
|
2018 |
|
|
Amount |
|
|
% |
|
|
2018 |
|
|
2017 |
|
|
Amount |
|
|
% |
|
|||||||||
|
|
|
(dollars in thousands) |
|
|||||||||||||||||||||||||||||
|
Provision for income taxes |
|
$ |
255 |
|
|
$ |
159 |
|
|
$ |
96 |
|
|
|
60 |
% |
|
$ |
159 |
|
|
$ |
2,515 |
|
|
$ |
(2,356 |
) |
|
|
(94 |
)% |
The provision for income taxes increased by $0.1 million, or 60%, for the year ended December 31, 2019 as compared to the year ended December 31, 2018. The increase in the provision for income taxes was primarily due to an increase in taxable income.
The provision for income taxes decreased by $2.4 million, or 94%, for the year ended December 31, 2018 as compared to the year ended December 31, 2017. The decrease in the provision for income taxes was primarily due to a decrease in pre-tax income, a reduction in the U.S. corporate tax rate to 21% as a result of tax law changes
39
during December 2017, and an increase in tax benefits from stock-option exercises and dispositions. The effective tax rate was 7.74% and 40.07% for the years ended December 31, 2018 and 2017, respectively.
Liquidity and Capital Resources
Since inception, we have funded our operations primarily with revenue from sales of our mixed-signal integrated circuits and with gross proceeds from our IPO. In September 2017, we completed our IPO and sold 1,520,000 JDSs, represented by 1,520,000 shares of our common stock at a price to the public of $5.85 per share and received net proceeds of $8.1 million, after deducting underwriting discounts and commissions of $0.7 million. In October 2017, the managing underwriter of our IPO elected to purchase an additional 228,000 shares of JDSs, represented by 228,000 shares of common stock, pursuant to the underwriters’ over-allotment option. We subsequently completed the sale at the IPO price of $5.85 per share and received net proceeds of $1.2 million, after deducting underwriting discounts and commissions of $0.1 million. Additionally, offering costs incurred by the Company totaled $3.0 million.
Our primary use of cash is to fund our operations as we continue to grow our business. Cash used to fund operating expenses is impacted by the timing of when we pay expenses, as reflected in the changes in our outstanding accounts payable and accrued expenses.
Our cash, cash equivalents and short-term investments as of December 31, 2019 were $20.9 million. We believe our existing cash, cash equivalents, short-term investments and cash we expect to generate from operations, will be sufficient to meet our anticipated cash needs for at least the next 12 months. Our future capital requirements will depend on many factors, including our growth rate, the timing and extent of our spending to support research and development activities, the timing and cost of establishing additional sales and marketing capabilities, the introduction of new and enhanced products and our costs to implement new manufacturing technologies or potentially acquire and integrate other companies or assets. In the event that additional financing is required from outside sources, we may not be able to raise it on terms acceptable to us or at all. Any debt financing obtained by us in the future could also involve restrictive covenants relating to our capital-raising activities and other financial and operational matters, which may make it more difficult for us to obtain additional capital and to pursue business opportunities, including potential acquisitions. Additionally, if we raise additional funds through further issuances of equity, convertible debt securities or other securities convertible into equity, our existing stockholders could suffer significant dilution in their percentage ownership, and any new equity securities we issue could have rights, preferences and privileges senior to those of holders of our common stock. If we are unable to obtain adequate financing or financing on terms satisfactory to us when we require it, our ability to continue to grow or support our business and to respond to business challenges could be significantly limited.
A summary of operating, investing and financing activities are shown in the following table (in thousands):
|
|
|
Year Ended |
|
|||||||||
|
|
December 31, |
|
||||||||||
|
|
|
2019 |
|
|
2018 |
|
|
2017 |
|
|||
|
Net cash provided by operating activities |
|
$ |
3,417 |
|
|
$ |
4,440 |
|
|
$ |
4,359 |
|
|
Net cash used in investing activities |
|
|
(18,053 |
) |
|
|
(376 |
) |
|
|
(170 |
) |
|
Net cash provided by financing activities |
|
|
86 |
|
|
|
341 |
|
|
|
7,341 |
|
|
Net increase (decrease) in cash and cash equivalents |
|
$ |
(14,550 |
) |
|
$ |
4,405 |
|
|
$ |
11,530 |
|
Operating Activities
Our primary source of cash from operating activities has been from cash collections from our customers. We expect cash inflows from operating activities to be affected by fluctuations in sales. Our primary uses of cash from operating activities have been for personnel costs and investments in research and development and sales and marketing.
During the year ended December 31, 2019, net cash provided by operating activities was $3.4 million, primarily due to net income of $2.2 million, non-cash charges of $3.0 million primarily driven by stock-based compensation, depreciation and amortization, provision for excess inventories and noncash lease expense offset by
40
cash outflow from the net change in operating assets and liabilities of $1.8 million. The cash outflow from the net change in operating assets and liabilities was primarily due to a $4.6 million cash outflow for inventory due to unit production exceeding product sales during the period, offset by a $1.4 million cash inflow in customer deposits due to timing of customer payments and a $1.2 million cash inflow in accrued expenses driven by the timing of services performed.
During the year ended December 31, 2018, net cash provided by operating activities was $4.4 million, primarily due to net income of $1.9 million, non-cash charges of $2.1 million primarily driven by stock-based compensation, provision for excess inventories, depreciation and amortization and deferred income taxes, and cash inflow provided by the change in net operating assets and liabilities of $0.5 million. The cash inflow due to the change in net operating assets and liabilities was primarily due to a $0.4 million cash inflow in inventory due to product sales in excess of units manufactured during the period and a $0.2 million cash inflow in accounts payable driven by the timing of payments made to our vendors.
During the year ended December 31, 2017, net cash provided by operating activities was $4.4 million, primarily due to net income of $3.8 million, non-cash charges of $2.4 million primarily driven by stock-based compensation, provision for excess inventories, depreciation and amortization and deferred income taxes, and cash outflow provided by the change in net operating assets and liabilities of $1.8 million. The cash outflow due to the change in net operating assets and liabilities was primarily due to a $0.7 million cash outflow in customer deposits attributable to timing of customer pre-payments, a $0.7 million cash outflow in inventory to support anticipated demand and a $0.7 million cash outflow in prepaid expenses and other current assets for purchased software, partially offset by a $0.2 million cash inflow in accrued expenses and a $0.1 million cash inflow in accounts payable driven by the timing of payments made to our vendors.
Investing Activities
During the year ended December 31, 2019, cash used in investing activities was $18.1 million primarily due to a $17.7 million cash outflow driven by the purchase of investments.
During the year ended December 31, 2018 and 2017, cash used in investing activities was, $0.4 million and $0.2 million, respectively, due to purchases of property and equipment.
Financing Activities
During the year ended December 31, 2019 and 2018, cash provided by financing activities was $0.1 million and $0.3 million, respectively, primarily due to net proceeds from the exercise of stock options.
During the year ended December 31, 2017, cash provided by financing activities was $7.3 million due to IPO proceeds received of $9.3 million, net proceeds from the exercise of stock options of $0.1 million, partially offset by payments for deferred offering costs of $2.1 million.
Contractual Obligations
We are required to make future payments under certain operating leases. Our outstanding contractual obligations as of December 31, 2019 are summarized in the following table (in thousands):
|
|
|
|
|
|
|
Payments Due by Period |
|
|||||||||
|
|
Total |
|
|
Less than 1 year |
|
|
1 to 3 years |
|
|
More than 3 years |
|
|||||
|
Operating leases |
|
$ |
1,129 |
|
|
$ |
593 |
|
|
$ |
536 |
|
|
$ |
— |
|
|
Purchase commitments |
|
|
587 |
|
|
|
294 |
|
|
|
293 |
|
|
|
— |
|
|
Total |
|
$ |
1,716 |
|
|
$ |
887 |
|
|
$ |
829 |
|
|
$ |
— |
|
Obligations under contracts that we can cancel without a significant penalty are not included in the table above.
41
Off Balance Sheet Arrangements
During the periods presented, we did not have any relationships with unconsolidated entities or financial partnerships, such as entities referred to as structured finance or special purpose entities, which would have been established for the purpose of facilitating off-balance sheet arrangements or other contractually narrow or limited purposes.
Critical Accounting Policies, Significant Estimates and Judgments
Our financial statements are prepared in accordance with U.S. generally accepted accounting principles, or GAAP. The preparation of these financial statements requires us to make estimates, assumptions and judgments that affect the reported amounts of assets, liabilities, revenue, expenses, and related disclosures. We evaluate our estimates, assumptions and judgments on an ongoing basis. Our estimates, assumptions and judgments are based on historical experience and various other factors that we believe to be reasonable under the circumstances. Different assumptions and judgments would change the estimates used in the preparation of our financial statements, which, in turn, could change the results from those reported.
The following paragraphs discuss the items that we believe are the critical accounting policies most affected by significant management estimates and judgments. Please see Note 1 of Part II, Item 8 of this Annual Report on Form 10-K for further information on all significant accounting policies.
Revenue Recognition
We generate revenue from product sales to distributors who, in turn, sell to ODMs, contract manufacturers and design houses. Prior to the adoption of ASC 606 on January 1, 2018, revenue was recognized from product sales when persuasive evidence of an arrangement exists, the selling price is fixed or determinable, delivery has occurred, and collectability is reasonably assured. After the adoption of ASC 606, revenue was recognized after we (1) identify the contract with a customer; (2) identify the performance obligations in the contract; (3) determine the transaction price; (4) allocate the transaction price to the performance obligations in the contract; and (5) satisfy the performance obligation when control is transferred to the customer.
We generally require advance payments from customers, but we may not be able to continue this practice in the future, particularly as we sell into the automotive market. We do not offer variable consideration or other significant payment terms, stock rotation, or price protection. Our customers do not have rights of return except pursuant to our standard warranty terms. We provide product assurance warranty only and do not offer warranties to be purchased separately.
Inventory
Inventories are stated at the lower of cost or net realizable value. The carrying value of inventory is adjusted for excess and obsolete inventory based on inventory age, shipment history and the forecast of demand over a specific future period. At the point of loss recognition, a new lower cost basis for that inventory is established and subsequent changes in facts and circumstances do not result in the restoration or increase in that new cost basis. The semiconductor markets that we serve are volatile and actual results may vary from forecast or other assumptions, potentially affecting our assessment of excess and obsolete inventory which could have a material effect on our results of operations.
Income Taxes
We account for income taxes using an asset and liability approach, which requires recognition of deferred tax assets and liabilities for the expected future tax consequences of events that have been recognized in the consolidated financial statements, but have not been reflected in our taxable income. Valuation allowances are established to reduce deferred tax assets as necessary based on available objective evidence. We believe it is more likely than not that we will realize benefits of deductible differences and have, therefore, not recorded a full valuation allowance. We recognize in our consolidated financial statements the impact of a tax position that based on its technical merits is more likely than not to be sustained upon examination.
42
We measure and recognize compensation expense for all stock-based awards granted to our employees and other service providers, including stock options and restricted stock unit awards, based on the estimated fair value of the award on the grant date. We estimate the grant date fair value of our stock option awards, and the resulting stock-based compensation expense, using the Black-Scholes option-pricing model. The fair value of a restricted stock unit is determined based on the fair value of our common stock on the date of grant. We recognize compensation costs on a straight-line basis over the requisite service period of the award, which is generally the vesting term of five years.
The Black-Scholes option-pricing model requires the use of highly subjective assumptions which determine the fair value of stock-based awards.
The assumptions used in our option-pricing model represent management’s best estimates. These estimates are highly complex, involve a number of variables, uncertainties and assumptions and the application of management’s judgment, so that they are inherently subjective. If factors change and different assumptions are used, our stock-based compensation expense could be materially different in the future.
These assumptions are estimated as follows:
|
|
• |
Fair Value of Common Stock. Given the absence of a public trading market prior to our IPO, the Company’s Board of Directors considered numerous objective and subjective factors to determine the fair value of the Company’s common stock which included, but were not limited to (i) contemporaneous independent third-party valuations of the Company’s common stock; (ii) the rights and preferences of the Company’s preferred stock relative to common stock; (iii) the lack of marketability of common stock; (iv) developments in the business; and (v) the likelihood of achieving a liquidity event, such as an initial public offering or sale of the company, given prevailing market conditions. |
Subsequent to our IPO, the fair value of our common stock is determined based on the per share closing price of the JDS on the Mothers market of the Tokyo Stock Exchange on the date of grant.
|
|
• |
Risk-Free Interest Rate. We base the risk-free interest rate used in the Black-Scholes valuation model on the implied yield available on U.S. Treasury zero-coupon issues with an equivalent remaining term of the options for each option group. |
|
|
• |
Expected Term. The expected term represents the period that our stock-based awards are expected to be outstanding. The expected term assumptions were determined based on the vesting terms, exercise terms and contractual lives of the options. |
|
|
• |
Volatility. We determine the price volatility factor based on the historical volatilities of our peer group as we did not have a sufficient trading history for our common stock. Industry peers consist of several public companies in the technology industry that provide similar services with comparable characteristics including enterprise value, risk profiles and position within the industry. We intend to continue to consistently apply this process using the same or similar public companies until a sufficient amount of historical information regarding the volatility of our own common stock share price becomes available, or unless circumstances change such that the identified companies are no longer similar to us, in which case, more suitable companies whose share prices are publicly available would be utilized in the calculation. |
|
|
• |
Dividend Yield. The expected dividend assumption is based on our current expectations about our anticipated dividend policy. We currently do not expect to issue any dividends. |
In addition to assumptions used in the Black-Scholes option-pricing model, we must also estimate a forfeiture rate to calculate the stock-based compensation for our awards. We adjust stock-based compensation expense to account for the forfeiture of equity incentive awards as they occur. We will continue to use judgment in evaluating the assumptions related to our stock-based compensation on a prospective basis. As we continue to accumulate additional data, we may have refinements to our estimates, which could materially impact our future stock-based compensation expense.
43
Recent Accounting Pronouncements
Refer to “Recent Accounting Pronouncements” in Note 1. Organization and Summary of Significant Accounting included in Part II, Item 8 of this Annual Report on Form 10-K.
Item 7A. Quantitative and Qualitative Disclosures About Market Risk
We are exposed to market risk from fluctuations in foreign currency exchange rates and interest rates, which may adversely affect our results of operations and financial condition. We seek to minimize these risks through regular operating activities. We do not purchase, hold or sell derivative financial instruments for trading or speculative purposes.
Foreign exchange rates
We transact business globally and are subject to risks associated with fluctuating foreign exchange rates. Substantially all of our revenue was derived from sales outside of the U.S. for the years ended December 31, 2019, 2018, and 2017. This revenue is generated in U.S. dollars with sales through distributors worldwide. Our operating expenses are denominated in the currencies of the countries in which our subsidiaries are located, and may be subject to fluctuations due to changes in foreign currency exchange rates. To date, we have not entered into any hedging contracts, but may elect to do so in the future. A hypothetical increase or decrease of 10% in foreign exchange rates for the years ended December 31, 2019, 2018, and 2017 would not have resulted in a significant increase or decrease in revenue or net income during that period.
The U.S. dollar is the functional currency for all of our foreign operations. Monetary assets and liabilities denominated in foreign currencies are remeasured into the functional currency of the subsidiary at the balance sheet date. The gains and losses from remeasurement of foreign currency denominated balances into the functional currency of the subsidiary are included in other income (expense) on our Consolidated Statement of Operations.
Interest rates
Our exposure to market risk for changes in interest rates relates primarily to our cash, cash equivalents and investments. Our cash, cash equivalents and investments consist primarily of cash, money market funds, corporate notes and bonds, and commercial paper. The primary objectives of our investment activities are the preservation of capital, the maintenance of liquidity, and capturing a market rate of return. We seek to minimize risk by investing cash in excess of our operating needs in high-quality instruments issued by highly creditworthy financial institutions. We do not enter into investments for trading or speculative purposes. Due to the nature of these instruments, we believe that we do not have any material exposure to changes in the fair value of our investment portfolio as a result of changes in interest rates. Decreases in interest rates, however, would reduce future interest income.
With the amount of cash, cash equivalents and investments that we maintained at December 31, 2019, a hypothetical increase or decrease of one percentage point, or 100 basis points, in interest rates, would not have had a material effect on our cash and cash equivalents or the fair value of our investment portfolio.
44
Item 8. Financial Statements and Supplementary Data
Index to Consolidated Financial Statements
|
46 |
|
|
47 |
|
|
Consolidated Statements of Operations and Comprehensive Income |
48 |
|
49 |
|
|
50 |
|
|
51 |
45
Report of Independent Registered Public Accounting Firm
Shareholders and Board of Directors
Techpoint, Inc.
San Jose, California
Opinion on the Consolidated Financial Statements
We have audited the accompanying consolidated balance sheets of Techpoint, Inc. (the “Company”) and subsidiaries as of December 31, 2019 and 2018, the related consolidated statements of operations and comprehensive income, stockholders’ equity, and cash flows for each of the three years in the period ended December 31, 2019, and the related notes (collectively referred to as the “consolidated financial statements”). In our opinion, the consolidated financial statements present fairly, in all material respects, the financial position of the Company and subsidiaries at December 31, 2019 and 2018, and the results of their operations and their cash flows for each of the three years in the period ended December 31, 2019, in conformity with accounting principles generally accepted in the United States of America.
Change in Accounting Method Related to Leases and Revenue
As discussed in Note 1 to the consolidated financial statements, the Company changed its method of accounting for leases during the year ended December 31, 2019, due to the adoption of Topic 842, “Leases” and changed its method of accounting for revenue during the year ended December 31, 2018, due to the adoption of Topic 606, “Revenue from Contracts with Customers.”
Basis for Opinion
These consolidated financial statements are the responsibility of the Company’s management. Our responsibility is to express an opinion on the Company’s consolidated financial statements based on our audits. We are a public accounting firm registered with the Public Company Accounting Oversight Board (United States) (“PCAOB”) and are required to be independent with respect to the Company in accordance with the U.S. federal securities laws and the applicable rules and regulations of the Securities and Exchange Commission and the PCAOB.
We conducted our audits in accordance with the standards of the PCAOB. Those standards require that we plan and perform the audit to obtain reasonable assurance about whether the consolidated financial statements are free of material misstatement, whether due to error or fraud. The Company is not required to have, nor were we engaged to perform, an audit of its internal control over financial reporting. As part of our audits we are required to obtain an understanding of internal control over financial reporting but not for the purpose of expressing an opinion on the effectiveness of the Company’s internal control over financial reporting. Accordingly, we express no such opinion.
Our audits included performing procedures to assess the risks of material misstatement of the consolidated financial statements, whether due to error or fraud, and performing procedures that respond to those risks. Such procedures included examining, on a test basis, evidence regarding the amounts and disclosures in the consolidated financial statements. Our audits also included evaluating the accounting principles used and significant estimates made by management, as well as evaluating the overall presentation of the consolidated financial statements. We believe that our audits provide a reasonable basis for our opinion.
/s/ BDO USA, LLP
We have served as the Company's auditor since 2015.
San Jose, California
March 13, 2020
46
(in thousands, except share and per share amounts)
|
|
|
December 31, |
|
|
December 31, |
|
||
|
|
2019 |
|
|
2018 |
|
|||
|
Assets |
|
|
|
|
|
|
|
|
|
Current assets: |
|
|
|
|
|
|
|
|
|
Cash and cash equivalents |
|
$ |
11,391 |
|
|
$ |
25,941 |
|
|
Short-term investments |
|
|
9,475 |
|
|
|
— |
|
|
Accounts receivable |
|
|
107 |
|
|
|
236 |
|
|
Inventory |
|
|
6,048 |
|
|
|
2,207 |
|
|
Prepaid expenses and other current assets |
|
|
875 |
|
|
|
936 |
|
|
Total current assets |
|
|
27,896 |
|
|
|
29,320 |
|
|
Property and equipment - net |
|
|
535 |
|
|
|
611 |
|
|
Deferred tax assets |
|
|
677 |
|
|
|
560 |
|
|
Lease assets |
|
|
1,058 |
|
|
|
— |
|
|
Other assets |
|
|
8,380 |
|
|
|
215 |
|
|
Total assets |
|
$ |
38,546 |
|
|
$ |
30,706 |
|
|
Liabilities and Stockholders’ Equity |
|
|
|
|
|
|
|
|
|
Current liabilities: |
|
|
|
|
|
|
|
|
|
Accounts payable |
|
$ |
1,535 |
|
|
$ |
1,063 |
|
|
Accrued liabilities |
|
|
2,012 |
|
|
|
718 |
|
|
Liability related to early exercised stock options |
|
|
67 |
|
|
|
136 |
|
|
Customer deposits |
|
|
1,371 |
|
|
|
2 |
|
|
Lease liabilities |
|
|
549 |
|
|
|
— |
|
|
Total current liabilities |
|
|
5,534 |
|
|
|
1,919 |
|
|
Other liabilities |
|
|
632 |
|
|
|
156 |
|
|
Total liabilities |
|
|
6,166 |
|
|
|
2,075 |
|
|
Commitments and contingencies (Note 5) |
|
|
|
|
|
|
|
|
|
Stockholders’ equity |
|
|
|
|
|
|
|
|
|
Common stock, par value $0.0001 per share - 75,000,000 shares authorized as of December 31, 2019 and 2018; 17,449,572 and 17,130,507 shares issued and outstanding as of December 31, 2019 and 2018, respectively |
|
|
2 |
|
|
|
2 |
|
|
Additional paid-in-capital |
|
|
20,928 |
|
|
|
19,358 |
|
|
Accumulated other comprehensive loss |
|
|
(15 |
) |
|
|
— |
|
|
Retained earnings |
|
|
11,465 |
|
|
|
9,271 |
|
|
Total stockholders’ equity |
|
|
32,380 |
|
|
|
28,631 |
|
|
Total liabilities and stockholders’ equity |
|
$ |
38,546 |
|
|
$ |
30,706 |
|
See accompanying notes to consolidated financial statements.
47
Consolidated Statements of Operations and Comprehensive Income
(in thousands, except share and per share amounts)
|
|
|
Year Ended |
|
|||||||||
|
|
December 31, |
|
||||||||||
|
|
|
2019 |
|
|
2018 |
|
|
2017 |
|
|||
|
Revenue |
|
$ |
32,027 |
|
|
$ |
31,098 |
|
|
$ |
31,142 |
|
|
Cost of revenue |
|
|
16,387 |
|
|
|
15,316 |
|
|
|
13,221 |
|
|
Gross profit |
|
|
15,640 |
|
|
|
15,782 |
|
|
|
17,921 |
|
|
Operating expenses |
|
|
|
|
|
|
|
|
|
|
|
|
|
Research and development |
|
|
6,468 |
|
|
|
7,331 |
|
|
|
5,383 |
|
|
Selling, general and administrative |
|
|
6,777 |
|
|
|
6,636 |
|
|
|
6,193 |
|
|
Total operating expenses |
|
|
13,245 |
|
|
|
13,967 |
|
|
|
11,576 |
|
|
Income from operations |
|
|
2,395 |
|
|
|
1,815 |
|
|
|
6,345 |
|
|
Other income (expense) |
|
|
54 |
|
|
|
229 |
|
|
|
(73 |
) |
|
Income before income taxes |
|
|
2,449 |
|
|
|
2,044 |
|
|
|
6,272 |
|
|
Provision for income taxes |
|
|
255 |
|
|
|
159 |
|
|
|
2,515 |
|
|
Net income |
|
$ |
2,194 |
|
|
$ |
1,885 |
|
|
$ |
3,757 |
|
|
Net income allocable to preferred stockholders |
|
$ |
— |
|
|
$ |
— |
|
|
$ |
1,936 |
|
|
Net income allocable to common stockholders |
|
$ |
2,194 |
|
|
$ |
1,885 |
|
|
$ |
1,821 |
|
|
Net income per share allocable to common stockholders: |
|
|
|
|
|
|
|
|
|
|
|
|
|
Basic |
|
$ |
0.13 |
|
|
$ |
0.11 |
|
|
$ |
0.25 |
|
|
Diluted |
|
$ |
0.12 |
|
|
$ |
0.10 |
|
|
$ |
0.24 |
|
|
Weighted-average shares outstanding in computing net income per share allocable to common stockholders |
|
|
|
|
|
|
|
|
|
|
|
|
|
Basic |
|
|
17,283,133 |
|
|
|
16,982,648 |
|
|
|
7,145,641 |
|
|
Diluted |
|
|
17,875,971 |
|
|
|
17,991,131 |
|
|
|
8,056,329 |
|
|
Comprehensive income: |
|
|
|
|
|
|
|
|
|
|
|
|
|
Net income |
|
$ |
2,194 |
|
|
$ |
1,885 |
|
|
$ |
3,757 |
|
|
Other comprehensive loss, net of tax: |
|
|
|
|
|
|
|
|
|
|
|
|
|
Unrealized loss on available-for-sale debt securities |
|
|
(15 |
) |
|
|
— |
|
|
|
— |
|
|
Comprehensive income |
|
$ |
2,179 |
|
|
$ |
1,885 |
|
|
$ |
3,757 |
|
See accompanying notes to consolidated financial statements.
48
Consolidated Statements of Stockholders’ Equity
(in thousands, except share amounts)
|
|
|
Convertible Preferred Stock |
|
|
|
|
Common Stock |
|
|
|
|
|
|
|
|
|
|
|
|
|
|
|
|
|
|
|
|
|
|
|
|
|
||||||||||||
|
|
|
Shares |
|
|
Amount |
|
|
|
|
Shares |
|
|
|
|
Amount |
|
|
|
|
Additional Paid-In Capital |
|
|
|
|
Accumulated Other Comprehensive Loss |
|
|
|
|
Retained Earnings |
|
|
|
|
Total Stockholders' Equity |
|
||||||||
|
Balances as of December 31, 2016 |
|
|
10,742,500 |
|
|
$ |
8,794 |
|
|
|
|
|
3,725,238 |
|
|
|
|
$ |
— |
|
|
|
|
$ |
813 |
|
|
|
|
$ |
— |
|
|
|
|
$ |
3,629 |
|
|
|
|
$ |
13,236 |
|
|
Conversion of convertible preferred stock to common stock upon IPO |
|
|
(10,742,500 |
) |
|
|
(8,794 |
) |
|
|
|
|
10,742,500 |
|
|
|
|
|
2 |
|
|
|
|
|
8,792 |
|
|
|
|
|
- |
|
|
|
|
|
- |
|
|
|
|
|
- |
|
|
Issuance of common stock upon IPO, net of issuance costs |
|
|
— |
|
|
|
- |
|
|
|
|
|
1,520,000 |
|
|
|
|
|
- |
|
|
|
|
|
5,157 |
|
|
|
|
|
- |
|
|
|
|
|
- |
|
|
|
|
|
5,157 |
|
|
Issuance of common stock upon exercise of over-allotment option, net of issuance costs |
|
|
— |
|
|
|
- |
|
|
|
|
|
228,000 |
|
|
|
|
|
- |
|
|
|
|
|
1,200 |
|
|
|
|
|
- |
|
|
|
|
|
- |
|
|
|
|
|
1,200 |
|
|
Issuance of common stock upon exercise of stock options and vesting of early exercised options |
|
|
— |
|
|
|
- |
|
|
|
|
|
506,433 |
|
|
|
|
|
- |
|
|
|
|
|
170 |
|
|
|
|
|
- |
|
|
|
|
|
- |
|
|
|
|
|
170 |
|
|
Issuance of common stock upon vesting of RSUs |
|
|
— |
|
|
|
- |
|
|
|
|
|
30,000 |
|
|
|
|
|
- |
|
|
|
|
|
- |
|
|
|
|
|
- |
|
|
|
|
|
- |
|
|
|
|
|
- |
|
|
Stock-based compensation |
|
|
— |
|
|
|
- |
|
|
|
|
|
- |
|
|
|
|
|
- |
|
|
|
|
|
1,448 |
|
|
|
|
|
- |
|
|
|
|
|
- |
|
|
|
|
|
1,448 |
|
|
Net Income |
|
|
— |
|
|
|
- |
|
|
|
|
|
- |
|
|
|
|
|
- |
|
|
|
|
|
- |
|
|
|
|
|
- |
|
|
|
|
|
3,757 |
|
|
|
|
|
3,757 |
|
|
Balances as of December 31, 2017 |
|
|
— |
|
|
$ |
— |
|
|
|
|
|
16,752,171 |
|
|
|
|
$ |
2 |
|
|
|
|
$ |
17,580 |
|
|
|
|
$ |
— |
|
|
|
|
$ |
7,386 |
|
|
|
|
$ |
24,968 |
|
|
Issuance of common stock upon exercise of stock options and vesting of early exercised options |
|
|
— |
|
|
|
- |
|
|
|
|
|
368,632 |
|
|
|
|
|
- |
|
|
|
|
|
423 |
|
|
|
|
|
- |
|
|
|
|
|
- |
|
|
|
|
|
423 |
|
|
Issuance of common stock upon vesting of RSUs |
|
|
— |
|
|
|
- |
|
|
|
|
|
10,500 |
|
|
|
|
|
- |
|
|
|
|
|
- |
|
|
|
|
|
- |
|
|
|
|
|
- |
|
|
|
|
|
- |
|
|
Shares repurchased for tax withholdings on vesting of RSUs |
|
|
— |
|
|
|
- |
|
|
|
|
|
(796 |
) |
|
|
|
|
- |
|
|
|
|
|
(9 |
) |
|
|
|
|
- |
|
|
|
|
|
- |
|
|
|
|
|
(9 |
) |
|
Stock-based compensation |
|
|
— |
|
|
|
- |
|
|
|
|
|
- |
|
|
|
|
|
- |
|
|
|
|
|
1,364 |
|
|
|
|
|
- |
|
|
|
|
|
- |
|
|
|
|
|
1,364 |
|
|
Net income |
|
|
— |
|
|
|
- |
|
|
|
|
|
- |
|
|
|
|
|
- |
|
|
|
|
|
- |
|
|
|
|
|
- |
|
|
|
|
|
1,885 |
|
|
|
|
|
1,885 |
|
|
Balances as of December 31, 2018 |
|
|
— |
|
|
$ |
— |
|
|
|
|
|
17,130,507 |
|
|
|
|
$ |
2 |
|
|
|
|
$ |
19,358 |
|
|
|
|
$ |
— |
|
|
|
|
$ |
9,271 |
|
|
|
|
$ |
28,631 |
|
|
Other comprehensive loss - unrealized loss on available-for-sale debt securities |
|
|
— |
|
|
|
- |
|
|
|
|
|
- |
|
|
|
|
|
- |
|
|
|
|
|
- |
|
|
|
|
|
(15 |
) |
|
|
|
|
- |
|
|
|
|
|
(15 |
) |
|
Issuance of common stock upon exercise of stock options and vesting of early exercised options |
|
|
— |
|
|
|
- |
|
|
|
|
|
249,848 |
|
|
|
|
|
- |
|
|
|
|
|
243 |
|
|
|
|
|
- |
|
|
|
|
|
- |
|
|
|
|
|
243 |
|
|
Issuance of common stock upon vesting of RSUs |
|
|
— |
|
|
|
- |
|
|
|
|
|
82,600 |
|
|
|
|
|
- |
|
|
|
|
|
- |
|
|
|
|
|
- |
|
|
|
|
|
- |
|
|
|
|
|
- |
|
|
Shares repurchased for tax withholdings on vesting of RSUs |
|
|
— |
|
|
|
- |
|
|
|
|
|
(13,383 |
) |
|
|
|
|
- |
|
|
|
|
|
(88 |
) |
|
|
|
|
- |
|
|
|
|
|
- |
|
|
|
|
|
(88 |
) |
|
Stock-based compensation |
|
|
— |
|
|
|
- |
|
|
|
|
|
- |
|
|
|
|
|
- |
|
|
|
|
|
1,415 |
|
|
|
|
|
- |
|
|
|
|
|
- |
|
|
|
|
|
1,415 |
|
|
Net income |
|
|
— |
|
|
|
- |
|
|
|
|
|
- |
|
|
|
|
|
- |
|
|
|
|
|
- |
|
|
|
|
|
- |
|
|
|
|
|
2,194 |
|
|
|
|
|
2,194 |
|
|
Balances as of December 31, 2019 |
|
|
— |
|
|
$ |
— |
|
|
|
|
|
17,449,572 |
|
|
|
|
$ |
2 |
|
|
|
|
$ |
20,928 |
|
|
|
|
$ |
(15 |
) |
|
|
|
$ |
11,465 |
|
|
|
|
$ |
32,380 |
|
See accompanying notes to consolidated financial statements
49
Consolidated Statements of Cash Flows
(in thousands)
|
|
|
Year Ended |
|
|||||||||
|
|
|
December 31, |
|
|||||||||
|
|
|
2019 |
|
|
2018 |
|
|
2017 |
|
|||
|
Cash Flows From Operating Activities |
|
|
|
|
|
|
|
|
|
|
|
|
|
Net income |
|
$ |
2,194 |
|
|
$ |
1,885 |
|
|
$ |
3,757 |
|
|
Adjustments to reconcile net income to net cash provided by operating activities: |
|
|
|
|
|
|
|
|
|
|
|
|
|
Depreciation and amortization |
|
|
331 |
|
|
|
244 |
|
|
|
207 |
|
|
Stock-based compensation |
|
|
1,415 |
|
|
|
1,364 |
|
|
|
1,448 |
|
|
Write-off of deferred costs and long lived assets |
|
|
— |
|
|
|
57 |
|
|
|
9 |
|
|
Provision for excess inventories |
|
|
710 |
|
|
|
301 |
|
|
|
410 |
|
|
Deferred income taxes |
|
|
(117 |
) |
|
|
92 |
|
|
|
370 |
|
|
Noncash lease expense |
|
|
643 |
|
|
|
— |
|
|
|
— |
|
|
Changes in operating assets and liabilities: |
|
|
|
|
|
|
|
|
|
|
|
|
|
Accounts receivable |
|
|
129 |
|
|
|
(143 |
) |
|
|
(14 |
) |
|
Inventory |
|
|
(4,551 |
) |
|
|
339 |
|
|
|
(674 |
) |
|
Prepaid expenses and other current assets |
|
|
128 |
|
|
|
42 |
|
|
|
(705 |
) |
|
Other assets |
|
|
(11 |
) |
|
|
(56 |
) |
|
|
(18 |
) |
|
Accounts payable |
|
|
621 |
|
|
|
151 |
|
|
|
85 |
|
|
Accrued expenses |
|
|
1,231 |
|
|
|
145 |
|
|
|
180 |
|
|
Customer deposits |
|
|
1,369 |
|
|
|
(4 |
) |
|
|
(739 |
) |
|
Lease liabilities |
|
|
(350 |
) |
|
|
— |
|
|
|
— |
|
|
Other liabilities |
|
|
(325 |
) |
|
|
23 |
|
|
|
43 |
|
|
Net cash provided by operating activities |
|
|
3,417 |
|
|
|
4,440 |
|
|
|
4,359 |
|
|
Cash Flows From Investing Activities |
|
|
|
|
|
|
|
|
|
|
|
|
|
Purchase of property and equipment |
|
|
(316 |
) |
|
|
(376 |
) |
|
|
(170 |
) |
|
Purchase of debt securities |
|
|
(17,737 |
) |
|
|
— |
|
|
|
— |
|
|
Net cash used in investing activities |
|
|
(18,053 |
) |
|
|
(376 |
) |
|
|
(170 |
) |
|
Cash Flows From Financing Activities |
|
|
|
|
|
|
|
|
|
|
|
|
|
Net proceeds from exercise of stock options |
|
|
174 |
|
|
|
407 |
|
|
|
98 |
|
|
Payment for shares withheld for tax withholdings on vesting of RSUs |
|
|
(88 |
) |
|
|
(9 |
) |
|
|
— |
|
|
Payments of deferred costs |
|
|
— |
|
|
|
(57 |
) |
|
|
(2,096 |
) |
|
Proceeds from initial public offering, net of underwriter commissions |
|
|
— |
|
|
|
— |
|
|
|
9,339 |
|
|
Net cash provided by financing activities |
|
|
86 |
|
|
|
341 |
|
|
|
7,341 |
|
|
Net increase (decrease) in cash and cash equivalents |
|
|
(14,550 |
) |
|
|
4,405 |
|
|
|
11,530 |
|
|
Cash and cash equivalents at beginning of period |
|
|
25,941 |
|
|
|
21,536 |
|
|
|
10,006 |
|
|
Cash and cash equivalents at end of period |
|
$ |
11,391 |
|
|
$ |
25,941 |
|
|
$ |
21,536 |
|
|
|
|
|
|
|
|
|
|
|
|
|
|
|
|
Supplemental Disclosure of Cash Flow Information |
|
|
|
|
|
|
|
|
|
|
|
|
|
Cash paid for income taxes |
|
$ |
35 |
|
|
$ |
44 |
|
|
$ |
2,585 |
|
|
Supplemental Disclosure of Noncash Investing and Financing Information |
|
|
|
|
|
|
|
|
|
|
|
|
|
Property and equipment purchased but not yet paid |
|
$ |
89 |
|
|
$ |
173 |
|
|
$ |
21 |
|
|
Vesting of early exercised options |
|
$ |
67 |
|
|
$ |
74 |
|
|
$ |
99 |
|
|
Conversion of preferred stock to common stock upon initial public offering |
|
$ |
— |
|
|
$ |
— |
|
|
$ |
8,792 |
|
50
See accompanying notes to consolidated financial statements.
Techpoint, Inc.
Notes to Consolidated Financial Statements
1. Organization and Summary of Significant Accounting Policies
Organization
Techpoint, Inc. and its wholly-owned subsidiaries (the “Company”) was originally incorporated in California in April 2012 and reincorporated in Delaware in July 2017. The Company is a fabless semiconductor company that designs, markets and sells mixed-signal integrated circuits for multiple video applications in the security surveillance and automotive markets. The Company is headquartered in San Jose, California.
Initial Public Offering
On September 29, 2017, the Company completed its initial public offering (“IPO”) of Japanese depositary shares (“JDS”). In connection with the IPO, the Company sold 1,520,000 JDSs, represented by 1,520,000 shares of our common stock at a price to the public of $5.85 per share and received net proceeds of $8.1 million, after deducting underwriting discounts and commissions of $0.7 million. Additionally, offering costs incurred by the Company totaled $3.0 million. Prior to the closing of the Company’s IPO, all outstanding shares of its preferred stock converted to common stock on a one-to-one basis.
On October 25, 2017, the managing underwriter of our IPO elected to purchase an additional 228,000 shares of JDSs, represented by 228,000 shares of common stock, pursuant to the underwriters’ over-allotment option. We subsequently completed the sale at the IPO price of $5.85 per share and received net proceeds of $1.2 million, after deducting underwriting discounts and commissions of $0.1 million.
Basis of Consolidation and Significant Accounting Policies
The accompanying consolidated financial statements include the accounts of the Company and its wholly-owned subsidiaries, and have been prepared in conformity with generally accepted accounting principles in the United States (“GAAP”) and applicable rules and regulations of the Securities and Exchange Commission (“SEC”). All intercompany balances and transactions have been eliminated. The functional currency of each of the Company’s subsidiaries is the U.S. dollar. Foreign currency gains or losses are recorded as other income (expense) in the Consolidated Statements of Operations.
Use of Management’s Estimates
The preparation of consolidated financial statements in conformity with GAAP requires management to make estimates, judgments and assumptions that affect the reported amounts of assets and liabilities and disclosure of contingent assets and liabilities at the date of the financial statements and reported amounts of revenue and expenses during the reporting period. Significant estimates included in the consolidated financial statements include inventory valuation, valuation allowance for recorded deferred tax assets, and stock-based compensation. These estimates are based upon information available as of the date of the consolidated financial statements. Actual results could differ materially from those estimates.
Concentration of Customer and Credit Risk
Financial instruments that potentially subject the Company to concentrations of credit risk consist principally of cash and cash equivalents, investments, and trade receivables. Risks associated with cash and cash equivalents, and investments are mitigated by banking with, and investing in, creditworthy institutions. The Company generally requires advance payments from customers. The Company also performs credit evaluations of its customers and provides credit to certain customers in the normal course of business. The Company has not incurred bad debt write-offs during any of the periods presented.
51
For each significant customer, or distributor, and significant end-customer, revenue as a percentage of total revenue is as follows:
|
|
|
Year Ended |
|
|||||||||
|
|
December 31, |
|
||||||||||
|
|
|
2019 |
|
|
2018 |
|
|
2017 |
|
|||
|
Customer |
|
|
|
|
|
|
|
|
|
|
|
|
|
Customer A |
|
|
57 |
% |
|
|
76 |
% |
|
|
74 |
% |
|
End-Customer |
|
|
|
|
|
|
|
|
|
|
|
|
|
End-Customer A (1) |
|
|
50 |
% |
|
|
62 |
% |
|
|
59 |
% |
|
|
(1) |
Sales to End-Customer A primarily occurred through Customer A |
Concentration of Supplier Risk
The Company is a fabless producer of semiconductors and is dependent on four subcontractors for substantially all of its production requirements. The failure of either subcontractor to fulfill the production requirements of the Company on a timely basis would adversely impact future results. Although there are other subcontractors that are capable of providing similar services, an unexpected change in either subcontractor would cause delays in the Company’s products and potentially result in a significant loss of revenue.
Cash and Cash Equivalents
The Company considers all highly liquid financial instruments purchased with an original maturity of three months or less at the date of purchase to be cash equivalents. Cash and cash equivalents consist of cash on deposit with banks, money market funds and commercial papers, the fair value of which approximates cost.
Financial Instruments
Financial instruments held by the Company consist primarily of corporate bonds, commercial paper and money market funds. The Company classified the securities with remaining maturities of twelve months or less as short-term investments, and remaining maturities of over twelve months as long-term investments. The Company’s financial instruments are classified as available-for-sale, and the long-term investments are included in other assets. Unrealized gains and losses on securities, net of tax, are recorded in accumulated other comprehensive loss and reported as a component of stockholders’ equity. Interest is included in other income (expense) on the consolidated statements of operations and comprehensive income.
The Company evaluates the investments periodically for possible other-than-temporary impairment and reviews factors such as the length of time and extent to which fair value has been below cost basis, the financial condition of the issuer, the Company’s intent to hold and whether the Company will not be required to sell the security before its anticipated recovery, on a more-likely-than-not basis. If the declines in the fair value of the investments are determined to be other-than-temporary, the Company reports the credit loss portion of such decline in other income, net and the remaining noncredit loss portion in accumulated other comprehensive loss.
Fair Value of Financial Instruments
The Company estimates certain financial assets and liabilities at fair value based on available market information and valuation methodologies considered to be appropriate. However, considerable judgment is required in interpreting market data to develop the estimate of fair value. The use of different market assumptions and/or estimation methodologies could have a material effect on estimated fair value amounts. See Note 3 “Fair Value Measurements of Financial Instruments” of these Notes to Consolidated Financial Statements for a further discussion on fair value of financial instruments.
52
Inventories are stated at the lower of cost or net realizable value. Cost is computed using the standard cost, which approximates actual cost determined on a first-in, first-out basis. Inventories include work in process and finished good parts that may be specialized in nature and subject to rapid obsolescence. Because of the cyclical nature of the market, inventory levels, obsolescence of technology, and product life cycles, the Company generally writes down inventories to net realizable value based on forecasted product demand. Inventory write downs for excess quantity and technological obsolescence are charged to cost of sales when evidence indicates clearly that a loss has been sustained. The amount written down for the years ended December 31, 2019 and 2018 was $0.7 million and $0.3 million, respectively.
Property and Equipment
Property and equipment, are stated at cost less accumulated depreciation, and are depreciated using the straight-line method over the estimated useful lives of the assets. The estimated useful lives range from two to three years for computer equipment and software, furniture and leasehold improvements.
The Company evaluates the recoverability of property, plant and equipment in accordance with ASC No. 360, Accounting for the Property, Plant, and Equipment. (“ASC 360”). The Company performs periodic reviews to determine whether facts and circumstances exist that would indicate that the carrying amounts of property and equipment exceeds their fair values. If facts and circumstances indicate that the carrying amount of property and equipment might not be fully recoverable, projected undiscounted net cash flows associated with the related asset or group of assets over their estimated remaining useful lives are compared against their respective carrying amounts. In the event that the projected undiscounted cash flows are not sufficient to recover the carrying value of the assets, the assets are written down to their estimated fair values based on their expected discounted future cash flows attributable to those assets.
Product Warranty
The Company generally warrants its products for one year from the date of shipment against defects. The Company accrues for anticipated warranty costs upon shipment based on the number of shipped units, historical analysis of the volume of product returned under the warranty program, management’s judgment regarding anticipated rates of warranty claims and associated repair costs.
Employee Benefit Plan
The Company sponsors a 401(k) tax-deferred savings plan for all employees in the United States who meet certain eligibility requirements. Participants may contribute up to the amount allowable as a deduction for federal income tax purposes. The 401(k) Plan provides for a discretionary employer-matching contribution. The Company has not made any matching contributions to the 401(k) Plan to date.
Revenue Recognition
The Company principally sells its products to distributors who, in turn, sell to ODMs, contract manufacturers and design houses. Prior to January 1, 2018, revenue from the sale of the Company’s products was recognized when all of the following criteria were met: (1) persuasive evidence of an arrangement exists; (2) the product has been delivered; (3) the price is fixed or determinable; and (4) collection is reasonably assured.
The Company adopted ASC Topic 606, or ASC 606, Revenue from Contracts with Customers on January 1, 2018 under the modified retrospective approach as applied to customer contracts that were not completed as of January 1, 2018. Financial information for reporting periods beginning after January 1, 2018 are reported under the new standard, while comparative financial information has not been adjusted and continues to be reported in accordance with the previous standard. There was no cumulative impact to adopting the new standard on the Company’s consolidated financial statements. Under ASC 606, the Company satisfies its performance obligations and recognize revenue upon shipment, at which time control of our products is transferred to its customers. The Company applies the following five-step model for recognizing revenue from contracts with customers: (1) identify
53
the contract with a customer; (2) identify the performance obligations in the contract; (3) determine the transaction price; (4) allocate the transaction price to the performance obligations in the contract; and (5) recognize revenue when the performance obligation is satisfied.
Product revenues consist of sales of mixed-signal integrated circuits into the security surveillance and automotive markets. The Company generally requires advance payments from customers and records these advance payments, or contract liabilities, as Customer deposits on our Consolidated Balance Sheet. Since the Company’s performance obligations relate to contracts with a duration of less than one year, the Company has elected to apply the optional exemption practical expedient provided in ASC 606 and is therefore not required to disclose the aggregate amount of the transaction price allocated to performance obligations that are unsatisfied or partially unsatisfied at the end of the reporting period. The Company provides product assurance warranty only and does not offer warranties to be purchased separately. The Company does not offer variable consideration or other significant payment terms and allocates the transaction price to each distinct product based on a relative standalone selling price. Revenue is recognized when control of the product is transferred to our customers, upon shipment, at which time the performance obligation is satisfied. The Company’s shipping terms are primarily FOB (free on board) shipping point, whereby legal title, risks and rewards of ownership, and physical possession are transferred to the customer upon shipment. Substantially all of the Company’s customers pay in advance of shipment, and no stock rotation, price protection or return rights are offered.
Research and Development Costs
Research and development costs are expensed as incurred. Such costs consist primarily of expenditures for labor, benefits and mask sets, design, prototype and software expense.
Stock-Based Compensation
The Company measures the cost of employee services received in exchange for equity incentive awards, including stock options and restricted stock unit awards, based on the grant date fair value of the award. The fair value of a stock option award is estimated using the Black-Scholes option pricing model which requires us to estimate certain key assumptions including, stock price, future stock price volatility, expected term of the options, risk free rates, and dividend yields. The fair value of a restricted stock unit is determined based on the fair value of our common stock on the date of grant. The Company adjusts compensation expense for forfeiture of equity incentive awards as they occur. The resulting cost is recognized over the period that the employee is required to provide services for the award, which is usually the vesting period. The Company recognizes compensation expense over the vesting period using the straight-line method and classifies these amounts based on the department to which the related employee is assigned. See Note 8 “Stock-Based Compensation” for a description of the Company’s stock-based employee compensation plans and the assumptions the Company uses to calculate the fair value of stock-based employee compensation.
Stock-based awards issued to non-employees are recognized as expense over the requisite service period at their then current fair value. The Company determines the fair value of its stock-based awards issued to non-employees utilizing the Black-Scholes option pricing model. Stock-based compensation expense for stock-based awards issued to nonemployees is recognized over the requisite service period or when it is probable that the performance condition will be satisfied. The fair value of stock-based awards to non-employees is measured at each reporting period until a measurement date is reached. Upon the early adoption of ASU 2018-07 on July 1, 2018 in the third quarter of fiscal 2018, non-employee stock awards were remeasured at fair value on the date of adoption; the remaining unamortized expense on the date of adoption will be recognized over the remaining vesting term.
Income Taxes
The Company accounts for income taxes using an asset and liability approach as prescribed in ASC 740-10, Income Taxes (“ASC 740-10”). The Company records the amount of taxes payable or refundable for the current and prior years and deferred tax assets and liabilities for the future tax consequences of events that have been recognized in the Company’s financial statements or tax returns. A valuation allowance is recorded to reduce deferred tax assets when it is more likely than not that a tax benefit will not be realized.
54
ASC 740-10 prescribes a recognition threshold and measurement framework for the financial statement reporting and disclosure of an income tax position taken or expected to be taken on a tax return. Under ASC 740-10, a tax position is recognized in the financial statements when it is more likely than not, based on the technical merits, that the position will be sustained upon examination, including resolution of any related appeals or litigation processes. A tax position that meets the recognition threshold is then measured to determine the largest amount of the benefit that has a greater than 50% likelihood of being realized upon settlement. The Company recognizes interest and penalties related to unrecognized tax benefits as a component of the provision for income taxes in the Consolidated Statements of Income.
The calculation of tax liabilities involves significant judgment in estimating the impact of uncertainties in the application of complex tax laws across multiple tax jurisdictions. Although ASC 740-10 provides clarification on the accounting for uncertainty in income taxes recognized in the financial statements, the recognition threshold and measurement framework will continue to require significant judgment by management. Resolution of these uncertainties in a manner inconsistent with the Company’s expectations could have a material impact on the Company’s results of operations.
Recently Adopted Accounting Pronouncements
Stock Compensation Guidance. In June 2018, the FASB issued ASU No 2018-07, Stock Compensation: Improvements to Nonemployee Share-Based Payment Accounting, which amends ASC 718 to include share-based payments issued to nonemployees for goods or services. The amendments in this update are effective for annual periods beginning after December 15, 2018, and interim periods therein. Early adoption is permitted, but no earlier than a company’s adoption date of Topic 606, Revenue from Contracts with Customers. The Company early adopted this guidance on July 1, 2018 during the third quarter of fiscal 2018, which resulted in no impact on its consolidated financial statements.
Revenue Recognition Guidance. In May 2014, the FASB issued ASU 2014-09, Revenue from Contracts with Customers, creating ASC 606. Upon adoption, this topic supersedes the existing guidance under ASC Topic 605 – Revenue Recognition and aims to simplify the number of requirements to follow for revenue recognition and make revenue recognition more comparable across various entities, industries, jurisdictions and capital markets. Revenue is recognized under a five-step process: 1. Identify the contract(s) with a customer. 2. Identify the performance obligations in the contract. 3. Determine the transaction price. 4. Allocate the transaction price to performance obligations in the contract. 5. Recognize revenue when (or as) the entity satisfies a performance obligation. Additional considerations under this update include accounting for costs to obtain or fulfill a contract with a customer and additional quantitative and qualitative disclosures. ASU 2014-09 became effective for periods beginning after December 15, 2017 (including interim reporting periods within those periods), or the first quarter 2018, and allows for retrospective or modified retrospective application. The Company adopted this guidance in the first quarter of fiscal 2018 under the modified retrospective approach as applied to customer contracts that were not completed as of January 1, 2018. As a result, financial information for reporting periods beginning after January 1, 2018 are reported under the new standard, while comparative financial information has not been adjusted and continues to be reported in accordance with the previous standard. There was no cumulative impact to adopting the new standard on the Company’s consolidated financial statements.
Lease Guidance. In February 2016, the FASB issued ASU No. 2016-02, Leases (Topic 842). ASU 2016-02 requires lessees to recognize all leases with terms in excess of one year on their balance sheet as a right-of-use asset and a lease liability at the commencement date. The new standard also simplifies the accounting for sale and leaseback transactions. The amendments in this update are effective for annual periods beginning after December 15, 2018, and interim periods therein and must be adopted using a modified retrospective method for leases existing at, or entered into after, the beginning of the earliest comparative period presented in the financial statements. The new standard also requires lessees and lessors to disclose qualitative and quantitative information about their leases and significant judgements made in applying the standard. In July 2018, the FASB issued ASU 2018-11, Leases: Targeted Improvements (Topic 842), which provides an optional adoption method to ASU 2016-02 whereby comparative period financial statements do not need to be adjusted for the new standard. The Company adopted the new standard using the optional adoption method on January 1, 2019 to not adjust comparative financial statements. The Company elected to use the package of practical expedients and did not reassess whether any expired or
55
existing contracts are or contain leases, the lease classification for any expired or existing leases, or initial direct costs for any existing leases, and the practical expedient to not separate lease and non-lease components. Additionally, the Company elected to use the short-term lease exemption whereby right-of-use assets and lease liabilities do not need to be recognized for leases with a term of 12 months or less. As a result, the Company recognized $0.8 million of lease assets and $0.9 million of lease liabilities, of which $0.2 million is recorded as non-current lease liabilities on the Company’s Consolidated Balance sheet as of January 1, 2019. Additionally, upon adoption, there was no impact on the Consolidated Statement of Operations and Comprehensive Income and no cumulative effect adjustment to retained earnings as of January 1, 2019.
Recently Issued Accounting Pronouncements Not Yet Adopted
In June 2016, the FASB issued ASU No. 2016-13, Financial Instruments-Credit Losses (Topic 326): Measurement of Credit Losses on Financial Instruments, which requires the measurement and recognition of expected credit losses for financial assets held at amortized cost. It also eliminates the concept of other-than-temporary impairment and requires credit losses related to available-for-sale debt securities to be recorded through an allowance for credit losses rather than as a reduction in the amortized cost basis of the securities. These changes will result in more timely recognition of credit losses. The guidance is effective for fiscal years beginning after December 15, 2022 for SEC filers that are eligible to be smaller reporting companies under the SEC’s definition, and interim periods within those fiscal years. The Company is currently evaluating the impact this guidance will have on the Company’s consolidated financial statements.
In August 2018, the FASB issued ASU No. 2018-13, Fair Value Measurement (Topic 820), which amends disclosure requirements for fair value measurements by requiring new disclosures, modifying existing requirements, and eliminating others. The amendments are the result of a broader disclosure project, which aims to improve the effectiveness of disclosures. ASU No. 2018-13 is effective for fiscal years beginning after December 15, 2019 and interim periods within those fiscal years. The Company is currently evaluating the impact this guidance will have on the Company’s consolidated financial statements.
In December 2019, the FASB issued Accounting Standard Update No. 2019-12, which simplifies the accounting for income taxes. The guidance in ASU No. 2019-12 is required for annual reporting periods, including interim periods within those annual periods, beginning after December 15, 2020, for public business entities, with early adoption permitted. The Company is currently evaluating the impact this guidance will have on the Company’s consolidated financial statements.
2. Balance Sheet Components
Inventory
Inventory consists of the following (in thousands):
|
|
December 31, |
|
|
December 31, |
|
|||
|
|
2019 |
|
|
2018 |
|
|||
|
Work in process |
|
$ |
2,529 |
|
|
$ |
961 |
|
|
Finished goods |
|
|
3,519 |
|
|
|
1,246 |
|
|
Total inventory |
|
$ |
6,048 |
|
|
$ |
2,207 |
|
56
Property and equipment - net consists of the following (in thousands):
|
|
December 31, |
|
|
December 31, |
|
|||
|
|
2019 |
|
|
2018 |
|
|||
|
Computer equipment and software |
|
$ |
1,405 |
|
|
$ |
1,173 |
|
|
Leasehold improvements |
|
|
89 |
|
|
|
84 |
|
|
Furniture |
|
|
30 |
|
|
|
30 |
|
|
Total property and equipment |
|
|
1,524 |
|
|
|
1,287 |
|
|
Less: accumulated depreciation |
|
|
(989 |
) |
|
|
(676 |
) |
|
Total property and equipment - net |
|
$ |
535 |
|
|
$ |
611 |
|
The Company recorded $0.3 million, $0.2 million and $0.2 million of depreciation expense for each of the years ended December 31, 2019, 2018, and 2017, respectively.
Accrued Liabilities
Accrued liabilities consist of the following (in thousands):
|
|
|
December 31, |
|
|
December 31, |
|
||
|
|
2019 |
|
|
2018 |
|
|||
|
Engineering services |
|
$ |
920 |
|
|
$ |
134 |
|
|
Payroll-related expenses |
|
|
780 |
|
|
|
398 |
|
|
Accrued warranty |
|
|
194 |
|
|
|
73 |
|
|
Taxes payable |
|
|
72 |
|
|
|
28 |
|
|
Professional fees |
|
|
31 |
|
|
|
48 |
|
|
Other |
|
|
15 |
|
|
|
37 |
|
|
Total accrued liabilities |
|
$ |
2,012 |
|
|
$ |
718 |
|
Customer Deposits
Customer deposits represent payments received in advance of shipments and fluctuate depending on timing of customer pre-payments and product shipment. Customer deposits were $1.4 million, $3.4 million, and $2,000 as of December 31, 2019, September 30, 2019, and December 31, 2018, respectively. The Company generally expects to recognize revenue from customer deposits during the three month interim period immediately following the balance sheet date. During the three months ended December 31, 2019, the Company recognized $3.4 million of revenue from the September 30, 2019 customer deposits balance. During the year ended December 31, 2019, the Company recognized $2,000 of revenue from the December 31, 2018 customer deposits balance.
57
3. Fair Value Measurements of Financial Instruments
Summary of Financial Instruments
The following is a summary of financial instruments (in thousands):
|
|
|
December 31, 2019 |
|
|||||||||||||
|
|
|
Amortized Cost |
|
|
Gross Unrealized Gain |
|
|
Gross Unrealized Loss |
|
|
Estimated Fair Values |
|
||||
|
Available-for-sale securities: |
|
|
|
|
|
|
|
|
|
|
|
|
|
|
|
|
|
Money market funds |
|
$ |
2,027 |
|
|
$ |
— |
|
|
$ |
— |
|
|
$ |
2,027 |
|
|
Commercial paper |
|
|
6,965 |
|
|
|
— |
|
|
|
(3 |
) |
|
|
6,962 |
|
|
Corporate bonds |
|
|
12,943 |
|
|
|
1 |
|
|
|
(13 |
) |
|
|
12,931 |
|
|
Total available-for-sale securities |
|
$ |
21,935 |
|
|
$ |
1 |
|
|
$ |
(16 |
) |
|
$ |
21,920 |
|
|
Reported in: |
|
|
|
|
|
|
|
|
|
|
|
|
|
|
|
|
|
Cash and cash equivalents |
|
|
|
|
|
|
|
|
|
|
|
|
|
$ |
4,275 |
|
|
Short-term investments |
|
|
|
|
|
|
|
|
|
|
|
|
|
|
9,475 |
|
|
Other assets |
|
|
|
|
|
|
|
|
|
|
|
|
|
|
8,170 |
|
|
Total available-for-sale securities |
|
|
|
|
|
|
|
|
|
|
|
|
|
$ |
21,920 |
|
|
|
|
December 31, 2018 |
|
|||||||||||||
|
|
Amortized Cost |
|
|
Gross Unrealized Gain |
|
|
Gross Unrealized Loss |
|
|
Estimated Fair Values |
|
|||||
|
Available-for-sale securities: |
|
|
|
|
|
|
|
|
|
|
|
|
|
|
|
|
|
Money market funds |
|
$ |
6,974 |
|
|
$ |
— |
|
|
$ |
— |
|
|
$ |
6,974 |
|
|
Reported in: |
|
|
|
|
|
|
|
|
|
|
|
|
|
|
|
|
|
Cash and cash equivalents |
|
|
|
|
|
|
|
|
|
|
|
|
|
$ |
6,974 |
|
The contractual maturities of available-for-sale securities are presented in the following table (in thousands):
|
|
|
December 31, 2019 |
|
|||||
|
|
|
Amortized Cost |
|
|
Estimated Fair Value |
|
||
|
Due in one year or less |
|
$ |
13,757 |
|
|
$ |
13,750 |
|
|
Due between one to two years |
|
|
8,178 |
|
|
|
8,170 |
|
|
|
|
$ |
21,935 |
|
|
$ |
21,920 |
|
The Company had 15 investments in unrealized loss positions as of December 31, 2019. The investments have been in unrealized loss positions for less than twelve months. The total fair value of such investments is $18.9 million with unrealized losses of $16,000. There were no material gross unrealized losses from available-for-sale securities and no material realized gains or losses from available-for-sale securities that were reclassified out of accumulated other comprehensive income for the year ended December 31, 2019.
For investments in available-for-sale debt securities that have unrealized losses, the Company evaluates whether (i) it has the intention to sell any of these investments and (ii) whether it is not more likely than not that it will be required to sell any of these investments before recovery of the entire amortized cost basis. Based on this evaluation, the Company determined that there were no other-than-temporary impairments associated with investments as of December 31, 2019.
58
There were no sales of available-for-sale securities for the years ended December 31, 2019 and 2018.
Fair Value Measurements
Fair value is defined as the exchange price that would be received from selling an asset or paid to transfer a liability in the principal or most advantageous market for the asset or liability in an orderly transaction between market participants on the measurement date. The Company measures financial assets and liabilities at fair value at each reporting period using a fair value hierarchy which requires us to maximize the use of observable inputs and minimize the use of unobservable inputs. A financial instrument’s classification within the fair value hierarchy is based upon the lowest level of input that is significant to the fair value measurement. Three levels of inputs may be used to measure fair value:
Level 1. Quoted prices in active markets for identical assets or liabilities.
Level 2. Inputs other than Level 1 that are observable, either directly or indirectly, such as quoted prices for similar assets or liabilities; quoted prices in markets that are not active; or other inputs that are observable or can be corroborated by observable market data.
Level 3. Unobservable inputs that are supported by little or no market activity and that are significant to the fair value of the assets or liabilities, including pricing models, discounted cash flow methodologies and similar techniques.
The following table sets forth our financial instruments that were measured at fair value by level within the fair value hierarchy (in thousands):
|
|
|
Fair Value Measurement at Reporting Date Using |
|
|||||||||||||
|
|
Quoted Prices in Active Markets for Identical Assets (Level 1) |
|
|
Significant Other Observable Inputs (Level 2) |
|
|
Significant Unobservable Inputs (Level 3) |
|
|
Total |
|
|||||
|
As of December 31, 2019 |
|
|
|
|
|
|
|
|
|
|
|
|
|
|
|
|
|
Financial assets - available-for-sale securities |
|
|
|
|
|
|
|
|
|
|
|
|
|
|
|
|
|
Money market funds |
|
$ |
2,027 |
|
|
$ |
— |
|
|
$ |
— |
|
|
$ |
2,027 |
|
|
Commercial paper |
|
|
— |
|
|
|
6,962 |
|
|
|
— |
|
|
|
6,962 |
|
|
Corporate bonds |
|
|
— |
|
|
|
12,931 |
|
|
|
— |
|
|
|
12,931 |
|
|
Total financial asset - available-for-sale securities |
|
$ |
2,027 |
|
|
$ |
19,893 |
|
|
$ |
— |
|
|
$ |
21,920 |
|
|
As of December 31, 2018 |
|
|
|
|
|
|
|
|
|
|
|
|
|
|
|
|
|
Financial assets - available-for-sale securities |
|
|
|
|
|
|
|
|
|
|
|
|
|
|
|
|
|
Money market funds |
|
$ |
6,974 |
|
|
$ |
— |
|
|
$ |
— |
|
|
$ |
6,974 |
|
The Company classifies money market funds in Level 1 since the financial assets consist of securities for which quoted prices are available in an active market.
In addition, the Company classifies corporate bonds and commercial paper in Level 2 since the financial assets use observable inputs including quoted prices in active markets for similar assets or liabilities. The Company uses a pricing service to assist in determining the fair values of all of its cash equivalents, short-term investments and long-term investments. The pricing service uses inputs from multiple industry standard data providers or other third party sources and applies various acceptable methodologies.
4. Segment Information
Operating segments are defined as components of an enterprise about which separate financial information is available that is evaluated regularly by the chief operating decision maker in deciding how to allocate resources and in assessing performance.
59
The Company’s chief operating decision maker, the chief executive officer, reviews financial information presented on a consolidated basis for purposes of making operating decisions and assessing financial performance on a regular basis. Accordingly, the Company considers itself to be one reportable segment, which is comprised of one operating segment, the designing, marketing and selling of mixed-signal integrated circuits for the security surveillance and automotive markets.
Product revenue from customers is designated based on the geographic region to which the product is delivered. Revenue by geographic region was as follows (in thousands):
|
|
Year Ended |
|
||||||||||
|
|
|
December 31, |
|
|||||||||
|
|
|
2019 |
|
|
2018 |
|
|
2017 |
|
|||
|
China |
|
$ |
23,533 |
|
|
$ |
26,175 |
|
|
$ |
26,453 |
|
|
Taiwan |
|
|
4,061 |
|
|
|
897 |
|
|
|
821 |
|
|
South Korea |
|
|
3,414 |
|
|
|
2,685 |
|
|
|
2,857 |
|
|
Japan |
|
|
908 |
|
|
|
1,310 |
|
|
|
941 |
|
|
Other |
|
|
111 |
|
|
|
31 |
|
|
|
70 |
|
|
Total revenue |
|
$ |
32,027 |
|
|
$ |
31,098 |
|
|
$ |
31,142 |
|
Revenue by principal product lines were as follows (in thousands):
|
|
Year Ended |
|
||||||||||
|
|
December 31, |
|
||||||||||
|
|
|
2019 |
|
|
2018 |
|
|
2017 |
|
|||
|
Security surveillance |
|
$ |
21,178 |
|
|
$ |
26,325 |
|
|
$ |
28,143 |
|
|
Automotive |
|
|
10,849 |
|
|
|
4,773 |
|
|
|
2,999 |
|
|
Total revenue |
|
$ |
32,027 |
|
|
$ |
31,098 |
|
|
$ |
31,142 |
|
Long-lived assets are attributed to the geographic region where they are located. Net long-lived assets by geographic region were as follows (in thousands):
|
|
December 31, |
|
|
December 31, |
|
|||
|
|
2019 |
|
|
2018 |
|
|||
|
Taiwan |
|
$ |
409 |
|
|
$ |
399 |
|
|
Japan |
|
|
54 |
|
|
|
104 |
|
|
United States |
|
|
49 |
|
|
|
102 |
|
|
China |
|
|
19 |
|
|
|
2 |
|
|
South Korea |
|
|
4 |
|
|
|
4 |
|
|
Total property and equipment - net |
|
$ |
535 |
|
|
$ |
611 |
|
5. Commitments and Contingencies
Operating leases
The Company determines if an arrangement contains a lease at inception. The Company leases facilities under non-cancellable lease agreements expiring through fiscal year 2022. The Company’s agreements do not include variable lease payments or any restrictions or covenants imposed by the leases. As the rate implicit in each lease agreement is not readily determinable, the Company’s incremental borrowing rate was used as the discount rate. The Company’s lease assets and lease liabilities have been adjusted for initial direct costs and prepaid rent but do not reflect any options to extend or terminate its lease agreements, any residual value guarantees, or any leases that have yet to be commenced.
60
As of December 31, 2019, the right of use assets and lease liabilities related to operating leases were as follows (in thousands):
|
|
December 31, |
|
||
|
|
|
2019 |
|
|
|
Lease assets |
|
$ |
1,058 |
|
|
|
|
|
|
|
|
Lease liabilities - Current |
|
$ |
549 |
|
|
Lease liabilities - Non-Current |
|
|
518 |
|
|
Total lease liabilities |
|
$ |
1,067 |
|
Rent expense under operating leases was $0.7 million, $0.6 million, and $0.5 million for the years ended December 31, 2019, 2018, and 2017, respectively. The rent expense recognized from short-term leases was $24,000 for the year ended December 31, 2019.
The following table summarizes the Company’s lease costs and weighted-average assumptions used in determining its lease assets and lease liabilities (in thousands):
|
|
|
Year Ended |
|
|
|
|
|
December 31, 2019 |
|
|
|
Operating lease cost |
|
$ |
686 |
|
|
Cash paid for operating leases |
|
$ |
695 |
|
|
Lease assets obtained in exchange for lease liabilities (1): |
|
|
|
|
|
Upon adoption of Topic 842 |
|
$ |
839 |
|
|
New leases commenced during the period |
|
$ |
997 |
|
|
Weighted average remaining term for operating leases |
|
1.94 years |
|
|
|
|
|
6.0 |
% |
|
(1) During the year ended December, 31 2019, the Company entered into one new operating lease and modified one existing operating lease. The lease modification was not treated as a separate contract as no additional right of use was granted. Balance is comprised of the commencement date asset value of the leases commenced during the year as well as the asset value of the leases existing at the date of ASC 842 adoption.
As of December 31, 2018 , the aggregate future minimum lease payments under non-cancelable operating leases consist of the following (in thousands):
|
Year Ending December 31, |
|
Amount |
|
|
|
2019 |
|
$ |
645 |
|
|
2020 |
|
|
201 |
|
|
Total |
|
$ |
846 |
|
As of December 31, 2019, the aggregate future minimum lease payments under non-cancelable operating leases consist of the following (in thousands):
|
Year Ending December 31, |
|
Amount |
|
|
|
2020 |
|
$ |
593 |
|
|
2021 |
|
|
471 |
|
|
2022 |
|
|
65 |
|
|
Total |
|
$ |
1,129 |
|
|
Less effects of discounting |
|
|
(62 |
) |
|
Lease liabilities recognized |
|
$ |
1,067 |
|
Purchase Commitments
As of December 31, 2019, the Company had purchase commitments with its third-party suppliers through fiscal year 2022. Future minimum payments under purchase commitments are $0.3 million, $0.2 million, and $49,000 for the years ending December 31, 2020, 2021, and 2022, respectively.
61
Although the Company is not currently subject to any litigation, and no litigation is currently threatened against it, the Company may be subject to legal proceedings, claims and litigation, including intellectual property litigation, arising in the ordinary course of business. Such matters are subject to many uncertainties and outcomes and are not predictable with assurance. The Company accrues amounts that it believes are adequate to address any liabilities related to legal proceedings and other loss contingencies that the Company believes will result in a probable loss that is reasonably estimable.
Indemnification
During the normal course of business, the Company may make certain indemnities, commitments and guarantees which may include intellectual property indemnities to certain of the Company’s customers in connection with the sales of the Company’s products and indemnities for liabilities associated with the infringement of other parties’ technology based upon the Company’s products. The Company’s exposure under these indemnification provisions is generally limited to the total amount paid by a customer under the agreement. However, certain agreements include indemnification provisions that could potentially expose us to losses in excess of the amount received under the agreement. In addition, the Company indemnifies its officers, directors and certain key employees while they are serving in good faith in such capacities.
The Company has not recorded any liability for these indemnities, commitments and guarantees in the accompanying consolidated balance sheets. Where necessary, the Company accrues for losses for any known contingent liabilities, including those that may arise from indemnification provisions, when future payment is probable.
6. Stockholders’ Equity
Preferred Stock
The Company was authorized to issue 5,000,000 shares of preferred stock with a $0.0001 par value per share as of December 31, 2019 and 2018. The shares of preferred stock issued and outstanding was nil as of December 31, 2019 and 2018.
Common Stock
The Company was authorized to issue 75,000,000 shares of common stock with $0.0001 par value per share as of December 31, 2019 and 2018. As of December 31, 2019, the shares of common stock issued and outstanding were 17,449,572 excluding 51,006 legally issued shares subject to repurchase related to the early exercise of options to purchase common stock. As of December 31, 2018, the shares of common stock issued and outstanding were 17,130,507 excluding 155,257 legally issued shares subject to repurchase related to the early exercise of options to purchase common stock.
The Company has reserved the following number of shares of common stock for future issuances:
|
|
December 31, |
|
||
|
|
2019 |
|
||
|
Outstanding stock awards |
|
|
1,354,234 |
|
|
Shares available for future issuance under the 2017 Stock Incentive Plan |
|
|
4,847,877 |
|
|
Total common stock reserved for future issuances |
|
|
6,202,111 |
|
62
Stock Incentive Plan
In April 2012, the Company adopted the 2012 Stock Option Plan (“2012 Plan”). The 2012 Plan provides for the granting of stock-based awards to employees, directors, and consultants under terms and provisions established by the Company’s board of directors. Under the terms of the 2012 Plan, options may be granted at an exercise price not less than fair market value. For employees holding more than 10% of the voting rights of all classes of stock, the exercise prices for incentive and nonstatutory stock options must be at least 110% of the fair market value of the common stock on the grant date, as determined by the Company’s board of directors. The terms of options granted under the 2012 Plan may not exceed ten years.
The 2012 Plan was superseded by the 2017 Stock Option Plan (“2017 Plan”). Any outstanding awards under the 2012 Plan will continue to be governed by the terms of the 2012 Plan.
In August 2017, the Company adopted the 2017 Plan. The Company’s stockholders approved the 2017 Plan in September 2017 and it became effective immediately prior to the closing of the Company’s IPO. In connection with the adoption of the 2017 Plan, no additional awards and no shares of common stock remain available for future issuance under the 2012 Plan and shares reserved but not issued under the 2012 Plan as of the effective date of the 2017 Plan were included in the number of shares reserved for issuance under the 2017 Plan. In addition, shares subject to awards under the 2012 Plan that are forfeited or terminated will be added to the 2017 Plan. The number of shares available for issuance under the 2017 Plan will be automatically increased on the first day of each fiscal year beginning on January 1, 2018 and ending on (and including) January 1, 2027, in an amount equal to the lesser of (1) 4% of the outstanding shares of our common stock on the last day of the immediately preceding fiscal year, or (2) another amount determined by the Company’s board of directors. The automatic increase in the number of shares available for issuance under the 2017 plan for the fiscal year 2019 was 691,431 shares. The 2017 Plan provides for the granting of incentive stock options, or ISOs, within the meaning of Section 422 of the Internal Revenue Code to employees and the granting of nonstatutory stock options, or NSOs, to employees, non-employee directors, advisors and consultants. The 2017 Plan also provides for the grants of restricted stock, stock appreciation rights, or SARs, stock unit and cash-based awards to employees, non-employee directors, advisors and consultants.
The Company’s stock award activity under the stock incentive plan is summarized as follows:
|
|
Awards Available for Grant |
|
||
|
|
|
4,434,310 |
|
|
|
Authorized |
|
|
691,431 |
|
|
Granted |
|
|
(358,750 |
) |
|
Canceled (1) |
|
|
80,886 |
|
|
As of December 31, 2019 |
|
|
4,847,877 |
|
|
|
(1) |
Includes repurchases of unvested early-exercised options |
Early Exercise of Stock Options
Certain employees and directors have exercised option grants prior to vesting. The unvested shares are subject to a repurchase right held by the Company at the original purchase price. The proceeds initially are recorded as Liability related to early exercised stock options and reclassified to Additional paid in capital as the repurchase right lapses.
For the year ended December 31, 2019, the Company did not issue unvested shares of common stock upon early exercise, and for the years ended December 31, 2018 and 2017, the Company issued 27,333 and 46,667 unvested shares of common stock, respectively, upon early exercise for total proceeds of $0.1 million and $46,000, respectively.
For the years ended December 31, 2019, 2018, and 2017, the Company repurchased 5,584, 6,834, and 45,666 shares of unvested common stock, respectively, related to early exercised options at the original purchase price,
63
respectively. As of December 31, 2019 and 2018, 51,006 and 155,257 shares, respectively, held by employees and nonemployees were subject to repurchase at an aggregate price of $0.1 million and $0.1 million, respectively.
Stock Options
The Company’s stock option activity is summarized as follows:
|
|
Options Issued and Outstanding |
|
|
Weighted- Average Exercise Price |
|
|
Weighted- Average Remaining Contractual Term (Years) |
|
|
Aggregate Intrinsic Value (in thousands) |
|
|||||
|
As of December 31, 2018 |
|
|
1,139,935 |
|
|
$ |
2.01 |
|
|
|
7.6 |
|
|
$ |
3,428 |
|
|
Granted |
|
|
— |
|
|
$ |
— |
|
|
|
|
|
|
|
|
|
|
Exercised (1) |
|
|
(249,848 |
) |
|
$ |
0.97 |
|
|
|
|
|
|
|
|
|
|
Canceled (2) |
|
|
(39,753 |
) |
|
$ |
2.30 |
|
|
|
|
|
|
|
|
|
|
As of December 31, 2019 |
|
|
850,334 |
|
|
$ |
2.30 |
|
|
|
6.8 |
|
|
$ |
3,587 |
|
|
Options vested and expected to vest as of December 31, 2019 |
|
|
850,334 |
|
|
$ |
2.30 |
|
|
|
6.8 |
|
|
$ |
3,587 |
|
|
Options vested and exercisable as of December 31, 2019 |
|
|
472,134 |
|
|
$ |
2.16 |
|
|
|
6.7 |
|
|
$ |
2,057 |
|
|
|
(1) |
Includes vesting of early-exercised options |
|
|
(2) |
Includes repurchases of unvested early-exercised options |
The stock options outstanding and exercisable by exercise price at December 31, 2019 are as follows:
|
|
|
|
Options Outstanding |
|
|
Options Vested and Exercisable |
|
|||||||||||||||
|
Exercise Price |
|
|
Number Outstanding |
|
|
Weighted- Average Remaining Contractual Life (Years) |
|
|
Weighted- Average Exercise Price |
|
|
Number Vested and Exercisable |
|
|
Weighted- Average Exercise Price |
|
||||||
|
$ |
0.16 |
|
|
|
32,850 |
|
|
|
4.1 |
|
|
$ |
0.16 |
|
|
|
32,850 |
|
|
$ |
0.16 |
|
|
$ |
0.37 |
|
|
|
77,254 |
|
|
|
5.5 |
|
|
$ |
0.37 |
|
|
|
49,998 |
|
|
$ |
0.37 |
|
|
$ |
0.97 |
|
|
|
107,501 |
|
|
|
6.2 |
|
|
$ |
0.97 |
|
|
|
61,149 |
|
|
$ |
0.97 |
|
|
$ |
2.51 |
|
|
|
151,111 |
|
|
|
6.7 |
|
|
$ |
2.51 |
|
|
|
85,743 |
|
|
$ |
2.51 |
|
|
$ |
2.89 |
|
|
|
46,000 |
|
|
|
7.2 |
|
|
$ |
2.89 |
|
|
|
22,000 |
|
|
$ |
2.89 |
|
|
$ |
2.93 |
|
|
|
324,918 |
|
|
|
7.4 |
|
|
$ |
2.93 |
|
|
|
169,279 |
|
|
$ |
2.93 |
|
|
$ |
3.18 |
|
|
|
110,700 |
|
|
|
7.6 |
|
|
$ |
3.18 |
|
|
|
51,115 |
|
|
$ |
3.18 |
|
|
|
|
|
|
|
850,334 |
|
|
|
6.8 |
|
|
$ |
2.30 |
|
|
|
472,134 |
|
|
$ |
2.16 |
|
The aggregate intrinsic value of options exercised for the years ended December 31, 2019, 2018, and 2017 was $0.9 million, $2.9 million, and $1.8 million, respectively. The Company has various vesting agreements with employees. Options granted generally vest over a five-year period and generally are exercisable up to 10 years.
64
The Company’s restricted stock unit activity is summarized as follows:
|
|
Units Issued and Outstanding |
|
|
Weighted-Average Grant Date Fair Value |
|
|||
|
As of December 31, 2018 |
|
|
255,500 |
|
|
$ |
11.53 |
|
|
Granted |
|
|
358,750 |
|
|
$ |
7.27 |
|
|
Released |
|
|
(69,217 |
) |
|
$ |
12.69 |
|
|
Canceled |
|
|
(41,133 |
) |
|
$ |
9.80 |
|
|
As of December 31, 2019 |
|
|
503,900 |
|
|
$ |
8.48 |
|
Restricted stock units are converted into shares of the Company’s common stock upon vesting on a one-for-one basis. Restricted stock unit awards generally vest over a five-year period and are subject to the grantee’s continued service with the Company.
8. Stock-Based Compensation
The following table summarizes the distribution of stock-based compensation expense (in thousands):
|
|
Year Ended |
|
||||||||||
|
|
December 31, |
|
||||||||||
|
|
|
2019 |
|
|
2018 |
|
|
2017 |
|
|||
|
Cost of revenue |
|
$ |
117 |
|
|
$ |
68 |
|
|
$ |
31 |
|
|
Research and development |
|
|
502 |
|
|
|
355 |
|
|
|
273 |
|
|
Selling, general and administrative |
|
|
796 |
|
|
|
941 |
|
|
|
1,144 |
|
|
Total |
|
$ |
1,415 |
|
|
$ |
1,364 |
|
|
$ |
1,448 |
|
The remaining unrecognized stock-based compensation related to non-vested awards was $4.7 million as of December 31, 2019 and will be recognized over a weighted average remaining period of approximately 3.7 years.
The Company records stock-based compensation based on the estimated fair value of the award at grant date. The estimated grant date fair value of stock option awards, and the resulting stock-based compensation expense is recorded based on the Black-Scholes option-pricing model. The fair value of a restricted stock unit is determined based on the fair value of our common stock on the date of grant. The Company recognizes such costs as compensation expense on a straight-line basis over the requisite service period. The Company’s valuation assumptions are as follows:
Fair value of common stock — Given the absence of a public trading market prior to our IPO, the Company’s Board of Directors considered numerous objective and subjective factors to determine the fair value of the Company’s common stock which included, but were not limited to (i) contemporaneous independent third-party valuations of the Company’s common stock; (ii) the rights and preferences of the Company’s preferred stock relative to common stock; (iii) the lack of marketability of common stock; (iv) developments in the business; and (v) the likelihood of achieving a liquidity event, such as an initial public offering or sale of the Company, given prevailing market conditions.
Subsequent to our IPO, the fair value of the Company’s common stock was the per share closing price for our JDS as reported on the Mothers market of the Tokyo Stock Exchange on the date of grant.
Risk-free interest rate — The Company bases the risk-free interest rate used in the Black-Scholes option-pricing model on the implied yield available on U.S. Treasury zero-coupon issues with an equivalent expected term of the awards for each award group.
65
Expected term — The expected term represents the period that the Company’s stock-based awards are expected to be outstanding. To determine the expected term, we generally apply the simplified approach in which the expected term of an award is presumed to be the mid-point between the vesting date and the expiration date of the award as we do not have sufficient historical exercise data to provide a reasonable basis for an estimate of expected term.
Volatility — As the Company does not have a long trading history to determine the volatility of its common stock, the Company determines volatility based on the historical stock volatilities of a group of publicly listed guideline companies over a period equal to the expected terms of the awards.
Dividend yield — The Company has never declared or paid any cash dividends and does not currently plan to pay a cash dividend in the foreseeable future. Consequently, the Company used an expected dividend yield of zero.
Employee Stock Awards
The following table summarizes the weighted-average assumptions used in the Black-Scholes option-pricing model to determine fair value of stock awards:
|
Year Ended |
|
|||
|
|
December 31, |
|
||
|
|
|
2017 |
|
|
|
Expected term (in years) |
|
|
6.28 |
|
|
Risk-free interest rate |
|
|
2.01 |
% |
|
Expected volatility |
|
|
53 |
% |
|
Dividend rate |
|
|
— |
|
|
Fair value of common stock |
|
$ |
5.14 |
|
The Company did not grant any stock options to employees during the years ended December 31, 2019 and 2018. The weighted-average grant date fair value for employee restricted stock units for the years ended December 31, 2019 and 2018 were $7.27 and $11.09. The weighted-average grant date fair value for employee stock awards for the year ended December 31, 2017 was $3.71.
Non-Employee Stock Awards
The following table summarizes the weighted-average assumptions used in the Black-Scholes option-pricing model to determine fair value of stock awards:
|
Year Ended |
|
|||
|
|
December 31, |
|
||
|
|
|
2017 |
|
|
|
Expected term (in years) |
|
|
10.00 |
|
|
Risk-free interest rate |
|
|
2.30 |
% |
|
Expected volatility |
|
|
53 |
% |
|
Dividend rate |
|
|
— |
|
|
Fair value of common stock |
|
$ |
14.40 |
|
The Company did not grant any stock awards to non-employees during the years ended December 31, 2019 and 2018. The weighted-average grant date fair value for non-employee stock awards for the year ended December 31, 2017 was $7.34. Non-employee stock awards are revalued at each reporting date and the relating stock-based compensation expense is recognized as awards vest. Non-employee stock-based compensation expense for unvested awards fluctuate as the fair value of our JDS, represented by common stock, fluctuates. Upon the early adoption of ASU 2018-07 on July 1, 2018 in the third quarter of fiscal 2018, non-employee stock awards were remeasured at fair value on the date of adoption; the remaining unamortized expense on the date of adoption will be recognized over the remaining vesting term.
66
For the periods presented prior to the Company’s IPO, basic and diluted net income per common share are presented in conformity with the two-class method required for participating securities. Prior to the closing of the Company’s IPO, all outstanding shares of its Series Seed, Series A, and Series B convertible preferred shares, which were participating securities, were converted to common stock on a one-to-one basis. The common stock issued for the conversion of 10,742,500 preferred shares were included in the calculation of the weighted-average shares outstanding for the year ended December 31, 2017.
The following table presents the calculation of basic and diluted net income per share (amounts in thousands, except per share data):
|
|
Year Ended |
|
||||||||||
|
|
December 31, |
|
||||||||||
|
|
|
2019 |
|
|
2018 |
|
|
2017 |
|
|||
|
Numerator: |
|
|
|
|
|
|
|
|
|
|
|
|
|
Basic: |
|
|
|
|
|
|
|
|
|
|
|
|
|
Net income |
|
$ |
2,194 |
|
|
$ |
1,885 |
|
|
$ |
3,757 |
|
|
Net income allocable to preferred stockholders |
|
|
— |
|
|
|
— |
|
|
|
1,936 |
|
|
Net income allocable to common stockholders |
|
|
2,194 |
|
|
|
1,885 |
|
|
|
1,821 |
|
|
Diluted: |
|
|
|
|
|
|
|
|
|
|
|
|
|
Net income |
|
|
2,194 |
|
|
|
1,885 |
|
|
|
3,757 |
|
|
Net income allocable to preferred stockholders |
|
|
— |
|
|
|
— |
|
|
|
1,823 |
|
|
Net income allocable to common stockholders |
|
|
2,194 |
|
|
|
1,885 |
|
|
|
1,934 |
|
|
Denominator: |
|
|
|
|
|
|
|
|
|
|
|
|
|
Basic shares: |
|
|
|
|
|
|
|
|
|
|
|
|
|
Weighted-average shares outstanding used in computing basic net income per share allocable to common stockholders |
|
|
17,283,133 |
|
|
|
16,982,648 |
|
|
|
7,145,641 |
|
|
Diluted shares: |
|
|
|
|
|
|
|
|
|
|
|
|
|
Effect of potentially dilutive securities: |
|
|
|
|
|
|
|
|
|
|
|
|
|
Stock options (1) |
|
|
592,838 |
|
|
|
1,008,483 |
|
|
|
910,688 |
|
|
Weighted-average shares outstanding used in computing diluted net income per common share allocable to common stockholders |
|
|
17,875,971 |
|
|
|
17,991,131 |
|
|
|
8,056,329 |
|
|
Net income per common share: |
|
|
|
|
|
|
|
|
|
|
|
|
|
Basic |
|
$ |
0.13 |
|
|
$ |
0.11 |
|
|
$ |
0.25 |
|
|
Diluted |
|
$ |
0.12 |
|
|
$ |
0.10 |
|
|
$ |
0.24 |
|
|
(1) |
Including early-exercised options |
The potentially dilutive securities outstanding related to stock options as of December 31, 2019, 2018, and 2017 that were excluded from the computation of diluted net income per common share for the periods presented as their effect would have been antidilutive was 382,000, 155,000, and 7,000 shares, respectively.
10. Income Taxes
The components of income before income taxes are as follows (in thousands):
|
|
Year Ended |
|
||||||||||
|
|
December 31, |
|
||||||||||
|
|
|
2019 |
|
|
2018 |
|
|
2017 |
|
|||
|
Domestic |
|
$ |
2,226 |
|
|
$ |
1,866 |
|
|
$ |
6,141 |
|
|
Foreign |
|
|
223 |
|
|
|
178 |
|
|
|
131 |
|
|
Income before income taxes |
|
$ |
2,449 |
|
|
$ |
2,044 |
|
|
$ |
6,272 |
|
67
The components of the provision for income taxes are as follows (in thousands):
|
|
Year Ended |
|
||||||||||
|
|
|
December 31, |
|
|||||||||
|
|
|
2019 |
|
|
2018 |
|
|
2017 |
|
|||
|
Current: |
|
|
|
|
|
|
|
|
|
|
|
|
|
Federal |
|
$ |
315 |
|
|
$ |
36 |
|
|
$ |
2,089 |
|
|
Foreign |
|
|
56 |
|
|
|
30 |
|
|
|
55 |
|
|
State |
|
|
1 |
|
|
|
1 |
|
|
|
1 |
|
|
Total Current |
|
|
372 |
|
|
|
67 |
|
|
|
2,145 |
|
|
Deferred - net |
|
|
(117 |
) |
|
|
92 |
|
|
|
370 |
|
|
Provision for income taxes |
|
$ |
255 |
|
|
$ |
159 |
|
|
$ |
2,515 |
|
The effective tax rate differs from the applicable U.S. statutory federal income tax rate as follows:
|
|
|
Year Ended |
|
|||||||||
|
|
December 31, |
|
||||||||||
|
|
|
2019 |
|
|
2018 |
|
|
2017 |
|
|||
|
U.S. statutory federal taxes at statutory rate |
|
|
21.00 |
% |
|
|
21.00 |
% |
|
|
34.00 |
% |
|
State taxes - net of federal benefit |
|
|
0.03 |
|
|
|
0.03 |
|
|
|
0.01 |
|
|
Research and development benefit |
|
|
(9.81 |
) |
|
|
(7.73 |
) |
|
|
(2.27 |
) |
|
Stock-based compensation |
|
|
6.14 |
|
|
|
(5.26 |
) |
|
|
0.54 |
|
|
Foreign derived intangible income (FDII) |
|
|
(11.18 |
) |
|
|
(3.26 |
) |
|
|
— |
|
|
Permanent items and other |
|
|
1.23 |
|
|
|
(0.44 |
) |
|
|
0.89 |
|
|
Change in valuation allowance |
|
|
3.03 |
|
|
|
3.40 |
|
|
|
1.78 |
|
|
Tax rate change |
|
|
— |
|
|
|
— |
|
|
|
5.12 |
|
|
Effective tax rate |
|
|
10.44 |
% |
|
|
7.74 |
% |
|
|
40.07 |
% |
The components of net deferred tax assets and liabilities are as follows:
|
|
Year Ended |
|
||||||
|
|
December 31, |
|
||||||
|
|
|
2019 |
|
|
2018 |
|
||
|
Deferred tax assets: |
|
|
|
|
|
|
|
|
|
Net operating loss carryforwards |
|
$ |
85 |
|
|
$ |
85 |
|
|
Research and other credits |
|
|
452 |
|
|
|
381 |
|
|
Accruals |
|
|
387 |
|
|
|
244 |
|
|
Intangibles |
|
|
264 |
|
|
|
293 |
|
|
Other |
|
|
122 |
|
|
|
118 |
|
|
Total deferred tax assets |
|
|
1,310 |
|
|
|
1,121 |
|
|
Deferred tax liabilities: |
|
|
|
|
|
|
|
|
|
Property and equipment - net |
|
|
(95 |
) |
|
|
(98 |
) |
|
Total deferred tax liabilities |
|
|
(95 |
) |
|
|
(98 |
) |
|
Valuation allowance |
|
|
(538 |
) |
|
|
(463 |
) |
|
Deferred tax assets - net |
|
$ |
677 |
|
|
$ |
560 |
|
In assessing the realizability of deferred tax assets, management considers whether it is more likely than not that some portion or all of its deferred tax assets will be realized. The ultimate realization of deferred tax assets is dependent upon the generation of future taxable income during periods in which temporary differences become deductible or includable in taxable income. Management considers projected future taxable income and tax planning strategies in making this assessment. Based on the level of current period taxable income and its expected recurring profitability, management believes it is more likely than not the Company will realize benefits of deductible differences for U.S. federal tax and thus has not recorded a valuation allowance. However, the Company has
68
recorded a full valuation allowance against it California deferred tax asset as management has concluded it is more likely than not that these future benefits will not be realized due to its 0% California apportionment.
Tax reform H.R.1, originally known as the Tax Cuts and Jobs Act (“Act”), was enacted on December 22, 2017. The Act contains several key provisions that may have significant financial statement effects including the remeasurement of deferred taxes and the recognition of liabilities for taxes on mandatory repatriation and certain other foreign income. The Act reduces the corporate tax rate to 21%, effective January 1, 2018. ASC 740 requires companies to recognize the effect of tax law changes in the period of enactment, the effects must be recognized by companies’ December 2017 financial statements, even though the effective date for most provisions is January 1, 2018.
Subsequent to the enactment of the Act, the Securities and Exchange Commission issued Staff Accounting Bulletin No. 118 ("SAB 118"). SAB 118 addresses the application of ASC 740 in situations when a registrant does not have the necessary information available, prepared, or analyzed in reasonable detail to complete the accounting for certain income tax effects of the Act and permits the recording of provisional amounts relating to the impact of the Act during a measurement period which is not to extend beyond one year from the Act enactment date. As such, the Company has completed the analysis relating to the Act currently available which resulted in no additional SAB 118 tax effect in the fourth quarter of fiscal 2018 for the year ended December 31, 2018.
The Company has reflected the impact of the Act in its financial statements as the law was enacted before the end of the 2017 year. The Company estimated that the reduction in the Corporate tax rate to 21% reduced net deferred tax assets by $0.3 million from $1.0 million to $0.7 million. The Company has estimated the liabilities for taxes on mandatory repatriation and certain other foreign income. As of December 31, 2018, the Company completed the accounting for transition tax and concluded that the liability for taxes on mandatory repatriation of foreign income is approximately $42,000 of which $41,000 can be offset with a foreign tax credit.
As of December 31, 2019, the Company had $1.2 million of California state net operating loss carryforwards (“NOL”). These NOL carryforwards will begin to expire in 2032 if unused. As of December 31, 2019, the Company had U.S. federal and California state tax credit carryforwards of nil and $0.7 million, respectively. The California tax credit carryforward will not expire.
Current tax laws impose substantial restrictions on the utilization of net operating losses and credit carryforwards in the event of an "ownership change", as defined by the Internal Revenue Code. If there should be an ownership change, the Company's ability to utilize its carryforwards could be limited.
The Company applies the provisions of the applicable accounting guidance regarding accounting for uncertainty in income taxes, which require application of a more-likely-than-not threshold to the recognition and derecognition of uncertain tax positions. If the recognition threshold is met, the applicable accounting guidance permits the recognition of a tax benefit measured at the largest amount of such tax benefit that, in our judgment, is more than fifty percent likely to be realized upon settlement. It further requires that a change in judgment related to the expected ultimate resolution of uncertain tax positions to be recognized in earnings in the period in which such determination is made. The Company will continue to review its tax positions and provide for, or reverse, unrecognized tax benefits as issues arise. As of December 31, 2019, the Company had approximately $0.3 million of unrecognized tax benefits of which $0.2 million was netted against deferred tax assets with a full valuation allowance. If these amounts are recognized, there will be a tax benefits of $0.1 million against the Company’s effective tax rate. The following table summarizes the activities related to the Company’s gross unrecognized tax benefits (in thousands):
|
|
Year Ended |
|
||||||
|
|
|
December 31, |
|
|||||
|
|
|
2019 |
|
|
2018 |
|
||
|
Balance at the beginning of the year |
|
$ |
293 |
|
|
$ |
233 |
|
|
Increases related to current year tax positions |
|
|
64 |
|
|
|
60 |
|
|
Decreases related to current year tax positions |
|
|
(62 |
) |
|
|
- |
|
|
Balance at the end of the year |
|
$ |
295 |
|
|
$ |
293 |
|
The Company recognizes interest and penalties related to unrecognized tax positions in income tax expenses on the Consolidated Statements of Operations and Comprehensive Income. The Company had approximately $2,900
69
and $7,800 of accrued interest and penalties related to uncertain tax positions as of December 31, 2019 and 2018, respectively.
The 2016 through 2019 tax years generally remain subject to examination by U.S. federal and most state tax authorities.
11. Selected Quarterly Financial Data (Unaudited)
The following table summarizes the Company’s unaudited consolidated statements of operations by quarter for the years ended December 31, 2019 and 2018. In the opinion of management, the accompanying unaudited consolidated statements of operations reflect all adjustments, which only include normal recurring adjustments, necessary to present fairly the Company’s results of operations in accordance with GAAP and are not necessarily indicative of the results to be expected for the full fiscal year or for any other future annual or interim periods.
|
|
|
Three Months Ended |
|
|||||||||||||
|
|
|
Dec 31, 2019 |
|
|
Sept 30, 2019 |
|
|
June 30, 2019 |
|
|
March 31, 2019 |
|
||||
|
Revenue |
|
$ |
10,218 |
|
|
$ |
9,613 |
|
|
$ |
7,175 |
|
|
$ |
5,021 |
|
|
Cost of revenue |
|
|
5,525 |
|
|
|
4,874 |
|
|
|
3,402 |
|
|
|
2,586 |
|
|
Gross profit |
|
|
4,693 |
|
|
|
4,739 |
|
|
|
3,773 |
|
|
|
2,435 |
|
|
Operating expenses |
|
|
|
|
|
|
|
|
|
|
|
|
|
|
|
|
|
Research and development |
|
|
1,706 |
|
|
|
1,686 |
|
|
|
1,600 |
|
|
|
1,476 |
|
|
Selling, general and administrative |
|
|
1,838 |
|
|
|
1,442 |
|
|
|
1,828 |
|
|
|
1,669 |
|
|
Total operating expenses |
|
|
3,544 |
|
|
|
3,128 |
|
|
|
3,428 |
|
|
|
3,145 |
|
|
Income (loss) from operations |
|
|
1,149 |
|
|
|
1,611 |
|
|
|
345 |
|
|
|
(710 |
) |
|
Other income (expense) |
|
|
13 |
|
|
|
2 |
|
|
|
52 |
|
|
|
(13 |
) |
|
Income (loss) before income taxes |
|
|
1,162 |
|
|
|
1,613 |
|
|
|
397 |
|
|
|
(723 |
) |
|
Provision for (benefit from) income taxes |
|
|
142 |
|
|
|
156 |
|
|
|
62 |
|
|
|
(105 |
) |
|
Net income (loss) |
|
$ |
1,020 |
|
|
$ |
1,457 |
|
|
$ |
335 |
|
|
$ |
(618 |
) |
|
Net income (loss) per share allocable to common stockholders: |
|
|
|
|
|
|
|
|
|
|
|
|
|
|
|
|
|
Basic |
|
$ |
0.07 |
|
|
$ |
0.08 |
|
|
$ |
0.02 |
|
|
$ |
(0.04 |
) |
|
Diluted |
|
$ |
0.06 |
|
|
$ |
0.08 |
|
|
$ |
0.02 |
|
|
$ |
(0.04 |
) |
|
|
|
Three Months Ended |
|
|||||||||||||
|
|
|
Dec 31, 2018 |
|
|
Sept 30, 2018 |
|
|
June 30, 2018 |
|
|
March 31, 2018 |
|
||||
|
Revenue |
|
$ |
8,908 |
|
|
$ |
8,667 |
|
|
$ |
6,470 |
|
|
$ |
7,053 |
|
|
Cost of revenue |
|
|
4,803 |
|
|
|
4,220 |
|
|
|
3,008 |
|
|
|
3,285 |
|
|
Gross profit |
|
|
4,105 |
|
|
|
4,447 |
|
|
|
3,462 |
|
|
|
3,768 |
|
|
Operating expenses |
|
|
|
|
|
|
|
|
|
|
|
|
|
|
|
|
|
Research and development |
|
|
1,838 |
|
|
|
1,704 |
|
|
|
1,578 |
|
|
|
2,211 |
|
|
Selling, general and administrative |
|
|
1,544 |
|
|
|
1,899 |
|
|
|
1,572 |
|
|
|
1,621 |
|
|
Total operating expenses |
|
|
3,382 |
|
|
|
3,603 |
|
|
|
3,150 |
|
|
|
3,832 |
|
|
Income from operations |
|
|
723 |
|
|
|
844 |
|
|
|
312 |
|
|
|
(64 |
) |
|
Other income (expense) |
|
|
99 |
|
|
|
(94 |
) |
|
|
(165 |
) |
|
|
389 |
|
|
Income before income taxes |
|
|
822 |
|
|
|
750 |
|
|
|
147 |
|
|
|
325 |
|
|
Provision for (benefit from) income taxes |
|
|
175 |
|
|
|
186 |
|
|
|
(54 |
) |
|
|
(148 |
) |
|
Net income |
|
$ |
647 |
|
|
$ |
564 |
|
|
$ |
201 |
|
|
$ |
473 |
|
|
Net income per share allocable to common stockholders: |
|
|
|
|
|
|
|
|
|
|
|
|
|
|
|
|
|
Basic |
|
$ |
0.04 |
|
|
$ |
0.03 |
|
|
$ |
0.01 |
|
|
$ |
0.03 |
|
|
Diluted |
|
$ |
0.03 |
|
|
$ |
0.03 |
|
|
$ |
0.01 |
|
|
$ |
0.03 |
|
70
71
Item 9. Changes in and Disagreements with Accountants on Accounting and Financial Disclosure
None.
Item 9A. Controls and Procedures
Evaluation of Disclosure Controls and Procedures
Under the supervision and with the participation of our management, including our principal executive officer and principal financial officer, we conducted an evaluation of the effectiveness of the design and operation of our disclosure controls and procedures, as defined in Rules 13a-15(e) and 15d-15(e) under the Exchange Act, as of the end of the period covered by this Annual Report on Form 10-K. Based on management’s evaluation, our principal executive officer and principal financial officer concluded that our disclosure controls and procedures are effective as of December 31, 2019.
Management’s Report on Internal Control over Financial Reporting
Management is responsible establishing and maintaining adequate internal control over financial reporting as defined by Rules 13a-15(f) and 15d-15(f) of the Exchange Act. Management evaluated the effectiveness of our internal control over financial reporting based on the criteria set forth in the Internal Control – Integrated Framework (2013) as issued by the Committee of Sponsoring Organizations of the Treadway Commission and concluded that its internal control over financial reporting was effective as of December 31, 2019.
Our independent registered public accounting firm will not be required to formally attest to the effectiveness of our internal control over financial reporting as long as we are an “emerging growth company” pursuant to the provisions of the JOBS Act.
Changes in Internal Control over Financial Reporting
There were no changes in our internal control over financial reporting identified in connection with the evaluation required by Rules 13a-15(d) and 15d-15(d) of the Exchange Act that occurred during the three months ended December 31, 2019 that have materially affected, or are reasonably likely to materially affect, our internal control over financial reporting.
None.
72
Item 10. Directors, Executive Officers and Corporate Governance
The information required by this item is incorporated by reference from the information under the captions “Election of Directors”, “Executive Officers of the Registrant” and “– Board Committees – Audit Committee and Financial Expert” contained in our Proxy Statement for our 2020 annual meeting of stockholders which will be filed with the SEC not later than 120 days after the end of our fiscal year ended December 31, 2019 (the “Proxy Statement”).
There have been no material changes to the procedures by which stockholders may recommend nominees to our board of directors.
Item 405 of Regulation S-K calls for disclosure of any known late filing or failure by an insider to file a report required by Section 16(a) of the Exchange Act. To the extent disclosure for delinquent reports is being made, it can be found under the caption “Delinquent Section 16(a) Reports” in the Proxy Statement and is incorporated herein by reference.
We have adopted a Code of Business Conduct and Ethics that applies to all of our officers, directors and employees. The Code of Business Conduct and Ethics sets forth the basic principles that guide the business conduct of our employees. We have also adopted a Code of Ethics for Senior Financial Officers that specifically applies to our chief executive officer (our principal executive officer) and chief financial officer (our principal financial and accounting officer). Stockholders may request a free copy of our Code of Business Conduct and Ethics and Code of Ethics for Senior Financial Officers by contacting us at Techpoint, Inc., Attention: Secretary, 2550 N. First Street, #550, San Jose, California 95131.
Item 11. Executive Compensation.
The information required by this item is incorporated by reference from the information under the captions “Director Compensation” and “Executive Compensation” in the Proxy Statement.
Item 12. Security Ownership of Certain Beneficial Owners and Management and Related Stockholder Matters
The information required by this item is incorporated by reference from the information under the captions “Executive Compensation” our Proxy Statement for our 2020 annual meeting of stockholders which will be filed with the SEC not later than 120 days after the end of our fiscal year ended December 31, 2019.
Item 13. Certain Relationships and Related Transactions, and Director Independence
The information required by this item is incorporated by reference from the information under the captions “Certain Relationships and Related Transactions”, “Related Party Transaction Approval” and “Director Independence” in the Proxy Statement.
Item 14. Principal Accounting Fees and Services
The information required by this item is incorporated by reference from the information under the captions “Principal Accountant Fees and Services” and “Pre-approval Policies and Procedures” in the Proxy Statement.
73
Item 15. Exhibits, Financial Statement Schedules
|
|
(a) |
Documents filed as a part of this Annual Report on Form 10-K are as follows: |
|
|
(1) |
Consolidated Financial Statements |
Our Consolidated Financial Statements are listed in the “Index to Consolidated Financial Statements” Under Part II, Item 8 Annual Report on Form 10-K.
|
|
(2) |
Financial Statement Schedules |
All financial statement schedules have been omitted because they are not applicable, not material, or the required information is shown in the consolidated financial statements or the notes thereto in this Annual Report on Form 10-K.
|
|
(3) |
Exhibits |
See Item 15(b) below.
(b) Exhibits
|
Exhibit Number |
|
Description |
|
|
|
|
|
3.1 |
|
|
|
|
|
|
|
3.2 |
|
|
|
4.1 |
|
|
|
4.2 |
|
|
|
4.3 |
|
|
|
4.4† |
|
Description of Securities Registered Pursuant to Section 12 of the Securities Exchange Act of 1934.
|
|
10.1# |
|
|
|
10.2# |
|
|
|
10.3# |
|
|
|
|
|
|
74
|
|
|
|
|
10.5# |
|
|
|
10.6 |
|
|
|
10.7† |
|
|
|
21.1 |
|
|
|
23.1† |
|
Consent of Independent Registered Public Accounting Firm
|
|
31.1† |
|
|
|
|
|
|
|
31.2† |
|
|
|
32.1* |
|
|
|
|
|
|
|
32.2* |
|
|
|
|
|
|
|
101.INS |
|
XBRL Instance Document |
|
|
|
|
|
101.SCH |
|
XBRL Taxonomy Extension Schema Document |
|
|
|
|
|
101.CAL |
|
XBRL Taxonomy Extension Calculation Linkbase Document |
|
|
|
|
|
101.DEF |
|
XBRL Taxonomy Extension Definition Linkbase Document |
|
|
|
|
|
101.LAB |
|
XBRL Taxonomy Extension Label Linkbase Document |
|
|
|
|
|
101.PRE |
|
XBRL Taxonomy Extension Presentation Linkbase Document |
_____________________________________________________________________________________________
† Filed herewith.
# Indicates management contract or compensatory plan or arrangement.
* In accordance with Item 601(b)(32)(ii) of Regulation S‑K and SEC Release No. 34‑47986, the certifications furnished in Exhibits 32.1 and 32.2 hereto are deemed to accompany this Form 10‑K and will not be deemed “filed” for purposes of Section 18 of the Securities Exchange Act of 1934 or deemed to be incorporated by reference into any filing under the Exchange Act or the Securities Act of 1933 except to the extent that the Company specifically incorporates it by reference.
75
None.
76
Pursuant to the requirements of Section 13 or 15(d) of the Securities Exchange Act of 1934, as amended, the Registrant has duly caused this Report to be signed on its behalf by the undersigned, thereunto duly authorized.
|
|
|
Company Name |
|
|
|
|
|
|
|
Date: March 13, 2020 |
|
By: |
/s/ Fumihiro Kozato |
|
|
|
|
Fumihiro Kozato |
|
|
|
|
President and Chief Executive Officer (Principal Executive Officer) |
Pursuant to the requirements of the Securities Exchange Act of 1934, as amended, this Report has been signed below by the following persons on behalf of the Registrant in the capacities and on the dates indicated.
|
Name |
|
Title |
|
Date |
|
|
|
|
|
|
|
|
|
/s/ Fumihiro Kozato |
|
President and Chief Executive Officer |
|
March 13, 2020 |
|
|
Fumihiro Kozato |
|
(Principal Executive Officer) |
|
|
|
|
|
|
|
|
|
|
|
/s/ Mark Voll |
|
Chief Financial Officer, Vice President of |
|
March 13, 2020 |
|
|
Mark Voll |
|
Administrations and Secretary (Principal Financial and Accounting Officer) |
|
|
|
|
|
|
|
|
|
|
|
/s/ Dr. Feng Kuo |
|
Director |
|
March 13, 2020 |
|
|
Dr. Feng Kuo, Ph.D. |
|
|
|
|
|
|
|
|
|
|
|
|
|
/s/ Robert Cochran |
|
Director |
|
March 13, 2020 |
|
|
Robert Cochran |
|
|
|
|
|
|
|
|
|
|
|
|
|
/s/ Fun-Kai Liu |
|
Director |
|
March 13, 2020 |
|
|
Fun-Kai Liu |
|
|
|
|
|
|
|
|
|
|
|
|
|
/s/ Koji Mori |
|
Director |
|
March 13, 2020 |
|
|
Koji Mori |
|
|
|
|
|
|
|
|
|
|
|
|
|
/s/ Dr. Yaichi Aoshima |
|
Director |
|
March 13, 2020 |
|
|
Dr. Yaichi Aoshima, Ph.D. |
|
|
|
|
|
|
|
|
|
|
|
|
|
*By |
/s/ Fumihiro Kozato |
|
|
|
|
|
|
Fumihiro Kozato Attorney-in-Fact |
|
|
|
|
|
|
|
|
|
|
|
77