Attached files
| file | filename |
|---|---|
| EX-32.2 - EX-32.2 - Target Hospitality Corp. | th-20191231ex322708a21.htm |
| EX-32.1 - EX-32.1 - Target Hospitality Corp. | th-20191231ex321c7309b.htm |
| EX-31.2 - EX-31.2 - Target Hospitality Corp. | th-20191231ex3129f4329.htm |
| EX-31.1 - EX-31.1 - Target Hospitality Corp. | th-20191231ex311494dca.htm |
| EX-23.1 - EX-23.1 - Target Hospitality Corp. | th-20191231ex23103b0dc.htm |
| EX-10.21 - EX-10.21 - Target Hospitality Corp. | th-20191231ex102180bdb.htm |
| EX-4.6 - EX-4.6 - Target Hospitality Corp. | th-20191231ex463695d2b.htm |
UNITED STATES
SECURITIES AND EXCHANGE COMMISSION
Washington, D.C. 20549
FORM 10-K
☒ANNUAL REPORT PURSUANT TO SECTION 13 OR 15(d) OF THE SECURITIES EXCHANGE ACT OF 1934
For the fiscal year ended December 31, 2019
OR
☐TRANSITION REPORT PURSUANT TO SECTION 13 OR 15(d) OF THE SECURITIES EXCHANGE ACT OF 1934
For the transition period from to
Commission file number 001-38343
TARGET HOSPITALITY CORP.
(Exact name of registrant as specified in its charter)
|
Delaware |
|
|
98-1378631 |
|
(State or other jurisdiction of |
|
|
(I.R.S. Employer |
|
incorporation or organization) |
|
|
Identification No.) |
2170 Buckthorne Place, Suite 440
The Woodlands, TX 77380-1775
(Address, including zip code, of principal executive offices)
(800) 832‑4242
(Registrant’s telephone number, including area code)
(Former name, former address and former fiscal year, if changed since last report)
Securities registered pursuant to Section 12(b) of the Act:
|
Title of each class |
Trading Symbol(s) |
Name of each exchange on which is registered |
|
Common stock, par value $0.0001 per share |
TH |
The Nasdaq Capital Market |
|
Warrants to purchase common stock |
THWWW |
The Nasdaq Capital Market |
Indicate by check mark if the registrant is a well-known seasoned issuer, as defined in Rule 405 of the Securities Act.
Yes ☐ No ☒
Indicate by check mark if the registrant is not required to file reports pursuant to Section 13 or Section 15(d) of the Act.
Yes ☐ No ☒
Indicate by check mark whether the registrant (1) has filed all reports required to be filed by Section 13 or 15 (d) of the Securities Exchange Act of 1934 during the preceding 12 months (or for such shorter period that the registrant was required to file such reports), and (2) has been subject to such filing requirements for the past 90 days. Yes ☒ No ☐
Indicate by check mark whether the registrant has submitted electronically and posted on its corporate Web site, if any, every Interactive Data File required to be submitted and posted pursuant to Rule 405 of Regulation S-T during the preceding 12 months (or for such shorter period that the registrant was required to submit and post such files). Yes ☒ No ☐
Indicate by check mark whether the registrant is a large accelerated filer, an accelerated filer, a non-accelerated filer, smaller reporting company, or an emerging growth company. See the definitions of “large accelerated filer,” “accelerated filer,” “smaller reporting company,” and “emerging growth company” in Rule 12b-2 of the Exchange Act.
|
Large accelerated filer ☐ |
Accelerated filer ☒ |
|
Non-accelerated filer ☐ |
Smaller reporting company ☐ |
|
|
Emerging growth company ☒ |
If an emerging growth company, indicate by check mark if the registrant has elected not to use the extended transition period for complying with any new or revised financial accounting standards provided pursuant to Section 13(a) of the Exchange Act. ☐
Indicate by check mark whether the registrant is a shell company (as defined in Rule 12b-2 of the Exchange Act). Yes ☐ No ☒.
The aggregate market value of common shares held by non-affiliates computed by reference to the price at which the common equity was last sold, or the average bid and asked price of such common equity, as of the last business day of the registrant’s most recently completed second fiscal quarter, June 28, 2019, was $314,734,067.
There were 105,277,765 shares of Common Stock, par value $0.0001 per share, issued and 102,297,898 outstanding as of March 9, 2020.
Documents Incorporated by Reference
The information required by Part III of this Report, to the extent not set forth herein, is incorporated herein by reference from the registrant's definitive proxy statement relating to the Annual Meeting of Shareholders to be held in 2020, which definitive proxy statement shall be filed with the Securities and Exchange Commission within 120 days after the end of the fiscal year to which this Report relates.
Target Hospitality Corp.
Annual Report on FORM 10‑K
December 31, 2019
Unless the context otherwise requires, references to “we”, “us”, “our”, “the Company”, or “Target Hospitality” refer to Target Hospitality Corp. and its consolidated subsidiaries.
Overview
Our company, Target Hospitality, is the largest vertically integrated specialty rental and hospitality services company in the United States. We own an extensive network of geographically relocatable specialty rental accommodation units with approximately 13,800 beds across 25 sites. The majority of our revenues are generated under multi-year committed contracts which provide visibility to future earnings and cash flows. We believe our customers enter into contracts with us because of our differentiated scale and ability to deliver premier accommodations and in-house culinary and hospitality services across many key geographies in which they operate. Approximately 75.6% of our revenue was earned from specialty rental with vertically integrated hospitality, specifically lodging and related ancillary services, whereas the remaining 24.4% of revenues were earned through leasing of lodging facilities (18.6%) and construction fee income (5.8%) for the year ended December 31, 2019. For the year ended December 31, 2019, we generated revenues of $321.1 million.
For additional information on our revenue related to December 31, 2018 and 2017, refer to “Management’s Discussion and Analysis of Financial Condition and Results of Operations” located in Part II, Item 7 within this Annual Report on Form 10-K.
Our company was formed from two leading businesses in the sector, Target Logistics Management, LLC (“Target”) and RL Signor Holdings, LLC (“Signor’). Signor was founded in 1990, and Target, though initially founded in 1978, began operating as a specialty rental and hospitality services company in 2006. Our company operates across the U.S. primarily in the Permian Basin in the southwest U.S. and Bakken Basin in North Dakota, which are the highest producing oil and gas basins in the country. We also own and operate the largest family residential center in the U.S., serving asylum-seeking women and children. Using the “Design, Develop, Build, Own, Operate, and Maintain” (“DDBOOM”) business model, Target Hospitality provides comprehensive turnkey solutions to customers’ unique needs, from the initial planning stages through the full cycle of development and ongoing operations. We provide cost-effective and customized specialty rental accommodations, culinary services and hospitality solutions, including site design, construction, operations, security, housekeeping, catering, concierge services and health and recreation facilities.
We deliver end-to-end specialty rental and hospitality services across several end markets in the U.S. and are known for high quality accommodations and vertically integrated specialty rental and hospitality services.
We primarily operate in the Permian and Bakken basins, which are some of the most active oil and gas regions in the world. We have established a leadership position in providing a fully integrated service offering to our large customer base, which is comprised of major and independent oil producers, oilfield service companies, midstream companies, refineries, government and government service providers. Our company is built on the foundation of the following core values: safety, care, excellence, integrity and collaboration.
3
Background
Target Hospitality Corp. was originally known as Platinum Eagle Acquisition Corp. (“Platinum Eagle”) and was a blank check company incorporated on July 12, 2017 as a Cayman Islands exempted company formed for the purpose of effecting a merger, share exchange, asset acquisition, share purchase, reorganization or similar business combination with one or more businesses. We completed an initial public offering in January 2018, after which our securities were listed on the Nasdaq Capital Market (“Nasdaq”).
On March 12, 2019, we discontinued our existence as a Cayman Islands exempted company under the Cayman Islands Companies Law (2018 Revision) and, pursuant to Section 388 of the General Corporation Law of the State of Delaware (the “DGCL”), continued our existence under the DGCL as a corporation incorporated in the State of Delaware (the “Domestication”). Thereafter, on March 15, 2019, the Company changed its name to Target Hospitality in accordance with the terms of: (i) the agreement and plan of merger, dated as of November 13, 2018, as amended on January 4, 2019 (the “Signor Merger Agreement”), by and among Platinum Eagle, Signor Merger Sub LLC, a Delaware limited liability company and wholly owned subsidiary of Platinum Eagle and sister company to the Holdco Acquiror (as defined below) (“Signor Merger Sub”), Arrow Holdings S.a.r.l., a Luxembourg société à responsabilité limitée (the “Arrow Seller”) and Signor Parent (as defined below), and (ii) the agreement and plan of merger, dated as of November 13, 2018, as amended
4
on January 4, 2019 (the “Target Merger Agreement” and, together with the Signor Merger Agreement, the “Merger Agreements”), by and among Platinum Eagle, Topaz Holdings LLC, a Delaware limited liability company (the “Holdco Acquiror”), Arrow Bidco, LLC, a Delaware limited liability company (“Arrow Bidco”) Algeco Investments B.V., a Netherlands besloten vennootschap (the “Algeco Seller”) and Target Parent (as defined below). Pursuant to the Merger Agreements, Platinum Eagle, through its wholly-owned subsidiary, the Holdco Acquiror, acquired all of the issued and outstanding equity interests of Arrow Parent Corp., a Delaware corporation (“Signor Parent”) and owner of Arrow Bidco, the owner of Signor, from the Arrow Seller, and all of the issued and outstanding equity interests of Algeco US Holdings LLC, a Delaware limited liability company (“Target Parent”) and owner of Target, from the Algeco Seller. The transactions contemplated by the Merger Agreements are herein after referred to as the “Business Combination.”
On the effective date of the Domestication, our then issued and outstanding Class A ordinary shares and Class B ordinary shares automatically converted by operation of law, on a one-for-one basis, into shares of our Class A common stock (“Class A common stock”) and Class B common stock (“Class B common stock”), respectively, and our outstanding Warrants automatically became warrants to acquire the corresponding number of shares of Class A common stock. On the closing date of the Business Combination (the “Closing Date”), each of our then currently issued and outstanding shares of Class B common stock automatically converted, on a one-for-one basis, into shares of Class A common stock, in accordance with the terms of our Delaware certificate of incorporation (the “Interim Domestication Charter”). Immediately thereafter, each of our issued and outstanding shares of Class A common stock automatically converted by operation of law, on a one-for-one basis, into shares of Target Hospitality Corp.’s Common Stock, par value $0.0001 per share (the “Common Stock”). Similarly, all of our outstanding Warrants to acquire shares of Class A common stock became warrants to acquire the corresponding number of shares of Common Stock and no other changes were made to the terms of any outstanding Warrants.
Upon completion of the Business Combination, the Nasdaq trading symbols of our Common Stock and our Warrants were changed to “TH” and “THWWW,” respectively.
Business Model
Our DDBOOM model allows our customers to focus their efforts and resources on their core businesses. This makes us an integral part of the planning and execution phases for all customers.
We provide a safe, comfortable, and healthy environment to our guests, employees and workers across the U.S. and anywhere our customers need our facilities and services. Under our “Target 12” service model, we provide benefits to our customers, delivering high quality food, rest, connection, wellness, community, and hospitality, which optimizes our customers’ workforce engagement, performance, safety, loyalty, and productivity during work hours.
This facility and service model is provided directly by our employees, who deliver the essential services 24 hours per day for 365 days a year. We provide all of the hospitality services at our sites, and as a result, we believe we deliver more consistent and high-quality hospitality services at each community compared to our peers. Our company and employees are driven by our primary objective of helping our customers’ workforce reach their full potential every day. Our professionally trained hospitality staff has the unique opportunity to live with our customers as most of our employees live on location at the communities where our customers’ workforce reside. This allows our employees to develop powerful customer empathy, so we are better able to deliver consistent service quality and care through the Target 12 platform each day. Our employees are focused on “the other 12 hours”—the time our customers and their employees are not working—making sure we deliver a well fed, well rested, happier, loyal, safer and more productive employee every day. What we provide our customers’ workforce “off the clock” optimizes their performance when they are “on the clock.” The investment our customers make in their employees “the other 12 hours” is an essential part of their strategy and overall business and operations execution plan.
Using our expansive community network, DDBOOM and Target 12 models, we provide specialty rental and hospitality services that span the lifecycle of our oil and gas customers’ projects. Our services cover the entire value chain of oil and gas projects, from the initial stages of exploration, resource delineation and drilling to the long-term production,
5
pipeline transportation and final processing. Customers typically require accommodations and hospitality services at the onset of their projects as they assess the resource potential and determine how they will develop the resource. Our temporary accommodation assets are well-suited to support this exploratory stage where customers begin to execute their development and construction plans. As the resource development begins, we can serve customers’ needs with our specialty rental accommodation assets, and we are able to scale our facility size to meet customers’ growing needs. By providing infrastructure early in the project lifecycle, we are well-positioned to continue serving our customers throughout the full cycle of their projects, which can typically last for several decades.
Our integrated model provides value to our customers by reducing project timing and counterparty risks associated with projects. More broadly, our accommodations networks, combined with our integrated value-added hospitality and facilities services creates value for our customers by optimizing our customers’ engagement, performance, safety, loyalty, productivity, preparedness and profitability.
Summary of Value Added Services
We take great pride in the premium customer experience we offer across our range of community and hospitality services offerings. All of Target’s communities include in-house culinary and hospitality services. Our well-trained culinary and catering professionals serve more than 13,000,000 meals each year with fresh ingredients and many of our meals are made from scratch. We self-manage most culinary and hospitality services, which provides us with greater control over service quality as well as incremental revenue and profit potential. Our communities are designed to promote rest and quality of life for our customers’ workforces and include amenities such as:
Summary of Amenities:
|
● New Innovative Modular Design |
|
● Media Lounges and WIFI Throughout |
|
|
|
● Single Occupancy Design |
|
● Individual Xbox/PSII Pods |
|
|
|
● Swimming Pool, Volleyball, Basketball |
|
● Flat-Screen TVs in Each Room |
|
|
|
● Commercial Kitchen |
|
● 40+ Premium TV Channel Line-up |
|
|
|
● Fast Food Lounges |
|
● Personal Laundry Service |
|
|
|
● Full & Self Service Dining Areas |
|
● Individually Controlled HVAC System |
|
|
|
● TV Sport/Entertainment Lounges |
|
● Hotel Access Unity Lock Systems |
|
|
|
● Training/conference Rooms |
|
● 24 Hour No-Limit Dining |
|
|
|
● Core Passive Recreation Areas |
|
● Free DVD Rentals |
|
|
|
● Active Fitness Centers |
|
● Self Dispensing Free Laundry |
|
|
|
● Lodge Recreation Areas |
|
● Commercial Laundry |
|
|
|
● Locker/Storage/Boot-up Areas |
|
● Transportation to Project Site |
|
|
|
● Parking Areas |
|
● 24 Hour Gated Security |
|
|
|
● Waste Water Treatment Facility |
|
● Daily Cleaning & Custodial Service |
|
|
|
● On-site Commissary |
|
● Professional Uniformed Staff |
|
|
Our hospitality services and programming are designed to promote safety, security and rest, which in turn promote greater on-the-job productivity for our customers’ workforces. All of our communities strictly adhere to our community code of conduct, which prohibits alcohol, drugs, firearms, co-habitation and guests. We work closely with our customers to ensure that our communities are an extension of the safe environment and culture they aim to provide to their employees while they are on a project location. Our customer code of conduct is adopted by each corporate customer and enforced in conjunction with our customers through their documented health, safety and environmental policies, standards and customer management. We recognize that safety and security extends beyond the customers’ jobsite hours and is a 24-hour responsibility which requires 24-hour services by Target Hospitality and close collaboration with our customer partners.
6
History and Development
Target Hospitality’s legacy businesses of Signor and Target have grown and developed since they were created. The chart below sets out certain key milestones for each business.
|
1978-2000 |
|
2010-Present |
|
● 1978: Target Logistics was founded |
|
● 2011: Target expanded capacity in Williston, Stanley and Tioga with long-term customers Halliburton, Hess, ONEOK, Schlumberger, Superior Well Service, Key Energy Services and others |
|
● 1990: Signor Farm and Ranch Real Estate was founded |
|
● 2011: Signor Lodge opened in Midland, TX (84 rooms) |
|
● Target awarded contracts for logistics services for Olympics in 1984 (Sarajevo), 1992 (Barcelona), 1996 (Atlanta), 2000 (Sydney), 2002 (Salt Lake City), 2004 (Athens), 2006 (Turin) and 2010 (Vancouver) |
|
● 2011: Signor Barnhart Lodge opened in Barnhart, TX (160 beds) |
|
● The Vancouver project consisted of a 1,600 bed facility, a portion of which was subsequently transferred to North Dakota and remains in use today |
|
● 2012: Target developed additional North Dakota facilities in Dunn County (Q1), Judson Lodge(Q3), Williams County (Q3) and Watford City (Q4) |
|
● 2005: Target operated 1,100-bed cruise ship anchored in the Gulf of Mexico to support relief efforts during aftermath of Hurricane Katrina |
|
● 2012: Target expanded service into Texas with the opening of Pecos Lodge (90 beds) (Permian basin) in Q4 |
|
● In addition, built and managed 700-person modular camp in New Orleans with running water, electricity and on-site kitchen services |
|
● 2013: Target awarded TCPL Keystone KXL pipeline project to house and feed over 6,000 workers |
|
● 2007: Target hired by Freeport-McMoRan to build and operate 425-bed facility in Morenci, AZ in support of copper mining operations (re-opening 10/2012) |
|
● 2014: Target awarded lodge contract for new 200-bed community in the Permian |
|
● 2008: Target provided catering/food services for 600 personnel in support of relief operations in aftermath of Hurricane Ike |
|
● 2014: Target awarded contract and built 2,400-bed STRFC for U.S. federal government |
|
● 2009: Target provided housing and logistics services for 1,500 workers during a refurbishment of a refinery in St. Croix |
|
● 2015: Opened new community in Mentone, TX (Permian basin) in Q4 for Anadarko Petroleum Company |
|
● 2009: Signor Lodging was formed |
|
● 2016: Signor expanded Midland Lodge several phased expansions 1,000 beds |
|
● 2010: Target opened Williston Lodge, Muddy River, Tioga and Stanley Cabins in western North Dakota |
|
● 2016: Signor Kermit Lodge opens with 84 rooms |
|
|
|
● 2017: Signor opened Oria Lodge with 208 rooms |
|
|
|
● 2017: Target expanded Permian network with the expansion of both Wolf Lodge and Pecos Lodge (Permian basin) in Q2 |
|
|
|
● 2017: Target expanded presence in New Mexico (Permian basin) and West Texas with the acquisition of 1,000-room Iron Horse Ranch |
|
|
|
● 2017: Signor opened El Reno Lodge with 345 rooms |
|
|
|
● 2017: Target expanded Permian presence with 280-room Blackgold Lodge in Q3 |
|
|
|
● 2018: Target Logistics rebranded as Target Lodging in March 2018 |
|
|
|
● 2018: Target opened new 600-room community in Mentone-Permian basin |
|
|
|
● 2018: Target added approximately 1,600 rooms across Permian basin network |
|
|
|
● 2018: Target expanded community network in Permian and Anadarko basins through acquisition of Signor, adding 7 locations and approximately 4,500 beds to the network |
|
|
|
● 2019: Target announced new 400-bed community in the Permian basin |
|
|
|
● 2019: Target expanded its community network in the Permian Basin through the acquisitions of Superior and ProPetro, adding 4 locations and approximately 758 beds to the network. |
|
|
|
● 2019: El Capitan 200 beds |
|
|
|
● 2019: El Capitan expansion 100 beds |
|
|
|
● 2019: Seven Rivers expansion 200 beds |
Industry Overview
We are one of the few vertically integrated specialty rental and hospitality services providers that service the entire value chain from site identification to long-term community development and facilities management. Our industry divides specialty rental accommodations into three primary types: communities, temporary worker lodges and mobile
7
assets. We are principally focused on communities across several end markets, including oil and gas, energy infrastructure and U.S. government.
Communities typically contain a larger number of rooms and require more time and capital to develop. These facilities typically have commercial kitchens, dining areas, conference rooms, medical and dental services, recreational facilities, media lounges and landscaped grounds where climate permits. A substantial portion of our communities are built and underpinned by multi-year committed contracts which often include exclusivity provisions. These facilities are designed to serve the long-term needs of customers regardless of the end markets they serve. All of our communities provide fully-integrated and value-added hospitality services, including but not limited to: catering and food services, housekeeping, health and recreation facilities, laundry services and overall workforce community management, as well as water and wastewater treatment, power generation, communications and personnel logistics where required. In contrast, temporary lodges are usually smaller in number of rooms and generally do not include hospitality, catering, facilities services or other value-added on-site services and typically serve customers on a spot or short-term basis without long-term committed contracts. These temporary facilities are “open” for any customer who needs lodging services. Finally, mobile assets, or rig housing, are designed to follow customers’ activities and are generally used for drilling rig operators. They are often used to support conventional drilling crews and are contracted on a project-by-project, well-by-well or short-term basis.
Our specialty rental modular assets and hospitality services deliver the essential services and accommodations when and where there is a lack of sufficient accessible or cost-effective housing, infrastructure or local labor. Many of the geographic areas near the southern U.S. border lack sufficient temporary housing and infrastructure for asylum-seeking immigrants or may require additional infrastructure in the future. In the U.S. oil and gas sector, many of the largest unconventional and hydrocarbon reservoirs are in remote and expansive geographic locations, like the Permian and Bakken where limited infrastructure exists. Our industry supports the development of these natural resources by providing lodging, catering and food services, housekeeping, recreation facilities, laundry services and facilities management, as well as water and wastewater treatment, power generation, communications and personnel logistics where required. Our communities and integrated hospitality services allow our customers to outsource their accommodations needs to a single provider, optimizing employee morale, productivity, safety, and loyalty while focusing their investment on their core businesses and long term planning.
With our focus on large-scale community networks, large-scale stand-alone communities and hospitality services, our business model is a balanced combination of specialty rental assets and facilities services and is most similar to specialty rental companies like William Scotsman and Mobile Mini, and facilities services companies such as Aramark, Sodexo or Compass Group, and developers of lodging properties who are also owners or operators, such as Hyatt Hotels Corporation or Marriott International, Inc.
The U.S. specialty rental accommodations industry is segmented into competitors that serve components of the overall value chain, with very few integrated providers.
The family residential center we own, operate, or manage, as well as those facilities we own but are managed by other operators, are subject to competition for residents from other private operators. We compete primarily on siting, cost, the quality and range of services offered, our experience in the design, construction, and management of facilities, and our reputation. We compete with government agencies that are responsible for correctional, detention and residential facilities. Government sector demand for facilities is affected by a number of factors, including the demand for beds, general economic conditions and the size of the immigration-seeking population.
In the U.S. oil and gas sector, Target Hospitality represents 42.7% of the overall rental accommodations market, of which, the total integrated market is approximately 70%. There are only three other integrated accommodations and facilities services providers and they make up approximately 28% of the total U.S. integrated rental accommodations market, while private companies primarily provide lodging only or offer optional catering services through a third-party
8
catering company and also make up approximately 10% of the market. Two public manufacturing and/or leasing firms also participate in the U.S. market. Those companies primarily own and lease the units to customers, facility service companies or integrated providers. Facility service companies, manage third-party facilities, but do not invest in, or own, the accommodations assets.
Demand for accommodations and related services within our oil and gas end market is influenced by four primary factors: (i) available infrastructure, (ii) competition, (iii) workforce requirements, and (iv) capital spending. Anticipated capital spending, and our customers’ expectations for future capital spending as well as larger infrastructure requirements, influence customers’ development on current productive assets, maintenance on current assets, expansion of existing assets and development of greenfield, brownfield or new assets. In addition to capital requirements, different types of customer activity require varying workforce sizes, influencing the demand for accommodations. Also, competing locations and services influence demand for our assets and services.
Demand within our government end market is primarily influenced by immigration, including the ongoing need to accommodate asylum seekers as well as federal governmental policy and budgets. Continued increases in asylum seeking activity may influence government spending on infrastructure in immigration-impacted regions and consequentially demand for accommodations and related services.
Another factor that influences demand for our rooms and services is the type of customer we are supporting. Generally, oil producer customers require larger workforces during construction and expansionary periods and therefore have a higher demand for accommodations. Due to the contiguous nature of their land positions, a “hub and spoke” model is utilized for producers. Oilfield service companies also require larger and more mobile workforces which, in many cases, consist of employees sourced from outside of the work areas. These employees, described as rotational workers, permanently reside in another region or state and commute to the Permian or Bakken on a rotational basis (often, two weeks on and one week off). Rotational workers are also sometimes described as a fly-in-fly-out (“FIFO”) or drive-in-drive-out (“DIDO”) commuter work force.
In addition, proximity to customer activities influences occupancy and demand. We have built, own and operate the two largest specialty rental and hospitality services networks available to oil and gas customers operating in the Permian and Bakken. These networks allow our customers to utilize one provider across a large and expansive geographic area. Our broad network often results in us having communities that are the closest to our customers’ job sites, which reduces commute times and costs, and improves the overall safety of our customers’ workforce.
Generally, if a community is within a one hour drive of a customer’s work location, our contractual exclusivity provisions with our customers require the customers to have their crews lodge at one of our communities. Our communities provide customers with cost efficiencies, as they are able to jointly use our communities and related infrastructure (power, water, sewer and IT) services alongside other customers operating in the same vicinity.
Demand for our services is dependent upon activity levels, particularly our customers’ capital spending on exploration for, development, production and transportation of oil and natural gas and government immigration housing programs. Our customers’ spending plans generally are based on their view of commodity supply and demand dynamics, as well as the outlook for near-term and long-term commodity prices and annual government appropriations. Our current oil and gas footprint is strategically concentrated in the Permian, the largest basin in the world with approximately 140 billion barrels of oil equivalent (“bboe”) of recoverable oil while producing approximately 4.5 million barrels of oil equivalent (“mboe”) per day. The Permian stretches across the southeast corner of New Mexico and through a large swath of land in western Texas, encompassing hundreds of thousands of square miles and dozens of counties.
The Permian has experienced elevated drilling activity as the result of improved technologies that have driven down the cost of production. Additionally, the Permian is the lowest cost basin within the U.S., with a breakeven price below $40/bbl and multi-year drilling inventory economic at sub-$35 per barrel WTI prices in many areas, allowing operators
9
focused in the Permian to continue drilling economic wells even at low commodity price levels. Technological improvements in recent years and the extensive oil and gas reserves support sustained activity in the Permian for the foreseeable future.
Business Strengths & Strategies
Strengths
|
· |
Market Leader in Strategically Located Geographies. We are the nation’s largest provider of turnkey specialty rental units with premium catering and hospitality services including 25 strategically located communities with approximately 13,800 beds primarily in the highest demand regions of the Permian and Bakken. Utilizing our large network of communities with the most bed capacity, particularly within the Permian and Bakken, we believe we are the only provider with the scale and regional density to serve all of our customers’ needs in these key basins. Additionally, our network and relocatable facility assets allow us to transfer the rental fleet to locations that meet our customer service needs. We leverage our scale and experience to deliver a comprehensive service offering of vertically integrated accommodations and hospitality services. Our complete end-to-end accommodations solution, including our premium amenities and experience, provides our customers with a compelling economic value proposition. |

10
|
· |
Long-Standing Relationships with Diversified Large Integrated Customers. We have long standing relationships with our diversified base of approximately 300 customers, which includes some of the largest blue-chip, investment grade oil and gas and integrated energy infrastructure companies in the U.S. We serve the full energy value chain, with customers spanning across the upstream, midstream, downstream and service sectors. We believe we have also established strong relationships in our U.S. government end market with our contract partner and the federal agency we serve. We initially won our large government contract in 2014 based upon our differentiated ability to develop and open the large facility on an accelerated timeline. This contract was renewed and extended in 2016, demonstrating our successful execution and customer satisfaction. The relationships we have established over the past decade have been built on trust and credibility given our track record of performance and delivering value to our customers by providing a broad range of hospitality service offerings within a community atmosphere. Target’s customers’ desire and willingness to enter into multi- year committed contracts, and to renew them at a historical rate of approximately 90%, demonstrates the strength of these long-standing relationships. |
|
· |
Multi-year Contracts and Exclusivity Produce Highly Visible, Recurring Revenue. The vast majority of our revenues are generated under multi-year contracts. Of those long-term contracts, 82% are committed and 63% represent contracts to which our revenue generation is guaranteed regardless of occupancy levels. Further, 46% (by revenue) of our total committed contracts contain exclusivity provisions under which our customers agree to exclusively use our communities for all of their needs within the geographies we serve. Of our contracts that are not committed, approximately 80% have exclusivity. The weighted average term of our contracts is approximately 39 months and Target has maintained a client renewal rate of at least 90% over the last 5 years. Our committed customers secure minimum capacity commitments with us to ensure that sufficient accommodations and hospitality services are in place to properly care for their large workforces. Our multi-year committed customer agreements provide us with contracted recurring revenue and high visibility to future financial performance. |
|
· |
Proven Performance and Resiliency Through the Cycle. Our business model is well insulated from economic and commodity cycles, as evidenced by our ability to increase revenue and EBITDA despite a significant and prolonged decline in oil and related commodity prices in recent years. For example, in the fourth quarter of 2019, we secured contract renewals and extensions with four large oil and gas customers who represent approximately 20% of Target Hospitality’s 2019 revenue attributable to the energy end market, despite a greater than 25% decline in the U.S. oil rig count during the period. Our multi-year, committed, exclusive contracts with large integrated customers support stable performance through commodity and economic cycles. Further, we are able to efficiently optimize our modular assets and redeploy them, as warranted by customer demand. Our prior planning and strategic focus on the Permian Basin further supports consistent performance as the region’s oil production continues to grow. The Permian Basin is one of the largest basins in the world with high levels of sustained production expected to continue, further supported by the structural decline in breakeven prices in the region. |
|
· |
Long-lived Assets Requiring Minimal Maintenance Capital Expenditures. Our long-lived specialty rental assets support robust cash flow generation. Our rental assets have an average life in excess of 20 years, and we typically recover our initial investment within the first few years of initial capital deployment. We estimate our maintenance capital to be approximately 1% of annual revenue and maintain low maintenance capital expenditures, as cleaning and routine maintenance costs are included in day-to-day operating costs and recovered through the average daily rates that we charge our customers. This continual care of our assets supports extended asset lives and the ongoing ability to operate with only nominal maintenance capital expenditures. The investment profile of our rental assets underpins our industry leading unit economics. Our contract discipline underpins our investment decision making and spending on any new growth investments. Generally, we do not invest capital |
11
unless we expect to meet our internal returns thresholds. Due to the high revenue visibility from long-term contracts, we are poised to generate robust and stable cash flows driven by historical strategic growth investments and minimal future maintenance capital expenditure requirements. |
Strategies
We believe that we can further develop our business by, among other things:
|
· |
Maintaining and Expanding Existing Customer Relationships. Growing and maintaining key customer relationships is a strategic priority. We fill existing bed capacity within our communities, while optimizing our inventory for existing customer expansion or for new customers. Keeping this balance provides us with flexibility and a competitive advantage when pursuing new contract opportunities. We optimize our capacity, inventory and customers’ usage through data analytics, customer collaboration and forecasting demand. With the scale of our accommodations network, a significant number of our key customers are commercially exclusive to Target Hospitality as their primary and preferred provider of accommodations and hospitality services throughout the U.S. or for a designated geographic area. |
|
· |
Enhancing Contract Scope and Services. One of our strategic focus areas is to enhance the scope and terms of our customer contracts. We intend to continue our historical track record of renewing and extending these contracts at favorable commercial and economic terms, while also providing additional value added services to our customers. For example, following the Signor acquisition we added our vertically integrated suite of services, including catering, to the many legacy Signor contracts that included only accommodations. Replacing legacy third party providers allows us greater control over service quality and delivery and offers substantial incremental revenue potential. Additionally, we believe we have capacity to increase revenue within our existing communities without new growth capital expenditures through increased utilization rates or modest price increases over time. |
|
· |
Disciplined Growth Capital Expenditures to Increase Capacity. We selectively pursue opportunities to expand existing communities and develop new communities to satisfy customer demand. We employ rigorous discipline to our capital expenditures to grow our business. Our investment strategy is to only deploy new capital with visibility—typically a contract—to revenue and returns to meet our internal return hurdles. We target payback on initial investment within a few years. Due to the lower cost per bed, returns on investment are higher for the expansion of existing facilities. |
|
· |
Growing and Pursuing New Customer/Contract Opportunities. We continually seek additional opportunities to lease our facilities to government, energy and natural resources, manufacturing, and other third-party owners or operators in need of specialty rental and hospitality services. We have a proven track record of success in executing our specialty rental and facilities management model across several end markets for ongoing needs as well as major projects that have finite project life cycle durations. While special projects do not constitute a large portion of our business, it is typical for us to secure some special projects that can last anywhere from 1-5 years (or more). We have designated sales-related resources that focus on special finite life cycle projects and maintain a dynamic business pipeline which includes but is not limited to special projects across end markets. |
|
· |
Expansion Through Acquisitions and diversify our service offerings. We selectively pursue acquisitions and business combinations related to specialty rental and hospitality services in the markets we currently serve as well as adjacent markets that offer existing complimentary services to ours. Leveraging our core competencies related to facilities management, culinary services, catering and site services, we can further scale this segment of our business and replicate it in other geographies and end markets. We continue to assess targeted acquisitions and business combinations that would be accretive to us while also expanding our end markets. |
12
Sales and Marketing
Target has a tenured in-house sales and marketing team that is responsible for acquiring new customers and managing the relationships of our existing customers across the U.S. Our sales approach is based on a consultative empathy based value creation model. Our professionally trained sales organization is relentlessly focused on providing solutions to our customers’ challenges which has resulted in higher customer satisfaction and loyalty.
Business Operations
Target Hospitality provides specialty rental and hospitality services, temporary specialty rental and hospitality services solutions and facilities management services across the U.S. The company’s primary customers are investment grade oil, gas and energy companies, other workforce accommodation providers operating in the Permian and Bakken regions, and government contractors. The company’s specialty rental and hospitality services and management services are highly customizable and are tailored to each customer’s needs and requirements. Target Hospitality is also an approved general services administration (“GSA”) contract holder and offers a comprehensive range of housing, deployment, operations and management services through its GSA professional services schedule agreement. The GSA contract allows U.S. federal agencies to acquire our products and services directly from Target Hospitality which expedites the commercial procurement process often required by government agencies.
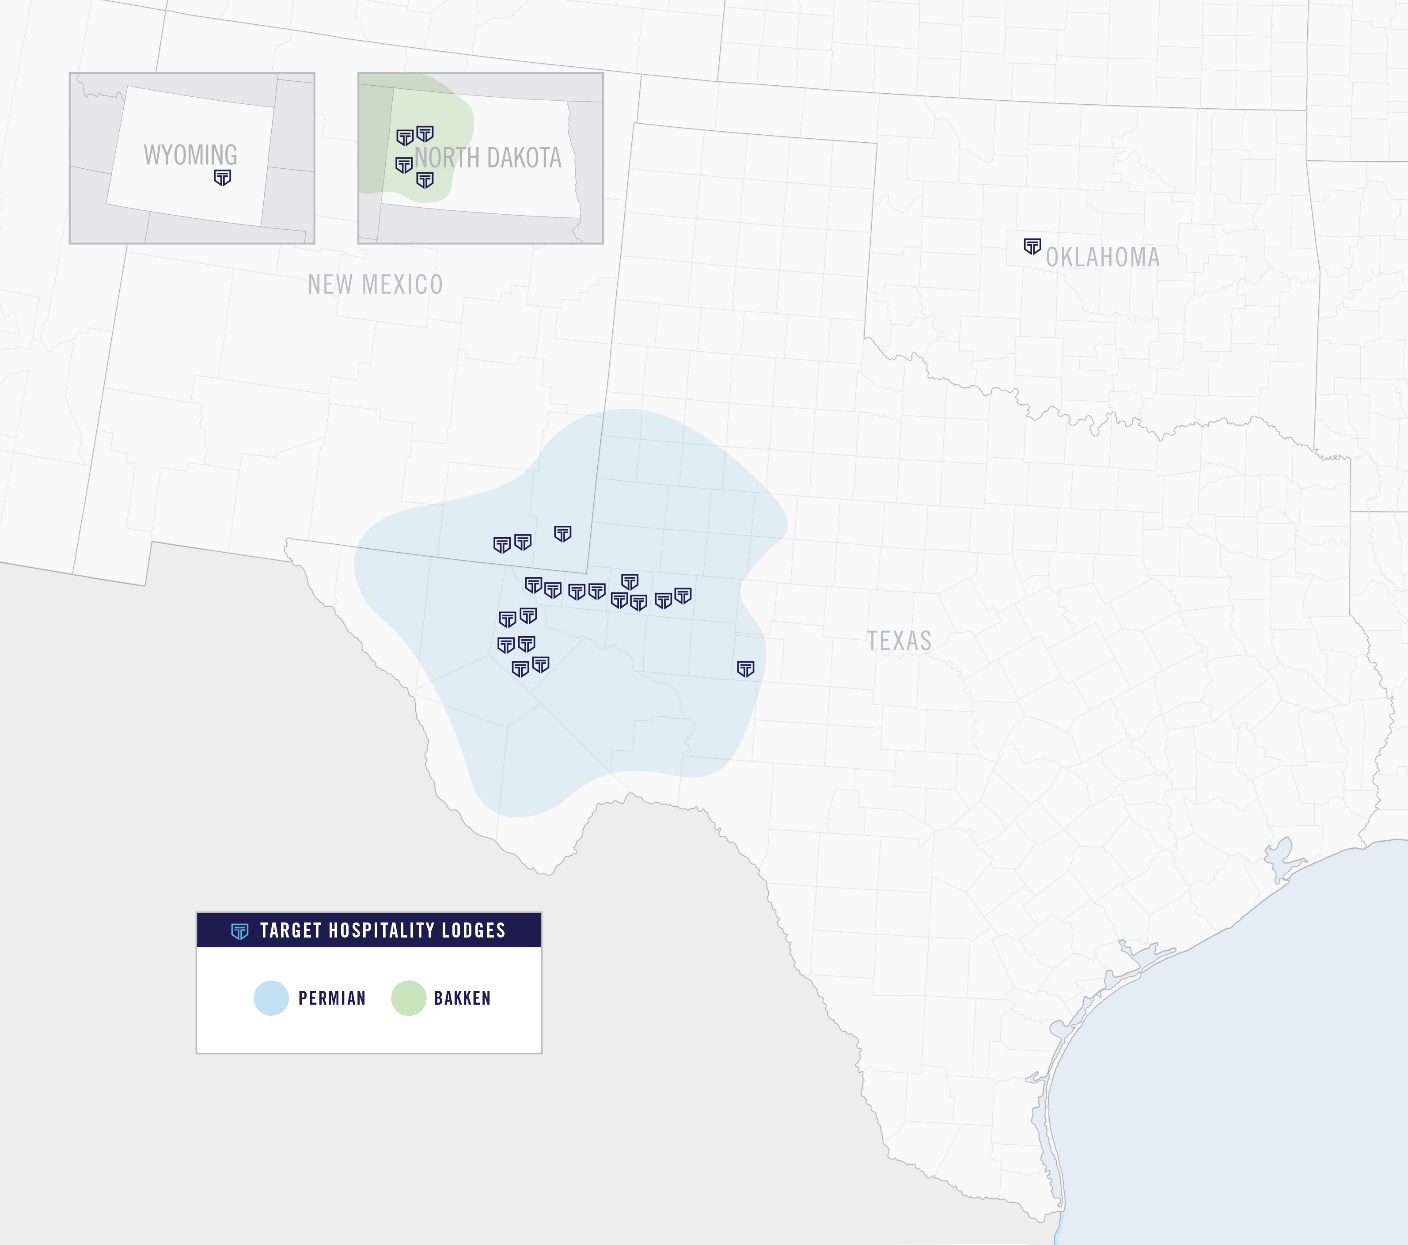
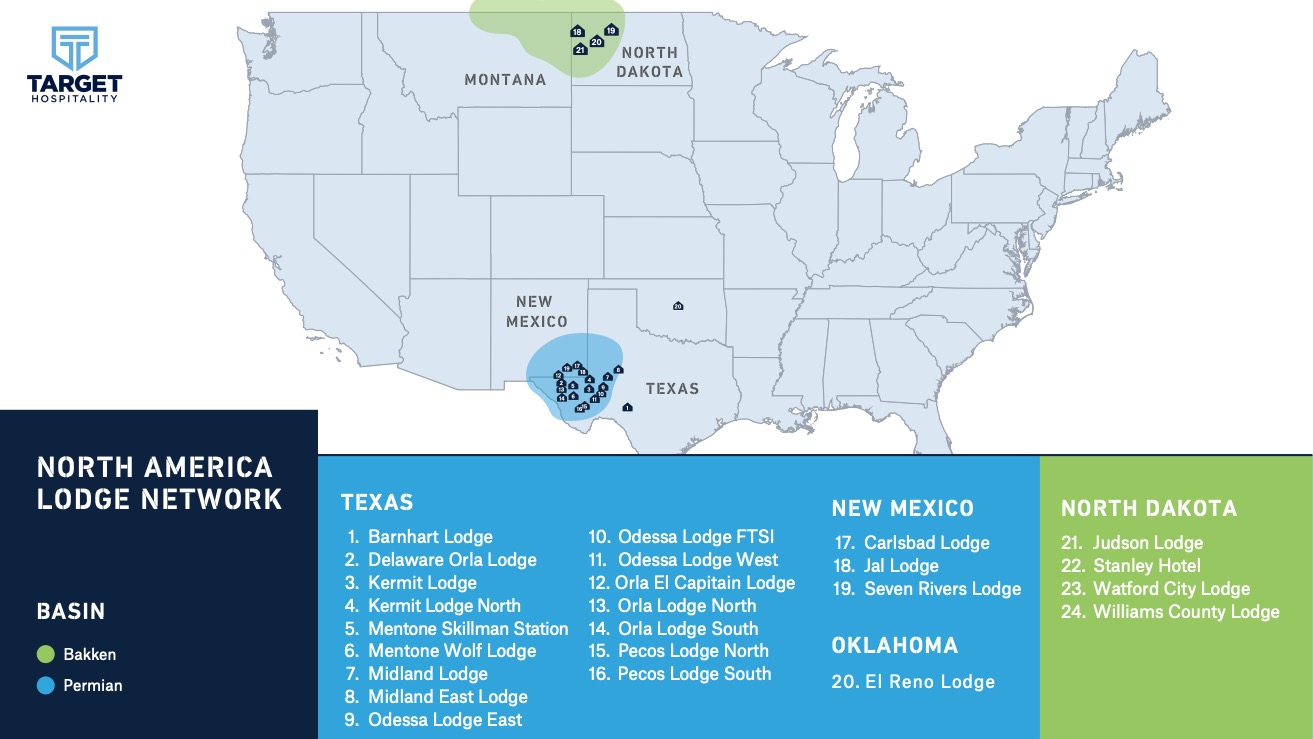
Target Hospitality operates its business in three key end markets: (i) government (“Government”), which includes the facilities, services and operations of its family residential center and the related support communities in Dilley, Texas (the “South Texas Family Residential Center”) provided under its lease and services agreement with CoreCivic; (ii) the Permian basin (the “Permian Basin”), which includes the facilities and operations in the Permian region and the 19 communities located across Texas, New Mexico and (iii) the Bakken basin (the “Bakken Basin”), which includes facilities and operations in the Bakken basin region and four communities in North Dakota
13
The map below shows the company’s primary community locations in the Permian Basin and the Bakken Basin (including the Company’s one location in the Anadarko).
14
The table below presents the Company’s lodges in the oil and gas end market.
|
Location |
|
Lodge Name |
|
Location |
|
Status |
|
Number of Beds |
|
Bakken |
|
Williams County Lodge |
|
Williston, North Dakota |
|
Own/Operate |
|
300 |
|
Bakken |
|
Judson Executive Lodge |
|
Williston, North Dakota |
|
Own/Operate |
|
100 |
|
Bakken |
|
Stanley Hotel |
|
Stanley, North Dakota |
|
Own/Operate |
|
345 |
|
Bakken |
|
Watford City Lodge |
|
Watford City, North Dakota |
|
Own/Operate |
|
334 |
|
Permian |
|
Dilley (STFRC) |
|
Dilley, Texas |
|
Own/Operate |
|
2,556 |
|
Permian |
|
Pecos North Lodge |
|
Pecos, Texas |
|
Own/Operate |
|
982 |
|
Permian |
|
Pecos South Lodge |
|
Pecos, Texas |
|
Own/Operate |
|
786 |
|
Permian |
|
Mentone Wolf Camp |
|
Mentone, Texas |
|
Own/Operate |
|
530 |
|
Permian |
|
Skillman Station Lodge |
|
Mentone, Texas |
|
Own/Operate |
|
706 |
|
Permian |
|
Orla North Lodge |
|
Orla, Texas |
|
Own/Operate |
|
170 |
|
Permian |
|
Orla South Lodge |
|
Orla, Texas |
|
Own/Operate |
|
240 |
|
Permian |
|
Delaware Orla Lodge |
|
Orla, Texas |
|
Own/Operate |
|
465 |
|
Permian |
|
El Capitan Lodge |
|
Orla, Texas |
|
Own/Operate |
|
429 |
|
Permian |
|
Odessa West Lodge |
|
Odessa, Texas |
|
Own/Operate |
|
805 |
|
Permian |
|
Odessa East Lodge |
|
Odessa, Texas |
|
Own/Operate |
|
280 |
|
Permian |
|
Odessa FTSI Lodge |
|
Odessa, Texas |
|
Own/Operate |
|
217 |
|
Permian |
|
Midland Lodge |
|
Midland, Texas |
|
Own/Operate |
|
1,567 |
|
Permian |
|
Midland East Lodge |
|
Midland, Texas |
|
Own/Operate |
|
168 |
|
Permian |
|
Kermit Lodge |
|
Kermit, Texas |
|
Own/Operate |
|
232 |
|
Permian |
|
Kermit North Lodge |
|
Kermit, Texas |
|
Own/Operate |
|
180 |
|
Permian |
|
Barnhart Lodge |
|
Barnhart, Texas |
|
Own/Operate |
|
192 |
|
Permian |
|
Carlsbad Lodge |
|
Carlsbad, New Mexico |
|
Own/Operate |
|
606 |
|
Permian |
|
Carlsbad Seven Rivers Lodge |
|
Carlsbad, New Mexico |
|
Own/Operate |
|
640 |
|
Permian |
|
Jal Lodge |
|
Jal, New Mexico |
|
Own/Operate |
|
626 |
|
Anadarko |
|
El Reno Lodge |
|
El Reno, Oklahoma |
|
Own/Operate |
|
345 |
|
Total Number of Beds |
|
|
|
|
|
|
|
13,801 |
Government
Historically, the Government segment has included, but is not limited to, two primary end markets which make up approximately 20.9% of our revenue for the year ended December 31, 2019:
|
· |
Residential Facilities. Residential facilities, including the South Texas Family Residential Center (discussed below), provide space and residential services in an open and safe environment to adult females with children who are seeking asylum and are awaiting the outcome of immigration hearings or the return to their countries of origin. Residential facilities offer services including, but not limited to, educational programs, medical care, recreational activities, counseling, and access to religious and legal services. |
|
· |
Community Corrections. Community corrections/residential reentry facilities offer housing and programs to offenders who are serving the last portion of their sentence or who have been assigned to the facility in lieu of a jail or prison sentence, with a key focus on employment, job readiness, and life skills. |
Target Hospitality built and currently leases and operates the South Texas Family Residential Center through a sub-lease and services agreement with CoreCivic, a government solutions company which provides correctional and detention management services. Target Hospitality owns and operates the facility by providing on-site services including catering, culinary, management, janitorial and light maintenance. The South Texas Family Residential Center includes 524,000 square feet of building space including residential housing units with 2,400 beds, as well as classrooms, a library, chapels, an infirmary with full medical, dental, pharmaceutical and x-ray capabilities, a dining hall, offices and an industrial laundry center.
15
We look forward to expanding the products and services of our Government segment through our GSA designations, specifically our designation to maintain the professional services schedule (“PSS”) for logistics service solutions, which are designed to assist federal agencies in procuring comprehensive logistics solutions, including planning, consulting, management, and operational support when deploying supplies, equipment, materials and associated personnel. GSA’s PSS is a multiple award schedule (“MAS”) contract for innovative solutions, offered to federal, state and local governments, for their professional service’s needs. Having a PSS signifies that we have been vetted as a responsible supplier, our pricing has been determined to be fair and reasonable and we are in compliance with all applicable laws and regulations. PSS is one of the GSA’s schedule contracts, which are indefinite delivery, indefinite quantity (“IDIQ”), long-term contracts under the GSA MAS program. GSA schedule contracts were developed to assist federal employees in purchasing products and services and they contain pre-negotiated prices, delivery terms, warranties, and other terms and conditions which streamline the buying process.
The Government segment generated 20.9% or $67.0 million of the company’s revenue for the year ended December 31, 2019.
Permian Basin
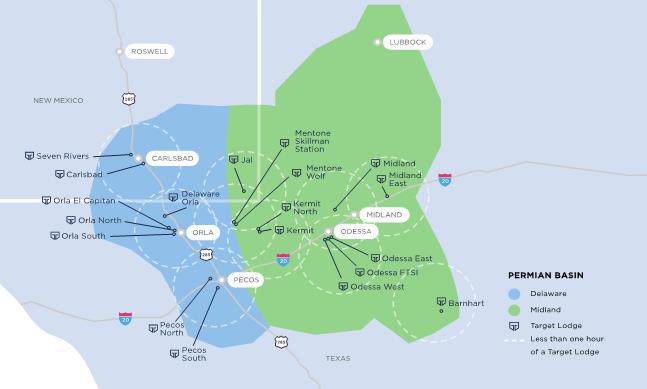
The Permian Basin is one of the oldest producing basins in the world, with production dating back to the early 1900s. It stretches across the southeast corner of New Mexico and a large swath of western Texas, encompassing hundreds of thousands of square miles and dozens of counties. The growth story comes from both unconventional and conventional drilling techniques into stacked reservoirs including the Wolfcamp, Bone Springs, Trend Area (Spraberry area) and Spraberry reservoirs. The basin consists of multiple sub-basins; the most targeted are the Delaware and Midlands Basins. Until the oil price decline in 2014, over 200 vertical rigs (most of all vertical rigs in the U.S.) were operating in the Permian using traditional drilling methods to vertically target and frac into multiple stacked pay zones, primarily in the Midland Basin’s Trend Area and Spraberry reservoirs. Horizontal production from the Delaware basin began in earnest in 2014, primarily in New Mexico. Horizontal drilling in the Texas portion of the Permian Basin followed shortly thereafter with horizontal drilling in the Spraberry and Trend Area reservoirs, which were traditionally vertical targets.
The Permian Basin market is the most prolific shale basin in the U.S. with an estimated 140 billion barrels of oil equivalent (bboe) of recoverable oil while producing approximately 4.5 one million barrels of oil equivalent (mboe) per day. This century-old oil basin has attracted investment from large and small companies for many decades. However, it took years of vertical drilling and multi-stage fracking of vertical wells (and simultaneous development of horizontal drilling and fracking outside of the Permian Basin) to learn enough about the stacked pay potential in order to drill it horizontally. The high proportion of vertical wells before 2014 evidences the recent realization of the Permian Basin’s potential—due in large part to its scale and geologic complexity.
While understanding the significant potential in the Permian Basin, Target entered the market in 2012, ahead of many of our competitors. We started in the Permian Basin with an 80-bed community in Pecos, TX.
As of December 31, 2019, Target Hospitality has two locations and over 1,700 beds in the Pecos area of the Permian Basin alone, which is located in the Delaware basin area. With 19 communities and approximately 9,821 beds across the Permian Basin, we offer the largest network of turnkey specialty rental accommodations and hospitality services in the basin, with the next largest provider having 5,000 beds or less and only six locations.
The Permian Basin segment generated 66.8% or $214.5 million of the company’s revenue for the year ended December 31, 2019. The map below shows the company’s primary community locations in the Permian Basin (including the Company’s one location in the Anadarko).
16
Bakken Basin
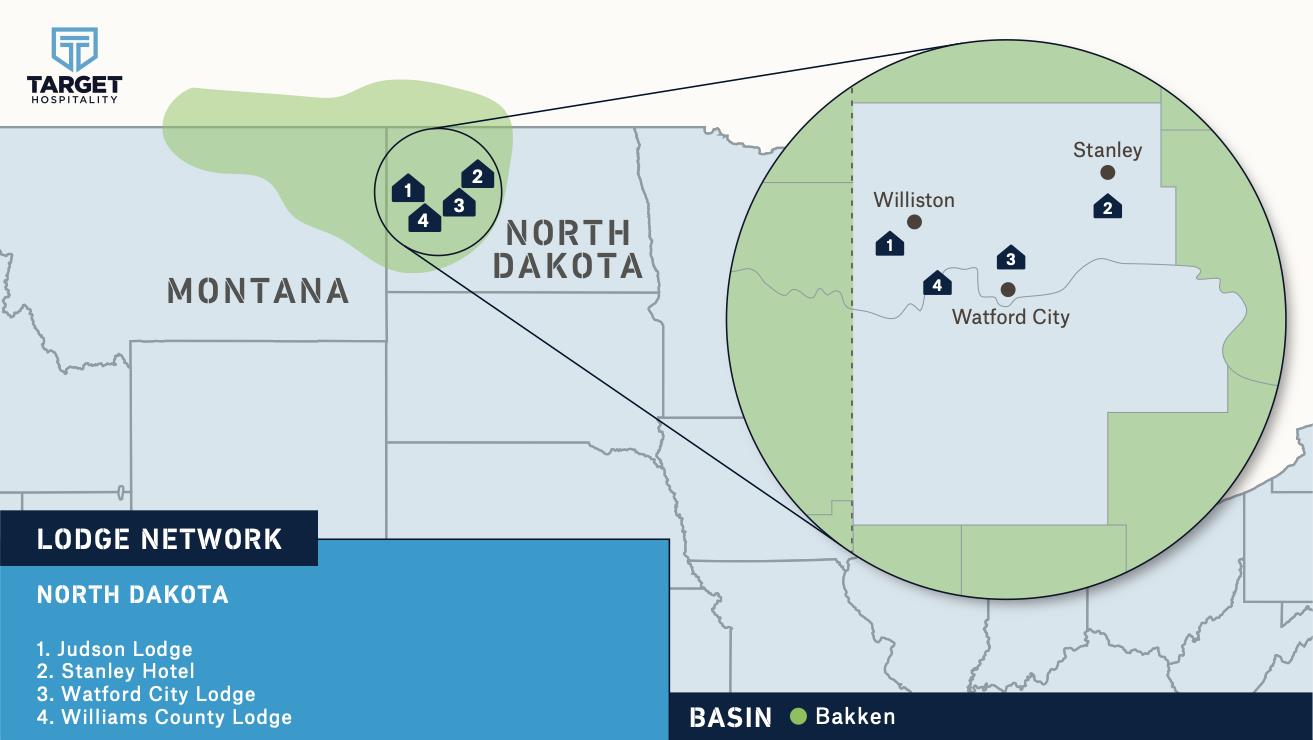
The Bakken Basin was the first of the unconventional oil regions to develop in the U.S. The Bakken Basin is one of the most prolific U.S. shale oil production formations to date. The basin spans territory in North Dakota, eastern Montana, and a small portion of northern South Dakota (in addition to portions in Saskatchewan and Manitoba in Canada). It is home to the Bakken Basin and Three Forks reservoirs and is often referred to simply as the Bakken Basin formation. North Dakota is home to most of the Bakken Basin production and has been the strongest growth area for many U.S. independent oil companies.
It was an older, conventional oil play that had endured several cycles, but had never really taken off in earnest. It followed on the tails of the shale gas boom and the advent of unconventional technology, particularly horizontal drilling and hydraulic fracturing. Experimental horizontal drilling, without fracking, was being done in the Bakken Basin in the 1990s.
The Bakken Basin drew attention and capital investment because operators were looking to find shale oil the same way they found shale gas, cracking open tight rocks and extracting oil.
The geology in the Bakken Basin was well known to geologists and was known for its vast reserves. It is a promising, clean and relatively simple geology in its structure. It is a large continuous oil accumulation with a simple Oreo cookie-like structure, with a layer of shale, sandstone, and then another layer of shale.
In 2009, Target entered the Bakken Basin market and built its first community in Williston, North Dakota for a large oilfield services company. The community was the first of its kind in the region and provided specialty rental and hospitality services for more than 150 remote rotational workers. As of December 31, 2019, Target Hospitality had four community locations and 1,079 rentable rooms serving the Bakken Basin. We are the largest specialty rental and
17
hospitality services provider in the region with approximately 50% of the market share with the next closest direct competitor having less than 15% of the market share.
The Bakken Basin segment generated 6.4% or $20.6 million of the company’s revenue for the year ended December 31, 2019. The map below shows the company’s primary community locations in the Bakken Basin.
Other
In addition to the three segments above, the company: (i) has facilities and operations for one community in the Anadarko Basin of Oklahoma; (ii) provides catering and other services to communities and other workforce accommodation facilities for the oil, gas and mining industries not owned by Target Hospitality (“Facilities Management”); and (iii) provides ongoing preparatory work and plans for facilities and services to be provided in connection with the TransCanada pipeline project.
The company provides specialty rental and hospitality services including concierge, culinary, catering, maintenance, security, janitorial and related services at facilities owned by other companies. We currently provide Facilities Management, culinary and catering services and site services for two facilities located in the Permian for which we do not own the specialty rental accommodation assets.
Future Pipeline Services Plans
We are contracted with TransCanada Pipelines (“TCPL”) to construct, deliver, cater and manage all accommodations and hospitality services in conjunction with the planned construction of the Keystone XL pipeline project. Our contract with TCPL was executed in 2013 and is currently pending full contract release, subject to TCPL’s final investment decision and formal notice to proceed. Our contract with TCPL is terminable at will by TCPL with ten days prior written notice and, in the event of such termination we are entitled to certain cancellation and termination fees for work performed prior to cancellation. In October 2018, we received partial release for certain pre-work related to the project and have commenced a limited scope of work based on work orders issued by TCPL.
18
The project is still pending a final investment decision by TCPL and, as a result, we cannot be certain that this project will commence in full on the expected timeline or at all.
This project continues to face legal challenges from various opposition groups. As a result, any adverse ruling or injunction from any current or future legal proceeding could adversely affect the timing and scope of work to be performed by the Company for TCPL in support of the Keystone XL project.
Segment information for December 31, 2018 and 2017
For additional information on our segments, including Government, Permian, Bakken, and Other, related to December 31, 2018 and 2017, refer to Note 25 of our audited consolidated financial statements located in Part II, Item 8 within this Annual Report on Form 10-K.
Customers and Competitors
Target Hospitality’s principal customers include investment grade oil and gas companies, energy infrastructure companies, and U.S. government and government contractors. For the year ended December 31, 2019, our largest customers were CoreCivic of Tennessee LLC and Halliburton, who accounted for approximately 20.8% and 12.5% of our revenues, respectively.
For the year ended December 31, 2019, our top five customers accounted for approximately 52% of our revenue.
For the year ended December 31, 2018, our largest customer was CoreCivic of Tennessee LLC, who accounted for approximately 27.7% of our revenues.
For the year ended December 31, 2017, our largest customers were CoreCivic of Tennessee LLC and Anadarko Petroleum Corporation who accounted for 50.5% and 11.8% of revenues, respectively.
Our primary competitors in the U.S. for our oil and gas segments are Cotton Logistics, Permian Lodging, Aries, and Civeo for temporary accommodations in the U.S. shale basins. For hospitality services and facilities management, our three primary competitors are: Sodexo, Aramark and Compass.
Our primary competitors in the Government segment are The GEO group and Management and Training Corporation (“MTC”).
The Company’s Community and Services Contracts
For the year ended December 31, 2019, revenue related to the Permian and Bakken regions represented 66.8% and 6.4% of our revenue, respectively, revenue related to our Government segment represented 20.9% of our revenue, and all other revenue represented less than 6% of our revenue.
Lease and Services Agreements
The company’s operations in the Permian and Bakken regions are primarily conducted through committed contractual arrangements with its customers. For certain of the company’s largest customers, it uses network lease and services agreements (“NLSAs”) which cover the customer’s full enterprise and are exclusive agreements with set terms and rates for all geographic regions in which the company operates. The NLSAs obligate the customers to use the company’s facilities and services across the U.S. The company’s NLSAs have an average set term of two to three years.
Certain other customers are subject to lease and services agreements (“LSAs”) which are more limited in geographic scope and cover only specified areas with the same structural commercial terms as the NLSAs. The LSAs have terms that range from six to thirty six months and generally do not have termination provisions in favor of the customer.
19
The company also has master services agreements (“MSAs”) with certain customers which are typically exclusive arrangements without the committed component of the NLSAs and LSAs and no minimum contractual liability for the customer.
CoreCivic
The company operates the South Texas Family Residential Center pursuant to a contractual arrangement with CoreCivic (the “CoreCivic Contract”). The CoreCivic Contract provides for the company’s sublease and ongoing operation of the South Texas Family Residential Center through September 2021. This facility, located in Dilley, Texas, is the largest family residential center in the U.S. and was built by the company in 2015. This facility has approximately 524,000 square feet of facilities on an 85-acre site. Target Hospitality leases the facilities to CoreCivic and provides onsite managed services including catering, culinary, facilities management, maintenance, and janitorial services of the common area facilities only.
The CoreCivic Contract depends on the U.S. government and its funding. Any impasse or delay in reaching a federal budget agreement, debt ceiling or government shut downs, and the subsequent lack of funding to the applicable government entity, could result in material payment delays, payment reductions or contract terminations. The government may terminate the contract with CoreCivic for convenience on 90 days’ notice; in the event this should occur, CoreCivic may terminate its agreement with Target upon 60 days’ notice.
Regulatory and Environmental Compliance
Our business and the businesses of the company’s customers can be affected significantly by federal, state, municipal and local laws and regulations relating to the oil, natural gas and mining industries, food safety and environmental protection. Changes in these laws, including more stringent regulations and increased levels of enforcement of these laws and regulations, and the development of new laws and regulations could impact the company’s business and result in increased compliance or operating costs associated with its or its customers’ operations.
To the extent that these laws and regulations impose more stringent requirements or increased costs or delays upon the company’s customers in the performance of their operations, the resulting demand for the company’s services by those customers may be adversely affected. Moreover, climate change laws or regulations could increase the cost of consuming, and thereby reduce demand for, oil and natural gas, which could reduce the company’s customers’ demand for its services. The company cannot predict changes in the level of enforcement of existing laws and regulations, how these laws and regulations may be interpreted or the effect changes in these laws and regulations may have on the company or its customers or on our future operations or earnings. The company also cannot predict the extent to which new laws and regulations will be adopted or whether such new laws and regulations may impose more stringent or costly restrictions on its customers or its operations.
Employees
As of December 31, 2019, Target Hospitality had approximately 826 employees. None of the Company’s employees are unionized or members of collective bargaining arrangements.
Intellectual Property
Target Hospitality owns a number of trademarks important to the business. Its material trademarks are registered or pending registration in the U.S. Patent and Trademark Office. The business operates primarily under the Target Hospitality brand.
20
Properties
Corporate Headquarters
Target Hospitality’s headquarters are located in The Woodlands, Texas. Its executive, financial, accounting, legal, administrative, management information systems and human resources functions operate from this single, leased office.
For a list of real property owned material to the operations of Target Hospitality, refer to Part I Item 2 within this Form 10-K.
Communities/Owned and Leased Real Estate
Target Hospitality operates 26 communities, of which it owns the underlying real property of 38%, leases the underlying real property of 31%, and both owns and leases the underlying real property of 4%. The remaining 12% are customer sites.
Legal Proceedings and Insurance
Target Hospitality is involved in various lawsuits, claims and legal proceedings, the majority of which arise out of the ordinary course of business. The nature of the company’s business is such that disputes occasionally arise with vendors including suppliers and subcontractors, and customers over contract specifications and contract interpretations among other things. The Company assesses these matters on a case-by-case basis as they arise. Reserves are established, as required, based on its assessment of exposure. Target Hospitality has insurance policies to cover general liability and workers’ compensation related claims. In the opinion of management, the ultimate amount of liability not covered by insurance, if any, under such pending lawsuits, claims and legal proceedings will not have a material adverse effect on its financial condition or results of operations. See the audited consolidated financial statements and the notes thereto of Target Hospitality Corp. located in Part II, Item 8 within this Annual Report on Form 10-K for additional information.
Available Information
Our website address is www.targethospitality.com. We make available, free of charge through our website, our Annual Report on Form 10-K, Quarterly Reports on Form 10-Q, Current Reports on Form 8-K and amendments to those reports filed or furnished pursuant to Section 13(a) or 15(d) of the Securities Exchange Act of 1934 (the “Exchange Act”) as soon as reasonably practicable after such documents are electronically filed with, or furnished to, the United States Securities and Exchange Commission (the “SEC”). The SEC maintains an internet website at www.sec.gov that contains reports, proxy and information statements and other information regarding Target Hospitality Corp.
21
Operational Risks
Our operations are and will be exposed to operational, economic, political and regulatory risks.
Our operations could be affected by economic, political and regulatory risks. These risks include:
multiple regulatory requirements that are subject to change and that could restrict our ability to build and operate our communities and other sites;
inflation, recession, fluctuations in interest rates;
compliance with applicable export control laws and economic sanctions laws and regulations;
trade protection measures, including increased duties and taxes, and import or export licensing requirements;
ownership regulations;
compliance with applicable antitrust and other regulatory rules and regulations relating to potential future acquisitions;
different local product preferences and product requirements;
pressures on management time and attention due to the complexities of overseeing diverse operations;
challenges in maintaining, staffing and managing national operations;
different labor regulations;
potentially adverse consequences from changes in or interpretations of tax laws;
political and economic instability;
enforcement of remedies in various jurisdictions;
the risk that the business partners upon whom we depend for technical assistance or management and acquisition expertise will not perform as expected;
differences in business practices that may result in violation of our policies including but not limited to bribery and collusive practices.
These and other risks could have a material adverse effect on our business, results of operations and financial condition.
We face significant competition as a provider of specialty rental and hospitality services in the specialty rental sector. If we are unable to compete successfully, we could lose customers and our revenue and profitability could decline.
Although our competition varies significantly by market, the specialty rental and hospitality services industry, in general, is highly competitive. We compete on the basis of a number of factors, including equipment availability, quality, price, service, reliability, appearance, functionality and delivery terms. We may experience pricing pressures in our operations in the future as some of our competitors seek to obtain market share by reducing prices. We may also face reduced demand for our products and services if our competitors are able to provide new or innovative products or services that better appeal to our potential customers. In each of our current markets, we face competition from national, regional and local
22
companies who have an established market position in the specific service area. We expect to encounter similar competition in any new markets that we may enter. Some of our competitors may have greater market share, less indebtedness, greater pricing flexibility, more attractive product or service offerings, or superior marketing and financial resources. Increased competition could result in lower profit margins, substantial pricing pressure, and reduced market share. Price competition, together with other forms of competition, may materially adversely affect our business, results of operations, and financial condition.
We depend on several significant customers. The loss of one or more such customers or the inability of one or more such customers to meet their obligations could adversely affect our results of operations.
We depend on several significant customers. The majority of our customers operate in the energy industry. For a more detailed explanation of our customers, see the section of this Annual Report on Form 10-K entitled “Business.” The loss of any one of our largest customers in any of our business segments or a sustained decrease in demand by any of such customers could result in a substantial loss of revenues and could have a material adverse effect on our results of operations. In addition, the concentration of customers in the industries in which we operate may impact our overall exposure to credit risk, either positively or negatively, in that customers may be similarly affected by changes in economic and industry conditions.
As a result of our customer concentration, risks of nonpayment and nonperformance by our counterparties are a concern in our business. We are subject to risks of loss resulting from nonpayment or nonperformance by our customers. Many of its customers finance their activities through cash flow from operations, the incurrence of debt, or the issuance of equity. Additionally, many of our customers’ equity values have declined and could decline further. The combination of lower cash flow due to commodity prices, a reduction in borrowing bases under reserve-based credit facilities, and the lack of available debt or equity financing may continue to result in a significant reduction in our customers’ liquidity and could impair their ability to pay or otherwise perform on their obligations. Furthermore, some of our customers may be highly leveraged and subject to their own operating and regulatory risks, which increases the risk that they may default on their obligations to us. The inability or failure of our significant customers to meet their obligations to us or their insolvency or liquidation may adversely affect our financial results.
Our business depends on the quality and reputation of the Company and its communities, and any deterioration in such quality or reputation could adversely impact its market share, business, financial condition or results of operations.
Many factors can influence our reputation and the value of our communities, including quality of services, food quality and safety, availability and management of scarce natural resources, supply chain management, diversity, human rights and support for local communities. In addition, events that may be beyond our control could affect the reputation of one or more of its communities or more generally impact the reputation of the Company, including protests directed at government immigration policies, violent incidents at one or more communities or other sites or criminal activity. Reputational value is also based on perceptions, and broad access to social media makes it easy for anyone to provide public feedback that can influence perceptions of Target Hospitality and its communities, and it may be difficult to control or effectively manage negative publicity, regardless of whether it is accurate. While reputations may take decades to build, negative incidents can quickly erode trust and confidence, particularly if they result in adverse mainstream and social media publicity, governmental investigations or penalties, or litigation. Negative incidents could lead to tangible adverse effects on our business, including customer boycotts, loss of customers, loss of development opportunities or employee retention and recruiting difficulties. A decline in the reputation or perceived quality of our communities or corporate image could negatively affect its market share, reputation, business, financial condition or results of operations. (See “Risk Factors—Public resistance and potential legal challenges to, and increasing scrutiny of, the use of family residential facilities like our South Texas Residential Center could affect our ability to obtain new contracts or result in the loss of existing contracts and negatively impact our brand or reputation, each of which could have a material adverse effect on our business, financial condition and results of operations)
23
We derive a substantial portion of our revenue from the operation of the South Texas Family Residential Center for the U.S. government through a subcontract with a government contractor. The loss of, or a significant decrease in revenues from, this customer could seriously harm our financial condition and results of operations.
We derive a significant portion of our revenues from our subcontract with a government contractor for the operation of the South Texas Family Residential Center for the U.S. government. These revenues depend on the U.S. government and its contractors receiving sufficient funding and providing it with timely payment under the terms of our contract. If the applicable government entity does not receive sufficient appropriations to cover its contractual obligations, it may delay or reduce payment to its contractors and, as a result, our government contractor customer may delay or reduce payments to or terminate its contract with us. Any future impasse or struggle impacting the federal government’s ability to reach agreement on the federal budget, debt ceiling or any future federal government shut downs could result in material payment delays, payment reductions or contract terminations. Additionally, our current and potential future government contractor customers may request in the future that we reduce our contract rates or forego increases to those rates as a way for those contractors to control costs and help their government customers to control their spending and address their budgetary shortfalls. For additional information regarding our operation of the South Texas Family Residential Center, see “Business—Business Operations—Government Services” elsewhere in this Annual Report on Form 10-K.
The U.S. government and, by extension, our U.S. government contractor customer, may also from time to time adopt, implement or modify certain policies or directives that may adversely affect our business. For example, while the U.S. government is currently using private immigration detention sites like the South Texas Family Residential Center, federal, state or local governmental partners may in the future choose to undertake a review of their utilization of privately operated facilities, or may cancel or decide not to renew existing contracts with their government contractors, who may, in turn, cancel or decide not to renew their contracts with us. Changes in government policy, the election of a new administration or other changes in the political landscape relating to immigration policies may similarly result in a decline in our revenues in the Government Services segment. In addition, lawsuits, to which we are not a party, have challenged the U.S. government’s policy of detaining migrant families, and government policies with respect to family immigration may impact the demand for the South Texas Family Residential Center and any facilities that we may operate in the future. Any court decision or government action that impacts our existing contract for the South Texas Family Residential Center or any future contracts for similar facilities could materially affect our cash flows, financial condition and results of operations. Our current agreement with this government contractor is scheduled to expire on September 22, 2021. We may not be able to renew our agreement with the government contractor or enter new agreements with this contractor. Further, any renewal or new agreement we may enter with this contractor may be on terms that are materially less favorable to us than those in our current agreement.
Public resistance and potential legal challenges to, and increasing scrutiny of, the use of family residential facilities like our South Texas Residential Center could affect our ability to obtain new contracts or result in the loss of existing contracts and negatively impact our brand or reputation, each of which could have a material adverse effect on our business, financial condition and results of operations.
The management and operation of facilities like our South Texas Residential Center through the government’s use of private contractors and subcontractors has not achieved complete acceptance by either government agencies or the public. Some governmental agencies have limitations on their ability to delegate their traditional management responsibilities for such facilities to private companies or they may be instructed by a governmental agency or authority overseeing them to reduce their utilization or scope of private companies or undertake additional reviews of their public-private relationships. Additional legislative or policy changes or prohibitions could occur that further increase these limitations or instructions. In addition, the movement toward using private companies to manage and operate these facilities has encountered resistance from groups which believe that these facilities should only be operated by governmental agencies. For example, JP Morgan Chase, Wells Fargo and Bank of America recently announced that they will not be renewing existing agreements or entering into new agreements with companies that operate such facilities. Bank of America, N.A. serves as the administrative and collateral agent for our New ABL Facility and is a lender thereunder. Upon expiration of the New ABL Facility, Bank of America or other banks that currently provide us with financing could decide not to provide financing, which could adversely affect our ability to refinance the New ABL Facility on acceptable terms or at all.
24
Increased public resistance, including negative media attention and public opinion, to the use of private companies for the management and operation of facilities like our South Texas Residential Center, and to the Trump administration’s immigration policies overall, may negatively impact our brand and the public perception of our company. Maintaining and promoting our brand will depend largely on our ability to differentiate ourselves from the direct participants in the ongoing conflict around immigration policy. If we continue to be portrayed negatively in the press, or associated with the ongoing social and political debates around immigration policy, our public image and reputation could be irreparably tarnished and our brand could be harmed. If we are unable to counter such negative media attention effectively, investors may lose confidence in our business, which could result in a decline in the trading price of our common stock, and our business could be materially adversely affected.
Furthermore, providing family residential services at the South Texas Residential Center subjects us and our government contractor customers to unique risks such as unanticipated increased costs and litigation that could materially adversely affect our or their business, financial condition, or results of operations. For example, the contractual arrangements between the U.S. government and the government’s private contractors, with whom we subcontract, mandate resident-to-staff ratios that are higher than the typical contract, require services unique to the contract (e.g. child care and primary education services), and limit the use of security protocols and techniques typically utilized in correctional and detention settings. These operational risks and others associated with privately managing this type of residential facility could result in higher costs associated with staffing and lead to increased litigation. Numerous lawsuits, to which we are not a party, have challenged the government's policy of detaining migrant families, and government policies with respect to family immigration may impact the demand for the South Texas Family Residential Center. Any court decision or government action that impacts our customer’s existing contract with the government for the South Texas Family Residential Center could impact our subcontract for the facility and result in a reduction in demand for our services or reputational damage to us, and require use to devote a significant amount of time and expense to the defense of our operations and reputation, which could materially affect our business, financial condition, and results of operations.
Our oil and gas customers are exposed to a number of unique operating risks and challenges which could also adversely affect us.
We could be impacted by disruptions to our customers’ operations caused by, among other things, any one of or all of the following singularly or in combination:
U.S. and international pricing and demand for the natural resources being produced at a given project (or proposed project);
unexpected problems, higher costs and delays during the development, construction, and project start-up which may delay the commencement of production;
unforeseen and adverse geological, geotechnical, and seismic conditions;
lack of availability of sufficient water or power to maintain their operations;
lack of availability or failure of the required infrastructure necessary to maintain or to expand their operations;
the breakdown or shortage of equipment and labor necessary to maintain their operations;
risks associated with the natural resource industry being subject to various regulatory approvals. Such risks may include a government agency failing to grant an approval or failing to renew an existing approval, or the approval or renewal not being provided by the government agency in a timely manner or the government agency granting or renewing an approval subject to materially onerous conditions. For example, the Keystone XL project requires various permits from state and federal authorities that have been delayed as a result of various legal and regulatory challenges;
risks to land titles and use thereof as a result of native title claims;
25
interruptions to the operations of our customers caused by industrial accidents or disputes; and
delays in or failure to commission new infrastructure in timeframes so as not to disrupt customer operations.
We may face opposition to our communities and planned communities along the Keystone XL pipeline route from various groups, including the indigenous people in these areas.
We may face opposition to the construction and operation of our facilities along the Keystone XL pipeline from environmental groups, landowners, tribal groups, local groups and other advocates. Such opposition could take many forms, including organized protests, attempts to block or sabotage our operations, intervention in regulatory or administrative proceedings involving our facilities, or lawsuits or other actions designed to prevent, disrupt or delay the operation of our facilities. For example, acts of sabotage or other disruptions at or around our communities could cause significant damage or injury to people, property or the environment or lead to extended interruptions of our operations. Any such event that interrupts the revenues generated by our operations, or which causes us to have to make significant expenditures not covered by insurance, could materially adversely affect our business, financial condition and results of operations.
A component of our business strategy is based on developing and maintaining positive relationships with the indigenous people and communities in the areas where we operate. These relationships are important to our operations and customers who desire to work on traditional Native American lands. The inability to develop and maintain relationships and to be in compliance with local requirements could have a material adverse effect on our business, results of operations or financial condition.
We may be adversely affected if customers reduce their specialty rental and hospitality services outsourcing.
Our business and growth strategies depend in large part on customers outsourcing some or all of the services that we provide. We cannot be certain that these customer preferences for outsourcing will continue or that customers that have outsourced accommodations will not decide to perform these functions themselves or only outsource accommodations during the development or construction phases of their projects. In addition, labor unions representing customer employees and contractors may oppose outsourcing accommodations to the extent that the unions believe that third-party accommodations negatively impact union membership and recruiting. The reversal or reduction in customer outsourcing of accommodations could negatively impact our financial results and growth prospects.
Our failure to retain our current customers, renew existing customer contracts, and obtain new customer contracts, or the termination of existing contracts, could adversely affect our business.
Our success depends on our ability to retain our current customers, renew or replace our existing customer contracts, and obtain new business. Our ability to do so generally depends on a variety of factors, including overall customer expenditure levels and the quality, price and responsiveness of our services, as well as its ability to market these services effectively and differentiate itself from its competitors. We cannot assure you that we will be able to obtain new business, renew existing customer contracts at the same or higher levels of pricing, or at all, or that our current customers will not turn to competitors, cease operations, elect to self-operate, or terminate contracts with us. In the context of a potential depressed commodity price environment, our customers may not renew contracts on terms favorable to it or, in some cases, at all, and we may have difficulty obtaining new business. Additionally, several contracts have clauses that allow termination upon the payment of a termination fee. As a result, our customers may choose to terminate their contracts. The likelihood that a customer may seek to terminate a contract is increased during periods of market weakness. Further, certain of our customers may not reach positive final investment decisions on projects with respect to which we have been awarded contracts to provide related accommodation, which may cause those customers to terminate the contracts. Customer contract cancellations, the failure to renew a significant number of our existing contracts, or the failure to obtain new business would have a material adverse effect on our business, results of operations and financial condition.
26
If we do not effectively manage our credit risk or collect on our accounts receivable, it could have a material adverse effect on our business, financial condition, and results of operations.
Failure to manage our credit risk and receive timely payments on our customer accounts receivable may result in the write-off of customer receivables. If we are not able to manage credit risk, or if a large number of customers should have financial difficulties at the same time, our credit and equipment losses would increase above historical levels. If this should occur, our business, financial condition, and results of operations may be materially and adversely affected.
Our operations could be subject to natural disasters and other business disruptions, which could materially adversely affect our future revenue and financial condition and increase its costs and expenses.
Our operations could be subject to natural disasters and other business disruptions such as fires, floods, hurricanes, earthquakes, outbreaks of epidemic or pandemic disease (such as the novel coronavirus outbreak) and terrorism, which could adversely affect its future revenue and financial condition and increase its costs and expenses. For example, extreme weather, particularly periods of high rainfall, hail, tornadoes, or extreme cold, in any of the areas in which we operate may cause delays in our community construction activities or result in the cessation of customer operations at one or more communities for an extended period of time. See “Risk Factors—We are exposed to various possible claims relating to our business and our insurance may not fully protect us.” See “[Management’s Discussion and Analysis of Financial Condition and Results of Operations—Factors Affecting Results of Operations—Natural Disasters or Other Significant Disruption.]” In addition, the occurrence and threat of terrorist attacks may directly or indirectly affect economic conditions, which could in turn adversely affect demand for our communities and services. In the event of a major natural or man-made disaster, we could experience loss of life of our employees, destruction of our communities or other sites, or business interruptions, any of which may materially adversely affect our business. If any of our communities were to experience a catastrophic loss, it could disrupt our operations, delay services, staffing and revenue recognition, and result in expenses to repair or replace the damaged facility not covered by asset, liability, business continuity or other insurance contracts. Also, we could face significant increases in premiums or losses of coverage due to the loss experienced during and associated with these and potential future natural or man-made disasters that may materially adversely affect our business. In addition, attacks or armed conflicts that directly impact one or more of our properties or facilities could significantly affect our ability to operate those properties or communities and thereby impair our results of operations.
More generally, any of these events could cause consumer confidence and spending to decrease or result in increased volatility in the global economy and worldwide financial markets. Any of these occurrences could have a material adverse effect on our business, results of operations and financial condition.
Construction risks exist which may adversely affect our results of operations.
There are a number of general risks that might impinge on companies involved in the development, construction and installation of facilities as a prerequisite to the management of those assets in an operational sense. We are exposed to the following risks in connection with our construction activities:
the construction activities of our accommodations are partially dependent on the supply of appropriate construction and development opportunities;
development approvals, slow decision making by counterparties, complex construction specifications, changes to design briefs, legal issues, and other documentation changes may give rise to delays in completion, loss of revenue, and cost over-runs which may, in turn, result in termination of accommodation supply contracts;
other time delays that may arise in relation to construction and development include supply of labor, scarcity of construction materials, lower than expected productivity levels, inclement weather conditions, land contamination, cultural heritage claims, difficult site access, or industrial relations issues;
objections to our activities or those of our customers aired by aboriginal or community interests, environment and/or neighborhood groups which may cause delays in the granting or approvals and/or the overall progress
27
of a project (See “Risk Factors—We may face opposition to our communities and planned communities along the Keystone XL pipeline route from various groups);
where we assume design responsibility, there is a risk that design problems or defects may result in rectification and/or costs or liabilities which we cannot readily recover; and
there is a risk that we may fail to fulfill our statutory and contractual obligations in relation to the quality of our materials and workmanship, including warranties and defect liability obligations.
Due to the nature of the natural resources industry, our business may be adversely affected by periods of low oil, or natural gas prices or unsuccessful exploration results may decrease customers’ spending and therefore our results.
Commodity prices have been and are expected to remain volatile. This volatility causes oil and gas companies to change their strategies and expenditure levels. Prices of oil and natural gas can be influenced by many factors, including reduced demand due to lower global economic growth, surplus inventory, improved technology such as the hydraulic fracturing of horizontally drilled wells in shale discoveries, access to potential productive regions, and availability of required infrastructure to deliver production to the marketplace. For example, when there is a significant drop in the price of oil as a result of reduced demand in global markets and oversupply, our oil and gas customers are likely to reduce expenditures, reduce rig counts, and cut costs which in turn, may result in lower occupancy in our facilities.
The carrying value of our communities could be reduced by extended periods of limited or no activity by its customers, which would require us to record impairment charges equal to the excess of the carrying value of the communities over fair value. We may incur asset impairment charges in the future, which charges may affect negatively our results of operations and financial condition.
Demand for our products and services is sensitive to changes in demand within a number of key industry end-markets and geographic regions.
Our financial performance is dependent on the level of demand for our facilities and services, which is sensitive to the level of demand within various sectors, in particular, the energy and natural resources and government end-markets. Each of these sectors is influenced not only by the state of the general global economy but by a number of more specific factors as well. For example, demand for workforce accommodations within the energy and resources sector may be materially adversely affected by a decline in global energy prices. Demand for our facilities and services may also vary among different localities or regions. The levels of activity in these sectors and geographic regions may also be cyclical, and we may not be able to predict the timing, extent or duration of the activity cycles in the markets in which we or our key customers operate. A decline or slowed growth in any of these sectors or geographic regions could result in reduced demand for our products and services, which may materially adversely affect our business, results of operations, and financial condition.
Decreased customer expenditure levels could adversely affect our results of operations.
Demand for our services is sensitive to the level of exploration, development and production activity of, and the corresponding capital spending by, oil and gas companies. The oil and gas industries’ willingness to explore, develop, and produce depends largely upon the availability of attractive resource prospects and the prevailing view of future commodity prices. Prices for oil and gas are subject to large fluctuations in response to changes in the supply of and demand for these commodities, market uncertainty, and a variety of other factors that are beyond our control. Accordingly, a sudden or long-term decline in commodity pricing would have a material adverse effect on our business, results of operations and financial condition.
Additionally, the potential imposition of new regulatory requirements, including climate change legislation, could have an impact on the demand for and the cost of producing oil and natural gas in the regions where we operate. Many factors affect the supply of and demand for oil, natural gas and other resources and, therefore, influence product prices, including:
the level of activity in US shale development;
28
the availability of economically attractive oil and natural gas field prospects, which may be affected by governmental actions or environmental activists which may restrict development;
the availability of transportation infrastructure for oil and natural gas, refining capacity and shifts in end-customer preferences toward fuel efficiency and the use of natural gas;
global weather conditions and natural disasters;
worldwide economic activity including growth in developing countries, such as China and India;
national government political requirements, including the ability of the Organization of Petroleum Exporting Companies (“OPEC”) to set and maintain production levels and prices for oil and government policies which could nationalize or expropriate oil and natural gas exploration, production, refining or transportation assets;
the level of oil and gas production by non-OPEC countries;
rapid technological change and the timing and extent of energy resource development, including liquid natural gas or other alternative fuels;
environmental regulation; and
U.S. and foreign tax policies.
Our business is contract intensive and may lead to customer disputes or delays in receipt of payments.
Our business is contract intensive and we are party to many contracts with customers. We periodically review our compliance with contract terms and provisions. If customers were to dispute our contract determinations, the resolution of such disputes in a manner adverse to our interests could negatively affect sales and operating results. In the past, our customers have withheld payment due to contract or other disputes, which has delayed our receipt of payments. While we do not believe any reviews, audits, delayed payments, or other such matters should result in material adjustments, if a large number of our customer arrangements were modified or payments withheld in response to any such matter, the effect could be materially averse to our business or results of operations.
Certain of our major communities are located on land subject to leases. If we are unable to renew a lease, we could be materially and adversely affected.
Certain of our major communities are located on land subject to leases. Accordingly, while we own the accommodations assets, we only own a leasehold interest in those properties. If we are found to be in breach of a lease, we could lose the right to use the property. In addition, unless we can extend the terms of these leases before their expiration, as to which no assurance can be given, we will lose our right to operate our facilities located on these properties upon expiration of the leases. In that event, we would be required to remove our accommodations assets and remediate the site. [Generally, our leases have an average term of three years and generally contain unilateral renewal provisions for up to seven additional years.] We can provide no assurances that we will be able to renew our leases upon expiration on similar terms, or at all. If we are unable to renew leases on similar terms, it may have an adverse effect on our business.
Third parties may fail to provide necessary services and materials for our communities and other sites.
We are often dependent on third parties to supply services and materials for our communities and other sites. We typically do not enter into long-term contracts with third-party suppliers. We may experience supply problems as a result of financial or operating difficulties or the failure or consolidation of our suppliers. We may also experience supply problems as a result of shortages and discontinuations resulting from product obsolescence or other shortages or allocations by suppliers. Unfavorable economic conditions may also adversely affect our suppliers or the terms on which we purchase products. In the future, we may not be able to negotiate arrangements with third parties to secure products and services that we require
29
in sufficient quantities or on reasonable terms. If we cannot negotiate arrangements with third parties to produce our products or if the third parties fail to produce our products to our specifications or in a timely manner, our business, results of operations, and financial condition may be materially adversely affected.
It may become difficult for us to find and retain qualified employees, and failure to do so could impede our ability to execute our business plan and growth strategy.
One of the most important factors in our ability to provide reliable and quality services and profitably execute our business plan is our ability to attract, develop and retain qualified personnel. The competition for qualified personnel in the industries in which we operate is intense and there can be no assurance that we will be able to continue to attract and retain all personnel necessary for the development and operation of our business. In periods of higher activity, it may become more difficult to find and retain qualified employees which could limit growth, increase operating costs, or have other material adverse effects on our operations.
Many of our key executives, managers, and employees have knowledge and an understanding of our business and our industry that cannot be readily duplicated and they are the key individuals that interface with customers. In addition, the ability to attract and retain qualified personnel is dependent on the availability of qualified personnel, the impact on the labor supply due to general economic conditions, and the ability to provide a competitive compensation package.
In addition, labor shortages, the inability to hire or retain qualified employees nationally, regionally or locally or increased labor costs could have a material adverse effect on our ability to control expenses and efficiently conduct operations. We may not be able to continue to hire and retain the sufficiently skilled labor force necessary to operate efficiently and to support our operating strategies. Labor expenses could also increase as a result of continuing shortages in the supply of personnel. Failure to retain key personnel or hire qualified employees may materially adversely affect our business, results of operations and financial condition.
Significant increases in raw material and labor costs could increase our operating costs significantly and harm our profitability.
We incur labor costs and purchase raw materials, including steel, lumber, siding and roofing, fuel and other products to construct and perform periodic repairs, modifications and refurbishments to maintain physical conditions of our facilities as well as the construction of our communities and other sites. The volume, timing, and mix of such work may vary quarter-to-quarter and year-to-year. Generally, increases in labor and raw material costs will increase the acquisition costs of new facilities and also increase the construction, repair, and maintenance costs of our facilities. During periods of rising prices for labor or raw materials, and in particular, when the prices increase rapidly or to levels significantly higher than normal, we may incur significant increases in our costs for new facilities and incur higher operating costs that we may not be able to recoup from customers through changes in pricing, which could have a material adverse effect on our business, results of operations and financial condition.
If we determine that our goodwill and intangible assets have become impaired, we may incur impairment charges, which would negatively impact our operating results.
We have goodwill, which represents the excess of the total purchase price of our acquisitions over the fair value of the assets acquired, and other intangible assets. As of December 31, 2019, we had approximately $41.0 million and $117.9 million of goodwill and other intangible assets, net, respectively, in our statement of financial position, which would represent approximately 6.9% and 19.7% of total assets, respectively. We are required to review goodwill and intangible assets at least annually for impairment. In the event impairment is identified, a charge to earnings would be recorded. Impairment may result from significant changes in the manner of use of the acquired asset, negative industry or economic trends and significant underperformance relative to historic or projected operating results. Any impairment charges could adversely affect our business, results of operations, and financial condition.
30
Increased operating costs and obstacles to cost recovery due to the pricing and cancellation terms of our specialty rental and hospitality services contracts may constrain its ability to make a profit.
Our profitability can be adversely affected to the extent we are faced with cost increases for food, wages and other labor related expenses, insurance, fuel and utilities, especially to the extent we are unable to recover such increased costs through increases in the prices for our services, due to one or more of general economic conditions, competitive conditions or contractual provisions in our customer contracts. Substantial increases in the cost of fuel and utilities have historically resulted in cost increases in our communities. From time to time we have experienced increases in our food costs. While we believe a portion of these increases were attributable to fuel prices, we believe the increases also resulted from rising global food demand. In addition, food prices can fluctuate as a result of foreign exchange rates and temporary changes in supply, including as a result of incidences of severe weather such as droughts, heavy rains, and late freezes. We may be unable to fully recover costs, and such increases would negatively impact its profitability on contracts that do not contain such inflation protections.
Our future operating results may fluctuate, fail to match past performance, or fail to meet expectations.
Our operating results may fluctuate, fail to match past performance, or fail to meet the expectations of analysts and investors. Our financial results may fluctuate as a result of a number of factors, some of which are beyond our control, including but not limited to:
general economic conditions in the geographies and industries where we own or operate communities;
|
· |
legislative policies where we provide our services; |
the budgetary constraints of our customers;
the success of our strategic growth initiatives;
the costs associated with the launching or integrating new or acquired businesses;
the cost, type, and timing of customer orders;
the nature and duration of the needs of our customers;
the raw material or labor costs of servicing our facilities;
the timing of new product or service introductions by us, our suppliers, and our competitors;
changes in end-user demand requirements;
the mix, by state and region, of our revenue, personnel, and assets;
movements in interest rates, or tax rates;
changes in, and application of, accounting rules;
changes in the regulations applicable to us;
litigation matters;
the success of large scale capital intensive projects;
liquidity, including the impact of our debt service costs; and
31
attrition and retention risk.
As a result of these factors, our historical financial results are not necessarily indicative of our future results.
We are exposed to various possible claims relating to our business, and our insurance may not fully protect us.
We are exposed to various possible claims relating to our business, and our operations are subject to many hazards. In the ordinary course of business, we may become the subject of various claims, lawsuits, and administrative proceedings seeking damages or other remedies concerning our commercial operations, products, employees, and other matters, including occasional claims by individuals alleging exposure to hazardous materials as a result of our products or operations. Some of these claims relate to the activities of businesses that we have acquired, even though these activities may have occurred prior to our acquisition of such businesses.
Our insurance policies have deductibles or self-insured retentions which would require us to expand amounts prior to taking advantage of coverage limits. We believe that we have adequate insurance coverage for the protection of our assets and operations. However, our insurance may not fully protect us for certain types of claims such as dishonest, fraudulent, criminal or malicious acts; terrorism, war, hostile or warlike action during a time of peace; automobile physical damage; natural disasters; and cyber-crime. A judgment could be rendered against us in cases in which we could be uninsured and beyond the amounts that we currently have reserved or anticipate incurring for such matters. Even a partially uninsured or underinsured claim, if successful and of significant size, could have a material adverse effect on our results of operations or consolidated financial position. The specifications and insured limits under those policies, however, may be insufficient for such claims. We also face the following other risks related to our insurance coverage:
|
· |
we may not be able to continue to obtain insurance on commercially reasonable terms; |
|
· |
the counterparties to our insurance contracts may pose credit risks; and |
|
· |
we may incur losses from interruption of our business that exceed our insurance coverage each of which, individually or in the aggregate, could materially and adversely impact our business |
Further, due to rising insurance costs and changes in the insurance markets, we cannot provide any assurance that our insurance coverage will continue to be available at all or at rates or on terms similar to those presently available.
Social, Political, and Regulatory Risks
A failure to maintain food safety or comply with government regulations related to food and beverages may subject us to liability.
Claims of illness or injury relating to food quality or food handling are common in the food service industry, and a number of these claims may exist at any given time. Because food safety issues could be experienced at the source or by food suppliers or distributors, food safety could, in part, be out of our control. Regardless of the source or cause, any report of food-borne illness or other food safety issues such as food tampering or contamination at one of our locations could adversely impact our reputation, hindering our ability to renew contracts on favorable terms or to obtain new business, and have a negative impact on our sales. Future food product recalls and health concerns associated with food contamination may also increase our raw materials costs and, from time to time, disrupt its business.
A variety of regulations at various governmental levels relating to the handling, preparation, and serving of food (including, in some cases, requirements relating to the temperature of food), and the cleanliness of food production facilities and the hygiene of food-handling personnel are enforced primarily at the local public health department level. We cannot assure you that we are in full compliance with all applicable laws and regulations at all times or that we will be able to comply with any future laws and regulations. Furthermore, legislation and regulatory attention to food safety is very high. Additional or amended regulations in this area may significantly increase the cost of compliance or expose us to liabilities.
32
If we are unable to maintain food safety or comply with government regulations related to food and beverages, the effect could be materially averse to our business or results of operations.
Unanticipated changes in our tax obligations, the adoption of a new tax legislation, or exposure to additional income tax liabilities could affect profitability.
We are subject to income taxes in the United States. Our tax liabilities are affected by the amounts charged for inventory, services, funding, and other intercompany transactions. Tax authorities may disagree with our intercompany charges, cross-jurisdictional transfer pricing or other tax positions and assess additional taxes. We regularly assess the likely outcomes of examinations in order to determine the appropriateness of its tax provision. However, there can be no assurance that we will accurately predict the outcomes of potential examinations, and the amounts ultimately paid upon resolution of examinations could be materially different from the amounts previously included in our income tax provision and, therefore, could have a material impact on its results of operations and cash flows. In addition, our future effective tax rate could be adversely affected by changes to its operating structure, changes in the mix of earnings in countries and/or states with differing statutory tax rates, changes in the valuation of deferred tax assets and liabilities, changes in tax laws, and the discovery of new information in the course of our tax return preparation process.
Our ability to use our net operating loss carryforwards and other tax attributes may be limited.
As of December 31, 2019, we had U.S. net operating loss (“NOL”) carryforwards of approximately $71.6 million for U.S. federal and state income tax purposes, available to offset future taxable income, prior to consideration of annual limitations that may be imposed under Section 382 (“Section 382”) of the Internal Revenue Code of 1986, as amended (the “Code”). Approximately $1.3 million of these tax loss carryovers expire in 2038. The remaining $70.3 million of tax loss carryovers do not expire.
Our NOL is limited and could expire unused and be unavailable to offset future income tax liabilities. Under Section 382 and corresponding provisions of U.S. state law, if a corporation undergoes an “ownership change,” generally defined as a greater than 50% change, by value, in its equity ownership over a three-year period, the corporation’s ability to use its pre-change NOLs and other applicable pre-change tax attributes, such as research and development tax credits, to offset its post-change income may be limited. We have not completed a Section 382 analysis and therefore cannot forecast or otherwise determine our ability to derive any benefit from our various federal or state tax attribute carryforwards at this time. As a result, if we earn net taxable income, our ability to use our pre-change NOL carryforwards to offset U.S. federal taxable income may be subject to limitations, which could potentially result in increased future tax liability to us. In addition, at the state level, there may be periods during which the use of NOLs is suspended or otherwise limited, which could accelerate or permanently increase state taxes owed.
Lastly, we may experience ownership changes in the future as a result of subsequent shifts in our share ownership, some of which may be outside of our control. If we determine that an ownership change has occurred and our ability to use our historical NOL is materially limited, it may result in increased future tax obligations.
We may be unable to recognize deferred tax assets and, as a result, lose future tax savings, which could have a negative impact on our liquidity and financial position.
We recognize deferred tax assets primarily related to deductible temporary differences based on our assessment that the item will be utilized against future taxable income and the benefit will be sustained upon ultimate settlement with the applicable taxing authority. Such deductible temporary differences primarily relate to tax loss carryforwards and deferred tax depreciation and deferred revenue. Tax loss carryforwards arising in a given tax jurisdiction may be carried forward to offset taxable income in future years from such tax jurisdiction and reduce or eliminate income taxes otherwise payable on such taxable income, subject to certain limitations. We may have to write down, via a valuation allowance, the carrying amount of certain of the deferred tax assets to the extent we determine it is not probable such deferred tax assets will continue to be recognized
In the event that we do not have sufficient taxable income in future years to use the tax benefits before they expire, the benefit may be permanently lost. In addition, the taxing authorities could challenge our calculation of the amount of our
33
tax attributes, which could reduce certain of our recognized tax benefits. In addition, tax laws in certain jurisdictions may limit the ability to use carryforwards upon a change in control.
We are subject to various laws and regulations including those governing our contractual relationships with the U.S. government and U.S. government contractors and the health and safety of our workforce and our customers. Obligations and liabilities under these laws and regulations may materially harm our business.
Our customers include U.S. government contractors, which means that we may, indirectly, be subject to various statutes and regulations applicable to doing business with the U.S. government. These types of contracts customarily contain provisions that give the U.S. government substantial rights and remedies, many of which are not typically found in commercial contracts and which are unfavorable to contractors, including provisions that allow the government to unilaterally terminate or modify our customers’ federal government contracts, in whole or in part, at the government’s convenience. Under general principles of U.S. government contracting law, if the government terminates a contract for convenience, the terminated party may generally recover only its incurred or committed costs and settlement expenses and profit on work completed prior to the termination. If the government terminates a contract for default, the defaulting party may be liable for any extra costs incurred by the government in procuring undelivered items from another source. In addition, our or our customers’ failure to comply with these laws and regulations might result in administrative penalties or the suspension of our customers’ government contracts or debarment and, as a result, the loss of the related revenue which would harm our business, results of operations and financial condition. We are not aware of any action contemplated by any regulatory authority related to any possible non-compliance by or in connection with our operations.
Our operations are subject to an array of governmental regulations in each of the jurisdictions in which we operate. Our activities are subject to regulation by several federal and state government agencies, including the Occupational Safety and Health Administration (“OSHA”) and by federal and state laws. Our operations and activities in other jurisdictions are subject to similar governmental regulations. Similar to conventionally constructed buildings, the workforce housing industry is also subject to regulations by multiple governmental agencies in each jurisdiction relating to, among others, environmental, zoning and building standards, and health, safety and transportation matters. Noncompliance with applicable regulations, implementation of new regulations or modifications to existing regulations may increase costs of compliance, require a termination of certain activities or otherwise have a material adverse effect on our business, results of operations, and financial condition.
In addition, U.S. government contracts and grants normally contain additional requirements that may increase our costs of doing business, reduce our profits, and expose us to liability for failure to comply with these terms and conditions. These requirements include, for example:
|
· |
specialized disclosure and accounting requirements unique to U.S. government contracts; |
|
· |
financial and compliance audits that may result in potential liability for price adjustments, recoupment of government funds after such funds have been spent, civil and criminal penalties, or administrative sanctions such as suspension or debarment from doing business with the U.S. government; |
|
· |
public disclosures of certain contract and company information; and |
|
· |
mandatory socioeconomic compliance requirements, including labor requirements, non-discrimination and affirmative action programs and environmental compliance requirements. |
If we fail to maintain compliance with these requirements, our contracts may be subject to termination, and we may be subject to financial and/or other liability under its contracts or under the Federal Civil False Claims Act (the “False Claims Act”). The False Claims Act’s “whistleblower” provisions allow private individuals, including present and former employees, to sue on behalf of the U.S. government. The False Claims Act statute provides for treble damages and other penalties and, if our operations are found to be in violation of the False Claims Act, we could face other adverse action, including suspension or prohibition from doing business with the United States government. Any penalties, fines, suspension or damages could adversely affect our financial results as well as our ability to operate our business.
34
We are subject to various anti-corruption laws and we may be subject to other liabilities which could have a material adverse effect on our business, results of operations and financial condition.
We are subject to various anti-corruption laws that prohibit improper payments or offers of payments to foreign governments and their officials by a U.S. person for the purpose of obtaining or retaining business. Our activities create the risk of unauthorized payments or offers of payments by one of our employees or agents that could be in violation of various laws, including the U.S. Foreign Corrupt Practices Act (the “FCPA”). We have implemented safeguards and policies to discourage these practices by our employees and agents. However, existing safeguards and any future improvements may prove to be ineffective and employees or agents may engage in conduct for which we might be held responsible.
If employees violate our policies or we fail to maintain adequate record-keeping and internal accounting practices to accurately record its transactions, we may be subject to regulatory sanctions. Violations of the FCPA or other anti-corruption laws may result in severe criminal or civil sanctions and penalties, including suspension or debarment from U.S. government contracting, and we may be subject to other liabilities which could have a material adverse effect on our business, results of operations and financial condition. We are also subject to similar anti-corruption laws in other jurisdictions.
We may be subject to environmental laws and regulations that may require us to take actions that will adversely affect our results of operations.
All of our and our customers’ operations may be affected by federal, state and local laws and regulations governing the discharge of substances into the environment or otherwise relating to environmental protection. Among other things, these laws and regulations impose limitations and prohibitions on the discharge and emission of, and establish standards for the use, disposal and management of, regulated materials and waste, and impose liabilities for the costs of investigating and cleaning up, and damages resulting from, present and past spills, disposals or other releases of hazardous substances or materials. In the ordinary course of business, we use and generate substances that are regulated or may be hazardous under environmental laws. We have an inherent risk of liability under environmental laws and regulations, both with respect to ongoing operations and with respect to contamination that may have occurred in the past on our properties or as a result of our operations. From time to time, our operations or conditions on properties that we have acquired have resulted in liabilities under these environmental laws. We may in the future incur material costs to comply with environmental laws or sustain material liabilities from claims concerning noncompliance or contamination. We have no reserves for any such liabilities. Environmental laws and regulations are subject to change in the future, possibly resulting in more stringent requirements. Our or any of our customers’ failure to comply with applicable environment laws and regulations may result in any of the following:
issuance of administrative, civil and criminal penalties;
denial or revocation of permits or other authorizations;
reduction or cessation of operations; and
performance of site investigatory, remedial or other corrective actions
While it is not possible at this time to predict how environmental legislation may change or how new regulations that may be adopted would impact our business, any such future laws and regulations could result in increased compliance costs or additional operating restrictions for us or our oil and gas and natural resource company customers and could have a material adverse effect on our business or demand for our services.
We may be subject to litigation, judgments, orders or regulatory proceedings that could materially harm our business.
We are subject to claims arising from disputes with customers, employees, vendors and other third parties in the normal course of business. The risks associated with any such disputes may be difficult to assess or quantify and their existence and magnitude may remain unknown for substantial periods of time. If the plaintiffs in any suits against us were to
35
successfully prosecute their claims, or if we were to settle such suits by making significant payments to the plaintiffs, our business, results of operations and financial condition would be harmed. Even if the outcome of a claim proves favorable to us, litigation can be time consuming and costly and may divert management resources. To the extent that our senior executives are named in such lawsuits, our indemnification obligations could magnify the costs.
We may be exposed to certain regulatory and financial risks related to climate change.
Climate change is receiving increasing attention from scientists and legislators alike. The debate is ongoing as to the extent to which the climate is changing, the potential causes of any change and its potential impacts. Some attribute global warming to increased levels of greenhouse gases, including carbon dioxide, which has led to significant legislative and regulatory efforts to limit greenhouse gas emissions. Significant focus is being made on companies that are active producers of depleting natural resources.
There are a number of legislative and regulatory proposals to address greenhouse gas emissions, which are in various phases of discussion or implementation. The outcome of U.S. federal, regional, provincial, and state actions to address global climate change could result in a variety of regulatory programs including potential new regulations, additional charges to fund energy efficiency activities, or other regulatory actions. These actions could:
result in increased costs associated with our operations and our customers’ operations;
increase other costs to our business;
reduce the demand for carbon-based fuels; and
reduce the demand for our services.
Any adoption of these or similar proposals by U.S. federal, regional, provincial, or state governments mandating a substantial reduction in greenhouse gas emissions could have far-reaching and significant impacts on the energy industry. Although it is not possible at this time to predict how legislation or new regulations that may be adopted to address greenhouse gas emissions would impact our business, any such future laws and regulations could result in increased compliance costs or additional operating restrictions, and could have a material adverse effect on our business or demand for our services. See “[Business—Regulatory and Environmental Compliance]” in this Annual Report on Form 10-K for a more detailed description of our climate-change related risks.
Growth, Development and Financing Risks
We may not be able to successfully acquire and integrate new operations, which could cause our business to suffer.
We may not be able to successfully complete potential strategic acquisitions for various reasons. We anticipate that we will consider acquisitions in the future that meet our strategic growth plans. We cannot predict whether or when acquisitions will be completed, and we may face significant competition for certain acquisition targets. Acquisitions that are completed involve numerous risks, including the following:
difficulties in integrating the operations, technologies, products and personnel of the acquired companies;
diversion of management’s attention from normal daily operations of the business;
difficulties in entering markets in which we have no or limited direct prior experience and where our competitors in such markets have stronger market positions;
difficulties in complying with regulations, such as environmental regulations, and managing risks related to an acquired business;
an inability to timely complete necessary financing and required amendments, if any, to existing agreements;
36
an inability to implement uniform standards, controls, procedures and policies;
undiscovered and unknown problems, defects, liabilities or other issues related to any acquisition that become known to us only after the acquisition, particularly relating to rental equipment on lease that are unavailable for inspection during the diligence process; and
potential loss of key customers or employees.
In connection with acquisitions we may assume liabilities or acquire damaged assets, some of which may be unknown at the time of such acquisitions; record goodwill and non-amortizable intangible assets that will be subject to future impairment testing and potential periodic impairment charges; or incur amortization expenses related to certain intangible assets.
The condition and regulatory certification of any facilities or operations acquired is assessed as part of the acquisition due diligence. In some cases, facility condition or regulatory certification may be difficult to determine due to that facility being on lease at the time of acquisition and/or inadequate certification records. Facility acquisitions may therefore result in a rectification cost which may not have been factored into the acquisition price, impacting deployability and ultimate profitability of the facility acquired.
Acquisitions are inherently risky, and no assurance can be given that our future acquisitions will be successful or will not materially adversely affect our business, results of operations, and financial condition. If we do not manage new markets effectively, some of our new communities and acquisitions may lose money or fail, and we may have to close unprofitable communities. Closing a community in such circumstances would likely result in additional expenses that would cause our operating results to suffer. To successfully manage growth, we will need to continue to identify additional qualified managers and employees to integrate acquisitions within our established operating, financial and other internal procedures and controls. We will also need to effectively motivate, train and manage our employees. Failure to successfully integrate recent and future acquisitions and new communities into existing operations could materially adversely affect our results of operations and financial condition.
Global or local economic movements could have a material adverse effect on our business.
We operate in the United States, but our business may be negatively impacted by economic movements or downturns in that market or in global markets generally, including those that could be caused by policy changes by the U.S. administration in areas such as trade and immigration. These adverse economic conditions may reduce commercial activity, cause disruption and volatility in global financial markets, and increase rates of default and bankruptcy. Reduced commercial activity has historically resulted in reduced demand for our products and services. For example, reduced commercial activity in the energy and natural resource sectors in certain markets in which we operate may negatively impact our business. U.S. federal spending cuts or further limitations that may result from presidential or congressional action or inaction may also negatively impact our arrangements with government contractor customers. Disruptions in financial markets could negatively impact the ability of our customers to pay their obligations to us in a timely manner and increase our counterparty risk. If economic conditions worsen, we may face reduced demand and an increase, relative to historical levels, in the time it takes to receive customer payments. If we are not able to adjust our business in a timely and effective manner to changing economic conditions, our business, results of operations and financial condition may be materially adversely affected.
37
Prior to the completion of the Business Combination in March 2019, Target Parent was owned by the Algeco Seller, and Signor Parent was owned by the Arrow Seller and did not operate together as Target Hospitality, though they were under common control. Target Parent’s and Signor Parent’s historical financial information for periods prior to the closing of the Business Combination is not representative of the results we would have achieved as a separate, publicly-traded company during these periods and may not be a reliable indicator of our future results.
The historical information of Signor Parent and Target Parent refers to their respective businesses prior to the Business Combination. Accordingly, the historical financial information does not necessarily reflect the financial condition, results of operations or cash flows that we would have achieved as a separate, publicly-traded company during the periods presented or those that we will achieve in the future primarily as a result of the factors described below:
prior to the completion of the Business Combination, Signor Parent’s and Target Parent’s businesses were owned by the Arrow Seller and the Algeco Seller, respectively, as part of broader corporate organizations, rather than as an independent company. As such, these broader organizations performed various corporate functions for each entity such as legal, treasury, accounting, auditing, human resources, corporate affairs and finance. Target Parent’s and Signor Parent’s historical financial results reflect allocations of corporate expenses from such functions and are likely to be less than the expenses Target Hospitality would have incurred had it operated as a separate publicly-traded company. Following the Business Combination, we are responsible for the cost related to such functions previously performed by each entity’s previous corporate group;
prior to the completion of the Business Combination, decisions regarding capital raising and major capital expenditures for Signor Parent or Target Parent were done through the Arrow Seller or the Algeco Seller, respectively;
following the Business Combination, we may need to obtain additional financing from banks, through public offerings or private placements of debt or equity securities, strategic relationships or other arrangements; and
Signor Parent’s and Target Parent’s historical financial information prior to the Business Combination does not reflect the debt or the associated expenses that Target Hospitality incurred as part of the Business Combination.
We incurred and expect to continue to incur significantly increased costs as a result of operating as a public company, and our management is required to devote substantial time to compliance efforts.
We incurred and expect to continue to incur significant legal, accounting, insurance, and other expenses as a result of becoming a public company, and we expect to continue to incur such expenses. The Dodd-Frank Wall Street Reform and Consumer Protection Act of 2010, as amended (the “Dodd-Frank Act”) and the Sarbanes-Oxley Act of 2002, as amended (“SOX”), as well as related rules implemented by the SEC, have required changes in corporate governance practices of public companies. In addition, rules that the SEC is implementing or is required to implement pursuant to the Dodd-Frank Act are expected to require additional change. Compliance with these and other similar laws, rules and regulations, including compliance with Section 404 of SOX, will substantially increase our expenses, including legal and accounting costs, and make some activities more time-consuming and costly. It is possible that these expenses will exceed the increases projected by management. These laws, rules, and regulations may also make it more expensive to obtain director and officer liability insurance, and we may be required to accept reduced policy limits and coverage or incur substantially higher costs to obtain the same or similar coverage, which may make it more difficult to attract and retain qualified persons to serve on its board of directors or as officers. Although the JOBS Act may, for a limited period of time, somewhat lessen the cost of complying with these additional regulatory and other requirements, we nonetheless expect a substantial increase in legal, accounting, insurance, and certain other expenses in the future, which will negatively impact its results of operations and financial condition.
38
We are an “emerging growth company” and as a result of the reduced disclosure and governance requirements applicable to emerging growth companies, our common stock may be less attractive to investors.
We are an “emerging growth company” as defined in the JOBS Act, and we intend to utilize some of the exemptions from reporting requirements that are applicable to other public companies that are not emerging growth companies, including not being required to comply with the auditor attestation requirements of Section 404 of the Sarbanes-Oxley Act, reduced disclosure obligations regarding executive compensation in our periodic reports and proxy statements, and adopting new accounting standards using private company effective dates. We cannot predict if investors will find our common stock less attractive because we will rely on these exemptions. If some investors find our common stock less attractive as a result, there may be a less active trading market for our common stock and our stock price may be more volatile. We may take advantage of these reporting exemptions until we are no longer an emerging growth company. We will remain an emerging growth company until the earlier of (1) the last day of the fiscal year (a) following the fifth anniversary of the completion of our initial public offering, (b) in which we have total annual gross revenue of at least $1.0 billion, or (c) in which we are deemed to be a large accelerated filer, which means the market value of our common stock that is held by non-affiliates exceeds $700 million as of the prior June 30th, and (2) the date on which we have issued more than $1.0 billion in non-convertible debt during the prior three-year period.
As a result of being a public company, we are subject to additional reporting and corporate governance requirements that require additional management time, resources and expense.
As a public company, we are obligated to file with the SEC annual and quarterly information and other reports that are specified in the Exchange Act. We are also subject to other reporting and corporate governance requirements under SOX, and the rules and regulations promulgated thereunder, all of which impose significant compliance and reporting obligations upon us and require us to incur additional expense in order to fulfill such obligations.
Information Technology and Privacy Risks
Any failure of our management information systems could disrupt our business and result in decreased revenue and increased overhead costs.
We depend on our management information systems to actively manage our facilities and provide facility information, and availability of our services. These functions enhance our ability to optimize facility utilization, occupancy, costs of goods sold, and average daily rate. The failure of our management information systems to perform as anticipated could damage our reputation with our customers, disrupt our business or result in, among other things, decreased revenue and increased overhead costs. For example, an inaccurate utilization rate could cause us to fail to have sufficient inventory to meet consumer demand, resulting in decreased sales. Any such failure could harm our business, results of operations and financial condition. In addition, the delay or failure to implement information system upgrades and new systems effectively could disrupt our business, distract management’s focus and attention from business operations and growth initiatives, and increase our implementation and operating costs, any of which could materially adversely affect our operations and operating results.
Like other companies, our information systems may be vulnerable to a variety of interruptions due to events beyond our control, including, but not limited to, telecommunications failures, computer viruses, security breaches (including cyber-attacks), and other security issues. In addition, because our systems contain information about individuals and businesses, the failure to maintain the security of the data we hold, whether the result of our own error or the malfeasance or errors of others, could harm our reputation or give rise to legal liabilities leading to lower revenue, increased costs, regulatory sanctions, and other potential material adverse effects on our business, results of operations, and financial condition.
Our business could be negatively impacted by security threats, including cyber-security threats and other disruptions.
We face various security threats, including cyber-security threats to gain unauthorized access to sensitive information or to render data or systems unusable; threats to the safety of our employees; threats to the security of our facilities and infrastructure or third-party facilities and infrastructure; and threats from terrorist acts. Although we utilize various procedures and controls to monitor these threats and mitigate our exposure to such threats, there can be no assurance that
39
these procedures and controls will be sufficient in preventing security threats from materializing. If any of these events were to materialize, they could lead to losses of sensitive information, critical infrastructure, personnel or capabilities essential to our operations and could have a material adverse effect on our reputation, financial position, results of operations or cash flows. Cyber-security attacks in particular are evolving and include, but are not limited to, malicious software, attempts to gain unauthorized access to data and other electronic security breaches that could lead to disruptions in critical systems, unauthorized release of confidential or otherwise protected information, and corruption of data. See “Risk Factors—Information Technology and Privacy Risks—Cyber-attacks could have a disruptive effect on our business.”
Cyber-attacks could have a disruptive effect on our business
From time to time we may experience cyber-attacks, attempted and actual breaches of our information technology systems and networks or similar events, which could result in a loss of sensitive business or customer information, systems interruption or the disruption of our operations. The techniques that are used to obtain unauthorized access, disable or degrade service or sabotage systems change frequently and are difficult to detect for long periods of time, and we are accordingly unable to anticipate and prevent all data security incidents.
Even if we are fully compliant with legal standards and contractual or other requirements, we still may not be able to prevent security breaches involving sensitive data. The sophistication of efforts by hackers to gain unauthorized access to information systems has continued to increase in recent years. Breaches, thefts, losses or fraudulent uses of customer, employee or company data could cause consumers to lose confidence in the security of our website, point of sale systems and other information technology systems and choose not to stay in our communities or contract with us in the future. Such security breaches also could expose us to risks of data loss, business disruption, litigation and other costs or liabilities, any of which could adversely affect our business.
Failure to keep pace with developments in technology could adversely affect our operations or competitive position.
The specialty rental and hospitality services industry demands the use of sophisticated technology and systems for community management, procurement, operation of services across communities and other facilities, distribution of community resources to current and future customers and amenities. These technologies may require refinements and upgrades. The development and maintenance of these technologies may require significant investment by us. As various systems and technologies become outdated or new technology is required, we may not be able to replace or introduce them as quickly as needed or in a cost-effective and timely manner. As a result, we may not achieve the benefits we may have been anticipating from any new technology or system.
Risks Relating to Our Indebtedness
Our leverage may make it difficult for us to service our debt and operate our business.
As of December 31, 2019, we, through our wholly-owned indirect subsidiary, Arrow Bidco, had $420 million of total indebtedness consisting of $80 million of borrowings under the New ABL Facility and $340 million of Notes.
Our leverage could have important consequences, including:
making it more difficult to satisfy our obligations with respect to our various debt (including the Notes) and liabilities;
requiring us to dedicate a substantial portion of our cash flow from operations to debt payments, thus reducing the availability of cash flow to fund internal growth through working capital and capital expenditures on our existing communities or new communities and for other general corporate purposes;
increasing our vulnerability to a downturn in our business or adverse economic or industry conditions;
40
placing us at a competitive disadvantage compared to our competitors that have less debt in relation to cash flow and that, therefore, may be able to take advantage of opportunities that our leverage would prevent us from pursuing;
limiting our flexibility in planning for or reacting to changes in our business and industry;
restricting us from pursuing strategic acquisitions or exploiting certain business opportunities or causing us to make non-strategic divestitures; and
limiting, among other things, our ability to borrow additional funds or raise equity capital in the future and increasing the costs of such additional financings.
Our ability to meet our debt service obligations, including those under the New ABL Facility and the Notes, or to refinance our debt depends on our future operating and financial performance, which will be affected by our ability to successfully implement our business strategy as well as general economic, financial, competitive, regulatory and other factors beyond our control. If our business does not generate sufficient cash flow from operations, or if future borrowings are not available to us in an amount sufficient to enable us to pay our indebtedness or to fund our other liquidity needs, we may need to refinance all or a portion of our indebtedness on or before the maturity thereof, sell assets, reduce or delay capital investments or seek to raise additional capital, any of which could have a material adverse effect on our operations. In addition, we may not be able to affect any of these actions, if necessary, on commercially reasonable terms or at all. Any refinancing of our debt could be at higher interest rates and may require us to comply with more onerous covenants, which could further restrict our business operations. The terms of our existing or future debt instruments may limit or prevent us from taking any of these actions. If we default on the payments required under the terms of certain of our indebtedness, that indebtedness, together with debt incurred pursuant to other debt agreements or instruments that contain cross-default or cross-acceleration provisions, may become payable on demand, and we may not have sufficient funds to repay all of our debts. As a result, our inability to generate sufficient cash flow to satisfy our debt service obligations, or to refinance or restructure our obligations on commercially reasonable terms or at all, would have an adverse effect, which could be material, on our business, financial condition and results of operations, as well as on our ability to satisfy our debt obligations.
We and our subsidiaries may be able to incur substantial additional indebtedness (including additional secured obligations) in the future. Although the Indenture and the New ABL Facility contain restrictions on the incurrence of additional indebtedness, these restrictions are subject to a number of significant qualifications and exceptions, and under certain circumstances, the amount of indebtedness that could be incurred in compliance with these restrictions could be substantial. If new debt, including future additional secured obligations, is added to our and our subsidiaries’ existing debt levels, the related risks that we now face would increase.
Global capital and credit markets conditions could materially adversely affect our ability to access the capital and credit markets or the ability of key counterparties to perform their obligations to it.
Although we believe the banks participating in the New ABL Facility have adequate capital and resources, we can provide no assurance that all of those banks will continue to operate as a going concern in the future. If any of the banks in our lending group were to fail, it is possible that the borrowing capacity under the New ABL Facility would be reduced. Further, practical, legal, and tax limitations may also limit our ability to access the cash available to certain businesses within our group to service the working capital needs of other businesses within our group. In the event that the availability under the New ABL Facility were reduced significantly, we could be required to obtain capital from alternate sources in order to finance our capital needs. The options for addressing such capital constraints would include, but would not be limited to, obtaining commitments from the remaining banks in the lending group or from new banks to fund increased amounts under the terms of the New ABL Facility, and accessing the public capital markets. In addition, we may delay certain capital expenditures to ensure that we maintain appropriate levels of liquidity. If it becomes necessary to access additional capital, any such alternatives could have terms less favorable than those terms under the New ABL Facility, which could have a material adverse effect on our business, results of operations, financial condition, and cash flows.
41
In addition, in the future we may need to raise additional funds to, among other things, refinance existing indebtedness, fund existing operations, improve or expand our operations, respond to competitive pressures or make acquisitions. If adequate funds are not available on acceptable terms, we may be unable to achieve our business or strategic objectives or compete effectively. Our ability to pursue certain future opportunities may depend in part on our ongoing access to debt and equity capital markets. We cannot assure Noteholders that any such financing will be available on terms satisfactory to us or at all. If we are unable to obtain financing on acceptable terms, we may have to curtail our growth.
Economic disruptions affecting key counterparties could also have a material adverse effect on our business. We monitor the financial strength of our larger customers, derivative counterparties, lenders, and insurance carriers on a periodic basis using publicly-available information in order to evaluate its exposure to those who have or who it believes may likely experience significant threats to their ability to adequately perform their obligations to it. The information available will differ from counterparty to counterparty and may be insufficient for us to adequately interpret or evaluate our exposure and/or determine appropriate or timely responses.
We are, and may in the future become, subject to covenants that limit our operating and financial flexibility and, if we default under our debt covenants, we may not be able to meet our payment obligations.
The New ABL Facility and the Indenture, as well as any instruments that will govern any future debt obligations, contain covenants that impose significant restrictions on the way the Arrow Bidco and its subsidiaries can operate, including restrictions on the ability to:
incur or guarantee additional debt and issue certain types of stock;
create or incur certain liens;
make certain payments, including dividends or other distributions, with respect to our equity securities;
prepay or redeem junior debt;
make certain investments or acquisitions, including participating in joint ventures;
engage in certain transactions with affiliates;
create unrestricted subsidiaries;
create encumbrances or restrictions on the payment of dividends or other distributions, loans or advances to, and on the transfer of, assets to the issuer or any restricted subsidiary;
sell assets, consolidate or merge with or into other companies;
sell or transfer all or substantially all our assets or those of our subsidiaries on a consolidated basis; and
issue or sell share capital of certain subsidiaries.
Although these limitations will be subject to significant exceptions and qualifications, these covenants could limit our ability to finance future operations and capital needs and our ability to pursue acquisitions and other business activities that may be in our interest. Arrow Bidco’s ability to comply with these covenants and restrictions may be affected by events beyond our control. These include prevailing economic, financial and industry conditions. If Arrow Bidco defaults on their obligations under the New ABL Facility and the Indenture, then the relevant lenders or holders could elect to declare the debt, together with accrued and unpaid interest and other fees, if any, immediately due and payable and proceed against any collateral securing that debt. If the debt under the New ABL Facility, the Indenture or any other material financing arrangement that we enter into were to be accelerated, our assets may be insufficient to repay in full the New ABL Facility, the Notes and our other debt.
42
The New ABL Facility will also require our subsidiaries to satisfy specified financial maintenance tests in the event that certain excess liquidity requirements are not satisfied. The ability to meet these tests could be affected by deterioration in our operating results, as well as by events beyond our control, including increases in raw materials prices and unfavorable economic conditions, and we cannot assure Noteholders that these tests will be met. If an event of default occurs under the New ABL Facility, the lenders thereunder could terminate their commitments and declare all amounts borrowed, together with accrued and unpaid interest and other fees, to be immediately due and payable. Borrowings under other debt instruments that contain cross-acceleration or cross-default provisions also may be accelerated or become payable on demand. In these circumstances, Target Hospitality’s assets may not be sufficient to repay in full that indebtedness and its other indebtedness then outstanding.
The amount of borrowings permitted at any time under the New ABL Facility will be subject to compliance with limits based on a periodic borrowing base valuation of the borrowing base assets thereunder. As a result, our access to credit under the New ABL Facility will potentially be subject to significant fluctuations depending on the value of the borrowing base of eligible assets as of any measurement date, as well as certain discretionary rights of the agent in respect of the calculation of such borrowing base value. As a result of any change in valuation, the availability under the New ABL Facility may be reduced, or we may be required to make a repayment of the New ABL Facility, which may be significant. The inability to borrow under the New ABL Facility or the use of available cash to repay the New ABL Facility as a result of a valuation change may adversely affect our liquidity, results of operations and financial position.
Restrictions in Arrow Bidco’s existing and future debt agreements could limit our growth and our ability to respond to changing conditions.
The New ABL Facility contains a number of significant covenants including covenants restricting the incurrence of additional debt. The credit agreement governing the New ABL Facility requires Arrow Bidco, among other things, to maintain certain financial ratios or reduce our debt. These restrictions also limit our ability to obtain future financings to withstand a future downturn in its business or the economy in general, or to otherwise conduct necessary corporate activities. We may also be prevented from taking advantage of business opportunities that arise because of the limitations that the restrictive covenants under the New ABL Facility and the indenture governing the Notes impose on it. In addition, complying with these covenants may also cause us to take actions that are not favorable to our securityholders and may make it more difficult for us to successfully execute our business strategy and compete against companies that are not subject to such restrictions.
Credit rating downgrades could adversely affect our businesses, cash flows, financial condition and operating results.
Arrow Bidco’s credit ratings will impact the cost and availability of future borrowings, and, as a result, cost of capital. Arrow Bidco’s ratings reflect each rating agency’s opinion of our financial strength, operating performance and ability to meet our debt obligations. Each rating agency will review these ratings periodically and there can be no assurance that such ratings will be maintained in the future. A downgrade in Arrow Bidco’s rating could adversely affect our businesses, cash flows, financial condition and operating results.
Item 1B. Unresolved Staff Comments
None
Our corporate headquarters are located in Woodlands, Texas. Our executive, financial, accounting, legal, administrative, management information systems and human resources functions operate from this single, leased office. We operate over 25 branch locations across the US. Subject to certain exceptions, substantially all of our owned personal property and material real property in the US and Canada is encumbered under our New ABL Facility and the 2024 Senior Secured
43
Notes. We do not believe that the encumbrances will materially detract from the value of our properties, nor will they materially interfere with their use in the operation of our business.
|
|
Location |
|
Description |
|
Bakken |
|
|
|
|
|
Williston, North Dakota |
|
Williams County Lodge |
|
|
Williston, North Dakota |
|
Judson Executive Lodge |
|
|
Stanley, North Dakota |
|
Stanley Hotel |
|
|
Watford City, North Dakota |
|
Watford City Lodge |
|
|
|
|
|
|
Government |
|
|
|
|
|
Dilley, Texas |
|
Dilley (STFRC) |
|
|
|
|
|
|
Permian |
|
|
|
|
|
Pecos, Texas |
|
Pecos North Lodge |
|
|
Pecos, Texas |
|
Pecos South Lodge |
|
|
Mentone, Texas |
|
Mentone Wolf Camp |
|
|
Mentone, Texas |
|
Skillman Station Lodge |
|
|
Orla, Texas |
|
Orla North Lodge |
|
|
Orla, Texas |
|
Orla South Lodge |
|
|
Orla, Texas |
|
Delaware Orla Lodge |
|
|
Orla, Texas |
|
El Capitan Lodge |
|
|
Odessa, Texas |
|
Odessa West Lodge |
|
|
Odessa, Texas |
|
Odessa East Lodge |
|
|
Odessa, Texas |
|
Odessa FTSI Lodge |
|
|
Midland, Texas |
|
Midland Lodge |
|
|
Midland, Texas |
|
Midland East Lodge |
|
|
Kermit, Texas |
|
Kermit Lodge |
|
|
Kermit, Texas |
|
Kermit North Lodge |
|
|
Barnhart, Texas |
|
Barnhart Lodge |
|
|
Carlsbad, New Mexico |
|
Carlsbad Lodge |
|
|
Carlsbad, New Mexico |
|
Carlsbad Seven Rivers Lodge |
|
|
Jal, New Mexico |
|
Jal Lodge |
|
|
|
|
|
|
Other |
|
|
|
|
|
El Reno, Oklahoma |
|
El Reno Lodge |
44
We are involved in various lawsuits, claims and legal proceedings, the majority of which arise out of the ordinary course of business. The nature of the Company’s business is such that disputes occasionally arise with vendors including suppliers and subcontractors, and customers over contract specifications and contract interpretations among other things. The company assesses these matters on a case-by-case basis as they arise. Reserves are established, as required, based on its assessment of exposure. We have insurance policies to cover general liability and workers’ compensation related claims. In the opinion of management, the ultimate amount of liability not covered by insurance, if any, under such pending lawsuits, claims and legal proceedings will not have a material adverse effect on its financial condition or results of operations. Because litigation is subject to inherent uncertainties including unfavorable rulings or developments, it is possible that the ultimate resolution of our legal proceedings could involve amounts that are different from our currently recorded accruals, and that such differences could be material.
Item 4. Mine Safety Disclosures
Not applicable
45
Item 5. Market for Registrant’s Common Equity, Related Shareholder Matters and Issuer Purchases of Equity Securities
Our Common Stock is listed on the Nasdaq Capital Market under the symbol “TH.” Through March 15, 2019, our common stock, warrants and units were quoted under the symbols “EAGL,” “EAGLW” and “EAGLU,” respectively. Upon consummation of the Business Combination, (i) our public units automatically separated into their component securities and, as a result, no longer trade as a separate security and were delisted; (ii) our Common Stock (into which Platinum Eagle’s ordinary shares were converted) continued to trade on Nasdaq under the ticker symbol “TH”; and (iii) the 2019 Warrants continued to trade on Nasdaq under the ticker symbol “THWWW”.
The following table includes the high and low closing prices for shares of our common stock and warrants for the periods presented. Share prices for 2019 represent prices for shares of Common Stock which came into existence on March 15, 2019 as part of the Business Combination. Share prices for all other periods presented represent prices for Class A ordinary shares of Platinum Eagle.
|
|
|
|
Common Stock |
|
Warrants |
||||||||
|
|
|
|
High |
|
Low |
|
High |
|
Low |
||||
|
2019 |
|
|
|
|
|
|
|
|
|
|
|
|
|
|
First Quarter |
|
$ |
12.11 |
|
$ |
9.26 |
|
$ |
1.65 |
|
$ |
1.20 |
|
|
Second Quarter |
|
$ |
11.70 |
|
$ |
8.92 |
|
$ |
3.30 |
|
$ |
1.41 |
|
|
Third Quarter |
|
$ |
9.93 |
|
$ |
5.65 |
|
$ |
2.00 |
|
$ |
0.84 |
|
|
Fourth Quarter |
|
$ |
7.15 |
|
$ |
3.80 |
|
$ |
1.05 |
|
$ |
0.22 |
|
|
|
|
|
|
|
|
|
|
|
|
|
|
|
|
|
2018 |
|
|
|
|
|
|
|
|
|
|
|
|
|
|
First Quarter |
|
$ |
9.85 |
|
$ |
9.85 |
|
$ |
1.50 |
|
$ |
0.51 |
|
|
Second Quarter |
|
$ |
11.82 |
|
$ |
9.60 |
|
$ |
2.13 |
|
$ |
1.15 |
|
|
Third Quarter |
|
$ |
9.85 |
|
$ |
9.72 |
|
$ |
1.50 |
|
$ |
1.05 |
|
|
Fourth Quarter |
|
$ |
10.16 |
|
$ |
9.70 |
|
$ |
1.75 |
|
$ |
1.20 |
|
Holders
As of December 31, 2019, there were 20 holders of record of our Common Stock and 1 holder of record of our Warrants.
Dividend Information
We do not currently pay any cash dividends on our Common Stock. The declaration and amount of all dividends will be at the discretion of our board of directors and will depend upon many factors, including our financial condition, results of operations, cash flows, prospects, industry conditions, capital requirements of our business, covenants associated with certain debt obligations, legal requirements, regulatory constraints, industry practice and other factors the board of directors deems relevant. We can give no assurances that we will pay a dividend in the future.
2018 Warrants
Platinum Eagle issued warrants to purchase its common stock as components of units sold in its initial public offering (the “Public Warrants”). Platinum Eagle also issued warrants to purchase its common stock in a private placement concurrently with its initial public offering (the “Private Warrants,” and together with the Public Warrants, the "2018 Warrants").
As of December 31, 2019, there were 16,166,650 2018 Warrants outstanding. Each 2018 Warrant entitles its holder to purchase Common Stock in accordance with its terms. See Note 21 of the audited consolidated financial statements included in Part II, Item 8 within this Annual Report on Form 10-k for additional information.
46
Performance Graph
The following stock price performance graph should not be deemed incorporated by reference by any general statement incorporating by reference this Annual Report on Form 10-K into any filing under the Exchange Act or the Securities Act of 1933, as amended (the “Securities Act”), except to the extent that we specifically incorporate this information by reference, and shall not otherwise be deemed filed under such acts.
The graph below compares the cumulative total return of our common stock from January 12, 2018, through December 31, 2019, with the comparable cumulative return of two indices, the Russell Broadbased Total Returns and the Nasdaq US Benchmark TR Index. The graph plots the change in value of an initial investment in each of our Common Stock, the Russell 2000 Index, and the Nasdaq US Benchmark Index over the indicated time periods. We have not paid any cash dividends and, therefore, the cumulative total return calculation for us is based solely upon the change in share price. The share price performance shown on the graph is not necessarily indicative of future price performance.
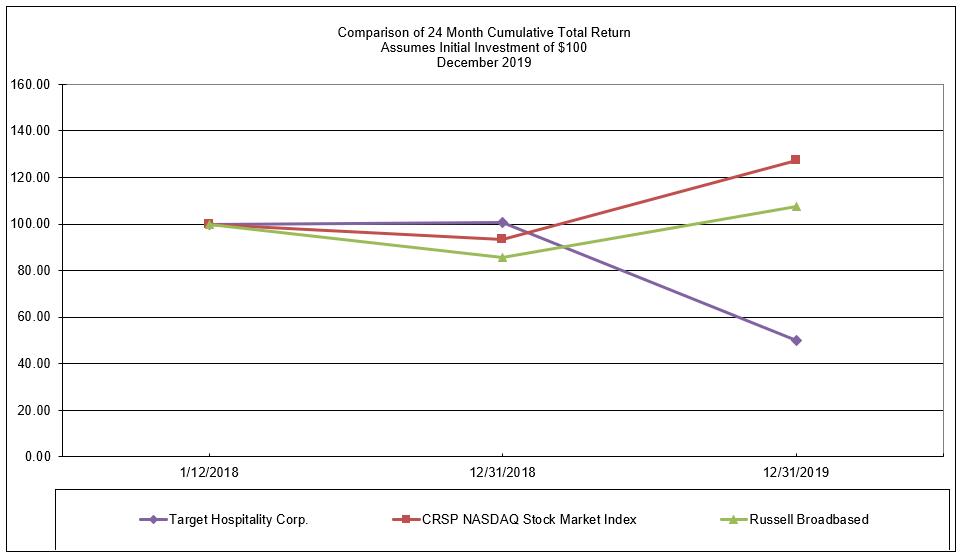
Unregistered Sales of Equity Securities and Use of Proceeds
Unregistered Sales of Equity Securities
None.
Issuer Purchases of Equity Securities
On August 15, 2019, the Company's board of directors approved the 2019 Share Repurchase Program (“2019 Plan”), authorizing the repurchase of up to $75.0 million of our common shares from August 30, 2019 to August 15, 2020. During the year ended December 31, 2019, the Company repurchased 4,414,767 common shares for approximately $23.6 million. As of December 31, 2019, the 2019 Plan had a remaining capacity of approximately $51.5 million.
47
The following table summarizes all of the share repurchases during the year ended December 31, 2019:
|
Period |
|
Total number |
|
|
Average price paid |
|
Total number of |
|
Maximum |
|
August 1, 2019 through August 31, 2019 |
|
23,300 |
|
$ |
6.03 |
|
23,300 |
|
12,272,034 |
|
September 1, 2019 through September 30, 2019 |
|
805,300 |
|
$ |
6.74 |
|
805,300 |
|
10,195,888 |
|
October 1, 2019 through October 30, 2019 |
|
962,800 |
|
$ |
6.14 |
|
962,800 |
|
11,465,803 |
|
November 1, 2019 through November 30, 2019 |
|
1,357,100 |
|
$ |
4.91 |
|
1,357,100 |
|
12,019,738 |
|
December 1, 2019 through December 31, 2019 |
|
1,266,267 |
|
$ |
4.20 |
|
1,266,267 |
|
10,307,008 |
|
Total |
|
4,414,767 |
|
|
|
|
4,414,767 |
|
|
|
(1) |
The maximum number of shares that may be repurchased under the 2019 Share Repurchase Program is calculated by dividing the total dollar amount available to repurchase shares by the closing price of our common shares on the last business day of the respective month. |
Securities Authorized for Issuance under Equity Compensation Plans
On March 6, 2019, our shareholders approved a new long-term incentive award plan (the "Plan") in connection with the Business Combination. The Plan is administered by the Compensation Committee. Under the Plan, the Compensation Committee may grant an aggregate of 4,000,000 shares of common stock in the form of stock options, stock appreciation rights, restricted stock, restricted stock units, stock bonus awards, and performance compensation awards.
As of December 31, 2019, 981,167 securities had been granted under the Plan.
Information on our equity compensation plans can be found in the table below.
|
|
|
Equity Compensation Plan Information |
|||||||
|
Plan Category |
|
|
Common shares to be |
|
|
Weighted Average |
|
|
Common Shares |
|
Equity compensation plan approved by Target Hospitality stockholders(1) |
|
|
981,167 |
|
$ |
9.39 |
|
|
3,018,833 |
|
Equity compensation plans not approved by security holders |
|
|
— |
|
|
— |
|
|
— |
|
Total |
|
|
981,167 |
|
$ |
9.39 |
|
|
3,018,833 |
|
(1) |
The number of common shares reported in Column (a) excludes grants that were forfeited on or before December 31, 2019, as forfeited grants are available for reissuance under the Plan. The amounts and values in Columns (a) and (b) comprise 401,797 RSUs at a weighted average grant price of $9.31, and 579,370 stock options at a weighted average exercise price of $9.48. For additional information on the awards outstanding under the Plan, see Note 22 in the audited consolidated financial statements included in Part II, Item 8 within this Annual Report on Form 10-K. |
48
Item 6. Selected Financial Data
On March 15, 2019, our company, formerly known as Platinum Eagle, indirectly acquired Target Parent and Signor Parent through the Business Combination. The Business Combination was accounted for as a reverse acquisition in which Target Parent and Signor Parent was the accounting acquirer. Except as otherwise provided herein, our financial statement presentation includes (i) the results of Target Parent and Signor Parent and its subsidiaries as our accounting predecessor for periods prior to the completion of the Business Combination, and (ii) the results of Target Hospitality (including the consolidation of its subsidiaries) for periods after the completion of the Business Combination. The operating statistics and data contained herein represents the operating information of the Company’s business.
The following selected historical financial information should be read together with the audited consolidated financial statements and accompanying notes (located in Part II, Item 8 within this Annual Report on Form 10-K) and “Management’s Discussion and Analysis of Financial Condition and Results of Operations” located in Part II, Item 7 within this Annual Report on Form 10-K. The selected historical financial information in this section is not intended to replace the Company’s consolidated financial statements and related notes. The Company’s historical results are not necessarily indicative of the Company’s future results, and the Company’s results as of the year ended December 31, 2019 are not necessarily indicative of future results.
49
|
|
|
|
|
|
|
|
|
|
|
|
|
|
|
|
|
|
|
As of and for the Years Ended December 31, |
||||||||||
|
|
|
|
2019 |
|
2018 |
|
2017 |
|
2016 |
||||
|
|
|
|
|
|
|
|
|
|
|
|
|
|
|
|
Revenues: |
|
|
|
|
|
|
|
|
|
|
|
|
|
|
|
Services income |
|
$ |
242,817 |
|
$ |
163,656 |
|
$ |
73,498 |
|
$ |
69,510 |
|
|
Specialty rental income |
|
|
59,826 |
|
|
53,735 |
|
|
58,813 |
|
|
79,957 |
|
|
Construction fee income |
|
|
18,453 |
|
|
23,209 |
|
|
1,924 |
|
|
- |
|
Total revenues: |
|
|
|
321,096 |
|
|
240,600 |
|
|
134,235 |
|
|
149,467 |
|
|
|
|
|
|
|
|
|
|
|
|
|
|
|
|
Costs: |
|
|
|
|
|
|
|
|
|
|
|
|
|
|
|
Services |
|
|
120,712 |
|
|
93,064 |
|
|
46,630 |
|
|
42,245 |
|
|
Specialty rental |
|
|
9,950 |
|
|
10,372 |
|
|
10,095 |
|
|
9,785 |
|
|
Depreciation of specialty rental assets |
|
|
43,421 |
|
|
31,610 |
|
|
24,464 |
|
|
36,300 |
|
|
Loss on impairment (1) |
|
|
- |
|
|
15,320 |
|
|
- |
|
|
- |
|
Gross profit: |
|
|
|
147,013 |
|
|
90,234 |
|
|
53,046 |
|
|
61,137 |
|
|
|
|
|
|
|
|
|
|
|
|
|
|
|
|
Expenses: |
|
|
|
|
|
|
|
|
|
|
|
|
|
|
|
Selling, general and administrative(2) |
|
|
76,464 |
|
|
41,340 |
|
|
24,337 |
|
|
15,793 |
|
|
Other depreciation and amortization |
|
|
15,481 |
|
|
7,518 |
|
|
5,681 |
|
|
5,029 |
|
|
Restructuring costs (3) |
|
|
168 |
|
|
8,593 |
|
|
2,180 |
|
|
- |
|
|
Currency (gains) losses, net |
|
|
(123) |
|
|
149 |
|
|
(91) |
|
|
- |
|
|
Other expense (income), net (4) |
|
|
6,872 |
|
|
(8,275) |
|
|
(519) |
|
|
(392) |
|
Operating income |
|
|
|
48,151 |
|
|
40,909 |
|
|
21,458 |
|
|
40,707 |
|
|
|
|
|
|
|
|
|
|
|
|
|
|
|
|
|
Loss on extinguishment of debt |
|
|
907 |
|
|
- |
|
|
- |
|
|
- |
|
|
Interest expense (income), net |
|
|
33,401 |
|
|
24,198 |
|
|
(5,107) |
|
|
(3,512) |
|
Income before income tax |
|
|
|
13,843 |
|
|
16,711 |
|
|
26,565 |
|
|
44,219 |
|
|
|
|
|
|
|
|
|
|
|
|
|
|
|
|
|
Income tax expense |
|
|
7,607 |
|
|
11,755 |
|
|
25,584 |
|
|
17,310 |
|
Net income |
|
|
|
6,236 |
|
|
4,956 |
|
|
981 |
|
|
26,909 |
|
Other comprehensive loss |
|
|
|
|
|
|
|
|
|
|
|
|
|
|
|
Foreign currency translation |
|
|
(95) |
|
|
(841) |
|
|
618 |
|
|
205 |
|
Comprehensive income |
|
|
|
6,141 |
|
|
4,115 |
|
|
1,599 |
|
|
27,114 |
|
|
|
|
|
|
|
|
|
|
|
|
|
|
|
|
Net income per Share - Basic and Diluted |
|
|
$ |
0.07 |
|
$ |
0.12 |
|
$ |
0.04 |
|
$ |
1.05 |
|
|
|
|
|
|
|
|
|
|
|
|
|
|
|
|
Summary Balance Sheet Data (at period end): |
|
|
|
|
|
|
|
|
|
|
|
|
|
|
|
Cash and cash equivalents |
|
|
6,787 |
|
|
12,194 |
|
|
12,533 |
|
|
3,810 |
|
|
Specialty rental assets, net |
|
|
353,695 |
|
|
293,559 |
|
|
193,786 |
|
|
189,619 |
|
|
Total assets |
|
|
600,792 |
|
|
565,032 |
|
|
363,125 |
|
|
424,276 |
|
|
Total debt, net (5) |
|
|
405,243 |
|
|
23,010 |
|
|
18,053 |
|
|
27,853 |
|
|
Total liabilities |
|
|
477,390 |
|
|
216,041 |
|
|
338,221 |
|
|
113,702 |
|
|
Total stockholders' equity |
|
|
123,402 |
|
|
348,991 |
|
|
24,904 |
|
|
310,574 |
|
|
|
|
|
|
|
|
|
|
|
|
|
|
|
|
Cash flow data |
|
|
|
|
|
|
|
|
|
|
|
|
|
|
|
Net cash provided by operating activities |
|
|
60,495 |
|
|
26,203 |
|
|
40,774 |
|
|
44,728 |
|
|
Net cash used in investing activities |
|
|
(112,705) |
|
|
(220,660) |
|
|
(130,246) |
|
|
(5,125) |
|
|
Net cash provided by (used in) financing activities |
|
|
46,652 |
|
|
194,553 |
|
|
98,059 |
|
|
(39,942) |
|
|
|
|
|
|
|
|
|
|
|
|
|
|
|
|
Other operating data |
|
|
|
|
|
|
|
|
|
|
|
|
|
|
|
Average daily rate (6) |
|
$ |
81.2 |
|
$ |
82.7 |
|
$ |
80.4 |
|
$ |
103.6 |
|
|
Average available beds (7) |
|
|
12,004 |
|
|
8,334 |
|
|
5,861 |
|
|
6,323 |
|
|
Utilization (8) |
|
|
82.7% |
|
|
83.7% |
|
|
72.6% |
|
|
55.9% |
|
|
|
|
|
|
|
|
|
|
|
|
|
|
|
|
Other financial data: |
|
|
|
|
|
|
|
|
|
|
|
|
|
|
|
EBITDA(9) |
|
|
107,053 |
|
|
80,037 |
|
|
51,603 |
|
|
82,036 |
|
|
Adjusted EBITDA(9) |
|
|
159,188 |
|
|
116,813 |
|
|
61,944 |
|
|
81,644 |
|
|
Adjusted Gross Profit (9) |
|
|
190,434 |
|
|
137,164 |
|
|
77,510 |
|
|
97,437 |
|
|
Capital expenditures for specialty rental assets(10) |
|
|
85,464 |
|
|
81,010 |
|
|
15,755 |
|
|
5,769 |
|
|
Depreciation and amortization |
|
|
58,902 |
|
|
39,128 |
|
|
30,146 |
|
|
41,329 |
|
(1) |
Represents non-cash asset impairment charges recognized in connection with our asset impairment test. The 2018 charge is associated with asset groups primarily located in Canada (“All Other” category of our segments) and the Bakken Basin segment. |
50
|
(2) |
Selling, general and administrative expenses in 2019 includes approximately $38.1 million worth of costs associated with the Business Combination as well as approximately $3.7 million of additional public company costs and 2018 includes approximately $13.6 million of transaction expenses associated with the Signor Acquisition and Business Combination as well as $7.4 million of Target Parent expenses as more fully discussed in “Management’s Discussion and Analysis of Financial Condition and Results of Operations” located in Part II, Item 7 within this Annual Report on Form 10-K. |
|
(3) |
Represents restructuring costs related primarily to employee termination costs. See Note 15 to our audited consolidated financial statements located in Part II, Item 8 within this Annual Report on Form 10-K. |
|
(4) |
2018 represents income from recharged costs from Target Parent to affiliate groups and gains associated with the receipt of casualty insurance proceeds. 2019 includes a loss on the sale of other property, plant and equipment of approximately $6.9 million during the fourth quarter of 2019. |
|
(5) |
Total debt as presented for 2019 includes 2024 Senior Secured Notes, net of unamortized original issue discount and unamortized term loan deferred financing costs, the New ABL revolving credit facility (as defined in Note 11 to our audited consolidated financial statements located in Part II, Item 8 within this Annual Report on Form 10-K), and long-term and short-term capital lease and other financing obligations. Total debt as presented for all periods excludes notes due to affiliates, which were repaid or otherwise settled as part of the Business Combination (see Note 3 to our audited consolidated financial statements located in Part II, Item 8 within this Annual Report on Form 10-K for further discussion on the Business Combination). |
|
(6) |
Average daily rate is calculated based on specialty rental income and services income received over the period indicated divided by utilized bed nights. |
|
(7) |
Average available beds is calculated as the sum of the number of available beds over the period indicated divided by the number of days in the period. |
|
(8) |
Utilization is calculated based on utilized beds divided by total average available beds. |
|
(9) |
For additional information and a reconciliation of these Non-GAAP measures to the most comparable GAAP measure, see “Management’s Discussion and Analysis of Financial Condition and Results of Operations” located in Part II, Item 7 within this Annual Report on Form 10-K. |
|
(10) |
Capital expenditures for specialty rental assets excludes the acquisitions of Superior, Signor, and Iron Horse in 2019, 2018 and 2017, respectively. Refer to Note 4 in our audited consolidated financial statements located in Part II, within Item 8 on this Annual Report on Form 10-K. |
51
Cautionary Statement Regarding Forward-Looking Statements
This Annual Report on Form 10-K includes “forward-looking statements” within the meaning of Section 27A of the Securities Act of 1933, as amended (the “Securities Act”), and Section 21E of the Securities Exchange Act of 1934, as amended (the “Exchange Act”). These forward-looking statements relate to expectations for future financial performance, business strategies or expectations for the post-combination business. Specifically, forward-looking statements may include statements relating to:
operational, economic, political and regulatory risks;
our ability to effectively compete in the specialty rental accommodations and hospitality services industry;
effective management of our communities;
natural disasters and other business disruptions including outbreaks of epidemic or pandemic disease;
the effect of changes in state building codes on marketing our buildings;
changes in demand within a number of key industry end-markets and geographic regions;
our reliance on third party manufacturers and suppliers;
failure to retain key personnel;
increases in raw material and labor costs;
the effect of impairment charges on our operating results;
our inability to recognize deferred tax assets and tax loss carry forwards;
our future operating results fluctuating, failing to match performance or to meet expectations;
our exposure to various possible claims and the potential inadequacy of our insurance;
unanticipated changes in our tax obligations;
our obligations under various laws and regulations;
the effect of litigation, judgments, orders or regulatory proceedings on our business;
our ability to successfully acquire and integrate new operations;
global or local economic and political movements;
our ability to effectively manage our credit risk and collect on our accounts receivable;
our ability to fulfill our public company obligations;
52
any failure of our management information systems;
our ability to meet our debt service requirements and obligations; and
risks related to Arrow Bidco’s obligations under the Notes;
These forward-looking statements are based on information available as of the date of this Form 10-K and our management’s current expectations, forecasts and assumptions, and involve a number of judgments, risks and uncertainties. Accordingly, forward-looking statements should not be relied upon as representing our views as of any subsequent date. We undertake no obligation to update forward-looking statements to reflect events or circumstances after the date they were made, whether as a result of new information, future events or otherwise, except as may be required under applicable securities laws.
53
Item 7. Management’s Discussion and Analysis of Financial Condition and Results of Operations
The following Management Discussion and Analysis of Financial Condition and Results of Operations (“MD&A”) summarizes the significant factors affecting the consolidated operating results, financial condition, liquidity and capital resources of Target Hospitality Corp. and is intended to help the reader understand Target Hospitality Corp., our operations and our present business environment. This discussion should be read in conjunction with the Company’s audited consolidated financial statements and notes to those statements included in Part II, Item 8 within this Annual Report on Form 10-K. References to “we,” “us,” “our”, “Target Hospitality,” or “the Company” refer to Target Hospitality Corp. and its consolidated subsidiaries at and after March 15, 2019 and to Platinum Eagle Acquisition Corp., our legal predecessor, for all periods prior to March 15, 2019. For purposes of this section, references to “Algeco US Holdings LLC,” or “Target Parent” refers to Algeco US Holdings LLC and its consolidated subsidiaries for periods from and after December 22, 2017 through March 15, 2019 and Target Logistics Management, LLC (“Target” or TLM”) and its consolidated subsidiaries for periods prior to December 21, 2017. For purposes of this section, references to “Signor Parent” refers to Arrow Parent Corp. and its consolidated subsidiaries for the period from September 7, 2018 through March 15, 2019.
Executive Summary and Outlook
Target Hospitality Corp. is the largest vertically integrated specialty rental and hospitality services company in the United States. The Company provides vertically integrated specialty rental and comprehensive hospitality services including: catering and food services, maintenance, housekeeping, grounds-keeping, security, health and recreation facilities, overall workforce community lodge management, concierge services and laundry service. As of December 31, 2019, our network included 25 locations to better serve our customers across the US.
For the year ended December 31, 2019, key drivers of financial performance include:
|
· |
Increased revenue of $80.5 million or 33% compared to the year ended 2018 driven by organic growth and the acquisition of Signor in September 2018 as well as the other acquisitions discussed in Note 4 in the notes to our audited consolidated financial statements included in Part II, Item 8 within this Annual Report on Form 10-K. |
|
· |
Increased revenue in the Permian Basin segment by $93.9 million or 78% as compared to the year ended December 31, 2018 through: |
|
o |
The acquisition of Signor which directly contributed to an increase of 4,388 available beds for the Permian Basin Segment as well as the other acquisitions referenced above. |
|
· |
Generated net income of approximately $6.2 million for the year ended December 31, 2019 as compared to net income of $5.0 million for the year ended December 31, 2018, which is primarily attributable to growth of the business, especially in the Permian Basin from the Signor and other acquisitions previously discussed, as well as savings in selling, general, and administrative expenses resulting primarily from a net reduction in acquisition-related expenses incurred in 2018 and not having an impairment loss in 2019, which are offset by an increase in interest expense due to the new 2024 Senior Secured Notes and New ABL. |
|
· |
Generated consolidated Adjusted EBITDA of $159.2 million representing an increase of $42.4 million or 36% as compared to the year ended December 31, 2018, which includes the impact of the acquisition of Signor, Superior and ProPetro as well as organic growth. |
In addition to the above, we also increased cash flows from operations by $34.3 million or 131% for the year ended December 31, 2019 compared to the year ended December 31, 2018.
Adjusted EBITDA is a non-GAAP measure. The GAAP measure most comparable to Adjusted EBITDA is Net income. Please see “Non-GAAP Financial Measures” for a definition and reconciliation to the most comparable GAAP measure.
54
Our proximity to customer activities influences occupancy and demand. We have built, own and operate the two largest specialty rental and hospitality services networks available to oil and gas customers operating in the Permian and Bakken regions. Our broad network often results in us having communities that are the closest to our customers’ job sites, which reduces commute times and costs, and improves the overall safety of our customers’ workforce. Our communities provide customers with cost efficiencies, as they are able to jointly use our communities and related infrastructure (i.e., power, water, sewer and IT) services alongside other customers operating in the same vicinity. Demand for our services is dependent upon activity levels, particularly our customers’ capital spending on exploration for, development, production and transportation of oil and natural gas and government immigration housing programs. The Permian has experienced elevated drilling activity as a result of improved technologies that have driven down the cost of production although a deceleration was experienced in the third quarter. Technological improvements in recent years to identify and extract hydrocarbons, as well as extensive oil and gas reserves in the Permian support sustained activity in the Permian for the foreseeable future.
Factors Affecting Results of Operations
We expect our business to continue to be affected by the key factors discussed below, as well as factors discussed in the section titled “Risk Factors” included elsewhere in this report. Our expectations are based on assumptions made by us and information currently available to us. To the extent our underlying assumptions about, or interpretations of, available information prove to be incorrect, our actual results may vary materially from our expected results.
Supply and Demand for Oil and Gas
As a provider of vertically integrated specialty rental and hospitality services, we are not directly impacted by oil and gas price fluctuations. However, these price fluctuations indirectly influence our activities and results of operations because the exploration and production (“E&P”) workforce is directly affected by price fluctuations and the industry’s expansion or contraction as a result of these fluctuations. Our occupancy volume depends on the size of the workforce within the oil and gas industry and the demand for labor. Oil and gas prices are volatile and influenced by numerous factors beyond our control, including the domestic and global supply of and demand for oil and gas. The commodities trading markets, as well as other supply and demand factors, may also influence the selling prices of oil and gas.
Availability and Cost of Capital
Capital markets conditions could affect our ability to access the debt and equity capital markets to the extent necessary to fund our future growth. Interest rates on future credit facilities and debt offerings could be higher than current levels, causing our financing costs to increase accordingly, and could limit our ability to raise funds, or increase the price of raising funds, in the capital markets and may limit our ability to expand.
Regulatory Compliance
We are subject to extensive federal, state, local, and foreign environmental, health and safety laws and regulations concerning matters such as air emissions, wastewater discharges, solid, and hazardous waste handling and disposal and the investigation and remediation of contamination. The risks of substantial costs, liabilities, and limitations on our operations related to compliance with these laws and regulations are an inherent part of our business, and future conditions may develop, arise, or be discovered that create substantial environmental compliance or remediation liabilities and costs.
Natural Disasters or Other Significant Disruption
An operational disruption in any of our facilities could negatively impact our financial results. The occurrence of a natural disaster, such as earthquake, tornado, severe weather including hail storms, flood, fire, or other unanticipated problems such as labor difficulties, equipment failure, capacity expansion difficulties or unscheduled maintenance could cause operational disruptions of varied duration. These types of disruptions could materially adversely affect our financial condition and results of operations to varying degrees dependent upon the facility, the duration of the disruption, our ability to shift business to another facility or find alternative solutions.
55
How We Evaluate Our Operations
We derive the majority of our revenue from specialty rental accommodations and vertically integrated hospitality services. Approximately 75.6% of our revenue was earned from specialty rental with vertically integrated hospitality services, specifically lodging and related ancillary services, whereas the remaining 24.4% of revenues were earned through leasing of lodging facilities (18.6%) and construction fee income (5.8%) for the year ended December 31, 2019. Our services include temporary living accommodations, catering food services, maintenance, housekeeping, grounds-keeping, on-site security, workforce community management, and laundry services. Revenue is recognized in the period in which lodging and services are provided pursuant to the terms of contractual relationships with our customers. In certain of our contracts, rates may vary over the contract term, in these cases, revenue is generally recognized on a straight-line basis over the contract term. We enter into arrangements with multiple deliverables for which arrangement consideration is allocated between lodging and services based on the relative estimated standalone selling price of each deliverable. The estimated price of lodging and services deliverables is based on the prices of lodging and services when sold separately or based upon the best estimate of selling price.
The Company originated a contract in 2013 with TransCanada Pipelines (“TCPL”) to construct, deliver, cater and manage all accommodations and hospitality services in conjunction with the planned construction of the Keystone XL pipeline project. During the construction phase of the contract, the Company recognizes revenue as costs are incurred in connection with the project under the percentage of completion method of accounting as more fully discussed in Note 1 of the notes to our audited consolidated financial statements included in Part II, Item 8 within this Annual Report on Form 10-K.
The Company also originated a contract on March 1, 2019 with a customer to construct, deliver, cater and manage all accommodations and hospitality services in conjunction with the construction of an accommodation facility in the Permian Basin. During the construction phase of the contract, the Company recognized revenue as costs are incurred in connection with the project under the percentage of completion method of accounting as more fully discussed in Note 1 of the notes to our audited consolidated financial statements included in Part II Item 8, within this Annual Report on this Form 10-K. The construction phase of this contract was completed in August 2019.
Our management uses a variety of financial and operating metrics to analyze our performance. We view these metrics as significant factors in assessing our operating results and profitability and intend to review these measurements frequently for consistency and trend analysis. We primarily review the following profit and loss information when assessing our performance.
Revenue
We analyze our revenues by comparing actual revenues to our internal projections for a given period and to prior periods to assess our performance. We believe that revenues are a meaningful indicator of the demand and pricing for our services. Key drivers to change in revenues may include average utilization of existing beds, levels of drilling activity in the Permian and Bakken basins, and the consumer price index impacting government contracts.
Adjusted Gross Profit
We analyze our adjusted gross profit, which is a Non-GAAP measure, which we define as revenues less cost of sales, excluding impairment and depreciation of specialty rental assets to measure our financial performance. Please see “Non-GAAP Financial Measures” for a definition and reconciliation to the most comparable GAAP measure. We believe adjusted gross profit is a meaningful metric because it provides insight on financial performance of our revenue streams without consideration of company overhead. Additionally, using adjusted gross profit gives us insight on factors impacting cost of sales, such as efficiencies of our direct labor and material costs. When analyzing adjusted gross profit, we compare actual adjusted gross profit to our internal projections and to prior period results for a given period in order to assess our performance.
56
Segments
We have identified three reportable business segments: the Permian Basin, the Bakken Basin and Government:
Permian Basin
The Permian Basin segment reflects our facilities and operations in the Permian Basin region and includes our 19 communities located across Texas and New Mexico.
Bakken Basin
The Bakken Basin segment reflects our facilities and operations in the Bakken Basin region and includes our 4 communities in North Dakota.
Government
The government segment (“Government”) includes the facilities and operations of the family residential center and the related support communities in Dilley, Texas (the “South Texas Family Residential Center”) provided under a lease and services agreement with CoreCivic (“CoreCivic”).
All Other
Our other facilities and operations which do not meet the criteria to be a separate reportable segment are consolidated and reported as “All Other” which represents the facilities and operations of one community in the Anadarko basin of Oklahoma, the catering and other services provided to communities and other workforce accommodation facilities for the oil, gas and mining industries not owned by us and initial work and future plans for facilities and services to be provided in connection with the TCPL project.
Key Factors Impacting the Comparability of Results
The historical results of operations for the periods presented may not be comparable, either to each other or to our future results of operations, for the reasons described below:
2017 Algeco US Holdings LLC Restructuring
On November 28, 2017, as part of the restructuring amongst entities under common control of TDR and ASG, ASG conducted a carve-out transaction of Target and Chard net assets from Williams Scotsman International Inc. (“WSII”) and Chard became a wholly-owned subsidiary of Target. Effective December 22, 2017, Target Parent acquired Target and Chard. Due to the acquisition of Target by Target Parent being a common control transaction, the prior period financial statements have been retrospectively adjusted to reflect the transaction as if it occurred at the beginning of the period presented. Because Target was owned by ASG prior to Target Parent’ formation, the historical operations of Target are deemed to be those of the Company. Thus, the financial statements included in this report reflect (i) the consolidated results of Target and Target Parent following the Restructuring on November 28, 2017; (ii) Target Parents’ equity structure since the date of its formation until the Business Combination on March 15, 2019. Due to the Restructuring discussed in Note 1 of the audited consolidated financial statements included in Part II, Item 8 within this Annual Report on Form 10-K, there are approximately $0.4 million, $17.3 million and $9.3 million of additional expenses related to the activity of Target Parent included in the consolidated statements of comprehensive income for the years ended December 31, 2019, 2018 and 2017, respectively. Approximately $0.2 million, $8.6 million and $0.5 million are reported in restructuring costs for the years ended December 31, 2019, 2018 and 2017, respectively. Approximately $0.2 million, $8.1 million and $8.8 million of these expenses are reported in selling, general and administrative expenses for the years ended December 31, 2019, 2018, and 2017 respectively. Such selling, general and administrative expenses were offset through charges to affiliated entities in the amount of approximately $5.3 million and recognized in other income, net for the year ended December 31, 2018 as more fully discussed in Note 19 of the audited consolidated financial statements included in Part
57
II, Item 8 within this Annual Report on Form 10-K. Approximately, $0, $0.6 million and $0.1 million is reported in other expense (income), net for the years ended December 31, 2019, 2018 and 2017, respectively.
2017 Target Logistics Management, LLC Restructuring
On December 22, 2017, in a restructuring transaction amongst entities under common control of TDR and ASG, Target Parent acquired 100% ownership of Target, a specialty rental company initially acquired by another subsidiary of ASG in 2013, as its operating company. As part of the restructuring, certain notes and intercompany accounts among Target and other ASG entities were offset and extinguished, any gain or loss on extinguishment of the notes and receivables have been recognized as contributions and distributions in equity. Further, immediately prior to the Restructuring transaction, on December 15, 2017, Target acquired all of membership interests of Iron Horse Managing Services, LLC and Iron Horse Ranch Yorktown, LLC (collectively, Iron Horse), in a transaction under common control of TDR. Iron Horse was initially acquired by another subsidiary of TDR on July 31, 2017 and accounted for as a business combination with the assets acquired and liabilities assumed recorded at fair value as of the date of the initial acquisition. The acquisition of Iron Horse expanded Target’s presence in the Texas Permian Basin, adding four lodges with approximately 1,000 beds in strategic locations across Texas.
Acquisitions
On September 7, 2018, Arrow Bidco purchased 100% of the membership interests of Signor. Signor’s results of operations are not directly comparable to the historical results of operations as Signor’s operating results are only included from the period from September 7, 2018. The acquisition of Signor further expanded our presence in the Texas Permian Basin, adding over 4,000 beds.
On June 19, 2019, TLM entered into the Superior Purchase Agreement with the Superior Sellers, and certain other parties named therein, pursuant to which TLM acquired substantially all of the assets in connection with the subject seller communities. This acquisition further expanded our presence in the Texas Permian Basin, adding 575 rooms. Prior to the acquisition, TLM was providing management and catering services to the Superior Sellers, which was terminated upon the closing of the acquisition.
On July 1, 2019, TLM purchased a 168-room community from ProPetro Services, Inc. On July 1, 2019, in connection with the purchase of this community, TLM and ProPetro entered into an amendment to its existing Network Lease and Services Agreement resulting in ProPetro leasing from the Company an additional 166 rooms per night for one year subject to three one-year extension options. The ProPetro acquisition further expanded the Company’s presence in the Permian Basin.
Business Combination Costs
We have incurred approximately $38.1 million in incremental costs related to the Business Combination that have been recognized as selling, general, and administrative expenses in the audited consolidated statement of comprehensive income for the year ended December 31, 2019. These costs include $8.0 million in transaction expenses relating to the consummation of the Business Combination. Additionally, certain members of the Company’s management and employees received bonus payments as a result of the Business Combination being consummated in the aggregate amount of $28.5 million. Finally, as part of the Business Combination being consummated, we recorded $1.6 million of compensation expense for the full loan forgiveness of certain executive members of management which has been recognized as a non-cash expense within the consolidated financial statements.
Public Company Costs
As part of becoming a public company, we also expect to incur additional significant and recurring expenses as a publicly traded company, including costs associated with the employment of additional personnel, compliance under the Exchange Act, annual and quarterly reports to common shareholders, registrar and transfer agent fees, national stock exchange fees, legal fees, audit fees, incremental director and officer liability insurance costs and director and officer compensation. For
58
the year ended December 31, 2019, excluding additional personnel costs, we incurred approximately $3.7 million of public company costs.
Results of Operations
The period to period comparisons of our results of operations have been prepared using the historical periods included in our audited consolidated financial statements. The following discussion should be read in conjunction with the audited consolidated financial statements and related notes included elsewhere in this document.
Consolidated Results of Operations for the years ended December 31, 2019, 2018 and 2017:
|
|
|
|
|
|
|
|
|
|
|
|
Amount of |
|
Percentage Change |
|
Amount of |
|
Percentage Change |
||
|
|
|
For the Years Ended |
|
Increase |
|
Favorable |
|
Increase |
|
Favorable |
|||||||||
|
|
|
December 31, |
|
(Decrease) |
|
(Unfavorable) |
|
(Decrease) |
|
(Unfavorable) |
|||||||||
|
|
|
2019 |
|
2018 |
|
2017 |
|
2019 vs. 2018 |
|
2019 vs. 2018 |
|
2018 vs. 2017 |
|
2018 vs. 2017 |
|||||
|
Revenue: |
|
|
|
|
|
|
|
|
|
|
|
|
|
|
|
||||
|
Services income |
|
$ |
242,817 |
|
$ |
163,656 |
|
$ |
73,498 |
|
$ |
79,161 |
|
48% |
|
$ |
90,158 |
|
123% |
|
Specialty rental income |
|
|
59,826 |
|
|
53,735 |
|
|
58,813 |
|
|
6,091 |
|
11% |
|
|
(5,078) |
|
-9% |
|
Construction fee income |
|
|
18,453 |
|
|
23,209 |
|
|
1,924 |
|
|
(4,756) |
|
-20% |
|
|
21,285 |
|
1106% |
|
Total revenue |
|
|
321,096 |
|
|
240,600 |
|
|
134,235 |
|
|
80,496 |
|
33% |
|
|
106,365 |
|
79% |
|
Costs: |
|
|
|
|
|
|
|
|
|
|
|
|
|
|
|
|
|
|
|
|
Services |
|
|
120,712 |
|
|
93,064 |
|
|
46,630 |
|
|
27,648 |
|
30% |
|
|
46,434 |
|
100% |
|
Specialty rental |
|
|
9,950 |
|
|
10,372 |
|
|
10,095 |
|
|
(422) |
|
-4% |
|
|
277 |
|
3% |
|
Depreciation of specialty rental assets |
|
|
43,421 |
|
|
31,610 |
|
|
24,464 |
|
|
11,811 |
|
37% |
|
|
7,146 |
|
29% |
|
Loss on impairment |
|
|
— |
|
|
15,320 |
|
|
— |
|
|
(15,320) |
|
-100% |
|
|
15,320 |
|
100% |
|
Gross Profit |
|
|
147,013 |
|
|
90,234 |
|
|
53,046 |
|
|
56,779 |
|
63% |
|
|
37,188 |
|
70% |
|
Selling, general and administrative |
|
|
76,464 |
|
|
41,340 |
|
|
24,337 |
|
|
35,124 |
|
85% |
|
|
17,003 |
|
70% |
|
Other depreciation and amortization |
|
|
15,481 |
|
|
7,518 |
|
|
5,681 |
|
|
7,963 |
|
106% |
|
|
1,837 |
|
32% |
|
Restructuring costs |
|
|
168 |
|
|
8,593 |
|
|
2,180 |
|
|
(8,425) |
|
-98% |
|
|
6,413 |
|
294% |
|
Currency (gains) losses, net |
|
|
(123) |
|
|
149 |
|
|
(91) |
|
|
(272) |
|
-183% |
|
|
240 |
|
-264% |
|
Other expense (income), net |
|
|
6,872 |
|
|
(8,275) |
|
|
(519) |
|
|
15,147 |
|
-183% |
|
|
(7,756) |
|
1494% |
|
Operating income |
|
|
48,151 |
|
|
40,909 |
|
|
21,458 |
|
|
7,242 |
|
18% |
|
|
19,451 |
|
91% |
|
Loss on extinguishment of debt |
|
|
907 |
|
|
— |
|
|
— |
|
|
907 |
|
100% |
|
|
— |
|
100% |
|
Interest expense, net |
|
|
33,401 |
|
|
24,198 |
|
|
(5,107) |
|
|
9,203 |
|
38% |
|
|
29,305 |
|
-574% |
|
Income before income tax |
|
|
13,843 |
|
|
16,711 |
|
|
26,565 |
|
|
(2,868) |
|
-17% |
|
|
(9,854) |
|
-37% |
|
Income tax expense |
|
|
7,607 |
|
|
11,755 |
|
|
25,584 |
|
|
(4,148) |
|
-35% |
|
|
(13,829) |
|
-54% |
|
Net income |
|
$ |
6,236 |
|
$ |
4,956 |
|
$ |
981 |
|
$ |
1,280 |
|
26% |
|
$ |
3,975 |
|
405% |
Comparison of Years Ended December 31, 2019 and 2018
Total Revenue. Total revenue was $321 million for the year ended December 31, 2019 as compared to $240.6 million for the year ended December 31, 2018, and consisted of $242.8 million of services income, $59.8 million of specialty rental income and $18.5 million of construction fee income. Total revenues for the year ended December 31, 2018 consisted of $163.7 million of services income, $53.7 million of specialty rental income and $23.2 million of construction fee income.
Services income consists primarily of specialty rental and vertically integrated hospitality services and comprehensive hospitality services including catering, food services, maintenance, housekeeping, grounds-keeping, security, overall workforce community management services, health and recreation facilities, concierge services and laundry service. Construction fee income consists of primarily of revenue from construction phase of the TCPL contract as well as the other contract originated on March 1, 2019 as previously mentioned. Specialty rental income consists primarily of revenues from renting rooms at facilities leased or owned.
The main driver of revenue was an increase in activity in the Permian Basin which is primarily attributable to the acquisition of Signor which took place in September 2018 as well as organic growth through capital expenditures. Total available beds increased from 10,977 beds (83% utilization) in December 2018 to 12,995 beds (83% utilization) in December 2019.
Cost of services. Cost of services was $120.7 million for the year ended December 31, 2019 as compared to $93.1 million for the year ended December 31, 2018.
59
The increase in Services costs is primarily due to an increase in activity within the Permian Basin. The acquisition of Signor, which principally operates in the Permian Basin also drove the increase in costs.
Specialty rental costs. Specialty rental costs were approximately $10.0 million for the year ended December 31, 2019 as compared to $10.4 million for the year ended December 31, 2018. The decrease in specialty rental costs is due to a reduction in utility, lease and other variable costs.
Depreciation of specialty rental assets. Depreciation of specialty rental assets was $43.4 million for the year ended December 31, 2019 as compared to $31.6 million for the year ended December 31, 2018.
The increase in depreciation expense is mainly due to a $9.7 million contribution to depreciation related to the acquisition of the Signor assets in September 2018 with the remaining increase attributable to assets placed into service.
Loss on impairment. Loss on impairment was $15.3 million for the year ended December 31, 2018 and was due to write downs of non-strategic asset groups in the following regions: $0.7 million in the Permian Basin, $7.4 million in the Canadian oil sands, and $7.2 million in the Bakken Basin. There was no loss on impairment recorded for the years ended December 31, 2019 or 2017.
Selling, general and administrative. Selling, general and administrative was $76.5 million for the year ended December 31, 2019 as compared to $41.3 million for the year ended December 31, 2018.
The increase in selling, general and administrative expenses is primarily due to the $38.1 million of costs associated with the Business Combination recognized for year ended December 31, 2019 as previously discussed as well as approximately $3.7 million of additional public company costs incurred during year ended December 31, 2019 as previously discussed. Additional increases include stock-based compensation, severance, sales commissions (due to growth in revenue), bad debt, claim settlement, insurance and other professional fees (including those associated with system implementation costs). These increases were offset by decreases in selling, general and administrative expenses due to $13.6 million of transaction expenses incurred in 2018 related to the Signor Acquisition and Business Combination effort as well as $7.4 million of Target Parent selling, general and administrative expenses incurred in 2018.
Other depreciation and amortization. Other depreciation and amortization expense was $15.5 million for the year ended December 31, 2019 as compared to $7.5 million for the year ended December 31, 2018.
The increase in other depreciation and amortization expense is due primarily to the amortization of customer relationship intangible assets from the Signor acquisition for year ended December 31, 2019.
Restructuring costs. Restructuring costs were $0.2 million for the year ended December 31, 2019 as compared to $8.6 million for the year ended December 31, 2018 primarily related to employee severance payments resulting from the closure of our Baltimore, MD corporate office.
The decrease in Restructuring costs is due to the final payments to the employees that have left or taken other positions related to the restructuring described above.
Other expense (income), net. Other expense (income), net was $6.9 million for the year ended December 31, 2019 as compared to $(8.3) million for the year ended December 31, 2018.
One of the Company’s properties in North Dakota incurred flood damage in November of 2017. During the year ended December 31, 2018, approximately $3.5 million in insurance proceeds were received and a $1.8 million gain on involuntary conversion associated with this event was recognized. During the year ended December 31, 2019 a loss was incurred on sales of land parcels in November for approximately $6.9 million.
Loss on extinguishment of debt. Loss on extinguishment of debt of $0.9 million and $0 for year ended December 31, 2019 and 2018, respectively, related to the write-off of deferred financing costs pertaining to non-continuing lenders associated with the modification of our ABL facility on March 15, 2019.
60
Interest expense, net. Interest expense, net was $33.4 million for the year ended December 31, 2019 as compared to interest expense, net of $24.2 million for the year ended December 31, 2018.
The change in interest expense is driven by increased interest being charged on the New ABL Facility and the 2024 Senior Secured Notes as compared the affiliate debt that was outstanding. Also, there was approximately $3.6 million of amortization of deferred financing costs and original issue discount related to the Algeco ABL facility, the New ABL Facility, and 2024 Senior Secured Notes issued in conjunction with the consummation of the Business Combination.
Income tax expense. Income tax expense was $7.6 million for the year ended December 31, 2019 as compared to $11.8 million for the year ended December 31, 2018. The decrease in income tax expense is primarily attributable to a decrease in income before taxes as well as a decrease in discrete items (benefits) related to transaction expenses associated with the Signor Acquisition and Business Combination.
Comparison of the Years Ended December 31, 2018 and 2017
For discussion of the comparison of our operating results for the years ended December 31, 2018 and 2017, please read section entitled “Target Parent and Signor Parent’s Combined Management’s Discussion and Analysis of Financial Condition and Results of Operations” included in our Current Report on Form 8-K filed on March 21, 2019 and is incorporated herein by reference.
Segment Results
The following table sets forth our selected results of operations for each of our reportable segments for the years ended December 31, 2019, 2018 and 2017.
|
|
|
|
|
|
|
|
|
|
|
|
|
|
Percentage |
|
|
|
Percentage |
|
||
|
|
|
|
|
|
|
|
|
|
|
|
Amount of Increase |
|
Change |
|
Amount of Increase |
|
Change |
|
||
|
|
|
For the Years Ended December 31, |
|
(Decrease) |
|
(Unfavorable) |
|
(Decrease) |
|
(Unfavorable) |
|
|||||||||
|
|
|
2019 |
|
|
2018 |
2017 |
|
2019 vs. 2018 |
|
2019 vs. 2018 |
|
2018 vs. 2017 |
|
2018 vs. 2017 |
|
|||||
|
Revenue: |
|
|
|
|
|
|
|
|
|
|
|
|
|
|
|
|
||||
|
Government |
|
$ |
66,972 |
|
$ |
66,676 |
|
$ |
66,722 |
|
$ |
296 |
|
— |
|
$ |
(46) |
|
0% |
|
|
Permian Basin |
|
|
214,464 |
|
|
120,590 |
|
|
41,439 |
|
|
93,874 |
|
78% |
|
|
79,151 |
|
191% |
|
|
Bakken Basin |
|
|
20,620 |
|
|
25,813 |
|
|
22,351 |
|
|
(5,193) |
|
-20% |
|
|
3,462 |
|
15% |
|
|
All Other |
|
|
19,040 |
|
|
27,521 |
|
|
3,723 |
|
|
(8,481) |
|
-31% |
|
|
23,798 |
|
639% |
|
|
Total Revenues |
|
$ |
321,096 |
|
$ |
240,600 |
|
$ |
134,235 |
|
$ |
80,496 |
|
33% |
|
$ |
106,365 |
|
79% |
|
|
|
|
|
|
|
|
|
|
|
|
|
|
|
|
|
|
|
|
|
|
|
|
Adjusted Gross Profit |
|
|
|
|
|
|
|
|
|
|
|
|
|
|
|
|
|
|
|
|
|
Government |
|
$ |
49,203 |
|
$ |
47,437 |
|
$ |
48,613 |
|
$ |
1,766 |
|
4% |
|
$ |
(1,176) |
|
-2% |
|
|
Permian Basin |
|
|
128,424 |
|
|
73,795 |
|
|
18,175 |
|
|
54,629 |
|
74% |
|
|
55,620 |
|
306% |
|
|
Bakken Basin |
|
|
8,511 |
|
|
10,554 |
|
|
9,333 |
|
|
(2,043) |
|
-19% |
|
|
1,221 |
|
13% |
|
|
All Other |
|
|
4,296 |
|
|
5,378 |
|
|
1,389 |
|
|
(1,082) |
|
-20% |
|
|
3,989 |
|
287% |
|
|
Total Adjusted Gross Profit |
|
$ |
190,434 |
|
$ |
137,164 |
|
$ |
77,510 |
|
$ |
53,270 |
|
39% |
|
$ |
59,654 |
|
77% |
|
|
|
|
|
|
|
|
|
|
|
|
|
|
|
|
|
|
|
|
|
|
|
|
Average Daily Rate |
|
|
|
|
|
|
|
|
|
|
|
|
|
|
|
|
|
|
|
|
|
Government |
|
$ |
74.5 |
|
$ |
74.7 |
|
$ |
74.8 |
|
$ |
(0.2) |
|
|
|
$ |
(0.1) |
|
|
|
|
Permian Basin |
|
$ |
84.7 |
|
$ |
88.2 |
|
$ |
93.8 |
|
$ |
(3.5) |
|
|
|
$ |
(5.6) |
|
|
|
|
Bakken Basin |
|
$ |
77.7 |
|
$ |
79.3 |
|
$ |
76.0 |
|
$ |
(1.6) |
|
|
|
$ |
3.3 |
|
|
|
|
Total Average Daily Rate |
|
$ |
81.2 |
|
$ |
82.7 |
|
$ |
80.4 |
|
$ |
(1.5) |
|
|
|
$ |
2.3 |
|
|
|
Note: Adjusted gross profit for the chief operating decision maker’s (“CODM”) analysis includes the services and rental costs recognized in the financial statements and excludes depreciation on specialty rental assets and loss on impairment. Average daily rate is calculated based on specialty rental income and services income received over the period indicated, divided by utilized bed nights.
61
Comparison of Years Ended December 31, 2019 and 2018
Government
Revenue for the Government segment was $67.0 million for the year ended December 31, 2019 as compared to $66.7 million for the year ended December 31, 2018.
Adjusted gross profit for the Government segment was $49.2 million for the year ended December 31, 2019 as compared to $47.4 million for the year ended December 31, 2018.
The increase in adjusted gross profit of $1.8 million is due to decreased occupancy which decreased costs in 2019 as revenue stayed flat for the year ended December 31, 2019, compared to the year ended December 31, 2018.
Permian Basin
Revenue for the Permian Basin segment was $214.5 million for the year ended December 31, 2019, as compared to $120.6 million for the year ended December 31, 2018.
Adjusted gross profit for the Permian Basin segment was $128.4 million for the year ended December 31, 2019, as compared to $73.8 million for the year ended December 31, 2018.
The increase in revenue of $93.8 million and increase in adjusted gross profit of $54.6 million is attributable to the acquisition of Signor which took place in September 2018 as well as organic growth through capital expenditures and the Superior and ProPetro acquisitions in 2019.
Bakken Basin
Revenue for the Bakken Basin segment was $20.6 million for the year ended December 31, 2019, as compared to $25.8 million for the year ended December 31, 2018.
Adjusted gross profit for the Bakken Basin segment was $8.5 million for the year ended December 31, 2019, as compared to $10.6 million for the year ended December 31, 2018.
The decrease in revenue of $5.2 million and decrease in adjusted gross profit of $2.0 million was driven by a decrease in ADR from $79.3 as for the year ended December 31, 2018 to $77.2 as for the year ended December 31, 2019 in conjunction with a decrease in utilized bed nights.
Comparison of the Years Ended December 31, 2018 and 2017
For discussion of the comparison of our operating results for the years ended December 31, 2018 and 2017, please read section entitled “Target Parent and Signor Parent’s Combined Management’s Discussion and Analysis of Financial Condition and Results of Operations” included in our Current Report on Form 8-K filed on March 21, 2019 and is incorporated herein by reference.
Liquidity and Capital Resources
Historically, our primary sources of liquidity have been capital contributions from our owners and cash flow from operations. We depend on cash flow from operations, cash on hand and borrowings under our New ABL Facility (as defined below) to finance our acquisition strategy, working capital needs, and capital expenditures. We currently believe that our cash on hand, along with these sources of funds will provide sufficient liquidity to fund debt service requirements, support our growth strategy, lease obligations, contingent liabilities and working capital investments for at least the next 12 months. However, we cannot assure you that we will be able to obtain future debt or equity financings adequate for our future cash requirements on commercially reasonable terms or at all.
62
If our cash flows and capital resources are insufficient, we may be forced to reduce or delay additional acquisitions, future investments and capital expenditures, and seek additional capital. Significant delays in our ability to finance planned acquisitions or capital expenditures may materially and adversely affect our future revenue prospects. We may from time to time seek to purchase our debt securities for cash or other consideration in open market purchases, privately-negotiated transactions, exchange offers or otherwise. Any such transactions will depend on prevailing market conditions, our liquidity requirements, contractual restrictions and other factors.
Capital Requirements
During the year ended December 31, 2019, we incurred $85.9 million in capital expenditures, excluding the acquisition of Superior. Our total annual 2019 capital spending included growth projects to increase community capacity. However, the amount and timing of these 2019 growth capital expenditures was largely discretionary and within our control. We could choose to defer or increase a portion of these growth capital expenditures in the future depending on a variety of factors, including, but not limited to, additional contracts awarded above and beyond our projections. As we pursue growth, we monitor which capital resources, including equity and debt financings, are available to us to meet our future financial obligations, planned capital expenditure activities and liquidity requirements. However, future cash flows are subject to a number of variables, including the ability to maintain existing contracts, obtain new contracts and manage our operating expenses. The failure to achieve anticipated revenue and cash flows from operations could result in a reduction in future capital spending. We cannot assure you that operations and other needed capital will be available on acceptable terms or at all. In the event we make additional acquisitions and the amount of capital required is greater than the amount we have available for acquisitions at that time, we could be required to reduce the expected level of capital expenditures or seek additional capital. We cannot assure you that needed capital will be available on acceptable terms or at all.
The following table sets forth general information derived from our audited consolidated statements of cash flows:
|
|
|
For the Years Ended |
|||||||
|
|
|
December 31, |
|||||||
|
|
|
2019 |
|
2018 |
|
2017 |
|||
|
|
|
|
|
|
|
|
|
|
|
|
Net cash provided by operating activities |
|
$ |
60,495 |
|
$ |
26,203 |
|
$ |
40,774 |
|
Net cash used in investing activities |
|
|
(112,705) |
|
|
(220,660) |
|
|
(130,246) |
|
Net cash provided by financing activities |
|
|
46,652 |
|
|
194,553 |
|
|
98,059 |
|
Effect of exchange rate changes on cash and cash equivalents |
|
|
(54) |
|
|
(178) |
|
|
136 |
|
Net (decrease) increase in cash and cash equivalents |
|
$ |
(5,612) |
|
$ |
(82) |
|
$ |
8,723 |
Comparison of Years Ended December 31, 2019 and 2018
Cash flows provided by operating activities. Net cash provided by operating activities was $60.5 million for the year ended December 31, 2019 compared to $26.2 million for the year ended December 31, 2018.
The increase in cash flows from operations is due to growth in the business resulting from the acquisition of Signor, Superior and ProPetro as well as organic growth. This increase in cash flows from operations was partially offset by $28.5 million of transaction bonus amounts paid for in connection with the Business Combination in March of 2019.
Cash flows used in investing activities. Net cash used in investing activities was $112.7 million for the year ended December 31, 2019 compared to $220.7 million for the year ended December 31, 2018. This decrease was primarily related to the acquisition of Signor in September 2018.
Cash flows provided by financing activities. Net cash flows provided by financing activities was $46.7 million for the year ended December 31, 2019 compared to $194.6 million for the year ended December 31, 2018. The decrease in cash from financing activities primarily reflects the decrease in cash received from affiliates in the amount of $223.3 million associated with the acquisition of Signor in 2018. This decrease is offset through increased borrowings net of payments on the New ABL Facility in 2019 as compared to 2018 of $40 million as well as net proceeds received in 2019 from the
63
Business Combination, which also included a capital contribution in the amount of $28.5 million to fund the bonus amounts paid in connection with the Business Combination previously discussed.
Comparison of the Years Ended December 31, 2018 and 2017
For discussion of the comparison of our operating results for the years ended December 31, 2018 and 2017, please read section entitled “Target Parent and Signor Parent’s Combined Management’s Discussion and Analysis of Financial Condition and Results of Operations” included in our Current Report on Form 8-K filed on March 21, 2019 and is incorporated herein by reference.
Indebtedness
The Company’s capital lease and other financing obligations as of December 31, 2019 consisted of $2.0 million of capital leases. In December 2019, the Company entered into a lease for certain equipment with a lease term expiring November 2022 and an effective interest rate of 4.3%. The Company’s lease relates to commercial-use vehicles.
The $1.3 million related to the equipment financing agreement as of December 31, 2018 was fully repaid in January 2019.
The Company entered into a capital lease for certain equipment with a lease term expiring in October 2019 and an effective interest rate of 7.43%. The Company’s capital leases relating to commercial-use vehicles have interest rates ranging from 3.3% to 20.7% with lease terms that expire through December 31, 2019.
New ABL Facility
On the Closing Date, in connection with the closing of the Business Combination, Topaz, Arrow Bidco, Target, Signor and each of their domestic subsidiaries entered into an ABL credit agreement that provides for a senior secured asset-based revolving credit facility in the aggregate principal amount of up to $125 million (the “New ABL Facility”). Approximately $40 million of proceeds from the New ABL Facility were used to finance a portion of the consideration payable and fees and expenses incurred in connection with the Business Combination. Additionally, $30 million was drawn on the New ABL Facility during June 2019 to fund the Superior acquisition and an additional $10 million was drawn in the fourth quarter of 2019 to fund non-routine expenditures. The maturity date of the New ABL Facility is September 15, 2023. Refer to Note 11 of the notes to our audited consolidated financial statements located in Part II, Item 8 within this Annual Report on Form 10-K for additional information on the New ABL Facility.
2024 Senior Secured Notes
In connection with the closing of the Business Combination, Bidco issued $340 million in aggregate principal amount of 9.50% senior secured notes due March 15, 2024 (the “2024 Senior Secured Notes” or “Notes”) under an indenture dated March 15, 2019 (the “Indenture”). The Indenture was entered into by and among Arrow Bidco, the guarantors named therein (the “Note Guarantors”), and Deutsche Bank Trust Company Americas, as trustee and as collateral agent. Interest is payable semi-annually on September 15 and March 15 beginning September 15, 2019. Refer to Note 11 of the notes to our audited consolidated financial statements located in Part II, Item 8 within this Annual Report on Form 10-K for additional discussion of the 2024 Senior Secured Notes.
64
Contractual Obligations
In the ordinary course of business, we enter into various contractual obligations for varying terms and amounts. The table below presents our significant contractual obligations as of December 31, 2019:
|
Contractual Obligations |
|
Total |
|
2020 |
|
2021 and 2022 |
|
2023 and 2024 |
|
2025 and beyond |
|||||
|
Capital lease and other financing obligations |
|
$ |
1,995 |
|
$ |
896 |
|
$ |
1,099 |
|
$ |
— |
|
$ |
— |
|
Asset retirement obligations |
|
|
3,274 |
|
|
— |
|
|
3,274 |
|
|
— |
|
|
— |
|
Interest payments(1) |
|
|
145,350 |
|
|
32,300 |
|
|
64,600 |
|
|
48,450 |
|
|
— |
|
New ABL Facility |
|
|
80,000 |
|
|
— |
|
|
— |
|
|
80,000 |
|
|
— |
|
2024 Senior Secured Notes |
|
|
340,000 |
|
|
— |
|
|
— |
|
|
340,000 |
|
|
— |
|
Total |
|
$ |
570,619 |
|
$ |
33,196 |
|
$ |
68,973 |
|
$ |
468,450 |
|
$ |
— |
|
(1) |
Pursuant to our 2024 Senior Secured Notes, we will incur and pay interest expense at 9.50% of the face value of $340.0 million annually, or $32.3 million. Over the remaining term of the Notes, interest payments total $145.4 million. |
Off-Balance Sheet Arrangements
We have no off-balance sheet arrangements that have or are reasonably likely to have a current or future material effect on our financial condition, changes in financial condition, revenues or expenses, results of operations, liquidity, capital expenditures or capital resources.
We lease certain land, community units, and real estate under non-cancelable operating leases, the terms of which vary and generally contain renewal options. Total rent expense under these leases is recognized ratably over the initial term of the lease. Any difference between the rent payment and the straight-line expense is recorded as a liability.
Rent expense included in services costs in the audited consolidated statements of comprehensive income for cancelable and non-cancelable leases was $12.5 million, $4.7 million, and $8.2 million for the years ended December 31, 2019, 2018, and 2017 respectively. Rent expense included in selling, general, and administrative expenses in the audited consolidated statements of comprehensive income for cancelable and non-cancelable leases was $0.6 million, $0.6 million and $0.3 million for the years ended December 31, 2019, 2018, and 2017 respectively.
Future minimum lease payments at December 31, 2019 by year and in the aggregate, under non-cancelable operating leases are as follows:
|
2020 |
|
$ |
2,130 |
|
2021 |
|
|
1,758 |
|
2022 |
|
|
1,345 |
|
2023 |
|
|
1,052 |
|
2024 |
|
|
323 |
|
Total |
|
$ |
6,608 |
Critical Accounting Policies and Estimates
Our management’s discussion and analysis of our financial condition and results of operations is based on our audited consolidated financial statements, which have been prepared in accordance with U.S. generally accepted accounting principles (“US GAAP”). For a discussion of the critical accounting policies and estimates that we use in the preparation of our audited consolidated financial statements, refer to Note 1 of the notes to our audited consolidated financial statements included in Part II, Item 8 within this Annual Report on Form 10-K.
65
Principles of Consolidation
Refer to Note 1 of the notes to our audited consolidated financial statements included in Part II, Item 8 within this Annual Report on Form 10-K for a discussion of principles of consolidation.
Recently Issued Accounting Standards
Refer to Note 1 of the notes to our audited consolidated financial statements included in Part II, Item 8 within this Annual Report on Form 10-K for our assessment of recently issued and adopted accounting standards.
Non-GAAP Financial Measures
We have included Adjusted gross profit, EBITDA and Adjusted EBITDA which are measurements not calculated in accordance with US GAAP, in the discussion of our financial results because they are key metrics used by management to assess financial performance. Our business is capital-intensive and these additional metrics allow management to further evaluate our operating performance.
Target Hospitality defines Adjusted gross profit, as gross profit plus depreciation of specialty rental assets and loss on impairment.
Target Hospitality defines EBITDA as net income before interest expense and loss on extinguishment of debt, income tax expense (benefit), depreciation of specialty rental assets, and other depreciation and amortization.
Adjusted EBITDA reflects the following further adjustments to EBITDA to exclude certain non-cash items and the effect of what management considers transactions or events not related to its core business operations:
|
· |
Other expense (income), net: Other expense (income), net includes losses from the sale of certain land parcels, consulting expenses related to certain projects, financing costs not classified as interest expense, gains and losses on disposals of property, plant, and equipment, involuntary conversion and other immaterial non-cash charges. Results for 2018 relate primarily to the gain on involuntary conversion and a recharge of management fees from Target Parent discussed in this Form 10-K. |
|
· |
Restructuring costs: Target Parent incurred certain costs associated with restructuring plans designed to streamline operations and reduce costs. |
|
· |
Currency (gains) losses, net: Foreign currency transaction gains or losses. |
|
· |
Transaction bonus amounts: Target Parent paid certain transaction bonuses to certain executives and employees related to the closing of the Business Combination. As discussed in Note 3 of our notes to our consolidated financial statements located in Part II, Item 8 within this Annual Report on Form 10-K, these bonuses were fully funded by a cash contribution from Algeco Seller in March of 2019. |
|
· |
Transaction expenses: Target Hospitality incurred certain transaction costs, including legal and professional fees, associated with the Business Combination. Such amounts were funded by proceeds from the Business Combination. |
|
· |
Acquisition-related expenses: Target Hospitality incurred certain transaction costs associated with the acquisition of Superior and Signor. |
|
· |
Officer loan expense: Non-cash charge associated with loans to certain executive officers of the Company that were forgiven and recognized as selling, general, and administrative expense upon consummation of the Business Combination. Such amounts are not expected to recur in the future. |
66
|
· |
Target Parent selling, general and administrative costs: Target Parent incurred certain costs in the form of legal and professional fees as well as transaction bonus amounts, primarily associated with a restructuring transaction that originated in 2017. |
|
· |
Stock-based compensation: Non-cash charges associated with stock-based compensation expense, which has been, and will continue to be for the foreseeable future, a significant recurring expense in our business and an important part of our compensation strategy |
|
· |
Other adjustments: System implementation costs, claim settlement, accounting standard implementation costs and certain severance costs. |
|
· |
Impairment loss: Loss on impairment due to write-downs of non-strategic asset groups in the Permian, Bakken and Canadian operations of the business. We view impairment charges as accelerated depreciation, and depreciation is excluded from EBITDA. |
EBITDA reflects net income excluding the impact of interest expense and loss on extinguishment of debt, provision for income taxes, depreciation, and amortization. We believe that EBITDA is a meaningful indicator of operating performance because we use it to measure our ability to service debt, fund capital expenditures, and expand our business. We also use EBITDA, as do analysts, lenders, investors, and others, to evaluate companies because it excludes certain items that can vary widely across different industries or among companies within the same industry. For example, interest expense can be dependent on a company’s capital structure, debt levels, and credit ratings. Accordingly, the impact of interest expense on earnings can vary significantly among companies. The tax positions of companies can also vary because of their differing abilities to take advantage of tax benefits and because of the tax policies of the jurisdictions in which they operate. As a result, effective tax rates and provision for income taxes can vary considerably among companies. EBITDA also excludes depreciation and amortization expense, because companies utilize productive assets of different ages and use different methods of both acquiring and depreciating productive assets. These differences can result in considerable variability in the relative costs of productive assets and the depreciation and amortization expense among companies.
Target Hospitality also believes that Adjusted EBITDA is a meaningful indicator of operating performance. Our Adjusted EBITDA reflects adjustments to exclude the effects of additional items, including certain items, that are not reflective of the ongoing operating results of Target Hospitality. In addition, to derive Adjusted EBITDA, we exclude gains or losses on the sale of depreciable assets and impairment losses because including them in EBITDA is inconsistent with reporting the ongoing performance of our remaining assets. Additionally, the gain or loss on sale of depreciable assets and impairment losses represents either accelerated depreciation or excess depreciation in previous periods, and depreciation is excluded from EBITDA.
Adjusted gross profit, EBITDA, and Adjusted EBITDA are not measurements of Target Hospitality’s financial performance under GAAP and should not be considered as alternatives to gross profit, net income or other performance measures derived in accordance with GAAP, or as alternatives to cash flow from operating activities as measures of Target Hospitality’s liquidity. Adjusted gross profit, EBITDA, and Adjusted EBITDA should not be considered as discretionary cash available to Target Hospitality to reinvest in the growth of our business or as measures of cash that is available to it to meet our obligations. In addition, the measurement of Adjusted gross profit, EBITDA, and Adjusted EBITDA may not be comparable to similarly titled measures of other companies. Target Hospitality’s management believe that Adjusted gross profit, EBITDA, and Adjusted EBITDA provide useful information to investors about Target Hospitality and its financial condition and results of operations for the following reasons: (i) they are among the measures used by Target Hospitality’s management team to evaluate its operating performance; (ii) they are among the measures used by Target Hospitality’s management team to make day-to-day operating decisions, (iii) they are frequently used by securities analysts, investors and other interested parties as a common performance measure to compare results across companies in Target Hospitality’s industry.
67
The following table presents a reconciliation of Target Hospitality’s consolidated gross profit to Adjusted gross profit:
|
|
|
For the Years Ended |
|||||||
|
|
|
December 31, |
|||||||
|
|
|
2019 |
|
2018 |
|
2017 |
|||
|
Gross Profit |
|
$ |
147,013 |
|
$ |
90,234 |
|
$ |
53,046 |
|
Depreciation of specialty rental assets |
|
|
43,421 |
|
|
31,610 |
|
|
24,464 |
|
Loss on impairment |
|
|
— |
|
|
15,320 |
|
|
— |
|
Adjusted gross profit |
|
$ |
190,434 |
|
$ |
137,164 |
|
$ |
77,510 |
The following table presents a reconciliation of Target Hospitality’s consolidated net income to EBITDA and Adjusted EBITDA:
|
|
|
For the Years Ended |
|||||||
|
|
|
December 31, |
|||||||
|
|
|
2019 |
|
2018 |
|
2017 |
|||
|
Net income |
|
$ |
6,236 |
|
$ |
4,956 |
|
$ |
981 |
|
Income tax expense |
|
|
7,607 |
|
|
11,755 |
|
|
25,584 |
|
Interest expense (income), net |
|
|
33,401 |
|
|
24,198 |
|
|
(5,107) |
|
Loss on extinguishment of debt |
|
|
907 |
|
|
— |
|
|
— |
|
Other depreciation and amortization |
|
|
15,481 |
|
|
7,518 |
|
|
5,681 |
|
Depreciation of specialty rental assets |
|
|
43,421 |
|
|
31,610 |
|
|
24,464 |
|
EBITDA |
|
|
107,053 |
|
|
80,037 |
|
|
51,603 |
|
|
|
|
|
|
|
|
|
|
|
|
Adjustments |
|
|
|
|
|
|
|
|
|
|
Loss on impairment |
|
|
— |
|
|
15,320 |
|
|
— |
|
Other expense (income), net |
|
|
8,031 |
|
|
(8,275) |
|
|
(519) |
|
Restructuring costs |
|
|
168 |
|
|
8,593 |
|
|
2,180 |
|
Currency (gains) losses, net |
|
|
(123) |
|
|
149 |
|
|
(91) |
|
Transaction bonus amounts |
|
|
28,519 |
|
|
— |
|
|
— |
|
Transaction expenses |
|
|
9,838 |
|
|
8,400 |
|
|
— |
|
Acquisition-related expenses |
|
|
370 |
|
|
5,211 |
|
|
— |
|
Officer loan expense |
|
|
1,583 |
|
|
— |
|
|
— |
|
Target Parent selling, general, and administrative costs |
|
|
246 |
|
|
7,378 |
|
|
8,771 |
|
Stock-based compensation |
|
|
1,527 |
|
|
— |
|
|
— |
|
Other adjustments |
|
|
1,976 |
|
|
— |
|
|
— |
|
Adjusted EBITDA |
|
$ |
159,188 |
|
$ |
116,813 |
|
|
61,944 |
Item 7A. Quantitative and Qualitative Disclosures About Market Risk
Our principal market risks are our exposure to interest rates and commodity risks.
Interest Rates
We have the New ABL Facility that is subject to the risk of higher interest charges associated with increases in interest rates. As of December 31, 2019, we had $80.0 million of outstanding floating-rate obligations under our credit facilities. These floating-rate obligations expose us to the risk of increased interest expense in the event of increases in short-term interest rates. If floating interest rates increased by 100 basis points, our consolidated interest expense would increase by approximately $0.8 million annually, based on our floating-rate debt obligations and interest rates in effect as of December 31, 2019.
68
Commodity Risk
Commodity price fluctuations also indirectly influence our activities and results of operations over the long-term because they may affect production rates and investments by E&P companies in the development of oil and gas reserves. Generally, lodging activity will increase as oil and gas prices increase.
We have limited direct exposure to risks associated with fluctuating commodity prices of crude oil. However, both our profitability and our cash flows are affected by volatility in the price of crude oil. Adverse effects on our cash flow from reductions in crude oil prices could adversely affect our ability to make distributions to shareholders. We do not currently hedge our exposure to crude oil prices.
Additionally, we believe that inflation has not had a material effect on our results of operations.
69
Report of Independent Registered Public Accounting Firm
To the Stockholders and the Board of Directors of Target Hospitality Corp.
Opinion on the Financial Statements
We have audited the accompanying consolidated balance sheets of Target Hospitality Corp. (the Company) as of December 31, 2019 and 2018, and the related consolidated statements of comprehensive income, changes in stockholders’ equity and cash flows for each of the three years in the period ended December 31, 2019, and the related notes (collectively referred to as the “consolidated financial statements”). In our opinion, the consolidated financial statements present fairly, in all material respects, the financial position of the Company at December 31, 2019 and 2018, and the results of its operations and its cash flows for each of the three years in the period ended December 31, 2019, in conformity with U.S. generally accepted accounting principles.
Basis for Opinion
These financial statements are the responsibility of the Company's management. Our responsibility is to express an opinion on the Company’s financial statements based on our audits. We are a public accounting firm registered with the Public Company Accounting Oversight Board (United States) (PCAOB) and are required to be independent with respect to the Company in accordance with the U.S. federal securities laws and the applicable rules and regulations of the Securities and Exchange Commission and the PCAOB. We conducted our audits in accordance with the standards of the PCAOB. Those standards require that we plan and perform the audit to obtain reasonable assurance about whether the financial statements are free of material misstatement, whether due to error or fraud. The Company is not required to have, nor were we engaged to perform, an audit of its internal control over financial reporting. As part of our audits we are required to obtain an understanding of internal control over financial reporting but not for the purpose of expressing an opinion on the effectiveness of the Company’s internal control over financial reporting. Accordingly, we express no such opinion
Our audits included performing procedures to assess the risks of material misstatement of the financial statements, whether due to error or fraud, and performing procedures that respond to those risks. Such procedures included examining, on a test basis, evidence regarding the amounts and disclosures in the financial statements. Our audits also included evaluating the accounting principles used and significant estimates made by management, as well as evaluating the overall presentation of the financial statements. We believe that our audits provide a reasonable basis for our opinion.
/s/ Ernst & Young LLP
We have served as the Company’s auditor since 2018.
Houston, Texas
March 12, 2020
70
Item 8. Financial Statements and Supplementary Data
Target Hospitality Corp.
($ in thousands)
|
|
|
December 31, |
|
December 31, |
||
|
|
|
2019 |
|
2018 |
||
|
Assets |
|
|
|
|
|
|
|
Current assets: |
|
|
|
|
|
|
|
Cash and cash equivalents |
|
$ |
6,787 |
|
$ |
12,194 |
|
Accounts receivable, less allowance for doubtful accounts of $989 and $39, respectively |
|
|
48,483 |
|
|
57,106 |
|
Prepaid expenses and other assets |
|
|
4,649 |
|
|
3,965 |
|
Related party receivable |
|
|
876 |
|
|
— |
|
Notes due from affiliates |
|
|
— |
|
|
638 |
|
Notes due from officers |
|
|
— |
|
|
1,083 |
|
Total current assets |
|
|
60,795 |
|
|
74,986 |
|
|
|
|
|
|
|
|
|
Restricted cash |
|
|
52 |
|
|
257 |
|
Specialty rental assets, net |
|
|
353,695 |
|
|
293,559 |
|
Other property, plant and equipment, net |
|
|
11,541 |
|
|
18,882 |
|
Goodwill |
|
|
41,038 |
|
|
34,180 |
|
Other intangible assets, net |
|
|
117,866 |
|
|
127,383 |
|
Deferred tax asset |
|
|
6,427 |
|
|
12,420 |
|
Deferred financing costs revolver, net |
|
|
4,688 |
|
|
2,865 |
|
Notes due from officers |
|
|
— |
|
|
500 |
|
Other non-current assets |
|
|
4,690 |
|
|
— |
|
Total assets |
|
$ |
600,792 |
|
$ |
565,032 |
|
|
|
|
|
|
|
|
|
Liabilities |
|
|
|
|
|
|
|
Current liabilities: |
|
|
|
|
|
|
|
Accounts payable |
|
$ |
7,793 |
|
$ |
21,597 |
|
Accrued liabilities |
|
|
35,330 |
|
|
23,300 |
|
Deferred revenue and customer deposits |
|
|
16,809 |
|
|
17,805 |
|
Current portion of capital lease and other financing obligations (Note 11) |
|
|
989 |
|
|
2,446 |
|
Total current liabilities |
|
|
60,921 |
|
|
65,148 |
|
|
|
|
|
|
|
|
|
Other liabilities: |
|
|
|
|
|
|
|
Long-term debt (Note 11): |
|
|
|
|
|
|
|
Principal amount |
|
|
340,000 |
|
|
— |
|
Less: unamortized original issue discount |
|
|
(2,876) |
|
|
— |
|
Less: unamortized term loan deferred financing costs |
|
|
(13,866) |
|
|
— |
|
Long-term debt, net |
|
|
323,258 |
|
|
— |
|
Revolving credit facility (Note 11) |
|
|
80,000 |
|
|
20,550 |
|
Long-term capital lease and other financing obligations (Note 11) |
|
|
996 |
|
|
14 |
|
Note due to affiliates |
|
|
— |
|
|
108,047 |
|
Deferred revenue and customer deposits |
|
|
9,390 |
|
|
19,571 |
|
Asset retirement obligations |
|
|
2,825 |
|
|
2,610 |
|
Other non-current liabilities |
|
|
— |
|
|
101 |
|
Total liabilities |
|
|
477,390 |
|
|
216,041 |
|
|
|
|
|
|
|
|
|
Commitments and contingencies (Note 17) |
|
|
|
|
|
|
|
Stockholders' equity: |
|
|
|
|
|
|
|
Common stock, $0.0001 par, 380,000,000 authorized, 105,254,929 issued and 100,840,162 outstanding as of December 31, 2019 and 74,786,327 issued and outstanding as of December 31, 2018. |
|
|
10 |
|
|
7 |
|
Common stock held in treasury at cost, 4,414,767 and 0 shares as of December 31, 2019 and December 31, 2018, respectively. |
|
|
(23,559) |
|
|
— |
|
Additional paid-in-capital |
|
|
111,794 |
|
|
319,968 |
|
Accumulated other comprehensive loss |
|
|
(2,558) |
|
|
(2,463) |
|
Accumulated earnings |
|
|
37,715 |
|
|
31,479 |
|
Total stockholders' equity |
|
|
123,402 |
|
|
348,991 |
|
Total liabilities and stockholders' equity |
|
$ |
600,792 |
|
$ |
565,032 |
See accompanying notes which are an integral part of these consolidated financial statements.
71
Target Hospitality Corp.
Consolidated Statements of Comprehensive Income
($ in thousands, except per share amounts)
|
|
|
|
For the Years Ended |
|
|||||||
|
|
|
|
December 31, |
|
|||||||
|
|
|
|
2019 |
|
2018 |
|
2017 |
|
|||
|
Revenue: |
|
|
|
|
|
|
|
|
|
|
|
|
Services income |
|
|
$ |
242,817 |
|
$ |
163,656 |
|
$ |
73,498 |
|
|
Specialty rental income |
|
|
|
59,826 |
|
|
53,735 |
|
|
58,813 |
|
|
Construction fee income |
|
|
|
18,453 |
|
|
23,209 |
|
|
1,924 |
|
|
Total revenue |
|
|
|
321,096 |
|
|
240,600 |
|
|
134,235 |
|
|
Costs: |
|
|
|
|
|
|
|
|
|
|
|
|
Services |
|
|
|
120,712 |
|
|
93,064 |
|
|
46,630 |
|
|
Specialty rental |
|
|
|
9,950 |
|
|
10,372 |
|
|
10,095 |
|
|
Depreciation of specialty rental assets |
|
|
|
43,421 |
|
|
31,610 |
|
|
24,464 |
|
|
Loss on impairment |
|
|
|
— |
|
|
15,320 |
|
|
— |
|
|
Gross profit |
|
|
|
147,013 |
|
|
90,234 |
|
|
53,046 |
|
|
Selling, general and administrative |
|
|
|
76,464 |
|
|
41,340 |
|
|
24,337 |
|
|
Other depreciation and amortization |
|
|
|
15,481 |
|
|
7,518 |
|
|
5,681 |
|
|
Restructuring costs |
|
|
|
168 |
|
|
8,593 |
|
|
2,180 |
|
|
Currency (gains) losses, net |
|
|
|
(123) |
|
|
149 |
|
|
(91) |
|
|
Other expense (income), net |
|
|
|
6,872 |
|
|
(8,275) |
|
|
(519) |
|
|
Operating income |
|
|
|
48,151 |
|
|
40,909 |
|
|
21,458 |
|
|
Loss on extinguishment of debt |
907 |
— |
— |
||||||||
|
Interest expense (income), net |
|
|
|
33,401 |
|
|
24,198 |
|
|
(5,107) |
|
|
Income before income tax |
|
|
|
13,843 |
|
|
16,711 |
|
|
26,565 |
|
|
Income tax expense |
|
|
|
7,607 |
|
|
11,755 |
|
|
25,584 |
|
|
Net income |
|
|
|
6,236 |
|
|
4,956 |
|
|
981 |
|
|
Other comprehensive income |
|
|
|
|
|
|
|
|
|
|
|
|
Foreign currency translation |
|
|
|
(95) |
|
|
(841) |
|
|
618 |
|
|
Comprehensive income |
|
|
|
6,141 |
|
|
4,115 |
|
|
1,599 |
|
|
|
|
|
|
|
|
|
|
|
|
|
|
|
|
|
|
|
|
|
|
|
|
|
|
|
|
Weighted average number shares outstanding - basic and diluted |
|
|
|
94,501,789 |
|
|
41,290,711 |
|
|
25,686,327 |
|
|
|
|
|
|
|
|
|
|
|
|
|
|
|
Net income per share - basic and diluted |
|
|
$ |
0.07 |
|
$ |
0.12 |
|
$ |
0.04 |
|
See accompanying notes which are an integral part of these consolidated financial statements
72
Target Hospitality Corp.
Consolidated Statements of Changes in Stockholders’ Equity
For the years ended December 31, 2019, 2018 and 2017
($ in thousands)
|
|
|
Common Stock |
|
Common Stock in Treasury |
|
|
|
|
|
|
|
|
|
|
|
|
|
|
|
||||||
|
|
|
|
|
|
|
|
|
|
|
Additional Paid |
|
|
|
Accumulated Other |
|
Accumulated |
|
Total |
|||||||
|
|
|
Shares |
|
Amount |
|
Shares |
|
Amount |
|
In Capital |
|
Equity (Deficit) |
|
Comprehensive Loss |
|
Earnings |
|
Stockholders' Equity |
|||||||
|
Balances at December 31, 2016 as previously reported |
|
|
|
$ |
|
|
|
|
$ |
|
|
$ |
|
|
$ |
274,663 |
|
$ |
(2,240) |
|
$ |
38,151 |
|
$ |
310,574 |
|
Retroactive application of recapitalization |
|
25,686,327 |
|
|
3 |
|
— |
|
|
— |
|
|
— |
|
|
(274,663) |
|
|
|
|
|
274,660 |
|
|
— |
|
Adjusted Balances at December 31, 2016 |
|
25,686,327 |
|
$ |
3 |
|
— |
|
$ |
— |
|
$ |
— |
|
$ |
— |
|
$ |
(2,240) |
|
$ |
312,811 |
|
$ |
310,574 |
|
|
|
|
|
|
|
|
|
|
|
|
|
|
|
|
|
|
|
|
|
|
|
|
|
|
|
|
Net income |
|
— |
|
|
— |
|
— |
|
|
— |
|
|
— |
|
|
— |
|
|
— |
|
|
981 |
|
|
981 |
|
Net Distribution upon Restructuring |
|
— |
|
|
— |
|
— |
|
|
— |
|
|
— |
|
|
— |
|
|
— |
|
|
(101,047) |
|
|
(101,047) |
|
Net distribution to affiliate |
|
— |
|
|
— |
|
— |
|
|
— |
|
|
— |
|
|
— |
|
|
— |
|
|
(186,222) |
|
|
(186,222) |
|
Cumulative translation adjustment |
|
— |
|
|
— |
|
— |
|
|
— |
|
|
|
|
|
— |
|
|
618 |
|
|
— |
|
|
618 |
|
Balances at December 31, 2017 |
|
25,686,327 |
|
$ |
3 |
|
— |
|
$ |
— |
|
$ |
— |
|
$ |
— |
|
$ |
(1,622) |
|
$ |
26,523 |
|
$ |
24,904 |
|
|
|
|
|
|
|
|
|
|
|
|
|
|
|
|
|
|
|
|
|
|
|
|
|
|
|
|
Net income |
|
— |
|
|
— |
|
— |
|
|
— |
|
|
— |
|
|
— |
|
|
— |
|
|
4,956 |
|
|
4,956 |
|
Distribution |
|
— |
|
|
— |
|
— |
|
|
— |
|
|
(26,738) |
|
|
— |
|
|
— |
|
|
— |
|
|
(26,738) |
|
Contribution |
|
— |
|
|
— |
|
— |
|
|
— |
|
|
346,710 |
|
|
— |
|
|
— |
|
|
— |
|
|
346,710 |
|
Retroactive application of recapitalization |
|
49,100,000 |
|
|
4 |
|
— |
|
|
— |
|
|
(4) |
|
|
— |
|
|
— |
|
|
— |
|
|
— |
|
Cumulative translation adjustment |
|
— |
|
|
— |
|
— |
|
|
— |
|
|
— |
|
|
— |
|
|
(841) |
|
|
— |
|
|
(841) |
|
Balances at December 31, 2018 |
|
74,786,327 |
|
$ |
7 |
|
— |
|
$ |
— |
|
$ |
319,968 |
|
$ |
— |
|
$ |
(2,463) |
|
$ |
31,479 |
|
$ |
348,991 |
|
|
|
|
|
|
|
|
|
|
|
|
|
|
|
|
|
|
|
|
|
|
|
|
|
|
|
|
Net income |
|
— |
|
|
— |
|
— |
|
|
— |
|
|
— |
|
|
— |
|
|
— |
|
|
6,236 |
|
|
6,236 |
|
Recapitalization transaction |
|
30,446,606 |
|
|
3 |
|
— |
|
|
— |
|
|
314,194 |
|
|
— |
|
|
— |
|
|
— |
|
|
314,197 |
|
Contribution |
|
— |
|
|
— |
|
— |
|
|
— |
|
|
39,107 |
|
|
— |
|
|
— |
|
|
— |
|
|
39,107 |
|
Recapitalization transaction - cash paid to Algeco Seller |
|
— |
|
|
— |
|
— |
|
|
— |
|
|
(563,134) |
|
|
— |
|
|
— |
|
|
— |
|
|
(563,134) |
|
Stock-based compensation |
|
21,996 |
|
|
— |
|
— |
|
|
— |
|
|
1,749 |
|
|
— |
|
|
— |
|
|
— |
|
|
1,749 |
|
Shares used to settle payroll tax withholding |
|
— |
|
|
— |
|
— |
|
|
— |
|
|
(90) |
|
|
— |
|
|
— |
|
|
— |
|
|
(90) |
|
Repurchase of common stock as part of a share repurchase program |
|
(4,414,767) |
|
|
— |
|
4,414,767 |
|
|
(23,559) |
|
|
— |
|
|
— |
|
|
— |
|
|
— |
|
|
(23,559) |
|
Cumulative translation adjustment |
|
— |
|
|
— |
|
— |
|
|
— |
|
|
— |
|
|
— |
|
|
(95) |
|
|
— |
|
|
(95) |
|
Balances at December 31, 2019 |
|
100,840,162 |
|
$ |
10 |
|
4,414,767 |
|
$ |
(23,559) |
|
$ |
111,794 |
|
$ |
— |
|
$ |
(2,558) |
|
$ |
37,715 |
|
$ |
123,402 |
See accompanying notes which are an integral part of these consolidated financial statements.
73
Target Hospitality Corp.
Consolidated Statements of Cash Flows
($ in thousands)
|
|
|
For the Years Ended |
|||||||
|
|
|
December 31, |
|||||||
|
|
|
2019 |
|
2018 |
|
|
2017 |
||
|
Cash flows from operating activities: |
|
|
|
|
|
|
|
|
|
|
Net income |
|
$ |
6,236 |
|
$ |
4,956 |
|
$ |
981 |
|
Adjustments to reconcile net income to net cash provided by operating activities: |
|
|
|
|
|
|
|
|
|
|
Depreciation |
|
|
44,585 |
|
|
31,952 |
|
|
25,244 |
|
Amortization of intangible assets |
|
|
14,317 |
|
|
7,176 |
|
|
4,902 |
|
Loss on impairment |
|
|
— |
|
|
15,320 |
|
|
— |
|
Accretion of asset retirement obligation |
|
|
215 |
|
|
202 |
|
|
140 |
|
Amortization of deferred financing costs |
|
|
3,204 |
|
|
608 |
|
|
— |
|
Amortization of original issue discount |
|
|
425 |
|
|
— |
|
|
— |
|
Stock-based compensation expense |
|
|
1,749 |
|
|
— |
|
|
— |
|
Officer loan compensation expense |
|
|
1,583 |
|
|
792 |
|
|
625 |
|
(Gain) loss on sale of specialty rental assets and other property, plant and equipment |
|
|
6,872 |
|
|
— |
|
|
(31) |
|
Loss (gain) on involuntary conversion |
|
|
122 |
|
|
(1,678) |
|
|
— |
|
Loss on extinguishment of debt |
|
|
907 |
|
|
— |
|
|
— |
|
Deferred income taxes |
|
|
5,992 |
|
|
10,864 |
|
|
21,878 |
|
Provision (benefit) for loss on receivables, net of recoveries |
|
|
1,183 |
|
|
(98) |
|
|
426 |
|
Changes in operating assets and liabilities (net of business acquired) |
|
|
|
|
|
|
|
|
|
|
Accounts receivable |
|
|
7,440 |
|
|
(25,908) |
|
|
(6,877) |
|
Related party receivable |
|
|
(855) |
|
|
— |
|
|
— |
|
Prepaid expenses and other assets |
|
|
(684) |
|
|
(361) |
|
|
(2,385) |
|
Accounts payable and other accrued liabilities |
|
|
(16,826) |
|
|
5,329 |
|
|
6,600 |
|
Deferred revenue and customer deposits |
|
|
(11,177) |
|
|
(20,531) |
|
|
(15,288) |
|
Other non-current assets and liabilities |
|
|
(4,793) |
|
|
(2,420) |
|
|
4,559 |
|
Net cash provided by operating activities |
|
|
60,495 |
|
|
26,203 |
|
|
40,774 |
|
Cash flows from investing activities: |
|
|
|
|
|
|
|
|
|
|
Purchase of specialty rental assets |
|
|
(84,732) |
|
|
(78,733) |
|
|
(15,315) |
|
Purchase of property, plant and equipment |
|
|
(441) |
|
|
(951) |
|
|
(899) |
|
Purchase of business, net of cash acquired |
|
|
(30,000) |
|
|
(200,099) |
|
|
(36,538) |
|
Proceeds from the sale of specialty rental assets and other property, plant and equipment |
|
|
1,444 |
|
|
— |
|
|
1,562 |
|
Receipt of insurance proceeds |
|
|
386 |
|
|
3,478 |
|
|
— |
|
Repayments from affiliates |
|
|
638 |
|
|
55,645 |
|
|
— |
|
Advances to affiliate |
|
|
— |
|
|
— |
|
|
(79,056) |
|
Net cash used in investing activities |
|
|
(112,705) |
|
|
(220,660) |
|
|
(130,246) |
|
Cash flows from financing activities: |
|
|
|
|
|
|
|
|
|
|
Proceeds from borrowings on Senior Secured Notes, net of discount |
|
|
336,699 |
|
|
— |
|
|
— |
|
Principal payments on finance and capital lease obligations |
|
|
(2,331) |
|
|
(14,967) |
|
|
(13,827) |
|
Principal payments on borrowings from ABL |
|
|
(48,790) |
|
|
(40,076) |
|
|
— |
|
Proceeds from borrowings on ABL |
|
|
108,240 |
|
|
59,550 |
|
|
1,994 |
|
Repayment of affiliate note |
|
|
(3,762) |
|
|
(256,626) |
|
|
— |
|
Contributions from affiliate |
|
|
39,107 |
|
|
346,710 |
|
|
125,593 |
|
Distribution to affiliate |
|
|
— |
|
|
(26,738) |
|
|
(23,561) |
|
Recapitalization |
|
|
218,752 |
|
|
— |
|
|
— |
|
Recapitalization - cash paid to Algeco Seller |
|
|
(563,134) |
|
|
— |
|
|
— |
|
Payment of deferred financing costs |
|
|
(19,798) |
|
|
(3,473) |
|
|
— |
|
Restricted shares surrendered to pay tax liabilities |
|
|
(90) |
|
|
— |
|
|
— |
|
Purchase of treasury stock |
|
|
(18,241) |
|
|
— |
|
|
— |
|
Proceeds from affiliate note |
|
|
— |
|
|
130,173 |
|
|
13,500 |
|
Cash paid for acquisition of Target |
|
|
— |
|
|
— |
|
|
(5,640) |
|
Net cash provided by financing activities |
|
|
46,652 |
|
|
194,553 |
|
|
98,059 |
|
|
|
|
|
|
|
|
|
|
|
|
Effect of exchange rate changes on cash and cash equivalents |
|
|
(54) |
|
|
(178) |
|
|
136 |
|
|
|
|
|
|
|
|
|
|
|
|
Net (decrease) increase in cash, cash equivalents and restricted cash |
|
|
(5,612) |
|
|
(82) |
|
|
8,723 |
|
Cash, cash equivalents and restricted cash - beginning of year |
|
|
12,451 |
|
|
12,533 |
|
|
3,810 |
|
Cash, cash equivalents and restricted cash - end of year |
|
$ |
6,839 |
|
$ |
12,451 |
|
$ |
12,533 |
|
|
|
|
|
|
|
|
|
|
|
|
Supplemental Cash Flow Information: |
|
|
|
|
|
|
|
|
|
|
Cash paid for interest, net of amounts capitalized |
|
$ |
23,581 |
|
$ |
23,076 |
|
$ |
955 |
|
Income taxes paid, net of refunds received |
|
$ |
1,237 |
|
$ |
— |
|
$ |
620 |
|
|
|
|
|
|
|
|
|
|
|
|
Non-cash investing and financing activity: |
|
|
|
|
|
|
|
|
|
|
Non-cash change in accrued capital expenditures |
|
$ |
(732) |
|
$ |
(2,277) |
|
$ |
(440) |
|
Non-cash repurchase of common shares as part of share repurchase program |
|
$ |
(5,318) |
|
$ |
— |
|
$ |
— |
|
Non-cash contribution from affiliate - forgiveness of affiliate note |
|
$ |
104,285 |
|
$ |
— |
|
$ |
— |
|
Non-cash distribution to PEAC - liability transfer from PEAC, net |
|
$ |
(8,840) |
|
$ |
— |
|
$ |
— |
|
Non-cash change in capital lease obligation |
|
$ |
(1,856) |
|
$ |
— |
|
$ |
— |
|
Non-cash distributions to affiliate - affiliate note payable incurred for Target acquisition |
|
$ |
— |
|
$ |
— |
|
$ |
(221,000) |
|
Non-cash distribution to affiliate - liability transfer from affiliate, net |
|
$ |
— |
|
$ |
— |
|
$ |
(9,257) |
|
Non-cash distribution to affiliates - forgiveness of related party receivables and payables, net |
|
$ |
— |
|
$ |
— |
|
$ |
(171,747) |
|
Non-cash change in specialty rental assets due to effect of exchange rate changes |
|
$ |
— |
|
$ |
(663) |
|
$ |
— |
|
Non-cash consideration in purchase of business, net of cash acquired |
|
$ |
— |
|
$ |
1,181 |
|
$ |
— |
Reconciliation of cash, cash equivalents, and restricted cash to consolidated balance sheets:
|
Cash and cash equivalents |
|
$ |
6,787 |
|
$ |
12,194 |
|
$ |
12,533 |
|
Restricted cash |
|
|
52 |
|
|
257 |
|
|
- |
|
Total cash, cash equivalents, and restricted cash shown in the statement of cash flows |
|
$ |
6,839 |
|
$ |
12,451 |
|
$ |
12,533 |
See accompanying notes which are an integral part of these consolidated financial statements.
74
Target Hospitality Corp.
Notes to Consolidated Financial Statements
(Amounts in Thousands, Unless Stated Otherwise)
1. Summary of Significant Accounting Policies
Organization and Nature of Operations
Target Hospitality Corp. (“Target Hospitality” and, together with its subsidiaries, the “Company”) was formed on March 15, 2019 and is one of the largest vertically integrated specialty rental and hospitality services companies in the United States. The Company provides vertically integrated specialty rental and comprehensive hospitality services including: catering and food services, maintenance, housekeeping, grounds-keeping, security, health and recreation, overall workforce community management, concierge services, and laundry service. Target Hospitality serves clients in oil, gas, mining, alternative energy, government and immigrations sectors principally located in the West Texas, South Texas, Oklahoma and Bakken regions, as well as various large linear-construction (pipeline and infrastructure) projects in the United States.
The Company, whose securities are listed on the Nasdaq Capital Market, serves as the holding company for the businesses of Target Logistics Management, LLC and its subsidiaries (“Target or TLM”) and RL Signor Holdings, LLC and its subsidiaries (“Signor”). TDR Capital LLP (“TDR Capital” or “TDR”) owns approximately 63% of Target Hospitality and the remaining ownership is broken out among the founders of the Company’s legal predecessor, Platinum Eagle Acquisition Corp. (“Platinum Eagle” or “PEAC”), investors in Platinum Eagle’s private placement transaction completed substantially and concurrently with the Business Combination (as defined below) (the “PIPE”), and other public shareholders. Platinum Eagle was originally incorporated on July 12, 2017 as a Cayman Islands exempted company, for the purpose of effecting a merger, share exchange, asset acquisition, share purchase, reorganization or similar business combination with one or more businesses. References in this Annual Report on Form 10-K to the Company refer to Target Hospitality for all periods at or after March 15, 2019 and Platinum Eagle for all periods prior to March 15, 2019, unless the context requires otherwise.
On November 13, 2018, PEAC entered into: (i) the agreement and plan of merger, as amended on January 4, 2019 (the “Signor Merger Agreement”), by and among PEAC, Signor Merger Sub LLC, a Delaware limited liability company and wholly-owned subsidiary of Platinum Eagle and sister company to the Holdco Acquiror (defined below as Topaz Holdings LLC) (“Signor Merger Sub”), Arrow Holdings S.a.r.l., a Luxembourg société à responsabilité limitée (the “Arrow Seller”) and Signor Parent (as defined below), and (ii) the agreement and plan of merger, as amended on January 4, 2019 (the “Target Merger Agreement” and, together with the Signor Merger Agreement, the “Merger Agreements”), by and among Platinum Eagle, Topaz Holdings LLC, a Delaware limited liability company (“Topaz”), Arrow Bidco, LLC, a Delaware limited liability company (“Bidco”), Algeco Investments B.V., a Netherlands besloten vennootschap (the “Algeco Seller”) and Target Parent (as defined below), to effect a business combination (the “Business Combination”). Pursuant to the Merger Agreements, on March 15, 2019, Platinum Eagle, through its wholly-owned subsidiary, Topaz, acquired all of the issued and outstanding equity interests of Arrow Parent Corp., a Delaware corporation (“Signor Parent”), the owner of Bidco and the owner of Signor from the Arrow Seller, and all of the issued and outstanding equity interests of Algeco US Holdings LLC, a Delaware limited liability company (“Target Parent”), the owner of Target, from the Algeco Seller, for approximately $1.311 billion. The purchase price was paid in a combination of shares of the Company’s common stock, par value $0.0001 per share (the “Common Stock”), and cash. The Arrow Seller and the Algeco Seller are hereinafter referred to as the “Sellers.”
Target Parent, was formed by TDR in September 2017. Prior to the Business Combination, Target Parent was directly owned by Algeco Scotsman Global S.a.r.l. (“ASG”) which is ultimately owned by a group of investment funds managed and controlled by TDR. During 2018, ASG assigned all of its ownership interest in Target Parent to the Algeco Seller, an affiliate of ASG that is also ultimately owned by a group of investment funds managed and controlled by TDR. Target Parent acted as a holding company that included the U.S. corporate employees of ASG and certain of its affiliates and certain related administrative costs and was the owner of Target, its operating company. Target Parent received capital contributions, made distributions, and maintained cash as well as other amounts owed to and from affiliated entities. As
75
discussed above, in connection with the closing of the Business Combination, Target Parent merged with and into Bidco, with Bidco as the surviving entity.
Signor Parent owned 100% of Bidco until the closing of the Business Combination in connection with which Signor Parent merged with and into Topaz with Topaz being the surviving entity. Prior to the Business Combination, Signor Parent was owned by the Arrow Seller, which is ultimately owned by a group of investment funds managed and controlled by TDR. Signor Parent was formed in August 2018 and acted as a holding company for Bidco, which was formed in September 2018, also as a holding company. Bidco acquired Signor on September 7, 2018 (see Note 4). Neither Signor Parent nor Bidco had operating activity, but each received capital contributions, made distributions, and maintained cash as well as other amounts owed to and from affiliated entities. Signor Parent was dissolved upon consummation of the Business Combination and merger with Topaz described above on March 15, 2019.
Prior to the Business Combination, on December 22, 2017, in a restructuring transaction (the “Restructuring”) amongst entities under common control of TDR and ASG, Target Parent acquired 100% ownership of Target, initially acquired by another subsidiary of ASG in 2013, as its operating company. As part of the Restructuring, certain notes and intercompany accounts among Target and other ASG entities were offset and extinguished and any gain or loss on extinguishment of the notes and receivables have been recognized as contributions and distributions in equity. Further, immediately prior to the Restructuring transaction, on December 15, 2017, Target acquired all of Iron Horse Managing Services, LLC and Iron Horse Ranch Yorktown, LLC (collectively, “Iron Horse”), in a transaction between entities under common control of TDR. Iron Horse was initially acquired by another subsidiary of TDR on July 31, 2017 and accounted for as a business combination with the assets acquired and liabilities assumed recorded at fair value as of the date of the initial acquisition. The acquisition of Iron Horse expanded Target’s presence in the Texas Permian Basin, adding four lodges with approximately one thousand rooms in strategic locations across Texas.
As the Restructuring transaction and Target’s acquisition of Iron Horse were among entities under common control, the transactions did not result in a change in control and therefore did not meet the definition of a business combination in accordance with Accounting Standards Codification (ASC) 805, Business Combinations. Accordingly, the net assets have been recorded at their carrying value at the date of transfer. Additionally, as these transactions occurred between entities under common control, Target Parent recorded no gain or loss in the consolidated financial statements. Further, as the common control transactions resulted in a change in the reporting entity, the Target Parent consolidated financial statements for historical comparative periods presented have been retrospectively adjusted, as if the transactions had occurred as of the earliest period presented or the initial date at which the entities first came under common control. As such, the operating results of Target and Iron Horse are included in the operations beginning on February 15, 2013 and July 31, 2017, respectively, the date at which common control was attained.
Basis of Presentation
The accompanying consolidated financial statements and related notes have been prepared on the accrual basis of accounting in accordance with accounting principles generally accepted in the United States of America (“US GAAP”).
Due to common ownership of Target Parent and Signor Parent by TDR as explained above, for periods prior to the Business Combination the financial statements were combined to include the consolidated accounts of both Target Parent and Signor Parent. All significant intercompany accounts and transactions have been eliminated. Prior to the Business Combination, TDR, the ultimate parent of Target Parent, owned 76% of Target Parent with the remaining 24% held through affiliated entities of TDR. TDR owned 100% of Signor Parent. TDR also has the majority ownership of the entity created from the closing of the Business Combination as discussed above.
The financial statements prior to the Business Combination reflect Target Parent and Signor Parent’s historical financial position, results of operations and cash flows, in conformity with US GAAP. Such financial statements were prepared from the separate records maintained by Target Parent and Signor Parent and may not necessarily be indicative of the conditions that would have existed or the results of operations if Target Parent and Signor Parent had been operated as unaffiliated entities.
76
Management believes the assumptions underlying the combined financial statements prior to the Business Combination, including the assumptions regarding the allocation of general corporate expenses, are reasonable. However, the allocations may not include all of the actual expenses that would have been incurred by Target Parent and Signor Parent and may not reflect its results of operations, financial position and cash flows had it been a standalone company during the periods presented. It is not practicable to estimate actual costs that would have been incurred had Target Parent and Signor Parent been a standalone company and operated as an unaffiliated entity during the periods presented. Actual costs that might have been incurred had Target Parent and Signor Parent been a standalone company would depend on a number of factors, including the organizational structure, what corporate functions Target Parent and Signor Parent might have performed directly or outsourced and strategic decisions Target Parent and Signor Parent might have made in areas such as executive management, legal and other professional services, and certain corporate overhead functions. Due to the Restructuring previously discussed, there are approximately $0.4 million, $17.3 million, and $9.3 million of additional expenses related to the activity of Target Parent included in the consolidated statements of comprehensive income for the years ended December 31, 2019, 2018, and 2017, respectively. Approximately $0.2 million, $8.6 million, and $0.5 million are reported in restructuring costs for the years ended December 31, 2019, 2018, and 2017, respectively. Approximately $0.2 million, $8.1 million and $8.8 million of these expenses are reported in selling, general and administrative expenses for the years ended December 31, 2019, 2018, and 2017, respectively. Such selling, general and administrative expenses were offset through charges to affiliated entities in the amount of approximately $5.3 million and recognized in other income, net for the year ended December 31, 2018 as more fully discussed in Note 19. Approximately $0, $0.6 million, and $0 of these expenses are reported in other income, net for the years ended December 31, 2019, 2018, and 2017, respectively.
Reclassifications
Certain prior year amounts in these financial statements have been reclassified to conform to the current year presentation with no impact to net income and comprehensive income, stockholders’ equity or cash flows.
Use of Estimates
The preparation of financial statements in conformity with US GAAP requires the use of estimates and assumptions by management in determining the reported amounts of assets and liabilities and disclosures of contingent assets and liabilities at the date of the consolidated financial statements and the reported amounts of revenues and expenses during the reporting period. If the underlying estimates and assumptions upon which the financial statements are based change in future periods, actual amounts may differ from those included in the accompanying consolidated financial statements.
Principles of Consolidation
The consolidated financial statements comprise the financial statements of the Company and its subsidiaries that it controls due to ownership of a majority voting interest. Subsidiaries are fully consolidated from the date of acquisition, being the date on which the Company obtains control, and continue to be consolidated until the date when such control ceases. The financial statements of the subsidiaries are prepared for the same reporting period as the Company. All intercompany balances and transactions are eliminated. The Business Combination was accounted for as a reverse recapitalization in accordance with ASC 805. Although Platinum Eagle was the indirect acquirer of Target Parent and Signor Parent for legal purposes, Target Parent and Signor Parent were considered the acquirer for accounting and financial reporting purposes.
As a result of Target Parent and Signor Parent being the accounting acquirer in the Business Combination, the financial reports filed with the SEC by the Company subsequent to the Business Combination are prepared “as if” Target Parent and Signor Parent are the accounting predecessor of the Company. The historical operations of Target Parent and Signor Parent are deemed to be those of the Company. Thus, the financial statements included in this report reflect (i) the historical operating results of Target Parent and Signor Parent prior to the Business Combination; (ii) the consolidated results of the Company, Target Parent and Signor Parent following the Business Combination on March 15, 2019; (iii) the assets and liabilities of Target Parent and Signor Parent at their historical cost; and (iv) the Company’s equity structure for all periods presented. The recapitalization of the number of shares of Common Stock attributable to the purchase of Target Parent and Signor Parent in connection with the Business Combination is reflected retroactively to the earliest period presented and will be utilized for calculating earnings per share in all prior periods presented. No step-up basis of intangible assets
77
or goodwill was recorded in the Business Combination transaction consistent with the treatment of the transaction as a reverse recapitalization of Target Parent and Signor Parent.
Cash and Cash Equivalents
The Company considers all highly liquid instruments with a maturity of three months or less when purchased to be cash equivalents. Included in restricted cash are irrevocable standby letters of credit that represent collateral for site improvements.
Receivables and Allowances for Doubtful Accounts
Receivables primarily consist of amounts due from customers from the delivery of specialty rental services. The trade accounts receivable is recorded net of an allowance for doubtful accounts. The allowance for doubtful accounts is based upon the amount of losses expected to be incurred in the collection of these accounts. The estimated losses are based upon a review of outstanding receivables, including specific accounts and the related aging, and on historical collection experience. Specific accounts are written off against the allowance when management determines the account is uncollectible. Activity in the allowance for doubtful accounts was as follows:
|
|
|
Years Ended December 31, |
|||||||
|
|
|
2019 |
|
2018 |
|
2017 |
|||
|
Balances at Beginning of Year |
|
$ |
39 |
|
$ |
137 |
|
$ |
781 |
|
Net charges to bad debt expense |
|
|
1,183 |
|
|
464 |
|
|
426 |
|
Recoveries |
|
|
(81) |
|
|
(562) |
|
|
— |
|
Write-offs |
|
|
(152) |
|
|
— |
|
|
(1,070) |
|
Balances at End of Year |
|
$ |
989 |
|
$ |
39 |
|
$ |
137 |
Prepaid Expenses and Other Assets
Prepaid expenses of approximately $3.3 million and $3.0 million at December 31, 2019 and 2018, respectively, primarily consist of insurance, taxes, rent, deposits and permits. Prepaid insurance, taxes, rent, and permits are amortized over the related term of the respective agreements. Other assets of approximately $1.4 million and $1.0 million at December 31, 2019 and 2018, respectively, primarily consist of $1.1 million and $0.9 million of hospitality inventory. Inventory, primarily consisting of food and beverages, is accounted for by the first-in, first-out method and is stated at the lower of cost and net realizable value.
Concentrations of Credit Risk
In the normal course of business, the Company grants credit to its customers based on credit evaluations of their financial condition and generally requires no collateral or other security. Major customers are defined as those individually comprising more than 10.0% of the Company’s revenues or accounts receivable. The Company had two customers representing 20.8% and 12.5% of revenues, respectively, for the year ended December 31, 2019. The largest customers accounted for 9.5% and 12.3% of accounts receivable, respectively, while no other customer accounted for more than 10% of the accounts receivable balance as of December 31, 2019.
For the year ended December 31, 2018, the Company had one customer representing 27.7% of total revenues. The largest customer accounts for 9.4% of accounts receivable, while two together customers account for 24.5% and 17.3% of accounts receivable, respectively, at December 31, 2018.
For the year ended December 31, 2017, Target Parent had two customers representing 49.7% and 11.8%, respectively, of total revenues for the year ended December 31, 2017. The largest customer, accounts for 26.6% of accounts receivable, with no other customer making up more than 10% of receivables at December 31, 2017.
78
Major suppliers are defined as those individually comprising more than 10.0% of the annual goods purchased. For the year ended December 31, 2019, the Company had one major supplier representing 12.3%, of goods purchased. For the years ended December 31, 2018 and 2017, the Company had no major suppliers comprising more than 10.0% of total purchases.
The Companies provide services almost entirely to customers in the governmental and oil and gas industries and as such, are almost entirely dependent upon the continued activity of such customers.
Interest Capitalization
Interest costs for the construction of certain long-term assets are capitalized by applying the weighted average interest rate applicable to the borrowings of the Company to the average amount of accumulated expenditures outstanding during the construction period. Such capitalized interest costs are depreciated over the related assets’ estimated useful lives. For each of the years ended December 31, 2019, 2018 and 2017, capitalized interest totaled approximately $0.8 million, $0, and $0, respectively.
Specialty Rental Assets
Specialty rental assets (units, site work and furniture and fixtures comprising lodges) are measured at cost less accumulated depreciation and impairment losses. Cost includes expenditures that are directly attributable to the acquisition of the asset. Costs of improvements and betterments to units are capitalized when such costs extend the useful life of the unit or increase the rental value of the unit. Costs incurred for units to meet a particular customer specification are capitalized and depreciated over the lease term. Maintenance and repair costs are expensed as incurred.
Depreciation is generally computed using the straight-line method over estimated useful lives and considering the residual value of those assets. The estimated useful life of modular units is 15 years. The estimated useful life of site work (above ground and below ground infrastructure) is 5 years. The estimated useful life of furniture and fixtures is 7 years. Depreciation methods, useful lives and residual values are adjusted prospectively, if a revision is determined to be appropriate.
Other Property, Plant, and Equipment
Other property, plant, and equipment is stated at cost, net of accumulated depreciation and impairment losses. Assets leased under capital leases are depreciated over the shorter of the lease term and their useful lives unless it is reasonably certain that the Company will obtain ownership by the end of the lease term. Land is not depreciated. Maintenance and repair costs are expensed as incurred.
Depreciation is generally computed using the straight-line method over estimated useful lives, as follows:
|
Buildings |
|
5-15 years |
|
Machinery and office equipment |
|
3-5 years |
|
Furniture and fixtures |
|
7 years |
|
Software |
|
3 years |
Depreciation methods, useful lives and residual values are reviewed and adjusted prospectively, if appropriate.
Business Combinations
Except as it relates to common control transactions as described in Note 1, business combinations are accounted for using the acquisition method. Consideration transferred for acquisitions is measured at fair value at the acquisition date and includes assets transferred, liabilities assumed and equity issued. Acquisition costs incurred are expensed and included in selling, general and administrative expenses. When the Company acquires a business, the financial assets and liabilities assumed are assessed for appropriate classification and designation in accordance with the contractual terms, economic circumstances and pertinent conditions at the acquisition date.
79
Any contingent consideration transferred by the acquirer is recognized at fair value at the acquisition date. Any subsequent changes to the fair value of contingent consideration are recognized in profit or loss. If the contingent consideration is classified as equity, it is not re-measured and subsequent settlement is accounted for within equity.
Goodwill
The Company evaluates goodwill for impairment at least annually at the reporting unit level. A reporting unit is the operating segment, or one level below that operating segment (the component level) if discrete financial information is prepared and regularly reviewed by segment management. However, components are aggregated as a single reporting unit if they have similar economic characteristics. For the purpose of impairment testing, goodwill acquired in a business combination is allocated to each of the Company’s reporting units that are expected to benefit from the combination. The Company evaluates changes in its reporting structure to assess whether that change impacts the composition of one or more of its reporting units. If the composition of the Company’s reporting units’ changes, goodwill is reassigned between reporting units using the relative fair value allocation approach.
The Company performs the annual impairment test of goodwill at October 1. In addition, the Company performs impairment tests during any reporting period in which events or changes in circumstances indicate that impairment may have occurred. To test goodwill for impairment, the Company first performs a qualitative assessment to determine whether it is more likely than not that the fair value of a reporting unit is less than its carrying value. If it is concluded that this is the case, the Company then performs a quantitative impairment test. Otherwise, the quantitative impairment test is not required. Under the quantitative impairment test, the Company would compare the estimated fair value of each reporting unit to its carrying value.
In assessing the fair value of the reporting units, the Company considers the market approach, the income approach, or a combination of both. Under the market approach, the fair value of the reporting unit is based on quoted market prices of companies comparable to the reporting unit being valued. Under the income approach, the fair value of the reporting unit is based on the present value of estimated cash flows. The income approach is dependent on several significant management assumptions, including estimated future revenue growth rates, gross margin on sales, operating margins, capital expenditures, tax rates and discount rates.
If the carrying amount of the reporting unit exceeds the calculated fair value, a loss on impairment is recognized in an amount equal to that excess, limited to the total amount of goodwill allocated to that reporting unit. Additionally, the Company considers the income tax effect from any tax-deductible goodwill on the carrying amount of the reporting unit, if applicable, when measuring the goodwill impairment charge.
Intangible Assets Other Than Goodwill
Intangible assets that are acquired by the Company and determined to have an indefinite useful life are not amortized, but are tested for impairment at least annually. The Company’s indefinite-lived intangible assets consist of trade names. The Company calculates fair value by comparing a relief-from-royalty method to the carrying amount of the indefinite-lived intangible asset. This method is used to estimate the cost savings that accrue to the owner of an intangible asset who would otherwise have to pay royalties or license fees on revenues earned through the use of the asset. A loss on impairment would be recorded to the extent the carrying value of the indefinite-lived intangible asset exceeds the fair value.
Other intangible assets that have finite useful lives are measured at cost less accumulated amortization and impairment losses, if any. Subsequent expenditures for intangible assets are capitalized only when they increase the future economic benefits embodied in the specific asset to which they relate. Amortization is recognized in profit or loss on a straight-line basis over the estimated useful lives of intangible assets. The Company has customer relationship assets with lives ranging from 5 to 9 years. Amortization of intangible assets is included in other depreciation and amortization on the consolidated statements of comprehensive income.
80
Impairment of Long-Lived and Amortizable Intangible Assets
Fixed assets including rental equipment and other property, plant and equipment and amortizable intangible assets are reviewed for impairment as events or changes in circumstances occur indicating that the carrying value of the asset may not be recoverable. Recoverability of assets to be held and used is measured by a comparison of the carrying amount of an asset group to future undiscounted cash flows, without interest charges, expected to be generated by the asset group. If future undiscounted cash flows, without interest charges, exceed the carrying amount of an asset, no impairment is recognized. If management determines that the carrying value cannot be recovered based on estimated future undiscounted cash flows, without interest charges, over the shorter of the asset’s estimated useful life or the expected holding period, an impairment loss would be recorded based on the estimated fair value of the asset. As discussed in Note 7, an impairment loss has been recognized during 2018.
Assets Held for Sale
Management considers an asset to be held for sale when management approves and commits to a formal plan to actively market the asset for sale and it is probable that the sale will be completed within twelve months. A sale may be considered probable when a signed sales contract and significant non-refundable deposit or contract break-up fee exist. Upon designation as held for sale, management records the carrying value of the asset at the lower of it carrying value or its estimated fair value, less estimated costs to sell, and management stops recording depreciation expense. As of December 31, 2019, no assets were considered held for sale.
Deferred Financing Costs Revolver, net
Deferred financing costs revolver are associated with the issuance of the New ABL revolver facility and the Algeco ABL facility discussed in Note 11. Such costs are amortized over the contractual term of the line-of-credit through initial maturity using the straight-line method. Amortization expense of deferred financing costs revolver is included in interest expense, net in the consolidated statement of comprehensive income.
Term Loan Deferred Financing Costs
Term loan deferred financing costs are associated with the issuance of the Senior Secured Notes 2024 discussed in Note 11. The Company presents unamortized deferred financing costs as a direct deduction from the principal amount of the Notes on the consolidated balance sheets. Such costs are deferred and amortized over the term of the debt based on the effective interest rate method.
Other Non-Current Assets
Other non-current assets consist of capitalized software implementation costs for the implementation of cloud computing systems during 2019. The Company capitalizes expenditures related to the implementation of cloud computing software as incurred during the application development stage. Such capitalized costs are amortized to selling, general, and administrative expenses over the term of the cloud computing hosting arrangement, including reasonably certain renewals, beginning when the module or component of the hosting arrangement is ready for its intended use. As of December 31, 2019, there is $4.7 million of capitalized implementation costs in other non-current assets on the consolidated balance sheet. None of these costs have been amortized during 2019 as the related systems were not ready for their intended use as of December 31, 2019. Such systems were placed into service beginning January of 2020 at which time the Company will begin to amortize these capitalized costs over the period of the service arrangement.
Original Issuance Discounts
Debt original discounts are associated with the issuance of the Senior Secured Notes 2024 discussed in Note 11 and are recorded as direct deductions to the principal amount of the Notes on the consolidated balance sheets. Debt discounts are deferred and amortized over the term of the debt based on the effective interest rate method.
81
Asset Retirement Obligations
The Company recognizes asset retirement obligations (AROs) related to legal obligations associated with the operation of the Company’s specialty rental assets. The fair values of these AROs are recorded on a discounted basis, at the time the obligation is incurred and accreted over time for the change in present value over the estimated useful lives of the underlying assets. The Company capitalizes asset retirement costs by increasing the carrying amount of the related long-lived assets and depreciating these costs over the remaining useful life. The carrying amount of AROs included in the consolidated balance sheets were $2.8 million and $2.6 million as of December 31, 2019 and 2018, respectively, which represents the present value of the estimated future cost of these AROs of approximately $3.3 million. Accretion expense of approximately $0.2 million, $0.2 million and $0.1 million was recognized in specialty rental costs in the accompanying consolidated statements of comprehensive income for the years ended December 31, 2019, 2018 and 2017, respectively.
Foreign Currency Transactions and Translation
The Company’s reporting currency is the US Dollar (USD). Exchange rate adjustments resulting from foreign currency transactions are recognized in profit or loss, whereas effects resulting from the translation of financial statements are reflected as a component of accumulated other comprehensive loss, a component of equity.
The assets and liabilities of subsidiaries whose functional currency is different from the USD are translated into USD at exchange rates at the reporting date and revenue and expenses are translated using average exchange rates for the respective period.
Foreign exchange gains and losses arising from a receivable or payable to a consolidated Company entity, the settlement of which is neither planned nor anticipated in the foreseeable future, are considered to form part of a net investment in the Company entity and are included within accumulated other comprehensive loss.
Revenue Recognition
The Company derives revenue from specialty rental and hospitality services, specifically lodging and related ancillary services. Revenue is recognized in the period in which lodging and services are provided pursuant to the terms of contractual relationships with the customers. Certain arrangements contain a lease of lodging facilities to customers. The leases are accounted for as an operating lease under the authoritative guidance for leases and are recognized as income using the straight-line method over the term of the lease agreement. When the Company enters into arrangements with multiple deliverables, arrangement consideration is allocated between the deliverables based on the relative estimated selling price of each deliverable. The estimated price of lodging and service deliverables is based on the price of lodging and services when sold separately, or based upon the best estimate of selling price. The most significant estimates and judgments relating to revenues involve the relative stand-alone selling for purpose of allocating consideration to performance obligations in our lease transactions. A contract’s transaction price is allocated to each distinct performance obligation and recognized as revenue when, or as, the performance obligation is satisfied. The Company’s revenues do not include material amounts of variable consideration.
Because performance obligations related to specialty rental and hospitality services are satisfied over time, the majority of our revenue is recognized on a daily basis, for each night a customer stays, at a contractual day rate. At contract inception, we assess the goods and services promised in our contracts with customers and identify a performance obligation for each promise to transfer our customers a good or service (or bundle of goods or services) that is distinct. Our customers typically contract for accommodation services under committed contracts with terms that most often range from several months to three years. Our contract terms generally provide for a rental rate for a reserved room and an occupied room rate that compensates us for services provided. We typically contract our facilities to our customers on a fee per day basis where the goods and services promised include lodging and meals. Our performance obligations are satisfied to the customer on a daily basis upon the consumption of the service by the customer. To identify the performance obligations, we consider all of the goods and services promised in the context of the contract and the pattern of transfer to our customers. Our payment terms vary by type and location of our customer and the service offered. The time between invoicing and when payment is due is not significant. Our contracts do not contain a significant financing component.
82
When lodging and services are billed and collected in advance, recognition of revenue is deferred until services are rendered. Certain of the Company’s contractual arrangements allow customers the ability to use paid but unused lodging and services for a specified period. The Company recognizes revenue for these paid but unused lodging and services as they are consumed, as it becomes probable the lodging and services will not be used, or upon expiration of the specified term.
Cost of services includes labor, food, utilities, supplies, rent and other direct costs associated with operating the lodging units. Cost of rental includes leasing costs and other direct costs of maintaining the lodging units. Costs associated with contracts includes sales commissions which are expensed as incurred and reflected in selling, general and administrative expenses in the consolidated statements of comprehensive income.
The Company originated an agreement in 2013 with TransCanada Pipelines (“TCPL”) to construct, deliver, cater and manage all accommodations and hospitality services in conjunction with the planned construction of the Keystone XL pipeline project. During the construction phase of the agreement, the Company is currently performing services under limited notices to proceed (“LNTP”) and change orders. The Company recognizes revenue associated with community construction using the percentage of completion method with progress towards completion measured using the cost-to-cost method as the basis to recognize revenue. Management believes this cost-to-cost method is the most appropriate measure of progress to the satisfaction of a performance obligation on the community construction. Provisions for estimated losses on uncompleted contracts are made in the period in which such losses are determined. Changes in job performance, job conditions, estimated profitability and final contract settlements may result in revisions to projected costs and revenue and are recognized in the period in which the revisions to estimates are identified and the amounts can be reasonably estimated. Factors that may affect future project costs and margins include weather, production efficiencies, availability and costs of labor, materials and subcomponents. These factors can significantly impact the accuracy of our estimates and materially impact our future reported earnings. The Company recognizes revenues associated with other services during the construction phase as costs are incurred in connection with the project change orders. The revenue recognized on these change orders includes a margin mark-up on costs incurred as allowable under the contract terms. Billings in excess of costs incurred and estimated profits are classified as contract liabilities. Costs incurred and estimated profits in excess of billings on these contracts are recognized as contract assets.
The Company also originated a contract on March 1, 2019 with a customer to construct, deliver, cater and manage all accommodations and hospitality services in conjunction with the construction of an accommodation facility in the Permian Basin. During the construction phase, the Company recognizes revenue using the percentage of completion method similarly to TCPL. The construction was completed in August of 2019.
Revenues associated with these contracts are reflected as construction fee income in the consolidated statements of comprehensive income and amounted to approximately $18.5 million, $23.2 million and $1.9 million for years ended December 31, 2019, 2018 and 2017, respectively. Of the total construction fee income approximately $15.8 million, $23.2 million and $2.0 million, is a result of projects with TCPL for the years ended December 31, 2019, 2018 and 2017, respectively, while $2.7 million, $0 and $0 are related to the Permian Basin project for the years ended December 31, 2019, 2018 and 2017, respectively.
Additionally, the Company collects sales, use, occupancy and similar taxes, which the Company presents on a net basis (excluded from revenues) in the consolidated statements of comprehensive income. The Company does not include these taxes in determining the transaction price previously discussed.
Fair Value Measurements
The Company maximizes the use of observable inputs and minimizes the use of unobservable inputs when measuring fair value. A financial instrument’s categorization within the fair value hierarchy is based upon the lowest level of input that is significant to the fair value measurement. The inputs are prioritized into three levels that may be used to measure fair value:
Level 1: Inputs that reflect quoted prices for identical assets or liabilities in active markets that are observable.
83
Level 2: Inputs that reflect quoted prices for similar assets or liabilities in active markets; quoted prices for identical or similar assets or liabilities in markets that are not active; or model-derived valuations in which significant inputs are observable or can be derived principally from, or corroborated by, observable market data.
Level 3: Inputs that are unobservable to the extent that observable inputs are not available for the asset or liability at the measurement date.
Income Taxes
The Company’s operations are subject to U.S. federal, state and local, and foreign income taxes. The Company accounts for income taxes under the liability method, which requires the recognition of deferred tax assets and liabilities for the expected future tax consequences of events that have been included in the financial statements. Under this method, deferred tax assets and liabilities are determined based on the differences between the financial statement and tax basis of assets and liabilities using enacted tax rates in effect for the year in which the differences are expected to reverse. The effect of a change in tax rates on deferred tax assets and liabilities is recognized in income in the period that includes the enactment date.
The Company records net deferred tax assets to the extent that it is more likely than not that these assets will be realized. In making such determination, the Company considers all available positive and negative evidence, including scheduled reversals of deferred tax liabilities, projected future taxable income, tax planning strategies and recent results of operations. Valuation allowances are recorded to reduce the deferred tax assets to an amount that will more likely than not be realized. When a valuation allowance is established or there is an increase in an allowance in a reporting period, tax expense is generally recorded in the Company’s consolidated statements of comprehensive income.
Prior to the Restructuring, the operations of Target were included in the U.S. tax return of its historical parent, Williams Scotsman International, Inc., along with certain state and local and foreign income tax returns. In preparing the combined financial statements for the period prior to the Restructuring, the provision for income taxes was calculated using the “separate return” method. Under this method, Target assumed a separate return would be filed with the tax authority, thereby reporting its taxable income or loss and paying the applicable tax to or receiving the appropriate refund from its parent as applicable. Target’s provision as of December 31, 2017 and 2018 is the amount of tax payable or refundable on the basis of a hypothetical, current-year separate return. Target provides deferred taxes on temporary differences and on any carryforwards that it could claim on a hypothetical return and the need for a valuation allowance is assessed on the basis of its projected separate return results.
In accordance with applicable authoritative guidance, the Company accounts for uncertain income tax positions using a benefit recognition model with a two-step approach; a more-likely-than-not recognition criterion; and a measurement approach that measures the position as the largest amount of tax benefit that is greater than 50% likely of being realized upon ultimate settlement. If it is not more-likely-than-not that the benefit of the tax position will be sustained on its technical merits, no benefit is recorded. Uncertain tax positions that relate only to timing of when an item is included on a tax return are considered to have met the recognition threshold. The Company classifies interest and penalties related to uncertain tax positions within income tax expense.
On December 22, 2017, the U.S. government enacted comprehensive tax legislation commonly referred to as the Tax Cuts and Jobs Act (the “Act”). The Act makes broad and complex changes to the U.S. tax code, including, but not limited to: (1) reducing the U.S. federal corporate tax rate from 35 percent to 21 percent; (2) requiring companies to pay a one-time transition tax on certain unrepatriated earnings of foreign subsidiaries; (3) generally eliminating U.S. federal income taxes on dividends from foreign subsidiaries; (4) requiring a tax on global intangible low-taxed income (GILTI) which is a current inclusion in U.S. federal taxable income of certain earnings of controlled foreign corporations; (5) eliminating the corporate alternative minimum tax (AMT) and changing how existing AMT credits can be realized; (6) creating the base erosion anti-abuse tax (BEAT), a new minimum tax; (7) creating a new limitation on deductible interest expense; and (8) changing rules related to uses and limitations of net operating loss carryforwards created in tax years beginning after December 31, 2017.
84
As of and for the year ended December 31, 2017, the Company, which consisted of Target operations, completed their accounting for the income tax effects of the Act. The Company has not recorded a liability for the one-time transition tax on certain unrepatriated earnings of foreign subsidiaries imposed under the Act due to historically negative earnings and profits. The Company also remeasured their deferred tax asset and liabilities to reflect the reduction of the U.S. federal corporate tax rate from 35 percent to 21 percent and, consequently, recorded a decrease related to net deferred tax assets of $12.1 million with a corresponding increase to deferred income tax expense for the year ended December 31, 2017.
Stock-Based Compensation
The Company sponsors an equity incentive plan (the “Plan”) in which certain employees and non-employee directors participate. The Plan is administered by the compensation committee of the board of directors of the Company (the “Compensation Committee”). The Company measures the cost of services received in exchange for an award of equity instruments (typically restricted stock unit awards (“RSUs”) and stock options) based on the grant-date fair value of the award as the awards issued under the Plan are equity classified. The fair value of the stock options is calculated using the Black-Scholes option-pricing model while the fair value of the RSUs is calculated based on the Company’s share price on the grant-date. The resulting cost is recognized over the period during which an employee or non-employee director is required to provide service in exchange for the awards, usually the vesting period. Forfeitures are accounted for as they occur. Refer to Note 22 for further details of activity related to the Plan.
Treasury Stock
Treasury stock is reflected as a reduction of stockholders’ equity at cost. We use the weighted average purchase price to determine the cost of treasury stock that is reissued, if any.
Recently Issued Accounting Standards
The Company meets the definition of an emerging growth company (“EGC”) as defined under the Jumpstart Our Business Startups Act of 2012 (the “JOBS Act”). In reliance on exemptions provided under the JOBS Act for EGCs, the Company has elected to defer compliance with new or revised financial accounting standards until a company that is not an issuer (as defined under section 2(a) of the Sarbanes-Oxley Act of 2002) is required to comply with such standards. As such, compliance dates included below pertain to non-issuers, and as permitted, early adoption dates are indicated.
In May 2014, the FASB issued ASU 2014-09, Revenue from Contracts with Customers (Topic 606), which prescribes a single comprehensive model for entities to use in the accounting for revenue arising from contracts with customers. The new guidance will supersede virtually all existing revenue guidance under US GAAP. The new standard became effective for the Company’s fourth quarter ended December 31, 2019 and interim periods thereafter. Topic 606 allows either full or modified retrospective transition, and the Company used the modified retrospective method of adoption. This approach consists of recognizing the cumulative effect of initially applying the standard as an adjustment to opening retained earnings. As part of the modified retrospective approach, the Company has presented the comparative periods under legacy GAAP and disclosed the amount by which each financial statement line item was affected as a result of applying the new standard and an explanation of significant changes. The core principle contemplated by this new standard is that an entity should recognize revenue to depict the transfer of promised goods or services to customers in an amount reflecting the consideration to which the entity expects to be entitled in exchange for those goods or services. New disclosures about the nature, amount, timing and uncertainty of revenue and cash flows arising from contracts with customers are also required. In April and May 2016, the FASB also issued clarifying updates to the new standard specifically to address certain core principles including the identification of performance obligations, licensing guidance, the assessment of the collectability criterion, the presentation of taxes collected from customers, non-cash considerations, contract modifications and completed contracts at transition. The Company has evaluated the impact that the updated guidance has on the Company’s financial statements and related disclosures. As part of the evaluation process, the Company held regular meetings with key stakeholders from across the organization to discuss the impact of the standard on its existing contracts. The Company utilized a bottom-up approach to analyze the impact of the standard on its portfolio of contracts by reviewing the Company’s current accounting policies and practices to identify potential differences that would result from applying the requirements of the new standard to the Company’s existing revenue contracts. Upon adoption of this standard, we did not recognize a cumulative effect adjustment to accumulated earnings in the accompanying consolidated balance sheet as of
85
December 31, 2019, because the impact was immaterial. We expect the impact of the adoption of the new standard to be immaterial to our consolidated financial statements on an ongoing basis.
In February 2016, the FASB issued ASU No. 2016‑02, Leases (Topic 842). This guidance revises existing practice related to accounting for leases under ASC Topic 840 Leases (ASC 840) for both lessees and lessors. The new guidance requires lessees to recognize a right-of-use asset and a lease liability for virtually all of their leases (other than leases that meet the definition of a short-term lease). The lease liability will be equal to the present value of lease payments and the right-of-use asset will be based on the lease liability, subject to adjustment such as for initial direct costs. For income statement purposes, the new standard retains a dual model similar to ASC 840, requiring leases to be classified as either operating or finance. Operating leases will result in straight-line expense (similar to current accounting by lessees for operating leases under ASC 840) while finance leases will result in a front-loaded expense pattern (similar to current accounting by lessees for capital leases under ASC 840). While the new standard maintains similar accounting for lessors as under ASC 840, the new standard reflects updates to, among other things, align with certain changes to the lessee model. In 2019, the FASB voted to delay the effective date for the new standard for financial statements issued for reporting periods beginning after December 15, 2021 and interim periods within those reporting periods for non-issuers (including EGCs). Topic 842 allows an entity to recognize and measure leases at the beginning of the earliest period presented using a modified retrospective approach or to adopt under the new optional transition method that allows an entity to recognize a cumulative-effect adjustment to the opening balance of retained earnings as of the adoption date. The Company is currently evaluating the impact of the pronouncement on its consolidated financial statements.
In June 2016, the FASB issued ASU 2016‑13, Financial Instruments - Credit Losses (ASU 2016‑13 or Topic 326). This new standard changes how companies account for credit impairment for trade and other receivables as well as changing the measurement of credit losses for most financial assets and certain other instruments that are not measured at fair value through net income. ASU 2016-13 will replace the current "incurred loss" model with an "expected loss" model. Under the "incurred loss" model, a loss (or allowance) is recognized only when an event has occurred (such as a payment delinquency) that causes the entity to believe that a loss is probable (i.e., that it has been "incurred"). Under the "expected loss" model, a loss (or allowance) is recognized upon initial recognition of the asset that reflects all future events that leads to a loss being realized, regardless of whether it is probable that the future event will occur. The "incurred loss" model considers past events and current conditions, while the "expected loss" model includes expectations for the future which have yet to occur. ASU 2018-19, Codification Improvements to Topic 326, Financial Instruments - Credit Losses, was issued in November 2018 and excludes operating leases from the new guidance. In 2019, the FASB voted to delay the effective date for the new standard for financial statements issued for reporting periods beginning after December 15, 2022 and interim periods within those reporting periods. The Company is currently evaluating the impact of this new standard on its consolidated financial statements.
In October 2016, the FASB issued ASU 2016‑16, Income Taxes (Topic 740): Intra-entity Transfers of Assets other than Inventory. This guidance requires an entity to recognize the income tax consequences of intra-entity sale or transfers of assets, other than inventory, at the time of transfer. The new standard requires the Company to recognize the income tax effects of intercompany sales or transfers of assets, other than inventory, in the income statement as income tax expense (or benefit) in the period the sale or transfer occurs. The exception to recognizing the income tax effects of intercompany sales or transfers of assets remains in place for intercompany inventory sales and transfers. The new standard was effective for annual reporting periods beginning after December 15, 2018. Early adoption is permitted for all entities as long as entities adopt at the beginning of an annual reporting period. The Company adopted the pronouncement on January 1, 2019 and determined that it had no impact on its consolidated financial statements.
In November 2016, the FASB issued ASU No. 2016‑18, Statement of cash flows (Topic 230): Restricted cash. The amendments in this update require that a statement of cash flows explain the change during the period in the total of cash, cash equivalents, and amounts generally described as restricted cash or restricted cash equivalents. Therefore, amounts generally described as restricted cash and restricted cash equivalents should be included with cash and cash equivalents when reconciling the beginning-of-period and end-of-period total amounts shown on the statement of cash flows. The amendments in this update apply to all entities that have restricted cash or restricted cash equivalents and are required to present a statement of cash flows under Topic 230. This update addresses stakeholder concerns around the diversity in practice that exists in the classification and presentation of changes in restricted cash on the statement of cash flows. The provisions of ASU No. 2016‑18 were effective for fiscal years beginning after December 15, 2018, and interim periods
86
with fiscal years beginning after December 15, 2019. The Company adopted ASU 2016-18 as of December 31, 2019 utilizing the retrospective transition method and it did not have a material impact on its consolidated statement of cash flows. As part of the adoption of this guidance, the Company included restricted cash with cash and cash equivalents in the consolidated statement of cash flows for the years ended December 31, 2019 and December 31, 2018 as no such restricted cash amounts existed for the year ended December 31, 2017.
In February 2018, the FASB issued ASU 2018-02, Income Statement-Reporting Comprehensive Income (Topic 220): Reclassification of Certain Tax Effects from Accumulated Other Comprehensive Income (“ASU 2018-02”), which permits entities to reclassify tax effects stranded in accumulated other comprehensive income as a result of tax reform to retained earnings. Companies that elect to reclassify these amounts must reclassify stranded tax effects for all items accounted for in accumulated other comprehensive income. ASU 2018-02 is effective for all entities for fiscal years beginning after December 15, 2018, and interim periods within those fiscal years with early adoption permitted. This guidance requires qualitative disclosure of the accounting policy for releasing income tax effects from accumulated other comprehensive income and if the reclassification election is made, the impacts of the change on the consolidated financial statements. The Company adopted ASU 2018-02 in the first quarter of 2019, did not reclassify the tax effects stranded in accumulated other comprehensive income as there were none, and there was no impact on the Company's consolidated results of operations or cash flows. The Company's policy for releasing disproportionate income tax effects from AOCI utilizes the portfolio approach.
In August 2018, the FASB issued ASU No. 2018‑15, Intangibles—Goodwill and Other—Internal-Use Software (Subtopic 350‑40): Customer’s Accounting for Implementation Costs Incurred in a Cloud Computing Arrangement That Is a Service Contract (“ASU 2018‑15”). The amendments in this update align the requirements for capitalizing implementation costs incurred in a cloud computing arrangement (i.e. hosting arrangement) that is a service contract with the requirements for capitalizing implementation costs incurred to develop or obtain internal-use software under Subtopic 350‑40. The amendments require certain costs incurred during the application development stage to be capitalized and other costs incurred during the preliminary project and post-implementation stages to be expensed as they are incurred. Capitalized implementation costs related to a hosting arrangement that is a service contract will be amortized over the term of the hosting arrangement including reasonably certain renewals, beginning when the module or component of the hosting arrangement is ready for its intended use. Accounting for the hosting component of the arrangement is not affected. The guidance is effective for fiscal years beginning after December 15, 2019, including interim periods within that fiscal year. Early adoption is permitted. The Company early adopted this pronouncement prospectively on January 1, 2019 as a result of deciding to implement cloud computing systems during 2019. Such implementations began in 2019 and, as a result, the Company capitalized certain implementation costs during 2019 as a discussed in the ‘other non-current assets” section of Note 1.
In January 2017, the FASB issued ASU 2017-01, Business Combinations (Topic 805): Clarifying the Definition of a Business which changes the definition of a business to assist entities with evaluating when a set of transferred assets and activities is a business. ASU 2017-01 requires an entity to evaluate if substantially all of the fair value of the gross assets acquired is concentrated in a single identifiable asset or a group of similar identifiable assets; if so, the set of transferred assets and activities is not a business. The guidance also requires a business to include at least one substantive process and narrows the definition of outputs by more closely aligning it with how outputs are described in ASC Topic 606 (previously described). The standard is effective for annual reporting periods beginning after December 15, 2018, and interim periods within annual periods beginning after December 15, 2019. Early adoption is permitted. The Company adopted this pronouncement on January 1, 2019 and applied such guidance to the Superior and ProPetro acquisitions discussed in Note 4.
In June 2018, the FASB issued ASU 2018-07, Improvements to Nonemployee Share-Based Payment Accounting, or ASU 2018-07. ASU 2018-07 simplifies the accounting for share-based payments to nonemployees by aligning it with the accounting for share-based payments to employees, with certain exceptions. All grants as of December 31, 2019 have been made to employees and directors who are treated as employees in line with ASC 718. The standard is effective for annual reporting periods beginning after December 15, 2018, and interim periods within annual periods beginning after December 15, 2019, early adoption is permitted. The Company has determined that the adoption of this guidance had no impact on its consolidated financial statements for the year ended December 31, 2019.
87
2. Revenue
Total revenue under contracts recognized under Topic 606 was $261.3 million for the year ended December 31, 2019, while $59.8 million was specialty rental income subject to the guidance of ASC 840 for the year ended December 31, 2019.
The following table disaggregates our revenue by our three reportable segments as well as the All Other category: Permian Basin, Bakken Basin, Government, and All Other for the years indicated below:
|
|
|
For the Years ended December 31, |
|||||||
|
|
|
2019 |
|
2018 |
|
2017 |
|||
|
Permian Basin |
|
|
|
|
|
|
|
|
|
|
Services income |
|
$ |
193,852 |
|
$ |
107,997 |
|
$ |
32,578 |
|
Construction fee income |
|
|
2,705 |
|
|
- |
|
|
- |
|
Total Permian Basin revenues |
|
|
196,557 |
|
|
107,997 |
|
|
32,578 |
|
|
|
|
|
|
|
|
|
|
|
|
Bakken Basin |
|
|
|
|
|
|
|
|
|
|
Services income |
|
$ |
20,621 |
|
$ |
25,813 |
|
$ |
22,351 |
|
Total Bakken Basin revenues |
|
|
20,621 |
|
|
25,813 |
|
|
22,351 |
|
|
|
|
|
|
|
|
|
|
|
|
Government |
|
|
|
|
|
|
|
|
|
|
Services income |
|
$ |
25,071 |
|
$ |
25,536 |
|
$ |
16,770 |
|
Total Government revenues |
|
|
25,071 |
|
|
25,536 |
|
|
16,770 |
|
|
|
|
|
|
|
|
|
|
|
|
All Other |
|
|
|
|
|
|
|
|
|
|
Services income |
|
$ |
3,273 |
|
$ |
4,310 |
|
$ |
1,799 |
|
Construction fee income |
|
|
15,748 |
|
|
23,209 |
|
|
1,924 |
|
Total All Other revenues |
|
|
19,021 |
|
|
27,519 |
|
|
3,723 |
|
|
|
|
|
|
|
|
|
|
|
|
Total revenues |
|
$ |
261,270 |
|
$ |
186,865 |
|
$ |
75,422 |
Contract Assets and Liabilities
We do not have any contract assets and we did not recognize any impairments of any contract assets or liabilities.
Contract liabilities under Topic 606 primarily consist of deferred revenue that represent room nights that the customer has not used and may use in the future.
|
|
|
Years Ended December 31, |
|||||||
|
|
|
2019 |
|
2018 |
|
2017 |
|||
|
Balances at Beginning of Year |
|
$ |
37,376 |
|
$ |
57,747 |
|
$ |
73,035 |
|
Additions to deferred revenue |
|
|
8,652 |
|
|
4,092 |
|
|
1,839 |
|
Revenue recognized |
|
|
(19,829) |
|
|
(24,463) |
|
|
(17,127) |
|
Balances at End of Year |
|
$ |
26,199 |
|
$ |
37,376 |
|
$ |
57,747 |
As of December 31, 2019, for contracts greater than one year, the following table discloses the estimated revenues related to performance obligations that are unsatisfied (or partially unsatisfied) and when we expect to recognize the revenue, and only represents revenue expected to be recognized from contracts where the price and quantity of the product or service are fixed (in thousands):
|
|
|
For the Years ended December 31, |
|||||||||||||
|
|
|
2020 |
|
2021 |
|
2022 |
|
Thereafter |
|
Total |
|||||
|
Revenue expected to be recognized as of December 31, 2019 |
|
$ |
32,335 |
|
$ |
23,413 |
|
$ |
2,999 |
|
$ |
- |
|
$ |
58,747 |
88
The Company applied some of the practical expedients in Topic 606 and does not disclose consideration for remaining performance obligations with an original expected duration of one year or less or for variable consideration related to unsatisfied (or partially unsatisfied) performance obligations. Due to the application of these practical expedients, the table above represents only a portion of the Company’s expected future consolidated revenues and it is not necessarily indicative of the expected trend in total revenues.
3. Business Combination
On March 15, 2019, Platinum Eagle consummated the Business Combination pursuant to the terms of the Merger Agreements and acquired all of the issued and outstanding equity interests in Target Parent and Signor Parent from the Sellers.
Pursuant to the Merger Agreements, Topaz purchased from the Sellers all of the issued and outstanding equity interests of Target Parent and Signor Parent for $1.311 billion, of which $563.1 million was paid in cash and the remaining $747.9 million was paid to the Sellers in the form of 25,686,327 shares of Common Stock, to Algeco Seller, and 49,100,000 shares of Common Stock, to Arrow Seller.
The following tables reconcile the elements of the Business Combination to the consolidated statement of cash flows for the year ended December 31, 2019.
|
|
|
Recapitalization |
|
|
Cash - Platinum Eagle's Trust (net of redemptions) |
|
$ |
146,137 |
|
Cash - PIPE |
|
|
80,000 |
|
Gross cash received by Target Hospitality from Business Combination |
|
|
226,137 |
|
Less: fees to underwriters |
|
|
(7,385) |
|
Net cash received from Recapitalization |
|
|
218,752 |
|
Plus: non-cash contribution - forgiveness of related party loan |
|
|
104,285 |
|
Less: non-cash net liabilities assumed from PEAC |
|
|
(8,840) |
|
Net contributions from Recapitalization Transaction |
|
$ |
314,197 |
|
|
|
|
|
|
|
|
|
|
|
|
|
Contributions |
|
|
Transaction bonus amounts |
|
$ |
28,519 |
|
Payment of historical ABL facility |
|
|
9,904 |
|
Payment of affiliate amounts |
|
|
684 |
|
Total contributions |
|
$ |
39,107 |
|
|
|
|
|
|
Cash paid to Algeco Seller |
|
$ |
563,134 |
The cash paid to Algeco Seller was funded from the proceeds from debt (described below), net cash received from Recapitalization (described above), offset by deferred financing costs and certain other transaction costs incurred in connection with the Business Combination.
The $340 million of gross proceeds from Bidco’s offering of 2024 Senior Secured Notes less $3.3 million of original issuance discount and $40 million through Bidco’s entry into a new ABL facility are shown separately in the consolidated statement of cash flows for the year ended December 31, 2019.
Prior to the Business Combination, Platinum Eagle had 32,500,000 shares of Class A common stock, par value $0.0001 per share (the “Class A Shares”) outstanding and 8,125,000 shares of Class B common stock, par value $0.0001 per share (the “Class B Shares”) outstanding, which comprised of Founder Shares held by the Founders (as defined below) and Former Platinum Eagle Director Shares held by individuals who are not founders but were directors of PEAC.
On March 15, 2019, Platinum Eagle was renamed Target Hospitality Corp. and each currently issued and outstanding share of Platinum Eagle Class B Shares automatically converted on a one-for-one basis, into shares of Platinum Eagle Delaware Class A Shares. Immediately thereafter, each currently issued and outstanding share of Platinum Eagle Class A
89
Shares automatically converted on a one-for-one basis, into shares of the common stock of Target Hospitality. In connection with the Business Combination, 18,178,394 Class A Shares were redeemed.
The number of shares of Common Stock of Target Hospitality issued immediately following the consummation of the Business Combination is summarized as follows:
|
Shares by Type |
|
Number of shares by type |
|
Platinum Eagle Class A Shares outstanding prior to the Business Combination |
|
32,500,000 |
|
Less: Redemption of Platinum Eagle Class A Shares |
|
(18,178,394) |
|
Class A Shares of Platinum Eagle |
|
14,321,606 |
|
Founder Shares |
|
8,050,000 |
|
Former Platinum Eagle Director Shares |
|
75,000 |
|
Shares issued to PIPE investors |
|
8,000,000 |
|
Shares issued to PEAC and PIPE investors |
|
30,446,606 |
|
Shares issued to the Sellers |
|
74,786,327 |
|
Total Outstanding Shares of Common Stock issued and outstanding |
|
105,232,933 |
|
Less: Founders Shares in escrow |
|
(5,015,898) |
|
Total Shares of Common Stock outstanding for earnings per share computation (see Note 20) |
|
100,217,035 |
In connection with the closing of and as a result of the consummation of the Business Combination, certain members of the Company’s management and employees received bonus payments as a result of the Business Combination being consummated in the aggregate amount of $28.5 million. The bonuses have been reflected in the selling, general and administrative expense line in the consolidated statements of comprehensive income. The bonuses were funded by a contribution from Algeco Seller in March of 2019 and is reflected as the transaction bonus amount contribution above. The Company also incurred transaction costs related to the Business Combination of approximately $8 million, which are included in selling, general and administrative expenses on the consolidated statement of comprehensive income for the year ended December 31, 2019. Upon the consummation of the Business Combination, outstanding loans to officers were forgiven, which resulted in $1.6 million of additional expenses recognized in selling, general and administrative expenses on the consolidated statement of comprehensive income for the year ended December 31, 2019 as more fully discussed in Note 19.
Earnout Agreement
On March 15, 2019 (the “Closing Date”), in connection with the closing of the Business Combination, Harry E. Sloan, Jeff Sagansky and Eli Baker (together, the “Founders”) and the Company entered into an earnout agreement (the “Earnout Agreement”), pursuant to which, on the Closing Date, 5,015,898 Founder Shares were placed in escrow (the “Escrow Shares”), to be released at any time during the period of three years following the Closing Date upon the occurrence of the following triggering events: (i) fifty percent (50%) of the Escrow Shares will be released to the Founder Group (as defined in the Earnout Agreement) if the closing price of the shares of Target Hospitality’s common stock as reported on Nasdaq exceeds $12.50 per share for twenty (20) of any thirty (30) consecutive trading days and (ii) the remaining fifty percent (50%) of the Escrow Shares will be released to the Founder Group if the closing price of the shares of Target Hospitality’s common stock as reported on Nasdaq exceeds $15.00 per share for twenty (20) of any thirty (30) consecutive trading days, in each case subject to certain notice mechanics.
90
Upon the expiration of the three-year earnout period, any Founders’ Shares remaining in escrow that were not released in accordance with the Earnout Agreement will be transferred to the Company for cancellation. The fair value of the Company’s contingent right to cancel the Founders’ Shares has been recorded as a component of additional paid in capital, with an equal and offsetting capital contribution from the Founders.
4. Acquisitions
Acquisition of Iron Horse
On December 15, 2017, Target purchased 100% of the membership interests of Iron Horse in a transaction under common control (initially acquired by a TDR affiliate on July 31, 2017). Target acquired Iron Horse for an aggregate purchase price of $37.1 million and recorded the excess of the purchase price over the carrying amount of the net assets acquired as a dividend, amounting to $0.1 million. The following table summarizes the carrying amount of the assets acquired and liabilities assumed at the date of acquisition by Target on December 15, 2017:
|
Cash, cash equivalents and restricted cash |
|
$ |
616 |
|
Other Assets |
|
|
36 |
|
Property and equipment |
|
|
14,720 |
|
Goodwill |
|
|
8,065 |
|
Intangible assets |
|
|
14,015 |
|
Total assets acquired |
|
|
37,452 |
|
|
|
|
|
|
Other liabilities |
|
|
(376) |
|
Dividend |
|
|
78 |
|
Net assets acquired |
|
$ |
37,154 |
Intangible assets related to customer relationships represent the aggregate value of those relationships from existing contracts and future operations on a look-through basis, considering the end customers of Iron Horse. The intangible assets received by Target are being amortized on a straight-line basis over an estimated useful life of nine years from the date of the business combination. The useful life is based on a period of expected future cash flow used to measure the fair value of the intangible assets.
The purchase price allocation performed by the TDR affiliate at July 31, 2017, the acquisition date, resulted in the recognition of approximately $8.1 million of goodwill which is attributable to the Permian basin segment. The goodwill recognized is attributable to expected revenue synergies generated by the expansion of territory of workforce housing, and costs synergies resulting from the consolidation or elimination of certain functions. The goodwill is expected to be deductible for income tax purposes.
The Companies have included the results of operations and cash flows of Iron Horse from the date of acquisition by the TDR affiliate as common control existed as of the business combination date. The effects of intra-entity transactions on current assets, current liabilities, revenue and expenses have been eliminated.
Iron Horse contributed $13.1 million and $1.5 million to our revenue and income before income taxes, respectively, for 2017.
The following unaudited pro forma information presents consolidated financial information as if Iron Horse had been acquired at the beginning of 2017.
|
Period |
|
Revenue |
|
Income before taxes |
||
|
2017 pro forma from January 1, 2017 to December 31, 2017 |
|
$ |
145,974 |
|
$ |
26,128 |
91
Signor Acquisition
On September 7, 2018, Bidco purchased 100% of the membership interests of Signor. Bidco acquired Signor for an aggregate purchase price of $201.5 million, excluding $15.5 million of cash and cash equivalents and restricted cash acquired. Included in the purchase price was $1.2 million of amounts owed to the sellers as a result of a subsequent working capital true-up adjustment recognized in accrued liabilities, with a corresponding increase to goodwill, as of December 31, 2018 in the accompanying consolidated balance sheets. The amount of the purchase price in excess of the fair value of the net assets acquired was recorded as goodwill.
The following table summarizes the allocation of the total purchase price to the net assets acquired and liabilities assumed at the date of acquisition by Bidco at estimated fair value:
|
Cash, cash equivalents and restricted cash |
|
$ |
15,536 |
|
Accounts receivable |
|
|
13,008 |
|
Property and equipment |
|
|
79,026 |
|
Other current assets |
|
|
581 |
|
Goodwill |
|
|
26,115 |
|
Customer relationships |
|
|
96,225 |
|
Total assets acquired |
|
|
230,491 |
|
|
|
|
|
|
Accounts payable |
|
|
(3,678) |
|
Accrued expenses |
|
|
(9,051) |
|
Capital lease liability and note payable |
|
|
(490) |
|
Unearned revenue |
|
|
(201) |
|
Total liabilities assumed |
|
|
(13,420) |
|
Net assets acquired |
|
$ |
217,071 |
The aggregate fair value of the acquired accounts receivable approximated the aggregate gross contractual amount. The contractual cash flows not expected to be collected at the acquisition date amounted to approximately $0.7 million.
Intangible assets related to customer relationships represent the aggregate value of those relationships from existing contracts and future operations on a look-through basis, considering the end customers of Signor. The intangible assets received by Bidco are being amortized on a straight-line basis over an estimated useful life of nine years from the date of the business combination.
The purchase price allocation performed resulted in the recognition of approximately $26.1 million of goodwill. The goodwill recognized is attributable to expected revenue synergies generated by the expansion of territory of workforce housing, and costs synergies resulting from the consolidation or elimination of certain functions. All of the goodwill is expected to be deductible for income tax purposes. All of the goodwill was allocated to the Permian Basin segment of our reportable segments discussed in Note 25.
The following unaudited pro forma information presents consolidated financial information as if Signor had been acquired as of January 1, 2017:
|
Period |
|
Revenue |
|
Income before taxes |
||
|
2018 pro forma from January 1, 2018 to December 31, 2018 |
|
$ |
301,842 |
|
$ |
41,175 |
|
2017 pro forma from January 1, 2017 to December 31, 2017 |
|
$ |
172,972 |
|
$ |
22,097 |
Signor added $30.1 million and $12.5 million to our revenue and income before income taxes, respectively, for 2018.
These pro forma amounts have been calculated after applying the Company’s accounting policies and adjusting the results of Signor to reflect the additional depreciation and amortization that would have been charged assuming the fair value adjustments to property and equipment, and intangible assets had been applied from January 1, 2017. This pro forma information is not necessarily indicative of the Company’s results of operations had the acquisition been completed on
92
January 1, 2017, nor is it necessarily indicative of the Company’s future results. This pro forma information does not reflect any cost savings from operating efficiencies or synergies that could result from the acquisition, and also does not reflect additional revenue opportunities following the acquisition.
2018 supplemental pro forma income before taxes was adjusted to exclude $5.2 million of acquisition-related costs incurred in 2018. 2017 supplemental pro forma income was adjusted to include these charges.
In connection with this acquisition, the Company incurred approximately $5.2 million of acquisition-related costs, which are recognized in selling, general, and administrative expenses in the accompanying consolidated statements of comprehensive income for the year ended December 31, 2018.
Superior Acquisition
On June 19, 2019, TLM, entered into a purchase agreement (the “Superior Purchase Agreement”) with Superior Lodging, LLC, Superior Lodging Orla South, LLC, and Superior Lodging Kermit, LLC (collectively, the “Superior Sellers”), and certain other parties, pursuant to which TLM acquired substantially all of the assets in connection with three workforce communities in the Delaware Basin of West Texas, including temporary housing facilities and underlying real estate (the “Communities”). Pursuant to the Superior Purchase Agreement, TLM acquired the Communities for a purchase price of $30.0 million in cash, which represents the acquisition date fair value of consideration transferred. The purchase price was funded by drawing on the New ABL Facility discussed in Note 11. The Superior Purchase Agreement provided for a simultaneous signing and closing on June 19, 2019. This acquisition further expands the Company’s presence in the Permian Basin. Immediately prior to the acquisition of the Communities, TLM provided management and catering services to the Superior Sellers at two of the Communities. At the time of the acquisition, all three Communities were fully operational and provided vertically integrated comprehensive hospitality services consistent with Target’s business. Certain affiliates of the Superior Sellers will continue to lease 140 beds in the Communities for the next year.
The following table summarizes the allocation of the total purchase price to the net assets acquired and liabilities assumed at the date of acquisition by TLM at estimated fair value:
|
Property and equipment |
|
$ |
18,342 |
|
Customer relationships |
|
|
4,800 |
|
Goodwill |
|
|
6,858 |
|
Total assets acquired |
|
$ |
30,000 |
Intangible assets related to customer relationships represent the aggregate value of those relationships from existing arrangements and future operations on a look-through basis, considering the end customers. The intangible assets received are being amortized on a straight-line basis over an estimated useful life of nine years from the date of the business combination.
The following unaudited pro forma information presents consolidated financial information as if Superior had been acquired as of January 1, 2018:
|
Period |
|
Revenue |
|
Income before taxes |
||
|
2019 pro forma from January 1, 2019 to December 31, 2019 |
|
$ |
325,845 |
|
$ |
15,557 |
|
2018 pro forma from January 1, 2018 to December 31, 2018 |
|
$ |
252,706 |
|
$ |
20,553 |
Superior added $7.8 million and $4.0 million to our revenue and income before income taxes, respectively, for year ended December 31, 2019.
These pro forma amounts have been calculated after applying the Company’s accounting policies and adjusting the results of Superior to reflect the additional depreciation and amortization that would have been charged assuming the fair value adjustments to property and equipment, and intangible assets had been applied from January 1, 2018. This pro forma information is not necessarily indicative of the Company’s results of operations had the acquisition been completed on January 1, 2018, nor is it necessarily indicative of the Company’s future results. This pro forma information does not
93
reflect any cost savings from operating efficiencies or synergies that could result from the acquisition, and also does not reflect additional revenue opportunities following the acquisition.
In connection with this acquisition, the Company incurred approximately $0.4 million of acquisition-related costs, which are recognized in selling, general, and administrative expenses in the accompanying consolidated statement of comprehensive income for the ended December 31, 2019. 2019 supplemental pro-forma income before taxes was adjusted to exclude these acquisition-related costs. 2018 supplemental pro-forma income before income taxes was adjusted to include these charges.
The purchase price allocation performed by the Company resulted in the recognition of $6.9 million of goodwill. The goodwill recognized is attributable to expected revenue synergies generated by the territorial expansion of workforce housing, and costs synergies resulting from the consolidation or elimination of certain functions. All of the goodwill is expected to be deductible for income tax purposes. All of the goodwill was allocated to the Permian Basin segment of our reportable segments discussed in Note 25.
ProPetro
On July 1, 2019, TLM purchased a 168-room community from ProPetro Services, Inc. (“ProPetro”) for an aggregate purchase price of $5.0 million in cash, which represents the acquisition date fair value of consideration transferred. The purchase price was funded by cash on hand as of the acquisition date. The acquisition was accounted for as an asset acquisition. The Company allocated the total purchase price to identifiable tangible assets based on their estimated relative fair values, which resulted in the entire purchase price being allocated to property and equipment.
5. Specialty Rental Assets, Net
Specialty rental assets, net at the dates indicated below consisted of the following:
|
|
|
December 31, |
|
December 31, |
||
|
|
|
2019 |
|
2018 |
||
|
Specialty rental assets |
|
$ |
545,399 |
|
$ |
432,158 |
|
Construction-in-process |
|
|
8,672 |
|
|
18,356 |
|
Less: accumulated depreciation |
|
|
(200,376) |
|
|
(156,955) |
|
Specialty rental assets, net |
|
$ |
353,695 |
|
$ |
293,559 |
Included in specialty rental assets, net are certain assets under capital lease. The gross cost of the specialty rental assets under capital lease was approximately $1.3 million and $22.8 million as of December 31, 2019 and 2018. Approximately $22.2 million of this gross cost attributable to assets under capital lease as of December 31, 2018 transferred ownership to the Company in January of 2019 pursuant to the terms of the agreement. The accumulated depreciation related to specialty rental assets under capital leases totaled $0 and $8.2 million as of December 31, 2019 and 2018, respectively. Depreciation expense of these assets is presented in depreciation of specialty rental assets in the accompanying consolidated statements of comprehensive income.
94
6. Other Property, Plant and Equipment, Net
Other property, plant, and equipment, net at the dates indicated below, consisted of the following:
|
|
|
December 31, |
|
December 31, |
||
|
|
|
2019 |
|
2018 |
||
|
Land |
|
$ |
9,155 |
|
$ |
16,245 |
|
Buildings and leasehold improvements |
|
|
978 |
|
|
908 |
|
Machinery and office equipment |
|
|
1,903 |
|
|
1,083 |
|
Software and other |
|
|
1,690 |
|
|
1,667 |
|
|
|
|
13,726 |
|
|
19,903 |
|
Less: accumulated depreciation |
|
|
(2,185) |
|
|
(1,021) |
|
Total other property, plant and equipment, net |
|
$ |
11,541 |
|
$ |
18,882 |
Depreciation expense related to other property, plant and equipment was approximately $1.2 million, $0.3 million and $0.8 million for the years ended December 31, 2019, 2018 and 2017, respectively, and is included in other depreciation and amortization in the consolidated statements of comprehensive income. The December 31, 2019 and 2018 land amounts in the table above includes approximately $0.7 million and $7.6 million of land acquired as part of the Signor acquisition discussed in Note 4, which is currently not being used in the operations of the business.
The gross cost of other property, plant and equipment under capital lease was approximately $0.7 million and $0 as of December 31, 2019 and 2018, respectively. The accumulated depreciation related to other property, plant and equipment under capital lease was approximately $0 as of December 31, 2019 and 2018, respectively.
In November of 2019, the Company auctioned several non-strategic land parcels including the Signor land discussed above, and other related assets (the “properties”) not used in the operations of the business for estimated net sale proceeds of approximately $1.4 million. The sale resulted in a pre-tax loss on the disposal of property, plant, and equipment of approximately $6.9 which is included in other expense (income), net in the consolidated statements of comprehensive income. These properties had a carrying value of approximately $8.1 million and are primarily located in the Permian Basin business segment and reporting unit.
7. Loss on Impairment
During the fourth quarter of 2018, the Company decided to dispose of certain nonstrategic asset groups that were vacant or operating at a loss. Some of these asset groups will be disposed of by sale, but are not classified as held for sale, as it is not probable that these asset groups will be sold within twelve months from the balance sheet date. Additionally, we identified an indicator that another asset group in the Canadian oil sands may be impaired due to deteriorating market conditions (“All Other” category above). These asset groups are comprised of land, modular units, furniture and fixtures, and land improvements. We assessed the carrying value of these asset groups to determine if they continued to be recoverable based on their estimated future cash flows. Based on the assessment, the carrying value of these asset groups were determined to not be fully recoverable, and we proceeded to compare the estimated fair value of those assets to their respective carrying values. The fair value of asset groups expected to be sold was determined using the market approach, comparing the assets held to other similar assets that have recently transacted in the market as well as identifying a depreciated replacement cost for real property assets. The fair value of the other asset groups was determined based on a discounted cash flow analysis in accordance with the income approach whereby current cash flow projections demonstrate continued operating losses in the future. Accordingly, the value of the asset groups was written down to their estimated
95
fair values resulting in a total loss on impairment for the year ended December 31, 2018 of $15.3 million. No impairment was recognized during 2019 or 2017.
The following summarizes pre-tax impairment charges recorded during 2018 by segment, which are included in loss on impairment in our consolidated statements of comprehensive income (in thousands):
|
|
|
The Permian |
|
The Bakken |
|
|
|
|
All |
|
|
|
|||
|
|
|
Basin |
|
Basin |
|
Government |
|
Other |
|
Total |
|||||
|
Year ended December 31, 2018 |
|
$ |
696 |
|
$ |
7,233 |
|
$ |
— |
|
$ |
7,391 |
|
$ |
15,320 |
Our estimates of fair value using market and income-based approaches required us to use significant unobservable inputs, representative of Level 3 fair value measurements, including numerous assumptions with respect to future circumstances that might directly impact each of the relevant asset groups’ operations in the future. These assumptions considered a variety of industry and local market conditions.
8. Goodwill and Other Intangible Assets, net
As discussed in Note 4, Bidco’s acquisition of Signor in September 2018 and TLM’s acquisition of Superior in June 2019, resulting in the recognition of goodwill. In connection with the Signor and Superior transactions, all goodwill was attributable to the Permian Basin business segment and reporting unit.
Changes in the carrying amount of goodwill were as follows:
|
|
|
Permian Basin |
|
|
Balance at January 1, 2018 |
|
$ |
8,065 |
|
Acquisition of Signor |
|
|
26,115 |
|
Balance at December 31, 2018 |
|
|
34,180 |
|
Acquisition of Superior |
|
|
6,858 |
|
Balance at December 31, 2019 |
|
$ |
41,038 |
During 2019, we performed a qualitative assessment for each reporting unit with goodwill which considered various factors, including changes in carrying value of the reporting unit, forecasted operating results, long-term growth rates and discount rates. Additionally, we considered qualitative key events and circumstances, including macroeconomic environment industry and market conditions, cost factors and events specific to the reporting units. Based on this assessment, we concluded that it was more likely than not that the fair value of the reporting unit was greater than its’ carrying value and as such, a quantitative impairment test was not required.
Intangible assets other than goodwill at the dates indicated below consisted of the following:
|
|
|
December 31, 2019 |
|||||||||
|
|
|
Weighted |
|
Gross |
|
|
|
|
|
||
|
|
|
average |
|
Carrying |
|
Accumulated |
|
Net Book |
|||
|
|
|
remaining lives |
|
Amount |
|
Amortization |
|
Value |
|||
|
Intangible assets subject to amortization |
|
|
|
|
|
|
|
|
|
|
|
|
Customer relationships |
|
7.4 |
|
$ |
132,720 |
|
$ |
(31,254) |
|
$ |
101,466 |
|
Non-compete agreements |
|
— |
|
|
11,400 |
|
|
(11,400) |
|
|
— |
|
Total |
|
|
|
|
144,120 |
|
|
(42,654) |
|
|
101,466 |
|
Indefinite lived assets: |
|
|
|
|
|
|
|
|
|
|
|
|
Tradenames |
|
|
|
|
16,400 |
|
|
— |
|
|
16,400 |
|
Total intangible assets other than goodwill |
|
|
|
$ |
160,520 |
|
$ |
(42,654) |
|
$ |
117,866 |
96
|
|
|
December 31, 2018 |
|||||||||
|
|
|
Weighted |
|
Gross |
|
|
|
|
|
||
|
|
|
average |
|
Carrying |
|
Accumulated |
|
Net Book |
|||
|
|
|
remaining lives |
|
Amount |
|
Amortization |
|
Value |
|||
|
Intangible assets subject to amortization |
|
|
|
|
|
|
|
|
|
|
|
|
Customer relationships |
|
8.3 |
|
$ |
127,920 |
|
$ |
(16,937) |
|
$ |
110,983 |
|
Non-compete agreements |
|
— |
|
|
11,400 |
|
|
(11,400) |
|
|
— |
|
Total |
|
|
|
|
139,320 |
|
|
(28,337) |
|
|
110,983 |
|
Indefinite lived assets: |
|
|
|
|
|
|
|
|
|
|
|
|
Tradenames |
|
|
|
|
16,400 |
|
|
— |
|
|
16,400 |
|
Total intangible assets other than goodwill |
|
|
|
$ |
155,720 |
|
$ |
(28,337) |
|
$ |
127,383 |
The aggregate amortization expense for intangible assets subject to amortization was $14.3 million, $7.2 million and $4.9 million for the years ended December 31, 2019, 2018 and 2017, respectively, and is included in other depreciation and amortization in the consolidated statements of comprehensive income.
The estimated aggregate amortization expense as of December 31, 2019 for each of the next five years and thereafter is as follows:
|
2020 |
|
$ |
14,656 |
|
2021 |
|
|
14,656 |
|
2022 |
|
|
13,302 |
|
2023 |
|
|
12,881 |
|
2024 |
|
|
12,881 |
|
Thereafter |
|
|
33,090 |
|
Total |
|
$ |
101,466 |
9. Accrued Liabilities
Accrued liabilities as of the dates indicated below consists of the following:
|
|
|
December 31, |
|
December 31, |
||
|
|
|
2019 |
|
2018 |
||
|
Accrued expenses |
|
$ |
6,310 |
|
$ |
9,104 |
|
Employee accrued compensation expense |
|
|
6,929 |
|
|
5,774 |
|
Other accrued liabilities |
|
|
12,373 |
|
|
4,844 |
|
Accrued interest on debt |
|
|
9,718 |
|
|
244 |
|
Accrued interest due affiliates |
|
|
— |
|
|
3,334 |
|
Total accrued liabilities |
|
$ |
35,330 |
|
$ |
23,300 |
10. Notes Due from Affiliates
The Company records interest income on notes due from affiliates based on the stated interest rate in the loan agreement. Refer to Note 11 for interest income recognized for the years ended December 31, 2019, 2018 and 2017, respectively.
All affiliate notes were paid in connection with the Business Combination discussed in Note 3.
11. Debt
Senior Secured Notes 2024
In connection with the closing of the Business Combination, Bidco issued $340 million in aggregate principal amount of 9.50% senior secured notes due March 15, 2024 (the “2024 Senior Secured Notes” or “Notes”) under an indenture
97
dated March 15, 2019 (the “Indenture”). The Indenture was entered into by and among Bidco, the guarantors named therein (the “Note Guarantors”), and Deutsche Bank Trust Company Americas, as trustee and as collateral agent. Interest is payable semi-annually on September 15 and March 15 beginning September 15, 2019. Refer to table below for a description of the amounts related to the Notes.
|
|
|
|
Principal |
|
|
Unamortized Original Issue Discount |
|
|
Unamortized Deferred Financing Costs |
|
9.50% Senior Secured Notes, due 2024 |
|
$ |
340,000 |
|
$ |
2,876 |
|
$ |
13,866 |
Before March 15, 2021, Bidco may redeem the Notes at a redemption price equal to 100% of the principal amount, plus a customary make whole premium for the Notes being redeemed, plus accrued and unpaid interest, if any, up to but not including the redemption date.
The customary make whole premium, with respect to the Notes on any applicable redemption date, as calculated by Bidco, is the greater of (i) 1.00% of the then outstanding principal amount of the Note; and (ii) the excess of (a) the present value at such redemption date of (i) the redemption price set on or after March 15, 2021 plus (ii) all required interest payments due on the Note through March 15, 2021, excluding accrued but unpaid interest to the redemption date, in each case, computed using a discount rate equal to the Treasury Rate as of such redemption date plus 50 basis points; over (b) the then outstanding principal amount of the Notes.
Before March 15, 2021, Bidco may redeem up to 40% of the aggregate principal number of outstanding Notes at a redemption price equal to 109.50% of the principal amount of the Notes redeemed, plus accrued and unpaid interest, if any, to but not including the redemption date, with the net proceeds of any equity offerings. Bidco may redeem up to 10% of the aggregate principal amount of the Notes during each twelve-month period commencing on the issue date and prior to March 15, 2021 at a redemption price equal to 103% of the principal amount of the Notes, plus accrued and unpaid interest, if any, to but not including the redemption date. If Bidco undergoes a change of control or sells certain of its assets, Bidco may be required to offer to repurchase the Notes. On or after March 15, 2021, Bidco at its option, may redeem the Notes, in whole or part, upon not less than fifteen (15) and not more than sixty (60) days’ prior written notice to holders and not less than twenty (20) days’ prior written notice to the trustee (or such shorter timeline as the trustee may agree), at the redemption price expressed as percentage of principal amount set forth below, plus accrued and unpaid interest thereon but not including the applicable redemption date (subject to the right of Note holders on the relevant record date to receive interest due on an interest payment date falling on or prior to the redemption date), if redeemed during the 12-month period beginning August 15 of each of the years set below.
|
|
|
Redemption |
|
Year |
|
Price |
|
2021 |
|
104.750% |
|
2022 |
|
102.375% |
|
2023 and thereafter |
|
100.000% |
The Notes are unconditionally guaranteed by Topaz and each of Bidco’s direct and indirect wholly-owned domestic subsidiaries (collectively, the “Note Guarantors”). Target Hospitality is not an issuer or a guarantor of the Notes. The Note Guarantors are either borrowers or guarantors under the New ABL Facility. To the extent lenders under the New ABL Facility release the guarantee of any Note Guarantor, such Note Guarantor is also released from obligations under the Notes. These guarantees are secured by a second priority security interest in substantially all of the assets of Bidco and the Note Guarantors (subject to customary exclusions). The guarantees of the Notes by TLM Equipment, LLC, a Delaware limited liability company (“TLM Equipment LLC”) which holds certain of Target Hospitality’s assets, are subordinated to its obligations under the New ABL Facility (as defined below).
The Notes contain certain negative covenants, including limitations that restrict Bidco’s ability and the ability of certain of its subsidiaries, to directly or indirectly, create additional financial obligations. With certain specified exceptions, these negative covenants prohibit Bidco and certain of its subsidiaries from: creating or incurring additional debt; paying dividends or making any other distributions with respect to its capital stock; making loans or advances to Bidco or any
98
restricted subsidiary of Bidco; selling, leasing or transferring any of its property or assets to Bidco or any restricted subsidiary of Bidco; directly or indirectly creating, incurring or assuming any lien of any kind securing debt on the collateral; or entering into any sale and leaseback transaction.
In connection with the issuance of the Notes, there was an original issue discount of $3.3 million and the unamortized balance of $2.9 million is presented on the face of the consolidated balance sheet as of December 31, 2019 as a reduction of the principal. The discount is amortized over the life of the Notes using the effective interest method.
Bidco’s ultimate parent, Target Hospitality, has no significant independent assets or operations except as included in the guarantors of the Senior Secured Notes, the guarantees under the Notes are full and unconditional and joint and several, and any subsidiaries of Target Hospitality that are not subsidiary guarantors of the Notes are minor. There are also no significant restrictions on the ability of Target Hospitality or any guarantor to obtain funds from its subsidiaries by dividend or loan. See discussion of certain negative covenants above. Therefore, pursuant to the SEC Rules, no individual guarantor financial statement disclosures are deemed necessary.
Capital Lease and Other Financing Obligations
The Company’s capital lease and other financing obligations as of December 31, 2019 consisted of $2.0 million of capital leases. In December 2019, the Company entered into a lease for certain equipment with a lease term expiring November 2022 and an effective interest rate of 4.3%. The Company’s lease relates to commercial-use vehicles.
The Company’s capital lease and financing obligations at December 31, 2018, primarily consisted of $1.3 million associated with an equipment financing arrangement, and $1.2 million of capital leases.
The $1.3 million related to the equipment financing agreement is payable monthly and matured in January 2019 and bears interest at 11.1%. Under this agreement, the Company’s transferred title and ownership of certain lodging units, assigned a portion of future lease payments, and can repurchase the rental equipment for $1 in January 2019.
The $1.3 million related to the equipment financing agreement as of December 31, 2018 was fully repaid in January 2019.
The Company entered into a capital lease for certain equipment with a lease term expiring in October 2019 and an effective interest rate of 7.43%. The Company’s capital leases relating to commercial-use vehicles have interest rates ranging from 3.3% to 20.7% with lease terms that expire through December 31, 2019.
New ABL Facility
On the Closing Date, in connection with the closing of the Business Combination, Topaz, Bidco, Target, Signor and each of their domestic subsidiaries entered into an ABL credit agreement that provides for a senior secured asset based revolving credit facility in the aggregate principal amount of up to $125 million (the “New ABL Facility”). The historical debt of Bidco, Target and their respective subsidiaries under the ABL facility of Algeco Seller was settled at the time of the consummation of the Business Combination on the Closing Date. Approximately $40 million of proceeds from the New ABL Facility were used to finance a portion of the consideration payable and fees and expenses incurred in connection with the Business Combination.
Borrowings under the New ABL Facility, at the relevant borrower’s (the borrowers under the New ABL Facility, the “ABL Borrowers”) option, bear interest at either (1) an adjusted LIBOR or (2) a base rate, in each case plus an applicable margin. The applicable margin is 2.50% with respect to LIBOR borrowings and 1.50% with respect to base rate borrowings. Commencing at the completion of the first full fiscal quarter after the Closing Date, the applicable margin for borrowings under the New ABL Facility is subject to one step-down of 0.25% and one step-up of 0.25%, based on achieving certain excess availability levels with respect to the New ABL Facility.
The New ABL Facility provides borrowing availability of an amount equal to the lesser of (i) (a) $125 million and (b) the Borrowing Base (defined below) (the “Line Cap”).
99
The Borrowing Base is, at any time of determination, an amount (net of reserves) equal to the sum of:
|
· |
85% of the net book value of the Borrowers’ eligible accounts receivables, plus |
|
· |
the lesser of (i) 95% of the net book value of the Borrowers’ eligible rental equipment and (ii) 85% of the net orderly liquidation value of the Borrowers’ eligible rental equipment, minus |
|
· |
customary reserves |
The New ABL Facility includes borrowing capacity available for standby letters of credit of up to $15 million and for ‘‘swingline’’ loan borrowings of up to $15 million. Any issuance of letters of credit or making of a swingline loan will reduce the amount available under the New ABL Facility.
In addition, the New ABL Facility will provide the Borrowers with the option to increase commitments under the New ABL Facility in an aggregate amount not to exceed $75 million plus any voluntary prepayments that are accompanied by permanent commitment reductions under the New ABL Facility. The termination date of the New ABL Facility is September 15, 2023.
The obligations under the New ABL Facility are unconditionally guaranteed by Topaz and each existing and subsequently acquired or organized direct or indirect wholly-owned U.S. organized restricted subsidiary of Bidco (together with Topaz, the “ABL Guarantors”), other than certain excluded subsidiaries. The New ABL Facility is secured by (i) a first priority pledge of the equity interests of Topaz, Bidco, Target, and Signor (the “Borrowers) and of each direct, wholly-owned US organized restricted subsidiary of any Borrower or any ABL Guarantor, (ii) a first priority pledge of up to 65% of the voting equity interests in each non-US restricted subsidiary of any Borrower or ABL Guarantor and (iii) a first priority security interest in substantially all of the assets of the Borrower and the ABL Guarantors (in each case, subject to customary exceptions).
The New ABL Facility requires the Borrowers to maintain a (i) minimum fixed charge coverage ratio of 1.00:1.00 and (ii) maximum total net leverage ratio of 4.00:1.00, at any time when the excess availability under the New ABL Facility is less than the greater of (a) $15.625 million and (b) 12.5% of the Line Cap.
The New ABL Facility also contains a number of customary negative covenants. Such covenants, among other things, limit or restrict the ability of each of the Borrowers, their restricted subsidiaries, and where applicable, Topaz, to:
|
· |
incur additional indebtedness, issue disqualified stock and make guarantees; |
|
· |
incur liens on assets; |
|
· |
engage in mergers or consolidations or fundamental changes; |
|
· |
sell assets; |
|
· |
pay dividends and distributions or repurchase capital stock; |
|
· |
make investments, loans and advances, including acquisitions; |
|
· |
amend organizational documents and master lease documents; |
|
· |
enter into certain agreements that would restrict the ability to pay dividends; |
|
· |
repay certain junior indebtedness; and |
|
· |
change the conduct of its business. |
The aforementioned restrictions are subject to certain exceptions including (i) the ability to incur additional indebtedness, liens, investments, dividends and distributions, and prepayments of junior indebtedness subject, in each case, to compliance with certain financial metrics and certain other conditions and (ii) a number of other traditional exceptions that grant the ABL Borrowers continued flexibility to operate and develop their businesses. The New ABL Facility also contains certain customary representations and warranties, affirmative covenants and events of default.
100
The carrying value of debt outstanding as of the dates indicated below consist of the following:
|
|
|
December 31, |
|
December 31, |
||
|
|
|
2019 |
|
2018 |
||
|
Capital lease and other financing obligations |
|
$ |
1,985 |
|
$ |
2,460 |
|
ABL facilities |
|
|
80,000 |
|
|
20,550 |
|
9.50% Senior Secured Notes due 2024, face amount |
|
|
340,000 |
|
|
— |
|
Less: unamortized original issue discount |
|
|
(2,876) |
|
|
— |
|
Less: unamortized term loan deferred financing costs |
|
|
(13,866) |
|
|
— |
|
Total debt, net |
|
|
405,243 |
|
|
23,010 |
|
Less: current maturities |
|
|
(996) |
|
|
(2,446) |
|
Total long-term debt |
|
$ |
404,247 |
|
$ |
20,564 |
Interest expense (income), net
The components of interest expense (income), net (which includes interest expense incurred) recognized in the consolidated statements of comprehensive income for the periods indicated below consist of the following:
|
|
|
For the Years Ended December 31, |
|||||||
|
|
|
2019 |
|
2018 |
|
2017 |
|||
|
Interest income on Notes Due from Affiliates (Note 10) |
|
$ |
- |
|
$ |
(4,663) |
|
$ |
(7,953) |
|
Interest expense incurred on Notes Due to Affiliates (Note 12) |
|
|
1,955 |
|
|
23,969 |
|
|
160 |
|
Interest expense incurred on ABL facilities and Notes |
|
|
28,608 |
|
|
2,400 |
|
|
2,686 |
|
Amortization of deferred financing costs on Notes |
|
|
2,052 |
|
|
- |
|
|
- |
|
Amortization of deferred financing costs on New ABL facility |
|
|
688 |
|
|
- |
|
|
- |
|
Amortization of deferred financing costs on Algeco ABL facility |
|
|
464 |
|
|
2,492 |
|
|
- |
|
Amortization of original issue discount on Notes |
|
|
425 |
|
|
- |
|
|
- |
|
Interest capitalized |
|
|
(791) |
|
|
- |
|
|
- |
|
Interest expense (income), net |
|
$ |
33,401 |
|
$ |
24,198 |
|
$ |
(5,107) |
Deferred Financing Costs and Original Issue Discount
The Company incurred and deferred approximately $16.3 million of deferred financing costs and approximately $3.3 million of original issue discount in connection with the issuance of the Notes in 2019 in connection with the Business Combination, which are included in the carrying value of the Notes as of December 31, 2019. The Company presents unamortized deferred financing costs and unamortized original issue discount as a direct deduction from the principal amount of the Notes on the consolidated balance sheet as of December 31, 2019. Accumulated amortization expense related to the deferred financing costs was approximately $2.0 million, $0 and $0 as of December 31, 2019, 2018 and 2017, respectively. Accumulated amortization of the original issue discount was approximately $0.4 million and $0 as of December 30, 2019 and 2018, respectively.
The Company also incurred deferred financing costs associated with the New ABL Facility as a result of the Business Combination in the amount of approximately $4.1 million, which are capitalized and presented on the consolidated balance sheet as of December 31, 2019 within deferred financing costs revolver, net. These costs are amortized over the contractual term of the line-of-credit through the initial maturity date using the straight-line method.
The New ABL Facility was considered a modification of the Algeco ABL facility for accounting purposes. Certain of the lenders under the Algeco ABL facility are also lenders under the New ABL Facility. As the borrowing capacity of each of the continuing lenders in the New ABL Facility is greater than the borrowing capacity of the Algeco ABL facility, the unamortized deferred financing costs at the time of the modification of approximately $1.8 million associated with the continuing lenders of the Algeco ABL facility was deferred and amortized over the remaining term of the New ABL Facility. Any unamortized deferred financing costs from the Algeco ABL facility that pertained to non-continuing lenders were expensed through loss on extinguishment of debt on the consolidated statement of comprehensive income as of the
101
modification date. The Company recognized a charge of $0.9 million in loss on extinguishment of debt related to the write-off of deferred financing costs pertaining to non-continuing lenders for the year ended December 31, 2019.
Accumulated amortization related to revolver deferred financing costs for both the Algeco ABL facility and New ABL Facility was approximately $1.1 million and $0.6 million as of December 31, 2019 and 2018, respectively.
Refer to the components of interest expense table in Note 11 for the amounts of the amortization expense related to the deferred financing costs and original issue discount recognized for each of these debt instruments for the years ended December 31, 2019, 2018 and 2017, respectively.
Future maturities
The aggregate annual principal maturities of debt and capital lease obligations for each of the next five years and thereafter, based on contractual terms are listed in the table below.
The schedule of future maturities as of December 31, 2019 consists of the following:
|
2020 |
|
$ |
989 |
|
2021 |
|
|
700 |
|
2022 |
|
|
296 |
|
2023 |
|
|
— |
|
2024 |
|
|
80,000 |
|
Thereafter |
|
|
340,000 |
|
Total |
|
$ |
421,985 |
12. Notes Due to Affiliates
The Company records interest expense on notes due to affiliates based on the stated interest rate in the loan agreement. Refer to Note 11 for interest expense incurred for the years ended December 31, 2019, 2018 and 2017, respectively.
As part of an intercompany debt restructuring, which occurred in December of 2018, Target Parent collected cash for the repayment of 100% of its affiliate note receivables and related accrued interest (Note 8), which amounted to approximately $61 million. Additionally, the sole member of Target Parent contributed $217 million to Target Parent on December 14, 2018. Cash received for the above amounts as of December 14, 2018 totaled approximately $278 million. The cash was used to pay off all intercompany debt and related accrued interest owed by Target Parent as of December 14, 2018, which amounted to approximately $278 million.
As part of the Business Combination, the affiliate note that was executed in September 2018 in connection with the acquisition of Signor has been extinguished. Prior to the Business Combination, Signor paid $9 million to a TDR affiliate, of which $5.3 million was used to pay off the accrued interest and the remaining $3.7 million was used to pay down the outstanding principal, reducing the amount owed to $104.3 million. Upon consummation of the Business Combination, the remaining principal was settled between Signor and the TDR affiliate in the form of a capital contribution.
Notes due to affiliates as of the dates indicated below consist of the following:
|
|
|
Interest |
|
Date of |
|
December 31, |
|
December 31, |
||
|
Affiliate Lender |
|
Rate |
|
Maturity |
|
2019 |
|
2018 |
||
|
Arrow Holdings S.a.r.l. |
|
LIBOR + 4% |
|
September 2023 |
|
$ |
— |
|
$ |
108,047 |
102
13. Income Taxes
The components of the provision for income taxes for the years ended December 31, 2019, 2018 and 2017, are comprised of the following:
|
|
|
2019 |
|
2018 |
|
2017 |
|||
|
Domestic |
|
|
|
|
|
|
|
|
|
|
Current |
|
$ |
1,615 |
|
$ |
891 |
|
$ |
3,706 |
|
Deferred |
|
|
5,992 |
|
|
10,864 |
|
|
21,880 |
|
|
|
|
|
|
|
|
|
|
|
|
Foreign |
|
|
|
|
|
|
|
|
|
|
Deferred |
|
|
— |
|
|
— |
|
|
(2) |
|
Total income tax expense |
|
$ |
7,607 |
|
$ |
11,755 |
|
$ |
25,584 |
Income tax results differed from the amount computed by applying the U.S. statutory income tax rate to income before income taxes for the following reasons for the years ended December 31:
|
|
|
2019 |
|
2018 |
|
2017 |
|||
|
Statutory income tax expense |
|
$ |
2,903 |
|
$ |
3,109 |
|
$ |
9,298 |
|
State tax expense |
|
|
1,816 |
|
|
2,681 |
|
|
531 |
|
Effect of tax rates in foreign jurisdictions |
|
|
(37) |
|
|
(623) |
|
|
219 |
|
Change in tax rate |
|
|
— |
|
|
— |
|
|
12,064 |
|
Financing fees |
|
|
— |
|
|
— |
|
|
2,608 |
|
Interest expense |
|
|
— |
|
|
— |
|
|
(194) |
|
Transaction costs |
|
|
2,387 |
|
|
1,288 |
|
|
355 |
|
Stewardship expense |
|
|
35 |
|
|
2,397 |
|
|
— |
|
Valuation allowances |
|
|
226 |
|
|
2,801 |
|
|
752 |
|
Other |
|
|
277 |
|
|
102 |
|
|
(49) |
|
Reported income tax expense |
|
$ |
7,607 |
|
$ |
11,755 |
|
$ |
25,584 |
Income tax expense was $7.6 million, $11.8 million and $25.6 million for the years ended December 31, 2019, 2018 and 2017, respectively. The effective tax rate for the years ended December 31, 2019, 2018, and 2017 was 55.0%, 70.30% and 96.3%, respectively. The fluctuation in the rate for the years ended December 31, 2019, 2018 and 2017, respectively, results primarily from the relationship of year-to-date income before income tax and the discrete treatment of the bonus amounts and transaction costs paid in connection with the Business Combination discussed in Note 3 as well as the restructuring costs in 2018.
103
Deferred Income Taxes
Deferred income taxes reflect the net tax effects of temporary differences between the carrying amounts of assets and liabilities and their tax bases, as well as from net operating loss and carryforwards.
Significant components of the deferred tax assets and liabilities for the Company are as follows:
|
|
|
2019 |
|
2018 |
||
|
Deferred tax assets |
|
|
|
|
||
|
Deferred compensation |
|
$ |
161 |
|
$ |
177 |
|
Deferred revenue |
|
|
5,941 |
|
|
10,084 |
|
Intangible assets |
|
|
9,289 |
|
|
7,420 |
|
Tax loss carryforwards |
|
|
16,799 |
|
|
22,093 |
|
Accrueds |
|
|
— |
|
|
54 |
|
Interest |
|
|
7 |
|
|
730 |
|
Other - net |
|
|
632 |
|
|
162 |
|
Deferred tax assets gross |
|
|
32,829 |
|
|
40,720 |
|
Valuation allowance |
|
|
(3,994) |
|
|
(3,572) |
|
Net deferred income tax asset |
|
|
28,835 |
|
|
37,148 |
|
|
|
|
|
|
|
|
|
Deferred tax liabilities |
|
|
|
|
|
|
|
Rental equipment and other plant, property and equipment |
|
|
(21,358) |
|
|
(24,728) |
|
Software |
|
|
(1,050) |
|
|
— |
|
Deferred tax liability |
|
|
(22,408) |
|
|
(24,728) |
|
Net deferred income tax asset |
|
$ |
6,427 |
|
$ |
12,420 |
Tax loss carryovers totaled $74.4 million at December 31, 2019. Approximately $4.1 million of these tax loss carryovers expire between 2023 and 2040. The remaining $70.3 million of tax loss carryovers do not expire. The availability of these tax losses to offset future income varies by jurisdiction. Furthermore, the ability to utilize the tax losses may be subject to additional limitations upon the occurrence of certain events, such as changes in ownership of the Company. A valuation allowance has been established against the deferred tax assets to the extent it is not more likely than not they will be realized.
|
|
|
|
|
|
|
|
|
|
Valuation |
|
|
|
|
2019 |
|
|
Expiration |
|
Allowance |
|
||
|
United States |
|
$ |
71,615 |
|
|
$ |
1,300 expire in 2038. Remaining do not expire |
|
— |
% |
|
Canada |
|
|
2,384 |
|
|
|
2023-2040 |
|
100 |
% |
|
Mexico |
|
|
434 |
|
|
|
2024-2030 |
|
100 |
% |
|
Total |
|
$ |
74,433 |
|
|
|
|
|
|
|
Unrecognized Tax Positions
No amounts have been accrued for uncertain tax positions as of December 31, 2019 and 2018. However, management's conclusion regarding uncertain tax positions may be subject to review and adjustment at a later date based on ongoing analyses of tax laws, regulations, and interpretations thereof and other factors. The Company does not have any unrecognized tax benefits as of December 31, 2019 and 2018 and does not expect that the total amount of unrecognized tax benefits will materially change over the next twelve months. Additionally, no interest or penalty related to uncertain taxes has been recognized in the accompanying consolidated financial statements.
The Company is subject to taxation in US, Canada, Mexico and state jurisdictions. The Company’s tax returns are subject to examination by the applicable tax authorities prior to the expiration of statute of limitations for assessing additional taxes, which generally ranges from two to five years after the end of the applicable tax year. Therefore, as of December 31, 2019, tax years for 2013 through 2019 generally remain subject to examination by the tax authorities. In addition, in the case of certain tax jurisdictions in which the Company has loss carryforwards, the tax authority in some of these jurisdictions may examine the amount of the tax loss carryforward based on when the loss is utilized rather than when it arises.
104
14. Fair Value of Financial Instruments
The fair value of the financial assets and liabilities are included at the amount at which the instrument could be exchanged in a current transaction between willing parties, other than in a forced or liquidation sale.
The Company has assessed that the fair value of cash and cash equivalents, trade receivables, related party receivables, trade payables, other current liabilities, and other debt approximates their carrying amounts largely due to the short-term maturities or recent commencement of these instruments. The fair value of the ABL Revolver is primarily based upon observable market data, such as market interest rates, for similar debt. The fair value of the Notes is based upon observable market data. The fair value of notes due to and notes due from affiliates are based upon similarly publicly-traded instruments with a readily-available market value as a proxy.
The carrying amounts and fair values of financial assets and liabilities, which are either Level 1 or Level 2, are as follows:
|
|
|
December 31, 2019 |
|
December 31, 2018 |
||||||||
|
Financial Assets (Liabilities) Not Measured at Fair Value |
|
Carrying |
|
|
Fair Value |
|
Carrying |
|
Fair Value |
|||
|
ABL facilities (See Note 11) - Level 2 |
|
$ |
(80,000) |
|
$ |
(80,000) |
|
$ |
(20,550) |
|
$ |
(20,550) |
|
Senior Secured Notes (See Note 11) - Level 1 |
|
$ |
(323,258) |
|
$ |
(325,693) |
|
$ |
— |
|
$ |
— |
|
Notes due from affiliates (See Note 10) - Level 2 |
|
$ |
— |
|
$ |
— |
|
$ |
638 |
|
$ |
638 |
|
Notes due to affiliates (See Note 12) - Level 2 |
|
$ |
— |
|
$ |
— |
|
$ |
(108,047) |
|
$ |
(108,047) |
There were no transfers of financial instruments between the three levels of the fair value hierarchy during the years ended December 31, 2019 and 2018, respectively.
15. Business Restructuring
The Company incurred costs associated with restructuring plans designed to streamline operations and reduce costs of $0.2 million, $8.6 million and $2.2 million during the years ended December 31, 2019, 2018 and 2017, respectively. The following is a summary of the activity in our restructuring accruals:
|
|
|
Employee termination Costs |
|
Other restructuring costs |
|
Total restructuring costs |
|||
|
Balance at December 31, 2016 |
|
$ |
— |
|
$ |
— |
|
$ |
— |
|
Restructuring liability transfer from affiliate |
|
|
1,968 |
|
|
— |
|
|
1,968 |
|
Charges during the period |
|
|
1,368 |
|
|
812 |
|
|
2,180 |
|
Cash payments during the period |
|
|
(941) |
|
|
(812) |
|
|
(1,753) |
|
Balance at December 31, 2017 |
|
$ |
2,395 |
|
$ |
— |
|
$ |
2,395 |
|
Charges during the period |
|
|
8,593 |
|
|
— |
|
|
8,593 |
|
Cash payments during the period |
|
|
(9,526) |
|
|
— |
|
|
(9,526) |
|
Balance at December 31, 2018 |
|
$ |
1,462 |
|
$ |
— |
|
$ |
1,462 |
|
Charges during the period |
|
|
168 |
|
|
— |
|
|
168 |
|
Cash payments during the period |
|
|
(1,630) |
|
|
— |
|
|
(1,630) |
|
Balance at December 31, 2019 |
|
$ |
— |
|
$ |
— |
|
$ |
— |
Approximately $2.5 million of the above restructuring costs in 2017 (inclusive of the restructuring liability transfer from affiliate, which was recorded as a distribution to affiliate) and all of 2018 and 2019 restructuring costs relate to the closure of the Baltimore, MD corporate office for Target Parent which resulted in downsizing of corporate employees consisting of employee termination costs. As part of the corporate restructuring plans, certain employees were required to render future service in order to receive their termination benefits. The termination costs associated with these employees was recognized over the period from the date of communication to the employee to the actual date of termination. No further amounts are expected to be incurred in connection with this restructuring as of December 31, 2019.
105
These restructuring costs pertain to corporate locations and do not impact the segments discussed in Note 25.
One of the Company’s properties in North Dakota incurred flood damage in November of 2017. Specialty rental assets were written-down by $1.8 million as of December 31, 2017 related to the damaged portion of the property. During the year ended December 31, 2018, approximately $3.5 million in insurance proceeds were received. For the year ended December 31, 2018, the Company recognized a gain on involuntary conversion associated with this event in the amount of approximately $1.7 million which is recognized within other expense (income), net in the accompanying consolidated statement of comprehensive income.
17. Commitments and Contingencies
The Company is involved in various lawsuits or claims in the ordinary course of business. Management is of the opinion that there is no pending claim or lawsuit which, if adversely determined, would have a material impact on the financial condition of the Company
Commitments
The Company leases certain land, lodging units and real estate under non-cancellable operating leases, the terms of which vary and generally contain renewal options. Total rent expense under these leases is recognized ratably over the initial term of the lease. Any difference between the rent payment and the straight-line expense is recorded as a liability. Rent expense included in services costs in the consolidated statements of comprehensive income for cancelable and non-cancelable leases was $12.5 million, $4.7 million and $8.2 million for the years ended December 31, 2019, 2018 and 2017, respectively. Rent expense included in the selling, general, and administrative expenses in the consolidated statements of comprehensive income for cancelable and non-cancelable leases was $0.6 million, $0.6 million and $0.3 million for the years ended December 31, 2019, 2018 and 2017, respectively.
Future minimum lease payments at December 31, 2019, by year and in the aggregate, under non-cancelable operating leases are as follows:
|
2020 |
|
$ |
2,130 |
|
2021 |
|
|
1,758 |
|
2022 |
|
|
1,345 |
|
2023 |
|
|
1,052 |
|
2024 |
|
|
323 |
|
Total |
|
$ |
6,608 |
18. Rental Income
Certain arrangements contain a lease of lodging facilities (Lodges) to customers. During 2014, we entered into a lease for Lodges in Dilley, Texas. That lease was amended in 2016 and expires in 2021. During 2015, the Company entered into a lease for Lodges in Mentone, Texas. That lease was amended in 2018 and expires in 2022. During 2019, the Company entered into a lease agreement in Orla, Texas which expires in 2022. Additionally, the Company entered into a lease in Midland, Texas which expires in 2022. Rental income from these leases for 2019, 2018 and 2017 was $59.8 million, $53.7 million and $58.8 million, respectively. Each Lodge is leased exclusively to one customer and is accounted for as an operating lease under the authoritative guidance for leases. Revenue related to these lease arrangements is reflected as specialty rental income in the consolidated statements of comprehensive income.
106
Scheduled future minimum lease payments to be received by the Company as of December 31, 2019 for each of the next five years and thereafter is as follows:
|
2020 |
|
$ |
59,290 |
|
2021 |
|
|
51,299 |
|
2022 |
|
|
7,953 |
|
2023 |
|
|
— |
|
2024 |
|
|
— |
|
Total |
|
$ |
118,542 |
19. Related Parties
Target Parent had amounts due from affiliates in the amount of $0 million and $0.6 million as of December 31, 2019 and 2018, respectively. The $0.6 million note due from affiliate as of December 31, 2018 represents financing costs and bonus amounts paid by Target Parent on behalf of an affiliate during the fourth quarter of 2018.
Upon the consummation of the Business Combination, outstanding loans to officers were forgiven, which resulted in $1.6 million of additional expenses recognized in selling, general and administrative expenses on the consolidated statement of comprehensive income. These loans were provided as retention payments and were earned and forgiven over a four-year period and charged to compensation expense on a straight-line basis as amounts were forgiven. The amounts due as of December 31, 2019 and 2018, respectively, are included in the Notes due from officers in the consolidated balance sheets. Approximately $0.0 million and $0.5 million was loaned to officers during the years ended December 31, 2019 and 2018, respectively. During the years ended December 31, 2019 and 2018, approximately $0 and $1.0 million was paid, respectively. Compensation expense recognized for the years ended December 31, 2019, 2018, and 2017, totaled $1.6 million, $0.7 million, and $0.6 million, respectively, and are included in selling, general and administrative expense in the consolidated statements of comprehensive income.
The Company leased modular buildings from an ASG affiliate to serve one of its customers. The rent expense related to the leasing of the modular buildings amounted to $0.3 million, $0.3 million and $0.6 million for the years ended December 31, 2019, 2018 and 2017, respectively. In August 2018, Target Parent purchased some of the leased buildings for $1.6 million.
During the years ended December 31, 2019, 2018 and 2017, respectively, the Company incurred $0.8 million, $0.8 million and $0.9 million in commissions owed to related parties, included in selling, general and administrative expense in the accompanying consolidated statements of comprehensive income. At December 31, 2019 and December 31, 2018, respectively, the Company accrued $0.2 million and $0.2 million, respectively, for these commissions.
Prior to the closing of the Business Combination, Mr. Diarmuid Cummins (the “Advisor”) provided certain consulting and advisory services (the “Services”) to Target Parent and certain of its affiliated entities (collectively, “Algeco”), including Target. The Advisor was compensated for these Services by Algeco. Following the closing of the Business Combination, the Advisor continued to provide these Services to Algeco and to the Company and is serving as an observer on the board of directors of the Company. The Advisor is currently compensated for these services by Chard Camp Catering Services Ltd. (“Chard”), a wholly-owned subsidiary of the Company. In June 2019, Chard and Algeco Global Sarl (“Algeco Global”) entered into a reimbursement agreement, as amended in July 2019, (the “Agreement”), pursuant to which Algeco Global agreed to reimburse Chard for 100% of the total compensation paid by it to the Advisor, from and after January 1, 2019, with such amounts to be paid monthly. The initial term of the Agreement ran through December 31, 2019 and automatically extended for an additional 12 month term. The Company and Algeco Global are each majority owned by TDR Capital. This reimbursement for the year ended December 31, 2019 amounts to approximately $1.2 million and is included in the other expense (income), net line within the consolidated statement of comprehensive income while $0.9 million is recorded as a related party receivable on the consolidated balance sheet as of December 31, 2019.
In August 2018, Target Parent paid interest on behalf of ASG in the amount of $21 million. ASG subsequently paid Target Parent the amount in August 2018. These amounts have been captured as a distribution and contribution within the equity section of the consolidated balance sheet and the consolidated statement of changes in equity.
107
On September 6, 2018, Arrow entered into a related party note with AHS for $108 million as more fully discussed in Note 12.
Target Parent charged affiliates for services performed by its home office based on work performed for the benefit of the affiliate group. These amounts consist of primarily compensation and benefits plus a mark-up associated primarily with corporate employees providing accounting, treasury, and IT services delivered to the affiliate groups being charged. Such charges amounted to approximately $0, $5.3 million and $0 for the years ended December 31, 2019, 2018 and 2017, respectively, and are included in other expense (income), net in the accompanying consolidated statement of comprehensive income. This transaction between Target Parent and its affiliates has been treated as a distribution during 2018 within the consolidated statements of changes in equity.
As part of the financing arrangement between affiliates of ASG, during 2018, Target Parent was charged $1.9 million of financing costs related to the extinguished affiliate notes discussed in Note 12 by an affiliate of ASG, which was recognized in the interest expense (income), net line on the consolidated statements of comprehensive income for the year ended December 31, 2018. In addition, in relation to the refinancing of the ABL facility in 2018, $3.4 million of deferred financing costs were charged to Target Parent by an affiliate of ASG and capitalized by the Company on the consolidated balance sheets and amortized in the amount of $0.6 million in the interest expense (income), net line on the consolidated statements of comprehensive income for the year ended December 31, 2018. These transactions between Target Parent and its affiliates have been treated as contributions during 2018 within the consolidated statements of changes in equity
20. Earnings per Share
Basic earnings per share (“EPS”) is calculated by dividing net income or loss attributable to Target Hospitality by the weighted average number of shares of common stock outstanding during the period. Diluted EPS is computed similarly to basic net earnings per share, except that it includes the potential dilution that could occur if dilutive securities were exercised. The following table presents basic and diluted EPS for the periods indicated below ($ in thousands, except per share amounts):
|
|
|
For the Years Ended |
|||||||
|
|
|
December 31, |
|
December 31, |
|
December 31, |
|||
|
|
|
2019 |
|
2018 |
|
2017 |
|||
|
Numerator |
|
|
|
|
|
|
|
|
|
|
Net income attributable to Common Stockholders |
|
$ |
6,236 |
|
$ |
4,956 |
|
$ |
981 |
|
|
|
|
|
|
|
|
|
|
|
|
Denominator |
|
|
|
|
|
|
|
|
|
|
Weighted average shares outstanding - basic and diluted |
|
|
94,501,789 |
|
|
41,290,711 |
|
|
25,686,327 |
|
|
|
|
|
|
|
|
|
|
|
|
Net income per share - basic and diluted |
|
$ |
0.07 |
|
$ |
0.12 |
|
$ |
0.04 |
As discussed in Note 3, 5,015,898 shares of the 8,050,000 shares of common stock held by the Founders, were placed into escrow concurrent with the Business Combination. Upon being placed into escrow, the voting and economic rights of the shares were suspended for the period they are in escrow. Given that the Founders are not entitled to vote or participate in the economic rewards available to the other shareholders with respect to these shares, these shares are not included in the EPS calculations.
Warrants representing 16,166,650 shares of the Company’s common stock for the years ended December 31, 2019 were excluded from the computation of EPS because they are considered anti-dilutive as the exercise price exceeds the average market price of the common stock price during the applicable periods.
As discussed in Note 22, RSUs and stock options were outstanding for the years ended December 31, 2019, respectively. These RSUs and stock options were excluded from the computation of EPS because their effect would have been anti-dilutive.
As discussed in Note 21, the Company repurchased shares of its outstanding Common Stock. These shares of treasury stock have been excluded from the computation of EPS.
108
21. Stockholders’ Equity
Common Stock
As of December 31, 2019, Target Hospitality had 105,254,929 shares of Common Stock, par value $0.0001 per share issued and 100,840,162 outstanding. Each share of Common Stock has one vote, except the voting rights related to the 5,015,898 of Founder Shares placed in escrow have been suspended subject to release pursuant to the terms of the Earnout Agreement, as discussed in Note 3.
Preferred Shares
Target Hospitality is authorized to issue 1,000,000 preferred shares at $0.0001 par value. As of December 31, 2019, no preferred shares were issued and outstanding.
Warrants
On January 17, 2018, PEAC sold 32,500,000 units at a price of $10.00 per unit (the “Units”) in its initial public offering (the “Public Offering”), including the issuance of 2,500,000 Units as a result of the underwriters’ partial exercise of their overallotment option. Each Unit consisted of one Class A ordinary share of PEAC, par value $0.0001 per share (the “Public Shares”), and one-third of one warrant to purchase one ordinary share (the “Public Warrants”).
Each Public Warrant entitles the holder to purchase one share of the Company’s Common Stock at a price of $11.50 per share. No fractional shares will be issued upon exercise of the Public Warrants. If upon exercise of the Public Warrants, a holder would be entitled to receive a fractional interest in a share, the Company will upon exercise, round down to the nearest whole number, the number of shares to be issued to the Public Warrant holder. Each Public Warrant became exercisable 30 days after the completion of the Business Combination.
On January 17, 2018, Platinum Eagle Acquisition LLC, a Delaware limited liability company (the “Sponsor”), Harry E. Sloan, Joshua Kazam, Fredric D. Rosen, the Sara L. Rosen Trust and the Samuel N. Rosen 2015 Trust, purchased from PEAC an aggregate of 5,333,334 warrants at a price of $1.50 per warrant (for an aggregate purchase price of $8.0 million) in a private placement (the “Private Placement Warrants”) that occurred simultaneously with the completion of the Public Offering. Each Private Placement Warrant entitles the holder to purchase one share of common stock at $11.50 per share. The purchase price of the Private Placement Warrants was added to the proceeds from the Public Offering and was held in the Trust Account until the closing of the Business Combination. The Private Placement Warrants (including the shares of Common Stock issuable upon exercise of the Private Placement Warrants) were not transferable, assignable or salable until 30 days after the closing date of the Business Combination, and they are non-redeemable so long as they are held by the initial purchasers of the Private Placement Warrants or their permitted transferees. If the Private Placement Warrants are held by someone other than the initial purchasers of the Private Placement Warrants or their permitted transferees, the Private Placement Warrants will be redeemable by the Company and exercisable by such holders on the same basis as the Public Warrants (as defined above). Otherwise, the Private Placement Warrants have terms and provisions that are identical to those of the Public Warrants and have no net cash settlement provisions.
As of December 31, 2019, the Company had 16,166,650 warrants issued and outstanding with the same terms as described above.
Common Stock in Treasury
On August 15, 2019, the Company's board of directors approved the 2019 Share Repurchase Program (“2019 Plan”), authorizing the repurchase of up to $75.0 million of our Common Stock from August 30, 2019 to August 15, 2020. During the year ended December 31, 2019, the Company repurchased 4,414,767 shares of our Common Stock for an aggregated price of approximately $23.6 million. As of December 31, 2019, the 2019 Plan had a remaining capacity of approximately $51.4 million.
109
2018 and 2017 Equity
AHS and affiliates contributed $103.3 million of cash during 2018 to Arrow, which was used by Bidco to partially fund the acquisition of Signor discussed in Note 4. This contribution is reflected in the consolidated statement in changes in stockholders’ equity as a contribution. The sole member of Target Parent made a capital contribution of approximately $217 million in December of 2018, which was used to pay off the affiliate notes and related accrued interest discussed in Note 12. Additionally, during 2018, as discussed in Note 19, Target Parent was repaid amounts and incurred charges from affiliates amounting to approximately $26.3 million. Such amounts were treated as contributions to Target Parent. Also, during 2018, as discussed in Note 19, Target Parent recharged affiliates for certain services performed and also paid debt on behalf of affiliates, which were both treated as capital distributions and totaled approximately $26.3 million. Refer to table below for summary of activity within the equity of the Company for 2018 and 2017:
|
Capital contributions |
|
2018 |
|
2017 |
||
|
Contribution to Signor Parent |
|
$ |
103,338 |
|
$ |
— |
|
Contribution to Target Parent |
|
|
243,372 |
|
|
— |
|
Current taxes payable |
|
|
— |
|
|
2,835 |
|
Deferred taxes on intra-entity transfer |
|
|
— |
|
|
10,372 |
|
Corporate costs |
|
|
— |
|
|
1,020 |
|
Contribution of chard |
|
|
— |
|
|
4,116 |
|
Total capital contributions (a) |
|
$ |
346,710 |
|
$ |
18,343 |
|
|
|
|
|
|
|
|
|
Distribution to affiliate |
|
|
(26,738) |
|
|
(23,561) |
|
Forgiveness of related party receivables and payables, net |
|
|
— |
|
|
(171,747) |
|
Liability transfer from affiliate, net |
|
|
— |
|
|
(9,257) |
|
Net contribution (distributions) to affiliates |
|
$ |
319,972 |
|
$ |
(186,222) |
|
|
|
|
|
|
|
|
|
(a) Total capital contributions in 2017 are non-cash financing activities |
|
|
|
|
|
|
|
|
|
|
|
|
|
|
|
|
|
2018 |
|
2017 |
||
|
Capital Contributions |
|
|
|
|
|
|
|
Capital contributions from affiliates |
|
$ |
— |
|
$ |
125,593 |
|
Total capital contributions |
|
$ |
— |
|
$ |
125,593 |
|
|
|
|
|
|
|
|
|
Affiliate note payable incurred for Target Acquisition |
|
|
— |
|
|
(221,000) |
|
Cash paid for acquisition of Target |
|
|
— |
|
|
(5,640) |
|
Net distributions upon Restructuring |
|
$ |
— |
|
$ |
(101,047) |
As discussed in Note 1, during 2017, the Company offset and extinguished notes with affiliates in a restructuring transaction under common control. Additionally, as part of the Restructuring, an affiliate note payable was incurred and cash was paid to an affiliate as part of the acquisition of net assets of Target and transaction costs were paid by the Company on behalf of its affiliates, which is reflected in the above schedules as reductions of equity. The acquisition price paid by Target Parent for Target was approximately $226.6 million in the form of cash of approximately $5.6 million (reported as a distribution to affiliate in the above table) and debt of $221 million (reported as an affiliate note payable in the above table).
The amount paid by Target Parent exceeded the carrying amount of the net assets of Target by approximately $60.7 million. However, for accounting purposes, as Target Parent was not formed until September 2017, Target is treated as a predecessor and therefore this transaction was reflected as the receipt by Target of the net assets of Target Parent.
110
22. Stock-Based Compensation
On March 15, 2019, in connection with the Business Combination, the Company’s board of directors approved the adoption of the Target Hospitality Corp. 2019 Incentive Award Plan (the “Plan”), under which 4,000,000 of the Company’s shares of Common Stock were reserved for issuance pursuant to future grants of share awards. The expiration date of the Plan, on and after which date no awards may be granted, is March 15, 2029.
Restricted Stock Units
On May 21, 2019, the Compensation Committee granted time-based RSUs to certain of the Company’s executive officers, other employees, and directors. Each RSU represents a contingent right to receive, upon vesting, one share of the Company’s Common Stock or its cash equivalent, as determined by the Company. The number of RSUs granted to certain named executive officers and certain other employees totaled 212,621. These RSU awards granted vest in four equal installments on each of the first four anniversaries of the grant date, on May 21, 2020, 2021, 2022, and 2023. On September 3, 2019, our recently appointed Chief Financial Officer received a grant of 81,434 RSUs and 48,860 RSUs, which vest on March 15, 2020 and on each of the first four anniversaries of the grant date, respectively. The number of RSUs granted to non-executive directors of the board amounted to 81,967 and were also granted on May 21, 2019. The RSU awards granted to non-executive directors of the board vest over one year on the anniversary of the date of grant or the date of the first annual meeting of the stockholders following the grant date, whichever is sooner.
Additionally, on May 21, 2019, the Compensation Committee approved the election by Mr. Archer, the CEO, pursuant to his employment agreement dated January 29, 2019, to receive his annual base salary for the period July 1, 2019 to December 31, 2019 in the form of 30,000 RSUs. These RSUs vested in six equal installments on the first of each month, beginning on July 1, 2019 through December 1, 2019.
During the years ended December 31, 2019, certain of the Company's employees surrendered RSUs owned by them to satisfy their statutory minimum federal and state tax obligations associated with the vesting of RSUs issued under the Plan.
The table below represents the changes in RSUs for the year ended December 31, 2019:
|
|
|
|
Number of |
|
|
Weighted |
|
Balance at December 31, 2018 |
|
|
— |
|
$ |
— |
|
Granted |
|
|
454,882 |
|
|
9.49 |
|
Vested and released |
|
|
(35,771) |
|
|
10.83 |
|
Forfeited |
|
|
(17,314) |
|
|
10.83 |
|
Balance at December 31, 2019 |
|
|
401,797 |
|
$ |
9.31 |
Stock-based compensation expense for these RSUs recognized in selling, general and administrative expense in the consolidated statement of comprehensive income for the year ended December 31, 2019 was approximately $1.5 million, with an associated tax benefit of less than $0.4 million. At December 31, 2019, unrecognized compensation expense related to RSUs totaled $2.6 million and is expected to be recognized over a remaining term of approximately 2.81 years.
Stock Option Awards
On May 21, 2019, the Compensation Committee granted 482,792 time-based stock option awards to certain employees. On September 3, 2019 the Compensation Committee made an additional grant of 171,429 time-based stock options to our newly appointed Chief Financial Officer. Each option represents the right upon vesting, to buy one share of the Company’s common stock, par value $0.0001 per share, for $6.14 to $10.83 per share. The stock options vest in four equal installments on each of the first four anniversaries of the grant date and expire ten years from the grant date.
111
The following table presents the changes in stock options outstanding and related information for our employees during year ended December 31, 2019:
|
|
|
|
Options |
|
|
Weighted Average |
|
Weighted Average |
|
|
Intrinsic Value |
|
Outstanding Options at December 31, 2018 |
|
|
- |
|
$ |
- |
|
- |
|
$ |
- |
|
Granted |
|
|
654,221 |
|
|
9.60 |
|
- |
|
|
- |
|
Vested and expired |
|
|
(18,712) |
|
|
10.83 |
|
- |
|
|
- |
|
Forfeited |
|
|
(56,139) |
|
|
10.83 |
|
- |
|
|
- |
|
Outstanding Options at December 31, 2019 |
|
|
579,370 |
|
$ |
9.44 |
|
9.48 |
|
$ |
- |
18,712 stock options were exercisable and expired at December 31, 2019 in connection with our former Chief Financial Officer’s separation of service.
Stock-based compensation expense for these stock option awards recognized in selling, general and administrative expense in the consolidated statement of comprehensive income for the year ended December 31, 2019 was approximately $0.2 million with an associated tax benefit of less than $0.1 million. At December 31, 2019, unrecognized compensation expense related to stock options totaled $1.5 million and is expected to be recognized over a remaining term of approximately 3.4 years.
The fair value of each option award at the grant date was estimated using the Black-Scholes option-pricing model with the following assumptions:
|
|
|
Assumptions |
|
Weighted average expected stock volatility |
% |
25.94 |
|
Expected dividend yield |
% |
0.00 |
|
Expected term (years) |
|
6.25 |
|
Risk-free interest rate (range) |
% |
1.38 - 2.26 |
|
Exercise price (range) |
$ |
6.14 - 10.83 |
|
Weighted-average grant date fair value |
$ |
2.92 |
The volatility assumption used in the Black-Scholes option-pricing model is based on peer group volatility as the Company does not have a sufficient trading history as a stand-alone public company to calculate volatility. Additionally, due to an insufficient history with respect to stock option activity and post vesting cancellations, the expected term assumption is based on the simplified method permitted under SEC rules, whereby, the simple average of the vesting period for each tranche of award and its contractual term is aggregated to arrive at a weighted average expected term for the award. The risk-free interest rate used in the Black-Scholes model is based on the implied US Treasury bill yield curve at the date of grant with a remaining term equal to the Company’s expected term assumption. The Company has never declared or paid a dividend on its shares of common stock.
Stock-based payments are subject to service based vesting requirements and expense is recognized on a straight-line basis over the vesting period. Forfeitures are accounted for as they occur. 56,139 stock options were forfeited during year ended December 31, 2019 in connection with the separation of our former Chief Financial Officer.
23. Retirement Plans
We offer a defined contribution 401(k) retirement plan to substantially all of our U.S. employees. Participants may contribute from 1% to 90% of eligible compensation, inclusive of pretax and / or Roth deferrals (subject to Internal Revenue Service limitations), and we make matching contributions under this plan on the first 6% of the participant’s compensation (100% match of the first 3% employee contribution and 50% match on the next 3% contribution). Our matching contributions vest at a rate of 20% per year for each of the employee’s first five years of service and then are fully vested thereafter. We recognized expense of $0.8 million, $0.5 million and $0 related to
112
matching contributions under our various defined contribution plans during the years ended December 31, 2019, 2018 and 2017, respectively.
24. Quarterly Financial Data (Unaudited)
The following tables present certain unaudited consolidated quarterly financial information for each of the four quarters in the years ended December 31, 2019 and 2018. This quarterly information has been prepared on the same basis as the consolidated financial statements and includes all adjustments necessary to state fairly the information for the periods presented, which management considers necessary for a fair presentation when read in conjunction with the consolidated financial statements and notes. We believe these comparisons of consolidated quarterly selected financial data are not necessarily indicative of future performance.
|
|
|
Quarter Ended ($ in thousands, except per share amounts) |
||||||||||
|
2019 |
|
March 31, |
|
June 30, |
|
September 30, |
|
December 31, |
||||
|
Total Revenue |
|
$ |
81,982 |
|
$ |
81,358 |
|
$ |
81,643 |
|
$ |
76,113 |
|
Gross Profit |
|
$ |
37,754 |
|
$ |
39,172 |
|
$ |
38,556 |
|
$ |
31,531 |
|
Operating Income (loss) (a) |
|
$ |
(10,891) |
|
$ |
24,554 |
|
$ |
23,031 |
|
$ |
11,457 |
|
Net Income (loss) (a) |
|
$ |
(13,979) |
|
$ |
10,580 |
|
$ |
9,569 |
|
$ |
66 |
|
Weighted average number of shares outstanding - basic and diluted |
|
|
79,589,905 |
|
|
100,217,035 |
|
|
100,102,641 |
|
|
97,835,525 |
|
Net Income (loss) per share - basic and diluted |
|
$ |
(0.18) |
|
$ |
0.11 |
|
$ |
0.10 |
|
$ |
0.00 |
|
|
|
|
|
|
|
|
|
|
|
|
|
|
|
|
|
Quarter Ended ($ in thousands, except per share amounts) |
||||||||||
|
2018 |
|
March 31, |
|
June 30, |
|
September 30, |
|
December 31, |
||||
|
Total Revenue |
|
$ |
38,646 |
|
$ |
45,476 |
|
$ |
60,326 |
|
$ |
96,152 |
|
Gross Profit (b) |
|
$ |
16,103 |
|
$ |
21,742 |
|
$ |
26,354 |
|
$ |
26,035 |
|
Operating Income (loss) (b) |
|
$ |
(1,175) |
|
$ |
11,921 |
|
$ |
7,935 |
|
$ |
22,228 |
|
Net Income (loss) (b) |
|
$ |
(4,194) |
|
$ |
4,424 |
|
$ |
849 |
|
$ |
3,877 |
|
Weighted average number of shares outstanding - basic and diluted |
|
|
25,686,327 |
|
|
25,686,327 |
|
|
38,495,023 |
|
|
74,786,327 |
|
Net Income (loss) per share - basic and diluted |
|
$ |
(0.16) |
|
$ |
0.17 |
|
$ |
0.02 |
|
$ |
0.05 |
|
(a) |
As discussed in Note 3, the Company recognized approximately $38.1 million of expenses in connection with the Business Combination during the first quarter of 2019. Additionally, as discussed in Note 6, the Company recognized a loss on the sale of other property, plant and equipment of approximately $6.9 million during the fourth quarter of 2019. |
|
(b) |
As discussed in Note 7, the Company recognized an asset impairment charge of $15.3 million during the fourth quarter of 2018. |
25. Business Segments
The Company is organized primarily on the basis of geographic region, customer industry group and operates primarily in three reportable segments. These reportable segments are also operating segments. Resources are allocated, and performance is assessed by our CEO, whom we have determined to be our Chief Operating Decision Maker (CODM).
Our remaining operating segments have been consolidated and included in an “All Other” category.
The following is a brief description of our reportable segments and a description of business activities conducted by All Other.
Permian Basin — Segment operations consist primarily of specialty rental and vertically integrated hospitality services revenue from customers in the oil and gas industry located primarily in Texas and New Mexico.
113
Bakken Basin — Segment operations consist primarily of specialty rental and vertically integrated hospitality services revenue from customers in the oil and gas industry located primarily in North Dakota.
Government — Segment operations consist primarily of specialty rental and vertically integrated hospitality services revenue from Government customers located in Texas.
All Other — Segment operations consist primarily of revenue from the construction phase of the contract with TCPL discussed in Note 1 as well as specialty rental and vertically integrated hospitality services revenue from customers in the Oil and Gas industry located outside of the Permian and Bakken Basins.
The accounting policies of the segments are the same as those described in the “Summary of Significant Accounting Policies” for the Company. The Company evaluates performance of their segments and allocates resources to them based on revenue and adjusted gross profit. Adjusted gross profit for the CODM’s analysis includes the services and specialty rental costs in the financial statements and excludes depreciation and loss on impairment.
The table below presents information about reported segments for the years ended December 31:
2019
|
|
|
Permian Basin |
|
Bakken Basin |
|
Government |
|
All Other |
|
Total |
|||||
|
Revenue |
|
$ |
214,464 |
|
$ |
20,620 |
|
$ |
66,972 |
|
$ |
19,040 |
(a) |
$ |
321,096 |
|
Adjusted gross profit |
|
$ |
128,424 |
|
$ |
8,511 |
|
$ |
49,203 |
|
$ |
4,296 |
|
$ |
190,434 |
|
Capital expenditures |
|
$ |
82,371 |
|
$ |
190 |
|
$ |
305 |
|
$ |
3,039 |
|
|
|
|
Total Assets |
|
$ |
305,701 |
|
$ |
59,134 |
|
$ |
35,484 |
|
$ |
5,955 |
|
$ |
406,274 |
|
|
|
|
|
|
|
|
|
|
|
|
|
|
|
|
|
2018
|
|
|
Permian Basin |
|
Bakken Basin |
|
Government |
|
All Other |
|
Total |
|||||
|
Revenue |
|
$ |
120,590 |
|
$ |
25,813 |
|
$ |
66,676 |
|
$ |
27,521 |
(a) |
$ |
240,600 |
|
Adjusted gross profit |
|
$ |
73,795 |
|
$ |
10,554 |
|
$ |
47,437 |
|
$ |
5,378 |
|
$ |
137,164 |
|
Capital expenditures |
|
$ |
68,724 |
|
$ |
6,375 |
|
$ |
5,068 |
|
$ |
1,388 |
|
|
|
|
Total Assets |
|
$ |
234,368 |
|
$ |
64,770 |
|
$ |
43,994 |
|
$ |
3,489 |
|
$ |
346,621 |
|
|
|
|
|
|
|
|
|
|
|
|
|
|
|
|
|
2017
|
|
|
Permian Basin |
|
Bakken Basin |
|
Government |
|
All Other |
|
Total |
|||||
|
Revenue |
|
$ |
41,439 |
|
$ |
22,351 |
|
$ |
66,722 |
|
$ |
3,723 |
(a) |
$ |
134,235 |
|
Adjusted gross profit |
|
$ |
18,175 |
|
$ |
9,333 |
|
$ |
48,613 |
|
$ |
1,389 |
|
$ |
77,510 |
|
Capital expenditures |
|
$ |
17,808 |
|
$ |
460 |
|
$ |
84 |
|
$ |
— |
|
|
|
(a)Revenues from segments below the quantitative thresholds are attributable to three operating segments of the Company and are reported in the “All Other” category previously described.
114
A reconciliation of total segment adjusted gross profit to total consolidated income before income taxes for years ended December 31, 2019, 2018 and 2017, respectively, is as follows:
|
|
|
December 31, 2019 |
|
December 31, 2018 |
|
December 31, 2017 |
|||
|
Total reportable segment adjusted gross profit |
|
$ |
186,138 |
|
$ |
131,786 |
|
$ |
76,121 |
|
Other adjusted gross profit |
|
|
4,296 |
|
|
5,378 |
|
|
1,389 |
|
Loss on impairment |
|
|
— |
|
|
(15,320) |
|
|
— |
|
Depreciation and amortization |
|
|
(58,902) |
|
|
(39,128) |
|
|
(30,145) |
|
Selling, general, and administrative expenses |
|
|
(76,464) |
|
|
(41,340) |
|
|
(24,337) |
|
Restructuring costs |
|
|
(168) |
|
|
(8,593) |
|
|
(2,180) |
|
Other (income) expense, net |
|
|
(6,872) |
|
|
8,275 |
|
|
519 |
|
Currency (gains) losses, net |
|
|
123 |
|
|
(149) |
|
|
91 |
|
Loss on extinguishment of debt |
|
|
(907) |
|
|
— |
|
|
— |
|
Interest (expense) income, net |
|
|
(33,401) |
|
|
(24,198) |
|
|
5,107 |
|
Consolidated income before income taxes |
|
$ |
13,843 |
|
$ |
16,711 |
|
$ |
26,565 |
A reconciliation of total segment assets to total consolidated assets as of December 31, 2019 and 2018, respectively, is as follows:
|
|
|
2019 |
|
2018 |
||
|
Total reportable segment assets |
|
$ |
400,319 |
|
$ |
343,132 |
|
Other assets |
|
|
5,955 |
|
|
3,489 |
|
Restricted cash |
|
|
52 |
|
|
257 |
|
Other unallocated amounts |
|
|
194,466 |
|
|
218,154 |
|
Total Assets |
|
$ |
600,792 |
|
$ |
565,032 |
Other unallocated assets are not included in the measure of segment assets provided to or reviewed by the CODM for assessing performance and allocating resources, and as such, are not allocated. Other unallocated assets consist of the following as reported in the consolidated balance sheets of the Company as of the dates indicated below:
|
|
|
December 31, |
|
December 31, |
||
|
|
|
2019 |
|
2018 |
||
|
Total current assets |
|
$ |
60,795 |
|
$ |
74,986 |
|
Other intangible assets, net |
|
|
117,866 |
|
|
127,383 |
|
Deferred tax asset |
|
|
6,427 |
|
|
12,420 |
|
Deferred financing costs revolver, net |
|
|
4,688 |
|
|
2,865 |
|
Notes due from officers |
|
|
— |
|
|
500 |
|
Other non-current assets |
|
|
4,690 |
|
|
— |
|
Total other unallocated amounts of assets |
|
$ |
194,466 |
|
$ |
218,154 |
Revenues from the Company’s Government segment are from one customer and represent approximately $67.0 million, $66.7 million, and $66.7 million of the Company’s consolidated revenues for the years ended December 31, 2019, 2018, and 2017, respectively.
Revenues from one customer of the Company’s Permian Basin segment represented approximately $15.5 million of the Company’s consolidated revenues for the year ended December 31, 2017. There were no single customers from the Permian Basin segment for the year ended December 31, 2018 that represented 10% or more of the Company’s consolidated revenues. Revenues from one customer of the Company’s Permian Basin segment represented approximately $40 million of the Company’s consolidated revenues for the year ended December 31, 2019. There were no transactions between reportable operating segments for the years ended December 31, 2019, 2018, and 2017, respectively.
115
Item 9. Changes in and Disagreements with Accountants on Accounting and Financial Disclosure
There were no changes in or disagreements on any matters of accounting principles or financial statement disclosure between us and our independent auditors during our two most recent fiscal years or any subsequent interim period.
Item 9A. Controls and Procedures
Disclosure controls and procedures are controls and other procedures that are designed to ensure that information required to be disclosed in our reports filed or submitted under the Exchange Act is recorded, processed, summarized and reported within the time periods specified in the SEC’s rules and forms. Disclosure controls and procedures include, without limitation, controls and procedures designed to ensure that information required to be disclosed in Company reports filed or submitted under the Exchange Act is accumulated and communicated to management, including our Chief Executive Officer and Chief Financial Officer, to allow timely decisions regarding required disclosure.
As required by Rules 13a-15 and 15d-15 under the Exchange Act, our Chief Executive Officer and Chief Financial Officer carried out an evaluation of the effectiveness of the design and operation of our disclosure controls and procedures as of December 31, 2019. Based upon their evaluation, our Chief Executive Officer and Chief Financial Officer concluded that our disclosure controls and procedures (as defined in Rules 13a- 15 (e) and 15d-15 (e) under the Exchange Act) were effective as of December 31, 2019.
Changes in Internal Control over Financial Reporting
On March 15, 2019, in connection with the closing of the Business Combination, the Board approved and adopted a Code of Ethics for the Chief Executive Officer and Senior Financial Officers (the “Code of Ethics”). The Code of Ethics applies to the Company’s chief executive officer, principal financial officer, principal accounting officer, and controller (each, a “Covered Officer”). In addition to other policies and procedures adopted by the Company, the Covered Officers are subject to the Company’s Code of Business Conduct and Ethics (“Code of Conduct”) that applies to all officers, directors and employees of the Company and its subsidiaries. These replaced the Code of Ethics adopted by PEAC in connection with its initial public offering in January 2018.
The Code of Ethics reflects (among other matters) amendments, clarifications, revisions and updates in relation to (i) the general principles and standards of ethical conduct of the Covered Officers designed to deter wrongdoing, (ii) the responsibility of the Covered Officers regarding public disclosure of the Company’s public communications, including, but not limited to, the full, fair, accurate, timely and understandable disclosure in reports and documents filed with or submitted to the SEC, (iii) the Covered Officers’ internal control over financial reporting and record keeping, (iv) internal procedures for the reporting of violations of the Code of Ethics, and (v) requests for waivers and amendments of the Code of Ethics. The amendments, clarifications, revisions and updates reflected in the Code of Ethics did not relate to or result in any waiver, explicit or implicit, of any provision of the PEAC Code of Ethics.
As discussed elsewhere in this Annual Report on Form 10-K, on March 15, 2019, we completed the Business Combination and were engaged in the process of the design and implementation of our internal control over financial reporting in a manner commensurate with the scale of our operations post-Business Combination.
Management’s Annual Report on Internal Control over Financial Reporting
Our management is responsible for establishing and maintaining adequate internal control over financial reporting as defined in Rules 13a-15(f) and 15d-15(f) under the Exchange Act. Our internal control over financial reporting is a process designed to provide reasonable assurance regarding the reliability of financial reporting and the preparation of consolidated financial statements for external purposes in accordance with GAAP. Our internal control over financial reporting includes those policies and procedures that (i) pertain to the maintenance of records that, in reasonable detail, accurately and fairly reflect the transactions and dispositions of our assets; (ii) provide reasonable assurance that transactions are recorded as
116
necessary to permit preparation of financial statements in accordance with GAAP, and that our receipts and expenditures are being made only in accordance with authorizations of management and our directors, and (iii) provide reasonable assurance regarding prevention or timely detection of unauthorized acquisition, use or disposition of our assets that could have a material effect on the consolidated financial statements.
Because of its inherent limitations, internal control over financial reporting may not prevent or detect misstatements. Also, projections of any evaluation of effectiveness to future periods are subject to the risk that controls may become inadequate because of changes in conditions, or that the degree of compliance with the policies or procedures may deteriorate. Accordingly, even effective internal control over financial reporting can only provide reasonable assurance of achieving their control objectives.
Under the supervision and with the participation of our management, including our Chief Executive Officer and Chief Financial Officer, an assessment of the effectiveness of our internal control over financial reporting as of December 31, 2019 was conducted. In making this assessment, management used the criteria set forth by the Committee of Sponsoring Organizations of the Treadway Commission (COSO) in Internal Control–Integrated Framework (2013 Framework). Based on our assessment we believe that, as of December 31, 2019, our internal control over financial reporting is effective based on those criteria.
Defaults upon Senior Securities
None
117
Item 10. Directors, Executives, Officers and Corporate Governance
The information required by Item 10 hereby is incorporated by reference to such information as set forth in the Company's Definitive Proxy Statement for the 2020 Annual Meeting of Stockholders. The Board of Directors of the Company (the “Board”) has documented its governance practices by adopting several corporate governance policies. These governance policies, including the Company's Corporate Governance Guidelines, Corporate Code of Business Conduct and Ethics and Financial Code of Ethics for Senior Officers, as well as the charters for the committees of the Board (Audit Committee, Compensation Committee, and Nominating and Corporate Governance Committee) may also be viewed at the Company's website. The Code of Ethics for the Chief Executive Officer and Senior Financial Officers applies to our principal executive officer, principal financial officer, principal accounting officer and certain other senior officers. We intend to disclose any amendments to or waivers from our Code of Ethics for the Chief Executive Officer and Senior Financial Officers by posting such information on our website at www.targethospitality.com,within four business days following the date of the amendment or waiver. Copies of such documents will be sent to shareholders free of charge upon written request to the corporate secretary at the address shown on the cover page of this report.
Item 11. Executive Compensation
The information required by Item 11 hereby is incorporated by reference to such information as set forth in the Company's Definitive Proxy Statement for the 2020 Annual Meeting of Stockholders under the headings “Executive Compensation,” “Director Compensation,” and “Compensation Committee Interlocks and Insider Participation.”
Item 12. Security Ownership of Certain Beneficial Owners and Management Related Shareholder Matters
The information required by Item 12 hereby is incorporated by reference to such information as set forth in the Company's Definitive Proxy Statement for the 2020 Annual Meeting of Stockholders under the heading “Security Ownership of Certain Beneficial Owners and Management”.
Item 13. Certain Relationships and Related Transactions, and Director Independence
The information required by Item 13 hereby is incorporated by reference to such information as set forth in the Company's Definitive Proxy Statement for the 2020 Annual Meeting of Stockholders under the headings “Certain Relationships and Related Party Transactions” and “Director Independence”.
Item 14. Principal Accounting Fees and Services
The information required by Item 14 hereby is incorporated by reference to such information as set forth in the Company's Definitive Proxy Statement for the 2020 Annual General Meeting of Shareholders under the heading “Audit Fee Disclosure”.
118
|
Exhibit No. |
|
Exhibit Description |
|
|
|
|
|
2.1 |
|
|
|
|
|
|
|
2.2 |
|
|
|
|
|
|
|
2.3 |
|
|
|
|
|
|
|
2.4 |
|
|
|
|
|
|
|
2.5 |
|
|
|
|
|
|
|
3.1 |
|
|
|
|
|
|
|
3.2 |
|
|
|
|
|
|
|
4.1 |
|
|
|
|
|
|
|
4.2 |
|
|
|
|
|
|
|
4.3 |
|
119
|
|
|
|
|
4.4 |
|
|
|
|
|
|
|
4.5 |
|
|
|
|
|
|
|
4.6* |
|
|
|
|
|
|
|
10.1 |
|
|
|
|
|
|
|
10.2 |
|
|
|
|
|
|
|
10.3 |
|
|
|
|
|
|
|
10.4 |
|
|
|
|
|
|
|
10.5 |
|
|
|
|
|
|
|
10.6 |
|
|
|
|
|
|
|
10.7 |
|
|
|
|
|
|
|
10.8 |
|
|
|
|
|
|
|
10.9 |
|
|
|
|
|
|
120
|
10.10 |
|
|
|
|
|
|
|
10.11 |
|
|
|
|
|
|
|
10.12 |
|
|
|
|
|
|
|
10.13 |
|
|
|
|
|
|
|
10.14 |
|
|
|
|
|
|
|
10.15 |
|
|
|
|
|
|
|
10.16 |
|
|
|
|
|
|
|
10.17+ |
|
|
|
|
|
|
|
10.18+ |
|
|
|
|
|
|
|
10.19+ |
|
|
|
|
|
|
|
10.20+ |
|
|
|
|
|
|
|
10.21*+ |
|
Amendment No. 1 to Employment Agreement with Heidi D. Lewis.
|
|
|
|
|
|
10.22+ |
|
|
|
|
|
|
121
|
10.23+ |
|
|
|
|
|
|
|
10.24+ |
|
|
|
|
|
|
|
10.25+ |
|
|
|
|
|
|
|
10.26+ |
|
|
|
|
|
|
|
10.27+ |
|
|
|
|
|
|
|
10.28+ |
|
|
|
|
|
|
|
10.29+ |
|
|
|
|
|
|
|
10.30+ |
|
|
|
|
|
|
|
10.31+ |
|
|
|
|
|
|
|
14.1 |
|
|
|
|
|
|
|
16.1 |
|
|
|
|
|
|
|
21.1 |
|
|
|
|
|
|
|
23.1* |
|
|
|
|
|
|
|
31.1* |
|
|
|
|
|
|
122
|
31.2* |
|
|
|
|
|
|
|
32.1** |
|
|
|
|
|
|
|
32.2** |
|
|
|
|
|
|
|
101.INS |
|
XBRL Instance Document |
|
|
|
|
|
101.SCH |
|
XBRL Taxonomy Extension Schema Document |
|
|
|
|
|
101.CAL |
|
XBRL Taxonomy Extension Calculation Linkbase Document |
|
|
|
|
|
101.DEF |
|
XBRL Taxonomy Extension Definition Linkbase Document |
|
|
|
|
|
101.LAB |
|
XBRL Taxonomy Extension Label Linkbask Document |
|
|
|
|
|
101.PRE |
|
XBRL Taxonomy Extension Presentation Linkbase Document |
-----------------
* Filed herewith
** The certifications furnished in Exhibit 32.1 and 32.2 hereto are deemed to accompany this Quarterly Report on Form 10-Q and will not be deemed “filed” for purposes of Section 18 of the Securities Exchange Act of 1934, as amended, except to the extent that the registrant specifically incorporates it by reference.
+ Management contract or compensatory plan or arrangement
123
Pursuant to the requirements of the Section 13 or Section 15(d) of the Securities Exchange Act of 1934, as amended, the registrant has duly caused this report to be signed on its behalf by the undersigned thereunto duly authorized.
|
|
Target Hospitality Corp. |
|
|
|
|
|
|
Dated: |
By: |
/s/ James B. Archer |
|
|
|
Name: James B. Archer |
|
|
|
Title: President & Chief Executive Officer |
|
Signature |
|
Title: |
|
Date: |
|
|
|
|
|
|
|
/s/ James B. Archer |
|
Director, President and Chief Executive Officer (Principal Executive Officer) |
|
March 12, 2020 |
|
James B. Archer |
|
|
|
|
|
|
|
|
|
|
|
/s/ Eric T. Kalamaras |
|
Chief Financial Officer (Principal Financial Officer) |
|
March 12, 2020 |
|
Eric T. Kalamaras |
|
|
|
|
|
|
|
|
|
|
|
/s/ Jason P. Vlacich |
|
Chief Accounting Officer (Principal Accounting Officer) |
|
March 12, 2020 |
|
Jason P. Vlacich |
|
|
|
|
|
|
|
|
|
|
|
/s/ Stephen Robertson |
|
Chairman of the Board |
|
March 12, 2020 |
|
Stephen Robertson |
|
|
|
|
|
|
|
|
|
|
|
/s/ Gary Lindsay |
|
Director |
|
March 12, 2020 |
|
Gary Lindsay |
|
|
|
|
|
|
|
|
|
|
|
/s/ Andrew P. Studdert |
|
Director |
|
March 12, 2020 |
|
Andrew P. Studdert |
|
|
|
|
|
|
|
|
|
|
|
/s/ Jeff Sagansky |
|
Director |
|
March 12, 2020 |
|
Jeff Sagansky |
|
|
|
|
|
|
|
|
|
|
|
/s/ Eli Baker |
|
Director |
|
March 12, 2020 |
|
Eli Baker |
|
|
|
|
|
|
|
|
|
|
|
/s/ Martin Jimmerson |
|
Director |
|
March 12, 2020 |
|
Martin L. Jimmerson |
|
|
|
|
|
|
|
|
|
|
124