Attached files
| file | filename |
|---|---|
| EX-32.2 - EX-32.2 - GTY Technology Holdings Inc. | gtyh-20191231ex32212084c.htm |
| EX-32.1 - EX-32.1 - GTY Technology Holdings Inc. | gtyh-20191231ex321fe3067.htm |
| EX-31.2 - EX-31.2 - GTY Technology Holdings Inc. | gtyh-20191231ex3122be392.htm |
| EX-31.1 - EX-31.1 - GTY Technology Holdings Inc. | gtyh-20191231ex311be5ba6.htm |
| EX-10.11 - EX-10.11 - GTY Technology Holdings Inc. | gtyh-20191231ex10114a1d3.htm |
| EX-4.5 - EX-4.5 - GTY Technology Holdings Inc. | gtyh-20191231ex45c8c127d.htm |
UNITED STATES
SECURITIES AND EXCHANGE COMMISSION
Washington, D.C. 20549
FORM 10-K
(Mark One)
☒ANNUAL REPORT PURSUANT TO SECTION 13 OR 15(d) OF THE SECURITIES EXCHANGE ACT OF 1934
For the fiscal year ended December 31, 2019
OR
☐TRANSITION REPORT PURSUANT TO SECTION 13 OR 15(d) OF THE SECURITIES EXCHANGE ACT OF 1934
For the transition period from to
Commission File Number 001‑37931
GTY Technology Holdings Inc.
(Exact name of Registrant as specified in its Charter)
|
Massachusetts |
|
83‑2860149 |
|
(State or other jurisdiction of incorporation or organization) |
|
(I.R.S. Employer Identification No.) |
|
|
|
|
|
1180 North Town Center Drive, Suite 100 Las Vegas, Nevada |
|
89144 |
|
(Address of principal executive offices) |
|
(Zip Code) |
Registrant's telephone number, including area code: (702) 945‑2898
Securities registered pursuant to Section 12(b) of the Act:
|
Title of each class |
|
Symbol |
|
Name of each exchange on which registered |
|
Common Stock, par value $0.0001 per share |
|
GTYH |
|
Nasdaq Stock Market LLC |
|
|
|
|
|
|
Securities registered pursuant to Section 12(g) of the Act:
None
Indicate by check mark if the Registrant is a well-known seasoned issuer, as defined in Rule 405 of the Securities Act. Yes ◻ No ☒
Indicate by check mark if the Registrant is not required to file reports pursuant to Section 13 or 15(d) of the Act. Yes ◻ No ☒
Indicate by check mark whether the Registrant: (1) has filed all reports required to be filed by Section 13 or 15(d) of the Securities Exchange Act of 1934 during the preceding 12 months (or for such shorter period that the Registrant was required to file such reports), and (2) has been subject to such filing requirements for the past 90 days. Yes ☒ No
Indicate by check mark whether the registrant has submitted electronically every Interactive Data File required to be submitted pursuant to Rule 405 of Regulation S-T (§232.405 of this chapter) during the preceding 12 months (or for such shorter period that the registrant was required to submit such files). Yes ◻ No ☒
Indicate by check mark whether the registrant is a large accelerated filer, an accelerated filer, a non-accelerated filer, smaller reporting company, or an emerging growth company. See the definitions of "large accelerated filer," "accelerated filer," "smaller reporting company," and "emerging growth company" in Rule 12b-2 of the Exchange Act.
|
Large accelerated filer |
◻ |
Accelerated filer |
☒ |
|
Non-accelerated filer |
◻ |
Smaller reporting company |
☒ |
|
Emerging growth company |
☒ |
|
|
If an emerging growth company, indicate by check mark if the registrant has elected not to use the extended transition period for complying with any new or revised financial accounting standards provided pursuant to Section 13(a) of the Exchange Act. ◻
Indicate by check mark whether the Registrant is a shell company (as defined in Rule 12b‑2 of the Exchange Act). Yes ☐ No ☒
The aggregate market value of the voting stock held by non-affiliates of the registrant as of the last business day of the registrant's most recently completed second fiscal quarter was approximately $212.7 million based upon the closing sale price of our common stock of $6.85 on that date. As of March 13, 2020, there were 53,504,278 shares of common stock, $0.0001 par value, issued and 52,887,912 outstanding.
DOCUMENTS INCORPORATED BY REFERENCE
The information required by Part III of this Report, to the extent not set forth herein, is incorporated herein by reference from the registrant's definitive proxy statement relating to the Annual Meeting of Stockholders to be held in 2020, which definitive proxy statement shall be filed with the Securities and Exchange Commission within 120 days after the end of the fiscal year to which this Report relates.
2
CAUTIONARY NOTE REGARDING FORWARD-LOOKING STATEMENTS
This Annual Report on Form 10-K contains forward-looking statements within the meaning of Section 27A of the Securities Act of 1933, as amended (the “Securities Act”), and Section 21E of the Securities Exchange Act of 1934, as amended (the “Exchange Act”). These statements include information relating to future events, future financial performance, strategies, expectations, competitive environment, regulation and availability of resources. Specifically, forward-looking statements may include statements relating to:
the benefits of our February 2019 business combination (the “business combination”);
|
· |
the future financial performance of the Company, including our revenues, cost of revenue, gross profit, operating expenses, ability to generate positive cash flow and ability to achieve profitability; |
|
· |
the sufficiency of our cash to meet our liquidity needs; |
|
· |
changes in the market for our products; |
|
· |
expansion plans and opportunities; and |
|
· |
other statements preceded by, followed by or that include the words “may,” “can,” “should,” “will,” “estimate,” “plan,” “project,” “forecast,” “intend,” “expect,” “anticipate,” “believe,” “seek,” “target” or similar expressions. |
You should not place undue reliance on these forward-looking statements in deciding whether to invest in our securities. As a result of a number of known and unknown risks and uncertainties, our actual results or performance may be materially different from those expressed or implied by these forward-looking statements. Some factors that could cause actual results to differ include:
the risk that the ongoing integration of the businesses acquired in the business combination may disrupt current plans and operations;
|
· |
the ability to recognize the anticipated benefits of the business combination, which may be affected by, among other things, competition and the ability of the combined business to grow and manage growth profitably; |
|
· |
costs related to the business combination; |
|
· |
changes in applicable laws or regulations; |
|
· |
the risk that we are unable to generate sufficient cash flow from our business to make payments on our debt; |
|
· |
the ability to raise or borrow additional funds on acceptable terms; |
|
· |
the possibility that we may be adversely affected by other economic, business, and/or competitive factors; and |
|
· |
other risks and uncertainties described in this Annual Report on Form 10-K under “Risk Factors.” |
Our forward-looking statements speak only as of the time that they are made and do not necessarily reflect our outlook at any other point in time, and involve a number of judgments, risks and uncertainties. Accordingly, forward-looking statements should not be relied upon as representing our views as of any subsequent date. We do not undertake any obligation to update forward-looking statements to reflect events or circumstances after the date they were made, whether as a result of new information, future events or otherwise, except as may be required under applicable securities laws. Unless the context indicates otherwise, the terms “GTY,” the “Company,” “we,” “us” and “our” refer to GTY Technology Holdings Inc., a Massachusetts corporation (f/k/a GTY Govtech, Inc.).
3
GTY Business Overview
GTY Technology Holdings Inc. (GTY) is software as a service (“SaaS”) company that offers a cloud-based suite of solutions for the public sector, in North America. GTY brings leading government technology companies together to achieve a new standard in citizen engagement and resource management. GTY solutions provide public sector organizations with the ability to communicate, engage, interact, conduct business and transact with their constituents in a simple and easy manner spanning functions in procurement, payments, grants management, budgeting, and permitting.
GTY operates through six operating subsidiaries: Bonfire provides strategic sourcing and procurement software to enable confident and compliant spending decisions; CityBase provides government payment solutions to connect constituents with utilities and government agencies; eCivis offers a grants management system to maximize grant revenues and track performance; Open Counter provides government permitting software to guide applicants through complex permitting and licensing procedures; Questica offers budget preparation and management software to deliver on financial and non-financial strategic objectives; Sherpa provides public sector budgeting software and consulting services.
We were initially formed as a blank check company incorporated on August 11, 2016 as a Cayman Islands exempted company formed for the purpose of effecting a merger, share exchange, asset acquisition, share purchase, reorganization or similar business combination with one or more businesses. Until the consummation of the business combination, we did not engage in any operations nor generated any revenue.
On November 1, 2016, we consummated our initial public offering of 55,200,000 units, including the issuance of 7,200,000 units as a result of the underwriters’ exercise of their over-allotment option in full. Each unit consisted of one Class A ordinary share and one-third of one warrant. Each whole warrant entitled the holder thereof to purchase one Class A ordinary share at a price of $11.50 per share. The units were sold at an offering price of $10.00 per unit, generating gross proceeds, before expenses, of $552 million. Prior to the consummation of the initial public offering, in August, 2016, GTY Investors, LLC (the “Sponsor”) purchased 8,625,000 Class B ordinary shares (“founder shares”) for an aggregate purchase price of $25,000, or approximately $0.002 per share. On each of October 14 and October 26, 2016, we effected a share capitalization resulting in an aggregate of 11,500,000 and 13,800,000 founder shares outstanding, respectively. In October 2016, the Sponsor transferred 25,000 founder shares to each of our independent director nominees at the same per-share purchase price paid by the Sponsor.
Simultaneously with the closing of the initial public offering, we consummated the private placement of 8,693,334 private placement warrants, each exercisable to purchase one Class A ordinary share at $11.50 per share, at a price of $1.50 per private placement warrant, with the Sponsor, generating gross proceeds of approximately $13.04 million.
Upon the closing of the initial public offering and private placement on November 1, 2016, $552 million from the net proceeds of the sale of the units in the initial public offering and the private placement was placed in a U.S.-based trust account maintained by Continental Stock Transfer & Trust Company, acting as trustee.
Initially, we were required to complete our initial business combination by November 1, 2018, which was 24 months from the closing of our initial public offering. On October 30, 2018, our shareholders approved a proposal to amend our second amended and restated memorandum and articles of association to extend the date by which we had to consummate an initial business combination from November 1, 2018 to May 1, 2019. In connection with such proposal, our public shareholders had the right to elect to redeem their Class A ordinary shares for a per share price, payable in cash, based upon the aggregate amount then on deposit in the trust account. Our public shareholders holding 34,011,538 Class A ordinary shares out of a total of 55,200,000 Class A ordinary shares validly elected to redeem their shares and, accordingly, after giving effect to such redemptions, the balance in our trust account was approximately $216.8 million.
On February 19, 2019, we consummated the business combination pursuant to which we (i) acquired each of Bonfire Interactive Ltd. (“Bonfire”), CityBase, Inc. (“CityBase”), eCivis Inc. (“eCivis”), Open Counter Enterprises Inc. (“Open Counter”), Questica Inc. and Questica USCDN Inc. (together, “Questica”). Until the Acquisition, GTY Cayman did not engage in any operations nor generate any revenues. 11,073,040 Class A ordinary shares were redeemed at a per share price of approximately $10.29 in connection with the shareholder vote to approve the business combination. In connection with the closing of the business combination, GTY Govtech, Inc. a Massachusetts corporation, became the parent company of and successor issuer by operation of Rule 12g-3(a) promulgated under the Exchange Act to our predecessor entity, GTY Technology Holdings Inc., the Cayman Islands exempted company, and changed its name from GTY Govtech, Inc. to GTY Technology Holdings Inc.
4
Upon the closing of the business combination, all outstanding Class A ordinary shares were exchanged on a one-for-one basis for shares of common stock, and our outstanding warrants became exercisable for shares of common stock on the same terms as were contained in such warrants prior to the business combination.
Legal Proceedings
On November 19, 2018, GTY Technology Holdings Inc., a Massachusetts corporation (“GTY” or the “Company”), Stephen J. Rohleder and Harry L. You commenced a lawsuit against OpenGov, Inc. (“OpenGov”) in the United States District Court for the Southern District of New York captioned GTY Technology Holdings Inc. et al. v. OpenGov, Inc., No. 18-cv-10854 (the “New York Action”), and on November 20, 2018, OpenGov commenced a lawsuit against the Company, the Company’s predecessor entity, GTY Technology Holdings Inc., a Cayman Islands exempted company, GTY Technology Merger Sub, Inc., GTY Investors, LLC, Mr. You, Mr. Rohleder and Does 1-50 in the Superior Court of the State of California in and for the County of San Mateo captioned OpenGov, Inc. v. GTY Technology Holdings Inc. et al., No. 18-cv-06264 (the “California Action”).
On February 19, 2020, the parties to the New York Action and the California Action entered into a settlement agreement (the “Settlement Agreement”) to resolve all the pending claims in the New York Action and the California Action, without any admission or concession of wrongdoing by the Company or other defendants. Pursuant to the Settlement Agreement, the Company paid OpenGov $3.3 million, net of amounts paid by the Company’s insurers, in exchange for a full and complete release of all claims that were or could have been asserted in the New York Action and the California Action.
The following is a brief description of each of the business units we acquired in connection with the business combination.
Bonfire Business Overview
Bonfire Interactive Ltd., a corporation incorporated under the laws of the Province of Ontario, Canada, or Bonfire, was founded in 2012 and is a major provider of software technologies for the procurement and vendor or supplier sourcing industry across government, the broader public sector, and various highly-regulated commercial vertical markets.
Bonfire offers clients and their sourcing professionals a modern software as a service (SaaS) application that helps find, engage, evaluate, negotiate with, and award contracts to suppliers. Bonfire delivers effective workflow automation, data collection and analysis, and collaboration to drive cost savings, compliance, and strategic outcomes. All of Bonfire’s applications are delivered as a SaaS offering.
Industry Background
The North American public sector represents a significant market for procurement technology. Various levels of government and public sector agencies’ procurement processes account for an estimated 12% of gross domestic product for both the United States and Canada, which equals approximately $2.5 trillion per year for the United States and Canada combined. Despite this magnitude, however, most of these spending decisions are made via paper, off-the-shelf spreadsheet technologies, and legacy internet-based sourcing portals.
In total, the North American public sector market includes over 99,000 cities, counties, towns, and other local government special agencies, and over 17,000 public institutions in academia, public healthcare, transit, utilities, and general state and federal agencies as of the most recent US Census of Governments. Despite differences in revenue sources, service delivery, and organizational mandates, each government body or entity shapes its sourcing practices in similar ways in response to state and federal procurement legislation and the emergence of various best practices.
Each public body faces a similar challenge: how to procure the best good/service, for the best cost, within often rigid compliance and policy directives from elected bodies or other regulation. This compliance- and policy-driven environment makes public sector procurement a significantly more complex and sensitive process than in the private sector. Public sector procurement teams are typically stewards of tax-payer resources, and are subjected to high sourcing scrutiny and ethics requirements. Such entities must balance competing interests like cost-savings, compliance, and quality to achieve uniquely positive outcomes.
5
Public sector procurement groups are more regularly transitioning tools from offline workflows to online SaaS-enabled platforms to fulfill this mandate. Legacy internet-based portals and procurement suites often fail to respect the complexities of making procurement decisions in a public sector context. Many are mere systems of record and rudimentary interface points for buyers and suppliers. Many more fail to help procurement teams with the key functionalities of managing and analyzing supplier data for optimal sourcing decisions.
Bonfire uniquely captures the complexity and depth of public sector sourcing workflows; the software allows procurement teams to collect highly granular supplier data, analyze and evaluate it across discrete criteria, and ultimately help procurement teams make the best possible decision as a balance of compliance, cost-savings, and quality/fit.
Products and Services
Bonfire provides a comprehensive and flexible suite of products that addresses the procurement needs of predominantly public sector clients across academia, public healthcare, local and state government, transit, utilities, and various other state and federal agencies. Bonfire derives all of its revenues from subscription-based SaaS revenues.
A description of Bonfire’s suites of products and services follows:
|
eRFx & eTendering |
Control for requests for proposals, or RFPs or RFx, and bids, streamlining the entire sourcing workflow from posting to award |
|
|
Vendor-friendly online portal to post opportunities and receive structured submissions |
|
|
Evaluation tools that give deep insights into suppliers’ relative strengths/weaknesses, pricing, and other areas |
|
|
|
|
|
Real-time overview of projects and key performance indicators, or KPIs |
|
Contracts |
Contract information in one centralized, searchable, online platform |
|
|
Heat-mapped calendar view, reminders and KPIs |
|
|
Easy creation of contracts from completed projects |
|
Vendor Performance |
Visibility into vendor performance |
|
|
Configure custom surveys for end users and set a cadence to automatically send |
|
|
Real-time insights to address issues immediately |
Strategy
Bonfire’s objective is to grow its revenue and earnings organically, supplemented by focused strategic acquisitions. The key components of its business strategy are to:
|
· |
Provide high quality, value-added products to its clients. Central to Bonfire’s success so far has been customer satisfaction and trust, as evidenced by a 93% client retention rate across clients added from January 1, 2019 to December 31, 2019 and net Annually Recurring Revenue, or ARR, churn of -7% for those same clients (i.e., Net Negative Churn). Bonfire expects that it will continue to invest heavily in client success. |
|
· |
Continue to expand its product offerings. Bonfire intends to continue to build innovative new products for its clients. These include products that leverage the data stored in clients’ networks to help clients achieve better sourcing outcomes through predictive analytics, machine learning, blockchain, intra-agency collaboration, and other next-generation technologies. |
|
· |
Expand its client base. Continued client growth is key for Bonfire’s strategy. Bonfire plans to continue building out its direct client acquisition strategy while adding strategic channel relationships to aid. |
|
· |
Attract and retain highly qualified employees. Bonfire’s business is dependent on attracting and retaining excellent managers and employees for product development, go-to-market, administrative, and support activities. Bonfire believes that its mission, scale of the opportunity, and unique culture will allow it to continue recruiting excellent staff. |
6
|
· |
Pursue selected strategic acquisitions. Where appropriate, Bonfire plans to make strategic acquisitions of legacy portal providers as a way of quickening the adoption of Bonfire. This will allow Bonfire to grow revenues more rapidly than with a purely organic strategy, and to grow its supplier network and corresponding data. |
Sales, Marketing, And Clients
Bonfire markets its products and services through direct, in-house sales and marketing personnel located in Canada and the United States.
Sales of new systems are typically generated from outbound marketing and sales campaigns, tradeshows and conferences, word-of-mouth and referrals, and thought-leadership campaigns.
Competition
Bonfire competes with numerous local, regional, and national firms that provide or offer some or many of the same solutions that it provides. Many of these competitors are smaller companies that may be able to offer less expensive solutions than Bonfire’s. Many of these firms operate within a specific geographic territory and/or are in a narrow product or service niche. Bonfire also competes with national firms, some of which have greater financial and technical resources than Bonfire does, including SAP Ariba. Bonfire also occasionally competes with central internal information service departments of local governments, which requires it to persuade the end-user department to discontinue service by its own personnel and outsource the service to Bonfire.
Bonfire competes on a variety of factors, including price, service, name recognition, reputation, technological capabilities, and the ability to modify existing products and services to accommodate the individual requirements of the client. Bonfire’s ability to offer an integrated system of applications for several offices or departments is often a competitive advantage. Local governmental units often are required to seek competitive proposals through a request for proposal process and some prospective clients use consultants to assist them with the proposal and vendor selection process.
Suppliers
Substantially all of the computers, peripherals, printers, scanners, operating system software, office automation software, and other equipment necessary for the implementation and provision of Bonfire’s software systems and services are presently available from several third-party sources. Hardware is purchased on original equipment manufacturer or distributor terms at discounts from retail. Bonfire has not experienced any significant supply problems.
Research and Development
Bonfire invests substantial resources in research and development to improve its platform and develop new products and features. Bonfire’s research and development team is primarily responsible for the design, development, testing, and delivery of its products.
Intellectual Property, Proprietary Rights and Licenses
Bonfire regards certain features of its internal operations, software, and documentation as confidential and proprietary and relies on a combination of contractual restrictions, trade secret laws and other measures to protect its proprietary intellectual property. Bonfire currently does not rely on patents. Bonfire believes that, due to the rapid rate of technological change in the computer software industry, trade secrets and copyright protection are less significant than factors such as knowledge, ability and experience of its employees, frequent product enhancements, and timeliness and quality of support services. Bonfire typically licenses its software products under non-exclusive license agreements, which are generally non-transferable and have a perpetual term.
Employees
At December 31, 2019, Bonfire had 108 full-time employees. None of its employees are represented by a labor union or are subject to collective bargaining agreements. Bonfire considers its relations with its employees to be positive.
7
Properties
Bonfire leases and occupies approximately 21,000 square feet of office space in Ontario, Canada. Such lease expires on June 30, 2022.
Government Regulation
Upon reasonable investigation, we are not aware of any current government regulations that negatively impact Bonfire’s business or ability to compete in its markets.
Legal Proceedings
There are no legal proceedings pending to which Bonfire is party or to which any of its properties are subject.
CityBase Business Overview
CityBase provides dynamic content, digital services, and integrated payments via a software-as-a- service (SaaS) platform that includes functionality accessible via web and mobile, kiosk, point-of-sale, and other channels. CityBase software integrates its platform to underlying systems of record, billing, and other source systems, and configures payments and digital services to meet the requirements of its clients. Its clients include government agencies and utility companies. CityBase, LLC was formed in Delaware on June 9, 2014. On June 21, 2016, CityBase, LLC was converted into a Delaware corporation, CityBase, Inc.
To complement and expand CityBase’s technology and customer base, on August 17, 2017, CityBase acquired 100% of the equity interests of the Department of Better Technology, Inc., a Delaware corporation, in exchange for shares of CityBase common stock.
Industry Background
Currently, the government technology industry is composed of legacy technology vendors (which typically use significant customization for implementation), consulting firms, in-house development, and manual processes that have never been digitized. CityBase anticipates that government will follow the digital transformation of the private sector as constituents will expect such digitalization, and ultimately such digitalization is expected to yield cost reductions and improved service to constituents. CityBase also expects a continued momentum amongst government staff and leaders to modernize government services. This future is not defined, but facilitated by, technology and will revolutionize the way that people experience government.
Product and Service Offerings
CityBase provides an enterprise SaaS platform that facilitates government and utility interactions with customers. The key elements of its products and services are digital services and payments.
Digital Services
CityBase’s digital services make it easier for constituents to register, apply, search, and pay for government and utility services — and easier for staff to administer these services. “Digital services” includes solutions that address the common interactions that people have with the government or their utility provider, which are often paper-based today. CityBase digital services include configurable digital forms and case management tools that replace manual processes or improve existing online processes for government and utility customers. CityBase’s digital service tools help government and utility staff process constituent requests faster and more effectively.
Payments
The CityBase platform helps local governments and utilities accept, track, and manage payments from their constituents. CityBase facilitates payments that provide a modern user experience, integrate seamlessly with its customers’ existing systems, and are consistent across a large enterprise. The payment technology is available via channels, including
8
web and mobile web, kiosk, and point-of-sale terminals. Its revenue management solution allows clients to manage system-wide payment activity as well as reconcile to individual transactions in one place.
Customers
CityBase’s clients include local and county governments and investor or municipal utility companies. Four of CityBase’s customers accounted for approximately 78% and 72% of CityBase’s total revenues for the years ended December 31, 2019 and 2018, respectively.
Competition
The market for enterprise payment, data analytics, and communication platforms for local governments and utilities is competitive and evolving. CityBase faces competition from several types of internal approaches and independent providers:
|
· |
Custom software solutions developed by outside consultants or through internal efforts to provide partial- or full-suite offerings; |
|
· |
Software vendors that have developed agency- or utility-specific systems for individual business cases, such as property tax payments, utility payments, or freedom of information requests; |
|
· |
Other SaaS solution providers; and |
|
· |
Payment processing solution vendors serving government and utilities. |
Competitive factors in CityBase’s market may include the following:
|
· |
Service |
|
· |
Price |
|
· |
Speed to implement |
|
· |
Citizen-centric design |
|
· |
Configurability and flexibility |
|
· |
Back office function for payment and banking reconciliation |
CityBase believes that it compares favorably on the basis of these factors. Some of CityBase’s current competitors have, and future competitors may have, greater financial, technical, marketing and other resources, greater resources to devote to research and development, a broader range of products and services, larger marketing budgets, more extensive customer bases and broader customer relationships, and/or longer operating histories, greater name recognition and other resources.
Government Regulation
As a contractor to various government agencies, CityBase is subject to certain restrictions in how it operates. Such restrictions may exist at the individual client level and may include regulations that govern the fees that CityBase collects for its services or the ability of the government counterparty to terminate its contractual obligations.
Privacy and Data Security
In addition, as a facilitator of credit card payments, CityBase is subject to privacy and data protection laws and payment card industry best practices. CityBase is a Payment Card Industry (PCI) Level-1 compliant service provider hosted in an Amazon Web Services (AWS) cloud environment. CityBase takes a number of important measures to promote
9
data privacy and data security, including adhering to the standards and requirements, as defined by the Payment Card Industry Data Security Standard (PCI DSS), using tokenization, employing 24/7 fraud and tamper detection, real-time alerting, end-to-end encryption technology, and regularly scheduled internal and external penetration testing.
Research and Development
CityBase invests substantial resources in research and development to improve its platform and develop new products and features. CityBase’s research and development organization is primarily responsible for the design, development, testing, and delivery of its products and platform.
Intellectual Property
The success of CityBase depends, in part, on its ability to protect its brands and technologies against infringement and misappropriation. CityBase relies on a combination of contractual restrictions, confidentiality procedures, trade secret laws and other measures to protect its proprietary intellectual property. CityBase does not currently own any patents or hold other intellectual property registrations to protect its intellectual property.
CityBase uses certain intellectual property licensed from third parties, including software made available to the public under open source licenses. If any proprietary software does not continue to be available on commercially reasonable terms, CityBase believes that alternative software would be available, if necessary.
CityBase cannot be certain that its products and services do not and will not infringe the intellectual property rights of others. To the extent claims against CityBase are successful, it may have to pay substantial monetary damages or discontinue or modify certain products or services that are found to infringe another party’s rights.
Employees
As of December 31, 2019, CityBase had 99 full-time employees. CityBase also utilizes independent contractors to support certain technical and other functions, including implementation engineers, which assist on all phases of the web-based project lifecycle, from project definition through implementation.
CityBase employees are not covered by any collective bargaining agreement, and it has never experienced a work stoppage. CityBase believes that its relations with its employees are good.
Facilities
CityBase’s corporate headquarters is located in Chicago, Illinois, where it currently leases approximately 14,560 square feet under a lease agreement set to expire in November 2021. In addition, CityBase subleases a Chicago, Illinois office to a non-related party under terms expiring on December 31, 2020. CityBase also leases a warehouse space in Illinois and co-working spaces in San Francisco, California; Indianapolis, Indiana; and Birmingham, Alabama. CityBase believes that its current facilities are adequate to meet its ongoing needs and that, to accommodate growth, it may seek additional facilities as necessary.
Legal Proceedings
There is no material litigation, arbitration or governmental proceeding currently pending against CityBase or any members of its management team in their capacity as such.
eCivis Business Overview
eCivis provides cloud-based grants management and cost allocation software for state, local and tribal governments and other government entities. eCivis helps thousands of public agencies maximize their grant revenues, track financial and program performance, prepare cost allocation plans and budgets, and access free open data tools to make sense of federal data. eCivis’s solutions simplify grant pursuance, proposal development, budgeting, program implementation, performance, reporting, compliance and management of subrecipients in one single centralized enterprise system. eCivis was founded in Pasadena, California in 2000 with the help of local government leaders at the International City/County Management Association (ICMA).
10
Industry Background
eCivis has identified a major inefficiency in the flow of government funding between state and federal government and businesses, individuals and various local government entities. The grant funding process is inefficient, with the majority of local governments lacking essential human and technical resources to pursue and manage the grant process. Instead, staff members without formal training often attempt to fit grants management into their already heavy workload, without access to standardized forms, tools or processes, resulting in inefficient strategy and lost opportunities for funding. Data and information is rarely standardized and is entered into common back office tools such as spreadsheets and outdated grant management systems without comprehensive tracking and integration functions. Furthermore, currently- existing fund management systems are unable to monitor the proper use of funds, leading to significant mismanagement and even risk of loss and misappropriation of funds. Competitive grants are time sensitive and require immediate attention whereas procurement and internal sources take time to be approved. eCivis provides products and services that can be deployed quickly and with little technical support to address the time sensitive nature of these grant funds.
eCivis’s Products and Services
The eCivis solution consists of three core cloud-based products including eCivis Grants Network©,a full lifecycle SaaS grants management solution consisting of grants acquisition software, grantee management software, and grantor management software, eCivis AllocateTM, a SaaS cost allocation solution, and FundMaxTM, a full-service solution designed to maximize federal and non-federal funds, including maximizing cost reimbursements using a suite of innovative digital tools and expert support. eCivis also offers one-time implementation services including data integration, grants data migration and change management. Additionally, eCivis provides ongoing grants management training and cost allocation plan development and consulting.
eCivis Grants Network©; Grants Acquisition Software
eCivis Grants Network©; Grantee Acquisition Software provides clients with the ability to manage the entire planning and grant pursuance process by integrating each step from project creation to grant award, so that stakeholders can eliminate unnecessary steps and systems required to secure the right funding for their projects. Users can to determine grant award eligibility and financial requirements, create and track projects requiring funding, track goals and objectives for funding, and assign various metrics to review and track organizational performance. The platform provides clients with the ability to search over 16,000 federal, state and foundation grants, all identified, analyzed and summarized by eCivis’s full-time professional research staff. Such grants can be searched with an easy to use advanced multi-factor search engine and reviewed via organized standard tabs to effectively identify the most relevant grants. Users can review application files and e-mail grants to internal and external recipients, as well as save and/or assign grants to internal projects. Built-in compliance tools help determine and confirm whether internal proposals and costs align with applicable federal and non-federal guidelines.
eCivis Grants Network©; Grantee Management Software
eCivis Grants Network©; Grantee Management Software Solution allows users to manage the entire grant process, from sourcing grant application to closeout as a grantee. Some of the key features of the Grants Management Software Solution include the ability to: organize projects and grants by organizational departments, review an enterprise-wide view of all grant activities, and access advanced workflows and robust management reporting systems. Users can build and save template reports for internal and external reporting, setup required tasks at various post-award stages, integrate project tasks with e-mail calendars, manage the communication and approval of budget amendments, and access a myriad of other features and functions. Users are also able to organize and connect financial data to and from enterprise resource planning (“ERP”)/GL against grant budgets using data integration functions — over thirty data integrations with government ERP/GL are provided to serve this function. Additionally, eCivis also maps compliance requirements into standard available actions across the entire grant lifecycle, and provides a library of resource that can be accessed at any time to understand 2 CFR 200 guidelines.
eCivis Grants Network©; Grantor Management Software
eCivis Grants Network©; Grantor Management Software provides grantors and its applicants and grantees with the opportunity to interact with each other in a modern and scaleable platform. Today’s grant portals are not built to make the experience great for the grantor and the grantee. A grantor solution will track performance history, organize reimbursement
11
requests, streamline communication, manage reporting requirements to support payments to deliver transparency of all grantee activities across all of your departments and agencies. Some of the key features of this platform include the ability to create and track grant solicitation, score and record decisions on applicants, check eligibility data, track application history, track and share performance metrics for grant goals and/or objectives, allocate and track multiple funding sources, track all pre-award grant activity by department, project, CFDA, etc., as well as a wide range of other features.
eCivis AllocateTM; Cost Allocation Software
eCivis AllocateTM tracks and compares expenditures and allocation basis by fiscal years, and provides a concise methodology for budgeting and program delivery planning. The platform allows users to: maximize efficiency by minimizing time spent entering and reviewing data and producing cost and plans reports, maximize grant and program funding through full and complete cost recovery and allocation, provide a clear and concise methodology to assist in developing budgets and planning program delivery, and determine full, defensible, indirect costs to include in ICRPs, hour rates, user fees, and SB90 claims.
eCivis FundMaxTM; Cost Allocation Software
eCivis FundMaxTM is a full-service solution designed to maximize federal and non-federal funds, including maximizing cost reimbursements using a suite of innovative digital tools and expert support. The reimbursements from FundMaxTM can generate the required funding to properly implement and utilize eCivis solutions.
Consulting and Training
eCivis’s team of experienced consultants and support staff provide training to improve planning, acquisition and effective management of federal and non-federal grants. Further, eCivis’s strategic grant development and grant writing service helps stakeholders develop a comprehensive solution leading to sustainable grant success by helping clients, among other things: (i) thoroughly understand key initiatives and internal projects eligible for grant funding, (ii) research grants that align to internal initiatives and organizational priorities to fill existing gaps, (iii) access organizational capacity to apply for grants successfully, (iv) align internal procurement processes and resources to pursue grant opportunities in a more efficient and effective way, and (v) draft grant proposals and provide strategic advice and consulting services to shape priorities per grant funding notices. Finally, the platform also offers a wide array of expert guides and other resources to its users.
Revenues, Sales and Marketing
eCivis derives its revenues primarily from subscription services and professional services. No single contract or customer represents a disproportionate percentage of revenue. eCivis’s subscription services revenue primarily consists of fees that provide customers access to either its grant management or cost allocation cloud applications. Such subscriptions are typically one to three years in length, and are priced based on a number of factors, including the number of users having access to the products and the number of products purchased by the customer. eCivis’s professional services revenues primarily consist of fees for data integration with the customer’s systems and the eCivis grant management application, migration of grants, training, and grant writing services.
eCivis focuses its sales and marketing efforts towards local, state and tribal governments and sells its solution to this market primarily through its direct sales force. The length of its sales cycle depends on the size of the potential customer and contract, as well as the type of solution or product being purchased. The sales cycle of its state government customer is generally longer than that of its local government customers. As eCivis continues to focus on increasing its average contract size and selling more advanced products, it expects its sales cycle to lengthen and become less predictable, which could cause variability in results for a particular period. Additionally, the nature, complexity and extent of its implementations will also increase, which may increase eCivis’s professional services revenues as a percentage of its overall revenues.
Research and Development
eCivis has spent approximately $1.5 million and $1.1 million during the years ended December 31, 2019 and 2018, respectively, on research and development activities.
12
Employees
As of December 31, 2019, eCivis had 60 full-time employees. eCivis also employs independent contractors to support grant services, web development, research publishing and editing, fit-gap analysis, change management, implementation services and marketing. eCivis’s employees are not covered by any collective bargaining agreement and eCivis has never experienced a work stoppage. eCivis believes that its relations with its employees are good.
Facilities
eCivis’s headquarters are located in a multi-tenant office building at 418 N. Fair Oaks Ave., Ste. 301, Pasadena, CA 91103, where eCivis leases approximately 10,030 rentable square feet. eCivis’s lease for such space expires on May 31, 2022. On June 1, 2017, eCivis subleased 2,500 rentable square feet to a subtenant, which sublease expires on May 31, 2022. eCivis does not own any facilities as of the date of this filing. eCivis believes that substantially all of its property and equipment is in good condition and its buildings and improvements have sufficient capacity to meet current needs.
Intellectual Property
eCivis does not own any patents. eCivis owns the registered trademarks: “ECIVIS”, “GRANTS NETWORK”, “NONPROFIT ONE-STOP” and “COSTTREE”.
Government Regulation
There are no current government regulations that negatively impact eCivis’s business or ability to compete in its markets.
Legal Proceedings
There is no material litigation, arbitration or governmental proceeding currently pending against eCivis or any members of its management team in their capacity as such.
Open Counter Business Overview
Open Counter builds software to streamline municipal permitting and licensing through four products: the Business Portal, Residential Portal, Special Events Portal, and Zoning Portal. These products help applicants understand the scope of their permitting projects, and apply and pay for the necessary permits online. The portals also allow city administrators to process incoming applications and respond to applicant inquiries online. By automating these processes, the software reduces the need for in-person meetings, and allows city staff to focus on higher-value assignments.
Open Counter’s Products and Services
Open Counter offers four products: Business Portal, Residential Portal, Special Events Portal, and Zoning Portal.
|
· |
The Business Portal helps entrepreneurs understand the costs and complexity of establishing or growing a business in a particular city. The Open Counter Business Portal educates potential applicants about necessary business permits, and provides estimates about the associated time and costs associated with a particular project. Once applicants are ready to proceed with a project, they can use the Business Portal to apply online for necessary permits. |
|
· |
The Residential Portal educates homeowners about the rules and regulations regarding residential additions, alterations, and new construction to help plan projects and remain in compliance with city code enforcement. |
|
· |
The Special Events Portal helps applicants understand the process involved in hosting a special event in a public space by handling site selection, cost estimation, event scheduling, and online applications. The Special Events Portal provides a high-level overview tool to educate users about which types of events are allowed, where events may be located, which permits are required, and cost estimates. |
13
|
· |
The Zoning Portal renders complex land use regulations in a user’s web browser to make zoning regulations responsive to citizen inquiries. Specifically, the Zoning Portal helps applicants navigate the site selection process by showing where a particular project may be permitted. The Portal analyzes and imports the logical structure of the municipal code, and factors secondary issues, such as whether a restaurant may serve alcohol, or have live entertainment, in order to provide tailored guidance about a specific project. |
As part of the deployment of these products, Open Counter also offers configuration services to set up and maintain the Portals on behalf of our municipal customers.
Competition
There are a number of companies that offer permitting and licensing software to municipal governments. These include Accela, Infor, and Tyler, among others. These companies built their software with an emphasis on the requirements of city staff users, with a lesser emphasis on the applicant experience.
By focusing on the applicant experience, Open Counter found a unique niche in the market: permit discovery. While the competition allows applicants to submit permit and license applications online, their software typically assumes that the applicant knows which permits and licenses are required, and the costs of those permits and licenses. In contrast, Open Counter’s software guides the applicant through the permit discovery process by calculating the impact of applicable zoning regulations on the choice of location and planned use, the permits required for the project, and the necessary permit fees. Open Counter’s software also alerts applicants about the professional licensure requirements for specific permits, such as whether a licensed contractor, electrician or plumber is needed on their project team. By automating these determinations, Open Counter has addressed an in-person step referred to as a “pre-application meeting,” which is a time-consuming step for both applicants and city staff.
Because Open Counter is offered as a SaaS solution, its annual pricing is significantly lower than the legacy systems, which have traditionally offered on-premises software under perpetual license agreements.
Some of Open Counter’s competition provide permit discovery products that explain the permitting process in general terms. While helpful, these materials do not provide information tailored to specific projects. For example, a restaurant with outdoor seating, live entertainment, and alcohol service may require a different set of permits (with higher costs), than one without those options. Many cities offer PDF documents with this kind of information. For example, San Francisco and Los Angeles offer detailed “Business Portals,” but they are still based on static content.
By focusing on permit discovery, Open Counter has remained agnostic to the back-end systems used by cities. This means that we can launch Open Counter products in cities using Accela, Infor, or Tyler, and other competitors, without coming into direct competition with offerings from those companies.
Research and Development
Open Counter spent approximately $400,000 during each of the years ended December 31, 2019 and 2018 on research and development activities. None of such costs are borne by customers.
Organization
As of December 31, 2019, Open Counter had 18 full-time employees. None of Open Counter’s employees are represented by a labor union with respect to their employment with Open Counter. Open Counter believes that its relations with its employees are good.
Facilities
Open Counter’s headquarters is located at 25 Taylor Street, San Francisco, California. Open Counter is not party to any lease agreements. Open Counter uses office space through an agreement with WeWork at the WeWork Golden Gate location, 25 Taylor Street, San Francisco, California. Open Counter employees work remotely out of their homes or at co-working facilities. Open Counter does not own any facilities as of the date of this filing.
14
Intellectual Property
Open Counter owns a trademark on the Open Counter name. The company does not hold any patents.
Government Regulation
There are no current government regulations that negatively impact Open Counter’s business or Open Counter’s ability to compete in the markets it pursues.
Legal Proceedings
There is no material litigation, arbitration or governmental proceeding currently pending against Open Counter or any members of its management team in their capacity as such.
Questica Business Overview
Questica offers budgeting software, performance management, and transparency and data visualization solutions throughout North America. Questica was founded by TJ Parass in Ontario, Canada in 1998. Questica uses its 20 years of experience to provide public sector organizations with access to a complete budgeting, performance, transparency and citizen engagement toolkit to better enable data-driven budgeting and decision-making, while increasing data accuracy, saving time and improving stakeholder trust. Questica’s solutions are sold to 719 customers as of December 31, 2019, which include state and local governments and public sector organizations such as healthcare, education and not-for-profit organizations.
Questica’s Products and Services
Questica has four primary products: (i) Budget; (ii) Performance; (iii) OpenBook; and (iv) BudgetBook powered by CaseWare.
Budget
Questica’s Budget is a web-based, multi-user budgeting preparation and management solution that provides all budgeting software requirements in one easy-to-access place. Budget is a comprehensive, streamlined budgeting software product that enables users to improve and shorten an organization’s budgeting cycle by ensuring an accurate and collaborative multi-user budgeting process. It provides multi-year capital budgeting, identifies expenditures and funding sources, provides salary and position planning and performance management modules, allows the generation of new financial statements, enables advanced analytics and provides an integrated dashboard that shows all critical data and other relevant information together in an interactive interface. Budget directly and seamlessly integrates with Questica’s other products, which are described below, as well as the Balancing Act budget simulator created by Engaged Public, a Colorado-based public policy consulting firm which has partnered with Questica since August 2018.
Performance
Questica’s Performance is a management performance measurement tool which permits users to obtain a complete view of performance across an organization. Performance, which can integrate with Budget, leverages financial and statistical data from an unlimited number of budget and non-budget key performance indicators to effectively measure performance by tracking an organization’s progress and achieving set goals. Performance can incorporate data from a variety of other sources such as ERP systems.
OpenBook
Questica’s OpenBook is a data visualization software that enables the presentation of financial and non-financial data with descriptive text, informational pop-ups, charts and graphs and includes fast information search functionality. OpenBook, which can integrate with Budget, can display on a map capital infrastructure projects, including the budget, actual spend, funding sources and accompanying documentation, images, video and other multimedia. By facilitating the sharing and communication of financials and other data, OpenBook is used by organizations to communicate strategic plans, fundraising and community initiatives, disclose to citizens how tax dollars are spent, and engage with stakeholders
15
regarding plans, projects and issues. Organizations can also link related activities to showcase the depth and scope of capital projects that are happening in a city, region, state, province or country.
Budget Book powered by CaseWare
Questica’s Budget Book powered by CaseWare is a user-friendly and comprehensive document management and financial reporting tool that allows government agencies to create, collaborate, edit, approve and publish annual budget books. Budget Book integrates with Budget and provides access to Questica’s partnership with CaseWare, a government financial reporting database product. The budget book standards for the Government Financial Officers Association’s annual Distinguished Budget Presentation Award were used to develop the standard budget book preparation model for Budget Book’s interface, permitting small and mid-sized agencies to prepare professional and compliant budget books that might be otherwise too time and resource intensive to produce.
Competition
The competitive landscape for budgeting software, performance management, and transparency and data visualization solutions varies depending on the type of solution, the size of the organizations to be served and the geographical locations in which such organizations operate, but in most cases the solutions with which Questica competes are ERP solutions, Microsoft’s Excel and home-grown solutions designed by the organizations themselves.
Questica believes the principal competitive factors in its markets include:
|
· |
Cost |
|
· |
Technology |
|
· |
User Interface |
|
· |
Customer Service |
|
· |
Integration |
|
· |
Public Sector Focus and Expertise |
|
· |
Product Breadth |
|
· |
Implementation Track Record |
Questica believes that it competes favorably based on these factors.
While there are a number of competitors seeking to provide such solutions, the primary competitors include Oracle’s Hyperion Planning, Sherpa, ClearGov, Public Sector Digest Software, MyBudgetFile, Allovue Balance, Adaptive Insights, Kaufman Hall, OpenGov and Centage’s Budget Maestro, which each compete to differing degrees across the spectrum of organizations, geographical locations and vertical markets in which Questica operates. Questica has emerged as a market leader or strong market participant for each type of solution that it provides among these primary competitors.
Questica has focused its competition on establishing relationships with potential customers as early in the process as possible through cold calling, email campaigns, trade show attendance and sponsorships, web marketing, partner referrals and Questica-sponsored regional events. Questica leverages existing customer references and its broad knowledge and understanding of the public sector and the unique budgeting challenges these customers face to compete with its primary competitors. Questica additionally differentiates itself by solely focusing its product development on the public sector and does not sell or market its products into any other types of customers.
Questica has a sales organization that sells its products, sometimes working with referral partners who sell complimentary solutions. In addition, Questica utilizes distribution relationships with partners who sell, implement and
16
provides basic support services to customers and has a number of referral arrangements with partners who introduce Questica’s products to their customers and receive a referral fee for Questica contracts.
Questica has 719 customers using its solutions and is not dependent on any one customer with no customers representing more than 10% of total revenues during each of the years ended December 31, 2019 and 2018.
Research and Development
Questica regularly introduces new product offerings, including BudgetBook powered by CaseWare, which was introduced in late 2017. Questica spent approximately $2.0 million and $1.3 million during the years ended December 31, 2019 and 2018, respectively, on research and development activities. Very little of such costs are borne by customers. Questica has a small group of developers who work with its professional services and implementation team. The cost of these development resources is not included in the annual research and development spend, and this team builds customizations and integrations funded by customers as billable jobs and deliverables.
Organization
As of December 31, 2019, Questica had 112 full-time employees. None of Questica’s employees are represented by a labor union with respect to their employment with Questica. Questica believes that its relations with its employees are good.
Facilities
Questica leases four facilities for key administrative, operational and technology functions. Questica’s headquarters are located in a multi-tenant office building in Burlington, Ontario, Canada at 980 Fraser Drive, Unit 105, where Questica leases 7,000 square feet. Questica’s lease for the space in Burlington commenced on June 1, 2015 and expires on March 31, 2020. Starting on March 1, 2017, Questica also leased 3,410 square feet in a second property in Burlington, Ontario, Canada, which lease ends on March 31, 2020. Starting on June 20, 2017, Questica leased 2,085 square feet in Huntington Beach, California, which lease ends on March 31, 2023. In August 2019, Questica entered into a leasing agreement located at 603 Michigan Drive, Oakville, Ontario. The lease commenced on January 1, 2020 and expires on December 31, 2031. The total square feet under lease is 22,170. Questica does not own any facilities as of the date of this filing. Questica believes that substantially all of its property and equipment is in good condition and its buildings and improvements have sufficient capacity to meet current needs.
Intellectual Property
Questica does not hold any patents but has registered trademarks for “QUESTICA” and “TEAMBUDGET” in the U.S. and Canada and has applied for trademarks for “OPENBOOK” and “WHERE BRILLIANT BEGINS” in the U.S. and Canada.
Government Regulation
There are no current government regulations that negatively impact Questica’s business or Questica’s ability to compete in the markets it pursues. However, there are regulations related to the Health Insurance Portability and Accountability Act of 1996 (HIPAA) and the Americans with Disabilities Act (ADA) that are relevant to Questica’s customers that could in the future necessitate changes to Questica’s products in order to be compliant, and if not addressed, could negatively impact Questica’s ability to compete for new business.
Legal Proceedings
There is no material litigation, arbitration or governmental proceeding currently pending against Questica or any members of its management team in their capacity as such.
Sherpa Business Overview
Sherpa is a leading provider of public sector budgeting software and consulting services that help state and local governments create and manage budgets and performance. Clients purchase Sherpa software as a subscription or perpetual
17
license and engage Sherpa consulting services to configure the software and train clients on how to manage the software going forward. Following the implementation, clients continue to use the software in perpetuity while paying maintenance or subscription fees.
Sherpa’s clients benefit from a system that greatly simplifies the budgeting process, encourages collaboration and provides detailed projections on substantial portions of their budgets. Increased access to data, including instant aggregation of the budget requests, means clients can spend more time analyzing data and less time collecting it and formatting outputs. Sherpa’s business consulting provides access to lessons learned from over 100 public sector budgeting implementations and consultants who average 20 years of experience in budgeting and performance management.
Sherpa’s contracts are comprised of two durations: (i) short-term implementation of three to twelve months; and (ii) on-going maintenance of one to five year renewable periods. Due to the investment made in implementing software and the quality of the solution, retention rates are very high.
Industry Background
Public sector budgeting has been traditionally performed by either disparate spreadsheet that are compiled by a central office or home-grown systems. Due to the sheer amount of data and publication requirements needed by public sector organizations, using this traditional process can be very challenging. Most budget processes experience a significant amount of data re-entry and re-stating, manual compilation and extensive data verification and often rely on the mostly manual preparation of required publications. While products that meet some budgeting software requirements exist in the market, many are overly complicated to implement or priced at a point that exceeds the reservation points of most government organizations. Sherpa’s product is flexible enough to meet complex requirements while also scalable to lower budget clients.
Sherpa’s Products and Services
Sherpa provides public sector budgeting software to meet the needs of key stakeholders, executive and legislative branches, budget offices and department users. The key elements of Sherpa’s offerings are: (i) a highly configurable software; (ii) an experienced consulting team; and (iii) a long-term support model.
Highly Configurable Software
Sherpa’s software was designed to be configured by functional staff with no changes to the underlying code. Implementation teams are comprised of functional experts, not technical experts, who are able to understand business requirements and demonstrate configured software immediately after requirements meetings. This means clients see their future solution throughout the process and can make refinements without having to wait for an entire build phase to complete.
Consulting
Each of the members of Sherpa’s consulting team have an average of over 20 years of targeted public sector budgeting experience and together have implemented over 100 public sector budgeting projects. This experience is invaluable to clients for several reasons. Clients can quickly explain their processes and Sherpa’s team will understand without multiple iterations, meaning clients dedicate a significantly lower amount of their time to engagements. When clients seek advice, Sherpa can refer them to dozens of relevant examples where other similar clients have faced similar challenges. Sherpa has many innovative clients whose collective thought leadership is channeled through Sherpa’s implementation team. Sherpa’s team has seen what has worked and what has not, so Sherpa can offer counsel on business processes redesign including recommended timing relative to the software project.
Support
Sherpa’s support model is designed to enable clients to use Sherpa’s software for the long term, traversing changes in leadership, policy, and staff. As part of Sherpa’s basic maintenance model, clients can reach out to their consulting team at any time to get assistance, answers to questions or support with activities that are rarely done, such as annual rollovers. This results in clients getting answers to questions immediately, without the struggles of reporting issues through a chain of support staff who are not familiar with the client processes and configuration.
18
Revenues
Sherpa currently earn revenues from three main sources: (i) consulting services for implementations and business process design; (ii) software fees; and (iii) maintenance fees. Consulting services are comprised of one-time implementation fees and system administrator services, where Sherpa serves as the customer’s system administrator, typically to provide coverage for turnover. Software fees are made up of both perpetual license fees and subscription fees. Maintenance fees are annual fees paid by perpetual license customers to have access to customer support and software upgrades. Hosting services are also provided but are mostly pass-through to Sherpa’s hosting providers. Sherpa generally relies on approximately 21 customers for each of its three main revenue sources in a given fiscal year, which are mostly comprised of state and local governments.
Sales and Marketing
Sherpa’s primary method of securing sales to date is through responses to requests for proposals. In addition, Sherpa’s target audience actively communicates with similar public sector organizations, which leads to word-of-mouth sales. To grow sales beyond responses to requests for proposals and word-of-mouth referrals, Sherpa employs the following sales and marketing strategies:
|
· |
Limited conferences where decision-makers attend; |
|
· |
Pre-sales work to introduce clients to Sherpa’s offering; and |
|
· |
Selling via cooperative agreements. |
Revenue Growth
Sherpa’s primary focus for revenue growth is to ensure Sherpa’s current customer base maintains a high degree of customer satisfaction. Sherpa believes that high retention of recurring revenue is critical to create the foundation for revenue growth. Sherpa also believes that high customer satisfaction provides secondary benefits, including strong references and willingness to promote the product and team.
Growing Existing Markets
Sherpa’s goals for growth focus on verticals with which Sherpa has had the most success: cities, counties and states. Sherpa’s targeted market of large, complex clients has a total available market of 450 counties, 300 cities, 49 states and 600 state agencies as of December 31, 2019. There are 280 K-12 opportunities, which Sherpa pursues selectively due to their unique requirements.
New Markets
There are additional verticals where Sherpa’s product applies, such as K-12, universities, and non-profits which may be considered for long-term growth.
Technology and Operations
Sherpa’s technology leverages Microsoft’s widely-used SQL Server, which is a relational database management system, and .NET software framework. The power of Sherpa’s application is derived from Sherpa’s investment in on-screen configuration, all of which is stored in the database, meaning code updates do not have client-specific features. Since each client has unique requirements which must be met due to statutory requirements or policy, Sherpa’s solution was built to be flexible enough to meet these requirements without code changes or client customizations. With Sherpa’s experience with multiple other budgeting systems, Sherpa’s product was built from the ground up with the specific focus on how to create outputs in an efficient manner. This means regardless of reporting solution, reports are fast and easy to create due to the strong design.
Sherpa’s technology infrastructure for hosted clients is provided by Amazon Web Services and is maintained by Sherpa’s partner at Smart Panda Labs. We have east coast and west coast hosting sites. Approximately half of Sherpa’s customer base is serviced on-premise. Budgeting is not mission critical, but Sherpa’s objective is to provide uninterrupted
19
service 24 hours per day and seven days a week, and Sherpa’s operations maintain extensive backup, security and disaster recovery procedures including recovery in 8 minute intervals.
Sherpa’s solutions are scalable and can be set up quickly for new clients. The average time to stand up a new environment is less than one day. Due to low incidences of system issues, most clients take upgrades only once per year, allowing them to complete their budget cycle uninterrupted.
Competition
Nearly every competitive request for proposals in the budget space will have ten or more bidders. Historically, very few are truly competitive across all scoring areas. Sherpa believes that the principal factors upon which its businesses compete are:
|
· |
Software capabilities — Sherpa’s software generally meets over 98% of requirements |
|
· |
Implementation team experience — Sherpa’s team members average 20 years of targeted experience |
|
· |
Support model — Sherpa’s clients have direct contact with Sherpa’s implementation team without a tiered support model |
|
· |
References — References are strong, with surveys resulting in a 9.9/10 average score |
|
· |
Price — Sherpa is generally in the 40th percentile in pricing among competitors for large to mid-sized clients |
Sherpa believes Sherpa competes favorably with respect to all of the above-listed factors. Sherpa’s main competitors are much larger than Sherpa and have an advantage in name recognition. However, Sherpa believes that in public sector budgeting most decision makers are focused on procuring the best possible product and rarely factor in company size once they are satisfied with the long-term prospects of the offering.
All of Sherpa’s prospective clients have preexisting financial and human resources solutions, meaning that Sherpa also faces competition with legacy product offerings. Companies such as SAP and Oracle have a substantial market share of financial and human resources software, which means they can up-sell their products, often without formal procurements. Sherpa has found, however, that most clients are not satisfied with enterprise resource planning budget products and are moving to best-in-breed for products such as budgeting, grants and procurement.
Sherpa’s primary competitors in the market vary by client size:
|
· |
Large, complex clients with over $2 billion in budget; competitors are larger, established companies such as Questica, Oracle, SAP and CGI. Integrators include Deloitte, Accenture for Oracle and SAP. |
|
· |
Mid-sized clients with between $500 million to $2 billion in budget; Questica and lower-priced integrators of expensive products such as Oracle or scaled-down offerings of the more expensive products. |
|
· |
Smaller clients with less than $500 million in budget: Sherpa does not currently compete in this space, but there is more competition at this level due to price sensitivity. |
Research and Development
Research and development is performed as part of Sherpa’s efforts to constantly improve our product. Our Research and Development expenditures were approximately $300,000 during each of the years ended December 31, 2019 and 2018.
20
Employees
As of December 31, 2019, Sherpa had 11 employees. Sherpa also employs independent contractors to support Sherpa’s hosting environments. Sherpa’s employees are not covered by any collective bargaining agreement and Sherpa has never experienced a work stoppage. Sherpa believes that its relations with its employees are good.
Facilities
Sherpa does not own or lease any facilities as of the date of this filing. Sherpa employees work remotely out of their homes or at co-working facilities.
Government Regulation
There are no current government regulations that negatively impact Sherpa’s business or ability to compete in its markets. However, there are regulations related to the Health Insurance Portability and Accountability Act of 1996 (HIPAA) and the Americans with Disabilities Act (ADA) that are relevant to Sherpa’s customers that could in the future necessitate changes to Sherpa’s products in order to be compliant, and if not addressed, could negatively impact Sherpa’s ability to compete for new business.
Legal Proceedings
There is no material litigation, arbitration or governmental proceeding currently pending against Sherpa or any members of its management team in their capacity as such.
Available Information
We file annual, quarterly and current reports, proxy statements and other information with the SEC. Our SEC filings are also available to the public on the internet at a website maintained by the SEC located at http://www.sec.gov.
Our website address is www.gtytechnology.com. Through our website, we make available, free of charge, the following documents as soon as reasonably practicable after they are electronically filed with, or furnished to, the SEC: our Annual Reports on Form 10-K; our proxy statements for our annual and special shareholder meetings; our Quarterly Reports on Form 10-Q; our Current Reports on Form 8-K; Forms 3, 4 and 5 and Schedules 13D; and amendments to those documents. The information contained on, or that may be accessed through, our website is not part of, and is not incorporated into, this Annual Report on Form 10-K.
RISK FACTORS
An investment in our securities involves a high degree of risk. You should carefully consider the risks described below before making an investment decision. Our business, prospects, financial condition, or operating results could be harmed by any of these risks, as well as other risks not currently known to us or that we currently consider immaterial. The trading price of our securities could decline due to any of these risks, and, as a result, you may lose all or part of your investment.
Risks Relating to Our Business and Industries
The ongoing integration of the business, management and operations of Bonfire, CityBase, eCivis, Open Counter, Questica and Sherpa may prove difficult, disrupt our business and operations, divert management attention and adversely affect the business and financial results of our consolidated company.
21
We completed the business combination in February 2019, which we believe will result in certain benefits and synergies, including our goal of establishing an efficiently integrated public sector SaaS company through our six operating subsidiaries which, together, we believe can offer solutions to North American state and local governments that may not otherwise be achievable by any one individual business on its own. However, our ability to realize these anticipated benefits depends on the successful integration of the six businesses. The consolidated company may fail to realize the anticipated benefits of the business combination for a variety of reasons, including the following:
|
· |
the inability to integrate the businesses in a timely and cost-efficient manner or do so without adversely impacting revenue, operations and cash flows; |
|
· |
the failure of our management team to successfully manage the consolidated business and operations; |
|
· |
expected synergies or operating efficiencies may fail to materialize in whole or part, or may not occur within expected time-frames; |
|
· |
the failure to successfully manage relationships with each company’s customers and their operating results and businesses generally (including the diversion of management time to react to new and unforeseen issues); |
|
· |
the failure or inability to timely and efficiently integrate and establish new sales forces without materially adversely impacting our relationships with customers; |
|
· |
the failure to accurately estimate the potential markets and market shares for the consolidated business’s products, the nature and extent of competitive responses to the business combination and the ability of the consolidated to achieve or exceed projected market growth rates; |
|
· |
the inability to attract key personnel or to retain key personnel with unique talents, expertise or background knowledge as a consequence of both voluntary and involuntary employment actions; |
|
· |
the failure to successfully advocate the benefits of the consolidated for existing and potential customers or general uncertainty regarding the value proposition of the combined entity or its products; |
|
· |
difficulties forecasting financial results; |
|
· |
failures in our financial reporting, including those resulting from system implementations in the context of the integration, our ability to report or forecast financial results of the consolidated and our inability to successfully discover and assess and integrate into our reporting system, any of which may adversely impact our ability to make timely and accurate filings with the SEC and other domestic and foreign governmental agencies; and |
|
· |
the potential that we are not yet fully aware of the risks and potential liabilities of any of Bonfire, CityBase, eCivis, Open Counter, Questica or Sherpa. |
The ongoing integration may result in additional and unforeseen expenses or delays, distract management from other revenue or acquisition opportunities, and increase the consolidated business’s expenses and working capital requirements, particularly in the short-term. If we are unable to successfully complete the integration of our businesses and operations in a timely manner, the anticipated benefits of the business combination may not be fully realized, or at all, or may take longer to realize than anticipated. Should any of the foregoing or other currently unanticipated risks arise, our business and results of operations may be materially adversely impacted.
Our goodwill and other long-lived assets are subject to potential impairment that could negatively impact our earnings.
A significant portion of our assets consists of goodwill and other long-lived assets, the carrying value of which may be reduced if we determine that those assets are impaired. As of December 31, 2019, we had $402.4 million of goodwill and net intangible assets, comprising approximately 93% of our total assets. If actual results differ from the assumptions and estimates used in our goodwill and long-lived asset valuation calculations, we could incur impairment charges, which could negatively impact our earnings.
22
During the 2019 Successor Period, we recognized a non-cash goodwill impairment charge of $32.2 million related to the Acquisition. The fair value of the goodwill related to the Acquisition continues to be sensitive to changes in projections for revenue growth rates and earnings. There are numerous risks that may cause the fair value to fall below its carrying amount and/or the value of long-lived assets to not be recoverable, which could lead to the measurement and recognition of goodwill and/or long-lived asset impairment. These risks include, but are not limited to, significant negative variances between actual and expected financial results, lowered expectations of future financial results, failure to realize anticipated synergies from acquisitions, adverse changes in the business climate, and the loss of key personnel. If we are not able to achieve projected performance levels, future impairments could be possible, which could negatively impact our earnings.
Certain liabilities resulting from acquisitions are estimated and could lead to a material impact on earnings.
Through our acquisition activities, we record liabilities for future contingent earnout payments that are settled in cash or through the issuance of common stock. The fair value of these liabilities is assessed on a quarterly basis and changes in assumptions used to determine the amount of the liability or a change in the fair value of our common stock could lead to an adjustment that may have a material impact, favorable or unfavorable, on our results of operations. For additional information regarding our contingent earnout liabilities, please see “Management’s Discussion and Analysis of Financial Condition and Results of Operations—Contractual Obligations” and Note 3 of our Financial Statements.
Without obtaining adequate capital funding or improving our financial performance, we may not be able to continue as a going concern.
As described in their audit report, our independent registered public accounting firm has included an explanatory paragraph that states we have incurred ongoing losses and that there is substantial doubt about our ability to continue as a going concern.
We are attempting to further expand our customer base; scale up our production of various products and increase revenues; however, our cash position may not be sufficient to support our daily operations through the next twelve months from the date of filing this Annual Report on Form 10-K. Our ability to continue as a going concern is dependent upon our ability to raise additional funds by way of a public or private offering and our ability to further generate sufficient revenues. While we believe in the viability of our platform and in our ability to raise additional funds by way of a public or private offering, debt financing or strategic alternative, there can be no assurances to that effect. If we cannot continue as a viable entity, our stockholders may lose some or all of their investment in us.
Our failure to generate sufficient cash flow from our business to make payments on our debt would adversely affect our business, financial condition and results of operations.
On February 14, 2020, the Company entered into an unsecured term loan credit facility that provides for borrowing of term loans in an aggregate principal amount of $12.0 million. The credit facility has a maturity date of twelve months from the borrowing date of the term loans. On the closing date, the Company fully drew on the credit facility, net of deferred issuance costs of $0.4 million. Our ability to make scheduled payments of the principal of, to pay interest on or to refinance the term loan credit facility and any additional debt obligations we may incur depends on our future performance, which is subject to economic, financial, competitive and other factors that may be beyond our control. Our business may not generate cash flow from operations in the future sufficient to service our debt and to make necessary capital expenditures. If we are unable to generate sufficient cash flow or if our results of operations cause us to fail to comply with our financial covenants, we may be required to take one or more actions, including refinancing our debt, significantly reducing expenses, renegotiating our debt covenants, restructuring our debt, selling assets or obtaining additional capital, each of which may be on terms that may be onerous, highly dilutive or disruptive to our business. Our ability to refinance our indebtedness will depend on the capital markets and our financial condition at such time. We may not be able to engage in any of these activities or engage in these activities on commercially reasonable or acceptable terms, which could result in a default on our obligations, including under the term loan credit facility.
23
The JOBS Act permits “emerging growth companies” like us to take advantage of certain exemptions from various reporting requirements applicable to other public companies that are not emerging growth companies.
We qualify as an “emerging growth company” as defined in Section 2(a)(19) of the Securities Act, as modified by the Jumpstart Our Business Startups Act of 2012, which we refer to as the “JOBS Act.” As such, we take advantage of certain exemptions from various reporting requirements applicable to other public companies that are not emerging growth companies for as long as we continue to be an emerging growth company, including (i) the exemption from the auditor attestation requirements with respect to internal control over financial reporting under Section 404 of the Sarbanes-Oxley Act, (ii) the exemptions from say-on-pay, say-on-frequency and say-on-golden parachute voting requirements and (iii) reduced disclosure obligations regarding executive compensation in our periodic reports and proxy statements. As a result, our stockholders may not have access to certain information they deem important. We had revenues during the fiscal year ended December 31, 2019 of approximately $36.4 million. We will remain an emerging growth company until the earliest of (i) the last day of the fiscal year (a) following November 1, 2021, the fifth anniversary of the GTY Cayman IPO, (b) in which we have total annual gross revenue of at least $1.07 billion or (c) in which we are deemed to be a large accelerated filer, which means the market value of our common stock that is held by non-affiliates exceeds $700 million as of the last business day of our prior second fiscal quarter, and (ii) the date on which we have issued more than $1.0 billion in non-convertible debt securities during the prior three-year period.
In addition, Section 107 of the JOBS Act also provides that an emerging growth company can take advantage of the exemption from complying with new or revised accounting standards provided in Section 7(a)(2)(B) of the Securities Act as long as we are an emerging growth company. An emerging growth company can therefore delay the adoption of certain accounting standards until those standards would otherwise apply to private companies. The JOBS Act provides that a company can elect to opt out of the extended transition period and comply with the requirements that apply to non-emerging growth companies, but any such election to opt out is irrevocable. We have elected not to opt out of such extended transition period, which means that when a standard is issued or revised and it has different application dates for public or private companies, we, as an emerging growth company, can adopt the new or revised standard at the time private companies adopt the new or revised standard. This may make comparison of our financial statements with another public company which is neither an emerging growth company nor an emerging growth company which has opted out of using the extended transition period difficult or impossible because of the potential differences in accounting standards used.
We cannot predict if investors will find our securities less attractive because we will rely on these exemptions. If some investors find our securities less attractive as a result, there may be a less active trading market for securities and our stock price may be more volatile.
We are a smaller reporting company (and may remain a smaller reporting company even after losing emerging growth company status), and any decision on our part to comply only with certain reduced or scaled reporting and disclosure requirements applicable to smaller companies could make our common stock less attractive to investors.
We are a smaller reporting company, and, for as long as we continue to be a smaller reporting company (which may be longer than we remain an emerging growth company), we may choose to take advantage of exemptions from various reporting requirements applicable to other public companies but not to “smaller reporting companies,” including but not limited to:
|
· |
not being required to have our independent registered public accounting firm audit our internal control over financial reporting under Section 404 of the Sarbanes-Oxley Act; |
|
· |
reduced disclosure obligations regarding executive compensation in our periodic reports and proxy statements; and |
|
· |
providing only two years of audited financial statements in our periodic reports and proxy statements. |
Our restated articles of organization designate the Business Litigation Session of the Superior Court of Suffolk County, Massachusetts as the sole and exclusive forum for certain types of actions and proceedings that may be initiated by our shareholders and the United States District Court in Boston as the sole and exclusive forum for any claim arising under the Securities Act, which could discourage lawsuits against us and our directors and officers.
Our restated articles of organization designate the Business Litigation Session of the Superior Court of Suffolk County, Massachusetts as the sole and exclusive forum for any derivative action or proceeding brought on our behalf, any
24
action asserting a claim for breach of a fiduciary duty owed by any of our directors, officers, employees or agents to us or our shareholders, any action asserting a claim arising pursuant to any provision of the Massachusetts Business Corporation Act, our articles of organization or our bylaws or any action asserting a claim governed by the internal affairs doctrine, in all cases subject to the court’s having personal jurisdiction over the indispensable parties named as defendants. Our restated articles of organization designate the United States District Court in Boston as the sole and exclusive forum for any claim arising under the Securities Act or any claim for which other courts do not have subject matter jurisdiction including, without limitation, any claim arising under the Exchange Act. This exclusive forum provision may limit the ability of our shareholders to bring a claim in a judicial forum that such shareholders find favorable for disputes with us or our directors or officers, which may discourage such lawsuits against us and our directors and officers. Alternatively, if the Business Litigation Session of the Superior Court of Suffolk County, Massachusetts, the United States District Court in Boston or a court outside of Massachusetts were to find this exclusive forum provision inapplicable to, or unenforceable in respect of, one or more of the specified types of actions or proceedings described above, we may incur additional costs associated with resolving such matters in other venues or jurisdictions, which could materially and adversely affect our business, financial condition, operating results, cash flows and prospects.
Software- & Technology-Related/Internet-Focused Risk Factors
Cyber-attacks and security vulnerabilities can disrupt our business and harm our competitive position.
Threats to IT security can take a variety of forms. Individuals and groups of hackers, and sophisticated organizations including state-sponsored organizations, may take steps that pose threats to our clients’ IT. They may develop and deploy malicious software to attack our products and services and gain access to our networks and data centers, or act in a coordinated manner to launch distributed denial of service or other coordinated attacks. Cyber threats are constantly evolving, thereby increasing the difficulty of detecting and successfully defending against them. Cyber threats can have cascading impacts that unfold with increasing speed across our internal networks and systems and those of our partners and clients. Breaches of our network or data security could disrupt the security of our internal systems and business applications, impair our ability to provide services to our clients and protect the privacy of our data, result in product development delays, compromise confidential or technical business information harming our competitive position, result in theft or misuse of our intellectual property or other assets, require us to allocate more resources to improve technologies, or otherwise adversely affect our business. Our business policies and internal security controls may not keep pace with these evolving threats.
Disclosure of personally identifiable information and/or other sensitive client data could result in liability and harm our reputation.
We store and process increasingly large amounts of personally identifiable and other confidential information of our clients. The continued occurrence of high-profile data breaches provides evidence of an external environment increasingly hostile to information security. Despite our efforts to improve security controls, it is possible that our security controls over personal data, our training of employees on data security, and other practices that we follow may not prevent the improper disclosure of client data that we store and manage. Disclosure of personally identifiable information and/or other sensitive client data could result in material liability and harm our reputation.
Data privacy is an evolving area of the law and our business may become subject to new and expanding regulations. Application of these new and changing laws to our business may increase risks and compliance costs.
Hosting services for some of our products and services are dependent upon the uninterrupted operation of data centers.
A material portion of our business is provided through software hosting services. These hosting services depend on the uninterrupted operation of data centers and the ability to protect computer equipment and information stored in these data centers against damage that may be caused by natural disaster, fire, power loss, telecommunications or Internet failure, acts of terrorism, unauthorized intrusion, computer viruses, and other similar damaging events. If any of our data centers were to become inoperable for an extended period, we might be unable to fulfill our contractual commitments. Although we take what we believe to be reasonable precautions against such occurrences, we can give no assurance that damaging
25
events such as these will not result in a prolonged interruption of our services, which could result in client dissatisfaction, loss of revenue, and damage to our business.
We run the risk of errors or defects with new products or enhancements to existing products.
Our software products and services are complex and may contain errors or defects, especially when first introduced or when new versions or enhancements are released. We cannot assure you that material defects and errors will not be found in the future. Any such defects could result in a loss of revenues, negative publicity or delay market acceptance. Our license and subscription agreements typically contain provisions designed to limit our exposure to potential liability. However, it is possible we may not always successfully negotiate such provisions in our client contracts or the limitation of liability provisions may not be effective due to existing or future federal, state, or local laws, ordinances, or judicial decisions. We cannot assure you that a successful claim could not be made or would not have a material adverse effect on our future operating results.
We must timely respond to technological changes to be competitive.
The market for our products is characterized by technological change, evolving industry standards in software technology, changes in client requirements, and frequent new product and service introductions and enhancements. The introduction of products and services embodying new technologies and the emergence of new industry standards can render existing products obsolete and unmarketable. As a result, our future success will depend, in part, upon our ability to enhance existing products and develop and introduce new products and services that keep pace with technological developments, satisfy increasingly sophisticated client requirements, and achieve market acceptance. We cannot assure you that we will successfully identify new product and service opportunities and develop and bring new products and services to market in a timely and cost-effective manner. The products, capabilities, or technologies developed by others could also render our products or technologies obsolete or noncompetitive. Our business may be adversely affected if they are unable to develop or acquire new software products or services or develop enhancements to existing products on a timely and cost-effective basis, or if such new products or services or enhancements do not achieve market acceptance.
We may be unable to protect our proprietary rights.
Many of our product and service offerings incorporate proprietary information, trade secrets, know-how, and other intellectual property rights. We rely on a combination of contracts, copyrights, and trade secret laws to establish and protect our proprietary rights in our technology. We cannot be certain that we have taken all appropriate steps to deter misappropriation of our intellectual property. There has also been significant litigation recently involving intellectual property rights. We may be a party to such litigation in the future to protect our proprietary information, trade secrets, know-how, and other intellectual property rights. We cannot assure you that third-parties will not assert infringement or misappropriation claims against one or more of the products or services with respect to current or future products or services. Any claims or litigation, with or without merit, could be time-consuming, costly, and a diversion to management. Any such claims and litigation could also cause product delivery delays, service interruptions or require us to enter into royalty or licensing arrangements. Such royalty or licensing arrangements, if required, may not be available on terms acceptable to us, if at all. Therefore, litigation to defend and enforce our intellectual property rights could have a material adverse effect on our business, regardless of the final outcome of such litigation.
Clients may elect to terminate our maintenance contracts and manage operations internally.
It is possible that our clients may elect to not renew maintenance contracts for our software, trying instead to maintain and operate the software themselves using their perpetual license rights (excluding software applications provided on a hosted or cloud basis). This could adversely affect our revenues and profits. Additionally, they may inadvertently allow our intellectual property or other information to fall into the hands of third-parties, including our competitors, which could adversely affect our business.
Material portions of our business require the Internet infrastructure to be further developed or adequately maintained.
Part of our future success depends on the use of the Internet as a means to access public information and perform transactions electronically. This in part requires the further development and maintenance of the Internet infrastructure. Among other things, this further development and maintenance will require a reliable network backbone with the necessary speed, data capacity, security, and timely development of complementary products for providing reliable Internet access and services. If this infrastructure fails to be further developed or be adequately maintained, our business would be harmed because users may not be able to access our government portals.
26
Security breaches or unauthorized access to payment information, including credit/debit card data, and/or personal information that we, or our service providers, store, process, use or transmit for our business may harm our reputation, cause service disruptions and adversely affect our business and results of operations.
A significant challenge to electronic commerce is the secure transmission of payment information and/or personal information over information technology networks and systems which process, transmit and store electronic information, and manage or support a variety of business processes. The collection, maintenance, use, disclosure, and disposal of payment information and personal information by our business is regulated at state and federal levels, and cybersecurity legislation, executive orders and reporting requirements continue to evolve and become more complex. Because we either directly or indirectly through service providers (i) provide the electronic transmission of sensitive and personal information released from and filed with various government entities and (ii) perform online payment and electronic check processing services, we face the risk of a security breach, whether through system attacks, hacking events, acts of vandalism or theft, malware, viruses, human errors, catastrophes or other unforeseen events that could lead to significant disruptions or compromises of information technology networks and systems or the unauthorized release or use of payment information or personal information. Additionally, vulnerabilities in the security of our own internal systems or those of our service providers could compromise the confidentiality of, or result in unauthorized access to, personal information of our employees.
We rely on encryption and authentication technology purchased or licensed from third parties to provide the security and authentication tools to effectively secure transmission of confidential information, including user credit/debit card information and banking data. Advances in computer capabilities, new discoveries in the field of cryptography, threats that evolve ahead of tools designed to counter them, or other developments may result in the breach or compromise of technology used by them to protect transaction data. Data breaches can also occur as a result of non-technical issues, such as so-called “social engineering,” where individuals are manipulated into divulging confidential or personal information.
Despite the various security measures that we have in place to protect payment and personal information from unauthorized disclosure and to comply with applicable laws and regulations, our information technology networks and systems and those of our third-party vendors and service providers cannot be made completely secure against security incidents. Even the most well protected information, networks, systems, and facilities remain vulnerable to security breaches or disruptions, because (i) the techniques used in such attempts are constantly evolving and generally are not recognized until launched against a target, and in some cases are designed not to be detected and, in fact, may not be detected for an extended period and (ii) the security methodologies, protocols, systems and procedures used for protection are implemented by humans at each level, and human errors may occur. Accordingly, we may be unable to anticipate these techniques or to implement adequate security barriers or other preventative measures, or if such measures are implemented, and even if appropriate training is conducted in support of such measures, human errors may still occur. It is impossible for us to entirely mitigate this risk. A party, whether internal or external, who is able to circumvent our security measures, or those of our service providers, could misappropriate information, including, but not limited to payment information and personal information, or cause interruptions or direct damage to our partners or our users.
Under payment card rules and our contracts with our credit card processors, if there is a breach of payment card information that we store, process, or transmit, we could be subject to fines. We could also be liable to partners for costs of investigation, notification, remediation and credit monitoring and for any damages to users under applicable laws or our partner contracts.
In addition, any noncompliance with privacy laws or a security breach involving the misappropriation, loss or other unauthorized access, use or disclosure of payment information or personal information, or other significant disruption involving our information technology networks and systems, or those of our service providers (whether or not caused by a breach of our contractual obligations or our negligence), may lead to negative publicity, impair our ability to conduct our business, subject us to private litigation and government investigations and enforcement actions and cause us to incur potentially significant liability, damages or remediation costs. It may also cause the governments with whom we contract to lose confidence in us, any of which may cause the termination or modification of our government contracts and impair our ability to win future contracts. Actual or anticipated attacks and risks affecting us, our service providers’ or our government partners’ environment may cause us to incur increasing costs, including costs to deploy additional personnel and protection technologies, to train employees, and to engage third-party security experts and consultants. Our insurance coverage may be insufficient to cover or protect against the costs, liabilities, and other adverse effects arising from a security breach or system disruption. If we fail to reasonably maintain the security of confidential information, we may also suffer significant reputational and financial losses and our results of operations, cash flows, financial condition and liquidity may be adversely affected.
27
We may be unable to integrate new technologies and industry standards effectively, which may adversely affect our business and results of operations.
Our future success will depend on our ability to enhance and improve the responsiveness, functionality, and features of our services in accordance with industry standards and to address the increasingly sophisticated technological needs of our customers on a cost-effective and timely basis. Our ability to remain competitive will depend, in part, on our ability to:
|
· |
Enhance and improve the responsiveness, functionality, and other features of the government services we offer; |
|
· |
Continue to develop our technical expertise; |
|
· |
Develop and introduce new services, applications, and technology to meet changing customer needs and preferences; and |
|
· |
Influence and respond to emerging industry standards and other technological changes in a timely and cost-effective manner. |
We cannot ensure that we will be successful in responding to the above technological and industry challenges in a timely and cost-effective manner. If we are unable to integrate new technologies and industry standards effectively, our business could be harmed.
Public Sector-Related Risk Factors
Selling products and services into the public sector poses unique challenges.
We derive substantially all of our revenues from sales of software and services to state, county, and city governments, utilities, tribal governments, other municipal agencies, and other public entities. We expect that sales to public sector clients will continue to account for substantially all of our revenues in the future. We face many risks and challenges associated with contracting with governmental entities, including:
|
· |
Resource limitations caused by budgetary constraints, which may provide for a termination of executed contracts due to a lack of future funding; |
|
· |
Long and complex sales cycles; |
|
· |
Contract payments at times being subject to achieving implementation milestones, and we may have differences with clients as to whether milestones have been achieved; |
|
· |
Political resistance to the concept of contracting with third-parties to provide IT solutions; |
|
· |
Legislative changes affecting a local government’s authority to contract with third-parties; |
|
· |
Varying bid procedures and internal processes for bid acceptance; and |
|
· |
Various other political factors, including changes in governmental administrations and personnel. |
Each of these risks is outside our control. If we fail to adequately adapt to these risks and uncertainties, our financial performance could be adversely affected.
A prolonged economic slowdown could harm our operations.
A prolonged economic slowdown or recession could reduce demand for our software products and services. Local and state governments may face financial pressures that could in turn affect our growth rate and profitability in the future. There is no assurance that local and state spending levels will be unaffected by declining or stagnant general economic conditions, and if budget shortfalls occur, they may negatively impact local and state IT spending and could adversely affect our business.
28
The open bidding process creates uncertainty in predicting future contract awards.
Many governmental agencies purchase products and services through an open bidding process. Generally, a governmental entity will publish an established list of requirements requesting potential vendors to propose solutions for the established requirements. To respond successfully to these requests for proposals, we must accurately estimate their cost structure for servicing a proposed contract, the time required to establish operations for the proposed client, and the likely terms of any other third-party proposals submitted. We cannot guarantee that we will win any bids in the future through the request for proposal process, or that any winning bids will ultimately result in contracts on favorable terms. Our failure to secure contracts through the open bidding process, or to secure such contracts on favorable terms, may adversely affect our revenue and gross margins.
We face significant competition from other vendors and potential new entrants into our markets.
We face competition from a variety of software vendors that offer products and services similar to those offered by us, as well as from companies offering to develop custom software. We compete based on a number of factors, including
|
· |
The breadth, depth, and quality of our product and service offerings; |
|
· |
The ability to modify our offerings to accommodate particular clients’ needs; |
|
· |
Technological innovation; and |
|
· |
Name recognition, reputation and references. |
We believe the market is highly fragmented with a large number of competitors that vary in size, product platform, and product scope. Our competitors include consulting firms, publicly held companies that focus on selected segments of the public sector market, and a significant number of smaller, privately held companies. Certain competitors have greater technical, marketing, and financial resources than we do. We cannot assure you that such competitors will not develop products or offer services that are superior to our products or services or that achieve greater market acceptance.
We also compete with internal, centralized IT departments of governmental entities, which requires us to persuade the end-user to stop the internal service and outsource to us. In addition, our clients and prospective clients could elect to provide information management services internally through new or existing departments, which could reduce the market for our services.
We could face additional competition as other established and emerging companies enter the public sector software application market and new products and technologies are introduced. Increased competition could result in pricing pressure, fewer client orders, reduced gross margins, and loss of market share. Current and potential competitors may make strategic acquisitions or establish cooperative relationships among themselves or with third-parties, thereby increasing the ability of their products to address the needs of our prospective clients. It is possible that new competitors or alliances may emerge and rapidly gain significant market share. We cannot assure you that we will be able to compete successfully against current and future competitors, and the failure to do so would have a material adverse effect upon our business.
If we are unable to meet the unique challenges involved in contracting with governments and government agencies, our business may be harmed.
Our revenues are generated principally from contracts with state and local governments and government agencies, to provide digital government services on behalf of those government entities to complete transactions and distribute public information digitally. We face many risks uniquely associated with government contracting, including:
|
· |
Regulations that govern the fees they collect for many of our services, limiting their control over the level of transaction-based fees they are permitted to retain; |
|
· |
The potential need for governments to draft and adopt specific legislation before they can circulate a request for proposal (“RFP”) to which we can respond or before they can otherwise award a contract or provide a new digital service; |
29
|
· |
Unexpected changes in legislation that increase our costs or result in a temporary or permanent suspension of our services; |
|
· |
Changes to legislation authorizing government’s contracting with third parties to receive or distribute public information; |
|
· |
Long and complex sales cycles that vary significantly according to each government entity’s policies and procedures; |
|
· |
Political resistance to the concept of government agencies contracting with third parties to receive or distribute public information, which has been offered traditionally only by the government agencies and often without charge; |
|
· |
Changes in government administrations that could impact existing RFPs, rebids, renewals or extensions; and |
|
· |
Government budget deficits and appropriation approval processes and periods, either of which could cause governments to curtail spending on services, including time and materials-based fees for application development or fixed fees for portal management. |
Our ability to grow revenues may be limited by the number of governments and government agencies that choose to provide digital government solutions such as those offered by us.
Our revenues are generated principally from contracts with state and local governments and government agencies to provide digital government solutions on behalf of those government entities to complete transactions and distribute public information digitally. The growth in our revenues largely will depend on government entities adopting solutions such as those offered by us. We cannot ensure that government entities will choose to provide digital government services or continue to provide digital government services at current levels, or that they will provide such services with private assistance or by adopting solutions such as those offered by us. The failure to secure contracts with certain government agencies could result in revenue levels insufficient to support our operations on a self-sustained, profitable basis.
We are subject to independent audits as requested by our government customers. Deficiencies in our performance under a government contract could result in contract termination, reputational damage, or financial penalties.
Each government entity with which we contract for outsourced portal services may have the authority to require an independent audit of our performance and financial management of contracted operations. The scope of audits could include inspections of income statements, balance sheets, fee structures, collections practices, service levels, security practices, and our compliance with contract provisions and applicable laws, regulations, and standards. The expansion of our operations into new markets and services may further expose us to requirements and potential liabilities under additional statutes and rules that have previously not been relevant to our business. We cannot ensure that a future audit will not find any material performance deficiencies that would result in an adjustment to our revenues and result in financial penalties. Moreover, any consequent negative publicity could harm our reputation among other governments with which we would like to contract. These factors could harm our business, results of operations, cash flows, and financial condition.
Risks Relating to Public Companies, Generally
Fluctuations in quarterly revenue could adversely impact our operating results and stock price.
Our revenues and operating results are difficult to predict and may fluctuate substantially from quarter to quarter for a variety of reasons, including:
|
· |
Prospective clients’ contracting decisions are often made in the last few weeks of a quarter; |
|
· |
The size of license transactions can vary significantly; |
|
· |
Clients may unexpectedly postpone or cancel procurement processes due to changes in strategic priorities, project objectives, budget, or personnel; |
30
|
· |
Client purchasing processes vary significantly and a client’s internal approval, expenditure authorization, and contract negotiation processes can be difficult and time consuming to complete, even after selection of a vendor; |
|
· |
The number, timing, and significance of software product enhancements and new software product announcements by us and our competitors may affect purchase decisions; |
|
· |
We may have to defer revenues under our revenue recognition policies; and |
|
· |
Clients may elect subscription-based arrangements, which result in lower software license revenues in the initial year as compared to traditional, on-premise software license arrangements, but generate higher overall subscription-based revenues over the term of the contract. |
In each fiscal quarter, our expense levels, operating costs, and hiring plans are based to some extent on projections of future revenues and are relatively fixed. If our actual revenues fall below expectations, we could experience a reduction in operating results. Also, if actual revenues or earnings for any given quarter fall below expectations, it may lead to a decline in our stock price.
Increases in service revenue as a percentage of total revenues could decrease overall margins.
We realize lower margins on service revenues than on software subscription or license revenue. The majority of our contracts include both software and professional services. Therefore, an increase in the percentage of professional service revenue compared to license revenue could have a detrimental impact on our overall gross margins and could adversely affect operating results.
Our stock price may be volatile.
The market price of our common stock may be volatile. Examples of factors that may significantly impact our stock price include:
|
· |
Actual or anticipated fluctuations in our operating results; |
|
· |
Announcements of technological innovations, new products, or new contracts by us or our competitors; |
|
· |
Developments with respect to patents, copyrights, or other proprietary rights; |
|
· |
Conditions and trends in the software and other technology industries; |
|
· |
Adoption of new accounting standards affecting the software industry; |
|
· |
Changes in financial estimates by securities analysts; and |
|
· |
General market conditions and other factors. |
In addition, the stock market has from time to time experienced significant price and volume fluctuations that have particularly affected the market prices of technology company stocks and may in the future adversely affect the market price of our stock. Sometimes, securities class action litigation is filed following periods of volatility in the market price of a particular company’s securities. We cannot assure you that similar litigation will not occur in the future with respect to us. Such litigation could result in substantial costs and a diversion of management’s attention and resources, which could have a material adverse effect upon our financial performance.
Future sales of shares by existing stockholders could cause our stock price to decline.
Sales of a substantial number of shares of our common stock in the public market could occur at any time. These sales, or the perception in the market that the holders of a large number of shares of common stock intend to sell shares, could reduce the market price of our common stock. A significant number of our shares became free of resale restrictions on February 19, 2020, which was the date one year from the business combination. The presence of these additional shares of common stock trading in the public market may have an adverse effect on the market price of our securities.
31
Exercise of warrants for common stock would increase the number of shares eligible for future resale in the public market and result in dilution to our stockholders.
As of December 31, 2019, we had warrants to purchase 27,093,334 shares of common stock outstanding. Each whole warrant is exercisable to purchase one share of common stock at $11.50 per share. While our warrants are currently substantially “underwater,” to the extent such warrants are exercised, additional shares of common stock will be issued, which will result in dilution to the then-existing holders of common stock and increase the number of shares eligible for resale in the public market. Sales of substantial numbers of such shares in the public market could adversely affect the market price of our common stock.
Our financial outlook may not be realized.
From time to time, in press releases and otherwise, we may publish forecasts or other forward-looking statements regarding our results, including estimated revenues or earnings. Any forecast of our future performance reflects various assumptions. These assumptions are subject to significant uncertainties, and as a matter of course, any number of them may prove to be incorrect. Further, the achievement of any forecast depends on numerous risks and other factors (including those described in this discussion), many of which are beyond our control. As a result, we cannot be certain that our performance will be consistent with any management forecasts or that the variation from such forecasts will not be material and adverse. Current and potential stockholders are cautioned not to base their entire analysis of our business and prospects upon isolated predictions, but instead are encouraged to utilize our entire publicly available mix of historical and forward-looking information, as well as other available information regarding us, our products and services, and the software industry when evaluating our prospective results of operations.
Compliance with changing regulation of corporate governance, public disclosure and other regulatory requirements or industry standards may result in additional expenses.
Changing laws, regulations, and standards relating to corporate governance, public disclosure and other regulatory requirements or industry standards, including the Dodd-Frank Wall Street Reform and Consumer Protection Act of 2010, the Sarbanes-Oxley Act of 2002, the Tax Cuts and Jobs Act, new SEC regulations and the Nasdaq Stock Market rules create uncertainty for public companies such as ours. These laws, regulations, and standards are subject to varying interpretations in many cases due to their lack of specificity, and as a result, their application in practice may evolve over time as new guidance is provided by regulatory and governing bodies, which could result in continuing uncertainty regarding compliance matters and higher costs necessitated by ongoing revisions to disclosure and governance practices. We are committed to maintaining adequate and appropriate standards of corporate governance and public disclosure. As a result, our efforts to comply with evolving laws, regulations, and standards have resulted in, and certain regulations could continue to result in, increased general and administrative expenses and a diversion of management time and attention from revenue-generating activities to compliance activities. Further, because of increasing regulation, our board members and executive officers could face an increased risk of personal liability in connection with the performance of their duties. As a result, we may have difficulty attracting and retaining qualified board members and executive officers, which could harm our business. If our efforts to comply with new or changed laws, regulations, and standards differ from the activities intended by regulatory or governing bodies due to ambiguities in the laws themselves or related to practice, our reputation may be harmed.
Our quarterly results of operations may be volatile and difficult to predict. If our quarterly results of operations, future growth, profitability or dividends fail to meet the expectations of public market analysts or investors, the market price of our common stock may decrease significantly.
Our future revenues and results of operations may vary significantly from quarter to quarter due to a number of factors, many of which are outside of our control, and any of which may harm our business. These factors include:
|
· |
the commencement, completion, or termination of contracts during any quarter; |
|
· |
the introduction of new services by us or our competitors; |
|
· |
technical difficulties or system downtime affecting the operation of our services; |
|
· |
the amount and timing of operating costs and capital expenditures relating to the expansion of our business operations and infrastructure; |
32
|
· |
unexpected changes in federal, state and local legislation that increase our costs and/or result in a temporary or permanent decrease in our revenues; |
|
· |
any federal government shutdown, such as the shutdown which commenced in December 2018, each of which impacts the ability of our customers to purchase our products and services; |
|
· |
the seasonal use of some of our services, particularly the payment of real estate taxes; |
|
· |
changes in economic conditions; |
|
· |
the result of negative cash flows due to capital investments; and |
|
· |
significant charges related to acquisitions. |
Due to the factors noted above and the other factors described in these Risk Factors, our financial performance in a quarter may be lower than we anticipate and if we are unable to reduce spending in that quarter, our results of operations for that quarter may be harmed. One should not rely on quarter-to-quarter comparisons of our results of operations as an indication of future performance. It is possible that in some future periods our results of operations may be below the expectations of public market analysts and investors. If this occurs, the price of our common stock may decline. In addition, if we fail to meet expectations related to future growth, profitability, dividends or other market expectations, the price of our common stock may decline.
Each operating subsidiary’s management and independent registered public accounting firm have previously identified internal control deficiencies, which such management and independent registered public accounting firms believe constitute material weaknesses. If we fail to establish and maintain effective internal control over financial reporting in the future, our ability to timely and accurately report our financial results could be adversely affected.
Each of our operating subsidiaries was previously a private company not subject to the rules of the SEC implementing Section 404 of the Sarbanes-Oxley Act and, therefore, was not required to make a formal assessment of the effectiveness of its internal control over financial reporting. We are required to comply with the SEC’s rules implementing Sections 302 and 404 of the Sarbanes-Oxley Act, which require management to certify financial and other information in quarterly and annual reports and provide an annual management report on the effectiveness of internal control over financial reporting.
Although our operating subsidiaries have not made assessments of the effectiveness of their internal control over financial reporting and did not engage their independent registered public accounting firms to conduct audits of their internal control over financial reporting, in connection with the audits of the their financial statements included in this Annual Report on Form 10-K, each operating subsidiary’s management and independent registered public accounting firm identified one or more material weaknesses relating to such subsidiary’s internal control over financial reporting under standards established by the Public Company Accounting Oversight Board, or PCAOB. The PCAOB defines a material weakness as a deficiency, or a combination of deficiencies, in internal control over financial reporting such that there is a reasonable possibility that a material misstatement of a company’s annual or interim financial statements will not be prevented or detected on a timely basis. A deficiency in internal control exists when the design or operation of a control does not allow management or employees, in the normal course of performing their assigned functions, to prevent or detect misstatements on a timely basis. A significant deficiency is a deficiency, or a combination of deficiencies, in internal control over financial reporting that is less severe than a material weakness, yet important enough to merit attention by those responsible for oversight of a company’s financial reporting.
The material weaknesses identified by the operating subsidiaries and their independent registered public accounting firms included: (i) deficiencies in Bonfire’s period end financial statement close process, (ii) each of CityBase’s, eCivis’s, Open Counter’s and Sherpa’s limited segregation of duties with regard to financial reporting activities such as payroll entry and processing due to the size of their respective accounting departments and (iii) deficiencies in Questica’s period end financial statement close process resulting from, among other things, the preparation of its financial statements included in this Annual Report on Form 10-K which have a different fiscal year end than its historical fiscal year end.
We believe that, as of December 31, 2019, we have remediated these material weaknesses and improved the effectiveness of our internal control over financial reporting by implementing additional controls related thereto.
The remediation efforts management took to address the previously identified material weaknesses include, but are not limited to, the following:
33
Implementation of specific policies and procedures with detailed instructions to the operating subsidiaries in order to adequately communicate the requirements around processes and controls;
Implementation of controls over manual journal entries and account reconciliations, including improving controls and procedures related to the timeliness and effectiveness of our review and approval procedures;
Expansion of our financial leadership team by adding employees and external consultants, each with the commensurate knowledge, experience, and training to properly support our financial reporting and accounting functions including overseeing that the first two items listed are timely and adequately implemented; and
Adoption of formal accounting policies related to non-routine complex transactions, such accounting for business combinations, revenue recognition, equity classification, deferred income taxes and derivative accounting.
There is no assurance that any measures we may take in the future will be sufficient to remediate the material weaknesses described above or to avoid potential future material weaknesses. If management fails to establish and maintain effective internal control over financial reporting and disclosure controls and procedures, we may not be able to produce timely and accurate financial statements and meet our SEC reporting obligations, which could result in sanctions by Nasdaq or the SEC. This could result in a loss of investor confidence and could lead to a decline in our stock price.
The impact of the coronavirus outbreak, or similar global health concerns, could negatively impact our operations, supply chain and customer base.
Our operations for certain of our products or services could be negatively impacted by the regional or global outbreak of illnesses, including coronavirus (COVID-19). Any quarantines, labor shortages or other disruptions to our operations, or those of our customers, may adversely impact our sales and operating results. In addition, a significant outbreak of epidemic, pandemic or contagious diseases in the human population could result in a widespread health crisis that could adversely affect the economies and financial markets of many countries, including those in which we operate, resulting in an economic downturn that could affect demand for our products and services. We are unable to accurately predict the possible future effect on the Company if coronavirus or another disease expands globally.
The information regarding the Company’s properties set forth in “Item 1. Business” above is incorporated by reference into this Item 2.
The information regarding the Company’s Legal Proceedings set forth in “Item 1. Business” above is incorporated by reference into this Item 3.
Item 4. Mine Safety Disclosures.
None.
Item 5. Market for Registrant’s Common Equity, Related Shareholder Matters and Issuer Purchases of Equity Securities.
Market Information
Our common stock trades on Nasdaq under the symbol “GTYH.”
Holders
At March 13, 2020, there were 167 holders of record of our common stock and 5 holders of record of our warrants.
34
Dividends
We have not paid any cash dividends on our common stock to date and GTY did not pay cash dividends prior to the consummation of the business combination. The payment of cash dividends in the future will be dependent upon our revenues and earnings, if any, capital requirements and general financial condition. The payment of any cash dividends will be within the discretion of our board of directors. In addition, our board of directors is not currently contemplating and does not anticipate declaring stock dividends in the foreseeable future.
Securities Authorized for Issuance Under Equity Compensation Plans
As of December 31, 2019, there were (i) 1,536,879 shares of common stock available for issuance pursuant to future awards under the GTY Technology Holdings Inc. 2019 Omnibus Incentive Plan (the “Incentive Plan”), (ii) 274,559 shares of common stock issuable upon exercise of outstanding stock options granted pursuant to the Incentive Plan at a weighted average exercise price of $2.14 per share and (iii) 3,278,324 restricted stock units granted pursuant to the Incentive Plan with a weighted average grant price of $6.55.
Performance Graph
The graph below compares the cumulative total return for GTY’s shares from February 20, 2019(the first day on which GTY’s shares began trading subsequent to the business combination) through December 31, 2019 with the comparable cumulative return of two indices: the Nasdaq Composite Index and the Nasdaq 100 Technology Sector Index. The graph assumes $100 invested on February 20, 2019 in each of GTY’s shares and the two indices presented.
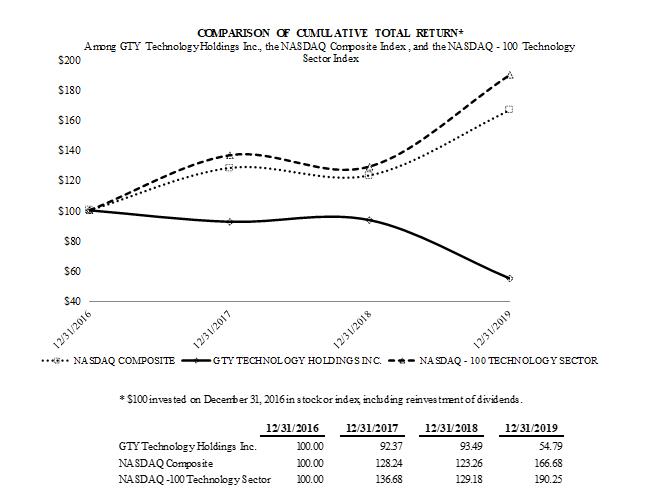
35
Recent Sales of Unregistered Securities; Use of Proceeds from Registered Offerings
Except as previously disclosed in our Quarterly Reports on Form 10-Q during 2019, we did not sell any securities that were not registered under the Securities Act during the period covered by this Annual Report on Form 10-K.
Item 6. Selected Financial Data.
The company qualifies as a smaller reporting company and is not required to provide the information required by this Item.
36
Item 7. Management’s Discussion and Analysis of Financial Condition and Results of Operations.
References to the “Company,” “our,” “us” or “we” refer to GTY Technology Holdings Inc. The following discussion and analysis should be read in conjunction with the consolidated financial statements and related notes included elsewhere in this Annual Report on Form 10-K. This discussion contains forward-looking statements reflecting our current expectations, estimates and assumptions concerning events and financial trends that may affect our future operating results or financial position. Actual results and the timing of events may differ materially from those contained in these forward-looking statements due to a number of factors, including those discussed in the sections entitled “Risk Factors” and “Forward-Looking Statements” appearing elsewhere in this Annual Report on Form 10-K.
Overview
We are a public sector company that offers a cloud-based suite of solutions primarily for North American state and local governments. Our six wholly-owned subsidiaries are Bonfire Interactive Ltd. (“Bonfire”), CityBase, Inc. (“CityBase”), eCivis, Inc. (“eCivis”), Open Counter Enterprises Inc. (“Open Counter”), Questica Inc. (“Questica”), and Sherpa Government Solutions (“Sherpa”). Through our operating subsidiaries, we serve some of the fastest growing segments in the government technology sector, including procurement, payments, grants management, permitting, and budgeting.
We were formed on August 11, 2016 for the purpose of effecting a merger, share exchange, asset acquisition, share purchase, reorganization or similar business combination with one or more businesses (the “business combination”). Until the business combination, we did not engage in any operations nor generate any revenues. We recognized an opportunity to replace costly legacy systems with scalable and efficient Software as a Service, or SaaS, products. Our search led to the acquisition (the “Acquisition”) of Bonfire, CityBase, eCivis, Open Counter, Questica, and Sherpa on February 19, 2019 (the “Closing Date”).
Our customers are primarily located in the United States and Canada, including counties, municipalities, special districts, law enforcement agencies and public-school districts. We plan to increase our customer base by leveraging our comprehensive product portfolio with our existing customer base, investing in direct sales to new customers, and utilizing partnerships with complementary products and services.
The Acquisition was accounted for as a business combination under GAAP and resulted in a change in accounting basis as of the date of the Acquisition. As a result, our consolidated financial statements for the period beginning on February 19, 2019 are presented on a different basis than that for the periods before February 19, 2019, and therefore are not comparable. As a result of the application of the acquisition method of accounting, our consolidated financial statements and certain presentations are separated into two distinct periods to indicate the different ownership and accounting basis between the periods presented: (i) the period before the consummation of the Acquisition, which includes the period from January 1, 2019 to the Closing Date (“2019 Predecessor Period”) and the year ended December 31, 2018 (the “2018 Predecessor Period”), and (ii) the periods on and after the consummation of the acquisition, which includes the period including and after the Closing Date to December 31, 2019 (“2019 Successor Period”).
Expansion and Further Penetration of Our Customer Base.
We employ a strategy that focuses on acquiring new customers and growing our relationships with existing customers over time. We believe significant opportunity exists for us to acquire new customers as well as expand the use of our platforms by selling additional products and increasing the number of users within our current customers’ organizations.
Investment in Growth.
We plan to continue to invest in our business so that we can capitalize on our market opportunity. We intend to continue to grow our sales and marketing team to acquire new customers and to increase sales to existing customers. We intend to continue to grow our research and development team to extend the functionality and range of our applications. We also intend to invest in new and improved IT solutions to support our business. However, we expect our sales and marketing expenses and research and development expenses as a percentage of revenues to decrease over time as we grow our revenues and gain economies of scale by increasing our customer base and increase sales to our existing customer base. We believe that these investments will contribute to our long-term growth, although they may adversely affect our profitability in the near term.
37
Leveraging Partnerships.
We plan to continue to strengthen and expand our relationships with technology vendors, professional services firms, and resellers. These relationships enable us to increase the speed of deployment and offer a wider range of integrated services to our customers. We intend to support these existing relationships, seek additional relationships and further expand our channel of resellers to help us increase our presence in existing markets and to expand into new markets. Our business and results of operations will be significantly affected by our success in leveraging and expanding these relationships.
Market Adoption of Our Platforms.
A key focus of our sales and marketing efforts is creating market awareness about the benefits of our cloud-based SaaS platforms. The market for SaaS solutions is less mature than the market for on-premise software applications, and potential customers may be slow or unwilling to migrate from their legacy solutions. Our business and operating results will be significantly affected by the degree to and speed with which organizations adopt our solutions.
Key Components of our Results of Operations
Revenues
Subscription, support and maintenance.
We provide software hosting services that provide customers with access to software related support and updates during the term of the arrangement. Revenues are recognized ratably over the contract term as the customer simultaneously receives and consumes the benefits of the subscription service. The first year of subscription fees are typically payable within 30 days after the execution of a contract, and thereafter upon renewal. We initially record subscription fees as contract liabilities and recognize revenues on a straight-line basis over the term of the agreement.
Our contracts may include variable consideration in the form of usage fees, which are included in the transaction price in the period in which the usage occurs and the fee is known.
Subscription, support and maintenance revenues also includes kiosk rentals and on-premise support or maintenance pertaining to license sales. Revenues from kiosk rentals and on-premise support are recognized on a straight-line basis over the support period.
Revenues from subscription, support and maintenance comprised approximately 67% of total revenues for the 2019 Successor Period.
Professional services.
Our professional services contracts generate revenues on a time and materials, fixed fee or subscription basis. Revenues are recognized as the services are rendered for time and materials contracts. Revenues are recognized when the milestones are achieved and accepted by the customer or on a proportional performance basis for fixed fee contracts. Revenues are recognized ratably over the contract term for subscription contracts. The milestone method for revenue recognition is used when there is substantive uncertainty at the date the contract is entered into whether the milestone will be achieved. Training revenues are recognized as the services are performed. Revenues from professional services comprised approximately 26% of total revenues for the 2019 Successor Period.
License.
Revenues from distinct licenses are recognized upfront when the software is made available to the customer, which normally coincides with contract execution, as this is when the customer has the risks and rewards of the right to use the software. Revenues from licenses comprised approximately 6% of total revenues for the 2019 Successor Period.
Asset sales.
Revenues from asset sales are recognized when the asset, typically a kiosk, has been received by the client and is fully operational and ready to accept transactions, which is when the customer obtains control and has the risks and rewards of the asset. Revenues from asset sales comprised less than 1% of total revenues for the 2019 Successor Period.
38
Cost of Revenues
Cost of revenues primarily consists of salaries and benefits of personnel relating to our hosting operations and support, implementation, and grants research. Cost of revenues includes data center costs including depreciation of the Company’s data center assets, third-party licensing costs, consulting fees, and the amortization of acquired technology from recent acquisitions.
Operating Expenses
Sales and marketing
Sales and marketing expenses consist primarily of personnel costs of our sales and marketing employees, including salaries, sales commissions and incentives and benefits, travel and related costs, outside consulting fees, marketing programs, including lead generation, and costs of advertising and trade shows. We defer sales commissions and amortize them ratably over the expected customer life. We expect sales and marketing expenses will increase as we expand our direct sales teams and increase sales through our strategic relationships and resellers.
Research and development
Research and development expenses consist primarily of salaries and benefits associated with our engineering, product and quality assurance personnel. Research and development expenses also include the cost of third-party contractors. Other than internal-use software development costs that qualify for capitalization, research and development costs are expensed as incurred. We expect research and development costs to increase as we develop new solutions and make improvements to our existing platforms.
General and administrative
General and administrative expenses consist primarily of salaries and benefits with our executive, finance, legal, human resources, compliance and other administrative personnel, accounting, auditing and legal professional services fees, recruitment costs, and other corporate-related expenses. We expect that general and administrative expenses will increase as we scale our business, but at a lower rate over time.
Results of Operations
We accounted for the Acquisition as a business combination, which resulted in a new basis of accounting. Refer to Note 3 of the notes to our consolidated financial statements for additional information. As a result of the Acquisition, our consolidated financial statements for the period after February 19, 2019 are presented on a different basis than that for the periods before February 19, 2019 due to the application of purchase accounting as of February 19, 2019 and, therefore, are not comparable.
The Acquisition resulted in the following principal impacts for the period subsequent to the Acquisition date:
|
· |
A reduction in revenues in the 2019 Successor Period as a result of the contract liabilities at the Acquisition date being recorded at fair value, an amount less than its then carrying value; |
|
· |
Increased amortization expense resulting from recording of intangible assets at fair value. We record amortization of acquired developed technology in cost of revenues, amortization of customer relationships in sales and marketing expenses, and amortization of covenants not to compete and tradename intangible assets in general and administrative expenses; |
|
· |
Contingent consideration issued as part of the Acquisition was recorded at fair value each period with changes in fair value recorded in general and administrative costs; and |
|
· |
Transaction costs were expensed as incurred as a separate line item in our consolidated statement of operations; |
39
We believe reviewing our operating results for the year ended December 31, 2019 by combining the results of the 2019 Predecessor Period and 2019 Successor Period (“S/P Combined Period”) is more useful in discussing our overall operating performance when compared to the 2018 Predecessor Period.
Successor/Predecessor (“S/P”) Combined Period Compared to the Year Ended December 31, 2018
Total revenues
Our total revenues for the S/P Combined Period increased on a year-over-year basis. This increase was driven by an increase in the number of customers, an increase in the number of users added by existing customers and an increase in the number of products purchased by existing customers. Our revenues for the S/P Combined Period were $36.4 million. Excluding the $4.1 million impact of purchase accounting and combining the results of the 2019 Predecessor Period and 2019 Successor Period, our total non-GAAP adjusted revenues for the year ended December 31, 2019 would have been $40.5 million compared to $29.8 million for the year ended December 31, 2018 on a comparable basis, representing a 36% increase. The change in revenues for each operating segment is due to the following (in thousands, except percentages):
|
|
|
|
|
|
|
|
|
|
|
|
Generally Accepted Accounting |
|
|
|
|
|
|
|
|
|
|
|
|
||||||
|
|
|
|
|
|
|
|
|
|
|
|
Principles (“GAAP”) |
|
Non-GAAP |
|
|||||||||||||||
|
|
|
February 19, |
|
January 01, |
|
|
|
|
|
|
|
|
|
|
|
|
|
|
|
|
|
|
|
|
|
|
|
||
|
|
|
2019 |
|
2019 |
|
|
|
|
|
|
|
|
|
|
|
|
|
|
|
|
|
|
|
|
|
|
|
||
|
|
|
through |
|
through |
|
Total S/P |
|
Total |
|
Increase / |
|
Increase / |
|
Total |
|
Total |
|
Increase / |
|
Increase / |
|
||||||||
|
|
|
December 30, |
|
February 18, |
|
Combined |
|
Revenues |
|
(Decrease) |
|
(Decrease) |
|
Revenues |
|
Revenues |
|
(Decrease) |
|
(Decrease) |
|
||||||||
|
|
|
2019 |
|
2019 |
|
2019 |
|
2018 |
|
in Dollars |
|
in % |
|
2019 |
|
2018 |
|
in Dollars |
|
in % |
|
||||||||
|
Bonfire |
|
$ |
3,863 |
|
$ |
593 |
|
$ |
4,456 |
|
$ |
3,190 |
|
$ |
1,266 |
|
40 |
% |
$ |
5,043 |
|
$ |
3,190 |
|
$ |
1,853 |
|
58 |
% |
|
CityBase |
|
|
7,122 |
|
|
820 |
|
|
7,942 |
|
|
6,773 |
|
|
1,169 |
|
17 |
% |
|
8,459 |
|
|
6,773 |
|
|
1,686 |
|
25 |
% |
|
eCivis |
|
|
4,742 |
|
|
673 |
|
|
5,415 |
|
|
4,951 |
|
|
464 |
|
9 |
% |
|
6,258 |
|
|
4,951 |
|
|
1,307 |
|
26 |
% |
|
Open Counter |
|
|
1,408 |
|
|
298 |
|
|
1,706 |
|
|
1,707 |
|
|
(1) |
|
(0) |
% |
|
2,154 |
|
|
1,707 |
|
|
447 |
|
26 |
% |
|
Questica |
|
|
10,005 |
|
|
1,913 |
|
|
11,918 |
|
|
10,099 |
|
|
1,819 |
|
18 |
% |
|
13,571 |
|
|
10,099 |
|
|
3,472 |
|
34 |
% |
|
Sherpa |
|
|
4,375 |
|
|
631 |
|
|
5,006 |
|
|
3,090 |
|
|
1,916 |
|
62 |
% |
|
5,062 |
|
|
3,090 |
|
|
1,972 |
|
64 |
% |
|
Total |
|
$ |
31,515 |
|
$ |
4,928 |
|
$ |
36,443 |
|
$ |
29,810 |
|
$ |
6,633 |
|
22 |
% |
$ |
40,547 |
|
$ |
29,810 |
|
$ |
10,737 |
|
36 |
% |
Bonfire’s and Open Counter’s revenues increased primarily due to an increase in subscription, support and maintenance revenues resulting from an increase in customers from the prior year. CityBase’s revenues increased primarily due to an increase in transaction volume and eCivis revenues increased primarily as a result of an increase in professional services. Sherpa’s and Questica’s revenues increased due primarily to an increase in professional services as well as an increase in subscription, support and maintenance revenues.
Total cost of revenues
Our total cost of revenues for the S/P Combined Period have increased on a year-over-year basis. The increase was driven by an increase in headcount in hosting operations and professional services, an increase in hosting costs due to customer expansion, and an increase in third-party product partnership costs. The change in cost of revenues for each operating segment is due to the following (in thousands, except percentages):
|
` |
|
February 19, |
|
January 01, |
|
|
|
|
|
|
|
|
|
|
|
|
||
|
|
|
2019 |
|
2019 |
|
|
|
|
Total Cost |
|
|
|
|
|
|
|||
|
|
|
Through |
|
through |
|
Total S/P |
|
of |
|
Increase / |
|
Increase / |
|
|||||
|
|
|
December 31, |
|
February 18, |
|
Combined |
|
Revenues |
|
(Decrease) |
|
(Decrease) |
|
|||||
|
|
|
2019 |
|
2019 |
|
2019 |
|
2018 |
|
in Dollars |
|
in % |
|
|||||
|
Bonfire |
|
$ |
1,003 |
|
$ |
124 |
|
$ |
1,127 |
|
$ |
809 |
|
$ |
318 |
|
39 |
% |
|
CityBase |
|
|
5,063 |
|
|
746 |
|
|
5,809 |
|
|
5,181 |
|
|
628 |
|
12 |
% |
|
eCivis |
|
|
1,744 |
|
|
267 |
|
|
2,011 |
|
|
1,732 |
|
|
279 |
|
16 |
% |
|
Open Counter |
|
|
367 |
|
|
51 |
|
|
418 |
|
|
498 |
|
|
(80) |
|
(16) |
% |
|
Questica |
|
|
2,375 |
|
|
296 |
|
|
2,671 |
|
|
1,746 |
|
|
925 |
|
53 |
% |
|
Sherpa |
|
|
1,376 |
|
|
130 |
|
|
1,506 |
|
|
429 |
|
|
1,077 |
|
251 |
% |
|
Total |
|
$ |
11,928 |
|
$ |
1,614 |
|
$ |
13,542 |
|
$ |
10,395 |
|
$ |
3,147 |
|
30 |
% |
Bonfire
Bonfire’s total cost of revenues increased primarily due to a $0.3 million increase in salaries and benefits driven by a 20% increase in average headcount from December 31, 2018 to December 31, 2019. The remaining increase was from additional hosting tools and services to support the higher number of customers supported on the platform.
40
CityBase
CityBase’s total cost of revenues increased primarily due to a $1.7 million increase in bank fees associated with its expansion in usage fee revenues and offset by a $0.9 million decrease in expenses incurred by third-party contractors and a $0.4 million decrease in the cost of kiosks sold.
eCivis
eCivis’ total cost of revenues for the S/P Combined Period increased primarily due to a $0.2 increase in expenses incurred by third-party contractors and a $0.1 million increase in salaries and benefits driven by 6% increase in average headcount from December 31, 2018 to December 31, 2019.
Open Counter
Open Counter’s total cost of revenues for the S/P Combined Period decreased slightly due to a decrease in expenses incurred by third-party contractors.
Questica
Questica’s total cost of revenues increased due primarily to a 29% increase in headcount from December 31, 2018 to December 31, 2019.
Sherpa
Sherpa’s total cost of revenues increased due primarily to an increase in professional services costs to support the increase in professional services revenues.
Operating expenses
Our total selling and marketing, general and administrative and research and development operating expenses for the S/P Combined Period have increased due primarily to increases in headcount in sales and marketing, general and administrative, and research and development resulting from growth in the business. The change in operating expenses for each operating segment is due to the following (in thousands, except percentages):
|
|
|
Year Ended December 31, |
|
|||||||||||||||
|
|
|
February 19, |
|
January 01, |
|
|
|
|
|
|
|
|
|
|
|
|
||
|
|
|
2019 |
|
2019 |
|
|
|
|
Total |
|
|
|
|
|
|
|||
|
|
|
Through |
|
through |
|
Total S/P |
|
Operating |
|
Increase / |
|
Increase / |
|
|||||
|
|
|
December 31, |
|
February 18, |
|
Combined |
|
Expenses |
|
(Decrease) |
|
(Decrease) |
|
|||||
|
|
|
2019 |
|
2019 |
|
2019 |
|
2018 |
|
in Dollars |
|
in % |
|
|||||
|
Bonfire |
|
$ |
10,249 |
|
$ |
1,210 |
|
$ |
11,459 |
|
$ |
7,100 |
|
$ |
4,359 |
|
61 |
% |
|
CityBase |
|
|
13,127 |
|
|
1,518 |
|
|
14,645 |
|
|
11,788 |
|
|
2,857 |
|
24 |
% |
|
eCivis |
|
|
4,752 |
|
|
575 |
|
|
5,327 |
|
|
4,030 |
|
|
1,297 |
|
32 |
% |
|
Open Counter |
|
|
2,162 |
|
|
202 |
|
|
2,364 |
|
|
1,385 |
|
|
979 |
|
71 |
% |
|
Questica |
|
|
6,761 |
|
|
1,034 |
|
|
7,795 |
|
|
6,696 |
|
|
1,099 |
|
16 |
% |
|
Sherpa |
|
|
1,604 |
|
|
147 |
|
|
1,751 |
|
|
1,671 |
|
|
80 |
|
5 |
% |
|
Corporate |
|
|
8,989 |
|
|
— |
|
|
8,989 |
|
|
— |
|
|
8,989 |
|
N/A |
|
|
Total |
|
$ |
47,644 |
|
$ |
4,686 |
|
$ |
52,330 |
|
$ |
32,670 |
|
$ |
19,660 |
|
60 |
% |
Bonfire
Bonfire’s total operating expense increased due to a 103% increase in sales and marketing, a 33% increase in general and administrative costs and a 28% increase in research and development. The increase in sales and marketing was primarily due to a $1.5 million increase in share-based compensation expense and a $1.1 million or 59% increase in salaries and benefits driven by a 50% increase in average headcount from December 31, 2018 to December 31, 2019. The increase in general and administrative expenses was primarily due to a $1.1 million increase in share-based compensation expense and a $0.2 million increase or 24% in salaries and benefits driven by a 17% increase in average headcount from December 31, 2018 to December 31, 2019. The increase in research and development expenses was primarily due to a $0.3 million or 20% increase in salaries and benefits driven by a 25% increase in average headcount from December 31, 2018 to December 31, 2019 and a $0.2 million increase in share-based compensation expense.
41
CityBase
CityBase’s total operating expense increased due to a 36% increase in research and development, a 67% increase in sales and marketing and offset by a 7% decrease in general and administrative costs. The increase in research and development was primarily due to a $1.2 million or 32% increase in salaries and benefits driven by a 60% increase in average headcount from December 31, 2018 to December 31, 2019. The increase in sales and marketing was primarily due to a $1.0 million or 104% increase in salaries and benefits driven by a 195% increase in average headcount from December 31, 2018 to December 31, 2019.
eCivis
eCivis’ total operating expense increased due to an 84% increase in sales and marketing and a 17% increase in research and development and was partially offset by a 5% decrease in general and administrative costs. The increase in sales and marketing was primarily due to a $0.7 million or 82% increase in salaries and benefits driven by a 58% increase in average headcount from December 31, 2018 to December 31, 2019, a $0.1 million increase in third-party consulting fees and a $0.1 million increase in commissions expense. The increase in research and development was primarily due to a $0.2 million or 19% increase in salaries and benefits driven by a 20% increase in average headcount from December 31, 2018 to December 31, 2019. The decrease in general and administrative costs was primarily due to a $0.2 million decrease in oversight costs at the company level post-Acquisition.
Open Counter
Open Counter’s total operating expense increased due primarily to a $0.8 million or 65% increase in salaries and benefits driven by a 58% increase in average headcount from December 31, 2018 to December 31, 2019.
Questica
Questica’s total operating expense increased due primarily to a 47% increase in average headcount in sales and marketing from December 31, 2018 to December 31, 2019.
Sherpa
Sherpa’s total operating expenses are materially consistent with the prior year.
Corporate
Corporate expenses primarily comprised of outside services including legal, accounting and consulting fees, payroll and related expenses, corporate insurance, and share-based compensation.
Other operating expenses
Acquisition costs consist primarily of Acquisition transaction costs, capital market advisory fees, and bonuses incurred as a result of the transaction or a change in control. Amortization of intangible assets consists of the amortization of finite lived intangibles resulting from the Acquisition as described in Note 3 of the notes to our consolidated financial statements included in this Annual Report on Form 10-K. Goodwill impairment expense includes any reduction in the fair value of Goodwill relative to its carrying value. The change in fair value of contingent consideration consists of any adjustments to the contingent consideration liability since the Acquisition.
Other income (expense)
Interest income during the S/P Combined Period was primarily due to the investments held by GTY during the 2019 Successor Period.
Reconciliation of Non-GAAP Revenues
To supplement our consolidated financial statements, which are prepared in accordance with U.S. generally accepted accounting principles, or GAAP, we have provided certain financial measures that have not been prepared in accordance with GAAP defined as “non-GAAP financial measures,” which include (i) non-GAAP revenues, (ii) non-GAAP gross profit and non-GAAP gross margin, (iii) and non-GAAP loss from operations.
42
We use these non-GAAP financial measures internally in analyzing our financial results and believe these metrics are useful to investors, as a supplement to the corresponding GAAP measure, in evaluating our ongoing operational performance and trends. However, it is important to note that particular items we exclude from, or include in, our non-GAAP financial measures may differ from the items excluded from, or included in, similar non-GAAP financial measures used by other companies in the same industry. Non-GAAP financial measures should not be considered in isolation from, or as a substitute for, financial information prepared in accordance with GAAP. Investors are encouraged to review the reconciliation of these non-GAAP financial measures to their most directly comparable GAAP financial measures.
Non-GAAP Revenues.
Non-GAAP revenues are defined as GAAP revenues adjusted for the impact of purchase accounting resulting from its business combination which reduced its acquired contract liabilities to fair value. The Company believes that presenting non-GAAP revenues is useful to investors as it eliminates the impact of the purchase accounting adjustments to revenues to allow for a direct comparison between current and future periods.
Non-GAAP Gross profit and Non-GAAP Gross margin.
Non-GAAP gross profit is defined as GAAP gross profit adjusted for the impact of purchase accounting resulting its business combination. Non-GAAP gross margin is defined as non-GAAP gross profit divided by non-GAAP revenues. The Company believes that presenting non-GAAP gross profit and margin is useful to investors as it eliminates the impact of the purchase accounting adjustments to allow for a direct comparison between periods.
Non-GAAP Loss from operations.
Non-GAAP loss from operations is defined as GAAP loss from operations adjusted for the impact of purchase accounting to revenues resulting from its business combination, the amortization of acquired intangible assets, share-based compensation, acquisition related costs, goodwill impairment expense, and the change in fair value of contingent consideration. The Company believes that presenting non-GAAP loss from operations is useful to investors as it eliminates the impact of certain non-cash and acquisition related expenses to allow a direct comparison of loss from operations between all periods presented.
43
Below is a reconciliation of non-GAAP revenues, Non-GAAP gross profit and Non-GAAP gross margin and Non-GAAP loss from operations to their most directly comparable GAAP financial measures (in thousands, except percentages):
|
|
|
Year Ended December 31, |
|
||||
|
|
|
2019 |
|
2018 |
|
||
|
Revenues - Successor Period |
|
$ |
31,515 |
|
$ |
— |
|
|
Revenues - Predecessor Period |
|
|
4,928 |
|
|
29,810 |
|
|
Pro forma as Adjusted Revenues |
|
|
36,443 |
|
|
29,810 |
|
|
Purchase accounting adjustment to revenue |
|
|
4,104 |
|
|
— |
|
|
Non-GAAP Pro forma as Adjusted Revenues |
|
$ |
40,547 |
|
$ |
29,810 |
|
|
|
|
|
|
|
|
|
|
|
Gross Profit - Successor Period |
|
$ |
19,587 |
|
$ |
— |
|
|
Gross Profit - Predecessor Period |
|
|
3,314 |
|
|
19,415 |
|
|
Pro forma as Adjusted Gross Profit |
|
|
22,901 |
|
|
19,415 |
|
|
Purchase accounting adjustment to revenue |
|
|
4,104 |
|
|
— |
|
|
Share-based compensation |
|
|
229 |
|
|
— |
|
|
Non-GAAP Pro forma as Adjusted Gross Profit |
|
$ |
27,234 |
|
$ |
19,415 |
|
|
|
|
|
|
|
|
|
|
|
Gross Margin - Successor Period |
|
|
62 |
% |
|
|
|
|
Gross Margin - Predecessor Period |
|
|
67 |
% |
|
65 |
% |
|
Pro forma as Adjusted Gross Margin |
|
|
63 |
% |
|
65 |
% |
|
Non-GAAP Pro forma as Adjusted Gross Margin |
|
|
67 |
% |
|
65 |
% |
|
|
|
|
|
|
|
|
|
|
Loss from operations - Successor Period |
|
$ |
(103,917) |
|
$ |
— |
|
|
Loss from operations - Predecessor Period |
|
|
(1,555) |
|
|
(15,614) |
|
|
Pro forma as Adjusted Loss from operations |
|
|
(105,472) |
|
|
(15,614) |
|
|
Purchase accounting adjustment to revenue |
|
|
4,104 |
|
|
— |
|
|
Amortization of intangibles |
|
|
12,841 |
|
|
395 |
|
|
Share-based compensation |
|
|
5,490 |
|
|
926 |
|
|
Acquisition costs |
|
|
37,139 |
|
|
1,964 |
|
|
Goodwill impairment expense |
|
|
32,198 |
|
|
— |
|
|
Change in fair value of contingent consideration |
|
|
(6,135) |
|
|
— |
|
|
Non-GAAP Pro forma as Adjusted Loss from operations |
|
$ |
(19,835) |
|
$ |
(12,329) |
|
Below is a reconciliation of non-GAAP revenues to revenues by operating segment (in thousands, except percentages):
|
|
|
Year Ended December 31, |
|
|||||||||||||||||||
|
|
|
|
|
|
|
|
|
|
|
|
Open |
|
|
|
|
|
|
|
Total |
|
||
|
|
|
Bonfire |
|
CityBase |
|
eCivis |
|
Counter |
|
Questica |
|
Sherpa |
|
Revenues |
|
|||||||
|
Pro forma Revenues - S/P combined Period 2019 |
|
$ |
4,456 |
|
$ |
7,942 |
|
$ |
5,415 |
|
$ |
1,706 |
|
$ |
11,918 |
|
$ |
5,006 |
|
$ |
36,443 |
|
|
Purchase accounting adjustment to revenues |
|
|
587 |
|
|
517 |
|
|
843 |
|
|
448 |
|
|
1,653 |
|
|
56 |
|
|
4,104 |
|
|
(Non-GAAP) Pro forma as Adjusted Revenues 2019 |
|
$ |
5,043 |
|
$ |
8,459 |
|
$ |
6,258 |
|
$ |
2,154 |
|
$ |
13,571 |
|
$ |
5,062 |
|
$ |
40,547 |
|
|
|
|
|
|
|
|
|
|
|
|
|
|
|
|
|
|
|
|
|
|
|
|
|
|
Predecessor Revenues 2018 |
|
$ |
3,190 |
|
$ |
6,773 |
|
$ |
4,951 |
|
$ |
1,707 |
|
$ |
10,099 |
|
$ |
3,090 |
|
$ |
29,810 |
|
|
|
|
|
|
|
|
|
|
|
|
|
|
|
|
|
|
|
|
|
|
|
|
|
|
% change |
|
|
58 |
% |
|
25 |
% |
|
26 |
% |
|
26 |
% |
|
34 |
% |
|
64 |
% |
|
36 |
% |
Liquidity and Capital Resources
As of December 31, 2019, we had a cash balance of approximately $8.4 million. Through December 31, 2019, our liquidity needs were satisfied through proceeds from our initial public offering and funds held in the Trust Account (see Note 11-Shareholders’ Equity-to the consolidated financial statements contained in this Annual Report on Form 10-K), proceeds from the PIPE Transaction (as defined below), and proceeds from our June 2019 registered direct offering.
44
Our consolidated financial statements have been prepared assuming that we will continue as a going concern, which contemplates continuity of operations, realization of assets, and liquidation of liabilities in the normal course of business.
As reflected in the consolidated financial statements, we had an accumulated deficit of approximately $85.0 million at December 31, 2019, a net loss of approximately $95.7 million and approximately $57.2 million net cash used in operating activities for the successor period from February 19, 2019 through December 31, 2019. These factors raise substantial doubt about our ability to continue as a going concern.
We are attempting to further expand its customer base; scale up its production of various products; and increase revenues; however, our cash position may not be sufficient to support our daily operations through the next twelve months from the date of filing this 10-Q. Our ability to continue as a going concern is dependent upon our ability to raise additional funds by way of a public or private offering and its ability to further generate sufficient revenues. While we believe in the viability of its platform and in our ability to raise additional funds by way of a public or private offering, there can be no assurances to that effect.
PIPE Transaction
Immediately prior to the closing of the business combination (the “Closing”), pursuant to subscription agreements (the “Subscription Agreements”), dated as of various dates from January 9, 2019 through February 12, 2019, by and among GTY Cayman and certain institutional and accredited investors party thereto (the “Subscribed Investors”), GTY Cayman issued to the Subscribed Investors an aggregate of 12,853,098 Class A ordinary shares of GTY for $10.00 per share, for an aggregate cash purchase price of approximately $126.3 million, including three such Subscription Agreements with certain CityBase holders (including Michael Duffy, the chief executive officer of CityBase) for an aggregate of 380,937 Class A ordinary shares of GTY Cayman at a price of $10.00 per share, for an aggregate cash purchase price of approximately $3.8 million (the “PIPE Transaction”). The Class A ordinary shares of GTY Cayman issued to the Subscribed Investors were cancelled and exchanged on a one-for-one basis for shares of Company common stock at the Closing.
Historical Cash Flows
The following table sets forth a summary of our cash flows for the periods indicated (amounts in thousands):
|
|
|
Successor |
|
|
Predecessor |
|||||
|
|
|
February 19, 2019 |
|
|
January 1, 2019 |
|
January 1, 2018 |
|||
|
|
|
through |
|
|
through |
|
through |
|||
|
|
|
December 30, |
|
|
February 18, |
|
December 30, |
|||
|
|
|
2019 |
|
|
2019 |
|
2018 |
|||
|
Net cash (used in) provided by operating activities |
|
$ |
(57,230) |
|
|
$ |
284 |
|
$ |
(8,900) |
|
Net cash provided by investing activities |
|
$ |
36,787 |
|
|
$ |
1,517 |
|
$ |
35 |
|
Net cash provided by (used in) financing activities |
|
$ |
28,561 |
|
|
$ |
(540) |
|
$ |
10,348 |
Net Cash (Used in) Provided by Activities
Our net loss and cash flows from operating activities are significantly influenced by the Acquisition and our investments in headcount and infrastructure to support anticipated growth.
For the Successor Period, net cash used in operations was $57.2 million resulting from our net loss of $95.7 million and offset by changes in operating assets and liabilities of $1.1 million and net non-cash expenses of $37.3 million. The $37.3 million of non-cash expenses was comprised of a $32.2 million goodwill impairment charge, $12.8 million of amortization of intangible assets acquired as a result of the Acquisition and $5.4 million from share-based compensation offset by $8.6 million of deferred tax benefits related to the tax and book basis difference on the amortization of intangible assets and $6.1 million benefit from the change in fair value of contingent consideration.
For the Predecessor Period, net cash provided by operations was $0.3 million resulting from our changes in operating assets and liabilities of $1.6 million and net non-cash expenses of $0.4 million offset by our net loss of $1.7 million. The $1.6 million of net cash flows provided as a result of changes in our operating assets and liabilities was primarily due to a $2.2 million decrease in accounts receivable resulting from seasonality in billings and offset by a $0.7 million decrease in contract and other long-term liabilities. The $0.4 million of non-cash expenses was primarily comprised of $0.2 million of depreciation of property and equipment.
45
For the year ended December 31, 2018, net cash used in operations was $8.9 million resulting from our net loss of $16.5 million and offset by changes in operating assets and liabilities of $3.9 million and net non-cash expenses of $3.7 million. The $3.9 million of net cash flows provided as a result of changes in our operating assets and liabilities was due to a $3.1 million increase in accounts payable and accrued liabilities and a $2.0 million increase in contract and other long-term liabilities offset by a $0.7 million increase in prepaid expenses and a $0.4 million increase in accounts receivable. The $3.7 million of non-cash expenses was primarily comprised of $1.4 million of the change in fair value of notes payable converted to stock, $0.9 million of share-based compensation, and $0.6 million of depreciation of property and equipment.
Net Cash Provided by Investing Activities
Our primary investing activities have consisted of investments in marketable securities and capital expenditures. In February 2019, we completed our Acquisition and the resulting cash flow impact is described below in the Successor Period.
For the Successor Period, cash provided by investing activities was $36.8 million resulting from $217.6 million of proceeds from cash held in a trust and offset primarily due to the Acquisition which had a cash purchase price of $179.4 million net of cash acquired and $1.4 million of capital expenditures and capitalization of internal-use software.
For the Predecessor Period, cash provided by investing activities was $1.5 million due to a $1.5 million sale of marketable securities by Questica.
For the year ended December 31, 2018, there was no material change in cash provided by investing activities.
Net Cash Provided By (Used in) Financing Activities
For the Successor Period, cash provided by financing activities was $28.6 million primarily as a result of the private placement of Class A shares of $125.3 million and proceeds received from the successful registered direct offering of common stock of $25.5 million, net of costs and offset primarily by the redemption of shares in the amount of $114.0 million and $4.2 million of common stock repurchases.
For the Predecessor Period, cash used in financing activities was $0.5 million primarily as a result of member distributions of $0.5 million.
For the year ended December 31, 2018, cash provided by financing activities was $10.3 million primarily as a result of $10.0 million of issuances of predecessor preferred shares and $6.3 million of proceeds from borrowings and offset by $3.5 of repayments of borrowings and $0.9 million of dividends.
Critical Accounting Policies and Use of Estimates
See Note 3 of the notes to our consolidated financial statements.
Recent Accounting Pronouncements
The impact of recently issued accounting standards is set forth in Note 3, Summary of Significant Accounting Policies, of the notes to our consolidated financial statements included elsewhere in this Annual Report on Form 10-K.
Off-Balance Sheet Arrangements
We are not party to any off-balance sheet transactions. Other than the guarantees described in Note 11, we have no guarantees or obligations other than those which arise out of normal business operations.
46
Contractual Obligations
Our principal commitments consist primarily of obligations under operating and financing leases, which include among others, our offices and leased kiosks. The following table summarizes our commitments to settle contractual obligations in cash as of December 31, 2019:
|
|
|
|
|
|
Payment Due by Period |
||||||||||||||||
|
|
|
|
Total |
|
|
2020 |
|
|
2021 |
|
|
2022 |
|
|
2023 |
|
|
2024 |
|
|
Thereafter |
|
Operating lease obligations |
|
$ |
7,456 |
|
$ |
1,867 |
|
$ |
1,655 |
|
$ |
785 |
|
$ |
372 |
|
$ |
357 |
|
$ |
2,420 |
|
Finance lease obligations (including interest) |
|
|
1,607 |
|
|
714 |
|
|
680 |
|
|
212 |
|
|
1 |
|
|
— |
|
|
— |
As of December 31, 2019, we also had contingent obligations in the form of potential earnout payments to individuals associated with each of Bonfire, CityBase, eCivis, Questica and Sherpa. See Note 3 of the Financial Statements for additional information regarding the accounting treatment of such contingent obligations.
Individuals associated with Bonfire may receive, based on Bonfire’s revenues and EBIT for the fiscal years ended December 31, 2019 and 2020, respectively, earnout payments up to $5.0 million for each of the fiscal years ended December 31, 2019 and December 31, 2020, payable 50% in cash and 50% in our common stock. The aggregate earnout payments shall not exceed $10.0 million. For the year ended December 31, 2019, individuals associated with Bonfire will not receive any payments associated with the earnout.
Individuals associated with CityBase may receive, upon CityBase’s trailing twelve-month net revenue exceeding $37.0 million, or the CityBase threshold, on or prior to December 31, 2048, an earnout payment equal to a number of shares (or, in the case of certain individuals associated with CityBase who are not accredited investors, the cash value thereof) of our common stock calculated by dividing $60 million by: (i) $10.00 if the CityBase threshold is met on or prior to December 31, 2021 or (ii) the greater of (x) $10.00 or (y) the volume-weighted average closing price for the shares of our common stock for the 30 trading days immediately preceding the payment date if the CityBase threshold is met after December 31, 2021.
Individuals associated with eCivis may receive, based on eCivis’ achievement of certain “tiers” of revenues and EBITDA for the year ending December 31, 2020, an earnout payment equal to a number of shares of our common stock determined by dividing (x) either $10.0 million, $20.0 million, $30.0 million, $40.0 million or $50.0 million (depending on the “tier” of revenues and EBITDA achieved) by (y) $10.00.
As of December 31, 2019, 1,000,000 Class B shares of Questica Exchangeco became eligible to be converted into 1,550,338 Class A shares of Questica Exchangeco when Questica’s aggregate revenue and aggregate EBIT for the year ended December 31, 2019 was greater than the aggregate revenue and aggregate EBIT for year ended December 31, 2018. The 1,550,338 Class A shares of Questica Exchangeco are convertible, at the option of the holder, into shares of our common stock on a one-to-one basis.
As of December 31, 2019, we became obligated to issue 336,965 of our common stock to individuals associated with Sherpa in satisfaction of an earnout obligation. The earnout obligation was triggered by Sherpa’s aggregate revenues for the year ended December 31, 2019 exceeding Sherpa’s aggregate revenues for the year ended December 31, 2018. Once the 336,965 shares are issued, the Company will no longer have any contingent obligations in respect of Sherpa.
Off-Balance Sheet Arrangements
As of December 31, 2019 and 2018, the Company did not have any off-balance sheet arrangements as defined in Item 303(a)(4)(ii) of Regulation S-K and did not have any commitments or contractual obligations
JOBS Act
On April 5, 2012, the Jumpstart GTY’s Business Startups Act of 2012 (the “JOBS Act”) was signed into law. The JOBS Act contains provisions that, among other things, relax certain reporting requirements for qualifying public companies. We qualify as an “emerging growth company” and under the JOBS Act are allowed to comply with new or revised accounting pronouncements based on the effective date for private (not publicly traded) companies. We are electing to delay the adoption of new or revised accounting standards, and as a result, we may not comply with new or revised
47
accounting standards on the relevant dates on which adoption of such standards is required for non-emerging growth companies. As such, GTY’s consolidated financial statements may not be comparable to companies that comply with public company effective dates. We will remain an emerging growth company until the earliest of (i) the last day of the fiscal year (a) following November 1, 2021, the fifth anniversary of the GTY Cayman IPO, (b) in which we have total annual gross revenue of at least $1.07 billion or (c) in which we are deemed to be a large accelerated filer, which means the market value of our common stock that is held by non-affiliates exceeds $700 million as of the last business day of our prior second fiscal quarter, and (ii) the date on which we have issued more than $1.0 billion in non-convertible debt securities during the prior three-year period.
Item 7A. Quantitative and Qualitative Disclosures About Market Risk.
The company qualifies as a smaller reporting company and is not required to provide the information required by this Item.
48
Item 8. Financial Statements and Supplementary Data.
Index to Consolidated Financial Statements
49
Report of Independent Registered Public Accounting Firm
To the Board of Directors and Shareholders of
GTY Technology Holdings Inc.
Opinion on the Consolidated Financial Statements
We have audited the accompanying consolidated balance sheets of GTY Technology Holdings, Inc. (the "Company") as of December 31, 2019 and 2018, the related consolidated statements of operations, changes in shareholders’ equity and cash flows for the years then ended and the related consolidated notes (collectively referred to as the "consolidated financial statements"). In our opinion, the consolidated financial statements present fairly, in all material respects, the financial position of the Company as of December 31, 2019 and 2018, and the results of its consolidated operations and its cash flows for the years then ended, in conformity with accounting principles generally accepted in the United States of America.
Substantial Doubt Regarding Going Concern
The accompanying consolidated financial statements have been prepared assuming that the Company will continue as a going concern. As discussed in Note 2 to the consolidated financial statements, the Company has suffered losses from operations and has an accumulated deficit that raise substantial doubt about its ability to continue as a going concern. Management's plans in regard to these matters are also described in Note 2. The consolidated financial statements do not include any adjustments that might result from the outcome of this uncertainty.
Basis for Opinion
These consolidated financial statements are the responsibility of the Company's management. Our responsibility is to express an opinion on the Company's consolidated financial statements based on our audits. We are a public accounting firm registered with the Public Company Accounting Oversight Board (United States) ("PCAOB") and are required to be independent with respect to the Company in accordance with the U.S. federal securities laws and the applicable rules and regulations of the Securities and Exchange Commission and the PCAOB.
We conducted our audits in accordance with the standards of the PCAOB. Those standards require that we plan and perform the audit to obtain reasonable assurance about whether the consolidated financial statements are free of material misstatement, whether due to error or fraud. The Company is not required to have, nor were we engaged to perform, an audit of its internal control over financial reporting. As part of our audits we are required to obtain an understanding of internal control over financial reporting but not for the purpose of expressing an opinion on the effectiveness of the Company’s internal control over financial reporting. Accordingly, we express no such opinion.
Our audits included performing procedures to assess the risks of material misstatement of the consolidated financial statements, whether due to error or fraud, and performing procedures that respond to those risks. Such procedures included examining, on a test basis, evidence regarding the amounts and disclosures in the consolidated financial statements. Our audits also included evaluating the accounting principles used and significant estimates made by management, as well as evaluating the overall presentation of the consolidated financial statements. We believe that our audits provide a reasonable basis for our opinion.
|
/s/ WithumSmith+Brown, PC |
|
|
|
|
|
We have served as the Company's auditor since 2016 |
|
|
|
|
|
Whippany, New Jersey |
|
|
March 13, 2020 |
|
F-1
GTY TECHNOLOGY HOLDINGS INC.
(Amounts in thousands, except share and per share amounts)
|
|
|
Successor |
|
|
Predecessor |
||
|
|
|
December 31, |
|
|
December 31, |
||
|
|
|
2019 |
|
|
2018 |
||
|
Assets |
|
|
|
|
|
|
|
|
Current assets: |
|
|
|
|
|
|
|
|
Cash and cash equivalents |
|
$ |
8,374 |
|
|
$ |
13,217 |
|
Investments |
|
|
— |
|
|
|
1,398 |
|
Accounts receivable, net |
|
|
9,184 |
|
|
|
5,988 |
|
Prepaid expenses and other current assets |
|
|
3,047 |
|
|
|
1,250 |
|
Total current assets |
|
|
20,605 |
|
|
|
21,853 |
|
|
|
|
|
|
|
|
|
|
Property and equipment, net |
|
|
3,185 |
|
|
|
1,124 |
|
Right of use assets |
|
|
5,876 |
|
|
|
— |
|
Loan receivable - related party |
|
|
— |
|
|
|
177 |
|
Intangible assets, net |
|
|
115,788 |
|
|
|
1,564 |
|
Goodwill |
|
|
286,635 |
|
|
|
2,518 |
|
Other assets |
|
|
2,304 |
|
|
|
2,332 |
|
Total assets |
|
$ |
434,393 |
|
|
$ |
29,568 |
|
|
|
|
|
|
|
|
|
|
Liabilities, Temporary Equity and Shareholders’ Equity (Deficit) |
|
|
|
|
|
|
|
|
Current liabilities: |
|
|
|
|
|
|
|
|
Accounts payable and accrued expenses |
|
$ |
8,443 |
|
|
$ |
5,969 |
|
Contract liabilities - current portion |
|
|
17,346 |
|
|
|
11,732 |
|
Warrant liability |
|
|
— |
|
|
|
87 |
|
Financing lease obligations - current portion |
|
|
555 |
|
|
|
138 |
|
Lease liability - current portion |
|
|
1,851 |
|
|
|
— |
|
Contingent consideration - current portion |
|
|
12,680 |
|
|
|
— |
|
Notes payable |
|
|
— |
|
|
|
450 |
|
Total current liabilities |
|
|
40,875 |
|
|
|
18,376 |
|
|
|
|
|
|
|
|
|
|
Contract and other long-term liabilities |
|
|
1,264 |
|
|
|
3,215 |
|
Deferred rent |
|
|
— |
|
|
|
62 |
|
Long-term debt, less current portion |
|
|
— |
|
|
|
433 |
|
Deferred tax liability |
|
|
20,276 |
|
|
|
— |
|
Financing lease obligations - less current portion |
|
|
811 |
|
|
|
268 |
|
Lease liability - less current portion |
|
|
4,311 |
|
|
|
— |
|
Contingent consideration - less current portion |
|
|
41,233 |
|
|
|
2,092 |
|
Total liabilities |
|
|
108,770 |
|
|
|
24,446 |
|
|
|
|
|
|
|
|
|
|
Commitments and contingencies |
|
|
|
|
|
|
|
|
|
|
|
|
|
|
|
|
|
Preferred stock |
|
|
— |
|
|
|
42,264 |
|
|
|
|
|
|
|
|
|
|
Shareholders’ equity (deficit): |
|
|
|
|
|
|
|
|
Common stock, par value $0.0001; 400,000,000 shares authorized; 52,920,228 shares issued and 52,303,862 shares outstanding as of December 31, 2019, net of treasury stock |
|
|
5 |
|
|
|
— |
|
Exchangeable shares, no par value, 5,568,096 shares issued and outstanding as of December 31, 2019 |
|
|
45,681 |
|
|
|
— |
|
Acquired Companies' common stock |
|
|
— |
|
|
|
148 |
|
Additional paid in capital |
|
|
369,756 |
|
|
|
7,835 |
|
Accumulated other comprehensive income (loss) |
|
|
370 |
|
|
|
(174) |
|
Treasury stock, at cost, 616,366 shares as of December 31, 2019 |
|
|
(5,174) |
|
|
|
— |
|
Accumulated deficit |
|
|
(85,015) |
|
|
|
(44,951) |
|
Total shareholders' equity (deficit) |
|
|
325,623 |
|
|
|
(37,142) |
|
Total liabilities, temporary equity and shareholders’ equity (deficit) |
|
$ |
434,393 |
|
|
$ |
29,568 |
The accompanying notes are an integral part of these consolidated financial statements.
F-2
GTY TECHNOLOGY HOLDINGS INC.
CONSOLIDATED STATEMENTS OF OPERATIONS
(Amounts in thousands, except share and per share amounts)
|
|
|
Successor |
|
|
Predecessor |
|||||
|
|
|
February 19, |
|
|
January 1, |
|
|
|
||
|
|
|
2019 |
|
|
2019 |
|
|
|
||
|
|
|
through |
|
|
through |
|
Year Ended |
|||
|
|
|
December 31, |
|
|
February 18, |
|
December 31, |
|||
|
|
|
2019 |
|
|
2019 |
|
2018 |
|||
|
Revenues |
|
$ |
31,515 |
|
|
$ |
4,928 |
|
$ |
29,810 |
|
Cost of revenues |
|
|
11,928 |
|
|
|
1,614 |
|
|
10,395 |
|
Gross Profit |
|
|
19,587 |
|
|
|
3,314 |
|
|
19,415 |
|
|
|
|
|
|
|
|
|
|
|
|
|
Operating expenses |
|
|
|
|
|
|
|
|
|
|
|
Sales and marketing |
|
|
13,088 |
|
|
|
1,394 |
|
|
8,386 |
|
General and administrative |
|
|
23,010 |
|
|
|
1,712 |
|
|
14,327 |
|
Research and development |
|
|
11,546 |
|
|
|
1,580 |
|
|
9,957 |
|
Amortization of intangible assets |
|
|
12,809 |
|
|
|
32 |
|
|
395 |
|
Acquisition costs |
|
|
36,988 |
|
|
|
151 |
|
|
1,964 |
|
Goodwill impairment expense |
|
|
32,198 |
|
|
|
— |
|
|
— |
|
Change in fair value of contingent consideration |
|
|
(6,135) |
|
|
|
— |
|
|
— |
|
Total operating expenses |
|
|
123,504 |
|
|
|
4,869 |
|
|
35,029 |
|
Loss from operations |
|
|
(103,917) |
|
|
|
(1,555) |
|
|
(15,614) |
|
|
|
|
|
|
|
|
|
|
|
|
|
Other income (expense) |
|
|
|
|
|
|
|
|
|
|
|
Interest income (expense) |
|
|
225 |
|
|
|
(170) |
|
|
(506) |
|
Loss from repurchase of shares |
|
|
(1,032) |
|
|
|
— |
|
|
— |
|
Other income (loss) |
|
|
472 |
|
|
|
12 |
|
|
377 |
|
Total other expense, net |
|
|
(335) |
|
|
|
(158) |
|
|
(129) |
|
|
|
|
|
|
|
|
|
|
|
|
|
Net loss before income taxes |
|
|
(104,252) |
|
|
|
(1,713) |
|
|
(15,743) |
|
Benefit from (provision for) income taxes |
|
|
8,595 |
|
|
|
— |
|
|
(777) |
|
Net loss |
|
|
(95,657) |
|
|
|
(1,713) |
|
|
(16,520) |
|
|
|
|
|
|
|
|
|
|
|
|
|
Other comprehensive loss: |
|
|
|
|
|
|
|
|
|
|
|
Foreign currency translation gain |
|
|
370 |
|
|
|
— |
|
|
— |
|
Total other comprehensive loss |
|
|
370 |
|
|
|
— |
|
|
— |
|
Comprehensive loss |
|
$ |
(95,287) |
|
|
$ |
(1,713) |
|
$ |
(16,520) |
|
|
|
|
|
|
|
|
|
|
|
|
|
Net loss |
|
$ |
(95,657) |
|
|
$ |
(1,713) |
|
$ |
(16,520) |
|
|
|
|
|
|
|
|
|
|
|
|
|
Cumulative preferred stock dividends |
|
|
— |
|
|
|
— |
|
|
(1,421) |
|
Deemed dividend for Exchangeable Shares - Series C |
|
|
(183) |
|
|
|
— |
|
|
— |
|
Deemed dividend on Series Seed preferred stock |
|
|
— |
|
|
|
— |
|
|
(37) |
|
Net loss applicable to common shareholders |
|
$ |
(95,840) |
|
|
$ |
(1,713) |
|
$ |
(17,978) |
|
|
|
|
|
|
|
|
|
|
|
|
|
Net loss per share, basic and diluted |
|
$ |
(1.88) |
|
|
|
|
|
|
|
|
Weighted average common shares outstanding, basic and diluted |
|
|
50,867,302 |
|
|
|
|
|
|
|
The accompanying notes are an integral part of these consolidated financial statements.
F-3
GTY TECHNOLOGY HOLDINGS INC.
CONSOLIDATED STATEMENTS OF CHANGES IN SHAREHOLDERS’ EQUITY
(Amounts in thousands, except share and per share amounts)
Year Ended December 31, 2019
|
|
|
|
|
|
|
|
|
|
|
|
|
|
|
|
|
|
|
|
|
|
|
|
|
|
|
|
|
|
|
|
Accumulated |
|
Total |
||
|
|
|
|
|
|
|
|
|
|
|
|
|
|
|
|
|
|
|
|
|
|
|
Additional |
|
|
|
|
|
|
|
Other |
|
Shareholders’ |
|||
|
|
|
Common Stock |
|
Class A |
|
Class B |
|
Exchangeable Shares |
|
Paid in |
|
Treasury |
|
Accumulated |
|
Comprehensive |
|
Equity |
|||||||||||||||||
|
Successor |
|
Shares |
|
Amount |
|
Shares |
|
Amount |
|
Shares |
|
Amount |
|
Shares |
|
Amount |
|
Capital |
|
Stock |
|
Deficit |
|
Loss |
|
(Deficit) |
|||||||||
|
Balance - December 31, 2018 |
|
— |
|
$ |
— |
|
898,984 |
|
$ |
— |
|
13,568,821 |
|
$ |
1 |
|
— |
|
$ |
— |
|
$ |
— |
|
$ |
— |
|
$ |
9,920 |
|
$ |
— |
|
$ |
9,921 |
|
Net loss |
|
— |
|
|
— |
|
— |
|
|
— |
|
— |
|
|
— |
|
— |
|
|
— |
|
|
— |
|
|
— |
|
|
(95,657) |
|
|
|
|
|
(95,657) |
|
Ordinary shares no longer subject to possible redemption |
|
— |
|
|
— |
|
9,216,438 |
|
|
1 |
|
— |
|
|
— |
|
— |
|
|
— |
|
|
88,190 |
|
|
— |
|
|
722 |
|
|
— |
|
|
88,913 |
|
Private placement of Class A shares, net of costs |
|
|
|
|
|
|
12,863,098 |
|
|
2 |
|
— |
|
|
— |
|
— |
|
|
— |
|
|
125,256 |
|
|
— |
|
|
— |
|
|
— |
|
|
125,258 |
|
Exchange of shares in GTY Merger |
|
36,547,341 |
|
|
4 |
|
(22,978,520) |
|
|
(3) |
|
(13,568,821) |
|
|
(1) |
|
— |
|
|
— |
|
|
— |
|
|
— |
|
|
— |
|
|
— |
|
|
— |
|
Common Stock issued for acquisitions |
|
11,969,004 |
|
|
1 |
|
— |
|
|
— |
|
— |
|
|
— |
|
— |
|
|
— |
|
|
119,688 |
|
|
— |
|
|
— |
|
|
— |
|
|
119,689 |
|
Shares convertible into Common Stock issued for acquisitions |
|
— |
|
|
— |
|
— |
|
|
— |
|
— |
|
|
— |
|
5,761,741 |
|
|
47,617 |
|
|
— |
|
|
— |
|
|
— |
|
|
— |
|
|
47,617 |
|
Common Stock issued for Exchangeable Shares - Class C |
|
500,000 |
|
|
— |
|
— |
|
|
— |
|
— |
|
|
— |
|
— |
|
|
— |
|
|
3,860 |
|
|
— |
|
|
— |
|
|
— |
|
|
3,860 |
|
Share-based compensation |
|
— |
|
|
— |
|
— |
|
|
— |
|
— |
|
|
— |
|
— |
|
|
— |
|
|
5,429 |
|
|
— |
|
|
— |
|
|
— |
|
|
5,429 |
|
Private placement of Common Stock, net of costs |
|
3,500,000 |
|
|
— |
|
— |
|
|
— |
|
— |
|
|
— |
|
— |
|
|
— |
|
|
25,450 |
|
|
— |
|
|
— |
|
|
— |
|
|
25,450 |
|
Common stock repurchases |
|
(616,366) |
|
|
— |
|
— |
|
|
— |
|
— |
|
|
— |
|
— |
|
|
— |
|
|
— |
|
|
(5,174) |
|
|
— |
|
|
— |
|
|
(5,174) |
|
Stock option exercises |
|
112,643 |
|
|
— |
|
— |
|
|
— |
|
— |
|
|
— |
|
— |
|
|
— |
|
|
130 |
|
|
— |
|
|
— |
|
|
— |
|
|
130 |
|
Vesting of restricted stock units |
|
97,595 |
|
|
— |
|
— |
|
|
— |
|
— |
|
|
— |
|
— |
|
|
— |
|
|
— |
|
|
— |
|
|
— |
|
|
— |
|
|
— |
|
Exchangeable shares converted to Common Stock |
|
193,645 |
|
|
— |
|
— |
|
|
— |
|
— |
|
|
— |
|
(193,645) |
|
|
(1,936) |
|
|
1,936 |
|
|
— |
|
|
— |
|
|
— |
|
|
— |
|
Foreign currency translation gain |
|
— |
|
|
— |
|
— |
|
|
— |
|
— |
|
|
— |
|
— |
|
|
— |
|
|
— |
|
|
— |
|
|
— |
|
|
370 |
|
|
370 |
|
Deemed dividend for Exchangeable Shares - Class C |
|
— |
|
|
— |
|
— |
|
|
— |
|
— |
|
|
— |
|
— |
|
|
— |
|
|
(183) |
|
|
— |
|
|
— |
|
|
— |
|
|
(183) |
|
Balance - December 31, 2019 |
|
52,303,862 |
|
$ |
5 |
|
— |
|
$ |
— |
|
— |
|
$ |
— |
|
5,568,096 |
|
$ |
45,681 |
|
$ |
369,756 |
|
$ |
(5,174) |
|
$ |
(85,015) |
|
$ |
370 |
|
$ |
325,623 |
F-4
GTY TECHNOLOGY HOLDINGS INC.
CONSOLIDATED STATEMENTS OF CHANGES IN SHAREHOLDERS’ EQUITY – CONTINUED
(Amounts in thousands, except share and per share amounts)
Predecessor from December 31, 2018 to February 18, 2019
|
|
|
|
|
Predecessor |
|
|
Balance as of December 31, 2018 |
|
|
|
$ |
(37,142) |
|
Net loss |
|
|
|
|
(1,713) |
|
Share-based compensation |
|
|
|
|
61 |
|
Stock option exercises |
|
|
|
|
13 |
|
Shareholders'/Members' equity activity |
|
|
|
|
5,629 |
|
Balance as of February 18, 2019 |
|
|
|
$ |
(33,152) |
Predecessor from December 31, 2017 to December 31, 2018
|
|
|
|
|
Predecessor |
|
|
Balance as of December 31, 2017 |
|
|
|
$ |
(18,613) |
|
Net loss |
|
|
|
|
(16,520) |
|
Share-based compensation |
|
|
|
|
926 |
|
Stock option exercises |
|
|
|
|
113 |
|
Shareholders'/Members' equity activity |
|
|
|
|
(2,982) |
|
Other |
|
|
|
|
(66) |
|
Balance as of December 31, 2018 |
|
|
|
$ |
(37,142) |
The accompanying notes are an integral part of these consolidated financial statements.
F-5
GTY TECHNOLOGY HOLDINGS INC.
CONSOLIDATED STATEMENTS OF CASH FLOWS
(Amounts in thousands)
|
|
|
Successor |
|
|
Predecessor |
|||||
|
|
|
February 19, |
|
|
January 1, |
|
|
|
||
|
|
|
2019 |
|
|
2019 |
|
|
|
||
|
|
|
through |
|
|
through |
|
Year Ended |
|||
|
|
|
December 31, |
|
|
February 18, |
|
December 31, |
|||
|
|
|
2019 |
|
|
2019 |
|
2018 |
|||
|
Cash flows from operating activities: |
|
|
|
|
|
|
|
|
|
|
|
Net loss |
|
$ |
(95,657) |
|
|
$ |
(1,713) |
|
$ |
(16,520) |
|
Adjustments to reconcile net loss to net cash provided by (used in) operating activities: |
|
|
|
|
|
|
|
|
|
|
|
Depreciation of property and equipment |
|
|
480 |
|
|
|
177 |
|
|
603 |
|
Amortization of intangible assets |
|
|
12,809 |
|
|
|
32 |
|
|
395 |
|
Amortization of right of use assets |
|
|
1,173 |
|
|
|
165 |
|
|
— |
|
Share-based compensation |
|
|
5,429 |
|
|
|
61 |
|
|
926 |
|
Deferred income tax benefit |
|
|
(8,595) |
|
|
|
— |
|
|
43 |
|
Bad debt expense |
|
|
(49) |
|
|
|
6 |
|
|
39 |
|
Loss on disposal of property and equipment |
|
|
2 |
|
|
|
— |
|
|
3 |
|
Foreign exchange loss on payment of vested options |
|
|
21 |
|
|
|
— |
|
|
(189) |
|
Goodwill impairment expense |
|
|
32,198 |
|
|
|
— |
|
|
— |
|
Change in fair value of contingent consideration |
|
|
(6,135) |
|
|
|
(37) |
|
|
220 |
|
Change in fair value of warrant liability |
|
|
— |
|
|
|
(18) |
|
|
178 |
|
Gain on sale of marketable securities |
|
|
— |
|
|
|
— |
|
|
(3) |
|
Accrual of Paid In Kind interest |
|
|
— |
|
|
|
— |
|
|
12 |
|
Repayments of Paid In Kind interest |
|
|
— |
|
|
|
— |
|
|
(23) |
|
Change in fair value of notes payable converted to stock |
|
|
— |
|
|
|
— |
|
|
1,387 |
|
Interest expense from notes payable converted to stock |
|
|
— |
|
|
|
— |
|
|
160 |
|
Other |
|
|
— |
|
|
|
— |
|
|
(21) |
|
Changes in operating assets and liabilities: |
|
|
|
|
|
|
|
|
|
|
|
Accounts receivable |
|
|
(5,276) |
|
|
|
2,190 |
|
|
(439) |
|
Prepaid expenses and other assets |
|
|
(1,536) |
|
|
|
202 |
|
|
(714) |
|
Accounts payable and accrued liabilities |
|
|
(1,000) |
|
|
|
(58) |
|
|
3,075 |
|
Contract and other long-term liabilities |
|
|
9,985 |
|
|
|
(723) |
|
|
1,975 |
|
Lease liabilities |
|
|
(1,079) |
|
|
|
— |
|
|
(7) |
|
Net cash (used in) provided by operating activities |
|
|
(57,230) |
|
|
|
284 |
|
|
(8,900) |
|
|
|
|
|
|
|
|
|
|
|
|
|
Cash flows from investing activities: |
|
|
|
|
|
|
|
|
|
|
|
Proceeds from cash held in trust |
|
|
217,642 |
|
|
|
— |
|
|
— |
|
Proceeds from sale/disposal of property and equipment |
|
|
— |
|
|
|
1 |
|
|
16 |
|
Purchase of marketable securities |
|
|
— |
|
|
|
— |
|
|
(749) |
|
Proceeds from related party loan |
|
|
— |
|
|
|
— |
|
|
(25) |
|
Proceeds from the sales of marketable securities |
|
|
— |
|
|
|
1,531 |
|
|
1,145 |
|
Payment of internal use software |
|
|
(793) |
|
|
|
— |
|
|
— |
|
Acquisitions, net of cash acquired |
|
|
(179,423) |
|
|
|
— |
|
|
— |
|
Capital expenditures |
|
|
(639) |
|
|
|
(15) |
|
|
(352) |
|
Net cash provided by investing activities |
|
|
36,787 |
|
|
|
1,517 |
|
|
35 |
|
|
|
|
|
|
|
|
|
|
|
|
|
Cash flows from financing activities: |
|
|
|
|
|
|
|
|
|
|
|
Proceeds from borrowings |
|
|
— |
|
|
|
35 |
|
|
6,319 |
|
Repayments of borrowings |
|
|
(486) |
|
|
|
(69) |
|
|
(3,519) |
|
Stock options exercises |
|
|
130 |
|
|
|
13 |
|
|
113 |
|
Contingent consideration payments |
|
|
(920) |
|
|
|
— |
|
|
(571) |
|
Shareholder advances |
|
|
— |
|
|
|
— |
|
|
— |
F-6
|
Proceeds from issuances of Predecessor preferred shares |
|
|
— |
|
|
|
— |
|
|
9,960 |
|
Member distribution |
|
|
— |
|
|
|
(500) |
|
|
(759) |
|
Dividends |
|
|
— |
|
|
|
— |
|
|
(872) |
|
Borrowings issuance cost |
|
|
— |
|
|
|
— |
|
|
(24) |
|
Deferred cash payment for acquisitions |
|
|
— |
|
|
|
— |
|
|
(150) |
|
Common Stock repurchases |
|
|
(4,174) |
|
|
|
— |
|
|
— |
|
Note repayment for common stock repurchases |
|
|
(1,000) |
|
|
|
|
|
|
|
|
Redemption of Class A Ordinary Shares |
|
|
(113,982) |
|
|
|
— |
|
|
— |
|
Redemption of Exchangeable Shares - Class C |
|
|
(1,323) |
|
|
|
— |
|
|
— |
|
Proceeds received from private placement of Class A shares, net of costs |
|
|
125,258 |
|
|
|
— |
|
|
— |
|
Proceeds received from private placement of Common Stock, net of costs |
|
|
25,450 |
|
|
|
— |
|
|
— |
|
Repayments of finance lease obligations |
|
|
(392) |
|
|
|
(19) |
|
|
(149) |
|
Net cash provided by (used in) financing activities |
|
|
28,561 |
|
|
|
(540) |
|
|
10,348 |
|
|
|
|
|
|
|
|
|
|
|
|
|
Effect of foreign currency on cash |
|
|
204 |
|
|
|
(9) |
|
|
(707) |
|
|
|
|
|
|
|
|
|
|
|
|
|
Net change in cash and cash equivalents |
|
|
8,322 |
|
|
|
1,252 |
|
|
776 |
|
Cash and cash equivalents, beginning of period |
|
|
52 |
|
|
|
13,217 |
|
|
12,441 |
|
Cash and cash equivalents, end of period |
|
$ |
8,374 |
|
|
$ |
14,469 |
|
$ |
13,217 |
|
|
|
|
|
|
|
|
|
|
|
|
|
Supplemental disclosure of cash flow information: |
|
|
|
|
|
|
|
|
|
|
|
Cash paid for interest |
|
$ |
— |
|
|
$ |
— |
|
$ |
— |
|
Cash paid for income taxes |
|
$ |
— |
|
|
$ |
— |
|
$ |
— |
|
|
|
|
|
|
|
|
|
|
|
|
|
Noncash Investing Activity: |
|
|
|
|
|
|
|
|
|
|
|
Shares issued for the Acquisition |
|
$ |
172,307 |
|
|
$ |
— |
|
$ |
— |
|
Reduction in convertible note liability |
|
$ |
1,000 |
|
|
$ |
— |
|
$ |
— |
|
Exchangeable shares converted to Common Stock |
|
$ |
1,936 |
|
|
$ |
— |
|
$ |
— |
|
Common Stock issued for Exchangeable Shares - Class C |
|
$ |
3,860 |
|
|
$ |
— |
|
$ |
— |
|
Deemed dividend for Exchangeable Shares - Class C |
|
$ |
183 |
|
|
$ |
— |
|
$ |
— |
|
Note payable issuance for common stock repurchases |
|
$ |
1,000 |
|
|
$ |
— |
|
$ |
— |
|
Capital leases |
|
$ |
2,714 |
|
|
$ |
— |
|
$ |
— |
The accompanying notes are an integral part of these consolidated financial statements.
F-7
GTY TECHNOLOGY HOLDINGS INC.
NOTES TO CONSOLIDATED FINANCIAL STATEMENTS
Amounts in tables in thousands, except share and per share amounts)
Note 1. Organization and Business Operations
GTY Technology Holdings Inc. (f/k/a GTY Govtech, Inc.), a Massachusetts corporation (“GTY”, the “Company” or “Successor”), is headquartered in Las Vegas, Nevada.
On February 19, 2019 (the “Closing Date”), the Company consummated several acquisitions (collectively, the “Acquisition”), pursuant to which it (i) acquired each of Bonfire Interactive Ltd. (“Bonfire”), CityBase, Inc. (“CityBase”), eCivis Inc. (“eCivis”), Open Counter Enterprises Inc. (“Open Counter”), Questica Inc. and Questica USCDN Inc. (together, “Questica”) and Sherpa Government Solutions LLC (“Sherpa” and together with Bonfire, CityBase, eCivis, Open Counter and Questica, the “Acquired Companies”) and (ii) became the parent company of its predecessor entity, GTY Technology Holdings Inc., a blank check company incorporated in the Cayman Islands (“GTY Cayman”). Until the Acquisition, GTY Cayman did not engage in any operations nor generate any revenues.
In connection with the closing of the Acquisition, the Company changed its name from GTY Govtech, Inc. to GTY Technology Holdings Inc. and became a successor issuer to GTY Cayman and continued the listing of its common stock and warrants on the Nasdaq Capital Market (“NASDAQ”) under the symbols “GTYH” and “GTYHW,” respectively. As of June 2019, the Company’s warrants are no longer listed on any exchange.
GTY is a public sector SAAS company which offers a cloud-based suite of solutions primarily for North American state and local governments. GTY’s cloud-based suite of solutions for state and local governments addresses functions in procurement, payments, grant management, budgeting and permitting. The following is a brief description of each of the Acquired Companies.
Bonfire
Bonfire Interactive Ltd. was incorporated on March 5, 2012 under the laws of the Province of Ontario, and its wholly-owned subsidiary, Bonfire Interactive US Ltd., was incorporated in the United States on January 8, 2018. Bonfire is a provider of strategic sourcing and procurement software, serving customers in government, the broader public sector, and various highly-regulated commercial vertical markets.
Bonfire offers customers and their sourcing professionals a modern SaaS application that helps find, engage, evaluate, negotiate and award vendor and supplier contracts. Bonfire delivers workflow automation, data collection and analysis, and collaboration to drive cost savings, compliance, and strategic outcomes. All of Bonfire’s applications are delivered as a SaaS offering, and Bonfire offers implementation and premium support services.
CityBase
CityBase, a Delaware corporation headquartered in Chicago, provides dynamic content, digital services, and integrated payments via a SaaS platform that includes technological functionality accessible via web and mobile, kiosk, point-of-sale, and other channels. CityBase software integrates its platform to underlying systems of record, billing, and other source systems, and configures payments and digital services to meet the requirements of its customers, which include government agencies and utility companies.
eCivis
eCivis, a Delaware corporation headquartered in Los Angeles, California, is a leading SaaS provider of grants management and indirect cost reimbursement solutions that enable its customers to standardize and streamline complex grant processes in a fully integrated platform. The eCivis platform consists of four core cloud-based products including grants research, grants management, sub-recipient management, and cost allocation and recovery. To assist its customers in the implementation of its cloud-based products, eCivis offers one-time implementation services, including data integration, grants migration and change management. Additionally, eCivis provides ongoing grants management training, cost allocation plan consulting and cost recovery services.
F-8
GTY TECHNOLOGY HOLDINGS INC.
NOTES TO CONSOLIDATED FINANCIAL STATEMENTS
Amounts in tables in thousands, except share and per share amounts)
Open Counter
Open Counter, a Delaware corporation headquartered in San Francisco, California, is a developer and provider of software tools for cities to streamline permitting and licensing services for municipal governments. Open Counter provides customers with software through a hosted platform and also provides professional services related to software implementation.
Questica
Questica, Inc., Questica USCDN Inc., and its wholly-owned subsidiary Questica Ltd., design and develop budgeting software that supports the unique requirements of the public sector. The Questica suite of products are part of a comprehensive web-based budgeting preparation, performance, management and data visualization solution that enables public sector and non-profit organizations to improve and shorten their budgeting cycles.
Questica Inc. was organized in 1998 as an Ontario corporation, maintains two offices located in Burlington, Ontario, Canada and serves the healthcare, K-12, higher education and local government verticals primarily in North America. Questica USCDN was organized in 2017 as an Ontario corporation and Questica Ltd. was incorporated in 2017 in the United States as a Delaware corporation. Questica Ltd. is located in Huntington Beach, California, primarily serving the non-profit market and services a limited number of customers in the public and private sector. The majority of the Questica Ltd.’s customers are located in the United States and Canada, and as well as some international customers, primarily located in the United Kingdom and Africa.
Sherpa
Sherpa is a Colorado limited liability company headquartered in Denver, Colorado, established in 2004. Sherpa is a leading provider of public sector budgeting software and consulting services that help state and local governments create and manage budgets and performance. Customers purchase Sherpa’s software and then engage its consulting services to configure the software and receive training on how to manage the software going forward. Following implementation, customers continue to use the software in exchange for maintenance or subscription fees.
Note 2. Going Concern and Liquidity
The Company’s consolidated financial statements have been prepared assuming that it will continue as a going concern, which contemplates continuity of operations, realization of assets, and liquidation of liabilities in the normal course of business.
As reflected in the consolidated financial statements, the Company had an accumulated deficit of approximately $85.0 million at December 31, 2019, a net loss of approximately $95.7 million and approximately $57.2 million net cash used in operating activities for the successor period from February 19, 2019 through December 31, 2019. These factors raise substantial doubt about the Company’s ability to continue as a going concern.
The Company is attempting to further expand its customer base; scale up its production of various products; and increase revenues; however, the Company’s cash position may not be sufficient to support its daily operations through the next twelve months from the date of filing this Form 10-K. The ability of the Company to continue as a going concern is dependent upon its ability to raise additional funds by way of a public or private offering and its ability to further generate sufficient revenues. While the Company believes in the viability of its platform and in its ability to raise additional funds by way of a public or private offering, there can be no assurances to that effect. On February 14, 2020, the Company entered into an unsecured term loan credit facility that provides for term loans in an aggregate principal amount of $12.0 million. See Note 13.
F-9
GTY TECHNOLOGY HOLDINGS INC.
NOTES TO CONSOLIDATED FINANCIAL STATEMENTS
Amounts in tables in thousands, except share and per share amounts)
The consolidated financial statements do not include any adjustments related to the recoverability and classification of recorded asset amounts or the amounts and classification of liabilities that might be necessary should the Company be unable to continue as a going concern.
Note 3. Summary of Significant Accounting Policies
Basis of Presentation
The accompanying consolidated financial statements are presented in U.S. dollars in conformity with accounting principles generally accepted in the United States of America (“U.S. GAAP”) and pursuant to the rules and regulations of the SEC.
The Acquisition was accounted for as a business combination using the acquisition method of accounting. The Company’s financial statement presentation distinguishes the results of operations into two distinct periods: (i) the period before the consummation of the Acquisition, which includes the period from January 1, 2019 to the Closing Date (the “2019 Predecessor Period”), the year ended December 31, 2018 (the “2018 Predecessor Period”) and (ii) the period after consummation of the Acquisition which includes the period including and after the Closing Date to December 31, 2019 (“2019 Successor Period”). The accompanying consolidated financial statements include a black line division which indicates that the Acquired Companies and the Company’s financial information are presented on a different basis and are therefore, not comparable.
Determining the fair value of certain assets and liabilities assumed is judgmental in nature and often involves the use of significant estimates and assumptions. See Note 4 – Business Combination for a discussion of the estimated fair values of assets and liabilities recorded in connection with the Acquisition.
The historical financial information of GTY Cayman prior to the Acquisition is not being reflected in the Predecessor financial statements as these historical amounts have been determined not to be useful to a user of the financial statements. GTY Cayman’s operations prior to the Acquisition, other than income from the Trust Account (as defined in Note 11. Shareholders’ Equity) investments and transaction expenses, were nominal.
The Company believes that Predecessor activities related to investments, intangible assets, share-based compensation, goodwill, fair value measurements and notes payable were either quantitatively or qualitatively immaterial. Therefore, the Company did not disclose these Predecessor activities in the following unaudited footnotes.
Principles of Consolidation
The Successor Period consolidated financial statements include all accounts of the Company and its subsidiaries. The Predecessor Period consolidated financial statements include all accounts of the Acquired Companies and the Acquired Companies’ subsidiaries. All material intercompany transactions and balances have been eliminated in the accompanying consolidated financial statements.
Segments
The Company has six operating segments. The Company’s Chief Executive Officer and Chief Financial Officer, who jointly are the Company’s chief operating decision maker, review financial information for each of the Acquired Companies, together with certain consolidated operating metrics, to make decisions about how to allocate resources and to measure the Company’s performance. See Note 12.
Emerging Growth Company
The Company is an “emerging growth company,” as defined in Section 2(a) of the Securities Act, as modified by the Jumpstart our Business Startups Act of 2012 (the “JOBS Act”), and it may take advantage of certain exemptions from
F-10
GTY TECHNOLOGY HOLDINGS INC.
NOTES TO CONSOLIDATED FINANCIAL STATEMENTS
Amounts in tables in thousands, except share and per share amounts)
various reporting requirements that are applicable to other public companies that are not emerging growth companies including, but not limited to, not being required to comply with the auditor attestation requirements of Section 404 of the Sarbanes-Oxley Act of 2002, reduced disclosure obligations regarding executive compensation in its periodic reports and proxy statements, and exemptions from the requirements of holding a nonbinding advisory vote on executive compensation and shareholder approval of any golden parachute payments not previously approved.
Further, section 102(b)(1) of the JOBS Act exempts emerging growth companies from being required to comply with new or revised financial accounting standards until private companies (that is, those that have not had a Securities Act registration statement declared effective or do not have a class of securities registered under the Exchange Act) are required to comply with the new or revised financial accounting standards. The JOBS Act provides that a company can elect to opt out of the extended transition period and comply with the requirements that apply to non-emerging growth companies but any such election to opt out is irrevocable.
The Company has elected not to opt out of such extended transition period which means that when a standard is issued or revised and it has different application dates for public or private companies, the Company, as an emerging growth company, can adopt the new or revised standard at the time private companies adopt the new or revised standard. This may make comparison of the Company’s consolidated financial statements with another public company which is neither an emerging growth company nor an emerging growth company which has opted out of using the extended transition period difficult or impossible because of the potential differences in accountant standards used.
Cash and Cash Equivalents
The Company considers all highly liquid investments with an original or remaining maturity of three months or less at the date of purchase to be cash equivalents. Cash includes cash held in checking and savings accounts. Cash equivalents are comprised of investments in money market mutual funds. Cash and cash equivalents are recorded at cost, which approximates fair value.
Accounts Receivable
Accounts receivable consists of amounts due from our customers, which are primarily located throughout the United States and Canada. Accounts receivable are recorded at the invoiced amount, do not require collateral, and do not bear interest.
The Company estimates its allowance for doubtful accounts by evaluating specific accounts where information indicates the Company’s customers may have an inability to meet financial obligations, such as bankruptcy and significantly aged receivables outstanding. Uncollectible receivables are written-off in the period management believes it has exhausted every opportunity to collect payment from the customer. Bad debt expense is recorded when events or circumstances indicate an additional allowance is required based on the Company’s specific identification approach.
The allowance for doubtful accounts for the Successor as of December 31, 2019 and for the Predecessor as of December 31, 2018 was immaterial. Bad debt expense for all periods presented was immaterial.
Concentration of Credit Risk
Financial instruments that potentially subject the Company to concentration of credit risk consist of cash and cash equivalents, and accounts receivable. Cash accounts in a financial institution at times may exceed the Federal depository insurance coverage of $250,000. As of December 31, 2019 and 2018, the Company had not experienced losses on these accounts and management believes the Company is not exposed to significant risks on such accounts. Additionally, all Canadian Dollars (“CDN”) institution amounts are covered by Canada Deposit Insurance Corporation, or CDIC insurance.
F-11
GTY TECHNOLOGY HOLDINGS INC.
NOTES TO CONSOLIDATED FINANCIAL STATEMENTS
Amounts in tables in thousands, except share and per share amounts)
Use of Estimates
The preparation of the consolidated financial statements and related disclosures in conformity with U.S. GAAP requires management to make estimates and assumptions that affect the reported amounts of assets and liabilities and disclosure of contingent assets and liabilities at the date of the balance sheets and the reported amounts of revenue and expenses during the reporting periods.
Making estimates requires management to exercise significant judgment. It is at least reasonably possible that the estimate of the effect of a condition, situation or set of circumstances that existed at the date of the consolidated financial statements, which management considered in formulating its estimate, could change in the near term due to one or more future confirming events. Accordingly, the actual results could differ significantly from those estimates.
Property and Equipment
Property and equipment are recorded at cost. Maintenance and repairs are charged to expense as incurred, and improvements are capitalized. When assets are retired or otherwise disposed of, the cost and accumulated depreciation are removed from the accounts, and any resulting gain or loss is reflected in the consolidated statement of operations in the period realized. Property, plant and equipment is depreciated using the straight-line method over five (5) to fifteen (15) years. Internal-use software is amortized on a straight-line basis over its estimated useful life of five (5) years.
Leasehold improvements are amortized over the shorter of the useful lives or the term of the respective leases.
Capitalized Software Costs
The Company capitalizes costs incurred during the application development stage related to the development of internal-use software and enterprise cloud computing services. Costs related to preliminary project activities and post-implementation activities are expensed as incurred. For the 2019 Successor Period, the Company capitalized $0.8 million for internal use software.
Intangible Assets (Successor)
Intangible assets consist of acquired customer relationships, acquired developed technology, trade names and non-compete agreements which were acquired as part of the Acquisition. The Company determines the appropriate useful life of its intangible assets by performing an analysis of expected cash flows of the acquired assets. Intangible assets are amortized over their estimated useful lives using the straight-line method, which approximates the pattern in which the economic benefits are consumed.
Goodwill (Successor)
Goodwill represents the excess of the purchase price of an entity over the estimated fair value of the assets acquired and liabilities assumed, and it is presented as Goodwill in the accompanying consolidated balance sheet of the Successor. Under ASC 350, Intangibles – Goodwill and Other (“ASC 350”), goodwill is not amortized but is subject to periodic impairment testing. ASC 350 requires that an entity assign its goodwill to reporting units and test each reporting unit’s goodwill for impairment at least on an annual basis and between annual tests if an event occurs or circumstances change that would more likely than not reduce the fair value of a reporting unit below its carrying amount. In our evaluation of goodwill for impairment, which will be performed annually during the fourth quarter, we first assess qualitative factors to determine whether the existence of events or circumstances led to a determination that it was more likely than not that the fair value of a reporting unit is less than its carrying amount. If, after assessing the totality of events or circumstances, it is determined that it is more likely than not that the fair value of a reporting unit is less than its carrying amount, the Company is required to perform the quantitative goodwill impairment test. As a result of the Acquisition, the Company acquired goodwill during the Successor Period. There was minimal goodwill prior to the Acquisition. As a result of our
F-12
GTY TECHNOLOGY HOLDINGS INC.
NOTES TO CONSOLIDATED FINANCIAL STATEMENTS
Amounts in tables in thousands, except share and per share amounts)
goodwill impairment assessment, the Company recorded a goodwill impairment expense of $18.0 million, $12.9 million and $1.3 million of its CityBase, Bonfire and eCivis segments, respectively, for the 2019 Successor Period.
Business Combinations (Successor)
The Company accounts for business acquisitions using the acquisition method of accounting based on Accounting Standards Codification (“ASC”) 805 — Business Combinations, which requires recognition and measurement of all identifiable assets acquired and liabilities assumed at their fair value as of the date control is obtained. The Company determines the fair value of assets acquired and liabilities assumed based upon its best estimates of the acquisition-date fair value of assets acquired and liabilities assumed in the acquisition. Goodwill represents the excess of the purchase price over the fair value of the net tangible and identifiable intangible assets acquired. Subsequent adjustments to fair value of any contingent consideration are recorded to the Company’s consolidated statements of operations.
Based on the acquisition date and the complexity of the underlying valuation work, certain amounts included in the Company’s consolidated financial statements may be provisional and thus subject to further adjustments within the permitted measurement period (a year from the date of acquisition), as defined in ASC 805. During the Successor Period ended December 31, 2019, adjustments were made within the permitted measurement period that resulted in (i) an increase in the aggregate consideration of the Acquisition of $0.4 million relating to the settlement of the working capital adjustments, (ii) the conversion of $0.04 million stock consideration to cash consideration for the correction of an investor’s status to a non-accredited investor, (iii) a decrease in intangible assets $4.4 million, (iv) a decrease in contingent consideration as a result of the Acquisition of $7.5 million and (v) a decrease in the related deferred tax liability of $11.0 million due to updated information regarding facts and circumstances which existed as of the date of the business combination (the “Measurement Period Adjustments). These Measurement Period Adjustments have been reflected as current period adjustments in the Successor Period ended December 31, 2019 in accordance with the guidance in ASU 2015-16 “Business Combinations.” The Measurement Period Adjustments primarily impacted goodwill, with no effect on earnings or cash in the current period. See Note 4.
Impairment of long-lived assets
The Company reviews long-lived assets, including property and equipment and intangible assets and goodwill for impairment whenever events or changes in business circumstances indicate that the carrying amount of an asset may not be fully recoverable. An impairment loss is recognized when the asset’s carrying value exceeds the total undiscounted cash flows expected from its use and eventual disposition. The amount of the impairment loss is determined as the excess of the carrying value of the asset over its fair value. During the Successor 2019 Period, the Company incurred a $32.2 million goodwill impairment charge.
Leases
Effective January 1, 2019, the Company accounts for its leases under ASC 842, Leases. Under this guidance, arrangements meeting the definition of a lease are classified as operating or financing leases, and are recorded on the consolidated balance sheet as both a right of use asset and a lease liability, calculated by discounting fixed lease payments over the lease term at the rate implicit in the lease or the Company’s incremental borrowing rate. Lease liabilities are increased by interest and reduced by payments each period, and the right of use asset is amortized over the lease term. For operating leases, interest on the lease liability and the amortization of the right of use asset results in straight-line rent expense over the lease term. Variable lease expenses are recorded when incurred.
In calculating the right of use asset and lease liability, the Company elects to combine lease and non-lease components. The Company excludes short-term leases having initial terms of 12 months or less from the new guidance as an accounting policy election, and recognizes rent expense on a straight-line basis over the lease term.
The Company accounted for leases prior to January 1, 2019 under ASC Topic 840.
F-13
GTY TECHNOLOGY HOLDINGS INC.
NOTES TO CONSOLIDATED FINANCIAL STATEMENTS
Amounts in tables in thousands, except share and per share amounts)
Fair Value (Successor)
The fair value of an asset or liability is the price that would be received to sell an asset or transfer a liability (an exit price) in the principal or most advantageous market for the asset or liability in an orderly transaction between market participants on the measurement date. The Company utilizes a fair value hierarchy that maximizes the use of observable inputs and minimizes the use of unobservable inputs when measuring fair value and defines three levels of inputs that may be used to measure fair value.
|
· |
Level 1 — uses quoted prices in active markets for identical assets or liabilities. |
|
· |
Level 2 — uses observable inputs other than quoted prices in Level 1, such as quoted prices for similar assets and liabilities in active markets; quoted prices for identical or similar assets and liabilities in markets that are not active; or other inputs that are observable or can be corroborated by observable market data. |
|
· |
Level 3 — uses one or more significant inputs that are unobservable and supported by little or no market activity, and that reflect the use of significant management judgment. |
The Company’s only material financial instruments carried at fair value as of December 31, 2019, with changes in fair value flowing through current earnings, consist of contingent consideration liabilities recorded in conjunction with business combinations and are as follows (in thousands):
|
|
|
|
|
|
Fair Value Measurement at |
|||||||
|
|
|
|
|
|
Reporting Date Using |
|||||||
|
|
|
|
|
|
Quoted Prices in |
|
Significant |
|
|
|
||
|
|
|
|
|
|
Active Markets |
|
Other |
|
Significant |
|||
|
|
|
Balance as of |
|
for Identical |
|
Observable |
|
Unobservable |
||||
|
|
|
December 31, |
|
Assets |
|
Inputs |
|
Inputs |
||||
|
|
|
2019 |
|
(Level 1) |
|
(Level 2) |
|
(Level 3) |
||||
|
Contingent consideration – current |
|
$ |
12,680 |
|
$ |
— |
|
$ |
— |
|
$ |
12,680 |
|
Contingent consideration – long term |
|
|
41,233 |
|
|
— |
|
|
— |
|
|
41,233 |
|
Total liabilities measured at fair value |
|
$ |
53,913 |
|
$ |
— |
|
$ |
— |
|
$ |
53,913 |
There were no transfers made among the three levels in the fair value hierarchy during the period after consummation of the Acquisition, which includes the period including and after the Closing Date to December 31, 2019.
The following table presents additional information about Level 3 liabilities measured at fair value. Both observable and unobservable inputs may be used to determine the fair value of positions that the Company has classified within the Level 3 category. As a result, the unrealized gains and losses for liabilities within the Level 3 category may include changes in fair value that were attributable to both observable (e.g., changes in market interest rates) and unobservable (e.g., changes in unobservable long-dated volatilities) inputs.
F-14
GTY TECHNOLOGY HOLDINGS INC.
NOTES TO CONSOLIDATED FINANCIAL STATEMENTS
Amounts in tables in thousands, except share and per share amounts)
Changes in Level 3 liabilities measured at fair value from February 19, 2019 to December 31, 2019 were as follows (in thousands):
|
Contingent consideration - February 18, 2019 |
|
$ |
2,685 |
|
Fair value of contingent consideration – Bonfire |
|
|
325 |
|
Fair value of contingent consideration – CityBase |
|
|
48,410 |
|
Fair value of contingent consideration – eCivis |
|
|
5,859 |
|
Fair value of contingent consideration – Questica |
|
|
9,311 |
|
Fair value of contingent consideration – Sherpa |
|
|
1,898 |
|
Payments of contingent consideration |
|
|
(920) |
|
Measurement period adjustment |
|
|
(7,535) |
|
Change in valuation |
|
|
(6,135) |
|
Change due to fluctuation in foreign currency |
|
|
15 |
|
Contingent consideration – December 31, 2019 |
|
$ |
53,913 |
The change in valuation was due, in part, to the decreased probabilities of the achievement of certain milestones of some of the acquired entities.
The fair value of the Company’s contingent consideration liabilities recorded as part of the Acquisition has been classified within Level 3 in the fair value hierarchy. The contingent consideration represents the estimated fair value of future payments due to the sellers based on each company’s achievement of annual earnings targets in certain years and other events considered in certain transaction documents. The initial fair values of the contingent consideration were calculated through the use of either Monte Carlo simulation or modified Black-Scholes analyses based on earnings projections for the respective earn-out periods, corresponding earnings thresholds, and approximate timing of payments as outlined in the purchase agreements for each of the Acquired Companies. The analyses utilized the following assumptions: (i) expected term; (ii) risk-adjusted net sales or earnings; (iii) risk-free interest rate; and (iv) expected volatility of earnings. Estimated payments, as determined through the respective models, were further discounted by a credit spread assumption to account for credit risk. The contingent consideration is revalued to fair value each period, and any increase or decrease is recorded in operating income (loss). The fair value of the contingent consideration may be impacted by certain unobservable inputs, most significantly with regard to discount rates, expected volatility and historical and projected performance. Significant changes to these inputs in isolation could result in a significantly different fair value measurement.
The carrying value of cash and cash equivalents, accounts receivable, accounts payable and accrued liabilities approximates fair value because of the short-term nature of these instruments.
The Company measures certain assets at fair value on a non-recurring basis, generally annually or when events or changes in circumstances indicate that the carrying amount of the assets may not be recoverable. These assets include goodwill and other intangible assets.
A financial instrument’s categorization within the valuation hierarchy is based upon the lowest level of input that is significant to the fair value measurement.
As a result of our annual goodwill impairment assessment, the Company recorded a goodwill impairment expense of $18.0 million, $12.9 million and $1.3 million of its CityBase, Bonfire and eCivis segments, respectively, for the year ended December 31, 2019. This measurement was performed on a non-recurring basis using significant unobservable inputs (Level 3). See Note 5.
F-15
GTY TECHNOLOGY HOLDINGS INC.
NOTES TO CONSOLIDATED FINANCIAL STATEMENTS
Amounts in tables in thousands, except share and per share amounts)
Foreign Currency Translation and Transactions
The assets, liabilities and results of operations of certain consolidated entities are measured using their functional currency, which is the currency of the primary foreign economic environment in which they operate. Upon consolidating these entities with the Company, their assets and liabilities are translated to U.S. dollars at currency exchange rates as of the consolidated balance sheet date and their revenues and expenses are translated at the weighted average currency exchange rates during the applicable reporting periods. Translation adjustments resulting from the process of translating these entities’ consolidated financial statements are reported in accumulated other comprehensive income (loss) in the consolidated balance sheets and total other comprehensive loss on the consolidated statements of operations.
Revenue Recognition
The Company adopted the Financial Accounting Standards Board (“FASB”) new revenue recognition framework, ASC 606, Revenue from Contracts with Customers (“ASC 606”), on January 1, 2017 using the full retrospective approach. The adoption of this standard did not have a material impact on prior revenue recognition or on opening equity, as the timing and measurement of revenue recognition for the Company is materially the same under ASC 606 as it was under the prior relevant guidance.
With the adoption of Topic 606, revenues are recognized upon transfer of control of promised products and services to customers in an amount that reflects the consideration the Company expects to receive in exchange for those products or services. If the consideration promised in a contract includes a variable amount, the Company includes an estimate of the amount it expects to receive for the total transaction price if it is probable that a significant reversal of cumulative revenues recognized will not occur.
The Company determines the amount of revenues to be recognized through application of the following steps:
|
· |
Identification of the contract, or contracts with a customer; |
|
· |
Identification of the performance obligations in the contract; |
|
· |
Determination of the transaction price; |
|
· |
Allocation of the transaction price to the performance obligations in the contract; and |
|
· |
Recognition of revenues when or as the Company satisfies the performance obligations. |
For contracts where the period between when the Company transfers a promised service to the customer and when the customer pays is one year or less, the Company has elected the practical expedient to not adjust the promised amount of consideration for the effects of a significant financing component.
The Company has made a policy election to exclude from the measurement of the transaction price all taxes assessed by a government authority that are both imposed on and concurrent with a specific revenue producing transaction and collected by the Company from a customer. Such taxes may include but are not limited to sales, use, value added and certain excise taxes.
F-16
GTY TECHNOLOGY HOLDINGS INC.
NOTES TO CONSOLIDATED FINANCIAL STATEMENTS
Amounts in tables in thousands, except share and per share amounts)
Disaggregation of Revenues
|
|
|
Successor |
|
|
Predecessor |
|||||
|
|
|
February 19, |
|
|
January 1, 2019 |
|
Year |
|||
|
|
|
2019 through |
|
|
through |
|
Ended |
|||
|
|
|
December 31, |
|
|
February 18, |
|
December 31, |
|||
|
|
|
2019 |
|
|
2019 |
|
2018 |
|||
|
Subscriptions, support and maintenance |
|
$ |
21,207 |
|
|
$ |
3,253 |
|
$ |
20,857 |
|
Professional services |
|
|
8,326 |
|
|
|
1,269 |
|
|
6,363 |
|
License |
|
|
1,930 |
|
|
|
383 |
|
|
2,173 |
|
Asset sales |
|
|
52 |
|
|
|
23 |
|
|
417 |
|
Total revenues |
|
$ |
31,515 |
|
|
$ |
4,928 |
|
$ |
29,810 |
Revenues
Subscription, support and maintenance. The Company provides software hosting services that provide customers with access to software related support and updates during the term of the arrangement. Revenues are recognized ratably over the contract term as the customer simultaneously receives and consumes the benefits of the subscription service, as the service is made available to the Company. The first year of subscription fees are typically payable within 30 days after the execution of a contract, and thereafter upon renewal. The Company initially records subscription fees as contract liabilities and recognize revenues on a straight-line basis over the term of the agreement.
Our contracts may include variable consideration in the form of usage fees, which are constrained and recognized once the uncertainties associated with the constraint are resolved, which is when usage occurs and the fee is known.
Subscription, support and maintenance revenues also includes kiosk rentals and on-premise support or maintenance pertaining to license sales. Revenues from kiosk rentals and on-premise support are recognized on a straight-line basis over the support period.
Revenues from subscription, support and maintenance comprised approximately 67% of total revenues for the 2019 Successor Period.
Professional services. The Company’s professional services contracts generate revenues on a time and materials, fixed fee or subscription basis. Revenues are recognized as the services are rendered for time and materials contracts. Revenues are recognized when the milestones are achieved and accepted by the customer or on a proportional performance basis for fixed fee contracts. Revenues are recognized ratably over the contract term for subscription contracts. The milestone method for revenue recognition is used when there is substantive uncertainty at the date the contract is entered into whether the milestone will be achieved. Training revenues are recognized as the services are performed. Revenues from professional services comprised approximately 26% of total revenues for the 2019 Successor Period.
License. Revenues from distinct licenses are recognized upfront when the software is made available to the customer, which normally coincides with contract execution, as this is when the customer has the risks and rewards of the right to use the software. Revenues from licenses comprised approximately 6% of total revenues for the 2019 Successor Period.
Asset sales. Revenues from asset sales are recognized when the asset, typically a kiosk, has been received by the client and is fully operational and ready to accept transactions, which is when the customer obtains control and has the risks and rewards of the asset. Asset sales were less than 1% of total revenues for the 2019 Successor Period.
Contract Liabilities
Contract liabilities primarily consist of amounts that have been billed to or received from customers in advance of revenue recognition and prepayments received from customers in advance for subscription services to the Company’s
F-17
GTY TECHNOLOGY HOLDINGS INC.
NOTES TO CONSOLIDATED FINANCIAL STATEMENTS
Amounts in tables in thousands, except share and per share amounts)
SaaS offerings and related implementation and training. The Company recognizes contract liabilities as revenues when the services are performed, and the corresponding revenue recognition criteria are met. The Company receives payments both upfront and over time as services are performed. Customer prepayments are generally applied against invoices issued to customers when services are performed and billed. Contract liabilities are reduced as services are provided and the revenue recognition criteria are met. Contract liabilities that are expected to be recognized as revenues during the succeeding twelve-month period are recorded in current liabilities as contract liabilities, and the remaining portion is recorded in long-term liabilities as contract liabilities, non-current. Revenues of approximately $8.6 million, $2.2 million, and $7.8 million were recognized for the 2019 Successor Period, the 2019 Predecessor Period, and the year ended December 31, 2018, respectively, that was included in the contract liabilities balances at the beginning of the respective periods.
Cost of revenues
Cost of revenues primarily consists of salaries and benefits of personnel relating to our hosting operations and support, implementation, and grants research. Cost of revenues includes data center costs including depreciation of the Company’s data center assets, third-party licensing costs, consulting fees, and the amortization of acquired technology from recent acquisitions.
Share-based Compensation
The Company expenses share-based compensation over the requisite service period based on the estimated grant-date fair value of the awards. Share-based awards with graded-vesting schedules are recognized on a straight-line basis over the requisite service period for each separately vesting portion of the award.
The Company estimates the fair value of stock option grants using the Black-Scholes option pricing model. The assumptions used in calculating the fair value of share-based awards represent management’s best estimates, involve inherent uncertainties and the application of management’s judgment.
Expected Term — The expected term of options represents the period that the Company’s share-based awards are expected to be outstanding based on the simplified method, which is the half-life from vesting to the end of its contractual term.
Expected Volatility — The Company computes share price volatility over expected terms based on comparable companies’ historical common stock trading prices.
Risk-Free Interest Rate — The Company bases the risk-free interest rate on the U.S. Treasuries implied yield with an equivalent remaining term.
Expected Dividend — The Company has never declared or paid any cash dividends on common shares and does not plan to pay cash dividends in the foreseeable future, and, therefore, uses an expected dividend yield of zero in valuation models.
The following are the assumptions used for the stock option grant on February 19, 2019:
|
Exercise price |
|
$ |
1.82 |
|
|
Expected term (years) |
|
|
5.1 |
|
|
Expected stock price volatility |
|
|
73.5 |
% |
|
Risk-free rate of interest |
|
|
2.5 |
% |
In accordance with ASU No. 2016-09, Compensation-Stock Compensation (Topic 718), Improvements to Employee Share-Based Payment Accounting, the Company records forfeitures as they occur.
F-18
GTY TECHNOLOGY HOLDINGS INC.
NOTES TO CONSOLIDATED FINANCIAL STATEMENTS
Amounts in tables in thousands, except share and per share amounts)
Net Loss per Share
Net loss per common share is computed by dividing net income by the weighted-average number of shares of common stock outstanding during the period. Diluted net income per common share is computed similar to basic net income per common share except that it reflects the potential dilution that could occur if dilutive securities or other obligations to issue common stock were exercised or converted into common stock. Due to the net loss for the Successor Period, diluted and basic loss per share are the same.
Securities that could potentially dilute loss per share in the future that were not included in the computation of diluted loss per share at December 31, 2019 are as follows:
|
Warrants to purchase common stock |
|
27,093,334 |
|
Unvested restricted stock units |
|
3,278,324 |
|
Options to purchase common stock |
|
274,559 |
|
Total |
|
30,646,217 |
Income Taxes
Deferred tax assets and liabilities are recorded for the expected future tax consequences of events that have been recognized in the Company’s financial statements or tax returns using the asset liability method. In estimating future tax consequences, all expected future events other than enactments of changes in the tax laws or rates are considered. The effect on deferred taxes of a change in tax rates is recognized in income in the period that includes the enactment date. Deferred tax assets are to be recognized for temporary differences that will result in deductible amounts in future years and for tax carryforwards if, in the opinion of management, it is more likely than not that the deferred tax assets will be realized.
The Company has recorded a valuation allowance to reduce their deferred tax assets to the net amount that they believe is more likely than not to be realized. The Company considers all available evidence, both positive and negative, including historical levels of income, expectations and risks associated with estimates of future taxable income and ongoing tax planning strategies in assessing the need for a valuation allowance
A tax position is recognized as a benefit only if it is “more likely than not” that the tax position would be sustained in a tax examination, with a tax examination being presumed to occur. The amount recognized is the largest amount of tax benefit that is greater than 50% likely of being realized on examination. For tax positions not meeting the “more likely than not” test, no tax benefit is recorded. The Company recognizes interest and / or penalties related to income tax matters in income tax expense.
As a result of the Acquisition, a temporary difference between the book fair value and tax basis for the assets acquired of $39.9 million was created, resulting in a deferred tax liability and additional goodwill. During the 2019 Successor Period, the Company recorded a measurement period adjustment decreasing the deferred tax liability and goodwill by $11.0 million due to a decrease in intangible assets and updated information regarding facts and circumstances which existed as of the date of the business combination. See Note 4.
F-19
GTY TECHNOLOGY HOLDINGS INC.
NOTES TO CONSOLIDATED FINANCIAL STATEMENTS
Amounts in tables in thousands, except share and per share amounts)
The following is a rollforward of the Company’s deferred tax liability from February 19, 2019 to December 31, 2019 (in thousands):
|
Balance - February 19, 2019 |
|
$ |
(39,908) |
|
Measurement period adjustment |
|
|
11,037 |
|
Income tax benefit (associated with the amortization of intangible assets) |
|
|
8,595 |
|
Balance - December 31, 2019 |
|
$ |
(20,276) |
Recently Adopted Accounting Pronouncements
In February 2016, the FASB issued ASU 2016-02, Leases (Topic 842) in order to increase transparency and comparability among organizations by, among other provisions, recognizing lease assets and lease liabilities on the balance sheet for those leases classified as operating leases under previous GAAP. For public companies, ASU 2016-02 is effective for fiscal years beginning after December 15, 2018 (including interim periods within those periods) using a modified retrospective approach and early adoption is permitted. In transition, entities may also elect a package of practical expedients that must be applied in its entirety to all leases commencing before the adoption date, unless the lease is modified, and permits entities to not reassess (a) the existence of a lease, (b) lease classification or (c) determination of initial direct costs, as of the adoption date, which effectively allows entities to carryforward accounting conclusions under previous GAAP. In July 2018, the FASB issued ASU 2018-11, Leases (Topic 842): Targeted Improvements, which provides entities an optional transition method to apply the guidance under Topic 842 as of the adoption date, rather than as of the earliest period presented. The Company adopted Topic 842 on January 1, 2019, using the optional transition method to apply the new guidance as of January 1, 2019, rather than as of the earliest period presented, and elected the package of practical expedients described above. Based on the analysis, on January 1, 2019, the Company recorded right of use assets of approximately $3.9 million, lease liability of approximately $4.0 million.
Recently Issued Accounting Pronouncements
In August 2018, the FASB issued ASU 2018-13, “Fair Value Measurement (Topic 820), – Disclosure Framework – Changes to the Disclosure Requirements for Fair Value Measurement,” which makes a number of changes meant to add, modify or remove certain disclosure requirements associated with the movement amongst or hierarchy associated with Level 1, Level 2 and Level 3 fair value measurements. This guidance is effective for fiscal years, and interim periods within those fiscal years, beginning after December 15, 2019. Early adoption is permitted upon issuance of the update. The Company has not determined the impact of this guidance on its financial statements.
In August 2018, the FASB issued Accounting Standards Update No. 2018-15, "Intangibles-Goodwill and Other-Internal-Use Software (Subtopic 350-40) - Customer’s Accounting for Implementation Costs Incurred in a Cloud Computing Arrangement That Is a Service Contract" ("ASU 2018-15"). ASU 2018-15 aligns the accounting for implementation costs incurred in a hosting arrangement that is a service contract with the accounting for implementation costs incurred to develop or obtain internal-use software under ASC 350-40, in order to determine which costs to capitalize and recognize as an asset and which costs to expense. ASU 2018-15 is effective for annual reporting periods, and interim periods within those years, beginning after December 15, 2019, and can be applied either prospectively to implementation costs incurred after the date of adoption or retrospectively to all arrangements. The Company is currently evaluating the impact of the adoption of ASU 2018-15 on its consolidated financial statements and expects to adopt the new standard in the first quarter of 2020.
In December 2019, the FASB issued ASU No. 2019-12, “Income Taxes (Topic 740): Simplifying the Accounting for Income Taxes (“ASU 2019-12”), which is intended to simplify various aspects related to accounting for income taxes. ASU 2019-12 removes certain exceptions to the general principles in Topic 740 and also clarifies and amends existing guidance to improve consistent application. This guidance is effective for fiscal years, and interim periods within those fiscal years, beginning after December 15, 2020, with early adoption permitted. The Company is currently evaluating the impact of this standard on its consolidated financial statements and related disclosures.
F-20
GTY TECHNOLOGY HOLDINGS INC.
NOTES TO CONSOLIDATED FINANCIAL STATEMENTS
Amounts in tables in thousands, except share and per share amounts)
In June 2016, the FASB issued ASU 2016-13, “Financial Instruments – Credit Losses”. The ASU sets forth a “current expected credit loss” (CECL) model which requires the Company to measure all expected credit losses for financial instruments held at the reporting date based on historical experience, current conditions, and reasonable supportable forecasts. This replaces the existing incurred loss model and is applicable to the measurement of credit losses on financial assets measured at amortized cost and applies to some off-balance sheet credit exposures. This ASU is effective for fiscal years beginning after December 15, 2019, including interim periods within those fiscal years, with early adoption permitted. Recently, the FASB issued the final ASU to delay adoption for smaller reporting companies to calendar year 2023. The Company is currently assessing the impact of the adoption of this ASU on its financial statements.
Note 4. Business Combination
Successor
Business Combination
On February 19, 2019, the Company consummated the Business Combination, pursuant to which it acquired each of Bonfire, CityBase, eCivis, Open Counter, Questica, and Sherpa. In connection with the closing of the Business Combination (the “Closing”), pursuant to the GTY Agreement between the Company, GTY Cayman, and GTY Technology Merger Sub, Inc. (“GTY Merger Sub”), merged with and into GTY Cayman, with GTY Cayman surviving the merger as a direct, wholly-owned subsidiary of the Company, and in connection therewith the Company changed its name from GTY Govtech, Inc. to GTY Technology Holdings Inc. This acquisition qualifies as a business combination under ASC 805. Accordingly, the Company recorded all assets acquired and liabilities assumed at their acquisition-date fair values, with any excess recognized as goodwill.
Bonfire Acquisition
Under the Bonfire Agreement, at Closing, the Company acquired Bonfire for aggregate consideration of approximately $48.0 million in cash and 2,156,014 shares of Company common stock (valued at $10.00 per share) and 2,161,741 shares of Bonfire Exchangeco, each of which is exchangeable for shares of Company common stock on a one-for-one basis at any time of the holder’s choosing. Of the shares issued to Bonfire Holders, 2,008,283 shares of Company common stock and 2,093,612 exchangeable shares in the capital stock of Bonfire Exchangeco (the “Bonfire Exchangeco Shares”) are subject to transfer restrictions for one year, which such transfer restrictions may be lifted earlier if, subsequent to the Closing, (i) the last sale price of the Company common stock equals or exceeds $12.00 per share (as adjusted for share splits, share dividends, reorganizations, recapitalizations and the like) for any 20 trading days within any 30-trading day period commencing at least 150 days after Closing, or (ii) the Company consummates a subsequent liquidation, merger, share exchange or other similar transaction which results in all of its shareholders having the right to exchange their shares of Company common stock for cash, securities or other property. In addition, approximately $3.1 million in cash and 690,000 shares of Company common stock were deposited into escrow for a period of up to one year to cover certain indemnification obligations of the Bonfire Holders.
Additionally, in accordance with the Bonfire Agreement, 1,218,937 unvested options to purchase shares of Bonfire common stock were converted into 408,667 options to purchase shares of Company common stock.
During the 2019 Successor Period, 193,645 shares of the Bonfire Exchangeco Shares were converted into the Company’s Common Stock on a one-for-one basis. The Bonfire Exchangeco Shares were subject to the transfer restrictions described above, and the Common Stock issued for these shares is subject to the same transfer restrictions, discussed above.
F-21
GTY TECHNOLOGY HOLDINGS INC.
NOTES TO CONSOLIDATED FINANCIAL STATEMENTS
Amounts in tables in thousands, except share and per share amounts)
During the 2019 Successor Period, the Company recorded a measurement period adjustment for the decrease in aggregate consideration of $0.1 million relating to the settlement of the working capital adjustment in accordance with the Bonfire Agreement.
CityBase Acquisition
Under the CityBase Agreement, at Closing, the Company acquired CityBase for aggregate consideration of approximately $62.2 million in cash and 3,155,961 shares of Company common stock (valued at $10.00 per share). Each CityBase Holder may elect to have their shares subject to transfer restrictions for up to one year or to have their shares subject to redemption at the Company’s option for a promissory note in an amount equal to $10.00 per share redeemed, which note would bear interest at a rate of 8% per annum in the first year after issuance and 10.0% per annum thereafter (subject to an increase of 1% for each additional 6 months that has elapsed without full payment of such note(s)) (which option was not exercised and expired on the 90th day after the Closing). Prior to the consummation of the Business Combination, certain of the CityBase Holders agreed to purchase 380,937 Class A Ordinary Shares of GTY Cayman with the proceeds they would have otherwise received from the closing of the CityBase Transaction, which resulted in an approximate $3.8 million reduction to the amount of cash payable to the CityBase Holders. In addition, approximately $2.1 million in cash and 1,000,000 shares of Company common stock were deposited into escrow for a period of up to one year to cover certain indemnification obligations of the CityBase Holders.
During the 2019 Successor Period, the Company recorded measurement period adjustments for (i) the increase in the aggregate consideration of $0.2 million relating to the settlement of the working capital adjustment in accordance with the CityBase Agreement, and (ii) the conversion of $0.04 stock consideration to cash consideration for the correction of an investor’s status to a non-accredited investor.
eCivis Acquisition
Under the eCivis Agreement and the eCivis Letter Agreement, at Closing, the Company acquired eCivis for aggregate consideration of approximately $14.0 million in cash and 2,883,433 shares of Company common stock (valued at $10.00 per share) (including 703,631 shares of the Company’s common stock which are redeemable for cash at any time in the sole discretion of the Company for a price of $10.00 per share (the “Redeemable Shares”). Upon redemption of the Redeemable Shares, the Company will simultaneously redeem additional shares from the holder equal to 40% of the number of Redeemable Shares being redeemed (the “Additional Shares”) at $10 per share. For the 2019 Successor Period, 178,571 Redeemable Shares and 71,428 Additional Shares have been redeemed. If the Redeemable Shares are not redeemed by February 12, 2020 and February 12, 2021, the Company will be subject to issuing additional shares, as calculated based on the number of outstanding Redeemable Shares. See Note 13. The shares not subject to a redemption right are subject to transfer restrictions for one year, provided; however, such transfer restrictions may be lifted earlier if, subsequent to the Closing, (i) the last sale price of the Company common stock equals or exceeds $12.00 per share (as adjusted for share splits, share dividends, reorganizations, recapitalizations and the like) for any 20 trading days within any 30-trading day period commencing at least 150 days after Closing, or (ii) the Company consummates a subsequent liquidation, merger, share exchange or other similar transaction which results in all of its shareholders having the right to exchange their shares of Company common stock for cash, securities or other property. In addition, approximately $3.6 million in cash and 242,200 shares of Company common stock were deposited into escrow for a period of up to one year to cover certain indemnification obligations of the eCivis Holders.
During the 2019 Successor Period, the Company recorded a measurement period adjustment for the increase in aggregate consideration of $0.5 million relating to the settlement of the working capital adjustment in accordance with the eCivis Agreement and the eCivis Letter Agreement.
F-22
GTY TECHNOLOGY HOLDINGS INC.
NOTES TO CONSOLIDATED FINANCIAL STATEMENTS
Amounts in tables in thousands, except share and per share amounts)
Open Counter Acquisition
Under the Open Counter Agreement and the Open Counter Letter Agreement, at Closing, the Company acquired Open Counter for aggregate consideration of approximately $9.7 million in cash and 1,580,990 shares of Company common stock (valued at $10.00 per share) which were redeemable at the sole discretion of the Company (the “OC Redeemable Shares”)). In March 2019, the OC Redeemable Shares were redeemed for a promissory note, which was subsequently repaid in March 2019. The shares that were not subject to a redemption right are subject to transfer restrictions for one year, provided; however, such transfer restrictions may be lifted earlier if, subsequent to the Closing, (i) the last sale price of the Company common stock equals or exceeds $12.00 per share (as adjusted for share splits, share dividends, reorganizations, recapitalizations and the like) for any 20 trading days within any 30-trading day period commencing at least 150 days after Closing, or (ii) the Company consummates a subsequent liquidation, merger, share exchange or other similar transaction which results in all of its shareholders having the right to exchange their shares of Company common stock for cash, securities or other property. In addition, approximately $1.3 million in cash and 164,554 shares of Company common stock were deposited into escrow for a period of one year to cover certain indemnification obligations of the Open Counter Holders.
During the 2019 Successor Period, the Company recorded a measurement period adjustment for the decrease in aggregate consideration of $0.1 million relating to the settlement of the working capital adjustment in accordance with the Open Counter Agreement and the Open Counter Letter Agreement.
Questica Acquisition
Under the Questica Agreement and the Questica Letter Agreement, at Closing, the Company indirectly acquired Questica for aggregate consideration of approximately $44.4 million in cash and an aggregate of 2,600,000 Class A exchangeable shares in the capital stock of Questica Exchangeco, which is exchangeable into shares of the Company’s common stock, and 1,000,000 Class B shares in the capital stock of Questica Exchangeco, which is not exchangeable into shares of Company common stock, that were issued to the holders of Questica capital stock (the “Questica Holders”). In accordance with the Questica Shareholder Agreement, dated as of February 12, 2019, by and among the Company and certain Questica Holders (the “Questica Shareholder Agreement”), 500,000 Class C exchangeable shares in the capital stock of Questica Exchangeco had been redeemable at the sole discretion of the Company at any time for $5.0 million plus all accrued and unpaid dividends, and may be exchanged for shares of Company common stock beginning on the sixty-first day following the Closing for a number of shares of Company common stock equal to $5.0 million plus accrued and unpaid dividends divided by the lesser of (i) $10.00 or (ii) the 5-day volume weighted average price (“VWAP”) at the time of exchange. In June 2019, these shares were redeemed for 500,000 shares of the Company common stock at the market price of $7.72, or $3.9 million, and transferred to permanent equity, and $1.3 million of cash. The incremental $0.2 million above the stated redemption price was recorded as a deemed dividend in the accompanying condensed consolidated financial statements. The Class A exchangeable shares in the capital stock of Questica Exchangeco are subject to transfer restrictions for one year, provided; however, such transfer restrictions may be lifted earlier if, subsequent to the Closing, (i) the last sale price of the Company common stock equals or exceeds $12.00 per share (as adjusted for share splits, share dividends, reorganizations, recapitalizations and the like) for any 20 trading days within any 30-trading day period commencing at least 150 days after Closing, or (ii) the Company consummates a subsequent liquidation, merger, share exchange or other similar transaction which results in all of its shareholders having the right to exchange their shares of Company common stock for cash, securities or other property. In addition, approximately $0.1 million in cash and 800,000 of the exchangeable shares described above were deposited into escrow for a period of one year to cover certain indemnification obligations of the Questica Holders.
Sherpa Acquisition
Under the Sherpa Agreement and the Sherpa Letter Agreement, at Closing, the Company indirectly acquired Sherpa for aggregate consideration of approximately $4.2 million in cash and 100,000 shares of Company common stock (valued at $10.00 per share) all of which are redeemable for a promissory note bearing interest equal to 5.5% per annum in the
F-23
GTY TECHNOLOGY HOLDINGS INC.
NOTES TO CONSOLIDATED FINANCIAL STATEMENTS
Amounts in tables in thousands, except share and per share amounts)
first year subsequent to issuance and 8.0% per annum thereafter at the sole discretion of the Company within seven days of the Closing. In addition, approximately $0.9 million in cash was deposited into escrow for a period of one year to cover certain indemnification obligations of the Questica Holders.
During the 2019 Successor Period, the Company recorded a measurement period adjustment for the decrease in aggregate consideration of $0.2 million relating to the settlement of the working capital adjustment in accordance with the Sherpa Agreement and the Sherpa Letter Agreement.
The following is a summary of the initial consideration paid and issued to each Acquired Company (in thousands):
|
|
|
|
|
|
|
|
|
|
|
|
|
|
|
|
|
|
|
|
|
|
|
|
Deferred |
|
|
|
|
Cash |
|
Stock |
|
Contingent |
|
|
|
|
Adjusted |
|
|
|
|
|
|
|
Tax |
|||||
|
|
|
Consideration |
|
Consideration |
|
Consideration |
|
Total |
|
Net Assets |
|
Goodwill |
|
Intangibles |
|
Liability |
||||||||
|
Bonfire |
|
$ |
51,068 |
|
$ |
50,078 |
(1) |
$ |
325 |
|
$ |
101,471 |
|
$ |
3,639 |
|
$ |
81,964 |
|
$ |
22,668 |
|
$ |
6,800 |
|
CityBase |
|
|
64,261 |
|
|
41,560 |
|
|
48,410 |
|
|
154,231 |
|
|
782 |
|
|
119,741 |
|
|
48,155 |
|
|
14,447 |
|
eCivis |
|
|
17,592 |
|
|
31,256 |
|
|
5,859 |
|
|
54,707 |
|
|
(1,788) |
|
|
47,397 |
|
|
12,997 |
|
|
3,899 |
|
OpenCounter |
|
|
10,958 |
|
|
17,455 |
|
|
— |
|
|
28,413 |
|
|
(1,441) |
|
|
22,524 |
|
|
10,471 |
|
|
3,141 |
|
Questica |
|
|
44,494 |
|
|
31,000 |
(2) |
|
9,311 |
|
|
84,805 |
|
|
3,652 |
|
|
57,479 |
|
|
33,821 |
|
|
10,147 |
|
Sherpa |
|
|
5,105 |
|
|
1,000 |
|
|
1,898 |
|
|
8,003 |
|
|
1,066 |
|
|
3,497 |
|
|
4,914 |
|
|
1,474 |
|
Total |
|
$ |
193,478 |
|
$ |
172,349 |
|
$ |
65,803 |
|
$ |
431,630 |
|
$ |
5,910 |
|
$ |
332,602 |
|
$ |
133,026 |
|
$ |
39,908 |
(1)Includes $21.6 million of convertible stock consideration
(2)Includes $31.0 million of convertible stock consideration
During the 2019 Successor Period, the Company made the Measurement Period Adjustments that resulted in (i) an increase in the aggregate consideration of the Acquisition of $0.4 million relating to the settlement of the working capital adjustments, (ii) the conversion of $0.04 stock consideration to cash consideration for the correction of an investor’s status to a non-accredited investor, and (iii) a decrease in intangible assets $4.4 million, (iv) a decrease in contingent consideration as a result of the Acquisition of $7.5 million and (v) a decrease in the related deferred tax liability of $11.0 million due to updated information regarding facts and circumstances which existed as of the date of the business combination. The Measurement Period Adjustments resulted in a net decrease to goodwill of $13.8 million.
The following table is a summary of the measurement period adjustments to consideration paid and issued to each Acquired Company (in thousands):
|
|
|
|
|
|
|
|
|
|
|
|
|
|
|
|
|
|
|
|
|
|
|
|
Deferred |
|
|
|
|
Cash |
|
Stock |
|
Contingent |
|
|
|
Adjusted |
|
|
|
|
|
Tax |
||||||||
|
|
|
Consideration |
|
Consideration |
|
Consideration |
|
Total |
|
Net Assets |
|
Goodwill |
|
Intangibles |
|
Liability |
||||||||
|
Bonfire |
|
$ |
(97) |
|
$ |
— |
|
$ |
— |
|
$ |
(97) |
|
$ |
— |
|
$ |
(299) |
|
$ |
202 |
|
$ |
— |
|
CityBase |
|
|
246 |
|
|
(42) |
|
|
(7,535) |
|
|
(7,331) |
|
|
— |
|
|
(13,384) |
|
|
(2,241) |
|
|
(8,294) |
|
eCivis |
|
|
481 |
|
|
— |
|
|
— |
|
|
481 |
|
|
— |
|
|
990 |
|
|
(1,071) |
|
|
(562) |
|
OpenCounter |
|
|
— |
|
|
— |
|
|
— |
|
|
— |
|
|
— |
|
|
(568) |
|
|
(139) |
|
|
(707) |
|
Questica |
|
|
— |
|
|
— |
|
|
— |
|
|
— |
|
|
— |
|
|
492 |
|
|
(492) |
|
|
— |
|
Sherpa |
|
|
(214) |
|
|
— |
|
|
— |
|
|
(214) |
|
|
— |
|
|
(1,000) |
|
|
(688) |
|
|
(1,474) |
|
Total |
|
$ |
416 |
|
$ |
(42) |
|
$ |
(7,535) |
|
$ |
(7,161) |
|
$ |
— |
|
$ |
(13,769) |
|
$ |
(4,429) |
|
$ |
(11,037) |
F-24
GTY TECHNOLOGY HOLDINGS INC.
NOTES TO CONSOLIDATED FINANCIAL STATEMENTS
Amounts in tables in thousands, except share and per share amounts)
The following table is a summary of the revised consideration paid and issued to each Acquired Company including the Measurement Period Adjustments (in thousands):
|
|
|
|
|
|
|
|
|
|
|
|
|
|
|
|
|
|
|
|
|
|
|
|
Deferred |
|
|
|
|
Cash |
|
Stock |
|
Contingent |
|
|
|
Adjusted |
|
|
|
|
|
Tax |
||||||||
|
|
|
Consideration |
|
Consideration |
|
Consideration |
|
Total |
|
Net Assets |
|
Goodwill |
|
Intangibles |
|
Liability |
||||||||
|
Bonfire |
|
$ |
50,971 |
|
$ |
50,078 |
(1) |
$ |
325 |
|
$ |
101,374 |
|
$ |
3,639 |
|
$ |
81,665 |
|
$ |
22,870 |
|
$ |
6,800 |
|
CityBase |
|
|
64,507 |
|
|
41,518 |
|
|
40,875 |
|
|
146,900 |
|
|
782 |
|
|
106,357 |
|
|
45,914 |
|
|
6,153 |
|
eCivis |
|
|
18,073 |
|
|
31,256 |
|
|
5,859 |
|
|
55,188 |
|
|
(1,788) |
|
|
48,387 |
|
|
11,926 |
|
|
3,337 |
|
OpenCounter |
|
|
10,958 |
|
|
17,455 |
|
|
— |
|
|
28,413 |
|
|
(1,441) |
|
|
21,956 |
|
|
10,332 |
|
|
2,434 |
|
Questica |
|
|
44,494 |
|
|
31,000 |
(2) |
|
9,311 |
|
|
84,805 |
|
|
3,652 |
|
|
57,971 |
|
|
33,329 |
|
|
10,147 |
|
Sherpa |
|
|
4,891 |
|
|
1,000 |
|
|
1,898 |
|
|
7,789 |
|
|
1,066 |
|
|
2,497 |
|
|
4,226 |
|
|
— |
|
Total |
|
$ |
193,894 |
|
$ |
172,307 |
|
$ |
58,268 |
|
$ |
424,469 |
|
$ |
5,910 |
|
$ |
318,833 |
|
$ |
128,597 |
|
$ |
28,871 |
|
(1) |
Includes $21.6 million of convertible stock consideration |
|
(2) |
Includes $31.0 million of convertible stock consideration |
The following table represents the revised preliminary allocation of consideration to the assets acquired and liabilities assumed at their estimated acquisition-date fair values, including the Measurement Period Adjustments discussed above. The following revised allocations are considered preliminary and may change within the permissible measurement period, not to exceed one year (in thousands):
|
|
|
Bonfire |
|
CityBase |
|
eCivis |
|
OpenCounter |
|
Questica |
|
Sherpa |
|
Total |
|||||||
|
Cash |
|
$ |
4,641 |
|
$ |
2,191 |
|
$ |
136 |
|
$ |
107 |
|
$ |
6,762 |
|
$ |
632 |
|
$ |
14,469 |
|
Accounts receivable, net |
|
|
323 |
|
|
1,018 |
|
|
720 |
|
|
46 |
|
|
1,257 |
|
|
587 |
|
|
3,951 |
|
Prepaid expense and other current assets |
|
|
607 |
|
|
170 |
|
|
340 |
|
|
— |
|
|
77 |
|
|
33 |
|
|
1,227 |
|
Fixed assets |
|
|
118 |
|
|
500 |
|
|
56 |
|
|
29 |
|
|
182 |
|
|
2 |
|
|
887 |
|
Loan receivable - related party |
|
|
— |
|
|
175 |
|
|
— |
|
|
— |
|
|
— |
|
|
— |
|
|
175 |
|
Right of use assets |
|
|
1,315 |
|
|
— |
|
|
901 |
|
|
— |
|
|
296 |
|
|
— |
|
|
2,512 |
|
Other assets |
|
|
369 |
|
|
783 |
|
|
30 |
|
|
— |
|
|
1,061 |
|
|
— |
|
|
2,243 |
|
Intangible assets |
|
|
22,870 |
|
|
45,914 |
|
|
11,926 |
|
|
10,332 |
|
|
33,329 |
|
|
4,226 |
|
|
128,597 |
|
Goodwill |
|
|
81,665 |
|
|
106,357 |
|
|
48,387 |
|
|
21,956 |
|
|
57,971 |
|
|
2,497 |
|
|
318,833 |
|
Accounts payable and accrued expenses |
|
|
(1,085) |
|
|
(1,192) |
|
|
(586) |
|
|
(124) |
|
|
(909) |
|
|
(188) |
|
|
(4,084) |
|
Contract liabilities |
|
|
(1,221) |
|
|
(816) |
|
|
(1,635) |
|
|
(483) |
|
|
(2,774) |
|
|
— |
|
|
(6,929) |
|
Lease liability - short term |
|
|
(366) |
|
|
— |
|
|
— |
|
|
— |
|
|
(296) |
|
|
— |
|
|
(662) |
|
Deferred tax liability |
|
|
(6,800) |
|
|
(6,153) |
|
|
(3,337) |
|
|
(2,434) |
|
|
(10,147) |
|
|
— |
|
|
(28,871) |
|
Other current liabilities |
|
|
— |
|
|
— |
|
|
(3) |
|
|
(491) |
|
|
(767) |
|
|
— |
|
|
(1,261) |
|
Capital lease obligations - current portion |
|
|
— |
|
|
(139) |
|
|
— |
|
|
— |
|
|
— |
|
|
— |
|
|
(139) |
|
Contract and other long-term liabilities |
|
|
(60) |
|
|
(1,646) |
|
|
(56) |
|
|
— |
|
|
— |
|
|
— |
|
|
(1,762) |
|
Capital lease obligation, less current portion |
|
|
— |
|
|
(262) |
|
|
— |
|
|
— |
|
|
— |
|
|
— |
|
|
(262) |
|
Long term debt |
|
|
— |
|
|
— |
|
|
— |
|
|
(525) |
|
|
— |
|
|
— |
|
|
(525) |
|
Lease liability - long term |
|
|
(1,002) |
|
|
— |
|
|
(901) |
|
|
— |
|
|
— |
|
|
— |
|
|
(1,903) |
|
Contingent consideration - pre-existing |
|
|
— |
|
|
— |
|
|
(790) |
|
|
— |
|
|
(1,237) |
|
|
— |
|
|
(2,027) |
|
Total consideration |
|
$ |
101,374 |
|
$ |
146,900 |
|
$ |
55,188 |
|
$ |
28,413 |
|
$ |
84,805 |
|
$ |
7,789 |
|
$ |
424,469 |
F-25
GTY TECHNOLOGY HOLDINGS INC.
NOTES TO CONSOLIDATED FINANCIAL STATEMENTS
Amounts in tables in thousands, except share and per share amounts)
Transaction Costs
Transaction costs incurred by the Company associated with the Acquisition were $37.0 million for the 2019 Successor Period.
Note 5. Goodwill and Intangible Assets (Successor)
In connection with the business combinations on February 19, 2019, the Company recognized goodwill and certain identifiable intangible assets, which were subsequently adjusted with measurement period adjustments. See Note 4.
Goodwill
The following table provides a rollforward of Goodwill for the 2019 Successor Period (in thousands):
|
|
|
Bonfire |
|
CityBase |
|
eCivis |
|
OpenCounter |
|
Questica |
|
Sherpa |
|
Total |
|||||||
|
Balance at February 18, 2019 |
|
$ |
— |
|
$ |
— |
|
$ |
— |
|
$ |
— |
|
$ |
— |
|
$ |
— |
|
$ |
— |
|
Goodwill from initial purchase price allocation |
|
|
81,964 |
|
|
119,741 |
|
|
47,397 |
|
|
22,524 |
|
|
57,479 |
|
|
3,497 |
|
|
332,602 |
|
Measurement period adjustment |
|
|
(299) |
|
|
(13,384) |
|
|
990 |
|
|
(568) |
|
|
492 |
|
|
(1,000) |
|
|
(13,769) |
|
Goodwill impairment |
|
|
(12,921) |
|
|
(18,030) |
|
|
(1,247) |
|
|
— |
|
|
— |
|
|
— |
|
|
(32,198) |
|
Balance at December 31, 2019 |
|
$ |
68,744 |
|
$ |
88,327 |
|
$ |
47,140 |
|
$ |
21,956 |
|
$ |
57,971 |
|
$ |
2,497 |
|
$ |
286,635 |
Intangible Assets
Identifiable intangible assets consist of the following as of December 31, 2019 for the Successor (in thousands):
|
|
|
|
|
|
|
|
|
|
|
|
|
|
|
|
|
|
|
|
|
|
|
|
|
|
|
|
Intangible Asset |
|
|
|
|
|
|
|
|
|
|
|
|
|
|
|
|
|
|
|
|
|
|
|
|
|
|
|
|
|
|
|
|
Amortization |
|
|
|
|
|
|
|
|
|
Weighted average |
|
|
|
|
|
|
|
|
|
|
|
|
|
|
|
|
|
|
|
|
|
|
for the Period |
|
|
|
|
|
|
|
|
|
remaining |
|
|
|
|
|
|
|
|
|
|
|
|
|
|
|
|
|
|
|
|
|
|
February 19, 2019 |
|
|
|
|
|
|
|
Economic |
|
economic life |
|
|
|
|
|
|
|
|
|
|
|
|
|
|
|
|
|
|
|
|
|
|
Through |
|
|
|
|
|
|
|
Life (Years) |
|
(years) |
|
Bonfire |
|
CityBase |
|
eCivis |
|
OpenCounter |
|
Questica |
|
Sherpa |
|
Gross Total |
|
December 31, 2019 |
|
Net Total |
|||||||||
|
Patents / Developed Technology |
|
8 |
|
7.1 |
|
$ |
11,964 |
|
$ |
31,987 |
|
$ |
3,315 |
|
$ |
5,829 |
|
$ |
6,090 |
|
$ |
899 |
|
$ |
60,084 |
|
$ |
6,496 |
|
$ |
53,588 |
|
Trade Names / Trademarks |
|
1 - 10 |
|
9.1 |
|
|
3,491 |
|
|
7,816 |
|
|
1,722 |
|
|
1,222 |
|
|
1,880 |
|
|
217 |
|
|
16,348 |
|
|
1,579 |
|
|
14,769 |
|
Customer Relationships |
|
10 |
|
9.1 |
|
|
7,172 |
|
|
5,660 |
|
|
6,744 |
|
|
3,174 |
|
|
25,229 |
|
|
3,024 |
|
|
51,003 |
|
|
4,400 |
|
|
46,603 |
|
Non-Compete Agreements |
|
3 |
|
2.1 |
|
|
243 |
|
|
451 |
|
|
145 |
|
|
107 |
|
|
130 |
|
|
86 |
|
|
1,162 |
|
|
334 |
|
|
828 |
|
|
|
|
|
|
|
$ |
22,870 |
|
$ |
45,914 |
|
$ |
11,926 |
|
$ |
10,332 |
|
$ |
33,329 |
|
$ |
4,226 |
|
$ |
128,597 |
|
$ |
12,809 |
|
$ |
115,788 |
Amortization expense recognized by the Company related to intangible assets for the 2019 Successor Period was $12.8 million. Amortization expense recognized by the Predecessor for the 2019 Predecessor Period and the year ended December 31, 2018 was $32,000 and $0.4 million, respectively. There were no impairment charges recorded for amortizable intangible assets for the 2019 Successor Period, the 2019 Predecessor Period or the year ended December 31, 2018.
The estimated aggregate future amortization expense for intangible assets is as follows (in thousands):
|
Year ended December 31, 2020 |
|
$ |
14,685 |
|
Year ended December 31, 2021 |
|
|
14,655 |
|
Year ended December 31, 2022 |
|
|
14,655 |
|
Year ended December 31, 2023 |
|
|
14,655 |
|
Year ended December 31, 2024 |
|
|
14,655 |
|
Thereafter |
|
|
42,483 |
|
|
|
$ |
115,788 |
F-26
GTY TECHNOLOGY HOLDINGS INC.
NOTES TO CONSOLIDATED FINANCIAL STATEMENTS
Amounts in tables in thousands, except share and per share amounts)
Note 6. Related Party Transactions
Convertible Note
On August 8, 2018, GTY Cayman issued the Convertible Note to GTY Investors, LLC (the “Sponsor”), pursuant to which GTY Cayman was able to borrow up to $1 million from the Sponsor from time to time. The Convertible Note did not bear interest. The Sponsor has the option to convert any amounts outstanding under the Convertible Note, up to $1.0 million in the aggregate, into warrants at a conversion price of $1.50 per warrant. The terms of such warrants were identical to the private placement warrants. During the period ended March 31, 2019, GTY drew down $0.4 million on the Convertible Note, resulting in $1.0 million principal amount outstanding. The $1.0 million principal amount was offset against amounts due from the Sponsor (see “Agreements and Arrangements with Certain Institutional Investors”) and, as of December 31, 2019, there was no amount outstanding under the Convertible Notes.
Agreements and Arrangements with Certain Institutional Investors
On February 13, 2019, GTY Cayman, the Sponsor, William D. Green, Joseph M. Tucci and Harry L. You (Messrs. Green, Tucci and You, collectively, the “Founders”) entered into agreements and arrangements with certain institutional investors pursuant to which a total of 1,500,000 Class A Ordinary Shares of GTY Cayman were not redeemed in connection with the business combination (the “Outstanding Cayman Shares”). The holder of Outstanding Cayman Shares which were converted into shares of the Company’s common stock on the Closing Date on a one-for-one basis is entitled to put such shares to the Sponsor and the Founders for a purchase price equal to the price at which GTY Cayman redeemed Class A Ordinary Shares in connection with the business combination, $10.29 (the “redemption price”), payment of such purchase price is guaranteed by the Company, and to receive from the Company a cash payment, if and to the extent necessary, but not to exceed $250,000, in order to provide such shareholder with at least a 5% return on such shares above the redemption price. With respect to 1,000,000 of the Outstanding Cayman Shares, GTY Cayman engaged a broker-dealer to facilitate the purchase of the Outstanding Cayman Shares by an institutional investor prior to the Closing for $9.90 per share and agreed to pay such broker-dealer an amount per share in cash equal to the difference between the redemption price and $9.90. In addition, the Sponsor and the Founders entered into agreements prior to the Closing pursuant to which they were obligated to reimburse the holders of an additional 1,942,953 Class A Ordinary Shares that were not redeemed in connection with the business combination (the “Outstanding Class A Shares”) for losses that may be incurred upon the sale of the Outstanding Class A Shares within a specified period following the Closing, up to an agreed-upon limit, and the Company has agreed to guarantee such reimbursement obligations of the Sponsor. During the Q1 2019 Successor Period, the Company, on behalf of the Sponsor, paid $4.0 million for losses incurred upon the sale of the Outstanding Class A Shares and, in turn, the Company reduced its convertible note liability for $1.0 million (see “Convertible Note”). During the 2019 Successor Period, the Sponsor reimbursed the Company for the remaining $3.0 million for such losses on the Outstanding Class A Shares. As of December 31, 2019, the Outstanding Class A Shares are no longer guaranteed by the Founders or the Company.
Note 7. Share-Based Compensation
Stock Options
In connection with the Acquisition, the Company adopted a stock option plan and issued 408,667 stock options to employees. The total fair value of the stock options at the grant date was $3.6 million.
F-27
GTY TECHNOLOGY HOLDINGS INC.
NOTES TO CONSOLIDATED FINANCIAL STATEMENTS
Amounts in tables in thousands, except share and per share amounts)
A summary of stock option activity is as follows:
|
|
|
|
|
|
|
|
Weighted |
|
|
|
|
|
|
|
|
|
|
|
Average |
|
|
|
|
|
|
|
|
Weighted |
|
Remaining |
|
|
|
|
|
|
|
|
|
Average |
|
Contractual |
|
Total |
||
|
|
|
Number of |
|
Exercise |
|
Life (in |
|
Intrinsic |
||
|
|
|
Shares |
|
Price |
|
years) |
|
Value |
||
|
Outstanding as of February 18, 2019 |
|
— |
|
$ |
— |
|
— |
|
$ |
— |
|
Granted |
|
408,667 |
|
|
1.82 |
|
8.0 |
|
|
— |
|
Exercised |
|
(112,643) |
|
|
1.16 |
|
|
|
|
— |
|
Forfeited/expired |
|
(21,465) |
|
|
1.16 |
|
|
|
|
— |
|
Outstanding as of December 31, 2019 |
|
274,559 |
|
$ |
2.14 |
|
7.9 |
|
$ |
1,293 |
|
Options vested and exercisable |
|
103,699 |
|
$ |
2.12 |
|
7.9 |
|
$ |
490 |
For the period from February 19, 2019 to December 31, 2019, the Company recorded approximately $2.6 million of share-based compensation expense related to the options. As of December 31, 2019, the Company has $0.9 million of unrecognized share-based compensation cost which will be recognized over 1.1 years. During the Successor Period, share-based compensation expense is recorded as a component of general and administrative expenses.
Restricted Stock Units
During the Successor Period, the Company issued 3,480,194 restricted stock units (“RSUs”) to employees as annual performance awards. A portion of the RSUs will vest in ratable annual installments over either two or four years, as applicable, from the grant date, and the remaining RSUs will vest subject to the achievement of certain performance conditions over a three-year performance period, in each case, assuming continuous service by the employees through the applicable vesting dates. The RSUs granted to the Company’s Chief Executive Officer are subject to two different sets of performance-vesting criteria: (i) one RSU grant will vest on the last day of any 120-day trading period ending prior to the third anniversary of the grant date, to the extent that during such period, the average closing price per share of the Company’s common stock equals or exceeds $20, and under certain circumstances, the RSUs may vest if the stock price hurdle is achieved prior to the fourth anniversary of the grant date; and (ii) the other RSU grant will vest subject to the achievement of certain performance conditions over a one-year performance period. In each case, vesting of the RSUs is generally subject to the Chief Executive Officer’s continuous service through each vesting date.
A summary of the Company's restricted stock units and related information is as follows:
|
|
|
|
|
Weighted Average |
|
|
|
|
Number of Shares |
|
Grant Price |
|
|
Unvested as of as of February 18, 2019 |
|
— |
|
$ |
— |
|
Granted |
|
3,480,194 |
|
|
6.61 |
|
Vested |
|
(97,595) |
|
|
5.35 |
|
Forfeited/expired |
|
(104,275) |
|
|
9.59 |
|
Unvested as of December 31, 2019 |
|
3,278,324 |
|
$ |
6.55 |
For the period from February 19, 2019 to December 31, 2019, the Company recorded approximately $2.8 million of share-based compensation expense related to the RSUs. As of December 31, 2019, the Company had unrecognized share-based compensation expense related to all unvested restricted stock units of $12.0 million. The weighted average remaining contractual term of unvested RSUs that is time based is approximately 1.8 years at December 31, 2019. 1,327,178 of the RSUs granted above contained performance conditions. The Company recorded $0.1 million of share-based compensation expense during the 2019 Successor Period ended December 31, 2019 for these performance RSUs.
F-28
GTY TECHNOLOGY HOLDINGS INC.
NOTES TO CONSOLIDATED FINANCIAL STATEMENTS
Amounts in tables in thousands, except share and per share amounts)
Note 8. Leases
The Company leases office space under agreements classified as operating leases that expire on various dates through 2023. Such leases do not require any contingent rental payments, impose any financial restrictions, or contain any residual value guarantees. Certain of the Company’s leases include renewal options and escalation clauses; renewal options have not been included in the calculation of the lease liabilities and right of use assets as the Company is not reasonably certain to exercise the options. Variable expenses generally represent the Company’s share of the landlord’s operating expenses. The Company does not act as a lessor or have any leases classified as financing leases.
At December 31, 2019, the Company had operating lease liabilities of approximately $6.2 million and right of use assets of approximately $5.9 million, which are included in the condensed consolidated balance sheet.
The following summarizes quantitative information about the Company’s operating leases (dollars in thousands):
Year Ended December 31, 2019 (Successor/Predecessor Period)
|
|
|
Bonfire |
|
CityBase |
|
eCivis |
|
Questica |
|
Total |
|||||
|
Operating leases |
|
|
|
|
|
|
|
|
|
|
|
|
|
|
|
|
Operating lease cost |
|
$ |
429 |
|
$ |
616 |
|
$ |
309 |
|
$ |
290 |
|
$ |
1,644 |
|
Variable lease cost |
|
|
— |
|
|
— |
|
|
— |
|
|
— |
|
|
— |
|
Operating lease expense |
|
|
429 |
|
|
616 |
|
|
309 |
|
|
290 |
|
|
1,644 |
|
Short-term lease rent expense |
|
|
— |
|
|
— |
|
|
— |
|
|
— |
|
|
— |
|
Total rent expense |
|
$ |
429 |
|
$ |
616 |
|
$ |
309 |
|
$ |
290 |
|
$ |
1,644 |
|
|
|
Bonfire |
|
CityBase |
|
eCivis |
|
Questica |
|
Total |
|
|||||
|
Operating cash flows from operating leases |
|
$ |
431 |
|
$ |
650 |
|
$ |
309 |
|
$ |
136 |
|
$ |
1,526 |
|
|
Right-of-use assets exchanged for operating lease liabilities |
|
$ |
1,331 |
|
$ |
1,541 |
|
$ |
920 |
|
$ |
3,450 |
|
$ |
7,242 |
|
|
Weighted-average remaining lease term – operating leases |
|
|
2.5 |
|
|
1.9 |
|
|
2.4 |
|
|
10.5 |
|
|
6.8 |
|
|
Weighted-average discount rate – operating leases |
|
|
9.9 |
% |
|
10.0 |
% |
|
8.0 |
% |
|
4.8 |
% |
|
6.8 |
% |
As of December 31, 2019, future minimum lease payments under non-cancellable operating are as follows (in thousands):
|
|
|
Bonfire |
|
CityBase |
|
eCivis |
|
Questica |
|
Total |
|||||
|
Year Ended December 31, 2020 |
|
$ |
461 |
|
$ |
662 |
|
$ |
309 |
|
$ |
435 |
|
$ |
1,867 |
|
Year Ended December 31, 2021 |
|
|
472 |
|
|
458 |
|
|
309 |
|
|
416 |
|
|
1,655 |
|
Year Ended December 31, 2022 |
|
|
239 |
|
|
— |
|
|
128 |
|
|
418 |
|
|
785 |
|
Year Ended December 31, 2023 |
|
|
— |
|
|
— |
|
|
— |
|
|
372 |
|
|
372 |
|
Year Ended December 31, 2024 |
|
|
— |
|
|
— |
|
|
— |
|
|
357 |
|
|
357 |
|
Thereafter |
|
|
— |
|
|
— |
|
|
— |
|
|
2,420 |
|
|
2,420 |
|
Total |
|
|
1,172 |
|
|
1,120 |
|
|
746 |
|
|
4,418 |
|
|
7,456 |
|
Less present value discount |
|
|
(136) |
|
|
(98) |
|
|
(70) |
|
|
(990) |
|
|
(1,294) |
|
Operating lease liabilities |
|
$ |
1,036 |
|
$ |
1,022 |
|
$ |
676 |
|
$ |
3,428 |
|
$ |
6,162 |
F-29
GTY TECHNOLOGY HOLDINGS INC.
NOTES TO CONSOLIDATED FINANCIAL STATEMENTS
Amounts in tables in thousands, except share and per share amounts)
Note 9. Income Taxes
The components of the income tax provision (benefit) are as follows:
|
Domestic |
|
|
|
|
Federal |
|
|
|
|
Current |
|
$ |
— |
|
Deferred |
|
|
(6,605) |
|
State |
|
|
|
|
Current |
|
|
3 |
|
Deferred |
|
|
(3,459) |
|
|
|
|
|
|
Foreign |
|
|
|
|
Current |
|
|
(56) |
|
Deferred |
|
|
1,522 |
|
Total |
|
$ |
(8,595) |
|
|
|
|
|
A reconciliation of the US federal statutory tax rates and the effective tax rates is as follows:
|
Statutory federal income tax provision |
|
21.0% |
|
State taxes, net of federal income tax effect |
|
2.6% |
|
Foreign taxes |
|
(8.8%) |
|
Goodwill impairment expense |
|
(3.9%) |
|
Nondeductible merger expenses |
|
(3.3%) |
|
Valuation allowance |
|
(0.7%) |
|
Other |
|
1.3% |
|
Total |
|
8.2% |
|
|
|
|
F-30
GTY TECHNOLOGY HOLDINGS INC.
NOTES TO CONSOLIDATED FINANCIAL STATEMENTS
Amounts in tables in thousands, except share and per share amounts)
Deferred tax assets (liabilities) were comprised of the following temporary differences between the financial statement carrying amounts and the tax basis of assets at December 31 and income tax attributes:
|
Deferred tax assets: |
|
|
|
Depreciation |
$ |
1,035 |
|
Settlement amount |
|
985 |
|
Stock-based compensation |
|
487 |
|
Lease liability |
|
510 |
|
Net operating losses |
|
19,094 |
|
Tax credits |
|
238 |
|
Other |
|
(32) |
|
Total deferred tax assets |
|
22,317 |
|
Less: valuation allowance |
|
(794) |
|
Deferred tax assets, net of valuation allowance |
|
21,523 |
|
|
|
|
|
Deferred tax liabilities: |
|
|
|
Intangible Assets |
|
(41,316) |
|
Right of use assets |
|
(483) |
|
Total deferred tax liabilities |
|
(41,799) |
|
Net deferred taxes |
$ |
(20,276) |
|
|
|
|
The Company’s valuation allowance was approximately $0.8 million relating to U.S. tax credits and federal net operating losses that we do not believe a tax benefit is more likely than not to be realized.
Utilization of the Company’s net operating loss and tax credit carryforwards may be subject to substantial annual limitations due to the ownership change limitations provided by the Internal Revenue Code and similar state provisions. Such annual limitations could result in the expirations of the net operating loss and tax credit carryforwards before their utilization. The events that may cause ownership changes includes, but are not limited to, a cumulative stock ownership change of greater than 50% over a three-year period.
The Company and its subsidiaries are subject to Canadian and United States federal income tax, as well as income and franchise tax in multiple state and provincial jurisdictions. The Canadian and United States federal tax years ended December 31, 2016, and subsequent years, are open for the assessment of taxes and various state and provincial tax years ended December 31, 2015, and subsequent years, are open for the assessment of taxes.
The 2017 Tax Cuts and Jobs Act (Tax Act) imposed a mandatory transition tax on accumulated foreign earnings and generally eliminated U.S. taxes on foreign subsidiary distribution. As a result, accumulated earnings in foreign jurisdictions are available for distribution to the U.S. without incremental U.S. taxes.
As of December 31, 2019, the Company had no unrecognized tax benefits and does not anticipate any significant change to the unrecognized tax benefit balance. The Company would classify interest and penalties related to uncertain tax positions as income tax expense, if applicable. There was no interest expense or penalties related to unrecognized tax benefits recorded through December 31, 2019.
F-31
GTY TECHNOLOGY HOLDINGS INC.
NOTES TO CONSOLIDATED FINANCIAL STATEMENTS
Amounts in tables in thousands, except share and per share amounts)
Note 10. Commitments and Contingencies
Successor
Legal Proceedings
From time to time, the Companies may become involved in legal proceedings arising in the ordinary course of its business. The Company is not presently a party to any legal proceedings that, if determined adversely to the Company, would have a material adverse effect on the Company.
In connection with the Business Combination, the Company has been involved in legal proceedings with OpenGov, Inc (“OpenGov”). On February 19, 2020, the Company entered into a settlement agreement with OpenGov to resolve all pending claims without any admission or concession of wrongdoing by the Company or other defendants. Pursuant to the settlement agreement, the Company recorded $3.3 million in acquisition costs for the 2019 Successor Period and accrued expenses as of December 31, 2019. See Note 12.
Indemnification
In the ordinary course of business, the Company may provide indemnification of varying scope and terms to customers, vendors, investors, directors and officers with respect to certain matters, including, but not limited to, losses arising out of our breach of such agreements, services to be provided by the Company, or from intellectual property infringement claims made by third parties. These indemnification provisions may survive termination of the underlying agreement and the maximum potential amount of future payments the Company could be required to make under these indemnification provisions may not be subject to maximum loss clauses. The maximum potential amount of future payments the Company could be required to make under these indemnification provisions is indeterminable. The Company has never paid a material claim, nor have it been sued in connection with these indemnification arrangements.
As of December 31, 2019 and 2018, the Company has not accrued a liability for these indemnification arrangements because the likelihood of incurring a payment obligation, if any, in connection with these indemnification arrangements is not probable or reasonably estimable.
Note 11. Shareholders’ Equity
Initial Public Offering Redemption Shares
In connection with a shareholder meeting called to approve the business combination, the Company provided the holders of its outstanding Class A ordinary shares sold in the Company’s initial public offering (the “public shareholders”) with the opportunity to redeem all or a portion of their public shares. The public shareholders were entitled to redeem their public shares for a pro rata portion of the remaining balance in the trust account established in connection with the Company’s initial public offering for the benefit of the Company’s public shareholders and into which substantially all of the proceeds from the initial public offering were deposited (the “Trust Account”). The remaining 20,289,478 GTY Cayman public shares were recorded at a redemption value and classified as temporary equity upon the completion of the initial public offering, in accordance with Accounting Standards Codification (“ASC”) Topic 480 “Distinguishing Liabilities from Equity.” In connection with the Business Combination, 11,073,040 Class A ordinary shares of GTY were redeemed for $114.0 million, at a per share price of approximately $10.29. The remaining 9,216,438 shares with a redemption value of $88.9 million were transferred to permanent equity.
Subscription Agreement
Immediately prior to the Closing, pursuant to subscription agreements (the “Subscription Agreements”), dated as of various dates from January 9, 2019 through February 12, 2019, by and among GTY and certain institutional and accredited investors party thereto (the “Subscribed Investors”), GTY Cayman issued to the Subscribed Investors an aggregate of
F-32
GTY TECHNOLOGY HOLDINGS INC.
NOTES TO CONSOLIDATED FINANCIAL STATEMENTS
Amounts in tables in thousands, except share and per share amounts)
12,863,098 Class A ordinary shares of GTY for $10.00 per share, for an aggregate cash purchase price of approximately $126.4 million and paid fees of $1.1 million, including three such Subscription Agreements with certain CityBase holders (including Michael Duffy, the chief executive officer of CityBase) for an aggregate of 380,937 Class A ordinary shares of GTY at a price of $10.00 per share, for an aggregate cash purchase price of approximately $3.8 million. The Class A ordinary shares of GTY issued to the Subscribed Investors were cancelled and exchanged on a one-for-one basis for shares of Company common stock at the Closing.
In connection with the Subscription Agreements, immediately prior to the Closing, the Sponsor surrendered to GTY Cayman for cancellation (at no cost to GTY) 231,179 Class B (founder) shares, which have been retroactively adjusted in the accompanying statement of stockholders equity, and sold 500,000 private placement warrants held by it to an accredited investor in a private placement for an aggregate of $250,000 or $0.50 per warrant (which was $1.00 per warrant less than the price originally paid for such warrants).
GTY Merger Share Exchange
In connection with the GTY Merger, all of the issued and outstanding shares of GTY Cayman were exchanged for an equal number of shares of GTY common stock and immediately before the exchange, each outstanding unit was separated into its component Class A ordinary share and warrant. Upon the exchange, 22,978,520 Class A and 13,568,821 Class B shares of GTY Cayman were exchanged for an aggregate of 36,547,341 shares of common stock of GTY.
Shares issued in the Acquisition
As part of the consideration for the Acquisition, the Company issued (a) 11,973,154 shares of common stock (as adjusted by the Measurement Period Adjustment below), of which 3,955,442 are redeemable at the option of the Company (the “Acquisition Redemption Shares”) (see Note 4), (b) 2.6 million Class A and 0.5 million Class C shares (the “Class C Shares”) of Questica Exchangeco (the “Questica Shares”) and 2,161,741 shares of Bonfire Exchangeco shares (collectively, the “Exchange Shares”) that are exchangeable into an equal number of common stock. The Exchange Shares are recorded as common shares of the Company. The Company also issued 1,000,000 Class B shares of Questica Shares which are not exchangeable for common stock and thus have no value. The shares issued as consideration in the Acquisition were valued at $10 per share in the accompanying condensed consolidated financial statements.
The 0.5 million Class C Shares were redeemable at the option of the shareholder at $10 per share, and thus the Company had classified the Class C Shares in the capital stock of Questica Exchangeco as temporary equity in accordance with ASC 480 - "Distinguishing Liabilities from Equity." In June 2019, these shares were redeemed for 0.5 million shares of Common Stock at the market price of $7.72, or $3.9 million, and transferred to permanent equity, and $1.3 million of cash. The incremental $0.2 million above the stated redemption price was recorded as a deemed dividend in the accompanying condensed consolidated financial statements.
In April 2019, 193,645 shares of the Bonfire Exchangeco Shares were converted into the Company’s Common Stock on a one-for-one basis (see Note 4).
For the 2019 Successor Period ended December 31, 2019, there was a Measurement Period Adjustment to change $41,500, or 4,150 shares, of stock consideration to cash consideration (see Note 4).
During the year-ended December 2019, the option to redeem 3,155,961 shares from the acquisition of CityBase was not exercised and expired and the 100,000 OC Redeemable Shares were redeemed. As of December 31, 2019, 525,060 shares of the Acquisition Redemption Shares, resulting from the Redeemable Shares from the acquisition of eCivis, remain redeemable at the option of the Company. The Redeemable Shares from the acquisition of eCivis require the Company to simultaneously redeem the Additional Shares (equal to 40% of the number of Redeemable Shares being redeemed). If the Redeemable Shares are not redeemed by February 12, 2020 and February 12, 2021, respectively, the Company is required to issue additional shares, as calculated based on the number of outstanding Redeemable Shares. See Notes 4 and 12.
F-33
GTY TECHNOLOGY HOLDINGS INC.
NOTES TO CONSOLIDATED FINANCIAL STATEMENTS
Amounts in tables in thousands, except share and per share amounts)
Common Stock – GTY is authorized to issue 400,000,000 shares of common stock with a par value of $0.0001 per share.
In June 2019, the Company issued 3.5 million shares of common stock in a registered direct offering for $25.5 million, at a price of $7.70 per share, net of $1.5 million of offering costs.
In June 2019, two Bonfire employees cashless exercised 284 stock options and the Company issued 117 shares of common stock. For the year ended December 31, 2019, Bonfire employees exercised 112,526 stock options for the issuance of 112,526 shares of common stock. See Note 7.
In December 2019, 97,595 shares of common stock were issued for the vesting of RSUs. See Note 7.
Share Repurchases
In March 2019, the Company redeemed 100,000 shares of common stock, the OC Redeemable Shares (See Note 4), for a promissory note in the principal amount of $1,000,000, which was subsequently repaid in March 2019, and included these in Treasury Stock in the accompanying condensed consolidated balance sheets.
In July 2019, in accordance with the eCivis Agreement and the eCivis Letter Agreement, the Company repurchased 250,000 shares of common stock (178,571 Redeemable Shares and 71,428 Additional Shares) for $2.5 million. These shares were included in Treasury Stock in the accompanying condensed consolidated balance sheets at the stock price on the date of the repurchases, or $1.7 million, and the remaining $0.8 million is included in Loss from repurchase of shares in the condensed consolidated statements of operations and comprehensive loss.
For the 2019 Successor Period, the Company repurchased 266,366 shares of common stock for $2.6 million. These shares were included in Treasury Stock in the accompanying condensed consolidated balance sheets at the stock price on the date of the repurchases, or $2.4 million, and the remaining $0.2 million is included in Loss from repurchase of shares in the condensed consolidated statements of operations and comprehensive loss.
Preferred Shares – GTY is authorized to issue 1,000,000 preferred shares with a par value of $0.0001 per share. As of December 31, 2019, there were no preferred shares issued or outstanding.
Warrants
At December 31, 2019, there were a total of 27,093,334 warrants outstanding. The warrants were originally sold as part of the units offered in the IPO. Each warrant entitles the holder thereof to purchase one share of common stock at a price of $11.50 per share, subject to adjustments. The warrants may be exercised only for a whole number of shares of common stock. No fractional shares will be issued upon exercise of the warrants.
The Company may call the warrants for redemption, in whole and not in part, at a price of $0.01 per warrant, upon not less than 30 days’ prior written notice of redemption to each warrant holder, if, and only if, the reported last sale price of common stock equals or exceeds $18.00 per share for any 20 trading days within a 30-trading day period ending on the third trading day prior to the date the Company sends the notice of redemption to the warrant holders. The warrants were determined to be equity classified in accordance with ASC 815, Derivatives and Hedging.
Note 12. Segment Reporting
The Company conducts the business through the following six operating segments: Bonfire, CityBase, eCivis, Open Counter, Questica and Sherpa.
The accounting policies of the operating segments are the same as those described in Note 3. Non-allocated interest expense and various other administrative costs are reflected in Corporate. Corporate assets include cash and cash
F-34
GTY TECHNOLOGY HOLDINGS INC.
NOTES TO CONSOLIDATED FINANCIAL STATEMENTS
Amounts in tables in thousands, except share and per share amounts)
equivalents, prepaid expenses and other current assets. The following provides operating information about the Company’s reportable segments for the periods presented (in thousands):
|
|
|
GTY |
|
Bonfire |
|
CityBase |
|
eCivis |
|
OpenCounter |
|
Questica |
|
Sherpa |
|
Eliminations |
|
Total |
|||||||||
|
|
|
|
|
|
|
|
|
|
|
|
|
|
|
|
|
|
|
|
|
|
|
|
|
|
|
|
|
|
Successor |
|
|
|
|
|
|
|
|
|
|
|
|
|
|
|
|
|
|
|
|
|
|
|
|
|
|
|
|
February 19, 2019 through December 31, 2019 |
|
|
|
|
|
|
|
|
|
|
|
|
|
|
|
|
|
|
|
|
|
|
|
|
|
|
|
|
Total revenue |
|
$ |
— |
|
$ |
3,863 |
|
$ |
7,122 |
|
$ |
4,742 |
|
$ |
1,408 |
|
$ |
10,005 |
|
$ |
4,375 |
|
$ |
— |
|
$ |
31,515 |
|
Cost of goods sold |
|
|
— |
|
|
1,003 |
|
|
5,063 |
|
|
1,744 |
|
|
367 |
|
|
2,375 |
|
|
1,376 |
|
|
— |
|
|
11,928 |
|
Loss from operations |
|
|
(28,752) |
|
|
(22,860) |
|
|
(32,666) |
|
|
(772) |
|
|
(2,159) |
|
|
(14,346) |
|
|
(2,362) |
|
|
— |
|
|
(103,917) |
|
|
|
|
|
|
|
|
|
|
|
|
|
|
|
|
|
|
|
|
|
|
|
|
|
|
|
|
|
|
Predecessor |
|
|
|
|
|
|
|
|
|
|
|
|
|
|
|
|
|
|
|
|
|
|
|
|
|
|
|
|
January 1, 2019 through February 18, 2019 |
|
|
|
|
|
|
|
|
|
|
|
|
|
|
|
|
|
|
|
|
|
|
|
|
|
|
|
|
Total revenue |
|
$ |
— |
|
$ |
593 |
|
$ |
820 |
|
$ |
673 |
|
$ |
298 |
|
$ |
1,913 |
|
$ |
631 |
|
|
|
|
$ |
4,928 |
|
Cost of goods sold |
|
|
— |
|
|
124 |
|
|
746 |
|
|
267 |
|
|
51 |
|
|
296 |
|
|
130 |
|
|
— |
|
|
1,614 |
|
Loss from operations |
|
|
— |
|
|
(741) |
|
|
(1,499) |
|
|
(265) |
|
|
46 |
|
|
550 |
|
|
354 |
|
|
— |
|
|
(1,555) |
|
|
|
|
|
|
|
|
|
|
|
|
|
|
|
|
|
|
|
|
|
|
|
|
|
|
|
|
|
|
Predecessor |
|
|
|
|
|
|
|
|
|
|
|
|
|
|
|
|
|
|
|
|
|
|
|
|
|
|
|
|
Year Ended December 31, 2018 |
|
|
|
|
|
|
|
|
|
|
|
|
|
|
|
|
|
|
|
|
|
|
|
|
|
|
|
|
Total revenue |
|
$ |
— |
|
$ |
3,190 |
|
$ |
6,773 |
|
$ |
4,951 |
|
$ |
1,707 |
|
$ |
10,099 |
|
$ |
3,090 |
|
$ |
— |
|
$ |
29,810 |
|
Cost of goods sold |
|
|
— |
|
|
809 |
|
|
5,181 |
|
|
1,732 |
|
|
498 |
|
|
1,746 |
|
|
429 |
|
|
— |
|
|
10,395 |
|
Loss from operations |
|
|
— |
|
|
(4,889) |
|
|
(11,452) |
|
|
(1,194) |
|
|
(365) |
|
|
1,296 |
|
|
990 |
|
|
— |
|
|
(15,614) |
|
|
|
|
|
|
|
|
|
|
|
|
|
|
|
|
|
|
|
|
|
|
|
|
|
|
|
|
|
|
Successor |
|
|
|
|
|
|
|
|
|
|
|
|
|
|
|
|
|
|
|
|
|
|
|
|
|
|
|
|
As of December 31, 2019 |
|
|
|
|
|
|
|
|
|
|
|
|
|
|
|
|
|
|
|
|
|
|
|
|
|
|
|
|
Goodwill |
|
$ |
— |
|
$ |
68,744 |
|
$ |
88,327 |
|
$ |
47,140 |
|
$ |
21,956 |
|
$ |
57,971 |
|
$ |
2,497 |
|
$ |
— |
|
$ |
286,635 |
|
Assets |
|
|
25,899 |
|
|
92,803 |
|
|
122,851 |
|
|
59,456 |
|
|
29,995 |
|
|
97,013 |
|
|
6,376 |
|
|
— |
|
|
434,393 |
|
|
|
|
|
|
|
|
|
|
|
|
|
|
|
|
|
|
|
|
|
|
|
|
|
|
|
|
|
|
Predecessor |
|
|
|
|
|
|
|
|
|
|
|
|
|
|
|
|
|
|
|
|
|
|
|
|
|
|
|
|
As of December 31, 2018 |
|
|
|
|
|
|
|
|
|
|
|
|
|
|
|
|
|
|
|
|
|
|
|
|
|
|
|
|
Goodwill |
|
$ |
— |
|
$ |
— |
|
$ |
123 |
|
$ |
585 |
|
$ |
— |
|
$ |
1,810 |
|
$ |
— |
|
$ |
— |
|
$ |
2,518 |
|
Assets |
|
|
— |
|
|
6,329 |
|
|
7,215 |
|
|
2,621 |
|
|
316 |
|
|
11,710 |
|
|
1,377 |
|
|
— |
|
|
29,568 |
Revenues from North America customers accounted for greater than 90% of the Company’s revenues for the periods presented.
Note 13. Subsequent Events
On February 10, 2020, the Compensation Committee of the Board of Directors approved restricted stock unit grants to employees totaling 403,254 shares. Each restricted stock unit entitles the recipient to receive one share of common stock upon vesting of the award.
On February 14, 2020, the Company entered into an unsecured term loan credit facility that provides for borrowing of term loans in an aggregate principal amount of $12.0 million. The credit facility has a maturity date of twelve months from the borrowing date of the term loans. On the closing date, the Company fully drew on the credit facility net of deferred issuance costs of $0.4 million. Amounts outstanding under the credit facility bear interest from the date the term loans are first made until the last day of the fiscal month immediately following the six month anniversary of such initial borrowing date at a rate per annum equal to twelve percent. Commencing on the first day of each fiscal month thereafter, the interest rate shall increase by one percent per annum until the term loans have been paid in full and all commitments under the credit agreement have terminated.
F-35
GTY TECHNOLOGY HOLDINGS INC.
NOTES TO CONSOLIDATED FINANCIAL STATEMENTS
Amounts in tables in thousands, except share and per share amounts)
On February 19, 2020, the Company entered into a settlement agreement with OpenGov, Inc. to resolve all pending claims without any admission or concession of wrongdoing by the Company or other defendants. Pursuant to the settlement agreement, the Company will pay $3.3 million, net of amounts to be paid to OpenGov, Inc. by the Company’s insurers, in exchange for a full and complete release of all claims that were or could have been asserted. This amount has been accrued as of December 31, 2019. See Note 9.
On February 20, 2020, the Company issued 334,254 shares pursuant to the eCivis Cash Waiver Letter, which required the Company to issue additional shares to the holders of the Redeemable Shares if the Redeemable Shares were not redeemed. See Notes 4 and 11.
In February 2020, the Questica Holders converted 1,000,000 exchangeable shares to 1,550,338 Class A exchangeable shares in accordance with the terms in the Questica Agreement and the Questica Letter Agreement.
F-36
Item 9. Changes in and Disagreements with Accountants on Accounting and Financial Disclosure.
None.
Item 9A. Controls and Procedures.
Disclosure Controls and Procedures
Disclosure controls and procedures are controls and other procedures that are designed to ensure that information required to be disclosed in our reports filed or submitted under the Exchange Act is recorded, processed, summarized and reported within the time periods specified in the SEC’s rules and forms. Disclosure controls and procedures include, without limitation, controls and procedures designed to ensure that information required to be disclosed in company reports filed or submitted under the Exchange Act is accumulated and communicated to management, including our Chief Executive Officer and Chief Financial Officer, to allow timely decisions regarding required disclosure.
As required by Rules 13a-15 and 15d-15 under the Exchange Act, our Chief Executive Officer and Chief Financial Officer carried out an evaluation of the effectiveness of the design and operation of our disclosure controls and procedures as of December 31, 2019. Based upon their evaluation, our Chief Executive Officer and Chief Financial Officer concluded that our disclosure controls and procedures (as defined in Rules 13a-15(e) and 15d-15(e) under the Exchange Act) were effective.
Management’s Report on Internal Control Over Financial Reporting
Management is responsible for establishing and maintaining adequate internal control over financial reporting for the Company. Management assessed the effectiveness of our internal control over financial reporting as of December 31, 2019. Based on its assessment, management concluded that our internal control over financial reporting was effective as of December 31, 2019.
Changes in Internal Control Over Financial Reporting
During the most recently completed fiscal quarter, there has been no change in our internal control over financial reporting that has materially affected, or is reasonably likely to materially affect, our internal control over financial reporting.
None.
Item 10. Directors, Executive Officers and Corporate Governance.
Information regarding our Directors is incorporated by reference from the information under the captions “Board of Directors” and “Corporate Governance” in our Proxy Statement for our 2020 Annual Meeting of Stockholders, which will be filed with the SEC within 120 days of December 31, 2019 (“2020 Proxy Statement”). Information regarding our Audit Committee and its Financial Experts is incorporated by reference from the information under the captions “Board Committees” and “Audit Committee Report” in our 2020 Proxy Statement. Information regarding our Executive Officers is incorporated by reference from the information under the caption “Executive Officers” in our 2020 Proxy Statement. Information regarding compliance with Section 16(a) of the Exchange Act is incorporated by reference from the information under the caption "Section 16(a) Beneficial Ownership Reporting Compliance" in our 2020 Proxy Statement.
50
Item 11. Executive Compensation
Incorporated by reference from the information under the captions "Named Executive Officer Compensation," "Director Compensation," "Compensation Discussion and Analysis," "Compensation Committee Interlocks and Insider Participation" and "Compensation Committee Report" in our 2020 Proxy Statement.
Item 12. Security Ownership of Certain Beneficial Owners and Management and Related Stockholder Matters
Incorporated by reference from the information under the captions "Information Regarding Beneficial Ownership of Principal Stockholders, Directors and Management" and "Equity Compensation Plan Information" in our 2020 Proxy Statement.
Item 13. Certain Relationships and Related Transactions, and Director Independence
Incorporated by reference from the information under the captions "Corporate Governance at Groupon," "Board Independence and Expertise" and "Certain Relationships and Related Party Transactions" in our 2020 Proxy Statement.
Item 14. Principal Accountant Fees and Services
Incorporated by reference from the information under the caption "Independent Registered Public Accounting Firm" in our 2020 Proxy Statement.
Item 15. Exhibits, Financial Statement Schedules.
(a)The following documents are filed as part of this Annual Report on Form 10-K:
1.Consolidated Financial Statements: See “Index to Consolidated Financial Statements” at “Item 8. Consolidated Financial Statements and Supplementary Data” herein.
(b)Consolidated Financial Statement Schedules. All schedules are omitted for the reason that the information is included in the consolidated financial statements or the notes thereto or that they are not required or are not applicable.
(c)Exhibits: The exhibits listed in the Exhibit Index below are filed or incorporated by reference as part of this Annual Report on Form 10-K.
51
Exhibit Index
|
Exhibit No. |
|
Description |
|
2.1 |
|
|
|
|
|
|
|
2.2 |
|
Arrangement Agreement, dated September 12, 2018, by and among Bonfire Interactive Ltd., GTY Cayman, 1176370 B.C. Unlimited Liability Company, 1176363 B.C. Ltd. and the Bonfire Holders’ Representative named therein (incorporated by reference to Exhibit 2.2 to GTY Cayman’s Current Report on Form 8-K filed with the SEC on September 12, 2018), as amended by Amendment No. 1 thereto, dated as of October 31, 2018 (incorporated by reference to Exhibit 2.1 to GTY Cayman’s Current Report on Form 8-K filed with the SEC on November 5, 2018) and Amendment No. 2 thereto, dated December 28, 2018 (incorporated by reference to Exhibit 2.1 to GTY Cayman’s Current Report on Form 8-K filed with the SEC on January 4, 2019). |
|
|
|
|
|
2.3 |
|
Agreement and Plan of Merger, dated September 12, 2018, by and among CityBase, Inc., GTY Cayman, GTY Technology Holdings Inc. (Massachusetts), GTY CB Merger Sub, Inc. and Shareholder Representative Services LLC (incorporated by reference to Exhibit 2.3 to GTY Cayman’s Current Report on Form 8-K filed with the SEC on September 12, 2018), as amended by Amendment No. 1 thereto, dated October 31, 2018 (incorporated by reference to GTY Cayman’s Current Report on Form 8-K filed with the SEC on November 5, 2018), Amendment No. 2 thereto, dated December 28, 2018 (incorporated by reference to Exhibit 2.2 to GTY Cayman’s Current Report on Form 8-K filed with the SEC on January 4, 2019) and Amendment No. 3 thereto, dated February 12, 2019 (incorporated by reference to Exhibit 2.1 to GTY Cayman’s Current Report on Form 8-K filed with the SEC on February 14, 2019). |
|
|
|
|
|
2.4 |
|
Amended and Restated Agreement and Plan of Merger, dated December 28, 2018, by and among eCivis Inc., GTY Cayman, GTY EC Merger Sub, Inc. and the eCivis Holders’ Representative named therein. (incorporated by reference to Exhibit 2.3 to GTY Cayman’s Current Report on Form 8-K filed with the SEC on January 4, 2019), as amended by Amendment No. 1 thereto, dated January 8, 2018 (incorporated by reference to Exhibit 2.1 to GTY Cayman’s Current Report on Form 8-K filed with the SEC on January 14, 2019). |
|
|
|
|
|
2.5 |
|
|
|
|
|
|
|
2.6 |
|
Share Purchase Agreement, dated September 12, 2018, by and among Questica Inc., Questica USCDN Inc., GTY Cayman, Fernbrook Homes (Hi-Tech) Limited, 1176368 B.C. Ltd. and each of the Questica Holders named therein (incorporated by reference to Exhibit 2.6 to GTY Cayman’s Current Report on Form 8-K filed with the SEC on September 12, 2018) as amended by Amendment No. 1 thereto, dated October 31, 2018 (incorporated by reference to the Exhibit 2.5 to GTY Cayman’s Current Report on Form 8-K filed with the SEC on November 5, 2018), Amendment No. 2 thereto, dated December 28, 2018 (incorporated by reference to Exhibit 2.5 to GTY Cayman’s Current Report on Form 8-K filed with the SEC on January 4, 2019) and Amendment No. 3 thereto, dated July 29, 2019 (incorporated by reference to Exhibit 2.1 to the Company's Quarterly Report on Form 10-Q filed with the SEC on November 7, 2019).
|
|
|
|
|
52
|
2.7 |
|
Unit Purchase Agreement, dated September 12, 2018, by and among Sherpa Government Solutions LLC, GTY Cayman, the Sherpa Holders named therein and the Sherpa Holders’ Representative named therein (incorporated by reference to Exhibit 2.7 to GTY Cayman’s Current Report on Form 8-K filed with the SEC on September 12, 2018) as amended by Amendment No. 1 thereto, dated October 31, 2018 (incorporated by reference to the Exhibit 2.6 to GTY Cayman’s Current Report on Form 8-K filed with the SEC on November 5, 2018) and Amendment No. 2 thereto, dated December 28, 2018 (incorporated by reference to Exhibit 2.6 to GTY Cayman’s Current Report on Form 8-K filed with the SEC on January 4, 2019). |
|
2.8 |
|
|
|
|
|
|
|
2.9 |
|
|
|
|
|
|
|
2.10 |
|
|
|
|
|
|
|
2.11 |
|
|
|
|
|
|
|
2.12 |
|
|
|
|
|
|
|
2.13 |
|
|
|
|
|
|
|
3.1 |
|
|
|
|
|
|
|
3.2 |
|
|
|
|
|
|
|
3.3 |
|
|
|
4.1 |
|
|
|
|
|
|
|
4.2 |
|
|
|
|
|
|
|
4.3 |
|
53
|
|
|
|
|
4.4 |
|
|
|
|
|
|
|
4.5 |
|
|
|
|
|
|
|
10.1 |
|
|
|
|
|
|
|
10.2 |
|
|
|
|
|
|
|
10.3 |
|
|
|
|
|
|
|
10.4 |
|
|
|
|
|
|
|
10.5 |
|
|
|
|
|
|
|
10.6 |
|
|
|
|
|
|
|
10.7 |
|
|
|
|
|
|
|
10.8 |
|
|
|
|
|
|
|
10.9 |
|
|
|
|
|
|
|
10.10 |
|
|
|
|
|
|
|
10.11 |
|
|
|
|
|
|
|
10.12 |
|
|
|
|
|
|
|
21.1 |
|
|
|
|
|
|
54
|
24.1 |
|
Powers of Attorney (included on the signature page of the Registration Statement). |
|
|
|
|
|
31.1 |
|
|
|
|
|
|
|
31.2 |
|
|
|
|
|
|
|
32.1 |
|
|
|
|
|
|
|
32.2 |
|
|
|
|
|
|
|
101.INS |
|
XBRL Instance Document |
|
|
|
|
|
101.SCH |
|
XBRL Taxonomy Extension Schema Document |
|
|
|
|
|
101.CAL |
|
XBRL Taxonomy Extension Calculation Linkbase Document |
|
|
|
|
|
101.DEF |
|
XBRL Taxonomy Extension Definition Linkbase Document |
|
|
|
|
|
101.LAB |
|
XBRL Taxonomy Extension Label Linkbase Document |
|
|
|
|
|
101.PRE |
|
XBRL Taxonomy Extension Presentation Linkbase Document |
55
SIGNATURES
Pursuant to the requirements of Section 13 or 15(d) of the Securities Exchange Act of 1934, as amended, the Registrant has duly caused this Report to be signed on its behalf by the undersigned, thereunto duly authorized.
|
|
GTY TECHNOLOGY HOLDINGS INC. |
|
|
|
|
|
|
Date: March 13, 2020 |
By: |
/s/ Stephen Rohleder |
|
|
|
Stephen Rohleder |
|
|
|
Chief Executive Officer and Chairman |
POWER OF ATTORNEY
KNOW ALL PERSONS BY THESE PRESENTS, that each person whose signature appears below constitutes and appoints Stephen Rohleder and Harry L. You and each or any one of them, his true and lawful attorney-in-fact and agent, with full power of substitution and resubstitution, for him and in his name, place and stead, in any and all capacities, to sign any and all amendments to this Annual Report on Form 10-K, and to file the same, with all exhibits thereto, and other documents in connection therewith, with the United States Securities and Exchange Commission, granting unto said attorneys-in-fact and agents, and each of them, full power and authority to do and perform each and every act and thing requisite and necessary to be done in connection therewith, as fully to all intents and purposes as he might or could do in person, hereby ratifying and confirming all that said attorneys-in-fact and agents, or any of them, or their or his substitutes or substitute, may lawfully do or cause to be done by virtue hereof.
Pursuant to the requirements of the Securities Exchange Act of 1934, as amended, this Annual Report on Form 10-K has been signed below by the following persons on behalf of the Registrant in the capacities and on the dates indicated.
|
/s/ Stephen Rohleder |
|
Chief Executive Officer, President and Chairman |
|
March 13, 2020 |
|
Stephen Rohleder |
|
(principal executive officer) |
|
|
|
|
|
|
|
|
|
/s/ Harry L. You |
|
Vice-Chairman |
|
March 13, 2020 |
|
Harry L. You |
|
|
|
|
|
|
|
|
|
|
|
/s/ John J. Curran |
|
Chief Financial Officer, Treasurer |
|
March 13, 2020 |
|
John J. Curran |
|
(principal financial officer) |
|
|
|
|
|
|
|
|
|
/s/ Justin Kerr |
|
Controller and Chief Accounting Officer |
|
March 13, 2020 |
|
Justin Kerr |
|
(principal accounting officer) |
|
|
|
|
|
|
|
|
|
/s/ Randolph Cowen |
|
Director |
|
March 13, 2020 |
|
Randolph Cowen |
|
|
|
|
|
|
|
|
|
|
|
/s/ William D. Green |
|
Director |
|
March 13, 2020 |
|
William D. Green |
|
|
|
|
|
|
|
|
|
|
|
/s/ Joseph M. Tucci |
|
Director |
|
March 13, 2020 |
|
Joseph M. Tucci |
|
|
|
|
|
|
|
|
|
|
|
/s/ Charles Wert |
|
Director |
|
March 13, 2020 |
|
Charles Wert |
|
|
|
|
56