Attached files
| file | filename |
|---|---|
| EX-99.1 - EXHIBIT 99.1 - Steadfast Apartment REIT, Inc. | ex991cbreconsent123119.htm |
| EX-32.2 - EXHIBIT 32.2 - Steadfast Apartment REIT, Inc. | ex322star12312019.htm |
| EX-32.1 - EXHIBIT 32.1 - Steadfast Apartment REIT, Inc. | ex321star12312019.htm |
| EX-31.2 - EXHIBIT 31.2 - Steadfast Apartment REIT, Inc. | ex312star12312019.htm |
| EX-31.1 - EXHIBIT 31.1 - Steadfast Apartment REIT, Inc. | ex311star12312019.htm |
| EX-23.1 - EXHIBIT 23.1 - Steadfast Apartment REIT, Inc. | ex231star12312019.htm |
| EX-21.1 - EXHIBIT 21.1 - Steadfast Apartment REIT, Inc. | ex211star12312019.htm |
| EX-4.7 - EXHIBIT 4.7 - Steadfast Apartment REIT, Inc. | exhibit47.htm |
UNITED STATES
SECURITIES AND EXCHANGE COMMISSION
Washington, D.C. 20549
FORM 10-K
(Mark One)
ý | ANNUAL REPORT PURSUANT TO SECTION 13 OR 15(d) OF THE SECURITIES EXCHANGE ACT OF 1934 | |
For the fiscal year ended December 31, 2019 | ||
OR
o | TRANSITION REPORT PURSUANT TO SECTION 13 OR 15(d) OF THE SECURITIES EXCHANGE ACT OF 1934 | |
For the transition period from _______ to _______ | ||
Commission file number 000-55428
STEADFAST APARTMENT REIT, INC.
(Exact Name of Registrant as Specified in Its Charter)
Maryland | 36-4769184 | |
(State or Other Jurisdiction of | (I.R.S. Employer | |
Incorporation or Organization) | Identification No.) | |
18100 Von Karman Avenue, Suite 500 | ||
Irvine, California | 92612 | |
(Address of Principal Executive Offices) | (Zip Code) | |
(949) 852-0700
(Registrant’s Telephone Number, Including Area Code)
Securities registered pursuant to Section 12(b) of the Act: None
Title of each class | Trading Symbol(s) | Name of each exchange on which registered |
N/A | N/A | N/A |
Securities registered pursuant to Section 12(g) of the Act:
Common Stock, $0.01 par value per share | ||
(Title of Class) | ||
Indicate by check mark if the registrant is a well-known seasoned issuer, as defined in Rule 405 of the Securities Act. Yes o No ý
Indicate by check mark if the registrant is not required to file reports pursuant to Section 13 or 15(d) of the Act. Yes o No ý
Indicate by check mark whether the registrant: (1) has filed all reports required to be filed by Section 13 or 15(d) of the Securities Exchange Act of 1934 during the preceding 12 months (or for such shorter period that the registrant was required to file such reports), and (2) has been subject to such filing requirements for the past 90 days. Yes ý No o
Indicate by check mark whether the registrant has submitted electronically every Interactive Data File required to be submitted pursuant to Rule 405 of Regulation S-T (§ 232.405 of this chapter) during the preceding 12 months (or for such shorter period that the registrant was required to submit such files). Yes ý No o
Indicate by check mark whether the registrant is a large accelerated filer, an accelerated filer, a non-accelerated filer, a smaller reporting company, or an emerging growth company. See the definitions of “large accelerated filer,” “accelerated filer,” “smaller reporting company,” and “emerging growth company” in Rule 12b-2 of the Exchange Act.
Large Accelerated filer o | Accelerated filer o |
Non-Accelerated filer x | Smaller reporting company o |
Emerging growth company x | |
If an emerging growth company, indicate by check mark if the registrant has elected not to use the extended transition period of complying with any new or revised financial accounting standards provided pursuant to Section 13(a) of the Exchange Act. ý
Indicate by check mark whether the registrant is a shell company (as defined in Rule 12b-2 of the Exchange Act). Yes o No ý
There is no established market for the registrant’s shares of common stock. There were approximately 51,850,018 shares of common stock held by non-affiliates as of June 28, 2019, the last business day of the registrant’s most recently completed second fiscal quarter, for an aggregate market value of $821,304,280, assuming an estimated value per share of $15.84.
As of March 5, 2020, there were 52,875,501 shares of the Registrant’s common stock issued and outstanding.
STEADFAST APARTMENT REIT, INC.
INDEX
Page | |||
PART I | |||
PART II | |||
PART III | |||
PART IV | |||
CAUTIONARY NOTE REGARDING FORWARD-LOOKING STATEMENTS
Certain statements included in this Annual Report on Form 10-K of Steadfast Apartment REIT, Inc. (which is referred to in this Annual Report on Form 10-K, as context requires, as the “Company,” “we,” “us,” or “our”) that are not historical facts (including any statements concerning investment objectives, other plans and objectives of management for future operations or economic performance, or assumptions or forecasts related thereto) are forward-looking statements within the meaning of Section 27A of the Securities Act of 1933, as amended, or the Securities Act, and Section 21E of the Securities Exchange Act of 1934, as amended, or the Exchange Act. These statements are only predictions. We caution that forward-looking statements are not guarantees. Actual events or our investments and results of operations could differ materially from those expressed or implied in any forward-looking statements. Forward-looking statements are typically identified by the use of terms such as “may,” “should,” “expect,” “could,” “intend,” “plan,” “anticipate,” “estimate,” “believe,” “continue,” “predict,” “potential” or the negative of such terms and other comparable terminology.
The forward-looking statements included herein are based upon our current expectations, plans, estimates, assumptions and beliefs that involve numerous risks and uncertainties. Assumptions relating to the foregoing involve judgments with respect to, among other things, future economic, competitive and market conditions and future business decisions, all of which are difficult or impossible to predict accurately and many of which are beyond our control. Although we believe that the expectations reflected in such forward-looking statements are based on reasonable assumptions, our actual results and performance could differ materially from those set forth in the forward-looking statements. Factors that could have a material adverse effect on our operations and future prospects include, but are not limited to:
• | the fact that we have had a net loss for each quarterly and annual period since inception; |
• | changes in economic conditions generally and the real estate and debt markets specifically; |
• | our ability to secure resident leases for our multifamily properties at favorable rental rates; |
• | risks inherent in the real estate business, including resident defaults, potential liability relating to environmental matters and the lack of liquidity of real estate investments; |
• | the fact that we pay fees and expenses to our advisor and its affiliates that were not negotiated on an arm’s-length basis and the fact that the payment of these fees and expenses increases the risk that our stockholders will not earn a profit on their investment in us; |
• | our ability to retain our executive officers and other key personnel of our advisor, our property manager and other affiliates of our advisor; |
• | our ability to generate sufficient cash flows to pay distributions for our stockholders; |
• | our level of indebtedness following our mergers with Steadfast Income REIT, Inc. and Steadfast Apartment REIT III, Inc.; |
• | legislative or regulatory changes (including changes to the laws governing the taxation of real estate investment trusts, or REITs); |
• | the availability of capital; |
• | changes in interest rates; and |
• | changes to generally accepted accounting principles, or GAAP. |
Any of the assumptions underlying forward-looking statements could be inaccurate. You are cautioned not to place undue reliance on any forward-looking statements included in this annual report. All forward-looking statements are made as of the date of this annual report and the risk that actual results will differ materially from the expectations expressed in this annual report will increase with the passage of time. Except as otherwise required by the federal securities laws, we undertake no obligation to publicly update or revise any forward-looking statements after the date of this annual report, whether as a result of new information, future events, changed circumstances or any other reason. In light of the significant uncertainties inherent in the forward-looking statements included in this annual report, the inclusion of such forward-looking statements should not be regarded as a representation by us or any other person that the objectives and plans set forth in this annual report will be achieved. All forward looking statements included herein should be read in connection with the risks identified in Part I. Item 1A. “Risk Factors” of this Annual Report on Form 10-K.
i
PART I
ITEM 1. BUSINESS
Overview
Steadfast Apartment REIT, Inc. (which is referred to in this annual report, as context requires, as the “Company,” “we,” “us,” or “our”) was formed on August 22, 2013, as a Maryland corporation and elected to qualify as a real estate investment trust, or REIT, for U.S. federal income tax purposes commencing with its taxable year ended December 31, 2014. We own and operate a diverse portfolio of real estate investments, primarily in the multifamily sector located throughout the United States. In addition to our focus on multifamily properties, we may also make selective strategic acquisitions of other types of commercial properties. We may also acquire or originate mortgage, mezzanine, bridge and other real estate loans and equity securities of other real estate companies. As of December 31, 2019, we owned 32 multifamily properties comprised of a total of 11,195 apartment homes and one parcel of land held for the development of apartment homes. For more information on our real estate portfolio, see “—Our Real Estate Portfolio” below.
On December 30, 2013, we commenced our initial public offering of up to 66,666,667 shares of common stock at an initial price of $15.00 per share and up to 7,017,544 shares of common stock pursuant to our distribution reinvestment plan, at an initial price of $14.25 per share. On March 24, 2016, we terminated our initial public offering. As of March 24, 2016, we had sold 48,625,651 shares of common stock for gross offering proceeds of $724,849,631, including 1,011,561 shares of common stock issued pursuant to our distribution reinvestment plan for gross offering proceeds of $14,414,752. Following the termination of our initial public offering, we continue to offer shares of our common stock pursuant to our distribution reinvestment plan. As of December 31, 2019, we had sold 54,276,237 shares of common stock for gross offering proceeds of $809,562,356, including 6,662,210 shares of common stock issued pursuant to our distribution reinvestment plan for proceeds of $99,127,477.
On March 14, 2018, our board of directors determined an estimated value per share of our common stock of $15.18 as of December 31, 2017. On March 12, 2019, our board of directors determined an estimated value per share of our common stock of $15.84 as of December 31, 2018. For more information on the determinations of the estimated value per share of our common stock, see Item 5. “Market for Registrant’s Common Equity, Related Stockholder Matters and Purchases of Equity Securities—Estimated Value Per Share.” In connection with the determination of our estimated value per share, our board of directors determined a price per share for the distribution reinvestment plan of $15.18 and $15.84, effective April 1, 2018 and April 1, 2019, respectively. We intend to establish an updated estimated value per share following the completion of the mergers (defined and discussed below) which closed on March 6, 2020. We expect that the estimated value per share will be as of March 6, 2020 and will be reported by us in a Current Report on Form 8-K. In the future, our board of directors may, in its sole discretion and from time to time, change the price at which we offer shares pursuant to our distribution reinvestment plan to reflect changes in our estimated value per share and other factors that our board of directors deems relevant.
We were externally managed by Steadfast Apartment Advisor, LLC, which we refer to as our “advisor,” pursuant to the Advisory Agreement, as amended, or the advisory agreement, dated December 13, 2013, by and between, us and our advisor. In connection with the closing of the mergers, we and our advisor entered into an Amended and Restated Advisory Agreement dated March 6, 2020. The current term of the Advisory Agreement expires on March 6, 2021. Subject to certain restrictions and limitations, our advisor manages our day-to-day operations and our portfolio of properties and real estate-related assets, sources and presents investment opportunities to our board of directors and provides investment management services on our behalf. The advisor has also entered into an Advisory Services Agreement with Crossroads Capital Advisors, LLC, or Crossroads Capital Advisors, whereby Crossroads Capital Advisors provides advisory services to us on behalf of the advisor. Stira Capital Markets Group, LLC (formerly known as Steadfast Capital Markets Group, LLC), or the dealer manager, an affiliate of Steadfast REIT Investments, LLC, our sponsor, served as the dealer manager for our initial public offering. Our advisor, along with the dealer manager, provides marketing, investor relations and other administrative services on our behalf.
Substantially all of our business was conducted through Steadfast Apartment REIT Operating Partnership, L.P., a Delaware limited partnership formed on August 27, 2013, which we refer to as our “operating partnership.” We are the sole general partner of our operating partnership and our wholly-owned subsidiary, Steadfast Apartment REIT Limited Partner, LLC, is the sole limited partner of our operating partnership. Following completion of the mergers on March 6, 2020, we now conduct our business through the operating partnership, Steadfast Income REIT Operating Partnership, L.P. and Steadfast Apartment REIT III Operating Partnership, L.P.
Merger with Steadfast Income REIT, Inc.
On August 5, 2019, we, Steadfast Income REIT, Inc., or SIR, our operating partnership, Steadfast Income REIT Operating Partnership, L.P., the operating partnership of SIR, and SI Subsidiary, LLC, our wholly-owned subsidiary, or SIR Merger Sub, entered into an Agreement and Plan of Merger, or the SIR Merger Agreement.
1
Pursuant to the terms and conditions of the SIR Merger Agreement, on March 6, 2020, SIR merged with and into SIR Merger Sub, or the SIR Merger, with SIR Merger Sub surviving the SIR Merger. Following the SIR Merger, SIR Merger Sub, as the surviving entity, will continue as our wholly-owned subsidiary. In accordance with the applicable provisions of the Maryland General Corporation Law, or MGCL, the separate existence of SIR ceased.
At the effective time of the SIR Merger, each issued and outstanding share of SIR common stock (or a fraction thereof), $0.01 par value per share, or the SIR Common Stock, converted into 0.5934 shares of our common stock.
Merger with Steadfast Apartment REIT III, Inc.
On August 5, 2019, we, Steadfast Apartment REIT III, Inc., or STAR III, our operating partnership, Steadfast Apartment REIT III Operating Partnership, L.P., the operating partnership of STAR III, and SIII Subsidiary, LLC, our wholly-owned subsidiary, or STAR III Merger Sub, entered into an Agreement and Plan of Merger, or the STAR III Merger Agreement.
Pursuant to the terms and conditions of the STAR III Merger Agreement, on March 6, 2020, STAR III merged with and into STAR III Merger Sub, or the STAR III Merger and together with the SIR Merger, the “mergers”, with STAR III Merger Sub surviving the STAR III Merger. Following the STAR III Merger, STAR III Merger Sub, as the surviving entity, will continue as our wholly-owned subsidiary. In accordance with the applicable provisions of the MGCL, the separate existence of STAR III ceased.
At the effective time of the STAR III Merger, each issued and outstanding share of STAR III common stock (or a fraction thereof), $0.01 par value per share, or the STAR III Common Stock, was converted into 1.430 shares of our common stock.
Each of SIR and STAR III were non-listed REITs sponsored by our sponsor and their external advisors were affiliates of our advisor.
Combined Company
The combined company after the mergers retains the name “Steadfast Apartment REIT, Inc.” Each merger is intended to qualify as a “reorganization” under, and within the meaning of, Section 368(a) of the Internal Revenue Code of 1986, as amended, or the Internal Revenue Code.
As of the closing of the mergers, our portfolio (unaudited) consisted of (1) 69 properties (including one property held for development) in 14 states, with an average effective rent of $1,173 and (2) a 10% interest in one unconsolidated joint venture that owned 20 multifamily properties with a total of 4,584 apartment homes. Based on occupancy as of December 31, 2019, our portfolio had an occupancy rate of 94.9%, an average age of 20 years and gross real estate assets value of $3,375,635,000 (unaudited).
As a result of the completion of the mergers, our financial information materially changed; however, the financial information included in this Annual Report on Form 10-K reflects only our stand-alone, historical financial results.
2
Our Structure
Our sponsor, Steadfast REIT Investments, LLC, a Delaware limited liability company, is indirectly controlled by Rodney F. Emery, the chairman of our board of directors and our chief executive officer. We refer to each of our sponsor, advisor, dealer manager and their affiliates as “a Steadfast Companies affiliate” and collectively as “Steadfast Companies affiliates.” The chart below shows the relationships among our company and various Steadfast Companies affiliates following the SIR Merger and the STAR III Merger.
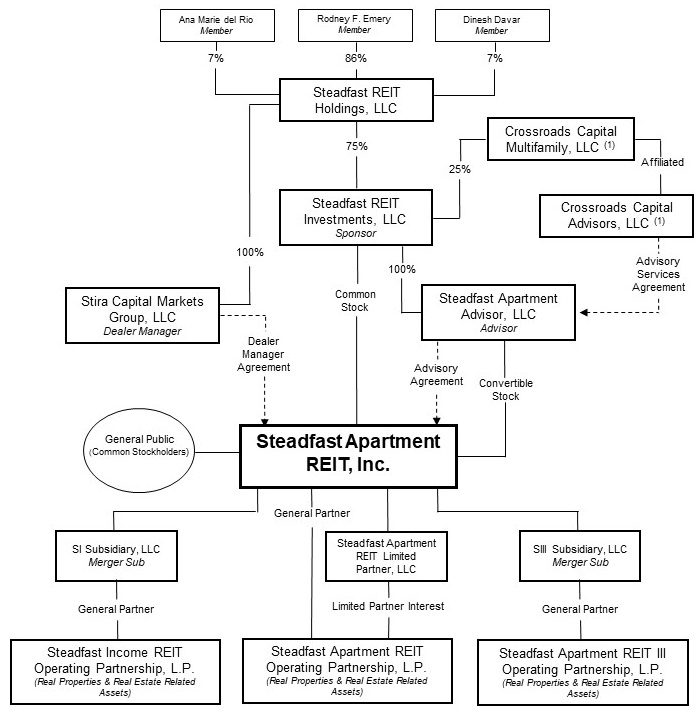 _______________
(1) | Crossroads Capital Multifamily, LLC and Crossroads Capital Advisors, LLC are affiliated entities, each being wholly-owned subsidiaries of Crossroads Capital Group, LLC. |
3
Objectives and Strategies
Our investment objectives are to:
• | realize capital appreciation in the value of our investments over the long term; and |
• | pay attractive and stable cash distributions to stockholders. |
We intend to use cash flows from operations to continue to invest in and manage our real estate investments located throughout the United States, with the objective of generating stable rental income and maximizing the opportunity for future capital appreciation. We believe that a majority of our portfolio consists of established, well-positioned, institutional-quality apartment communities with high occupancies and consistent rental revenue. Established apartment communities are typically older, more affordable apartments that cater to the middle-class segment of the workforce, with monthly rental rates that accommodate the generally accepted guidelines for housing costs as a percentage of gross income. As a result, we believe the demand for apartment housing at these properties is higher compared to other types of multifamily properties and is generally more consistent in all economic cycles. We continue to implement a value-enhancement strategy on the apartment homes we acquired. Our value-enhancement strategy involves the acquisition of under-managed, stabilized apartment communities in high job and population growth neighborhoods and the investment of additional capital to make strategic upgrades of the interiors of the apartment homes. These opportunities vary in degree based on the specific business plan for each asset, but could include new appliances, better cabinets, countertops and flooring.
2019 Highlights
During 2019, we:
• | entered into merger agreements to combine our company with SIR and STAR III; |
• | invested $26,689,336 in improvements to our real estate investment portfolio; |
• | acquired land for the new development of 176 apartment homes for a purchase price of $2,469,183; |
• | invested $2,920,469 in development and construction to our real estate held for development; |
• | disposed of two multifamily properties, for a gross sales price of $59,100,000, exclusive of closing costs, resulting in a gain on sales of real estate of $11,651,565; |
• | paid cash distributions of $25,681,391 and distributed $21,222,382 in shares of our common stock pursuant to our distribution reinvestment plan, which constituted a 6.0% annualized distribution rate to our stockholders based on our initial public offering price of $15.00 per share; |
• | generated cash flows from operations of $29,078,255, although we incurred a net loss of $38,524,316; |
• | generated net operating income, or NOI, of $96,636,421 (for further information on how we calculate NOI and a reconciliation of NOI to net loss, see Item 7. “Management’s Discussion and Analysis of Financial Condition and Results of Operations—Net Operating Income”); |
• | generated funds from operations, or FFO, of $23,604,194 (for further information on how we calculate FFO and a reconciliation of FFO to net loss, see Item 7. “Management’s Discussion and Analysis of Financial Condition and Results of Operations—Funds From Operations and Modified Funds From Operations”); |
• | generated modified funds from operations, or MFFO, of $25,378,778 (for further information on how we calculate MFFO and a reconciliation of MFFO to net loss, see Item 7. “Management’s Discussion and Analysis of Financial Condition and Results of Operations—Funds from Operations and Modified Funds from Operations”); and |
• | received proceeds of $56,890,038, net of principal payments of $202,728,946, deferred financing costs of $1,573,716 and loan financing deposits of $452,300, related to the refinancing of a portion of our outstanding debt (for further information on the 2019 refinancing transactions, please refer to Item 7. “Management’s Discussion and Analysis of Financial Condition and Results of Operations—Liquidity and Capital Resources”). |
4
Our Real Estate Portfolio
As of December 31, 2019, we owned the 32 multifamily properties and one parcel of land held for the development of apartment homes described below.
Property Name | Location | Number of Homes | Average Monthly Occupancy | Average Monthly Rent(1) | Purchase Date | Contract Purchase Price | Mortgage Debt Outstanding(2) | ||||||||||||||||
1 | Villages at Spring Hill Apartments | Spring Hill, TN | 176 | 96.0 | % | $ | 1,120 | 5/22/2014 | $ | 14,200,000 | (3 | ) | |||||||||||
2 | Harrison Place Apartments | Indianapolis, IN | 307 | 94.1 | % | 992 | 6/30/2014 | 27,864,250 | (3 | ) | |||||||||||||
3 | Terrace Cove Apartment Homes | Austin, TX | 304 | 95.1 | % | 966 | 8/28/2014 | 23,500,000 | (3 | ) | |||||||||||||
4 | The Residences on McGinnis Ferry | Suwanee, GA | 696 | 96.0 | % | 1,344 | 10/16/2014 | 98,500,000 | (3 | ) | |||||||||||||
5 | The 1800 at Barrett Lakes | Kennesaw, GA | 500 | 92.4 | % | 1,076 | 11/20/2014 | 49,000,000 | 40,623,442 | ||||||||||||||
6 | The Oasis | Colorado Springs, CO | 252 | 94.8 | % | 1,424 | 12/19/2014 | 40,000,000 | 39,499,673 | ||||||||||||||
7 | Columns on Wetherington | Florence, KY | 192 | 91.7 | % | 1,220 | 2/26/2015 | 25,000,000 | (3 | ) | |||||||||||||
8 | Preston Hills at Mill Creek | Buford, GA | 464 | 91.6 | % | 1,192 | 3/10/2015 | 51,000,000 | (3 | ) | |||||||||||||
9 | Eagle Lake Landing Apartments | Speedway, IN | 277 | 96.8 | % | 905 | 3/27/2015 | 19,200,000 | (3 | ) | |||||||||||||
10 | Reveal on Cumberland | Fishers, IN | 220 | 95.0 | % | 1,144 | 3/30/2015 | 29,500,000 | 20,827,267 | ||||||||||||||
11 | Heritage Place Apartments | Franklin, TN | 105 | 97.1 | % | 1,145 | 4/27/2015 | 9,650,000 | 8,590,932 | ||||||||||||||
12 | Rosemont at East Cobb | Marietta, GA | 180 | 96.7 | % | 1,100 | 5/21/2015 | 16,450,000 | 13,258,252 | ||||||||||||||
13 | Ridge Crossings Apartments | Hoover, AL | 720 | 92.8 | % | 1,012 | 5/28/2015 | 72,000,000 | 57,668,758 | ||||||||||||||
14 | Bella Terra at City Center | Aurora, CO | 304 | 96.1 | % | 1,221 | 6/11/2015 | 37,600,000 | (3 | ) | |||||||||||||
15 | Hearthstone at City Center | Aurora, CO | 360 | 95.0 | % | 1,257 | 6/25/2015 | 53,400,000 | (3 | ) | |||||||||||||
16 | Arbors at Brookfield | Mauldin, SC | 702 | 92.7 | % | 923 | 6/30/2015 | 66,800,000 | (3 | ) | |||||||||||||
17 | Carrington Park | Kansas City, MO | 298 | 95.3 | % | 1,011 | 8/19/2015 | 39,480,000 | (3 | ) | |||||||||||||
18 | Delano at North Richland Hills | North Richland Hills, TX | 263 | 95.8 | % | 1,486 | 8/26/2015 | 38,500,000 | 31,814,165 | ||||||||||||||
19 | Meadows at North Richland Hills | North Richland Hills, TX | 252 | 94.4 | % | 1,392 | 8/26/2015 | 32,600,000 | 26,580,102 | ||||||||||||||
20 | Kensington by the Vineyard | Euless, TX | 259 | 95.8 | % | 1,507 | 8/26/2015 | 46,200,000 | 34,111,658 | ||||||||||||||
21 | Monticello by the Vineyard | Euless, TX | 354 | 96.3 | % | 1,344 | 9/23/2015 | 52,200,000 | 41,229,964 | ||||||||||||||
22 | The Shores | Oklahoma City, OK | 300 | 94.7 | % | 1,016 | 9/29/2015 | 36,250,000 | 23,653,152 | ||||||||||||||
23 | Lakeside at Coppell | Coppell, TX | 315 | 96.8 | % | 1,716 | 10/7/2015 | 60,500,000 | 47,883,143 | ||||||||||||||
24 | Meadows at River Run | Bolingbrook, IL | 374 | 90.1 | % | 1,364 | 10/30/2015 | 58,500,000 | 42,438,707 | ||||||||||||||
25 | PeakView at T-Bone Ranch | Greeley, CO | 224 | 93.3 | % | 1,373 | 12/11/2015 | 40,300,000 | (3 | ) | |||||||||||||
26 | Park Valley Apartments | Smyrna, GA | 496 | 94.4 | % | 1,068 | 12/11/2015 | 51,400,000 | 48,575,513 | ||||||||||||||
27 | PeakView by Horseshoe Lake | Loveland, CO | 222 | 93.7 | % | 1,396 | 12/18/2015 | 44,200,000 | 38,003,137 | ||||||||||||||
28 | Stoneridge Farms | Smyrna, TN | 336 | 95.2 | % | 1,196 | 12/30/2015 | 47,750,000 | 45,340,947 | ||||||||||||||
29 | Fielder’s Creek | Englewood, CO | 217 | 96.3 | % | 1,219 | 3/23/2016 | 32,400,000 | — | ||||||||||||||
30 | Landings of Brentwood | Brentwood, TN | 724 | 96.8 | % | 1,262 | 5/18/2016 | 110,000,000 | (4 | ) | |||||||||||||
31 | 1250 West Apartments | Marietta, GA | 468 | 93.6 | % | 1,061 | 8/12/2016 | 55,772,500 | (3 | ) | |||||||||||||
32 | Sixteen50 @ Lake Ray Hubbard | Rockwall, TX | 334 | 96.4 | % | 1,492 | 9/29/2016 | 66,050,000 | (3 | ) | |||||||||||||
33 | Garrison Station Development(5) | Murfreesboro, TN | — | — | % | — | 5/30/2019 | 5,687,978 | — | ||||||||||||||
11,195 | 94.6%(6) | $ | 1,200 | $ | 1,451,454,728 | $ | 560,098,815 | ||||||||||||||||
________________
(1) | Average monthly rent is based upon the effective rental income for the month of December 2019 after considering the effect of vacancies, concessions and write-offs. |
(2) | Mortgage debt outstanding is net of deferred financing costs associated with the loans for each individual property listed above but excludes the principal balance of $551,669,000 and associated deferred financing costs of $3,208,770 related to the refinancings pursuant to our Master Credit Facility Agreement, or MCFA. |
(3) | Properties secured pursuant to the terms of the MCFA. |
(4) | At December 31, 2018, Landings of Brentwood was pledged as collateral pursuant to our line of credit. On January 9, 2019, we terminated the line of credit. |
(5) | We acquired the Garrison Station property on May 30, 2019, which included unimproved land, currently zoned as a Planned Unit Development, or PUD. The current zoning permits the development of the property into a multifamily community including 176 apartment homes of 1, 2 and 3-bedrooms with a typical mix for this market. |
5
(6) | At December 31, 2019, our portfolio was approximately 96.0% leased, calculated using the number of occupied and contractually leased apartment homes divided by total apartment homes. As of December 31, 2019, no single tenant accounted for greater than 10% of our 2019 gross annualized rental revenues. |
We plan to invest approximately $10 million to $15 million during the year ending December 31, 2020, for the combined company, for interior renovations at certain properties in our portfolio. These renovations are primarily to enhance the interior amenities of the apartment homes and will be performed initially on vacant homes and thereafter on homes vacated from time to time in the ordinary course.
The following information generally applies to all of our properties:
• | we believe all of our properties are adequately covered by insurance and are suitable for their intended purposes; |
• | except as noted above, we have no plans for any material renovations, improvements or developments with respect to any of our properties; and |
• | our properties face competition in attracting new residents and retaining current residents from other multifamily properties in and around their respective submarkets. |
Leverage
We use secured debt, and intend to use in the future secured and unsecured debt, as a means of providing additional funds for the acquisition, development or renovation of our properties. We believe that the careful use of borrowings will help us achieve our diversification goals and potentially enhance the returns on our investments. At December 31, 2019, our debt was approximately 60% of the value of our properties, as determined by the most recent valuations performed by an independent third-party appraiser as of December 31, 2019. Going forward, we expect that our borrowings (after debt amortization) will be approximately 55% to 65% of the value of our properties and other real estate-related assets. Under our Articles of Amendment and Restatement, which we refer to as our “charter,” we are prohibited from borrowing in excess of 300% of the value of our net assets which generally approximates to 75% of the aggregate cost of our assets unless such excess is approved by a majority of the independent directors and disclosed to stockholders, along with a justification for such excess, in our next quarterly report. In such event, we will monitor our debt levels and take action to reduce any such excess as soon as practicable. Our aggregate borrowings are reviewed by our board of directors at least quarterly. At December 31, 2019, our borrowings were not in excess of 300% of the value of our net assets.
Employees
We have no paid employees. The employees of our advisor and its affiliates provide management, acquisition, advisory and certain administrative services for us.
Competition
We are subject to significant competition in seeking real estate investments and residents. We compete with many third parties engaged in real estate investment activities, including other REITs, specialty finance companies, savings and loan associations, banks, mortgage bankers, insurance companies, mutual funds, institutional investors, investment banking firms, lenders, hedge funds, governmental bodies and other entities. Many of our competitors have substantially greater financial and other resources than we have and may have substantially more operating experience than us. They may also enjoy significant competitive advantages that result from, among other things, a lower cost of capital.
The multifamily property market in particular is highly competitive. This competition could reduce occupancy levels and revenues at our multifamily properties, which would adversely affect our operations. We face competition from many sources, including from other multifamily properties in our target markets. In addition, overbuilding of multifamily properties may occur, which would increase the number of multifamily homes available and may decrease occupancy and unit rental rates. Furthermore, multifamily properties we acquire most likely compete, or will compete, with numerous housing alternatives in attracting residents, including owner occupied single- and multifamily homes available to rent or purchase. Competitive housing in a particular area and the increasing affordability of owner occupied single- and multifamily homes available to rent or buy could adversely affect our ability to retain our residents, lease apartment homes and increase or maintain rental rates.
We may also compete with affiliates of our sponsor that have similar investment objectives as us. To the extent that we compete with any other program affiliated with our sponsor for investments, our sponsor will face potential conflicts of interest and there is a risk that our sponsor will select investment opportunities for us that provide lower returns than the investments selected for other such programs, or that certain otherwise attractive investment opportunities will not be available to us.
6
Regulations
Our investments are subject to various federal, state, and local laws, ordinances, and regulations, including, among other things, zoning regulations, land use controls, environmental controls relating to air and water quality, noise pollution, and indirect environmental impacts such as increased motor vehicle activity. We believe that we have all permits and approvals necessary under current law to operate our investments.
Income Taxes
We elected to be taxed as a REIT under the Internal Revenue Code, and operated as such commencing with the taxable year ended December 31, 2014. To continue to qualify as a REIT, we must meet certain organizational and operational requirements, including requirements relating to the nature of our income and assets and the requirement to distribute at least 90% of our annual REIT taxable income to our stockholders (which is computed without regard to the dividends paid deduction or net capital gain and which does not necessarily equal net income as calculated in accordance with GAAP). As a REIT, we generally will not be subject to federal income tax to the extent we distribute qualifying dividends to our stockholders. If we fail to qualify as a REIT in any taxable year, we would be subject to federal income tax on our taxable income at regular corporate income tax rates and generally would not be permitted to qualify for treatment as a REIT for federal income tax purposes for the four taxable years following the year during which qualification is lost unless we are eligible for relief under certain statutory provisions.
Financial Information About Industry Segments
Our current business consists of owning, managing, operating, leasing, acquiring, developing, investing in, and disposing of real estate assets. We internally evaluate all of our real estate assets as one industry segment, and, accordingly, we do not report segment information.
Available Information
We are subject to the reporting requirements of the Exchange Act and, accordingly, we file annual reports, quarterly reports and other information with the Securities and Exchange Commission, or SEC. Access to copies of our Annual Reports on Form 10-K, Quarterly Reports on Form 10-Q, Current Reports on Form 8-K and other filings with the SEC, including amendments to such filings, may be obtained free of charge from our website, http://www.steadfastreits.com. These filings are available promptly after we file them with, or furnish them to, the SEC. We are not incorporating our website or any information from the website into this annual report. The SEC also maintains a website, http://www.sec.gov, that contains our Annual Reports on Form 10-K, Quarterly Reports on Form 10-Q, Current Report on Form 8-K and other filings with the SEC. Access to these filings is free of charge.
ITEM 1A. RISK FACTORS
The following are some of the risks and uncertainties that could cause our actual results to differ materially from those presented in our forward-looking statements. The risks and uncertainties described below are not the only ones we face but do represent those risks and uncertainties that we believe are material to us. Additional risks and uncertainties not presently known to us or that we currently deem immaterial may also harm our business. References to “shares” and “our common stock” refer to the shares of common stock of Steadfast Apartment REIT, Inc.
General Investment Risks
From inception through December 31, 2019, we have experienced annual net losses and may experience similar losses in the future.
From inception through December 31, 2019, we incurred a net loss of $221,552,200. We cannot assure you that we will be profitable in the future or that we will recognize growth in the value of our assets.
There is no public trading market for shares of our common stock and we are not required to effectuate a liquidity event by a certain date. As a result, it will be difficult for you to sell your shares of common stock and, if you are able to sell your shares, you are likely to sell them at a substantial discount. Our stockholders also are limited in their ability to sell shares pursuant to our share repurchase plan and may have to hold their shares for an indefinite period of time.
There is no public market for the shares of our common stock and we have no obligation to list our shares on any public securities market or provide any other type of liquidity to our stockholders by a particular date. It is anticipated that our board of directors will consider a liquidity event within five years after the completion of our offering stage; however, the timing of
7
any such event would be significantly dependent upon economic and market conditions. We terminated our initial public offering on March 24, 2016. Because there is no public trading market for shares of common stock, it will be difficult for you to sell your shares of common stock. Even if you are able to sell your shares of common stock, the absence of a public market may cause the price received for any shares of our common stock sold to be less than what you paid or less than your proportionate value of the assets we own. We have adopted a share repurchase plan but it is limited in terms of the amount of shares that stockholders may sell to us each quarter. Our board of directors can amend, suspend, or terminate our share repurchase plan upon 30 days’ notice. The restrictions of our share repurchase plan limit our stockholders’ ability to sell their shares should they require liquidity and limit our stockholders’ ability to recover the value they invested. See Item 5. “Market for Registrant’s Common Equity, Related Stockholder Matters and Purchases of Equity Securities—Share Repurchase Plan” for more information regarding the limitations of our share repurchase plan. As a result, you should be prepared to hold your shares for an indefinite period of time.
We have paid, and it is likely we will continue to pay, distributions from sources other than our cash flow from operations. To the extent that we pay distributions from sources other than our cash flow from operations, we will have reduced funds available for investment and the overall return to our stockholders may be reduced.
Our organizational documents permit us to pay distributions from any source, including net proceeds from our public offerings, borrowings, advances from our sponsor or advisor and the deferral of fees and expense reimbursements by our advisor, in its sole discretion. To the extent that our cash flow from operations has been or is insufficient to fully cover our distributions, we have paid, and may continue to pay, distributions from sources other than cash flow from operations. We have not established a limit on the amount of proceeds from our public or private securities offerings, or other sources other than cash flow from operations, which we may use to fund distributions.
If we are unable to consistently fund distributions to our stockholders entirely from our cash flow from operations, the value of your shares upon a listing of our common stock, the sale of our assets or any other liquidity event may be reduced. To the extent that we fund distributions from sources other than our cash flow from operations, our funds available for investment will be reduced relative to the funds available for investment if our distributions were funded solely from cash flow from operations, our ability to achieve our investment objectives will be negatively impacted and the overall return to our stockholders may be reduced. In addition, if we make a distribution in excess of our current and accumulated earnings and profits, the distribution will be treated first as a tax-free return of capital, which will reduce the stockholder’s tax basis in its shares of common stock. The amount, if any, of each distribution in excess of a stockholder’s tax basis in its shares of common stock will be taxable as gain realized from the sale or exchange of property.
For the year ended December 31, 2019, we paid aggregate distributions of $46,903,773, including $25,681,391 of distributions paid in cash and 1,354,560 shares of our common stock issued pursuant to our distribution reinvestment plan for $21,222,382. For the year ended December 31, 2019, our net loss was $38,524,316, we had FFO of $23,604,194 and net cash provided by operations of $29,078,255. For the year ended December 31, 2019, we funded $29,078,255, or 62%, and $17,825,518, or 38%, of total distributions paid, including shares issued pursuant to our distribution reinvestment plan, from cash flow from operations and funds equal to amounts reinvested in the STAR DRP, respectively. Since inception, of the $198,592,501 in total distributions paid through December 31, 2019, including shares issued pursuant to our distribution reinvestment plan, we funded $137,568,170 or 70% from cash flow from operations, $40,370,171, or 20%, from funds equal to amounts reinvested in our distribution reinvestment plan and $20,654,160, or 10%, from offering proceeds. For information on how we calculate FFO and the reconciliation of FFO to net loss, see Item 7. “Management’s Discussion and Analysis of Financial Condition and Results of Operations—Funds from Operations and Modified Funds from Operations.”
Our success is dependent on the performance of our advisor and its affiliates and any adverse change in their financial health could cause our operations to suffer.
Our ability to achieve our investment objectives and to pay distributions is dependent upon the performance of our advisor and its affiliates and any adverse change in their financial health could cause our operations to suffer. Our advisor and its affiliates are sensitive to trends in the general economy, as well as the commercial real estate and credit markets. An economic downturn could result in reductions in overall transaction volume and size of sales and leasing activities, which could put downward pressure on our advisor’s and its affiliates’ revenues and operating results. To the extent that any decline in revenues and operating results impacts the performance of our advisor and its affiliates, our financial condition could suffer.
We have paid substantial fees and expenses to our advisor and its affiliates. These fees were not negotiated at arm’s-length, may be higher than fees payable to unaffiliated third parties and may reduce cash available for investment.
A portion of the offering proceeds from the sale of our shares in our public offering was used to pay fees and expenses to our advisor and its affiliates. These fees were not negotiated at arm’s-length and may be higher than fees payable to unaffiliated third parties. In addition, the full offering price paid by stockholders was not invested in properties. As a result, stockholders will only receive a full return of their invested capital if we either (1) sell our assets or the Company for a sufficient amount in
8
excess of the original purchase price of our assets or (2) the market value of the Company after we list our shares of common stock on a national securities exchange is substantially in excess of the original purchase price of our assets.
The geographic concentration of our portfolio may make us particularly susceptible to adverse economic developments in the real estate markets of those areas.
In addition to general, regional and national economic conditions, our operating results are impacted by the economic conditions of the specific markets in which we have concentrations of properties. As of December 31, 2019, of the $1,451,454,728 contract price of our real estate assets, 22% was located in the Atlanta, Georgia metropolitan statistical area, 20% was located in the Dallas/Fort Worth, Texas metropolitan statistical area and 13% was located in the Nashville, Tennessee metropolitan statistical area. Any adverse economic or real estate developments in these markets, such as business layoffs or downsizing, industry slowdowns, relocations of businesses, changing demographics and other factors, or any decrease in demand for multifamily property space resulting from the local business climate, could adversely affect our property revenue resulting in a lower NOI.
Financial regulatory reforms could have a significant impact on our business, financial condition and results of operations.
On July 21, 2010, the Dodd-Frank Wall Street Reform and Consumer Protection Act, or the Dodd-Frank Act, was signed into law. The Dodd-Frank Act represents a significant change in the American financial regulatory environment and impacts nearly every aspect of the U.S. financial services industry. The Dodd-Frank Act requires various federal agencies to adopt hundreds of new rules to implement the Dodd-Frank Act and to deliver to Congress numerous studies and reports that may influence future legislation. The Dodd-Frank Act leaves significant discretion to federal agencies as to exactly how to implement the broad provisions of the Dodd-Frank Act. Some provisions of the Dodd-Frank Act are subject to rulemaking and will take effect over several years, making it difficult to anticipate the overall impact on us. The changes resulting from the Dodd-Frank Act may impact the profitability of business activities, require changes to certain business practices, impose more stringent capital, liquidity and leverage requirements or otherwise adversely affect our business.
A cybersecurity incident and other technology disruptions could negatively impact our business.
We use technology in substantially all aspects of our business operations. We also use mobile devices, social networking, outside vendors and other online activities to connect with our residents, suppliers and employees of our affiliates. Such uses give rise to potential cybersecurity risks, including security breach, espionage, system disruption, theft and inadvertent release of information. Our business involves the storage and transmission of numerous classes of sensitive and confidential information and intellectual property, including residents’ and suppliers’ personal information, private information about employees of our affiliates, and financial and strategic information about us. If we fail to assess and identify cybersecurity risks associated with our operations, we may become increasingly vulnerable to such risks. Additionally, the measures we have implemented to prevent security breaches and cyber incidents may not be effective. The theft, destruction, loss, misappropriation, or release of sensitive and/or confidential information or intellectual property, or interference with our information technology systems or the technology systems of third parties on which we rely, could result in business disruption, negative publicity, brand damage, violation of privacy laws, loss of residents, potential liability and competitive disadvantage, any of which could result in a material adverse effect on our financial condition or results of operations.
Our board of directors determined an estimated value per share of $15.84 for our shares of common stock as of December 31, 2018. You should not rely on the estimated value per share as being an accurate measure of the current value of our shares of common stock.
On March 12, 2019, our board of directors determined an estimated value per share of our common stock of $15.84 as of December 31, 2018. Our board of directors’ objective in determining the estimated value per share was to arrive at a value, based on the most recent data available, that it believed was reasonable based on methodologies that it deemed appropriate after consultation with our advisor. However, the market for commercial real estate can fluctuate quickly and substantially and the value of our assets is expected to change in the future and may decrease. Also, our board of directors did not consider certain other factors, such as a liquidity discount to reflect the fact that our shares are not currently traded on a national securities exchange and the limitations on the ability to redeem shares pursuant to our share repurchase plan.
As with any valuation methodology, the methodologies used to determine the estimated value per share were based upon a number of assumptions, estimates and judgments that may not be accurate or complete. Our assets have been valued based upon appraisal standards and the value of our assets using these methodologies are not required to be a reflection of market value under those standards and will not result in a reflection of fair value under GAAP. Further, different parties using different property-specific and general real estate and capital market assumptions, estimates, judgments and standards could derive a different estimated value per share, which could be significantly different from the estimated value per share determined by our board of directors. The estimated value per share does not represent the fair value of our assets less liabilities in accordance with United States GAAP as of December 31, 2018. The estimated value per share is not a representation or indication that: a stockholder would be able to realize the estimated value per share if he or she attempts to sell shares; a
9
stockholder would ultimately realize distributions per share equal to the estimated value per share upon liquidation of assets and settlement of our liabilities or upon a sale of our company; shares of our common stock would trade at the estimated value per share on a national securities exchange; a third party would offer the estimated value per share in an arm’s-length transaction to purchase all or substantially all of our shares of common stock; or the methodologies used to estimate the value per share would be acceptable to FINRA or compliant with the Employee Retirement Income Security Act of 1974, or ERISA, the Internal Revenue Code or other applicable law, or the applicable provisions of a retirement plan or individual retirement plan, or IRA, with respect to their respective requirements. Further, the estimated value per share was calculated as of a moment in time and the value of our shares will fluctuate over time as a result of, among other things, future acquisitions or dispositions of assets (including acquisitions and dispositions of real estate investments since December 31, 2018), developments related to individual assets and changes in the real estate and capital markets. For additional information on the calculation of our estimated value per share as of December 31, 2018, see Item 5. “Market for Registrant’s Common Equity, Related Stockholder Matters and Purchases of Equity Securities—Estimated Value Per Share.”
We intend to establish an updated estimated value per share following the completion of the mergers, which closed on March 6, 2020. We expect that the estimated value per share will be as of March 6, 2020, and will be reported by us in a Current Report on Form 8-K. This updated estimated value per share will be subject to the same risks described above.
If we internalize our management functions, we could incur other significant costs associated with being self-managed.
Our advisor notified us that it intends to present a proposal to our special committee within 60 days of the closing of the mergers regarding a possible internalization of management, whereby our advisor would sell, and we would acquire, our advisor or certain assets of our advisor and its affiliates. Such a transaction, if consummated, likely would include an amendment to the advisory agreement with our advisor to permit our advisor or its affiliates to receive consideration for internalization. We cannot reasonably estimate the form of or amount of consideration that may be paid as consideration in exchange for the sale and the impact it would have on funds available to distribute to our stockholders.
If our board of directors elects to internalize management functions, we may elect to negotiate to acquire our advisor’s assets and hire our advisor’s personnel. Pursuant to our advisory agreement with our advisor, we are not allowed to solicit or hire any of our advisor’s personnel without our advisor’s prior written consent. While we would no longer bear the costs of the various fees and expenses we expect to pay to our advisor under the advisory agreement, our direct expenses would include general and administrative costs, including legal, accounting and other expenses related to asset management fees. We would also be required to employ personnel and would be subject to potential liabilities commonly faced by employers, such as workers’ disability and compensation claims, potential labor disputes and other employee-related liabilities and grievances as well as incur the compensation and benefits costs of our officers and other employees and consultants that are paid by our advisor or its affiliates. We may issue equity awards to officers, employees and consultants, which awards would decrease net income and FFO and may further dilute your investment. We cannot reasonably estimate the amount of fees to our advisor we would save or the costs we would incur if we became self-managed. If the expenses we assume, plus the costs to acquire the advisor and or its assets as a result of an internalization, are higher than the expenses we avoid paying to our advisor, our FFO would be lower as a result of the internalization than they otherwise would have been, potentially decreasing the amount of funds available to distribute to our stockholders.
The outbreak of widespread contagious disease, such as the Coronavirus, could adversely impact the value of our investments, the ability to meet our capital and operating needs or make cash distributions to our stockholders.
The widespread outbreak of infectious or contagious disease, such as H1N1 influenza (swine flu), avian bird flu, SARS, the Coronavirus and Zika virus, could adversely impact our ability to generate income sufficient to meet operating expenses or generate income and capital appreciation, if any, at rates lower than those anticipated or available through investments in comparable real estate or other investments.
We also may depend on access to third-party sources to continue our investing activities and pay distributions to our stockholders. Our access to third-party sources depends on, in part, general market conditions, including conditions that are out of our control, such as the impact of health and safety concerns like the current Coronavirus outbreak.
As of the date of this annual report, the recent outbreak of the Coronavirus appears to be principally concentrated in China, although cases have been confirmed in other countries and regions, including the United States. The extent to which our business may be affected by the Coronavirus will largely depend on future developments with respect to the continued spread and treatment of the virus, which we cannot accurately predict. New information and developments may emerge concerning the severity of the Coronavirus and the actions to contain the Coronavirus or treat its impact. Our business and financial results could be materially and adversely impacted.
10
Disruptions in the financial markets and deteriorating economic conditions could adversely impact our ability to implement our investment strategy and achieve our investment objectives.
United States and global financial markets experienced extreme volatility and disruption from 2008 to 2010. There was a widespread tightening in overall credit markets, devaluation of the assets underlying certain financial contracts, and increased borrowing by governmental entities. The turmoil in the capital markets during the most recent recession resulted in constrained equity and debt capital available for investment in the real estate market, resulting in fewer buyers seeking to acquire properties, increases in capitalization rates and lower property values. During the subsequent economic recovery, capital has been more available and the overall economy has improved. However, the failure of a sustained economic recovery or future disruptions in the financial markets and deteriorating economic conditions could impact the value of our investments in properties. In addition, if potential purchasers of properties have difficulty obtaining capital to finance property acquisitions, capitalization rates could increase and property values could decrease. Current economic conditions greatly increase the risks of our investments. See “—Risks Related to Investments in Real Estate.”
Events in U.S. financial markets have had, and may continue to have, a negative impact on the terms and availability of credit, which could have an adverse effect on our business and our results of operations.
The failure of large U.S. financial institutions in 2009 and the resulting turmoil in the U.S. financial sector had a negative impact on the terms and availability of credit within the United States. The tightening of the U.S. credit markets resulted in a lack of adequate credit. Some lenders continue to impose more stringent restrictions on the terms of credit, including shorter terms and more conservative loan-to-value underwriting than was previously customary. The negative impact of the tightening credit markets may limit our ability to finance the acquisition of properties on favorable terms, if at all, and may result in increased financing costs or financing with increasingly restrictive covenants.
We are uncertain of our sources for funding our future capital needs. If we do not have sufficient funds from operations to cover our expenses or to fund improvements to our real estate and cannot obtain debt or equity financing on acceptable terms, our ability to cover our expenses or to fund improvements to our real estate will be adversely affected.
We terminated our initial public offering on March 24, 2016. In the event that we develop a need for additional capital in the future for the repayment of maturing debt obligations, the improvement of our real properties or for any other reason, sources of funding may not be available to us. If we do not have sufficient funds from cash flow generated by our investments or out of net sale proceeds, or cannot obtain debt or equity financing on acceptable terms, our financial condition and ability to make distributions may be adversely affected.
Risks Relating to Our Organizational Structure
Maryland law and our organizational documents limit your right to bring claims against our officers and directors.
Maryland law provides that a director will not have any liability as a director so long as he or she performs his or her duties in accordance with the applicable standard of conduct. In addition, our charter provides that, subject to the applicable limitations set forth therein or under Maryland law, no director or officer will be liable to us or our stockholders for monetary damages. Our charter also provides that we will generally indemnify our directors, our officers, our advisor and its affiliates for losses they may incur by reason of their service in those capacities unless their act or omission was material to the matter giving rise to the proceeding and was committed in bad faith or was the result of active and deliberate dishonesty, they actually received an improper personal benefit in money, property or services or, in the case of any criminal proceeding, they had reasonable cause to believe the act or omission was unlawful. Moreover, we have entered into separate indemnification agreements with each of our directors and executive officers. As a result, we and our stockholders may have more limited rights against these persons than might otherwise exist under common law. In addition, we may be obligated to fund the defense costs incurred by these persons. However, our charter provides that we may not indemnify our directors, our advisor and its affiliates for loss or liability suffered by them or hold our directors or our advisor and its affiliates harmless for loss or liability suffered by us unless they have determined that the course of conduct that caused the loss or liability was in our best interests, they were acting on our behalf or performing services for us, the liability was not the result of negligence or misconduct by our non-independent directors, our advisor and its affiliates or gross negligence or willful misconduct by our independent directors, and the indemnification or agreement to hold harmless is recoverable only out of our net assets, including the proceeds of insurance, and not from the stockholders. As a result of these limitations on liability and indemnification provisions and agreements, we and our stockholders may be entitled to a more limited right of action than we would otherwise have if indemnification rights were not granted.
The limit on the percentage of shares of our common stock that any person may own may discourage a takeover or business combination that may benefit our stockholders.
Our charter restricts the direct or indirect ownership by one person or entity to no more than 9.8% of the value of our then outstanding capital stock (which includes common stock and any preferred stock we may issue) and no more than 9.8% of the
11
value or number of shares, whichever is more restrictive, of our then outstanding common stock unless exempted (prospectively or retroactively) by our board of directors. These restrictions may discourage a change of control of us and may deter individuals or entities from making tender offers for shares of our common stock on terms that might be financially attractive to stockholders or which may cause a change in our management. In addition to deterring potential transactions that may be favorable to our stockholders, these provisions may also decrease your ability to sell your shares of our common stock.
Our stockholders’ voting interest in us would be diluted if we issue additional shares.
Existing stockholders do not have preemptive rights to any shares issued by us in the future. Under our charter, we have authority to issue a total of 1,100,000,000 shares of capital stock, of which 999,998,000 shares are classified as common stock with a par value of $0.01 per share, 100,000,000 shares are classified as preferred stock with a par value of $0.01 per share, 1,000 shares are classified as convertible stock with a par value of $0.01 per share, and 1,000 shares are classified as Class A convertible stock, with a par value of $0.01 per share. Subject to any limitations set forth under Maryland law, our board of directors may increase the number of authorized shares of stock, increase or decrease the number of shares of any class or series of stock designated, or reclassify any unissued shares without the necessity of obtaining stockholder approval. All such shares may be issued in the discretion of our board of directors. Therefore, existing stockholders would experience dilution of their equity investment in us if we (i) sell additional shares in the future, including those issued pursuant to our distribution reinvestment plan, (2) sell securities that are convertible into shares of our common stock, (3) issue shares of our common stock in a private offering of securities to institutional investors, (4) issue restricted shares of our common stock to our independent directors, (5) issue shares of our common stock in a merger or to sellers of properties acquired by us in connection with an exchange of limited partnership interests of our operating partnership. Because the limited partnership interests of our operating partnership may, in the discretion of our board of directors, be exchanged for shares of our common stock, any merger, exchange or conversion between our operating partnership and another entity ultimately could result in the issuance of a substantial number of shares of our common stock, thereby diluting the percentage ownership interest of other stockholders. Because of these and other reasons, our stockholders may experience substantial dilution in their percentage ownership of our shares.
We may issue preferred stock or other classes of common stock, which issuance could adversely affect the existing holders of our common stock.
Our stockholders do not have preemptive rights to any shares issued by us in the future. We may issue, without stockholder approval, preferred stock or other classes of common stock with rights that could dilute the value of your shares of common stock. However, the issuance of preferred stock must also be approved by a majority of our independent directors not otherwise interested in the transaction, who will have access, at our expense, to our legal counsel or to independent legal counsel. The issuance of preferred stock or other classes of common stock could increase the number of stockholders entitled to distributions without simultaneously increasing the size of our asset base. Under our charter, we have authority to issue a total of 1,100,000,000 shares of capital stock, of which 999,998,000 shares are classified as common stock with a par value of $0.01 per share, 100,000,000 shares are classified as preferred stock with a par value of $0.01 per share, 1,000 shares are classified as convertible stock with a par value of $0.01per share and 1,000 shares are classified as Class A convertible stock with a par value of $0.01 per share. Our board of directors, with the approval of a majority of the entire board of directors and without any action by our stockholders, may amend our charter from time to time to increase or decrease the aggregate number of shares of capital stock or the number of shares of capital stock of any class or series that we have authority to issue. If we ever created and issued preferred stock with a distribution preference over common stock, payment of any distribution preferences of outstanding preferred stock would reduce the amount of funds available for the payment of distributions on our common stock. Further, holders of preferred stock are normally entitled to receive a preference payment in the event we liquidate, dissolve or wind up before any payment is made to our common stockholders, likely reducing the amount common stockholders would otherwise receive upon such an occurrence. In addition, under certain circumstances, the issuance of preferred stock or a separate class or series of common stock may render more difficult or tend to discourage a merger, tender offer or proxy contest, the assumption of control by a holder of a large block of our securities, or the removal of incumbent management.
Your investment will be diluted upon conversion of the Class A convertible stock.
We have issued 1,000 shares of our Class A convertible stock, or the Class A convertible stock, to our advisor for an aggregate purchase price of $1,000. Under limited circumstances, each outstanding share of our Class A convertible stock may be converted into shares of our common stock, which will have a dilutive effect to our stockholders. Our Class A convertible stock will be converted into shares of our common stock if (1) we have made total distributions of money or other property by us, SIR and STAR III to their respective holders of common shares (with respect to SIR and STAR III, in each case prior to the closing of the mergers), which we refer to collectively as the “Class A Distributions,” equal to the original issue price of our shares of common stock, shares of common stock of SIR and shares of common stock of STAR III, or the Common Equity, plus an aggregate 6.0% cumulative, non-compounded, annual return on the original issue price of those shares, (2) we list our common stock for trading on a national securities exchange or enter into a merger whereby holders of our common stock receive listed securities of another issuer or (3) our advisory agreement is terminated or not renewed (other than for “cause” as
12
defined in our advisory agreement), each referred to as a “Triggering Event.” Upon any of these Triggering Events, each share of Class A convertible stock will be converted into a number of shares of our common stock equal to 1/1000 of the quotient of (A) 15% of the amount, if any, by which (i) the “Class A Enterprise Value” plus the aggregate value of the Class A Distributions paid to date on the Common Equity exceeds (ii) the aggregate purchase price paid by stockholders for the Common Equity plus an aggregated 6.0% cumulative, non-compounded, annual return on the original issue price of the Common Equity as of the date of the Triggering Event, divided by (B) the Class A Enterprise Value divided by the number of our outstanding common shares on an as-converted basis as of the date of the Triggering Event. In the event of a termination or non-renewal of our advisory agreement for cause, all of the shares of the convertible stock will be repurchased by us for $1.00. Upon the issuance of our common stock in connection with the conversion of the convertible stock, then-existing stockholders’ interests in us will be diluted.
The conversion of the Class A convertible stock held by our advisor due upon termination of the advisory agreement and the voting rights granted to the holder of our Class A convertible stock may discourage a takeover attempt or prevent us from effecting a merger that otherwise would have been in the best interests of our stockholders.
If we engage in a merger in which we are not the surviving entity or our advisory agreement is terminated without cause, our advisor may be entitled to conversion of the shares of our Class A convertible stock it holds and to require that we purchase all or a portion of the limited partnership interests in our operating partnership that it holds at any time thereafter for cash or our common stock. The existence of this Class A convertible stock may deter a prospective acquirer from bidding on our company, which may limit the opportunity for stockholders to receive a premium for their stock that might otherwise exist if an investor attempted to acquire us through a merger.
The affirmative vote of two-thirds of the outstanding shares of Class A convertible stock, voting as a single class, will be required (1) for any amendment, alteration or repeal of any provision of our charter that materially and adversely changes the rights of the Class A convertible stock and (2) to effect a merger of our company into another entity, or a merger of another entity into our company, unless in each case each share of Class A convertible stock (A) will remain outstanding without a material and adverse change to its terms and rights or (B) will be converted into or exchanged for shares of stock or other ownership interest of the surviving entity having rights identical to that of our Class A convertible stock (except for changes that do not materially and adversely affect the holders of the Class A convertible stock). In the event that we propose to merge with or into another entity, including another REIT, our advisor could, by exercising these voting rights, determine whether or not we are able to complete the proposed transaction. By voting against a proposed merger, our advisor could prevent us from effecting the merger, even if the merger otherwise would have been in the best interests of our stockholders.
Our UPREIT structure may result in potential conflicts of interest with limited partners in our operating partnership whose interests may not be aligned with those of our stockholders.
Limited partners in our operating partnership have the right to vote on certain amendments to the operating partnership agreement, as well as on certain other matters. Persons holding such voting rights may exercise them in a manner that conflicts with the interests of our stockholders. As general partner of our operating partnership, we are obligated to act in a manner that is in the best interest of all partners of our operating partnership. Circumstances may arise in the future when the interests of limited partners in our operating partnership may conflict with the interests of our stockholders. These conflicts may be resolved in a manner stockholders do not believe are in their best interest.
We may change our targeted investments and investment guidelines without our stockholders’ consent.
Our board of directors may change our targeted investments and investment guidelines at any time without the consent of our stockholders, which could result in our making investments that are different from, and possibly riskier than, the investments described in this Annual Report on Form 10-K. A change in our targeted investments or investment guidelines may increase our exposure to interest rate risk, default risk and real estate market fluctuations, all of which could adversely affect the value of our common stock and our ability to make distributions to our stockholders.
Our bylaws designate the Circuit Court for Baltimore City, Maryland as the sole and exclusive forum for certain actions and proceedings that may be initiated by our stockholders.
Our bylaws provide that, unless we consent in writing to the selection of an alternative forum, the Circuit Court for Baltimore City, Maryland, or, if that Court does not have jurisdiction, the U.S. District Court for the District of Maryland, Baltimore Division, will be the sole and exclusive forum for: (1) any derivative action or proceeding brought on our behalf, (2) any action asserting a claim of breach of any duty owed by any of our directors or officers or employees to us or to our stockholders, (3) any action asserting a claim against us or any of our directors or officers or employees arising pursuant to any provision of the MGCL, or our charter or bylaws or (4) any action asserting a claim against us or any of our directors or officers or employees that is governed by the internal affairs doctrine. Any person or entity purchasing or otherwise acquiring or holding any interest in our shares shall be deemed to have notice of and to have consented to these provisions of our bylaws, as they may be amended from time to time. Our board of directors, without stockholder approval, adopted this provision of the
13
bylaws so that we can respond to such litigation more efficiently and reduce the costs associated with our responses to such litigation, particularly litigation that might otherwise be brought in multiple forums. This exclusive forum provision may limit a stockholder’s ability to bring a claim in a judicial forum that the stockholder believes is favorable for disputes with us or our directors, officers, agents or employees, if any, and may discourage lawsuits against us and our directors, officers, agents or employees, if any. Alternatively, if a court were to find this provision of our bylaws inapplicable to, or unenforceable in respect of, one or more of the specified types of actions or proceedings notwithstanding that the MGCL expressly provides that the charter or bylaws of a Maryland corporation may require that any internal corporate claim be brought only in courts sitting in one or more specified jurisdictions, we may incur additional costs that we do not currently anticipate associated with resolving such matters in other jurisdictions, which could adversely affect our business, financial condition and results of operations.
Our stockholders’ investment return may be reduced if we were to be required to register as an investment company under the Investment Company Act of 1940, as amended, or the 1940 Act. If we lose our exemption from registration under the 1940 Act, we would not be able to continue its business unless and until we register under the 1940 Act.
We do not intend to register as an investment company under the 1940 Act. As of December 31, 2019, we owned 32 multifamily properties and one parcel of land held for the development of apartment homes, and investments in real estate will represent the substantial majority of our total asset mix, which would not subject us to the 1940 Act. In order to maintain an exemption from regulation under the 1940 Act, we must engage primarily in the business of buying real estate.
To maintain compliance with our 1940 Act exemption, we may be unable to sell assets we would otherwise want to sell and may need to sell assets we would otherwise wish to retain. In addition, we may be required to acquire additional income- or loss-generating assets that we might not otherwise acquire or forego opportunities to acquire interests in companies that we would otherwise want to acquire. If we are required to register as an investment company but fail to do so, we would be prohibited from engaging in our business, and criminal and civil actions could be brought against us. In addition, our contracts would be unenforceable unless a court required enforcement, and a court could appoint a receiver to take control of us and liquidate our business.
Risks Related To Conflicts of Interest
We depend on our advisor and its key personnel and if any such key personnel were to cease to be affiliated with our advisor, our business could suffer.
Our ability to achieve our investment objectives is dependent upon the performance of our advisor and, to a significant degree, upon the continued contributions of certain of the key personnel of our advisor, each of whom would be difficult to replace. If our advisor were to lose the benefit of the experience, efforts and abilities of any these individuals, our operating results could suffer.
Our advisor and its affiliates, including our officers and our affiliated directors, will face conflicts of interest caused by compensation arrangements with us, which could result in actions that are not in the best interests of our stockholders.
Our advisor and its affiliates receive substantial fees from us in return for their services and these fees could influence the advice provided to us. Among other matters, the compensation arrangements could affect our advisor’s judgment with respect to, but not limited to, the following: (i) real estate acquisitions, which allow our advisor to earn acquisition fees upon repurchases of assets and to increase asset management fees; (ii) real estate asset sales, since the asset management fees payable to our advisor would decrease and our advisor would be entitled to a disposition fee upon sales; and (iii) whether and when we seek to list our common stock on a national securities exchange, which would trigger a conversion of our advisor’s convertible stock. These compensation arrangements may induce our advisor to recommend transactions that may not be in our best interest at the time, and our advisor will have considerable discretion with respect to the terms of any acquisition, disposition or leasing transaction.
The time and resources that our sponsor and its affiliates could devote to us may be diverted to other investment activities, and we may face additional competition due to the fact that our sponsor and its affiliates are not prohibited from raising money for, or managing, another entity that makes the same or other types of investments that we do.
Our sponsor and its affiliates are not prohibited from raising money for, or managing, another investment entity that makes the same or other types of investments as we do. As a result, the time and resources they could devote to us may be diverted to other investment activities. We cannot currently estimate the time our officers and directors will be required to devote to us because the time commitment required of our officers and directors will vary depending upon a variety of factors, including, but not limited to, general economic and market conditions affecting us, our advisor’s ability to locate and acquire investments that meet our investment objectives and the size of our real estate portfolio. Since these professionals engage in and will continue to engage in other business activities on behalf of themselves and others, these professionals will face conflicts of interest in allocating their time among us, our advisor, and its affiliates and other business activities in which they are involved. This could result in actions that are more favorable to affiliates of our advisor than to us.
14
In addition, we may compete with affiliates of our advisor for the same investors and investment opportunities. We may also co-invest with any such investment entity. Even though all such co-investments will be subject to approval by our independent directors, they could be on terms not as favorable to us as those we could achieve co-investing with a third party.
Our advisor may have conflicting fiduciary obligations if we acquire assets from affiliates of our sponsor or enter into joint ventures with affiliates of our sponsor. As a result, in any such transaction we may not have the benefit of arm’s-length negotiations of the type normally conducted between unrelated parties.
Our advisor may cause us to invest in a property owned by, or make an investment in equity securities in or real estate-related loans to, our sponsor or its affiliates or through a joint venture with affiliates of our sponsor. In these circumstances, our advisor will have a conflict of interest when fulfilling its fiduciary obligation to us. In any such transaction, we would not have the benefit of arm’s-length negotiations of the type normally conducted between unrelated parties.
The fees we paid to affiliates in connection with our public offering and continue to pay in connection with the acquisition and management of our investments were determined without the benefit of arm’s-length negotiations of the type normally conducted between unrelated parties.
The fees paid to the dealer manager for services they provided for us and the fees to be paid to our advisor, our property managers and other affiliates for services they provide for us were determined without the benefit of arm’s-length negotiations of the type normally conducted between unrelated parties, may be in excess of amounts that we would otherwise pay to third parties for such services and may reduce the amount of cash that would otherwise be available for investments in real properties and distributions to our stockholders.
Risks Related To Investments in Real Estate
Our operating results will be affected by economic and regulatory changes that impact the real estate market in general.
Our investments in multifamily properties will be subject to risks generally attributable to the ownership of real property, including:
• | changes in global, national, regional or local economic, demographic or real estate market conditions; |
• | changes in supply of or demand for similar properties in an area; |
• | increased competition for real property investments targeted by our investment strategy; |
• | bankruptcies, financial difficulties or lease defaults by our residents; |
• | changes in interest rates and availability of financing; |
• | changes in the terms of available financing, including more conservative loan-to-value requirements and shorter debt maturities; |
• | competition from other residential properties; |
• | the inability or unwillingness of residents to pay rent increases; |
• | changes in government rules, regulations and fiscal policies, including changes in tax, real estate, environmental and zoning laws; |
• | the severe curtailment of liquidity for certain real estate related assets; and |
• | rent restrictions due to government program requirements. |
All of these factors are beyond our control. Any negative changes in these factors could affect our ability to meet our obligations and make distributions to stockholders.
We are unable to predict future changes in global, national, regional or local economic, demographic or real estate market conditions. For example, a recession or rise in interest rates could make it more difficult for us to lease or dispose of multifamily properties and could make alternative interest-bearing and other investments more attractive and therefore potentially lower the relative value of the real estate assets we acquire. These conditions, or others we cannot predict, may adversely affect our results of operations and returns to our stockholders. In addition, the value of the multifamily properties we acquire may decrease following the date we acquire such properties due to the risks described above or any other unforeseen changes in market conditions. If the value of our multifamily properties decreases, we may be forced to dispose of our properties at a price lower than the price we paid to acquire our properties, which could adversely impact the results of our operations and our ability to make distributions and return capital to our investors.
15
A concentration of our investments in the apartment sector may leave our profitability vulnerable to a downturn or slowdown in the sector or state or region.
Our property portfolio is comprised solely of multifamily properties. As a result, we will be subject to risks inherent in investments in a single type of property. Because our investments are in the apartment sector, the potential effects on our revenues, and as a result, our cash available for distribution to our stockholders, resulting from a downturn or slowdown in the apartment sector could be more pronounced than if we had more fully diversified our investments. If our investments are concentrated in a particular state or geographic region, and such state or geographic region experiences economic difficulty disproportionate to the nation as a whole, then the potential effects on our revenues, and as a result, our cash available for distribution to our stockholders, could be more pronounced than if we had more fully diversified our investments geographically.
We depend on residents for our revenue, and therefore, our revenue and our ability to make distributions to our stockholders is dependent upon the ability of the residents at our properties to generate enough income to pay their rents in a timely manner. A substantial number of non-renewals, terminations or lease defaults could reduce our net income and limit our ability to make distributions to our stockholders.
The underlying value of our properties and the ability to make distributions to our stockholders depend upon the ability of the residents at our properties to generate enough income to pay their rents in a timely manner, and the success of our investments depends upon the occupancy levels, rental income and operating expenses of our properties and our company. Residents’ inability to timely pay their rents may be impacted by employment and other constraints on their personal finances, including debts, purchases and other factors. These and other changes beyond our control may adversely affect our residents’ ability to make rental payments. In the event of a resident default or bankruptcy, we may experience delays in enforcing our rights as landlord and may incur costs in protecting our investment and re-leasing our property. We may be unable to re-lease the property for the rent previously received. We may be unable to sell a property with low occupancy without incurring a loss. These events and others could cause us to reduce the amount of distributions we make to stockholders and the value of our stockholders’ investment to decline.
We may be unable to secure funds for future capital improvements, which could adversely impact our ability to make cash distributions to our stockholders.
In order to attract residents, we may be required to expend funds for capital improvements and apartment renovations when residents do not renew their leases or otherwise vacate their apartment homes. In addition, we may require substantial funds to renovate an apartment community in order to sell it, upgrade it or reposition it in the market. If we have insufficient capital reserves, we will have to obtain financing from other sources. We intend to establish capital reserves in an amount we, in our discretion, believe is necessary. A lender also may require escrow of capital reserves in excess of any established reserves. If these reserves or any reserves otherwise established are designated for other uses or are insufficient to meet our cash needs, we may have to obtain financing from either affiliated or unaffiliated sources to fund our cash requirements. We cannot assure our stockholders that sufficient financing will be available or, if available, will be available on economically feasible terms or on terms acceptable to us. Moreover, certain reserves required by lenders may be designated for specific uses and may not be available for capital purposes such as future capital improvements. Additional borrowing for capital needs and capital improvements will increase our interest expense, and therefore our financial condition and our ability to make cash distributions to our stockholders may be adversely affected.
A property that experiences significant vacancy could be difficult to sell or re-lease.
A property may experience significant vacancy through the eviction of residents and/or the expiration of leases. Certain of the multifamily properties we acquire may have some level of vacancy at the time of our acquisition of the property and we may have difficulty obtaining new residents. If vacancies continue for a long period of time, we may suffer reduced revenues resulting in lower cash distributions to stockholders. In addition, the resale value of the property could be diminished because the market value may depend principally upon the value of the leases of such property.
We will compete with numerous other persons and entities for real estate investments.
We are subject to significant competition in seeking real estate investments and residents. We compete with many third parties engaged in real estate investment activities, including other REITs, specialty finance companies, savings and loan associations, banks, mortgage bankers, insurance companies, mutual funds, institutional investors, investment banking firms, lenders, hedge funds, governmental bodies and other entities. Many of our competitors have substantially greater financial and other resources than we have and may have substantially more operating experience than us. They may also enjoy significant competitive advantages that result from, among other things, a lower cost of capital.
16
Competition from other multifamily communities and housing alternatives for residents could reduce our profitability and the return on your investment.
The multifamily property market in particular is highly competitive. This competition could reduce occupancy levels and revenues at our multifamily properties, which would adversely affect our operations. We face competition from many sources, including from other multifamily properties in markets where we own properties. In addition, overbuilding of multifamily properties may occur, which would increase the number of multifamily homes available and may decrease occupancy and unit rental rates. Furthermore, our multifamily properties compete, with numerous housing alternatives in attracting residents, including owner occupied single- and multifamily homes available to rent or purchase. Competitive housing in a particular area and the increasing affordability of owner occupied single and multifamily homes available to rent or buy caused by declining mortgage interest rates and government programs to promote home ownership could adversely affect our ability to retain our residents, lease apartment homes and increase or maintain rental rates.
Our strategy for acquiring value-enhancement multifamily properties involves greater risks than more conservative investment strategies.
We have implemented a value-enhancement strategy for a substantial portion of the total apartment homes we have acquired. Our value-enhancement strategy involves the acquisition of under-managed, stabilized apartment communities in high job and population growth neighborhoods and the investment of additional capital to make strategic upgrades of the interiors of the apartment homes. These opportunities will vary in degree based on the specific business plan for each asset, but could include new appliances, better cabinets, countertops and flooring. Our strategy for acquiring value-enhancement multifamily properties involves greater risks than more conservative investment strategies. The risks related to these value-enhancement investments include risks related to delays in the repositioning or improvement process, higher than expected capital improvement costs, possible borrowings necessary to fund such costs, and ultimately that the repositioning process may not result in the higher rents and occupancy rates anticipated. In addition, our value-enhancement properties may not produce revenue while undergoing capital improvements. Furthermore, we may also be unable to complete the improvements of these properties and may be forced to hold or sell these properties at a loss. For these and other reasons, we cannot assure you that we will realize growth in the value of our value-enhancement multifamily properties, and as a result, our ability to make distributions to our stockholders could be adversely affected.
Multifamily properties are illiquid investments, and we may be unable to adjust our portfolio in response to changes in economic or other conditions or sell a property if or when we decide to do so.
Multifamily properties are illiquid investments. We may be unable to adjust our portfolio in response to changes in economic or other conditions. In addition, the real estate market is affected by many factors, such as general economic conditions, availability of financing, interest rates, supply and demand, and other factors that are beyond our control. We cannot predict whether we will be able to sell any real property for the price or on the terms set by us, or whether any price or other terms offered by a prospective purchaser would be acceptable to us. We cannot predict the length of time needed to find a willing purchaser and to close the sale of a real property.
Additionally, we may be required to expend funds to correct defects or to make improvements before a real property can be sold. We cannot assure you that we will have funds available to correct such defects or to make such improvements.
In acquiring a real property, we may agree to restrictions that prohibit the sale of that real property for a period of time or impose other restrictions, such as a limitation on the amount of debt that can be placed or repaid on that real property. All these provisions would restrict our ability to sell a property, which could reduce the amount of cash available for distribution to our stockholders.
Short-term apartment leases expose us to the effects of declining market rent, which could adversely impact our ability to make cash distributions to our stockholders.
Substantially all of our apartment leases are for a term of one year or less. Because these leases generally permit the residents to leave at the end of the lease term without penalty, our rental revenues may be impacted by declines in market rents more quickly than if our leases were for longer terms.
Increased construction of similar properties that compete with our apartment communities in any particular location could adversely affect the operating results of our properties and our cash available for distribution to our stockholders.
We may have acquired apartment communities in locations that may be experiencing increases in construction of properties that compete with our apartment communities. This increased competition and construction could:
• | make it more difficult for us to find residents to lease apartment homes in our apartment communities; |
• | force us to lower our rental prices in order to lease apartment homes in our apartment communities; or |
• | substantially reduce our revenues and cash available for distribution to our stockholders. |
17
Actions of joint venture partners could negatively impact our performance.
We may enter into joint ventures with third parties, including with entities that are affiliated with our advisor. We may also purchase and develop properties in joint ventures or in partnerships, co-tenancies or other co-ownership arrangements with the sellers of the properties, affiliates of the sellers, developers or other persons. Such investments may involve risks not otherwise present with a direct investment in real estate, including, for example:
• | the possibility that our venture partner or co-tenant in an investment might become bankrupt; |
• | that the venture partner or co-tenant may at any time have economic or business interests or goals which are, or which become, inconsistent with our business interests or goals; |
• | that such venture partner or co-tenant may be in a position to take action contrary to our instructions or requests or contrary to our policies or objectives; |
• | the possibility that we may incur liabilities as a result of an action taken by such venture partner; |
• | that disputes between us and a venture partner may result in litigation or arbitration that would increase our expenses and prevent our officers and directors from focusing their time and effort on our business; |
• | the possibility that if we have a right of first refusal or buy/sell right to buy out a co-venturer, co-owner or partner, we may be unable to finance such a buy-out if it becomes exercisable or we may be required to purchase such interest at a time when it would not otherwise be in our best interest to do so; or |
• | the possibility that we may not be able to sell our interest in the joint venture if we desire to exit the joint venture. |
Such investments may also have the potential risk of impasses on decisions because neither we nor the co-venturer would have full control over the joint venture, which might have a negative influence on the joint venture and decrease potential returns to you. In addition, to the extent our participation represents a minority interest, a majority of the participants may be able to take actions which are not in our best interests because of our lack of full control. Disputes between us and co-venturers may result in litigation or arbitration that would increase our expenses and prevent our officers and/or directors from focusing their time and effort on our business. Consequently, actions by or disputes with co-venturers might result in subjecting properties owned by the joint venture to additional risk. In addition, to the extent that our venture partner or co-tenant is an affiliate of the Advisor, certain conflicts of interest will exist.
Our multifamily properties will be subject to property taxes that may increase in the future, which could adversely affect our cash flow.
Our multifamily properties are subject to real and personal property taxes, as well as excise taxes, that may increase as tax rates change and as the properties are assessed or reassessed by taxing authorities. As the owner of the properties, we are ultimately responsible for payment of the taxes to the applicable government authorities. If we fail to pay any such taxes, the applicable taxing authority may place a lien on the real property and the real property may be subject to a tax sale. In addition, we will generally be responsible for real property taxes related to any vacant space.
Uninsured losses or costly premiums for insurance coverage relating to real property may adversely affect your returns.
We attempt to adequately insure all of our multifamily properties against casualty losses. The nature of the activities at certain properties we may acquire may expose us and our operators to potential liability for personal injuries and property damage claims. In addition, there are types of losses, generally catastrophic in nature, such as losses due to wars, acts of terrorism, earthquakes, floods, tornadoes, hurricanes, pollution or environmental matters that are uninsurable or not economically insurable, or may be insured subject to limitations, such as large deductibles or co-payments. Risks associated with potential acts of terrorism could sharply increase the premiums we pay for coverage against property and casualty claims. Mortgage lenders sometimes require commercial property owners to purchase specific coverage against acts of terrorism as a condition for providing mortgage loans. These policies may not be available at a reasonable cost, if at all, which could inhibit our ability to finance or refinance our properties. In such instances, we may be required to provide other financial support, either through financial assurances or self-insurance, to cover potential losses. Changes in the cost or availability of insurance could expose us to uninsured casualty losses. In the event that any of our properties incurs a casualty loss that is not fully covered by insurance, the value of our assets will be reduced by any such uninsured loss. In addition, we cannot assure you that funding will be available to us for repair or reconstruction of damaged real property in the future.
Costs of complying with governmental laws and regulations related to environmental protection and human health and safety may be high.
All real property investments and the operations conducted in connection with such investments are subject to federal, state and local laws and regulations relating to environmental protection and human health and safety. Some of these laws and
18
regulations may impose joint and several liability on customers, owners or operators for the costs to investigate or remediate contaminated properties, regardless of fault or whether the acts causing the contamination were legal.
Under various federal, state and local environmental laws, a current or previous owner or operator of real property may be liable for the cost of removing or remediating hazardous or toxic substances on such real property. These environmental laws often impose liability whether or not the owner or operator knew of, or was responsible for, the presence of such hazardous or toxic substances. In addition, the presence of hazardous substances, or the failure to properly remediate these substances, may adversely affect our ability to sell, rent or pledge such real property as collateral for future borrowings. Environmental laws also may impose restrictions on the manner in which real property may be used or businesses may be operated. Some of these laws and regulations have been amended so as to require compliance with new or more stringent standards as of future dates. Compliance with new or more stringent laws or regulations or stricter interpretation of existing laws may require us to incur material expenditures. Future laws, ordinances or regulations may impose material environmental liability. Additionally, the existing condition of land when we buy it, operations in the vicinity of our properties, such as the presence of underground storage tanks, or activities of unrelated third parties, may affect our properties. There are also various local, state and federal fire, health, life-safety and similar regulations with which we may be required to comply and which may subject us to liability in the form of fines or damages for noncompliance. In connection with the acquisition and ownership of our properties, we may be exposed to these costs in connection with such regulations. The cost of defending against environmental claims, any damages or fines we must pay, compliance with environmental regulatory requirements or remediating any contaminated real property could materially and adversely affect our business and results of operations, lower the value of our assets and, consequently, lower the amounts available for distribution to our stockholders.
The costs associated with complying with the Americans with Disabilities Act may reduce the amount of cash available for distribution to our stockholders.
Investment in properties may also be subject to the Americans with Disabilities Act of 1990, as amended, or the ADA. Under the ADA, all places of public accommodation are required to comply with federal requirements related to access and use by disabled persons. We are committed to complying with the ADA to the extent to which it applies. The ADA has separate compliance requirements for “public accommodations” and “commercial facilities” that generally require that buildings and services be made accessible and available to people with disabilities. With respect to the properties we acquire, the ADA’s requirements could require us to remove access barriers and could result in the imposition of injunctive relief, monetary penalties or, in some cases, an award of damages. We will attempt to acquire properties that comply with the ADA or place the burden on the seller or other third party, such as residents, to ensure compliance with the ADA. We cannot assure you that we will be able to acquire properties or allocate responsibilities in this manner. Any monies we use to comply with the ADA will reduce the amount of cash available for distribution to our stockholders.
To the extent we invest in age-restricted communities, we may incur liability by failing to comply with the Housing for Older Persons Act, or HOPA, the Fair Housing Act, or FHA, or certain state regulations, which may affect cash available for distribution to our stockholders.
To the extent we invest in age-restricted communities, any such properties must comply with the FHA and HOPA. The FHA generally prohibits age-based housing discrimination; however certain exceptions exist for housing developments that qualify as housing for older persons. HOPA provides the legal requirements for such housing developments. In order for housing to qualify as housing for older persons, HOPA requires (1) all residents of such developments to be at least 62 years of age or (2) that at least 80% of the occupied apartment homes are occupied by at least one person who is at least 55 years of age and that the housing community publish and adhere to policies and procedures that demonstrate this required intent and comply with rules issued by the United States Department of Housing and Urban Development, or HUD, for verification of occupancy. In addition, certain states require that age-restricted communities register with the state. Noncompliance with the FHA, HOPA or state registration requirements could result in the imposition of fines, awards of damages to private litigants, payment of attorneys’ fees and other costs to plaintiffs, substantial litigation costs and substantial costs of remediation, all of which would reduce the amount of cash available for distribution to our stockholders.
Government housing regulations may limit the opportunities at some of the government-assisted housing properties we invest in, and failure to comply with resident qualification requirements may result in financial penalties or loss of benefits, such as rental revenues paid by government agencies.
To the extent that we invest in government-assisted housing, we may acquire properties that benefit from governmental programs intended to provide affordable housing to individuals with low or moderate incomes. These programs, which are typically administered by HUD or state housing finance agencies, generally provide mortgage insurance, favorable financing terms, tax credits or rental assistance payments to property owners. As a condition of the receipt of assistance under these programs, the properties must comply with various requirements, which typically limit rents to pre-approved amounts and impose restrictions on resident incomes. Failure to comply with these requirements and restrictions may result in financial
19
penalties or loss of benefits. In addition, we will typically need to obtain the approval of HUD in order to acquire or dispose of a significant interest in or manage a HUD-assisted property.
Risks Associated with Real Estate-Related Assets
Disruptions in the financial markets and deteriorating economic conditions could adversely impact the market for real estate-related assets, which may negatively impact our investments in real-estate related assets.
We may invest in real estate-related assets backed by multifamily properties. The returns available to investors in these investments are determined by: (1) the supply and demand for such investments and (2) the existence of a market for such investments, which includes the ability to sell or finance such investments. During periods of volatility the number of investors participating in the market may change at an accelerated pace. As liquidity or “demand” increases, the returns available to investors will decrease. Conversely, a lack of liquidity will cause the returns available to investors to increase. In recent years, concerns pertaining to the deterioration of credit in the residential mortgage market have adversely impacted almost all areas of the debt capital markets including corporate bonds, asset-backed securities and commercial real estate bonds and loans. Future instability in the financial markets or weakened economic conditions may negatively impact investments in such real estate-related assets.
If we make or invest in mortgage loans, our mortgage loans may be affected by unfavorable real estate market conditions and other factors that impact the commercial real estate underlying the mortgage loans, which could decrease the value of those loans and the return on your investment.
If we make or invest in mortgage loans, we will be at risk of defaults by the borrowers on those mortgage loans. These defaults may be caused by many conditions beyond our control, including interest rate levels, economic conditions affecting real estate values and other factors that impact the value of the underlying real estate. We will not know whether the values of the properties securing our mortgage loans will remain at the levels existing on the dates of origination of those mortgage loans. If the values of the underlying properties decrease, our risk will increase because of the lower value of the security associated with such loans.
Our investments in real estate-related assets may be illiquid, and we may not be able to reallocate our portfolio in response to changes in economic and other conditions.
Certain of the real estate-related assets that we may purchase in connection with privately negotiated transactions will not be registered under the relevant securities laws, resulting in a prohibition against their transfer, sale, pledge or other disposition except in a transaction that is exempt from the registration requirements of, or is otherwise in accordance with, those laws. The mezzanine and bridge loans we may purchase would be particularly illiquid investments due to their short life, their unsuitability for securitization and the greater difficulty of recoupment in the event of a borrower’s default. As a result, our ability to reallocate our portfolio in response to changes in economic and other conditions may be relatively limited.
Risks Associated With Debt Financing
We incur mortgage indebtedness and other borrowings that may increase our business risks and could hinder our ability to make distributions and decrease the value of your investment.
We have financed a portion of the purchase price of our multifamily properties by borrowing funds. Under our charter, we are prohibited from borrowing in excess of 300% of the value of our net assets. For valuation purposes, the value of a property will equal the value determined by an independent third-party appraiser or qualified independent valuation expert. Generally speaking, this is expected to approximate 75% of the aggregate cost of our assets. We may borrow in excess of these amounts if such excess is approved by a majority of the independent directors and is disclosed to stockholders in our next quarterly report, along with the justification for such excess. In addition, we may incur mortgage debt and pledge some or all of our investments as security for that debt to obtain funds to acquire additional investments or for working capital. We may also borrow funds as necessary or advisable to ensure we maintain our REIT tax qualification, including the requirement that we distribute at least 90% of our annual REIT taxable income to our stockholders (computed without regard to the dividends-paid deduction and excluding net capital gains). Furthermore, we may borrow in excess of the borrowing limitations in our charter if we otherwise deem it necessary or advisable to ensure that we maintain our qualification as a REIT for U.S. federal income tax purposes.
Certain debt levels will cause us to incur higher interest charges, which would result in increased debt service payments and could be accompanied by restrictive covenants. If there is a shortfall between the cash flow from a property and the cash flow needed to service mortgage debt on that property, the amount available for distributions to our stockholders may be reduced. In addition, incurring mortgage debt increases the risk of loss since defaults on indebtedness secured by a property may result in lenders initiating foreclosure actions. In that case, we could lose the property securing the loan that is in default, thus reducing the value of your investment. For tax purposes, a foreclosure on any of our properties will generally be treated as a sale of the property for a purchase price equal to the outstanding balance of the debt secured by the mortgage. If the
20
outstanding balance of the debt secured by the mortgage exceeds our tax basis in the property, we will recognize taxable income on foreclosure, but we would not receive any cash proceeds. If any mortgage contains cross collateralization or cross default provisions, a default on a single property could affect multiple properties. If any of our properties are foreclosed upon due to a default, our ability to pay cash distributions to our stockholders could be adversely affected.
Instability in the debt markets and our inability to find financing on attractive terms may make it more difficult for us to finance or refinance properties, which could reduce the amount of cash distributions we can make to our stockholders.
If mortgage debt is unavailable on reasonable terms as a result of increased interest rates, underwriting standards, capital market instability or other factors, we run the risk of being unable to refinance such debt when the loans come due, or of being unable to refinance on favorable terms to the extent that we place mortgage debt on properties. If interest rates are higher when we refinance debt, our income could be reduced. We may be unable to refinance debt at appropriate times, which may require us to sell properties on terms that are not advantageous to us, or could result in the foreclosure of such properties. If any of these events occur, our cash flow would be reduced. This, in turn, would reduce cash available for distribution to our stockholders and may hinder our ability to raise more capital by issuing securities or by borrowing more money.
Increases in interest rates could increase the amount of our debt payments and negatively impact our operating results.
The interest we pay on our debt obligations reduces our cash available for distributions. Utilization of variable rate debt, combined with increases in interest rates would increase our interest costs, which would reduce our cash flows and our ability to make distributions to our stockholders. If we need to repay existing debt during periods of rising interest rates, we could be required to liquidate one or more of our investments at times which may not permit realization of the maximum return on such investments.
Changes in banks’ inter-bank lending rate reporting practices or the method pursuant to which LIBOR is determined may impact our variable rate debt and adversely affect our ability to manage and hedge our debt.
Our variable rate debt is tied to the benchmark LIBOR. LIBOR and other indices are the subject of recent national, international, and other regulatory guidance and proposals for reform. Some of these reforms are already effective while others are still to be implemented. These reforms may cause such benchmarks to perform differently than in the past, or have other consequences which cannot be predicted. LIBOR is calculated by reference to a market for interbank lending that continues to shrink, as it’s based on increasingly fewer actual transactions. This increases the subjectivity of the LIBOR calculation process and increases the risk of manipulation. Actions by the regulators or law enforcement agencies, as well as ICE Benchmark Administration (the current administrator of LIBOR), may result in changes to the manner in which LIBOR is determined or the establishment of alternative reference rates. For example, on July 27, 2017, the U.K. Financial Conduct Authority announced that it intends to stop persuading or compelling banks to submit LIBOR rates after 2021.
It is likely that, over time, U.S. Dollar LIBOR will be replaced by the Secured Overnight Financing Rate (“SOFR”) published by the Federal Reserve Bank of New York. However, the manner and timing of this shift is currently unknown. SOFR is an overnight rate instead of a term rate, making SOFR an inexact replacement for LIBOR. There is currently no perfect way to create robust, forward-looking, SOFR term rates. Market participants are still considering how various types of financial instruments and securitization vehicles should react to a discontinuation of LIBOR. It is possible that not all of our variable rate debt will transition away from LIBOR at the same time, and it is possible that not all of our variable rate debt will transition to the same alternative reference rate, in each case increasing the difficulty of hedging. Switching existing financial instruments and hedging transactions from LIBOR to SOFR requires calculations of a spread. Industry organizations are attempting to structure the spread calculation in a manner that minimizes the possibility of value transfer between counterparties, borrowers, and lenders by virtue of the transition, but there is no assurance that the calculated spread will be fair and accurate or that all asset types and all types of securitization vehicles will use the same spread. We and other market participants have less experience understanding and modeling SOFR-based assets and liabilities than LIBOR-based assets and liabilities, increasing the difficulty of investing, hedging, and risk management. The process of transition involves operational risks. It is also possible that no transition will occur for many financial instruments, meaning that those instruments would continue to be subject to the weaknesses of the LIBOR calculation process. At this time, it is not possible to predict the effect of any such changes, any establishment of alternative reference rates or any other reforms to LIBOR that may be implemented. If LIBOR ceases to exist, we may need to renegotiate with borrowers and financing institutions that utilize LIBOR as a factor in determining the interest rate to replace LIBOR with the new standard that is established. As such, the potential effect of any such event on our cost of capital and interest income cannot yet be determined.
Lenders may require us to enter into restrictive covenants relating to our operations, which could limit our ability to make distributions to our stockholders.
When providing financing, a lender may impose restrictions on us that affect our distributions and operating policies, and our ability to incur additional debt. Loan documents we enter into may contain covenants that limit our ability to further mortgage a property, discontinue insurance coverage, or replace our advisor. In addition, loan documents may limit our ability
21
to replace a property’s property manager or terminate certain operating or lease agreements related to a property. These or other limitations may adversely affect our flexibility and our ability to achieve our investment objectives.
The derivative financial instruments that we use to hedge against interest rate fluctuations may not be successful in mitigating our risks associated with interest rates and could reduce the overall returns on your investment.
We use derivative financial instruments, such as interest rate cap or collar agreements and interest rate swap agreements, to hedge exposures to changes in interest rates on loans secured by our assets, but no hedging strategy can protect us completely. These agreements involve risks, such as the risk that counterparties may fail to honor their obligations under these arrangements and that these arrangements may not be effective in reducing our exposure to interest rate changes. We cannot assure you that our hedging strategy and the derivatives that we use will adequately offset the risk of interest rate volatility or that our hedging transactions will not result in losses. In addition, the use of such instruments may reduce the overall return on our investments. These instruments may also generate income that may not be treated as qualifying REIT income for purposes of the 75% or 95% REIT income tests.
Federal Income Tax Risks
Failure to qualify as a REIT would reduce our net cash flows available for investment or distribution.
In order for us to qualify as a REIT, we must satisfy certain complex requirements set forth in the Code and Treasury Regulations relating to our organization, ownership and nature and amount of our assets, income and distributions, some of which may not be entirely within our control. Although we intend to structure our activities in a manner designed to satisfy all of these requirements, there can be no assurance that we will actually do so.
If we fail to qualify as a REIT for any taxable year and we do not qualify for certain statutory relief provisions, we will be subject to U.S. federal income tax on our taxable income at corporate rates. In addition, we would generally be disqualified from treatment as a REIT for the four taxable years following the taxable year in which we lost our REIT status. Losing our REIT status would reduce our net earnings available for investment or distribution to stockholders because of the additional tax liability. In addition, distributions to stockholders would no longer qualify for the dividends paid deduction, and we would no longer be required to make distributions. If this occurs, we might be required to borrow funds or liquidate some investments in order to pay the applicable tax. Our failure to qualify as a REIT could adversely affect the return on a stockholder’s investment.
You may have current tax liability on distributions you elect to reinvest in our common stock.
If you participate in our distribution reinvestment plan, you will be deemed to have received, and for U.S. federal income tax purposes will recognize taxable income equal to the amount reinvested in our shares to the extent such amount does not exceed our earnings and profits. As a result, unless you are a tax-exempt entity, you may have to use funds from other sources to pay your tax liability on distributions reinvested in our shares.
Distributions payable by REITs generally are subject to a higher tax rate than regular corporate dividends under current law.
The maximum U.S. federal income tax rate for certain qualified dividends payable to U.S. stockholders that are individuals, trusts and estates generally is 20%. Dividends payable by REITs, however, are generally not eligible for the reduced rates for qualified dividends and are taxed at ordinary income rates (but U.S. stockholders that are individuals, trusts and estates generally may deduct 20% of ordinary dividends from a REIT for taxable years beginning after December 31, 2017, and before January 1, 2026.
The more favorable rates applicable to regular corporate dividends under current law could cause investors who are individuals, trusts and estates or are otherwise sensitive to these lower rates to perceive investments in REITs to be relatively less attractive than investments in the stocks of non-REIT corporations that pay dividends, which could adversely affect the value of the stock of REITs, including shares of our common stock.
REIT distribution requirements could adversely affect our ability to execute our business plan.
We generally must distribute annually at least 90% of our REIT taxable income (which is determined without regard to the dividends paid deduction or net capital gain for this purpose) in order to qualify as a REIT. To the extent that we satisfy this distribution requirement, but distribute less than 100% of our REIT taxable income (including net capital gain), we will be subject to U.S. federal corporate income tax on our undistributed REIT taxable income. In addition, if we fail to distribute during each calendar year at least the sum of (a) 85% of our ordinary income for that year, (b) 95% of our capital gain net income for that year, and (c) any undistributed taxable income from prior periods, we will be subject to a 4% nondeductible excise tax on the excess of the required distribution over the sum of (i) the amounts that we actually distributed and (ii) the amounts we retained and upon which we paid income tax at the corporate level. Although we intend to make distributions to
22
you to comply with the REIT requirements of the Internal Revenue Code, it is possible that we might not always be able to do so.
From time to time, we may generate taxable income greater than our taxable income for financial reporting purposes, or our taxable income may be greater than our cash flow available for distribution to stockholders. If we do not have other funds available in these situations we could be required to borrow funds, sell investments at disadvantageous prices or find another alternative source of funds to make distributions sufficient to satisfy the REIT distribution requirement and to avoid corporate income tax and the 4% excise tax in a particular year. There is no assurance that outside financing will be available to us. Even if available, the use of outside financing or other alternative sources of funds to pay distributions could increase our costs or dilute your equity interests. Thus, compliance with the REIT requirements may hinder our ability to operate solely on the basis of maximizing profits.
Our gains from sales of our assets are potentially subject to the prohibited transaction tax, which could reduce the return on your investment.
Our ability to dispose of property during the first few years following acquisition may be restricted to a substantial extent as a result of our REIT status. Under applicable provisions of the Code regarding “prohibited transactions” by REITs, we would be subject to a 100% tax on any gain realized on the sale or other disposition of any property (other than foreclosure property) that we own, directly or through any subsidiary entity, including our operating partnership, but generally excluding any taxable REIT subsidiaries, that is deemed to be inventory or property held primarily for sale to customers in the ordinary course of a trade or business, unless we qualify for a statutory safe harbor. Whether property is inventory or otherwise held primarily for sale to customers in the ordinary course of a trade or business depends on the particular facts and circumstances surrounding each property. We intend to avoid the 100% prohibited transaction tax by (1) conducting activities that may otherwise be considered prohibited transactions through a taxable REIT subsidiary or, (2) conducting our operations in such a manner so that no sale or other disposition of an asset we own, directly or through any subsidiary other than a taxable REIT subsidiary, will be treated as a prohibited transaction (including by structuring certain dispositions of our properties to comply with certain safe harbors available under the Internal Revenue Code for properties held at least two years). However, no assurance can be given that any particular property we own, directly or through any subsidiary entity, including our operating partnership, but excluding any taxable REIT subsidiaries, will not be treated as inventory or property held primarily for sale to customers in the ordinary course of a trade or business.
Complying with REIT requirements may force us to liquidate otherwise attractive investments.
To maintain our REIT status, we must ensure that at the end of each calendar quarter, at least 75% of the value of our assets consists of cash, cash items, government securities and qualifying real estate assets, including certain mortgage loans and mortgage-backed securities. Our investment in securities (other than government securities and qualified real estate assets) generally cannot include more than 10% of the outstanding voting securities of any one issuer or more than 10% of the total value of the outstanding securities of any one issuer. In addition, in general, no more than 5% of the value of our assets (other than government securities and qualified real estate assets) can consist of the securities of any one issuer. No more than 20% of the value of our total assets can be represented by securities of one or more taxable REIT subsidiaries, and not more than 25% of the value of our assets may consist of “nonqualified publicly offered REIT debt instruments.”
If we fail to comply with these requirements at the end of any calendar quarter, we must correct the failure within 30 days after the end of the calendar quarter or qualify for certain statutory relief provisions to avoid losing our REIT qualification and suffering adverse tax consequences. As a result, we may be required to liquidate from our portfolio otherwise attractive investments. These actions could have the effect of reducing our income and amounts available for distribution to you.
Liquidation of assets may jeopardize our REIT status.
To maintain our REIT status, we must comply with requirements regarding our assets and our sources of income. If we are compelled to liquidate our investments to repay obligations to our lenders, we may be unable to comply with these requirements, ultimately jeopardizing our qualification as a REIT, or we may be subject to a 100% tax on any resultant gain if we sell assets that are treated as dealer property or inventory.
The failure of a mezzanine loan to qualify as a real estate asset could adversely affect our ability to qualify as a REIT.
We may acquire or originate mezzanine loans. The Internal Revenue Service has provided a safe harbor in Revenue Procedure 2003-65 for structuring mezzanine loans so that they will be treated by the Internal Revenue Service as a real estate asset for purposes of the REIT asset tests and interest derived from mezzanine loans will be treated as qualifying mortgage interest for purposes of the 75% gross income test. Although the Revenue Procedure provides a safe harbor on which taxpayers may rely, it does not prescribe rules of substantive tax law. We may acquire mezzanine loans that do not meet all of the requirements of the safe harbor. In the event we own a mezzanine loan that does not meet the safe harbor, the Internal Revenue Service could challenge such loan’s treatment as a real estate asset for purposes of the REIT asset and income tests and, if such a challenge were sustained, we could fail to continue to qualify as a REIT.
23
If our operating partnership fails to maintain its status as a disregarded entity or partnership, its income may be subject to taxation, which would reduce the cash available for distribution to you and likely result in a loss of our REIT status.
We intend to maintain the status of the operating partnership as a disregarded entity or partnership for U.S. federal income tax purposes. However, if the Internal Revenue Service were to successfully challenge the status of the operating partnership as a disregarded entity or partnership for such purposes, it would be taxable as a corporation. In such event, this would reduce the amount of distributions that the operating partnership could make to us. This would also likely result in our losing REIT status, and, if so, becoming subject to a corporate level tax on our own income. This would substantially reduce any cash available to pay distributions. In addition, if any of the partnerships or limited liability companies through which the operating partnership owns its properties, in whole or in part, loses its characterization as a partnership and is otherwise not disregarded for U.S. federal income tax purposes, it would be subject to taxation as a corporation, thereby reducing distributions to the operating partnership. Such a recharacterization of an underlying property owner could also threaten our ability to maintain our status as a REIT.
Legislative or regulatory action could adversely affect investors.
In recent years, numerous legislative, judicial and administrative changes have been made in the provisions of U.S. federal income tax laws applicable to investments similar to an investment in shares of our common stock. Additional changes to the tax laws are likely to continue to occur, and we cannot assure you that any such changes will not adversely affect our taxation and our ability to continue to qualify as a REIT or the taxation of a stockholder. Any such changes could have an adverse effect on an investment in our shares or on the market value or the resale potential of our assets. You are urged to consult with your own tax advisor with respect to the impact of recent legislation on their investment in our shares and the status of legislative, regulatory or administrative developments and proposals and their potential effect on an investment in our shares.
Although REITs generally receive better tax treatment than entities taxed as regular corporations, it is possible that future legislation would result in a REIT having fewer tax advantages, and it could become more advantageous for a company that invests in real estate to elect to be treated for U.S. federal income tax purposes as a regular corporation. As a result, our charter provides our board of directors with the power, under certain circumstances, to revoke or otherwise terminate our REIT election and cause us to be taxed as a regular corporation, without your vote or the vote of our other stockholders. Our board of directors has fiduciary duties to us and our stockholders and could only cause such changes in our tax treatment if it determines in good faith that such changes are in the best interests of our stockholders.
In addition, the Tax Cuts and Jobs Act, or the Tax Act, made significant changes to the U.S. federal income tax rules for taxation of individuals and businesses. In addition to reducing corporate and individual tax rates, the Tax Act eliminates or restricts various deductions. Most of the changes applicable to individuals are temporary and apply only to taxable years beginning after December 31, 2017, and before January 1, 2026. The Tax Act made numerous large and small changes to the tax rules that do not affect the REIT qualification rules directly, but may otherwise affect us or you.
While the changes in the Tax Act generally appear to be favorable with respect to REITs, the extensive changes to non-REIT provisions in the Internal Revenue Code may have unanticipated effects on us or you.
We urge you to consult with your own tax advisor with respect to the status of the Tax Act and other legislative, regulatory or administrative developments and proposals and their potential effect on an investment in shares of our common stock.
Our property taxes could increase due to property tax rate changes or reassessment, which would impact our cash flows.
Even if we qualify as a REIT for U.S. federal income tax purposes, we will be required to pay some state and local taxes on our properties. The real property taxes on our properties may increase as property tax rates change or as our properties are assessed or reassessed by taxing authorities. Therefore, the amount of property taxes we pay in the future may increase substantially. If the property taxes we pay increase and if any such increase is not reimbursable under the terms of our lease, then our cash flows will be impacted, and our ability to pay expected distributions to you could be adversely affected.
Non-U.S. investors may be subject to FIRPTA on the sale of shares of our common stock if we are unable to qualify as a “domestically controlled qualified investment entity.”
A non-U.S. person (other than certain foreign pension plans and certain foreign publicly traded entities) disposing of a U.S. real property interest, including shares of a U.S. corporation whose assets consist principally of U.S. real property interests, is generally subject to a tax, known as FIRPTA, on the gain recognized on the disposition of such interest. FIRPTA does not apply to the disposition of stock in a REIT if the REIT is “domestically controlled.” A REIT is domestically controlled if, at all times during a specified testing period (the continuous five-year period ending on the date of disposition or, if shorter, the entire period of the REIT’s existence), less than 50% in value of its shares is held directly or indirectly by non-U.S. holders. We cannot assure you that we will qualify as a domestically controlled REIT. If we were to fail to so qualify, gain realized by a non-U.S. investor (other than certain foreign pension plans and certain foreign publicly traded entities) on a sale of our common stock would be subject to FIRPTA unless our common stock was traded on an established securities market and the
24
non-U.S. investor did not at any time during a specified testing period directly or indirectly own more than 10% of the value of our outstanding common stock.
A non-U.S. investor also may be subject to FIRPTA tax upon the payment of any distribution by us, which dividend is attributable to gain from sales or exchanges of U.S. real property interests. We encourage you to consult your own tax advisor to determine the tax consequences applicable to you.
If either or both of the mergers do not qualify as a tax-free reorganization, there may be adverse tax consequences.
The mergers are each intended to qualify as a tax-free reorganization within the meaning of Section 368(a) of the Internal Revenue Code. The closing of the mergers was conditioned on the receipt by each of the Company, SIR and STAR III of an opinion of its counsel to the effect that each merger will qualify as a tax-free reorganization within the meaning of Section 368(a) of the Internal Revenue Code. However, these legal opinions will not be binding on the IRS or on the courts. If, for any reason, the mergers were to fail to qualify as a tax-free reorganization, then each former stockholder of SIR and/or STAR III generally would recognize gain or loss, as applicable, equal to the difference between (i) the merger consideration (i.e. the sum of the cash plus the fair market value of the shares of the Company’s common stock) received by the former SIR and/or STAR III stockholder in the applicable merger, and (ii) such former stockholder’s adjusted tax basis in its shares of SIR or STAR III common stock.
Retirement Plan Risks
If our assets are deemed to be ERISA plan assets, the Advisor and we may be exposed to liabilities under Title I of ERISA and the Internal Revenue Code.
In some circumstances where an ERISA plan holds an interest in an entity, the assets of the entire entity are deemed to be ERISA plan assets unless an exception applies. This is known as the "look-through rule." Under those circumstances, the obligations and other responsibilities of plan sponsors, plan fiduciaries and plan administrators, and of parties in interest and disqualified persons, under Title I of ERISA and Section 4975 of the Code, as applicable, may be applicable, and there may be liability under these and other provisions of ERISA and the Code. We believe that our assets should not be treated as plan assets because the shares should qualify as "publicly-offered securities" that are exempt from the look-through rules under applicable Treasury Regulations. We note, however, that because certain limitations are imposed upon the transferability of shares so that we may qualify as a REIT, and perhaps for other reasons, it is possible that this exemption may not apply. If that is the case, and if the Advisor or we are exposed to liability under ERISA or the Code, our performance and results of operations could be adversely affected. Prior to making an investment in us, you should consult with your legal and other advisors concerning the impact of ERISA and the Code on your investment and our performance.
ITEM 1B. UNRESOLVED STAFF COMMENTS
We have no unresolved staff comments.
ITEM 2. PROPERTIES
As of December 31, 2019, we owned 32 multifamily properties consisting of an aggregate of 11,195 apartment homes and one parcel of land held for the development of apartment homes. The total contract purchase price of our real estate portfolio as of December 31, 2019 was $1,451,454,728, including development costs. For additional information on our real estate portfolio, see Part I, Item I. “Business—Our Real Estate Portfolio” of this Annual Report on Form 10-K.
Our principal executive offices are located at 18100 Von Karman Avenue, Suite 500, Irvine, CA 92612. Our telephone number, general facsimile number and website address are (949) 852-0700, (949) 852-0143 and http://www.steadfastreits.com, respectively.
ITEM 3. LEGAL PROCEEDINGS
From time to time, we are party to legal proceedings that arise in the ordinary course of our business. Management is not aware of any legal proceedings of which the outcome is reasonably likely to have a material adverse effect on our results of operations or financial condition, nor are we aware of any such legal proceedings contemplated by government agencies.
ITEM 4. MINE SAFETY DISCLOSURES
Not applicable.
25
PART II
ITEM 5. MARKET FOR REGISTRANT’S COMMON EQUITY, RELATED STOCKHOLDER MATTERS AND PURCHASES OF EQUITY SECURITIES
Stockholder Information
As of March 5, 2020, we had approximately 52,875,501 shares of common stock outstanding held by a total of approximately 17,500 stockholders. The number of stockholders is based on the records of DST Systems, Inc., who serves as our transfer agent. As a result of the completion of the mergers on March 6, 2020, we had approximately 108,898,305 shares of common stock issued and outstanding held by a total of approximately 40,000 stockholders.
Market Information
No public market currently exists for our shares of common stock and we currently have no plans to list our shares on a national securities exchange. Until our shares are listed, if ever, our stockholders may not sell their shares unless the buyer meets the applicable suitability and minimum purchase requirements. In addition, our charter prohibits the ownership of more than 9.8% in value of our outstanding capital stock (which includes common stock and preferred stock we may issue) and more than 9.8% in value or number of shares, whichever is more restrictive, of our outstanding common stock, unless exempted (prospectively or retroactively) by our board of directors. Consequently, there is the risk that our stockholders may not be able to sell their shares at a time or price acceptable to them.
Estimated Value Per Share
The following is a discussion of the estimated value per share determined by our board of directors as of December 31, 2018, and publicly announced in our Annual Report on Form 10-K for the fiscal year ended December 31, 2018. We intend to establish an updated estimated value per share following the completion of the mergers, which closed on March 6, 2020. We expect that the estimated value per share will be as of March 6, 2020, and will be reported by us in a Current Report on Form 8-K.
Background
In November 2018, our board of directors initiated a process to determine an estimated value per share of the shares of our common stock. We provide an estimated value per share to assist broker-dealers that participated in our public offering in meeting their customer account statement reporting obligations under National Association of Securities Dealers Conduct Rule 2340, as required by the Financial Industry Regulatory Authority, Inc., or FINRA. This valuation was performed in accordance with Practice Guideline 2013-01, Valuations of Publicly Registered Non-Listed REITs, issued by the Institute for Portfolio Alternatives (formerly known as the Investment Program Association), or IPA, in April 2013, or the IPA valuation guidelines. Our board of directors formed a valuation committee, or the valuation committee, comprised solely of independent directors, to oversee the process of determining our estimated value per share. Upon approval of our board of directors, we engaged CBRE Capital Advisors, Inc., or CBRE Cap, a FINRA registered broker dealer firm that specializes in providing real estate financial services, to provide property-level and aggregate valuation analyses and a range for the estimated value per share of our common stock as of December 31, 2018.
From CBRE Cap’s engagement through the issuance of its valuation report on March 12, 2019, or the valuation report, CBRE Cap held discussions with our advisor and our senior management and conducted or commissioned such investigations, research, review and analyses as it deemed necessary. CBRE Cap based its calculation of the range for our estimated value per share of our common stock upon appraisals of all our real properties, or the appraisals, performed by CBRE, Inc., or CBRE, an affiliate of CBRE Cap and an independent third-party appraisal firm, and valuations performed by our advisor with respect to our other assets and liabilities. The valuation committee, upon its receipt and review of the valuation report, concluded that the range between $14.98 and $16.74 for our estimated value per share proposed in the valuation report was reasonable and recommended that the board adopt $15.84 as the estimated value per share of our common stock as of December 31, 2018. The estimated value per share represents the weighted average of the range reflecting the effect of using differing discount rates and terminal capitalization rates in the sensitivity analysis. On March 12, 2019, our board of directors accepted the valuation committee’s recommendation and approved $15.84 as the estimated value per share of our common stock as of December 31, 2018. CBRE Cap is not responsible for the determination of the estimated value per share of our common stock as of December 31, 2018.
26
Valuation Methodology
In preparing the valuation report, CBRE Cap, among other things:
• | reviewed financial and operating information requested from or provided by our advisor and us; |
• | reviewed and discussed with us and our advisor the historical and anticipated future financial performance of our multifamily properties, including forecasts prepared by us and our advisor; |
• | reviewed appraisals commissioned by us that contained analysis on each of our multifamily properties and performed analyses and studies for each property; |
• | conducted or reviewed CBRE Cap proprietary research, including market and sector capitalization rate surveys; |
• | reviewed third-party research, including equity reports and online data providers; |
• | compared our financial information to similar information of companies that CBRE Cap deemed to be comparable; |
• | reviewed our reports filed with the SEC, including our Quarterly Report on Form 10-Q for the period ended September 30, 2018, and the unaudited financial statements therein; and |
• | reviewed the unaudited financial statements as of December 31, 2018, as prepared by us. |
The appraisals were performed in accordance with Uniform Standards of Professional Appraisal Practice and were all MAI appraisals. The appraisals were prepared by CBRE and personnel who are members and hold the MAI designation. CBRE Cap reviewed and took into consideration the appraisals, and described the results of the appraisals in its valuation report. Discreet values were assigned to each property in our portfolio.
Our valuation committee and board of directors considered the following valuation methodology with respect to each multifamily property, which was applied by CBRE Cap in its valuation report. Unlevered, ten-year discounted cash flow analyses from appraisals were created for our fully operational properties. The “terminal capitalization rate” method was used to calculate the terminal value of the assets, with such rates varying based on the specific geographic location and other relevant factors.
Valuation Summary: Material Assumptions
The valuation process we used to determine an estimated value per share was designed to follow the recommendations of the IPA valuation guidelines.
The following table summarizes the key assumptions that were employed by CBRE Cap in the discounted cash flow models to estimate the value of our real estate assets:
Range | Weighted-Average | |||
Terminal capitalization rate | 5.78% - 6.08% | 5.93% | ||
Discount rate | 7.14% - 7.51% | 7.33% | ||
While we believe that CBRE’s assumptions and inputs are reasonable, a change in these assumptions and inputs may significantly impact the appraised value of the real estate properties and our estimated value per share. The table below illustrates the impact on the estimated value per share if the terminal capitalization rates or discount rates were adjusted by 2.5% in either direction, which represents a 5% sensitivity analysis, in accordance with the IPA valuation guidelines, assuming all other factors remain unchanged:
Increase (Decrease) on the Estimated Value per Share due to | ||||||||
Decrease of 2.5% | Increase of 2.5% | |||||||
Terminal capitalization rate | $ | 0.43 | $ | (0.48 | ) | |||
Discount rate | 0.40 | (0.43 | ) | |||||
In its valuation report, CBRE Cap included an estimate of the December 31, 2018 value of our assets, including cash and selected other assets net of payables, and accruals and other liabilities including notes payable. The estimated values of our notes payable are equal to GAAP fair values in this annual report, but do not equal the book value of the loans in accordance with GAAP. The GAAP fair values of our notes payable were determined using a discounted cash flow analysis. The discounted cash flow analysis was based on projected cash flow over the remaining loan terms and on management’s estimates of current market interest rates for instruments with similar characteristics. The carrying values of a majority of our other assets and liabilities are considered to equal their fair value due to their short term maturities or liquid nature. Certain balances, such
27
as lease intangible assets and liabilities related to real estate investments and deferred financing costs have been eliminated for the purpose of the valuation since the value of those balances was already considered in the appraisals.
Our estimated value per share takes into consideration any potential liability related to an incentive fee our advisor was entitled to upon meeting certain stockholder return thresholds in accordance with our charter. For purposes of determining the estimated value per share, our advisor calculated the potential liability related to this incentive fee based on a hypothetical liquidation of our assets and liabilities at their estimated fair values, without considering the impact of any potential closing costs and fees related to the disposition of real estate properties, and determined that there would be a liability related to the incentive fee of $5,218,160.
Taking into consideration the reasonableness of the valuation methodology, assumptions and conclusions contained in the valuation report, the board of directors determined the estimated value of our equity interest in our real estate portfolio to be in the range of $1,777,959,694 to $1,881,531,755 and our net asset value to range between $775,104,772 and $866,261,775, or between $14.98 and $16.74 per share, based on a share count of 51,723,801 shares issued and outstanding as of December 31, 2018.
As with any valuation methodology, the methodologies considered by the valuation committee and board of directors in reaching an estimate of the value of our shares are based upon all of the foregoing estimates, assumptions, judgments and opinions that may, or may not, prove to be correct. The use of different estimates, assumptions, judgments or opinions may have resulted in significantly different estimates of the value of our shares.
The following table summarizes the material components of our estimated value and estimated value per share as of December 31, 2018 and December 31, 2017:
Estimated Value as of December 31, | Estimated Value Per Share as of December 31, | |||||||||||||||
2018 | 2017 | 2018 | 2017 | |||||||||||||
Real estate properties | $ | 1,827,610,000 | $ | 1,777,635,000 | $ | 35.33 | $ | 34.96 | ||||||||
Cash | 72,738,775 | 27,298,855 | 1.41 | 0.54 | ||||||||||||
Other assets | 4,760,131 | 15,903,101 | 0.09 | 0.31 | ||||||||||||
Mortgage debt | (1,042,358,884 | ) | (1,011,004,179 | ) | (20.15 | ) | (19.88 | ) | ||||||||
Other liabilities | (37,994,945 | ) | (34,259,950 | ) | (0.74 | ) | (0.68 | ) | ||||||||
Incentive fee | (5,218,160 | ) | (3,604,360 | ) | (0.10 | ) | (0.07 | ) | ||||||||
Estimated value per share | $ | 819,536,917 | $ | 771,968,467 | $ | 15.84 | $ | 15.18 | ||||||||
The estimated value of our real estate properties as of December 31, 2018 and 2017 was $1,827,610,000 and $1,777,635,000, respectively, while the total cost of the real estate properties was $1,612,494,662 and $1,595,533,800, respectively, comprised of the aggregate purchase price and capital expenditures subsequent to acquisition.
Additional Information Regarding the Valuation, Limitations of Estimated Value per Share and the Engagement of CBRE Cap
In accordance with the IPA valuation guidelines, the valuation committee reviewed, confirmed and approved the processes and methodologies employed by CBRE Cap and their consistency with real estate industry standards and best practices.
The valuation report issued March 12, 2019, was based upon market, economic, financial and other information, circumstances and conditions existing prior to December 31, 2018, and any material change in such information, circumstances and/or conditions may have a material effect on the estimated value per share. CBRE Cap’s valuation materials were addressed solely to our board of directors to assist it in establishing an estimated value of our common stock. CBRE Cap’s valuation materials were restricted, were not addressed to the public and should not be relied upon by any other person to establish an estimated value of our common stock. The valuation report does not constitute a recommendation by CBRE Cap to purchase or sell any shares of our common stock and should not be represented as such.
Each of CBRE Cap and CBRE reviewed the information supplied or otherwise made available to it by us or our advisor for reasonableness, and assumed and relied upon the accuracy and completeness of all such information and of all information supplied or otherwise made available to it by any other party, and did not undertake any duty or responsibility to verify independently any of such information. With respect to operating or financial forecasts and other information and data provided to or otherwise reviewed by or discussed with CBRE Cap and CBRE, CBRE Cap and CBRE assumed that such forecasts and other information and data were reasonably prepared in good faith reflecting our and our advisor’s best currently available estimates and judgments and other subjective judgments, and relied upon us and our advisor to advise CBRE Cap and CBRE promptly if any information previously provided became inaccurate or was required to be updated during the period of its review. CBRE Cap assumes no obligation to update or otherwise revise these materials. In preparing its valuation materials,
28
CBRE Cap did not, and was not requested to, solicit third-party indications of interest for us in connection with possible purchases of our securities or the acquisition of all or any part of us.
In performing its analyses, CBRE Cap made numerous assumptions as of various points in time with respect to industry performance, general business, economic and regulatory conditions, current and future rental market for our operating properties and those in development and other matters, many of which are necessarily subject to change and beyond the control of CBRE Cap and us. The analyses performed by CBRE Cap are not necessarily indicative of actual values, trading values or actual future results of our common stock that might be achieved, all of which may be significantly more or less favorable than suggested by the valuation report. The analyses do not purport to be appraisals or to reflect the prices at which the properties may actually be sold, and such estimates are inherently subject to uncertainty. The actual value of our common stock may vary significantly depending on numerous factors that generally impact the price of securities, our financial condition and the state of the real estate industry more generally. Accordingly, with respect to the estimated value per share of our common stock, neither we nor CBRE Cap can give any assurance that:
• | a stockholder would be able to resell shares at this estimated value; |
• | a stockholder would ultimately realize distributions per share equal to our estimated value per share upon liquidation of our assets and settlement of our liabilities or a sale of the Company; |
• | another independent third-party appraiser or third-party valuation firm would agree with our estimated value per share; |
• | a third party would offer the estimated value per share in an arm’s length transaction to purchase all or substantially all of our shares of common stock; |
• | our shares would trade at a price equal to or greater than the estimated value per share if we listed them on a national securities exchange; or |
• | the methodology used to estimate our value per share would be acceptable to FINRA or the reporting requirements under ERISA, the Internal Revenue Code or other applicable law, or the applicable provisions of a Benefit Plan or IRA. |
The December 31, 2018 estimated value per share was reviewed and recommended by our valuation committee and approved by our board of directors at meetings held on March 12, 2019. The value of our common stock will fluctuate over time as a result of, among other things, developments related to individual assets and responses to the real estate and capital markets.
The estimated value per share does not reflect a discount for the fact that we are externally managed, nor does it reflect a real estate portfolio premium/discount versus the sum of the individual property values. The estimated value per share does not take into account estimated disposition costs and fees for real estate properties that are not under contract to sell or debt prepayment penalties that could apply upon the prepayment of certain of our debt obligations or the impact of restrictions on the assumption of debt.
CBRE Cap is a FINRA registered broker-dealer and is an investment banking firm that specializes in providing real estate financial services. CBRE is actively engaged in the business of appraising commercial real estate properties similar to those owned by us in connection with public securities offerings, private placements, business combinations and similar transactions. We commissioned CBRE to deliver an appraisal report relating to our real estate properties and CBRE received fees upon delivery of such report. In addition, we have agreed to indemnify CBRE Cap against certain liabilities arising out of this engagement. Each of CBRE Cap and CBRE is an affiliate of CBRE Group, Inc., or the CBRE Group, a Fortune 500 and S&P 500 company headquartered in Los Angeles, California, one of the world’s largest commercial real estate services and investment firms (in terms of 2018 revenue) and a parent holding company of affiliated companies that are engaged in the ordinary course of business in many areas related to commercial real estate and related services. CBRE Cap and its affiliates possess substantial experience in the valuation of assets similar to those owned by us and regularly undertake the valuation of securities in connection with public offerings, private placements, business combinations and similar transactions. For the preparation of the valuation report, we paid CBRE Cap a customary fee for services of this nature, no part of which was contingent relating to the provision of services or specific findings. We have not engaged CBRE Cap for any other services. During the past four years, CBRE Cap assisted our board of directors in the determination of the estimated value per share and certain of our affiliates engaged affiliates of CBRE primarily for various real estate-related services and these affiliates of CBRE received fees in connection with such services. We anticipate that affiliates of CBRE will continue to provide similar or other real estate-related services in the future for us and our affiliates. In addition, we may in our discretion engage CBRE Cap to assist our board of directors in future determinations of our estimated value per share. We are not affiliated with CBRE, CBRE Cap or any of their affiliates. CBRE Cap and CBRE and their affiliates may from time to time in the future perform other commercial real estate appraisal, valuation and financial advisory services for us and our affiliates in transactions related to the properties that are the subjects of the appraisals, so long as such other services do not adversely affect the independence of the applicable CBRE appraiser. While we and affiliates of our advisor have engaged and may engage CBRE Cap or its
29
affiliates in the future for commercial real estate services of various kinds, we believe that there are no material conflicts of interest with respect to our engagement of CBRE Cap.
In the ordinary course of their business, each of CBRE Cap and CBRE, and their respective affiliates, directors and officers may structure and effect transactions for their own accounts or for the accounts of their customers in commercial real estate assets of the same kind and in the same markets as our assets.
Distribution Information
To qualify and maintain our qualification as a REIT, we are required to distribute 90% of our annual taxable income, determined without regard to the dividends paid deduction and by excluding net capital gains, to our stockholders. If the aggregate amount of cash distributions in any given year exceeds the amount of our “REIT taxable income” generated during the year, the excess amount will either be (1) a return on capital or (2) gain from the sale or exchange of property to the extent that a stockholder’s basis in our common stock equals or is reduced to zero as the result of our current or prior year distributions.
We declared distributions based on daily record dates for each day during the period commencing April 7, 2014 through December 31, 2019. During the years ended December 31, 2019 and 2018, distributions declared for all record dates of a given month were paid approximately three days after month-end. Distributions were calculated at a rate of $0.002466 per share per day, which if paid each day over a 365-day period is equivalent to a 6.0% annualized distribution rate based on our initial public offering price of $15.00 per share of common stock. There is no guarantee that we will pay distributions at this rate in the future or at all.
Distributions declared during the years ended December 31, 2019 and 2018 aggregated by quarter, are as follows:
2019 | ||||||||||||||||||||
1st Quarter | 2nd Quarter | 3rd Quarter | 4th Quarter | Total | ||||||||||||||||
Total Distributions Declared(1) | $ | 11,511,537 | $ | 11,684,723 | $ | 11,860,005 | $ | 11,915,518 | $ | 46,971,783 | ||||||||||
Total Per Share Distribution | $ | 0.222 | $ | 0.224 | $ | 0.227 | $ | 0.227 | $ | 0.900 | ||||||||||
Annualized Rate Based on Purchase Price | 6.0 | % | 6.0 | % | 6.0 | % | 6.0 | % | 6.0 | % | ||||||||||
2018 | ||||||||||||||||||||
1st Quarter | 2nd Quarter | 3rd Quarter | 4th Quarter | Total | ||||||||||||||||
Total Distributions Declared(1) | $ | 11,312,463 | $ | 11,485,650 | $ | 11,664,156 | $ | 11,717,500 | $ | 46,179,769 | ||||||||||
Total Per Share Distribution | $ | 0.222 | $ | 0.224 | $ | 0.227 | $ | 0.227 | $ | 0.900 | ||||||||||
Annualized Rate Based on Purchase Price | 6.0 | % | 6.0 | % | 6.0 | % | 6.0 | % | 6.0 | % | ||||||||||
_________________
(1) | Distributions were based on daily record dates and calculated at a rate of $0.002466 per share per day for the years ended December 31, 2019 and 2018. |
The tax composition of our distributions declared for the years ended December 31, 2019 and 2018 was as follows:
December 31, | ||||||
2019 | 2018 | |||||
Ordinary income | 17.9 | % | 20.7 | % | ||
Return of capital | 82.1 | % | 79.3 | % | ||
Total | 100.0 | % | 100.0 | % | ||
Generally, our policy is to pay distributions from cash flow from operations. Because we may receive income from interest or rents at various times during our fiscal year and because we may need cash flow from operations during a particular period to fund capital expenditures and other expenses, we expect that from time to time during our operational stage, we will declare distributions in anticipation of cash flow that we expect to receive during a later period, and we expect to pay these distributions in advance of our actual receipt of these funds. In these instances, our board of directors has the authority under our organizational documents, to the extent permitted by Maryland law, to fund distributions from sources such as borrowings, offering proceeds or the deferral of fees and expense reimbursements by our advisor in its sole discretion. We have not established a limit on the amount of proceeds we may use from any public or private securities offerings to fund distributions.
30
If we pay distributions from sources other than cash flow from operations, we will have fewer funds available for investments and our stockholders’ overall return on their investment in us may be reduced. As of December 31, 2019, 20%, 10% and 70% of distributions, including shares issued pursuant to our distribution reinvestment plan, have been funded from funds equal to amounts reinvested in our distribution reinvestment plan, net public offering proceeds and cash flows from operations, respectively.
Pursuant to our distribution reinvestment plan, stockholders had the option to elect to have their cash distributions reinvested in shares of our common stock at an initial price of $14.25 per share. On February 14, 2017, our board of directors determined a new share price of $14.85 for purposes of our distribution reinvestment plan. On March 14, 2018, our board of directors determined a new share price of $15.18 for purposes of our distribution reinvestment plan. On March 12, 2019, our board of directors determined a new share price of $15.84 for purposes of our distribution reinvestment plan. In each instance the share price for our distribution reinvestment plan was revised in connection with our board of directors determining a new estimated value per share. No sales commissions or dealer manager fees are payable on shares sold through our distribution reinvestment plan. Our board of directors may terminate the distribution reinvestment plan at its discretion at any time upon ten days’ notice to our stockholders. Following any termination of the distribution reinvestment plan, all subsequent distributions to stockholders will be made in cash.
For additional information on our distributions, see Item 7. “Management’s Discussion and Analysis of Financial Condition and Results of Operations—Distributions.”
Unregistered Sales of Equity Securities
On each of August 10, 2017, August 8, 2018 and November 6, 2019, we granted 1,666 shares of restricted common stock to each of our three independent directors pursuant to our independent directors’ compensation plan as compensation for services in connection with their re-election to the board of directors at our annual meeting of stockholders. The shares of restricted stock issued pursuant to our independent directors’ compensation plan were issued in transactions exempt from registration pursuant to Section 4(a)(2) of the Securities Act.
Share Repurchase Plan
Our share repurchase plan may provide an opportunity for our stockholders to have their shares of common stock repurchased by us, subject to certain restrictions and limitations.
On March 14, 2018, our board of directors amended the terms of our share repurchase plan effective as of April 15, 2018 to (1) limit the amount of shares repurchased pursuant to our share repurchase plan each quarter to $2,000,000 and (2) revise the repurchase price to an amount equal to 93% of the most recent publicly disclosed estimated value per share. Pursuant to the amended share repurchase program, the share repurchase price was $14.73 per share, which represented 93% of the estimated value per share of $15.84. As discussed in more detail below, our board of directors further amended our share repurchase plan on March 3, 2020 in connection with the mergers. Prior to the March 3, 2020 amendments, the share repurchase price was further reduced based on how long the stockholder had held the shares as follows:
Share Purchase Anniversary | Repurchase Price on Repurchase Date(1) | |
Less than 1 year | No Repurchase Allowed | |
1 year | 92.5% of the Share Repurchase Price(2) | |
2 years | 95.0% of the Share Repurchase Price(2) | |
3 years | 97.5% of the Share Repurchase Price(2) | |
4 years | 100.0% of the Share Repurchase Price(2) | |
In the event of a stockholder’s death or disability(3) | Average Issue Price for Shares(4) | |
_________________
(1) | As adjusted for any stock dividends, combinations, splits, recapitalizations or any similar transaction with respect to the shares of common stock. Repurchase price includes the full amount paid for each share, including all sales commissions and dealer manager fees. |
(2) The “Share Repurchase Price” equals 93% of the most recent publicly disclosed estimated value per share determined by our board of directors.
(3) | The required one-year holding period does not apply to repurchases requested within two years after death or disability of a stockholder. |
31
(4) | The purchase price per share for shares repurchased upon the death or disability of a stockholder will be equal to the average issue price per share for all of the stockholder’s shares. |
The purchase price per share for shares repurchased pursuant to our share repurchase plan is further reduced by the aggregate amount of net proceeds per share, if any, distributed to our stockholders prior to the repurchase date (defined below) as a result of the sale of one or more of our assets that constitutes a return of capital as a result of such sales.
Repurchases of shares of our common stock are made quarterly upon written request to us at least 15 days prior to the end of the applicable quarter. Repurchase requests will be honored approximately 30 days following the end of the applicable quarter, or the repurchase date. Stockholders may withdraw their repurchase request at any time up to three business days’ prior to the repurchase date.
In connection with the announcement of the then-proposed SIR Merger and STAR III Merger, on August 5, 2019, our board of directors approved the Amended and Restated Share Repurchase Plan, or the Amended & Restated SRP, which became effective September 5, 2019, and applied with repurchases made on the repurchase dates subsequent to the effective date of the Amended & Restated SRP. Under the Amended & Restated SRP, we only repurchased shares of common stock in connection with the death or qualifying disability (as determined by our board of directors in its sole discretion) of a stockholder, subject to certain terms and conditions specified in the Amended & Restated SRP. Repurchases pursuant to the Amended and Restated SRP continued to be limited to $2,000,000 per quarter.
On March 3, 2020, in connection with the closing of the SIR Merger and the STAR III Merger, our board of directors adopted a Second Amended and Restated Share Repurchase Plan to: (1) allow all stockholders to request repurchases (as opposed to death and disability only), (2) limit the amount of shares repurchased pursuant to the SRP each quarter to $4,000,000 and (3) set the repurchase price in all instances (including death and disability) to an amount equal to 93% of the most recent publicly disclosed estimated value per share. The $4,000,000 quarterly limit and the repurchase price of 93% of the estimated value per share will take effect upon 30 days’ notice to stockholders and will be in effect on the repurchase date at the end of April 2020 with respect to redemptions for the fiscal quarter ending March 31, 2020, or the First Quarter Redemptions; provided, however, that we will continue to limit First Quarter Redemptions to death and disability only. Our share repurchase plan will be open to all redemption requests for the second quarter of 2020.
We cannot guarantee that the funds set aside for the share repurchase plan will be sufficient to accommodate all repurchase requests made in any quarter. In the event that we do not have sufficient funds available to repurchase all of the shares of our common stock for which repurchase requests have been submitted in any quarter, priority will be given to repurchase requests in the case of the death or disability of a stockholder. If we repurchase less than all of the shares subject to a repurchase request in any quarter, with respect to any shares which have not been repurchased, we will treat the shares that have not been repurchased as a request for repurchase in the following quarter pursuant to the limitations of the share repurchase plan and when sufficient funds are available unless the stockholder withdraws the request for repurchase. Such pending requests will be honored among all requests for repurchases in any given repurchase period as follows: first, pro rata as to repurchases sought upon a stockholder’s death or disability; and then next in exigent circumstances as determined by our board of directors in its sole discretion; and, finally, pro rata as to other repurchase requests.
We are not obligated to repurchase shares of our common stock under the share repurchase plan. The share repurchase plan limits the number of shares to be repurchased in any calendar year to (1) the lessor of 5% of the weighted average number of shares of common stock outstanding during the prior calendar year or any quarterly limit adopted by our board of directors and (2) those that could be funded from the net proceeds from the sale of shares under our distribution reinvestment plan in the prior calendar year, plus such additional funds as may be reserved for that purpose by our board of directors. Such sources of funds could include cash on hand, cash available from borrowings and cash from liquidations of securities investments as of the end of the applicable month, to the extent that such funds are not otherwise dedicated to a particular use, such as working capital, cash distributions to stockholders or purchases of real estate assets. There is no fee in connection with a repurchase of shares of our common stock pursuant to our share repurchase plan.
Our board of directors may, in its sole discretion, amend, suspend or terminate the share repurchase plan at any time upon 30 days’ notice to our stockholders if it determines that the funds available to fund the share repurchase plan are needed for other business or operational purposes or that amendment, suspension or termination of the share repurchase plan is in the best interest of our stockholders. Therefore, a stockholder may not have the opportunity to make a repurchase request prior to any potential termination or suspension of our share repurchase plan. The share repurchase plan will terminate in the event that a secondary market develops for our shares of common stock.
32
During the year ended December 31, 2019, we fulfilled repurchase requests and repurchased shares of our common stock pursuant to our share repurchase plan as follows:
Total Number of Shares Requested to be Repurchased(1) | Total Number of Shares Repurchased | Average Price Paid per Share(2)(3) | Approximate Dollar Value of Shares Available That May Yet Be Repurchased Under the Program | |||||||||
January 2019 | 142,184 | 138,961 | $ | 14.39 | (4) | |||||||
February 2019 | 151,987 | — | — | (4) | ||||||||
March 2019 | 146,737 | — | — | (4) | ||||||||
April 2019 | 97,417 | — | — | (4) | ||||||||
May 2019 | 183,346 | 135,885 | 14.72 | (4) | ||||||||
June 2019 | 74,844 | — | — | (4) | ||||||||
July 2019 | 18,740 | 135,389 | 14.77 | (4) | ||||||||
August 2019 | 25,214 | — | — | (4) | ||||||||
September 2019 | 11,347 | — | — | (4) | ||||||||
October 2019 | 19,745 | 55,301 | 14.82 | (4) | ||||||||
November 2019 | 21,029 | 10,134 | 15.00 | (4) | ||||||||
December 2019 | 12,377 | — | — | (4) | ||||||||
904,967 | 475,670 | |||||||||||
________________
(1) | We generally repurchase shares approximately 30 days following the end of the applicable quarter in which requests were received. At December 31, 2019, we had $797,289, representing 53,152 shares of outstanding and unfulfilled repurchase requests, all of which were fulfilled on January 31, 2020. |
(2) | During the year ended December 31, 2019, we repurchased shares at prices determined as follows: |
• | 92.5% of the Share Repurchase Price for stockholders who have held their shares for at least one year; |
• | 95.0% of the Share Repurchase Price for stockholders who have held their shares for at least two years; |
• | 97.5% of the Share Repurchase Price for stockholders who have held their shares for at least three years; and |
• | 100% of the Share Repurchase Price for stockholders who have held their shares for at least four years. |
The Share Repurchase Price is 93% of the most recently determined estimated value per share. Notwithstanding the above, the repurchase price for repurchases sought upon a stockholder’s death, “qualifying disability” or “determination of incompetence” was the average issue price the respective stockholder paid to acquire the shares from us. In connection with the announcement of the proposed SIR Merger and STAR III Merger, on August 5, 2019, our board of directors approved the Amended and Restated Share Repurchase Plan, or the Amended & Restated SRP, which became effective September 5, 2019, and applied with repurchases made on the repurchase dates subsequent to the effective date of the Amended & Restated SRP. Under the Amended & Restated SRP, we only repurchased shares of common stock in connection with the death or qualifying disability (as determined by our board of directors in its sole discretion) of a stockholder, subject to certain terms and conditions specified in the Amended & Restated SRP.
(3) | From inception through December 31, 2019, our share repurchases have been funded exclusively from the net proceeds we received from the sale of shares under our distribution reinvestment plan. |
(4) | We are not obligated to repurchase shares of our common stock under the share repurchase plan. In no event will repurchases under the share repurchase plan exceed 5% of the weighted average number of shares of common stock outstanding during the prior calendar year or the $2,000,000 limit for any quarter, which will be increased to $4,000,000 beginning with the first quarter of 2020 repurchase date and sets the repurchase price in all instances (ordinary and qualifying death or disability) to an amount equal to 93% of the most recent publicly disclosed estimated value per share. |
33
ITEM 6. SELECTED FINANCIAL DATA
The following selected financial data as of December 31, 2019, 2018, 2017, 2016 and 2015 and for the years then ended should be read in conjunction with the accompanying consolidated financial statements and related notes thereto and Item 7. “Management’s Discussion and Analysis of Financial Condition and Results of Operations.” During the period from August 22, 2013 (inception) to May 22, 2014, we were in existence and commenced our initial public offering, but had not yet commenced real estate operations, as we had not yet acquired any real estate investments. As a result, we had no material results of operations for that period. We terminated our initial public offering on March 24, 2016.
Our results of operations for the periods presented below are not indicative of those expected in future periods.
As of December 31, | |||||||||||||||||||
2019 | 2018 | 2017 | 2016 | 2015 | |||||||||||||||
Balance sheet data | |||||||||||||||||||
Total real estate, net | $ | 1,270,871,366 | $ | 1,356,639,742 | $ | 1,411,166,101 | $ | 1,453,385,165 | $ | 1,207,028,126 | |||||||||
Total assets | 1,426,957,126 | 1,434,138,648 | 1,454,368,057 | 1,497,101,228 | 1,258,692,194 | ||||||||||||||
Notes payable | 1,108,559,045 | 1,050,155,743 | 993,405,862 | 971,761,151 | 850,766,025 | ||||||||||||||
Total liabilities | 1,150,940,557 | 1,088,150,688 | 1,027,665,812 | 1,007,103,450 | 876,726,253 | ||||||||||||||
Redeemable common stock | 1,202,711 | — | 36,397,062 | 27,949,492 | 9,401,360 | ||||||||||||||
Total stockholders’ equity | 274,813,858 | 345,987,960 | 390,305,183 | 462,048,286 | 372,564,581 | ||||||||||||||
For the Year Ended December 31, | |||||||||||||||||||
2019 | 2018 | 2017 | 2016 | 2015 | |||||||||||||||
Operating data | |||||||||||||||||||
Total revenues | $ | 173,535,679 | $ | 169,124,188 | $ | 163,036,959 | $ | 143,301,398 | $ | 68,395,123 | |||||||||
Net loss | (38,524,316 | ) | (49,100,346 | ) | (33,623,841 | ) | (37,682,474 | ) | (50,694,124 | ) | |||||||||
Net loss attributable to common stockholders | (38,524,316 | ) | (49,100,346 | ) | (33,623,841 | ) | (37,682,474 | ) | (50,694,124 | ) | |||||||||
Loss per common share - basic and diluted | (0.74 | ) | (0.96 | ) | (0.67 | ) | (0.80 | ) | (2.33 | ) | |||||||||
Other data | |||||||||||||||||||
Cash flows provided by operating activities | 29,078,255 | 33,557,275 | 34,670,391 | 38,221,740 | 6,674,297 | ||||||||||||||
Cash flows provided by (used in) investing activities | 22,714,294 | (17,481,756 | ) | (26,784,774 | ) | (269,914,470 | ) | (910,353,430 | ) | ||||||||||
Cash flows provided by (used in) financing activities | 24,008,347 | 17,995,551 | (8,033,178 | ) | 225,786,450 | 917,012,264 | |||||||||||||
Distributions declared | 46,971,783 | 46,179,769 | 45,321,063 | 42,357,688 | 19,559,628 | ||||||||||||||
Distributions declared per common share(1) | 0.900 | 0.900 | 0.900 | 0.900 | 0.900 | ||||||||||||||
Weighted-average number of common shares outstanding, basic and diluted | 52,204,410 | 51,312,947 | 50,358,618 | 47,092,206 | 21,753,832 | ||||||||||||||
FFO(2) | 23,604,194 | 21,892,934 | 34,793,715 | 30,309,069 | (8,255,364 | ) | |||||||||||||
MFFO(2) | 25,378,778 | 27,369,983 | 35,243,568 | 36,566,768 | 17,530,067 | ||||||||||||||
_________________
(1) | On April 4, 2014, our board of directors approved a cash distribution that began to accrue on April 7, 2014. Distributions declared per common share for the years ended December 31, 2019, 2018, 2017, 2016 and 2015 assume each share was issued and outstanding each day of each year. During the years ended December 31, 2019, 2018 and 2017, distributions declared were calculated at a rate of $0.002466 per share of common stock per day, which if paid over a 365-day period is equivalent to a 6.0% annualized distribution rate based on our initial public offering price of $15.00 per share of common stock. |
(2) | GAAP basis accounting for real estate assets utilizes historical cost accounting and assumes real estate values diminish over time. In an effort to overcome the difference between real estate values and historical cost accounting for real estate assets, the Board of Governors of the National Association of Real Estate Investment Trusts, or NAREIT, established the measurement tool of FFO. Since its introduction, FFO has become a widely used non-GAAP financial measure among |
34
REITs. Additionally, we use MFFO, as defined by the IPA, as a supplemental measure to evaluate our operating performance. MFFO is based on FFO but includes certain adjustments we believe are necessary due to changes in accounting and reporting under GAAP since the establishment of FFO. Neither FFO nor MFFO should be considered as an alternative to net loss or other measurements under GAAP as indicators of our operating performance, nor should they be considered as alternatives to cash flow from operating activities or other measurements under GAAP as indicators of liquidity. For additional information on how we calculate FFO and MFFO and a reconciliation of FFO and MFFO to net loss, see Item 7. “Management’s Discussion and Analysis of Financial Condition and Results of Operations—Funds From Operations and Modified Funds From Operations.”
ITEM 7. MANAGEMENT’S DISCUSSION AND ANALYSIS OF FINANCIAL CONDITION AND RESULTS OF OPERATIONS
The following discussion and analysis should be read in conjunction with the “Selected Financial Data” above and our accompanying consolidated financial statements and the notes thereto included in this Annual Report on Form 10-K. Also see “Cautionary Note Regarding Forward Looking Statements” preceding Part I.
This section of the Annual Report on Form 10-K generally discusses 2019 and 2018 items and year-to-year comparisons between 2019 and 2018. A discussion of the changes in our financial condition and results of operation for the years ended December 31, 2018 and 2017 has been omitted from this Annual Report on Form 10-K, but may be found in “Management’s Discussion and Analysis of Financial Condition and Results of Operations” in Part II, Item 7 of our Annual Report on Form 10-K for the year ended December 31, 2018, filed with the SEC on March 14, 2019.
Overview
We were formed on August 22, 2013, as a Maryland corporation that elected to be taxed as, and qualifies as, a REIT. As of December 31, 2019, we owned and managed a diverse portfolio of multifamily properties, located in the United States comprising a total of 11,195 apartment homes and one parcel of land held for the development of apartment homes. Following completion of the SIR Merger and STAR III Merger on March 6, 2020, we owned and managed a total of 21,525 apartment homes, one parcel of land held for development and a 10% interest in a joint venture that owned 20 multifamily properties with a total of 4,584 apartment homes. We may acquire additional multifamily properties or pursue multifamily development projects in the future.
On December 30, 2013, we commenced our initial public offering of up to 66,666,667 shares of common stock at an initial price of $15.00 per share and up to 7,017,544 shares of common stock pursuant to our distribution reinvestment plan at an initial price of $14.25 per share. On March 24, 2016, we terminated our initial public offering. As of March 24, 2016, we had sold 48,625,651 shares of common stock for gross offering proceeds of $724,849,631, including 1,011,561 shares of common stock issued pursuant to our distribution reinvestment plan for gross offering proceeds of $14,414,752. Following the termination of our initial public offering, we continue to offer shares of our common stock pursuant to our distribution reinvestment plan. As of December 31, 2019, we had sold 54,276,237 shares of common stock for gross offering proceeds of $809,562,356, including 6,662,210 shares of common stock issued pursuant to our distribution reinvestment plan for gross offering proceeds of $99,127,477.
On March 14, 2018, our board of directors determined an estimated value per share of our common stock of $15.18 as of December 31, 2017. On March 12, 2019, our board of directors determined an estimated value per share of our common stock of $15.84 as of December 31, 2018. In connection with the determination of an estimated value per share, our board of directors determined a purchase price per share for the distribution reinvestment plan of $15.18 and $15.84, effective April 1, 2018 and April 1, 2019, respectively. We intend to establish an updated estimated value per share following the completion of the mergers, which closed on March 6, 2020. We expect that the estimated value per share will be as of March 6, 2020, and will be reported by us in a Current Report on Form 8-K.
Subject to certain restrictions and limitations, Steadfast Apartment Advisor, LLC, which we refer to as our “advisor,” manages our day-to-day operations and our portfolio of properties and real estate-related assets. Our advisor sources and presents investment opportunities to our board of directors. Our advisor also provides investment management, marketing, investor relations and other administrative services on our behalf.
Substantially all of our business is conducted through Steadfast Apartment REIT Operating Partnership, L.P., our operating partnership. We are the sole general partner of our operating partnership and one of our wholly-owned subsidiaries is the only limited partner of our operating partnership. As we accepted subscriptions for shares of common stock in our initial public offering, we transferred substantially all of the net proceeds to our operating partnership as a capital contribution. The limited partnership agreement of our operating partnership provides that our operating partnership will be operated in a manner that will enable us to (1) satisfy the requirements for being classified as a REIT for federal income tax purposes, (2) avoid any
35
federal income or excise tax liability and (3) ensure that our operating partnership will not be classified as a “publicly traded partnership” for purposes of Section 7704 of the Internal Revenue Code which classification could result in our operating partnership being taxed as a corporation, rather than as a disregarded entity. In addition to the administrative and operating costs and expenses incurred by our operating partnership in acquiring and operating our investments, our operating partnership will pay all of our administrative costs and expenses, and such expenses will be treated as expenses of our operating partnership. Following the completion of the mergers on March 6, 2020, we now conduct our business through the operating partnership, Steadfast Income REIT Operating Partnership, L.P. and Steadfast Apartment REIT III Operating Partnership, L.P.
We elected to be taxed as a REIT under the Internal Revenue Code commencing with our taxable year ended December 31, 2014. As a REIT, we generally will not be subject to federal income tax to the extent that we distribute qualifying dividends to our stockholders. If we fail to qualify as a REIT in any taxable year, we would be subject to federal income tax on our taxable income at regular corporate rates and would not be permitted to qualify for treatment as a REIT for federal income tax purposes for four years following the year in which qualification is lost, unless the Internal Revenue Service grants us relief under certain statutory provisions. Failing to qualify as a REIT could materially and adversely affect our net income and results of operations.
Merger with Steadfast Income REIT, Inc.
On August 5, 2019, we, SIR, our operating partnership, Steadfast Income REIT Operating Partnership, L.P., the operating partnership of SIR, and SIR Merger Sub entered into the SIR Merger Agreement. Pursuant to the terms and conditions of the SIR Merger Agreement, on March 6, 2020, SIR merged with and into SIR Merger Sub with SIR Merger Sub surviving the SIR Merger. Following the SIR Merger, SIR Merger Sub, as the surviving entity, will continue as our wholly-owned subsidiary. In accordance with the applicable provisions of the MGCL, the separate existence of SIR ceased.
At the effective time of the SIR Merger, each issued and outstanding share of SIR common stock (or a fraction thereof), $0.01 par value per share converted into 0.5934 shares of our common stock.
Merger with Steadfast Apartment REIT III, Inc.
On August 5, 2019, we, STAR III, our operating partnership, Steadfast Apartment REIT III Operating Partnership, L.P., the operating partnership of STAR III, and STAR III Merger Sub entered into the STAR III Merger Agreement. Pursuant to the terms and conditions of the STAR III Merger Agreement, on March 6, 2020, STAR III merged with and into STAR III Merger Sub with STAR III Merger Sub surviving the STAR III Merger. Following the STAR III Merger, STAR III Merger Sub, as the surviving entity, will continue as our wholly-owned subsidiary. In accordance with the applicable provisions of the MGCL, the separate existence of STAR III ceased.
At the effective time of the STAR III Merger, each issued and outstanding share of STAR III common stock (or a fraction thereof), $0.01 par value per share was converted into 1.430 shares of our common stock.
Combined Company
The combined company after the mergers retains the name “Steadfast Apartment REIT, Inc.” Each merger is intended to qualify as a “reorganization” under, and within the meaning of, Section 368(a) of the Internal Revenue Code.
As of the closing of the mergers, our portfolio (unaudited) consisted of (1) 69 properties (including one property held for development) in 14 states, with an average effective rent of $1,173 and (2) a 10% interest in one unconsolidated joint venture that owned 20 multifamily properties with a total of 4,584 apartment homes. Based on occupancy as of December 31, 2019, our portfolio had an occupancy rate of 94.9%, an average age of 20 years and gross real estate assets value of $3,375,635,000 (unaudited).
As a result of the completion of the mergers, our financial information materially changed; however, the financial information included in this Annual Report on Form 10-K reflects only our stand-alone, historical financial results.
Market Outlook
We believe economic and demographic trends will benefit our existing portfolio and that we have unique future investment opportunities in the multifamily sector. Home ownership rates are at near all-time lows. Demographic and economic factors favor the flexibility of rental housing and discourage the potential financial burden associated with home ownership. Additionally, Millennials and Baby Boomers, the two largest demographic groups comprising roughly half of the total population in the United States, are increasingly choosing rental housing over home ownership. Demographic studies suggest that Baby Boomers are downsizing their suburban homes and relocating to multifamily apartments. Millennials are renting multifamily apartments due to high levels of student debt and increased credit standards in order to qualify for a home mortgage. According to the Federal Reserve Bank of New York, aggregate student debt has surpassed automotive, home equity lines of credit and credit card debt. Millennials are also getting married and having children later and are choosing to live in apartment communities until their mid-30s. Today, approximately 30% of Millennials are still living with their parents or are still in school. When they are employed, Millennials will likely rent moderate income apartments based upon an average income of $45,000 to $65,000. Our plan is to provide rental housing for these generational groups as they age. We believe these factors will continue to contribute to the demand for multifamily housing.
36
Our Real Estate Portfolio
As of December 31, 2019, we owned the 32 multifamily apartment communities and one parcel of land held for the development of apartment homes listed below:
Average Monthly Occupancy(1) | Average Monthly Rent(2) | ||||||||||||||||||||||||||||||
Property Name | Location | Purchase Date | Number of Homes | Contract Purchase Price | Mortgage Debt Outstanding(3) | December 31, 2019 | December 31, 2018 | December 31, 2019 | December 31, 2018 | ||||||||||||||||||||||
1 | Villages at Spring Hill Apartments | Spring Hill, TN | 5/22/2014 | 176 | $ | 14,200,000 | (4 | ) | 96.0 | % | 94.9 | % | $ | 1,120 | $ | 996 | |||||||||||||||
2 | Harrison Place Apartments | Indianapolis, IN | 6/30/2014 | 307 | 27,864,250 | (4 | ) | 94.1 | % | 95.4 | % | 992 | 971 | ||||||||||||||||||
3 | Terrace Cove Apartment Homes | Austin, TX | 8/28/2014 | 304 | 23,500,000 | (4 | ) | 95.1 | % | 95.7 | % | 966 | 918 | ||||||||||||||||||
4 | The Residences on McGinnis Ferry | Suwanee, GA | 10/16/2014 | 696 | 98,500,000 | (4 | ) | 96.0 | % | 93.0 | % | 1,344 | 1,282 | ||||||||||||||||||
5 | The 1800 at Barrett Lakes | Kennesaw, GA | 11/20/2014 | 500 | 49,000,000 | 40,623,442 | 92.4 | % | 95.2 | % | 1,076 | 1,035 | |||||||||||||||||||
6 | The Oasis | Colorado Springs, CO | 12/19/2014 | 252 | 40,000,000 | 39,499,673 | 94.8 | % | 93.7 | % | 1,424 | 1,349 | |||||||||||||||||||
7 | Columns on Wetherington | Florence, KY | 2/26/2015 | 192 | 25,000,000 | (4 | ) | 91.7 | % | 94.3 | % | 1,220 | 1,153 | ||||||||||||||||||
8 | Preston Hills at Mill Creek | Buford, GA | 3/10/2015 | 464 | 51,000,000 | (4 | ) | 91.6 | % | 93.5 | % | 1,192 | 1,113 | ||||||||||||||||||
9 | Eagle Lake Landing Apartments | Speedway, IN | 3/27/2015 | 277 | 19,200,000 | (4 | ) | 96.8 | % | 94.6 | % | 905 | 865 | ||||||||||||||||||
10 | Reveal on Cumberland | Fishers, IN | 3/30/2015 | 220 | 29,500,000 | 20,827,267 | 95.0 | % | 94.5 | % | 1,144 | 1,104 | |||||||||||||||||||
11 | Heritage Place Apartments | Franklin, TN | 4/27/2015 | 105 | 9,650,000 | 8,590,932 | 97.1 | % | 96.2 | % | 1,145 | 1,130 | |||||||||||||||||||
12 | Rosemont at East Cobb | Marietta, GA | 5/21/2015 | 180 | 16,450,000 | 13,258,252 | 96.7 | % | 92.8 | % | 1,100 | 991 | |||||||||||||||||||
13 | Ridge Crossings Apartments | Hoover, AL | 5/28/2015 | 720 | 72,000,000 | 57,668,758 | 92.8 | % | 94.7 | % | 1,012 | 979 | |||||||||||||||||||
14 | Bella Terra at City Center | Aurora, CO | 6/11/2015 | 304 | 37,600,000 | (4 | ) | 96.1 | % | 91.8 | % | 1,221 | 1,150 | ||||||||||||||||||
15 | Hearthstone at City Center | Aurora, CO | 6/25/2015 | 360 | 53,400,000 | (4 | ) | 95.0 | % | 92.2 | % | 1,257 | 1,224 | ||||||||||||||||||
16 | Arbors at Brookfield | Mauldin, SC | 6/30/2015 | 702 | 66,800,000 | (4 | ) | 92.7 | % | 93.0 | % | 923 | 929 | ||||||||||||||||||
17 | Carrington Park | Kansas City, MO | 8/19/2015 | 298 | 39,480,000 | (4 | ) | 95.3 | % | 94.0 | % | 1,011 | 1,013 | ||||||||||||||||||
18 | Delano at North Richland Hills | North Richland Hills, TX | 8/26/2015 | 263 | 38,500,000 | 31,814,165 | 95.8 | % | 94.3 | % | 1,486 | 1,439 | |||||||||||||||||||
19 | Meadows at North Richland Hills | North Richland Hills, TX | 8/26/2015 | 252 | 32,600,000 | 26,580,102 | 94.4 | % | 93.7 | % | 1,392 | 1,339 | |||||||||||||||||||
20 | Kensington by the Vineyard | Euless, TX | 8/26/2015 | 259 | 46,200,000 | 34,111,658 | 95.8 | % | 95.0 | % | 1,507 | 1,485 | |||||||||||||||||||
21 | Monticello by the Vineyard | Euless, TX | 9/23/2015 | 354 | 52,200,000 | 41,229,964 | 96.3 | % | 95.2 | % | 1,344 | 1,336 | |||||||||||||||||||
22 | The Shores | Oklahoma City, OK | 9/29/2015 | 300 | 36,250,000 | 23,653,152 | 94.7 | % | 94.0 | % | 1,016 | 1,000 | |||||||||||||||||||
23 | Lakeside at Coppell | Coppell, TX | 10/7/2015 | 315 | 60,500,000 | 47,883,143 | 96.8 | % | 94.6 | % | 1,716 | 1,687 | |||||||||||||||||||
24 | Meadows at River Run | Bolingbrook, IL | 10/30/2015 | 374 | 58,500,000 | 42,438,707 | 90.1 | % | 91.4 | % | 1,364 | 1,408 | |||||||||||||||||||
37
Average Monthly Occupancy(1) | Average Monthly Rent(2) | ||||||||||||||||||||||||||||||
Property Name | Location | Purchase Date | Number of Homes | Contract Purchase Price | Mortgage Debt Outstanding(3) | December 31, 2019 | December 31, 2018 | December 31, 2019 | December 31, 2018 | ||||||||||||||||||||||
25 | PeakView at T-Bone Ranch | Greeley, CO | 12/11/2015 | 224 | $ | 40,300,000 | (4 | ) | 93.3 | % | 95.5 | % | $ | 1,373 | $ | 1,295 | |||||||||||||||
26 | Park Valley Apartments | Smyrna, GA | 12/11/2015 | 496 | 51,400,000 | 48,575,513 | 94.4 | % | 92.9 | % | 1,068 | 1,012 | |||||||||||||||||||
27 | PeakView by Horseshoe Lake | Loveland, CO | 12/18/2015 | 222 | 44,200,000 | 38,003,137 | 93.7 | % | 94.1 | % | 1,396 | 1,388 | |||||||||||||||||||
28 | Stoneridge Farms | Smyrna, TN | 12/30/2015 | 336 | 47,750,000 | 45,340,947 | 95.2 | % | 93.8 | % | 1,196 | 1,178 | |||||||||||||||||||
29 | Fielder’s Creek | Englewood, CO | 3/23/2016 | 217 | 32,400,000 | — | 96.3 | % | 95.9 | % | 1,219 | 1,193 | |||||||||||||||||||
30 | Landings of Brentwood | Brentwood, TN | 5/18/2016 | 724 | 110,000,000 | (5 | ) | 96.8 | % | 95.9 | % | 1,262 | 1,191 | ||||||||||||||||||
31 | 1250 West Apartments | Marietta, GA | 8/12/2016 | 468 | 55,772,500 | (4 | ) | 93.6 | % | 90.4 | % | 1,061 | 1,008 | ||||||||||||||||||
32 | Sixteen50 @ Lake Ray Hubbard | Rockwall, TX | 9/29/2016 | 334 | 66,050,000 | (4 | ) | 96.4 | % | 94.6 | % | 1,492 | 1,492 | ||||||||||||||||||
33 | Garrison Station Development(6) | Murfreesboro, TN | 5/30/2019 | — | 5,687,978 | — | — | % | — | % | — | — | |||||||||||||||||||
11,195 | $ | 1,451,454,728 | $ | 560,098,815 | 94.6 | % | 93.9 | % | $ | 1,200 | $ | 1,163 | |||||||||||||||||||
________________
(1) | As of December 31, 2019, our portfolio was approximately 96.0% leased, calculated using the number of occupied and contractually leased apartment homes divided by total apartment homes. |
(2) | Average monthly rent is based upon the effective rental income for the month of December 2019 after considering the effect of vacancies, concessions and write-offs. |
(3) | Mortgage debt outstanding is net of deferred financing costs associated with the loans for each individual property listed above but excludes the principal balance of $551,669,000 and associated deferred financing costs of $3,208,770 related to the refinancings pursuant to the MCFA. |
(4) | Properties secured pursuant to the terms of the MCFA. |
(5) | At December 31, 2018, Landings of Brentwood was pledged as collateral pursuant to our line of credit. On January 9, 2019, we terminated the line of credit. |
(6) | We acquired the Garrison Station property on May 30, 2019, which included unimproved land, currently zoned as a PUD. The current zoning permits the development of the property into a multifamily community including 176 apartment homes of 1, 2 and 3-bedrooms with a typical mix for this market. |
2019 Property Dispositions
Randall Highlands Apartments
On March 31, 2015, we, through an indirect wholly-owned subsidiary, acquired Randall Highlands Apartments, a multifamily property located in North Aurora, Illinois, containing 146 apartment homes. The purchase price of Randall Highlands Apartments was $32,115,000, exclusive of closing costs. On September 26, 2019, we sold Randall Highlands Apartments for $31,000,000, resulting in a gain of $3,329,078, which includes reductions to the net book value of the property due to historical depreciation and amortization expense. The purchaser of Randall Highlands Apartments was not affiliated with us or our advisor.
Club at Summer Valley
On August 28, 2014, we, through an indirect wholly-owned subsidiary, acquired Club at Summer Valley, a multifamily property located in Austin, Texas, containing 260 apartment homes. The purchase price of Club at Summer Valley was $21,500,000, exclusive of closing costs. On December 27, 2019, we sold Club at Summer Valley for $28,100,000, resulting in a gain of $8,322,487, which includes reductions to the net book value of the property due to historical depreciation and amortization expense. The purchaser of Club at Summer Valley was not affiliated with us or our advisor.
38
Review of our Policies
Our board of directors, including our independent directors, has reviewed our policies described in this Annual Report on Form 10-K, including policies regarding our investments, leverage and conflicts of interest, and determined that the policies are in the best interests of our stockholders.
Liquidity and Capital Resources
We use secured borrowings, and intend to use in the future secured and unsecured borrowings. At December 31, 2019, our debt was approximately 60% of the value of our properties, as determined by the most recent valuations performed by an independent third-party appraiser as of December 31, 2019. Going forward, we expect that our borrowings (after debt amortization) will be approximately 55% to 65% of the value of our properties and other real estate-related assets. Under our charter, we are prohibited from borrowing in excess of 300% of the value of our net assets, which generally approximates to 75% of the aggregate cost of our assets, though we may exceed this limit only under certain circumstances.
In addition to making investments in accordance with our investment objectives, we use our capital resources to make certain payments to our advisor and its affiliates. Currently, we make payments to our advisor in connection with the acquisition and disposal of investments, the management of our assets and costs incurred by our advisor in providing services to us.
Our principal demand for funds will be to fund value-enhancement and other capital improvement projects, to pay operating expenses and interest on our outstanding indebtedness and to make distributions to our stockholders. Over time, we intend to generally fund our cash needs, other than asset acquisitions, from operations. Otherwise, we expect that our principal sources of working capital will include:
• | unrestricted cash balance, which was $74,806,649 as of December 31, 2019; |
• | various forms of secured and unsecured financing; |
• | equity capital from joint venture partners; and |
• | proceeds from our distribution reinvestment plan. |
Over the short term, we believe that our sources of capital, specifically our cash balances, cash flow from operations, our ability to raise equity capital from joint venture partners and our ability to obtain various forms of secured and unsecured financing will be adequate to meet our liquidity requirements and capital commitments.
Over the longer term, in addition to the same sources of capital we will rely on to meet our short-term liquidity requirements, we may also conduct additional public or private offerings of our securities, refinance debt or dispose of assets to fund our operating activities, debt service, distributions and future property acquisitions and development projects. We expect these resources will be adequate to fund our ongoing operating activities as well as providing capital for investment in future development and other joint ventures along with potential forward purchase commitments.
On May 18, 2016, we entered into a secured revolving line of credit, or the line of credit, with PNC Bank in an amount not to exceed $65,000,000. The line of credit provided for advances solely for the purpose of financing the costs in connection with acquisitions and development of real estate projects and for general corporate purposes (subject to certain debt service and loan to value requirements). The line of credit had a maturity date of May 17, 2019, subject to extension. As of December 31, 2018, no amounts were outstanding on our line of credit. We terminated our line of credit in January 2019. We continue to evaluate possible other sources of capital, including, without limitation, entering into additional credit facilities. There can be no assurance that we will be able to obtain any such financing on favorable terms, if at all.
Master Credit Facility
On July 31, 2018, or the closing date, 16 of our indirect wholly-owned subsidiaries terminated the existing mortgage loans with their lenders for an aggregate principal amount of $479,318,649 and entered into the MCFA with Berkeley Point Capital, LLC, or the facility lender, for an aggregate principal amount of $551,669,000. The MCFA provides for three tranches: (i) a fixed rate loan in the aggregate principal amount of $331,001,400 that accrues interest at 4.43% per annum; (ii) a fixed rate loan in the aggregate principal amount of $137,917,250 that accrues interest at 4.57%; and (iii) a variable rate loan in the aggregate principal amount of $82,750,350 that accrues interest at the one-month LIBOR plus 1.70%. The loans have a maturity date of August 1, 2028, unless the maturity date is accelerated in accordance with the terms of the loan documents. Interest only payments are payable monthly through August 1, 2025, with interest and principal payments due monthly thereafter. We paid $1,930,842 in the aggregate in loan origination fees to the facility lender in connection with the refinancings, and paid our advisor a loan coordination fee of $2,758,345. During the year ended December 31, 2019, we sold
39
two properties and were required to deposit $36,740,983 as substitution for the loan amount allocated in the MCFA to the sold properties, $31,749,791 of which was funded from proceeds from the sales of the properties. On February 11, 2020, in connection with the acquisition financing of a newly acquired property, we and the facility lender amended the MCFA to include as collateral for the MCFA the newly acquired multifamily property, Patina Flats at the Foundry, and the Fielder’s Creek Apartments, an unencumbered multifamily property. We also increased our outstanding borrowings pursuant to the MCFA by $40,468,000, a portion of which was attributable to the acquisition of Patina Flats at the Foundry.
CME Loans
On the closing date, five of our indirect wholly-owned subsidiaries terminated the existing mortgage loans with their lenders for an aggregate principal amount of $131,318,742 and entered into new loan agreements with PNC Bank for an aggregate principal amount of $160,850,000. Each loan agreement provides for a term loan, or a CME Loan, and, collectively, the CME Loans, with a maturity date of August 1, 2028, unless the maturity date is accelerated with the loan terms. Each CME Loan accrues interest at a fixed rate of 4.43% per annum. The entire outstanding principal balance and any accrued and unpaid interest on each of the CME Loans are due on the maturity date. Interest only payments on the CME Loans are payable monthly in arrears on specified dates as set forth in each loan agreement and interest and principal payments are due beginning September 1, 2023. Monthly payments are due and payable on the first day of each month, commencing September 1, 2018. We paid $643,400 in the aggregate in loan origination fees to PNC Bank in connection with the refinancings, and paid our advisor a loan coordination fee of $804,250.
Construction Loan
On October 16, 2019, we entered into an agreement with PNC Bank for a construction loan related to the development of Garrison Station in an aggregate principal amount not to exceed $19,800,000 for a thirty-six month initial term and two twelve month mini-perm extensions. The rate of interest will be at the one-month LIBOR plus 2.00%, which then reduces to the one-month LIBOR plus 1.80% upon achieving completion as defined in the construction loan agreement and at a debt service coverage ratio of 1.15x. The loan includes a 0.4% fee at closing, a 0.1% fee upon exercising the mini-perm and a 0.1% fee upon extending the mini-perm, each payable to PNC Bank. There is an exit fee of 1% which will be waived if permanent financing is secured through PNC Bank or one of their affiliates. No amounts were outstanding on this construction loan at December 31, 2019.
Stoneridge Farms Financing
On July 30, 2019, one of our indirect wholly-owned subsidiaries entered into a loan agreement with Berkeley Point Capital LLC, or Berkeley Point, for the principal amount of $45,711,000. The loan agreement provides for a term loan with a maturity date of August 1, 2029, unless the maturity date is accelerated pursuant to the loan agreement’s terms. The loan accrues interest at a fixed rate of 3.36% per annum. The entire outstanding principal balance and any accrued and unpaid interest on the loan is due on the maturity date. Interest only payments on the loan are payable monthly in arrears on specified dates as set forth in the loan agreement and interest and principal payments are due beginning September 1, 2024. Monthly payments are due and payable on the first day of each month, commencing September 1, 2019. The loan is secured by Stoneridge Farms, a 336-unit property located in Smyrna, Tennessee. We paid $228,555 in loan origination fees to Berkeley Point in connection with the financing, and paid our advisor a loan coordination fee of $342,833.
Refinancing Transactions
On September 27, 2019 and October 1, 2019, we, through our wholly-owned subsidiaries, each a borrower and collectively, the borrowers, refinanced $201,762,000 of existing variable rate loans with our existing lender, PNC Bank, with new fixed rate Freddie Mac loans in an aggregate principal amount of $215,934,000. Each of the loans has a maturity date of October 1, 2029. Interest only payments are payable monthly through November 1, 2024, with interest and principal payments due monthly thereafter. The borrowers paid $809,753 in the aggregate in loan origination fees to PNC Bank in connection with the refinancing, and our advisor earned loan coordination fees of $600,000.
40
The following is a summary of the refinancing of mortgage notes payable secured by real property during the year ended December 31, 2019:
Property | Closing Date | Lender | Interest Rate | Loan Amount | ||||||
Delano at North Richland Hills | 9/27/2019 | PNC Bank | 3.56% | $ | 32,159,000 | |||||
Lakeside at Coppell | 9/27/2019 | PNC Bank | 3.56% | 48,251,000 | ||||||
Meadows at North Richland Hills | 10/1/2019 | PNC Bank | 3.56% | 26,888,000 | ||||||
Park Valley | 10/1/2019 | PNC Bank | 3.56% | 49,100,000 | ||||||
PeakView by Horseshoe Lake | 10/1/2019 | PNC Bank | 3.56% | 38,421,000 | ||||||
Reveal on Cumberland | 10/1/2019 | PNC Bank | 3.56% | 21,115,000 | ||||||
$ | 215,934,000 | |||||||||
Cash Flows Provided by Operating Activities
During the year ended December 31, 2019, net cash provided by operating activities was $29,078,255, compared to $33,557,275 for the year ended December 31, 2018. The change in net cash provided by operating activities was primarily due to the changes in net loss, accounts payable and accrued liabilities and amounts due to affiliates. We expect to continue to generate cash flows from operations as we complete our value-enhancement program.
Cash Flows Provided by (Used in) Investing Activities
During the year ended December 31, 2019, net cash provided by investing activities was $22,714,294, compared to $17,481,756 of net cash used in investing activities during the year ended December 31, 2018. The increase in net cash provided by investing activities was primarily the result of the disposition of two real estate investments and to a lesser extent proceeds from insurance claims, offset by the increase in additions to real estate investments, acquisition of real estate held for development, increase in additions to real estate held for development and increase in escrow deposits of pending real estate acquisitions during the year ended December 31, 2019, compared to the year ended December 31, 2018. Net cash provided by investing activities during the year ended December 31, 2019, consisted of the following:
• | $2,158,815 of cash used for the acquisition of real estate held for development; |
• | $26,689,336 of cash used for improvements to real estate investments; |
• | $2,920,469 of cash used for additions to real estate held for development; |
• | $2,800,300 of cash used for escrow deposits for pending real estate acquisitions; |
• | $704,298 of cash used for capitalized acquisition costs related to the SIR Merger and STAR III Merger; |
• | $18,000 of cash used to purchase interest rate cap agreements; |
• | $57,107,943 of net proceeds from the sales of real estate investments; and |
• | $897,569 of cash provided by proceeds from insurance claims. |
Cash Flows Provided by Financing Activities
During the year ended December 31, 2019 and 2018, net cash provided by financing activities was $24,008,347, and $17,995,551, respectively. The increase in net cash provided by financing activities was primarily due to the increase in proceeds from the issuance of mortgage notes payable, a decrease in principal payments on mortgage notes payable, a decrease in principal payments on our line of credit, a decrease in payments of deferred financing costs, a decrease in the payments of debt extinguishment costs and a decrease in repurchases of common stock during the year ended December 31, 2019 compared to the same prior year period, partially offset by a decrease in borrowings from our credit facility, an increase in payment of loan financing deposits and an increase in distributions paid to common stockholders during the year ended December 31, 2019 compared to the same prior year period. Net cash provided by financing activities during the year ended December 31, 2019, consisted of the following:
• | $56,890,038 of proceeds from the issuance of mortgage notes payable, net of $202,728,946 of principal payments on mortgage notes payable, $452,300 of cash deposited to finance loans and $1,573,716 of payments for deferred financing costs; |
41
• | $228,665 of payments of commissions on sales of common stock; |
• | $25,681,391 of net cash distributions to our stockholders, after giving effect to distributions reinvested by stockholders of $21,222,382; and |
• | $6,971,635 of cash paid for the repurchase of common stock. |
Contractual Commitments and Contingencies
We use secured debt, and intend to use in the future secured and unsecured debt. We believe that the careful use of borrowings will help us achieve our diversification goals and potentially enhance the returns on our investments. At December 31, 2019, our debt was approximately 60% of the value of our properties, as determined by the most recent valuations performed by an independent third-party appraiser as of December 31, 2019. Going forward, we expect that our borrowings will be approximately 55% to 65% of the value of our properties (after debt amortization) and other real estate-related assets. Under our charter, we are prohibited from borrowing in excess of 300% of our net assets, which generally approximates to 75% of the aggregate cost of our assets unless such excess is approved by a majority of the independent directors and disclosed to stockholders, along with a justification for such excess, in our next quarterly report. In such event, we will monitor our debt levels and take action to reduce any such excess as practicable. Our aggregate borrowings are reviewed by our board of directors at least quarterly. As of December 31, 2019, our aggregate borrowings were not in excess of 300% of the value of our net assets.
In addition to using our capital resources for investing purposes and meeting our debt obligations, we expect to use our capital resources to make certain payments to our advisor in connection with the management of our asset portfolio and costs incurred by our advisor in providing services to us.
As of December 31, 2019, we had indebtedness totaling $1,108,559,045, comprised of an aggregate principal amount of $1,116,144,387 and net deferred financing costs of $7,585,342. The following is a summary of our contractual obligations as of December 31, 2019:
________________
Payments due by period | ||||||||||||||||||||
Contractual Obligations | Total | Less than 1 year | 1-3 years | 3-5 years | More than 5 years | |||||||||||||||
Interest payments on outstanding debt obligations(1) | $ | 405,295,575 | $ | 46,639,044 | $ | 92,764,729 | $ | 92,329,745 | $ | 173,562,057 | ||||||||||
Principal payments on outstanding debt obligations(2) | 1,116,144,387 | 1,149,183 | 4,683,111 | 8,957,948 | 1,101,354,145 | |||||||||||||||
Total | $ | 1,521,439,962 | $ | 47,788,227 | $ | 97,447,840 | $ | 101,287,693 | $ | 1,274,916,202 | ||||||||||
(1) | Scheduled interest payments on outstanding debt obligations are based on the outstanding principal amounts and interest rates in effect at December 31, 2019. We incurred interest expense of $49,273,750 during the year ended December 31, 2019, including amortization of deferred financing costs totaling $1,019,355, net unrealized loss from the change in fair value of interest rate cap agreements of $225,637, loan fees associated with mortgage notes refinancing of $496,684 and line of credit commitment fees of $2,137, net of capitalized interest of $106,523, respectively. |
(2) | Scheduled principal payments on outstanding debt obligations are based on the terms of the notes payable agreements. Amounts exclude net deferred financing costs associated with certain notes payable. |
Our debt obligations contain customary financial and non-financial debt covenants. As of December 31, 2019 and 2018, we were in compliance with all debt covenants.
Results of Operations
Overview
The discussion that follows is based on our consolidated results of operations for the years ended December 31, 2019 and 2018. The ability to compare one period to another is affected by the disposition of two properties in 2019 and implementation of our value-enhancement strategy. The number of multifamily properties wholly-owned by us decreased to 32 as of December 31, 2019, from 34 as of December 31, 2018. As of December 31, 2019, we owned 32 multifamily properties and one parcel of land held for the development of apartment homes. Our results of operations were primarily affected by (1) the disposition of two multifamily properties during the year ended December 31, 2019, (2) the increase in rents and occupancy
42
as of December 31, 2019 and (3) our value-enhancement activity completed through December 31, 2019, as further discussed below.
Our results of operations for the years ended December 31, 2019 and 2018 are not indicative of those expected in future periods. For the year ended December 31, 2019, we continued to perform value-enhancement projects, which may have an impact on our future results of operations. In general, we expect that our revenues and expenses related to our portfolio will increase in future periods as a result of organic rent increases, anticipated value-enhancement projects and the completion of real estate under development. Additionally, our results of operations will be significantly impacted by the SIR Merger and the STAR III Merger.
To provide additional insight into our operating results, we are also providing a detailed analysis of same-store versus non-same-store net operating income, or NOI. For more information on NOI and a reconciliation of NOI (a non-GAAP financial measure) to net loss, see “—Net Operating Income.”
Consolidated Results of Operations for the Year Ended December 31, 2019 Compared to the Year Ended December 31, 2018
The following table summarizes the consolidated results of operations for the years ended December 31, 2019 and 2018:
For the Year Ended December 31, | $ Change Due to Dispositions(1) | $ Change Due to Properties Held Throughout Both Periods(2) | |||||||||||||||||||||
2019 | 2018 | Change $ | Change % | ||||||||||||||||||||
Total revenues | $ | 173,535,679 | $ | 169,124,188 | $ | 4,411,491 | 3 | % | $ | (726,414 | ) | $ | 5,137,905 | ||||||||||
Operating, maintenance and management | (43,473,179 | ) | (42,490,381 | ) | (982,798 | ) | (2 | )% | 199,465 | (1,182,263 | ) | ||||||||||||
Real estate taxes and insurance | (25,152,761 | ) | (23,501,730 | ) | (1,651,031 | ) | (7 | )% | 213,159 | (1,864,190 | ) | ||||||||||||
Fees to affiliates | (25,861,578 | ) | (25,976,226 | ) | 114,648 | — | % | 270,910 | (156,262 | ) | |||||||||||||
Depreciation and amortization | (73,781,883 | ) | (70,993,280 | ) | (2,788,603 | ) | (4 | )% | 634,074 | (3,422,677 | ) | ||||||||||||
Interest expense | (49,273,750 | ) | (44,374,484 | ) | (4,899,266 | ) | (11 | )% | 827,862 | (5,727,128 | ) | ||||||||||||
General and administrative expenses | (7,440,680 | ) | (6,386,131 | ) | (1,054,549 | ) | (17 | )% | (542 | ) | (1,054,007 | ) | |||||||||||
Gain on sales of real estate, net | 11,651,565 | — | 11,651,565 | 100 | % | 11,651,565 | — | ||||||||||||||||
Interest income | 865,833 | 271,478 | 594,355 | 219 | % | 2,479 | 591,876 | ||||||||||||||||
Insurance proceeds in excess of losses incurred | 448,047 | 201,717 | 246,330 | 122 | % | (751 | ) | 247,081 | |||||||||||||||
Loss on debt extinguishment | (41,609 | ) | (4,975,497 | ) | 4,933,888 | 99 | % | 309,749 | 4,624,139 | ||||||||||||||
Net loss | $ | (38,524,316 | ) | $ | (49,100,346 | ) | $ | 10,576,030 | 22 | % | |||||||||||||
NOI(1) | $ | 96,636,421 | $ | 96,461,631 | $ | 174,790 | — | % | |||||||||||||||
FFO(2) | $ | 23,604,194 | $ | 21,892,934 | $ | 1,711,260 | 8 | % | |||||||||||||||
MFFO(2) | $ | 25,378,778 | $ | 27,369,983 | $ | (1,991,205 | ) | (7 | )% | ||||||||||||||
______________
(1) | Represents the favorable (unfavorable) dollar amount change for the year ended December 31, 2019, compared to the year ended December 31, 2018, related to multifamily properties disposed of on or after January 1, 2019. |
(2) | Represents the favorable (unfavorable) dollar amount change for the year ended December 31, 2019, compared to the year ended December 31, 2018, related to multifamily properties owned by us throughout both periods presented. |
(3) | NOI is a non-GAAP financial measure used by investors and our management to evaluate and compare the performance of our properties and to determine trends in earnings. However, the usefulness of NOI is limited because it excludes general and administrative costs, interest expense, interest income and other expense, acquisition costs, certain fees to affiliates, depreciation and amortization expense and gains or losses from the sale of our properties and other gains and losses as stipulated by GAAP, the level of capital expenditures and leasing costs, all of which are significant economic costs. For additional information on how we calculate NOI and a reconciliation of NOI to net loss, see “—Net Operating Income.” |
(4) | GAAP basis accounting for real estate assets utilizes historical cost accounting and assumes real estate values diminish over time. In an effort to overcome the difference between real estate values and historical cost accounting for real estate assets the Board of Governors of NAREIT established the measurement tool of FFO. Since its introduction, |
43
FFO has become a widely used non-GAAP financial measure among REITs. Additionally, we use MFFO, as defined by the IPA, as a supplemental measure to evaluate our operating performance. MFFO is based on FFO but includes certain adjustments we believe are necessary due to changes in accounting and reporting under GAAP since the establishment of FFO. Neither FFO nor MFFO should be considered as alternatives to net loss or other measurements under GAAP as indicators of our operating performance, nor should they be considered as alternatives to cash flow from operating activities or other measurements under GAAP as indicators of liquidity. For additional information on how we calculate FFO and MFFO and a reconciliation of FFO and MFFO to net loss, see “—Funds From Operations and Modified Funds From Operations.”
Net loss
For the year ended December 31, 2019, we had a net loss of $38,524,316 compared to $49,100,346 for the year ended December 31, 2018. The decrease in net loss of $10,576,030 over the comparable prior year period was due to increases in total revenues of $4,411,491, gain on sales of real estate, net of $11,651,565, interest income of $594,355 and insurance proceeds in excess of losses incurred of $246,330 and decreases in fees to affiliates of $114,648 and loss on debt extinguishment of $4,933,888, partially offset by increases in operating, maintenance and management expenses of $982,798, real estate taxes and insurance of $1,651,031, depreciation and amortization expense of $2,788,603, interest expense of $4,899,266 and general and administrative expenses of $1,054,549.
Total revenues
Total revenues were $173,535,679 for the year ended December 31, 2019, compared to $169,124,188 for the year ended December 31, 2018. The increase of $4,411,491 was primarily due to increases in average monthly occupancy and average monthly rents as a result of ordinary monthly rent increases and rent increases driven by our value-enhancement projects. Average monthly occupancy increased from 93.9% as of December 31, 2018, to 94.6% as of December 31, 2019, and average monthly rents per unit increased from $1,163 as of December 31, 2018, to $1,200 as of December 31, 2019. We expect rental income and other income to increase in future periods as a result of ordinary monthly rent increases, improved occupancy, the implementation of our value-enhancement strategy and the increase in the size of our portfolio due to the mergers.
Operating, maintenance and management expenses
Operating, maintenance and management expenses were $43,473,179 for the year ended December 31, 2019, compared to $42,490,381 for the year ended December 31, 2018. The increase of $982,798 was primarily due to increases in utilities, repairs and maintenance, turnover costs and payroll during the year ended December 31, 2019, compared to the year ended December 31, 2018. We expect that these amounts will decrease as a percentage of total revenues as we implement operational efficiencies at our multifamily properties.
Real estate taxes and insurance
Real estate taxes and insurance expenses were $25,152,761 for the year ended December 31, 2019, compared to $23,501,730 for the year ended December 31, 2018. The increase of $1,651,031 was primarily due to increases in tax rates, assessed values and special assessments at some of our multifamily properties and to a lesser extent, an increase in insurance expenses, during the year ended December 31, 2019, compared to the year ended December 31, 2018. We expect these amounts may increase in future periods as a result of municipal property tax rate increases, increases in the assessed value of our property portfolio, increases in insurance premiums and the increase in the size of our portfolio due to the mergers.
Fees to affiliates
Fees to affiliates were $25,861,578 for the year ended December 31, 2019, compared to $25,976,226 for the year ended December 31, 2018. The decrease of $114,648 was primarily due to the decrease in loan coordination fees related to the refinancing of 21 multifamily properties during the year ended December 31, 2018, compared to the financing of one property and refinancing of six properties during the year ended December 31, 2019. We expect fees to affiliates related to the ongoing management of our real estate portfolio to increase in future periods as a result of increased property management fees from anticipated increases in future rental income and to fluctuate based on real estate related transactions.
Depreciation and amortization
Depreciation and amortization expenses were $73,781,883 for the year ended December 31, 2019, compared to $70,993,280 for the year ended December 31, 2018. The increase of $2,788,603 was primarily due to the net increase in depreciable and amortizable assets of $27,903,780 as a result of capital improvements. We expect these amounts to increase in future periods as a result of anticipated future enhancements to our real estate portfolio and the increase in the size of our portfolio due to the mergers.
44
Interest expense
Interest expense for the year ended December 31, 2019, was $49,273,750 compared to $44,374,484 for the year ended December 31, 2018. The increase of $4,899,266 was primarily due to the increase in the notes payable, net balance of $58,403,302 since December 31, 2018, and the increase in notes payable, net during the year ended December 31, 2018 experiencing a full year of interest expense in the year ended December 31, 2019. Included in interest expense is the amortization of deferred financing costs of $1,019,355 and $1,056,545, net, unrealized loss (gain) on derivative instruments of $225,637 and $(87,160), amortization of loan discount of $0 and $207,074, credit facility commitment fees of $2,137 and $57,007, and closing costs associated with the refinancing of debt of $496,684 and $587,520, for the years ended December 31, 2019 and 2018, respectively. Our interest expense in future periods will vary based on the impact of changes to LIBOR or the adoption of a replacement to LIBOR, our level of future borrowings, which will depend on the availability and cost of debt financing and the opportunity to acquire real estate and real estate-related investments meeting our investment objectives.
General and administrative expenses
General and administrative expenses for the year ended December 31, 2019, were $7,440,680 compared to $6,386,131 for the year ended December 31, 2018. These general and administrative costs consisted primarily of legal fees, insurance premiums, audit fees, other professional fees and independent director compensation. The increase of $1,054,549 was primarily due to increases in payroll, overhead costs, director meeting fees as a result of an increase in the number of meetings compared to the prior year and legal costs incurred during the year ended December 31, 2019. We expect general and administrative expenses to decrease as a percentage of total revenues.
Gain on sales of real estate
Gain on sales of real estate for the year ended December 31, 2019, were $11,651,565 compared to $0 for the year ended December 31, 2018. The gain on sales of real estate consisted of the gain recognized on the disposition of two multifamily properties during the year ended December 31, 2019. No multifamily property dispositions occurred during the year ended December 31, 2018. Our gain on sales of real estate in future periods will vary based on the opportunity to sell properties and real estate-related investments.
Interest income
Interest income for the year ended December 31, 2019, were $865,833 compared to $271,478 for the year ended December 31, 2018. Interest income consisted of interest earned on our cash, cash equivalents and restricted cash deposits. In general, we expect interest income to fluctuate with the change in our cash, cash equivalents and restricted cash deposits.
Insurance proceeds in excess of losses incurred
Insurance proceeds in excess of losses incurred for the year ended December 31, 2019, were $448,047 compared to $201,717 for the year ended December 31, 2018.
Loss on debt extinguishment
Loss on debt extinguishment for the year ended December 31, 2019, was $41,609, compared to $4,975,497 for the year ended December 31, 2018. The expenses incurred during the year ended December 31, 2019 consisted of the expense of the deferred financing costs, net related to the termination of the line of credit. The expenses incurred during the year ended December 31, 2018 consisted of prepayment penalties and the expense of the deferred financing costs, net related to the refinancing of 21 multifamily properties. The loss on debt extinguishment will vary in future periods if we repay the remaining outstanding principal prior to the scheduled maturity dates of the notes payable.
For information on our results of operations for the year ended December 31, 2018, compared to the year ended December 31, 2017, see our Annual Report on Form 10-K for the fiscal year filed with the SEC on March 14, 2019.
Property Operations for the Year Ended December 31, 2019 Compared to the Year Ended December 31, 2018
For purposes of evaluating comparative operating performance for the year, we categorize our properties as “same-store” or “non-same-store.” A “same-store” property is a property that was owned at January 1, 2018. A “non-same-store” property is a property that was acquired, placed into service or disposed of after January 1, 2018. As of December 31, 2019, 32 properties were categorized as same-store properties.
45
The following table presents the same-store and non-same-store results from operations for the years ended December 31, 2019 and 2018:
For the Year Ended December 31, | |||||||||||||||
2019 | 2018 | Change $ | Change % | ||||||||||||
Same-store properties: | |||||||||||||||
Revenues | $ | 168,217,612 | $ | 163,079,708 | $ | 5,137,904 | 3.2 | % | |||||||
Operating expenses | 73,971,948 | 69,345,011 | 4,626,937 | 6.7 | % | ||||||||||
Net operating income | 94,245,664 | 93,734,697 | 510,967 | 0.5 | % | ||||||||||
Non-same-store properties: | |||||||||||||||
Net operating income | 2,390,757 | 2,726,934 | (336,177 | ) | |||||||||||
Total net operating income(1) | $ | 96,636,421 | $ | 96,461,631 | $ | 174,790 | |||||||||
________________
(1) | See “—Net Operating Income” below for a reconciliation of NOI to net loss. |
Net Operating Income
Same-store net operating income for the year ended December 31, 2019, was $94,245,664 compared to $93,734,697 for the year ended December 31, 2018. The 0.5% increase in same-store net operating income was a result of a 3.2% increase in same-store rental revenues offset by a 6.7% increase in same-store operating expenses.
Revenues
Same-store revenues for the year ended December 31, 2019, were $168,217,612 compared to $163,079,708 for the year ended December 31, 2018. The 3.2% increase in same-store revenues was primarily due to average rent increases at the same-store properties from $1,160 as of December 31, 2018 to $1,200 as of December 31, 2019, as a result of ordinary monthly rent increases and the completion of value-enhancement projects. In addition, same-store occupancy increased from 94.0% for the same-store properties as of December 31, 2018 to 94.6% as of December 31, 2019.
Operating Expenses
Same-store operating expenses for the year ended December 31, 2019, were $73,971,948 compared to $69,345,011 for the year ended December 31, 2018. The increase in same-store operating expenses was primarily attributable to a net increase in property taxes, repairs and maintenance, general and administrative costs, turnover expenses, insurance and utility costs across the same-store properties.
Net Operating Income
NOI is a non-GAAP financial measure of performance. NOI is used by investors and our management to evaluate and compare the performance of our properties, to determine trends in earnings and to compute the fair value of our properties as it is not affected by (1) the cost of funds, (2) acquisition costs, (3) non-operating fees to affiliates, (4) the impact of depreciation and amortization expenses as well as gains or losses from the sale of operating real estate assets that are included in net income computed in accordance with GAAP or (5) general and administrative expenses and other gains and losses that are specific to us. The cost of funds is eliminated from net income (loss) because it is specific to our particular financing capabilities and constraints. The cost of funds is also eliminated because it is dependent on historical interest rates and other costs of capital as well as past decisions made by us regarding the appropriate mix of capital which may have changed or may change in the future. Acquisition costs and non-operating fees to affiliates are eliminated because they do not reflect continuing operating costs of the property owner.
Depreciation and amortization expenses as well as gains or losses from the sale of operating real estate assets are eliminated because they may not accurately represent the actual change in value in our multifamily properties that result from use of the properties or changes in market conditions. While certain aspects of real property do decline in value over time in a manner that is reasonably captured by depreciation and amortization, the value of the properties as a whole have historically increased or decreased as a result of changes in overall economic conditions instead of from actual use of the property or the passage of time. Gains and losses from the sale of real property vary from property to property and are affected by market conditions at the time of sale which will usually change from period to period. These gains and losses can create distortions when comparing one
46
period to another or when comparing our operating results to the operating results of other real estate companies that have not made similarly timed purchases or sales. We believe that eliminating these costs from net income is useful because the resulting measure captures the actual revenue generated and actual expenses incurred in operating our properties as well as trends in occupancy rates, rental rates and operating costs.
However, the usefulness of NOI is limited because it excludes general and administrative costs, interest expense, interest income and other expense, acquisition costs, certain fees to affiliates, depreciation and amortization expense and gains or losses from the sale of properties, and other gains and losses as stipulated by GAAP, the level of capital expenditures and leasing costs necessary to maintain the operating performance of our properties, all of which are significant economic costs. NOI may fail to capture significant trends in these components of net income which further limits its usefulness.
NOI is a measure of the operating performance of our properties but does not measure our performance as a whole. NOI is therefore not a substitute for net income (loss) as computed in accordance with GAAP. This measure should be analyzed in conjunction with net income (loss) computed in accordance with GAAP and discussions elsewhere in “—Results of Operations” regarding the components of net income (loss) that are eliminated in the calculation of NOI. Other companies may use different methods for calculating NOI or similarly entitled measures and, accordingly, our NOI may not be comparable to similarly entitled measures reported by other companies that do not define the measure exactly as we do.
The following is a reconciliation of our NOI to net loss for the three months ended December 31, 2019 and 2018 and for the years ended December 31, 2019, 2018 and 2017 computed in accordance with GAAP:
For the Three Months Ended December 31, | For the Year Ended December 31, | |||||||||||||||||||
2019 | 2018 | 2019 | 2018 | 2017 | ||||||||||||||||
Net loss | $ | (3,782,227 | ) | $ | (11,464,743 | ) | $ | (38,524,316 | ) | $ | (49,100,346 | ) | $ | (33,623,841 | ) | |||||
Fees to affiliates(1) | 4,520,353 | 2,916,698 | 17,588,260 | 19,305,780 | 18,388,615 | |||||||||||||||
Depreciation and amortization | 18,351,478 | 18,072,943 | 73,781,883 | 70,993,280 | 68,417,556 | |||||||||||||||
Interest expense | 12,311,696 | 12,754,788 | 49,273,750 | 44,374,484 | 34,944,073 | |||||||||||||||
Loss on debt extinguishment | — | — | 41,609 | 4,975,497 | — | |||||||||||||||
General and administrative expenses | 1,559,402 | 1,809,070 | 7,440,680 | 6,386,131 | 5,244,554 | |||||||||||||||
Gain on sale of real estate | (8,322,487 | ) | — | (11,651,565 | ) | — | — | |||||||||||||
Other gains(2) | (329,568 | ) | (242,253 | ) | (1,313,880 | ) | (473,195 | ) | (167,786 | ) | ||||||||||
Net operating income | $ | 24,308,647 | $ | 23,846,503 | $ | 96,636,421 | $ | 96,461,631 | $ | 93,203,171 | ||||||||||
________________
(1) | Fees to affiliates for the three months and year ended December 31, 2019 exclude property management fees of $1,260,797 and $5,016,845 and other fees of $831,519 and $3,256,473, respectively, that are included in NOI. Fees to affiliates for the three months and year ended December 31, 2018 exclude property management fees of $1,233,125 and $4,886,436 and other fees of $576,764 and $1,784,010, respectively, that are included in NOI. Fees to affiliates for the year ended December 31, 2017 exclude property management fees of $4,706,698 and other fees of $1,248,100, that are included in NOI. |
(2) | Other gains for the years ended December 31, 2019, 2018 and 2017 include non-recurring insurance claim recoveries and interest income that are not included in NOI. |
Funds from Operations and Modified Funds from Operations
Due to certain unique operating characteristics of real estate companies, as discussed below, NAREIT, an industry trade group, has promulgated a measure known as FFO, which we believe to be an appropriate supplemental measure to reflect the operating performance of a REIT. The use of FFO is recommended by the REIT industry as a supplemental performance measure. FFO is not equivalent to our net income (loss) as determined under GAAP.
We define FFO, a non-GAAP financial measure, consistent with the standards established by the White Paper on FFO approved by the Board of Governors of NAREIT, as revised in December 2018, or the White Paper. The White Paper defines FFO as net income (loss) computed in accordance with GAAP, excluding gains or losses from sales of property and non-cash impairment charges of real estate related investments, plus real estate related depreciation and amortization, and after adjustments for unconsolidated partnerships and joint ventures. In particular, we believe it is appropriate to disregard impairment charges, as this is a fair value adjustment that is largely based on market fluctuations and assessments regarding general market conditions which can change over time. An asset will only be evaluated for impairment if certain impairment indications exist and if the carrying, or book value, exceeds the total estimated undiscounted future cash flows (including net
47
rental and lease revenues, net proceeds on the sale of the property, and any other ancillary cash flows at a property or group level under GAAP) from such asset. Investors should note, however, that determinations of whether impairment charges have been incurred are based partly on anticipated operating performance, because estimated undiscounted future cash flows from a property, including estimated future net rental and lease revenues, net proceeds on the sale of the property, and certain other ancillary cash flows, are taken into account in determining whether an impairment charge has been incurred. While impairment charges are excluded from the calculation of FFO as described above, investors are cautioned that due to the fact that impairments are based on estimated future undiscounted cash flows and the relatively limited term of our operations, it could be difficult to recover any impairment charges. Our FFO calculation complies with NAREIT’s policy described above.
The historical accounting convention used for real estate assets requires straight-line depreciation of buildings and improvements, which implies that the value of real estate assets diminishes predictably over time, especially if such assets are not adequately maintained or repaired and renovated as required by relevant circumstances and/or as requested or required by lessees for operational purposes in order to maintain the value disclosed. We believe that since real estate values historically rise and fall with market conditions, including inflation, interest rates, the business cycle, unemployment and consumer spending, presentations of operating results for a REIT using historical accounting for depreciation may be less informative. Historical accounting for real estate involves the use of GAAP. Any other method of accounting for real estate such as the fair value method cannot be construed to be any more accurate or relevant than the comparable methodologies of real estate valuation found in GAAP. Nevertheless, we believe that the use of FFO, which excludes the impact of real estate related depreciation and amortization, provides a more complete understanding of our performance to investors and to management, and when compared year over year, reflects the impact on our operations from trends in occupancy rates, rental rates, operating costs, general and administrative expenses, and interest costs, which may not be immediately apparent from net income. We adopted Accounting Standards Update, or ASU, 2016-02, Leases, or ASU 2016-02 on January 1, 2019, which requires us, as a lessee, to recognize a liability for obligations under a lease contract and a right-of-use asset. ASU 2017-01 now forms part of Accounting Standards Codification, or ASC 805, Business Combinations, or ASC 805. The carrying amount of the right-of-use asset is amortized over the term of the lease. Because we have no ownership rights (current or residual) in the underlying asset, NAREIT concluded that the amortization of the right-of-use asset should not be added back to GAAP net income (loss) in calculating FFO. This amortization expense is included in FFO. However, FFO, and MFFO as described below, should not be construed to be more relevant or accurate than the current GAAP methodology in calculating net income or in its applicability in evaluating our operating performance. The method utilized to evaluate the value and performance of real estate under GAAP should be construed as a more relevant measure of operational performance and considered more prominently than the non-GAAP FFO and MFFO measures and the adjustments to GAAP in calculating FFO and MFFO.
Changes in the accounting and reporting promulgations under GAAP (for acquisition fees and expenses from a capitalization/depreciation model to an expensed-as-incurred model) that were put into effect in 2009 and other changes to GAAP accounting for real estate subsequent to the establishment of NAREIT’s definition of FFO have prompted an increase in cash-settled expenses, specifically acquisition fees and expenses for all industries as items that are expensed under GAAP, that are typically accounted for as operating expenses. Management believes these fees and expenses do not affect our overall long-term operating performance. Publicly registered, non-listed REITs typically have a significant amount of acquisition activity and are substantially more dynamic during their initial years of investment and operation. While other start-up entities may also experience significant acquisition activity during their initial years, we believe that public, non-listed REITs, like us, are unique in that they have a limited life with targeted exit strategies within a relatively limited time frame after acquisition activity ceases.
Due to the above factors and other unique features of publicly registered, non-listed REITs, the IPA, an industry trade group, has standardized a measure known as MFFO, which the IPA has recommended as a supplemental measure for publicly registered non-listed REITs and which we believe to be another appropriate supplemental measure to reflect the operating performance of a public, non-listed REIT having the characteristics described above. MFFO is not equivalent to our net income or loss as determined under GAAP, and MFFO may not be a useful measure of the impact of long-term operating performance on value if we do not continue to operate with a limited life and targeted exit strategy, as currently intended. We believe that, because MFFO excludes costs that we consider more reflective of investing activities and other non-operating items included in FFO and also excludes acquisition fees and expenses that are not capitalized, as discussed below, and affect our operations only in periods in which properties are acquired, MFFO can provide, on a going forward basis, an indication of the sustainability (that is, the capacity to continue to be maintained) of our operating performance after the period in which we are acquiring our properties and once our portfolio is in place. By providing MFFO, we believe we are presenting useful information that assists investors and analysts to better assess the sustainability of our operating performance after our offering has been completed and our properties have been acquired. We also believe that MFFO is a recognized measure of sustainable operating performance by the non-listed REIT industry. Further, we believe MFFO is useful in comparing the sustainability of our operating performance after our offering and acquisitions are completed with the sustainability of the operating performance of other real estate companies that are not as involved in acquisition activities. Investors are cautioned that MFFO should only be used to assess the sustainability of our operating performance after our offering has been completed and properties have been acquired, as it
48
excludes acquisition costs that have a negative effect on our operating performance during the periods in which properties are acquired.
We define MFFO, a non-GAAP financial measure, consistent with the IPA’s Guideline 2010-01, Supplemental Performance Measure for Publicly Registered, Non-Listed REITs: Modified Funds from Operations, or the Practice Guideline, issued by the IPA in November 2010. The Practice Guideline defines MFFO as FFO further adjusted for the following items, as applicable, included in the determination of GAAP net income: acquisition fees and expenses; amounts relating to deferred rent receivables and amortization of above and below market leases and liabilities (which are adjusted in order to reflect such payments from a GAAP accrual basis to a cash basis of disclosing the rent and lease payments); accretion of discounts and amortization of premiums on debt investments; mark-to-market adjustments included in net income; nonrecurring gains or losses included in net income from the extinguishment or sale of debt, hedges, foreign exchange, derivatives or securities holdings where trading of such holdings is not a fundamental attribute of the business plan, unrealized gains or losses resulting from consolidation from, or deconsolidation to, equity accounting, and after adjustments for consolidated and unconsolidated partnerships and joint ventures, with such adjustments calculated to reflect MFFO on the same basis. The accretion of discounts and amortization of premiums on debt investments, nonrecurring unrealized gains and losses on hedges, foreign exchange, derivatives or securities holdings, unrealized gains and losses resulting from consolidations, as well as other listed cash flow adjustments are adjustments made to net income in calculating the cash flows provided by operating activities and, in some cases, reflect gains or losses which are unrealized and may not ultimately be realized. While we rely on our advisor for managing interest rate, hedge and foreign exchange risk, we do not retain an outside consultant to review all our hedging agreements. Inasmuch as interest rate hedges are not a fundamental part of our operations, we believe it is appropriate to exclude such non-recurring gains and losses in calculating MFFO, as such gains and losses are not reflective of on-going operations.
Our MFFO calculation complies with the IPA’s Practice Guideline described above, except with respect to certain acquisition fees and expenses as discussed below. In calculating MFFO, we exclude acquisition related expenses, amortization of above and below market leases, fair value adjustments of derivative financial instruments, deferred rent receivables and the adjustments of such items related to noncontrolling interests. Historically under GAAP, acquisition fees and expenses were characterized as operating expenses in determining operating net income. However, following the publication of ASU 2017-01, which now forms part of ASC 805, acquisition fees and expenses are capitalized and depreciated under certain conditions. These expenses are paid in cash by us. All paid and accrued acquisition fees and expenses will have negative effects on returns to investors, the potential for future distributions, and cash flows generated by us, unless earnings from operations or net sales proceeds from the disposition of other properties are generated to cover the purchase price of the property, these fees and expenses and other costs related to such property. The acquisition of properties, and the corresponding acquisition fees and expenses, is the key operational feature of our business plan to generate operational income and cash flow to fund distributions to its stockholders. Further, under GAAP, certain contemplated non-cash fair value and other non-cash adjustments are considered operating non-cash adjustments to net income in determining cash flow from operating activities. In addition, we view fair value adjustments of derivatives and gains and losses from dispositions of assets as non-recurring items or items which are unrealized and may not ultimately be realized, and which are not reflective of on-going operations and are therefore typically adjusted for when assessing operating performance.
Our management uses MFFO and the adjustments used to calculate MFFO in order to evaluate our performance against other public, non-listed REITs which have limited lives with short and defined acquisition periods and targeted exit strategies shortly thereafter. As noted above, MFFO may not be a useful measure of the impact of long-term operating performance on value if we do not continue to operate in this manner. We believe that our use of MFFO and the adjustments used to calculate MFFO allow us to present our performance in a manner that reflects certain characteristics that are unique to public, non-listed REITs, such as their limited life, limited and defined acquisition period and targeted exit strategy, and hence that the use of such measures is useful to investors. By excluding expensed acquisition costs, that are not capitalized, the use of MFFO provides information consistent with management’s analysis of the operating performance of the properties. Additionally, fair value adjustments, which are based on the impact of current market fluctuations and underlying assessments of general market conditions, but can also result from operational factors such as rental and occupancy rates, may not be directly related or attributable to our current operating performance. By excluding such changes that may reflect anticipated and unrealized gains or losses, we believe MFFO provides useful supplemental information.
Presentation of this information is intended to provide useful information to investors as they compare the operating performance to that of other public, non-listed REITs, although it should be noted that not all public, non-listed REITs calculate FFO and MFFO the same way, so comparisons with other public, non-listed REITs may not be meaningful. Furthermore, FFO and MFFO are not necessarily indicative of cash flow available to fund cash needs and should not be considered as an alternative to net income (loss) or income (loss) from continuing operations as an indication of our performance, as an alternative to cash flows from operations as an indication of our liquidity, or indicative of funds available to fund our cash needs, including our ability to make distributions to our stockholders. FFO and MFFO should be reviewed in conjunction with GAAP measurements as an indication of our performance. MFFO is useful in assisting management and investors in assessing the sustainability of operating performance in future operating periods, and in particular, after the offering and acquisition
49
stages are complete and net asset value is disclosed. MFFO is not a useful measure in evaluating net asset value because impairments are taken into account in determining net asset value but not in determining MFFO.
Neither the SEC, NAREIT nor any other regulatory body has passed judgment on the acceptability of the adjustments that we use to calculate FFO or MFFO. In the future, the SEC, NAREIT or another regulatory body may decide to standardize the allowable adjustments across the non-listed REIT industry and in response to such standardization we may have to adjust our calculation and characterization of FFO or MFFO accordingly.
Our calculation of FFO and MFFO is presented in the following table for the years ended December 31, 2019, 2018 and 2017:
For the Year Ended December 31, | ||||||||||||
2019 | 2018 | 2017 | ||||||||||
Reconciliation of net loss to MFFO: | ||||||||||||
Net loss | $ | (38,524,316 | ) | $ | (49,100,346 | ) | $ | (33,623,841 | ) | |||
Depreciation of real estate assets | 73,780,075 | 70,993,280 | 67,407,444 | |||||||||
Amortization of lease-related costs | — | — | 1,010,112 | |||||||||
Gain on sales of real estate, net | (11,651,565 | ) | — | — | ||||||||
FFO | 23,604,194 | 21,892,934 | 34,793,715 | |||||||||
Acquisition fees and expenses(1)(2) | 1,507,338 | 858,712 | 2,185 | |||||||||
Unrealized loss (gain) on derivative instruments | 225,637 | (87,160 | ) | 447,668 | ||||||||
Realized gain on derivative instruments | — | (270,000 | ) | — | ||||||||
Loss on debt extinguishment | 41,609 | 4,975,497 | — | |||||||||
MFFO | $ | 25,378,778 | $ | 27,369,983 | $ | 35,243,568 | ||||||
FFO per share - basic and diluted | $ | 0.45 | $ | 0.43 | $ | 0.69 | ||||||
MFFO per share - basic and diluted | 0.49 | 0.53 | 0.70 | |||||||||
Loss per common share - basic and diluted | (0.74 | ) | (0.96 | ) | (0.67 | ) | ||||||
Weighted average number of common shares outstanding, basic and diluted | 52,204,410 | 51,312,947 | 50,358,618 | |||||||||
________________
(1) | By excluding expensed acquisition costs that are not capitalized, management believes MFFO provides useful supplemental information that is comparable for each type of real estate investment and is consistent with management’s analysis of the investing and operating performance of our properties. Acquisition fees and expenses include payments to our advisor or third parties. Historically under GAAP, acquisition fees and expenses were considered operating expenses and as expenses included in the determination of net income (loss) and income (loss) from continuing operations, both of which are performance measures under GAAP. Following the publication of ASU 2017-01, which now forms part of ASC 805, acquisition fees and expenses are capitalized and depreciated under certain conditions. All paid and accrued acquisition fees and expenses will have negative effects on returns to investors, the potential for future distributions, and cash flows generated by us, unless earnings from operations or net sales proceeds from the disposition of properties are generated to cover the purchase price of the property, these fees and expenses and other costs related to the property. The acquisition of properties, and the corresponding acquisition fees and expenses, is the key operational feature of our business plan to generate operational income and cash flow to fund distributions to its stockholders. |
(2) | Acquisition fees and expenses for the years ended December 31, 2019, 2018 and 2017 include acquisition expenses of $1,507,338, $858,712 and $2,185, respectively, that did not meet the criteria for capitalization under ASU 2017-01, which now forms part of ASC 805, and were recorded in general and administrative expenses in the accompanying consolidated statements of operations. These expenses largely pertained to the then-proposed SIR Merger and STAR III Merger and were incurred and expensed through the date of the Merger Agreement. Upon signing the Merger Agreement, merger related acquisition expenses met the definition of capitalized expenses and were therefore capitalized in the accompanying consolidated balance sheets thereby not impacting MFFO. Also included in expensed acquisition expenses are acquisition expenses related to real estate projects that did not come to fruition. |
50
FFO and MFFO may be used to fund all or a portion of certain capitalizable items that are excluded from FFO and MFFO, such as tenant improvements, building improvements and deferred leasing costs.
Inflation
Substantially all of our multifamily property leases are for a term of one year or less. In an inflationary environment, this may allow us to realize increased rents upon renewal of existing leases or the beginning of new leases. Short-term leases generally will minimize our risk from the adverse effects of inflation, although these leases generally permit residents to leave at the end of the lease term and therefore will expose us to the effects of a decline in market rents. In a deflationary rent environment, we may be exposed to declining rents more quickly under these shorter term leases.
With respect to other commercial properties, we expect in the future to include provisions in our leases designed to protect us from the impact of inflation. These provisions include reimbursement billings for operating expense pass-through charges, real estate tax and insurance reimbursements, or in some cases annual reimbursement of operating expenses above a certain allowance.
As of December 31, 2019, we had not entered into any material leases as a lessee.
REIT Compliance
To continue to qualify as a REIT for tax purposes, we are required to distribute at least 90% of our REIT taxable income (which is computed without regard to the dividends-paid deduction or net capital gain and which does not necessarily equal net income as calculated in accordance with GAAP) to our stockholders. We must also meet certain asset and income tests, as well as other requirements. We monitor the operations and transactions that may potentially impact our REIT status. If we fail to qualify as a REIT in any taxable year following the year we initially elected to be taxed as a REIT, we would be subject to federal income tax on our taxable income at regular corporate rates.
Distributions
Our board of directors has declared daily distributions that are paid on a monthly basis. We expect to continue paying monthly distributions unless our results of operations, our general financial condition, general economic conditions or other factors prohibit us from doing so. We may declare distributions in excess of our funds from operations. As a result, our distribution rate and payment frequency may vary from time to time. However, to qualify as a REIT for tax purposes, we must make distributions equal to at least 90% of our “REIT taxable income” each year.
Distributions declared (1) accrued daily to our stockholders of record as of the close of business on each day, (2) are payable in cumulative amounts on or before the third day of each calendar month with respect to the prior month and (3) were calculated at a rate of $0.002466 per share per day during the years ended December 31, 2019 and 2018, which if paid each day over a 365-day period is equivalent to a 6.0% annualized distribution rate based on our initial public offering price of $15.00 per share of common stock.
The distributions declared and paid for the four fiscal quarters of 2019, along with the amount of distributions reinvested pursuant to our distribution reinvestment plan, were as follows:
Distributions Paid(3) | Sources of Distributions Paid | Net Cash Provided by Operating Activities | ||||||||||||||||||||||||||||||
Period | Distributions Declared(1) | Distributions Declared Per Share(1)(2) | Cash | Reinvested | Total | Cash Flow From Operations | Funds Equal to Amounts Reinvested in our Distribution Reinvestment Plan | |||||||||||||||||||||||||
First Quarter 2019 | $ | 11,511,537 | $ | 0.222 | $ | 6,116,456 | $ | 5,378,566 | $ | 11,495,022 | $ | 2,276,063 | $ | 9,218,959 | $ | 2,276,063 | ||||||||||||||||
Second Quarter 2019 | 11,684,723 | 0.224 | 6,419,268 | 5,378,696 | 11,797,964 | 8,905,513 | 2,892,451 | 8,905,513 | ||||||||||||||||||||||||
Third Quarter 2019 | 11,860,005 | 0.227 | 6,550,164 | 5,293,528 | 11,843,692 | 7,611,759 | 4,231,933 | 7,611,759 | ||||||||||||||||||||||||
Fourth Quarter 2019 | 11,915,518 | 0.227 | 6,595,503 | 5,171,592 | 11,767,095 | 10,284,920 | 1,482,175 | 10,284,920 | ||||||||||||||||||||||||
$ | 46,971,783 | $ | 0.900 | $ | 25,681,391 | $ | 21,222,382 | $ | 46,903,773 | $ | 29,078,255 | $ | 17,825,518 | $ | 29,078,255 | |||||||||||||||||
____________________
(1) | Distributions during the years ended December 31, 2019 and 2018 were based on daily record dates and calculated at a rate of $0.002466 per share per day. |
51
(2) | Assumes each share was issued and outstanding each day during the period presented. |
(3) | Distributions are paid on a monthly basis. Distributions for all record dates of a given month are paid approximately three days following month end. |
For the year ended December 31, 2019, we paid aggregate distributions of $46,903,773, including $25,681,391 of distributions paid in cash and 1,354,560 shares of our common stock issued pursuant to our distribution reinvestment plan for $21,222,382. For the year ended December 31, 2019, our net loss was $38,524,316, we had FFO of $23,604,194 and net cash provided by operations of $29,078,255. For the year ended December 31, 2019, we funded $29,078,255, or 62%, of total distributions paid, including shares issued pursuant to our distribution reinvestment plan, from net cash provided by operating activities and $17,825,518, or 38%, from funds equal to amounts reinvested in our distribution reinvestment plan. Since inception, of the $198,592,500 in total distributions paid through December 31, 2019, including shares issued pursuant to our distribution reinvestment plan, 70% of such amounts were funded from cash flow from operations, 20% were funded from funds equal to amounts reinvested in our distribution reinvestment plan and 10% were funded from net public offering proceeds. For information on how we calculate FFO and the reconciliation of FFO to net loss, see “—Funds from Operations and Modified Funds from Operations.”
Our long-term policy is to pay distributions solely from cash flow from operations. Because we may receive income from interest or rents at various times during our fiscal year and because we may need cash flow from operations during a particular period to fund capital expenditures and other expenses, we expect that from time to time during our operational stage, we will declare distributions in anticipation of cash flow that we expect to receive during a later period, and we expect to pay these distributions in advance of our actual receipt of these funds. In these instances, our board of directors has the authority under our organizational documents, to the extent permitted by Maryland law, to fund distributions from sources such as borrowings, offering proceeds or advances and the deferral of fees and expense reimbursements by our advisor, in its sole discretion. We have not established a limit on the amount of proceeds we may use from sources other than cash flow from operations to fund distributions. If we pay distributions from sources other than cash flow from operations, we will have fewer funds available for investments.
Off-Balance Sheet Arrangements
As of December 31, 2019 and 2018, we had no off-balance sheet arrangements that have or are reasonably likely to have a current or future effect on our financial condition, changes in financial condition, revenues or expenses, results of operations, liquidity, capital expenditures or capital resources.
Related-Party Transactions and Agreements
We have entered into agreements with our advisor and its affiliates, whereby we pay or have paid certain fees to, or reimburse certain expenses of, our advisor or its affiliates for acquisition and advisory fees and expenses, financing coordination fees, organization and offering costs, sales commissions, dealer manager fees, asset and property management fees and expenses, leasing fees and reimbursement of certain operating costs. See Item 13. “Certain Relationships and Related Transactions, and Director Independence” and Note 7 (Related Party Arrangements) to the consolidated financial statements included in this annual report for a discussion of the various related-party transactions, agreements and fees.
Critical Accounting Policies
Below is a discussion of the accounting policies that we believe are critical because they involve significant judgments and assumptions, require estimates about matters that are inherently uncertain and because they are important for understanding and evaluating our reported financial results. These judgments affect the reported amounts of assets and liabilities and our disclosure of contingent assets and liabilities at the dates of the financial statements and the reported amounts of revenue and expenses during the reporting periods. With different estimates or assumptions, materially different amounts could be reported in our financial statements. Other companies may utilize different estimates that may impact the comparability of our results of operations to those of companies in similar businesses.
Use of Estimates
The preparation of the consolidated financial statements in conformity with GAAP requires us to make estimates and assumptions that affect the amounts reported in the consolidated financial statements and accompanying notes. Actual results could materially differ from those estimates.
52
Real Estate Assets
Depreciation and Amortization
Real estate costs related to the development, construction and improvement of properties are capitalized. Acquisition costs related to business combinations are expensed as incurred. Acquisition costs related to asset acquisitions are capitalized. On January 1, 2017, we early adopted Accounting Standards Update, or ASU, 2017-01, that clarifies the definition of a business with the objective of adding guidance to assist entities with evaluating whether transactions should be accounted for as acquisitions (or disposals) of businesses. ASU 2017-01 now forms part of ASC 805. Repair and maintenance and tenant turnover costs are charged to expense as incurred and significant replacements and betterments are capitalized. Repair and maintenance and tenant turnover costs include all costs that do not extend the useful life of the real estate asset. We consider the period of future benefit of an asset to determine its appropriate useful life and anticipate the estimated useful lives of assets by class to be generally as follows:
Buildings | 27.5 years | |
Building improvements | 5-25 years | |
Tenant improvements | Shorter of lease term or expected useful life | |
Tenant origination and absorption costs | Remaining term of related lease | |
Furniture, fixtures, and equipment | 5-10 years | |
Real Estate Purchase Price Allocation
Prior to the adoption of ASU 2017-01, which now forms part of ASC 805, we recorded the acquisition of income-producing real estate or real estate that are used for the production of income as a business combination. All assets acquired and liabilities assumed in a business combination are measured at their acquisition-date fair values. Acquisition costs are expensed as incurred. Upon adoption of ASU 2017-01, we record the acquisition of income-producing real estate or real estate that are used for the production of income as an asset acquisition. All assets acquired and liabilities assumed in an asset acquisition are measured at their acquisition-date fair values. Acquisition costs are capitalized and allocated between land, buildings and improvements and tenant origination and associated costs on the consolidated balance sheet.
We assess the acquisition-date fair values of all tangible assets, identifiable intangible assets and assumed liabilities using methods similar to those used by independent appraisers (e.g., discounted cash flow analysis) and that utilize appropriate discount and/or capitalization rates and available market information. Estimates of future cash flows are based on a number of factors including historical operating results, known and anticipated trends, and market and economic conditions. The fair value of tangible assets of an acquired property considers the value of the property as if it was vacant.
Intangible assets include the value of in-place leases, which represents the estimated value of the net cash flows of the in-place leases to be realized, as compared to the net cash flows that would have occurred had the property been vacant at the time of acquisition and subject to lease-up.
We estimate the value of resident origination and absorption costs by considering the estimated carrying costs during hypothetical expected lease-up periods, considering current market conditions. In estimating carrying costs, we estimate the amount of lost rentals using market rates during the expected lease-up periods.
We amortize the value of in-place leases to expense over the remaining non-cancelable term of the respective leases. Should a resident terminate its lease, the unamortized portion of the in-place lease value and customer relationship intangibles would be charged to expense in that period.
We record above-market and below-market in-place lease values for acquired properties based on the present value (using an interest rate that reflects the risks associated with the leases acquired) of the difference between (1) the contractual amounts to be paid pursuant to the in-place leases and (2) our estimate of fair market lease rates for the corresponding in-place leases, measured over a period equal to the remaining non-cancelable term of the lease. We amortize any capitalized above-market or below-market lease values as a reduction or increase to rental income over the remaining non-cancelable terms of the respective leases.
Estimates of the fair values of the tangible assets, identifiable intangible assets and assumed liabilities require us to make significant assumptions to estimate market lease rates, property-operating expenses, carrying costs during lease-up periods, discount rates, market absorption periods, and the number of years the property will be held for investment. The use of inappropriate assumptions could result in an incorrect valuation of acquired tangible assets, identifiable intangible assets and assumed liabilities, which could impact the amount of our net income (loss).
53
Impairment of Real Estate Assets
We account for our real estate assets in accordance with ASC 360, Property, Plant and Equipment, or ASC 360. ASC 360
requires us to continually monitor events and changes in circumstances that could indicate that the carrying amounts of our real estate and related intangible assets may not be recoverable. When indicators of potential impairment suggest that the carrying value of real estate and related intangible assets and liabilities may not be recoverable, we assess the recoverability of the assets by estimating whether we will recover the carrying value of the asset through its undiscounted future cash flows and its eventual disposition. Based on this analysis, if we do not believe that we will be able to recover the carrying value of the real estate and related intangible assets and liabilities, we record an impairment loss to the extent that the carrying value exceeds the estimated fair value of the real estate and related intangible assets and liabilities. If any assumptions, projections or estimates regarding an asset changes in the future, we may have to record an impairment to reduce the net book value of such individual asset.
Revenue Recognition - Operating Leases
On January 1, 2019, we adopted the lease accounting standards under ASC 842, Leases, or ASC 842, including the package of practical expedients for all leases that commenced before the effective date of January 1, 2019. Accordingly, we (i) did not reassess whether any expired or existing contracts are or contain leases, (ii) did not reassess the lease classification for any expired or existing lease, and (iii) did not reassess initial direct costs for any existing leases. We did not elect the practical expedient related to using hindsight to reevaluate the lease term.
In addition, ASC 842 provides an optional transition method to allow entities to apply the new lease accounting standards at the adoption date and recognize a cumulative-effect adjustment to the opening balance of retained earnings. We adopted this transition method upon its adoption of the lease accounting standards of ASC 842, which did not result in a cumulative effect adjustment to the opening balance of retained earnings on January 1, 2019. Our comparative periods presented in the financial statements will continue to be reported under the lease accounting standards of ASC 840, Leases.
In accordance with ASC 842, tenant reimbursements are included in the single lease component of the lease contract (the right of the lessee to use the leased space) and therefore are accounted for as variable lease payments and are recorded as rental income on our statement of operations beginning January 1, 2019. In addition, we adopted the practical expedient available under ASC 842 to not separate nonlease components from the associated lease component and instead to account for those components as a single component if the nonlease components otherwise would be accounted for under the new revenue recognition standard ASC 606, Revenue from Contracts with Customers, and if certain conditions are met, specifically related to tenant reimbursements for common area maintenance which would otherwise be accounted for under the revenue recognition standard. We believe the two conditions have been met for tenant reimbursements for common area maintenance as (i) the timing and pattern of transfer of the nonlease components and associated lease components are the same and (ii) the lease component would be classified as an operating lease. Accordingly, tenant reimbursements for common area maintenance are also accounted for as variable lease payments and recorded as rental income on our statement of operations beginning January 1, 2019. We recognized $172,445,306 of rental income related to operating lease payments, of which $17,679,788 was for variable lease payments for the year ended December 31, 2019, respectively.
We lease apartment homes under operating leases with terms generally of one year or less. Generally, credit investigations are performed for prospective residents and security deposits are obtained. We recognize minimum rent, including rental abatements, lease incentives and contractual fixed increases attributable to operating leases, on a straight-line basis over the term of the related leases when collectibility is probable and records amounts expected to be received in later years as deferred rent receivable.
Rents and Other Receivables
In accordance with ASC 842, we make a determination of whether the collectibility of the lease payments in an operating lease is probable. If we determine the lease payments are not probable of collection, we would fully reserve for any contractual lease payments, deferred rent receivable, and variable lease payments and would recognize rental income only if cash is received. We exercise judgment in establishing these allowances and considers payment history and current credit status of tenants in developing these estimates. Due to the short-term nature of the operating leases, we do not maintain a deferred rent receivable related to the straight-lining of rents. Beginning January 1, 2019, these changes to our collectibility assessment are reflected as an adjustment to rental income.
Fair Value Measurements
Under GAAP, we are required to measure certain financial instruments at fair value on a recurring basis. In addition, we are required to measure other assets and liabilities at fair value on a non-recurring basis (e.g., carrying value of impaired real estate loans receivable and long-lived assets). Fair value is defined as the price that would be received upon the sale of an asset or paid to transfer a liability in an orderly transaction between market participants at the measurement date. The GAAP fair value
54
framework uses a three-tiered approach. Fair value measurements are classified and disclosed in one of the following three categories:
Level 1: | unadjusted quoted prices in active markets that are accessible at the measurement date for identical assets or liabilities; |
Level 2: | quoted prices for similar instruments in active markets, quoted prices for identical or similar instruments in markets that are not active, and model-derived valuations in which significant inputs and significant value drivers are observable in active markets; and |
Level 3: | prices or valuation techniques where little or no market data is available that requires inputs that are both significant to the fair value measurement and unobservable. |
When available, we utilize quoted market prices from an independent third-party source to determine fair value and will classify such items in Level 1 or Level 2. In instances where the market is not active, regardless of the availability of a non-binding quoted market price, observable inputs might not be relevant and could require us to make a significant adjustment to derive a fair value measurement. Additionally, in an inactive market, a market price quoted from an independent third party may rely more on models with inputs based on information available only to that independent third party. When we determine the market for a financial instrument we own to be illiquid or when market transactions for similar instruments do not appear orderly, we use several valuation sources (including internal valuations, discounted cash flow analysis and quoted market prices) and we establish a fair value by assigning weights to the various valuation sources.
Changes in assumptions or estimation methodologies can have a material effect on these estimated fair values. In this regard, the derived fair value estimates cannot be substantiated by comparison to independent markets and, in many cases, may not be realized in an immediate settlement of the instrument.
Accounting for Stock-Based Compensation
We amortize the fair value of stock-based compensation awards to expense over the vesting period and record any dividend equivalents earned as dividends for financial reporting purposes. Stock-based compensation awards are valued at the fair value on the date of grant and amortized as an expense over the vesting period.
Income Taxes
We have elected to be taxed as a REIT under the Internal Revenue Code and have operated as such commencing with the taxable year ended December 31, 2014. To continue to qualify as a REIT, we must meet certain organizational and operational requirements, including a requirement to distribute at least 90% of our annual REIT taxable income to our stockholders (which is computed without regard to the dividends paid deduction or net capital gain and which does not necessarily equal net income as calculated in accordance with GAAP). As a REIT, we generally will not be subject to federal income tax to the extent we distribute qualifying dividends to our stockholders. If we fail to qualify as a REIT in any taxable year, we would be subject to federal income tax on our taxable income at regular corporate income tax rates and generally would not be permitted to qualify for treatment as a REIT for federal income tax purposes for the four taxable years following the year during which qualification is lost, unless the Internal Revenue Service grants us relief under certain statutory provisions. Such an event could materially adversely affect our net income and net cash available for distribution to stockholders. However, we believe we are organized and operate in such a manner as to qualify for treatment as a REIT.
We follow the income tax guidance under GAAP to recognize, measure, present and disclose in our consolidated financial statements uncertain tax positions that we have taken or expect to take on a tax return. As of December 31, 2019, 2018 and 2017, we did not have any liabilities for uncertain tax positions that we believe should be recognized in our consolidated financial statements. We have not been assessed material interest or penalties by any major tax jurisdictions. Our evaluation was performed for all tax years ended December 31, 2019, 2018 and 2017.
Subsequent Events
Distributions Paid
On January 2, 2020, we paid distributions of $4,021,509, which related to distributions declared for each day in the period from December 1, 2019 through December 31, 2019 and consisted of cash distributions paid in the amount of $2,277,269 and $1,744,240 in shares issued pursuant to our distribution reinvestment plan.
On February 3, 2020, we paid distributions of $4,018,365, which related to distributions declared for each day in the period from January 1, 2020 through January 31, 2020 and consisted of cash distributions paid in the amount of $2,285,142 and $1,733,223 in shares issued pursuant to our distribution reinvestment plan.
55
On March 2, 2020, we paid distributions of $3,762,953, which related to distributions declared for each day in the period from February 1, 2020 through February 29, 2020 and consisted of cash distributions paid in the amount of $2,154,494 and $1,608,459 in shares issued pursuant to our distribution reinvestment plan.
Shares Repurchased
On January 31, 2020, we repurchased 53,152 shares of our common stock for a total repurchase value of $797,289, or $15.00 average price per share, pursuant to our share repurchase plan.
Acquisition of Eleven10 at Farmers Market
On January 28, 2020, we acquired a fee simple interest in Eleven10 at Farmers Market, or the Farmers Market Property, located in Dallas, Texas, for a purchase price of $61,000,000, exclusive of closing costs. We financed the acquisition of the Farmers Market Property with a combination of: (1) cash proceeds from the dispositions of Randall Highlands and Club at Summer Valley in a tax-free exchange pursuant to Section 1031 of the Internal Revenue Code and (2) the assumption of a loan in the aggregate principal amount of $36,515,122. The Farmers Market Property contains 313 apartment homes consisting of 70 studio apartments, 168 one-bedroom apartments, 73 two-bedroom apartments and two three-bedroom apartments that average 837 square feet.
Disposition of Terrace Cove Apartment Homes
On February 5, 2020, we, through STAR Terrace Cove, LLC, or STAR Terrace Cove, an indirect, wholly-owned subsidiary of us, sold its fee simple interest in Terrace Cove Apartment Homes, a 304-unit multifamily property located in Austin, Texas, to an unaffiliated third-party buyer. STAR Terrace Cove sold Terrace Cove Apartment Homes for an aggregate sales price of $33,875,000, excluding closing costs, resulting in a gain of $11,384,616, which includes reductions to the net book value of the property due to historical depreciation and amortization expense.
Acquisition of Patina Flats at the Foundry
On February 11, 2020, we acquired a fee simple interest in Patina Flats at the Foundry, or the Patina Flats Property, located in Loveland, Colorado, for a purchase price of $44,100,000, exclusive of closing costs. We financed the acquisition of the Patina Flats Property with a combination of: (1) cash proceeds from the disposition of Terrace Cove Apartment Homes in a tax-free exchange pursuant to Section 1031 of the Internal Revenue Code and (2) an advance of $31,271,471 pursuant to our MCFA. The Patina Flats Property contains 155 apartment homes consisting of 44 studio apartments, 80 one-bedroom apartments, 27 two-bedroom apartments and four three-bedroom apartments that average 685 square feet, in addition to seven retail spaces with 15,206 square feet.
Amendment to the MCFA
On February 11, 2020, in connection with the financing of the Patina Flats Property, we and the facility lender amended the MCFA to include as collateral for the MCFA the Patina Flats Property and Fielders Creek, an unencumbered multifamily property owned by us. We also increased our outstanding borrowings pursuant to the MCFA by $40,468,000, a portion of which was attributable to the acquisition of the Patina Flats Property.
Mergers
Merger with Steadfast Income REIT, Inc.
On August 5, 2019, we, SIR, our operating partnership, Steadfast Income REIT Operating Partnership, L.P., the operating partnership of SIR, and SIR Merger Sub entered into the SIR Merger Agreement. Pursuant to the terms and conditions of the SIR Merger Agreement, on March 6, 2020, SIR merged with and into SIR Merger Sub with SIR Merger Sub surviving the SIR Merger. Following the SIR Merger, SIR Merger Sub, as the surviving entity, will continue as our wholly-owned subsidiary. In accordance with the applicable provisions of the MGCL, the separate existence of SIR ceased.
At the effective time of the SIR Merger, each issued and outstanding share of SIR common stock (or a fraction thereof), $0.01 par value per share converted into 0.5934 shares of our common stock.
Merger with Steadfast Apartment REIT III, Inc.
On August 5, 2019, we, STAR III, our operating partnership, Steadfast Apartment REIT III Operating Partnership, L.P., the operating partnership of STAR III, and STAR III Merger Sub entered into the STAR III Merger Agreement. Pursuant to the terms and conditions of the STAR III Merger Agreement, on March 6, 2020, STAR III merged with and into STAR III Merger Sub with STAR III Merger Sub surviving the STAR III Merger. Following the STAR III Merger, STAR III Merger Sub, as the surviving entity, will continue as our wholly-owned subsidiary. In accordance with the applicable provisions of the MGCL, the separate existence of STAR III ceased.
56
At the effective time of the STAR III Merger, each issued and outstanding share of STAR III common stock (or a fraction thereof), $0.01 par value per share was converted into 1.430 shares of our common stock.
Combined Company
The combined company after the mergers retains the name “Steadfast Apartment REIT, Inc.” Each merger is intended to qualify as a “reorganization” under, and within the meaning of, Section 368(a) of the Internal Revenue Code.
As of the closing of the mergers, our portfolio (unaudited) consisted of (1) 69 properties (including one property held for development) in 14 states, with an average effective rent of $1,173 and (2) a 10% interest in one unconsolidated joint venture that owned 20 multifamily properties with a total of 4,584 apartment homes. Based on occupancy as of December 31, 2019, our portfolio had an occupancy rate of 94.9%, an average age of 20 years and gross real estate assets value of $3,375,635,000 (unaudited).
As a result of the completion of the mergers, our financial information materially changed; however, the financial information included in this Annual Report on Form 10-K reflects only our stand-alone, historical financial results.
Amended and Restated Advisory Agreement
In connection with the closing of the mergers, we and our advisor entered into an Amended and Restated Advisory Agreement, effective as of March 6, 2020. For more information on the Amended and Restated Advisory Agreement, see Item 13 “Certain Relationships and Related Transactions, and Director Independence—Amended and Restated Advisory Agreement.”
Class A Convertible Stock
In connection with the closing of the mergers, we and our advisor exchanged the then-outstanding convertible stock for new Class A convertible stock. For more information on the Class A convertible stock, see Item 13 “Certain Relationships and Related Transactions, and Director Independence—Class A Convertible Stock.”
Distributions Declared
On March 10, 2020, our board of directors approved and authorized a daily distribution to stockholders of record as of the close of business on each day of the period commencing on April 1, 2020 and ending on June 30, 2020. The distributions will be equal to $0.002459 per share of our common stock. The distributions for each record date in April 2020, May 2020 and June 2020 will be paid in May 2020, June 2020 and July 2020, respectively. The distributions will be payable to stockholders from legally available funds therefor.
Expansion of Our Board of Directors
At the time of the closing of the SIR Merger and the STAR III Merger, our board of directors increased the size of our board of directors from five members to seven members. Our board of directors also appointed Ned W. Brines and Stephen R. Bowie to the board of directors. Mr. Brines previously served as a board member of SIR and STAR III and Mr. Bowie previously served as a board member of STAR III. Messrs. Brines and Bowie are independent directors.
Shares Issued to New Board Members
On March 6, 2020, we issued 3,333 restricted shares of our common stock to each of Ned W. Brines and Stephen R. Bowie in connection with their appointment to our board of directors.
57
ITEM 7A. QUANTITATIVE AND QUALITATIVE DISCLOSURES ABOUT MARKET RISK
We may be exposed to the effects of interest rate changes as a result of borrowings used to maintain liquidity and to fund the acquisition, expansion and refinancing of our real estate investment portfolio and operations. We may be also exposed to the effects of changes in interest rates as a result of the acquisition and origination of mortgage, mezzanine, bridge and other loans. Our profitability and the value of our investment portfolio may be adversely affected during any period as a result of interest rate changes. Our interest rate risk management objectives are to limit the impact of interest rate changes on earnings, prepayment penalties and cash flows and to lower overall borrowing costs. We have managed and will continue to manage interest rate risk by maintaining a ratio of fixed rate, long-term debt such that floating rate exposure is kept at an acceptable level. In addition, we may utilize a variety of financial instruments, including interest rate caps, collars, floors and swap agreements, in order to limit the effects of changes in interest rates on our operations. When we use these types of derivatives to hedge the risk of interest-earning assets or interest-bearing liabilities, we may be subject to certain risks, including the risk that losses on a hedge position will reduce the funds available for distributions to holders of our common stock and that the losses may exceed the amount we invested in the instruments.
We borrow funds and make investments at a combination of fixed and variable rates. Interest rate fluctuations will generally not affect our future earnings or cash flows on our fixed rate debt unless such instruments mature or are otherwise terminated. However, interest rate changes will affect the fair value of our fixed rate instruments. At December 31, 2019, the fair value of our fixed rate debt was $999,060,767 and the carrying value of our fixed rate debt was $950,948,388. The fair value estimate of our fixed rate debt was estimated using a discounted cash flow analysis utilizing rates we would expect to pay for debt of a similar type and remaining maturity if the loans were originated at December 31, 2019. As we expect to hold our fixed rate instruments to maturity and the amounts due under such instruments would be limited to the outstanding principal balance and any accrued and unpaid interest, we do not expect that fluctuations in interest rates, and the resulting change in fair value of our fixed rate instruments, would have a significant impact on our operations.
Conversely, movements in interest rates on our variable rate debt will change our future earnings and cash flows, but not significantly affect the fair value of those instruments. However, changes in required risk premiums will result in changes in the fair value of floating rate instruments. At December 31, 2019, the fair value of our variable rate debt was $154,385,001 and the carrying value of our variable rate debt was $157,610,657. Based on interest rates as of December 31, 2019, if interest rates are 100 basis points higher during the 12 months ending December 31, 2020, interest expense on our variable rate debt would increase by $1,610,600 and if interest rates are 100 basis points lower during the 12 months ending December 31, 2020, interest expense on our variable rate debt would decrease by $1,610,600.
At December 31, 2019, the weighted-average interest rate of our fixed rate debt and variable rate debt was 4.21% and 3.63%, respectively. The weighted-average interest rate of our blended fixed and variable rates was 4.13% at December 31, 2019. The weighted-average interest rate represents the actual interest rate in effect at December 31, 2019 (consisting of the contractual interest rate), using interest rate indices as of December 31, 2019, where applicable.
We may also be exposed to credit risk. Credit risk is the failure of the counterparty to perform under the terms of the derivative contract. If the fair value of a derivative contract is positive, the counterparty will owe us, which creates credit risk for us. If the fair value of a derivative contract is negative, we will owe the counterparty and, therefore, do not have credit risk. We will seek to minimize the credit risk in derivative instruments by entering into transactions with high-quality counterparties. As of December 31, 2019, we did not have counterparty risk on our interest rate cap agreements as the underlying variable rates for each of our interest rate cap agreements as of December 31, 2019 were not in excess of the capped rates. See also Note 10 (Derivative Financial Instruments) to our audited consolidated financial statements included in this annual report.
ITEM 8. FINANCIAL STATEMENTS AND SUPPLEMENTARY DATA
Our consolidated financial statements and supplementary data can be found beginning at page F-1 of this annual report.
ITEM 9. CHANGES IN AND DISAGREEMENTS WITH ACCOUNTANTS ON ACCOUNTING AND FINANCIAL DISCLOSURE
None.
ITEM 9A. CONTROLS AND PROCEDURES
Disclosure Controls and Procedures
58
We maintain disclosure controls and procedures that are designed to ensure that information required to be disclosed in our reports under the Exchange Act is recorded, processed, summarized and reported within the time periods specified in the rules and forms, and that such information is accumulated and communicated to us, including our chief executive officer and principal financial officer, as appropriate, to allow timely decisions regarding required disclosure. In designing and evaluating the disclosure controls and procedures, we recognize that any controls and procedures, no matter how well designed and operated, can provide only reasonable assurance of achieving the desired control objectives, as ours are designed to do, and we necessarily are required to apply our judgment in evaluating whether the benefits of the controls and procedures that we adopt outweigh their costs.
As required by Rules 13a-15(b) and 15d-15(b) of the Exchange Act, an evaluation as of December 31, 2019, was conducted under the supervision and with the participation of our management, including our chief executive officer and principal financial officer, of the effectiveness of our disclosure controls and procedures (as defined in Rules 13a-15(e) and 15d-15(e) under the Exchange Act). Based on this evaluation, our chief executive officer and principal financial officer concluded that our disclosure controls and procedures, as of December 31, 2019, were effective at the reasonable assurance level.
Internal Control Over Financial Reporting
Our management is responsible for establishing and maintaining adequate internal control over financial reporting, as such term is defined in Rules 13a-15(f) or 15d-15(f) promulgated under the Exchange Act.
In connection with the preparation of this annual report, our management, including our chief executive officer and chief financial officer, assessed the effectiveness of our internal control over financial reporting as of December 31, 2019. In making that assessment, our management used the criteria set forth by the Committee of Sponsoring Organizations of the Treadway Commission (COSO) in Internal Control-Integrated Framework (2013 framework).
Based on its assessment, our management believes that, as of December 31, 2019, our internal control over financial reporting was effective based on those criteria. There have been no changes in our internal control over financial reporting that occurred during the quarter ended December 31, 2019 that have materially affected, or are reasonably likely to materially affect, our internal control over financial reporting.
ITEM 9B. OTHER INFORMATION
None.
59
PART III
ITEM 10. DIRECTORS, EXECUTIVE OFFICERS AND CORPORATE GOVERNANCE
Our directors and executive officers and their respective positions and offices are as follows:
Name | Age | Position | ||
Rodney F. Emery | 69 | Chairman of the Board and Chief Executive Officer | ||
Ella S. Neyland | 65 | Affiliated Director and President | ||
Kevin J. Keating | 57 | Chief Financial Officer and Treasurer | ||
Ana Marie del Rio | 65 | Secretary | ||
G. Brian Christie | 73 | Independent Director | ||
Thomas H. Purcell | 69 | Independent Director | ||
Kerry D. Vandell | 73 | Independent Director | ||
Ned W. Brines | 58 | Independent Director | ||
Stephen R. Bowie | 69 | Independent Director | ||
Rodney F. Emery has served as our Chairman of the Board since August 2013 and as our Chief Executive Officer since September 2013. Mr. Emery also served as Chairman of the Board and Chief Executive Officer of SIR, positions he held from its inception in May 2009 through the SIR Merger in March 2020. In addition, Mr. Emery served as the Chairman of the Board and Chief Executive Officer of STAR III, positions he held from January 2016 and August 2015, respectively, through the STAR III Merger in March 2020. Mr. Emery is the founder of Steadfast Companies and is responsible for the corporate vision, strategy and overall guidance of the operations of Steadfast Companies. Mr. Emery chairs the Steadfast Executive Committee, which establishes policy and strategy and acts as the general oversight committee of Steadfast Companies. Mr. Emery also serves on the Steadfast Companies Investment Committee and is a member of the Board of Managers of Stira Capital Markets Group (formerly “Steadfast Capital Markets Group”). Prior to founding Steadfast Companies in 1994, Mr. Emery served for 17 years as the President of Cove Properties, a diversified commercial real estate firm specializing in property management, construction and development with a specialty in industrial properties. Mr. Emery received a Bachelor of Science in Accounting from the University of Southern California and serves on the board of directors of several non-profit organizations.
Our board of directors, excluding Mr. Emery, has determined that Mr. Emery is qualified to serve as one of our directors due to the leadership positions previously and currently held by Mr. Emery and Mr. Emery’s extensive experience acquiring, financing, developing and managing multifamily, hotel, office, industrial and retail real estate assets throughout the country.
Ella S. Neyland, has served as our President since September 2013 and an affiliated director since August 2013. Ms. Neyland also served as President and an affiliated director of SIR, positions she held from October 2012 through the SIR Merger in March 2020. Ms. Neyland served as an independent director of SIR from October 2011 to September 2012. In addition, Ms. Neyland served as the President and an affiliated director of STAR III, positions she held from August 2015 and January 2016, respectively, through the STAR III Merger in March 2020. Ms. Neyland was a founder of Thin Centers MD (“TCMD”) and served as its Chief Financial Officer from February 2011 to October 2011. Prior to founding TCMD, Ms. Neyland was a founder of SBMI, LLC, and served as its Chief Financial Officer from December 2008 to February 2011. From October 2004 to December 2008, Ms. Neyland was a financial advisor of Montecito Medical Investment Company, a private real estate acquisition and development company headquartered in Santa Barbara, California. From April 2001 to September 2004, Ms. Neyland served as the Executive Vice President, Treasurer and Investor Relations Officer of United Dominion Realty Trust, Inc., where she was responsible for capital market transactions, banking relationships and presentations to investors and Wall Street analysts. Prior to working at United Dominion Realty Trust, Inc., Ms. Neyland served as the Chief Financial Officer at Sunrise Housing, Ltd., from November 1999 to March 2001, and served as Executive Director of CIBC World Markets, from November 1997 to October 1999. From July 1990 to October 1997, Ms. Neyland served as the Senior Vice President of Finance and the Vice President of Troubled Debt Restructures/Finance for the Lincoln Property Company, a commercial real estate development and management company. From November 1989 to July 1990, Ms. Neyland was the Vice President/Portfolio Manager at Bonnet Resources Corporation, a subsidiary of BancOne. Prior to her employment at Bonnet Resources Corporation, Ms. Neyland served on the board of directors and as the Senior Vice President/Director of Commercial Real Estate Lending at Commerce Savings Association, a subsidiary of the publicly held American Century Corporation, from May 1983 to March 1989. Ms. Neyland received a Bachelor of Science in Finance from Trinity University in San Antonio, Texas.
Our board of directors, excluding Ms. Neyland, has determined that Ms. Neyland is qualified to serve as one of our directors due to Ms. Neyland’s prior service in real estate and banking.
60
Kerry D. Vandell has served as one of our independent directors since August 2013. Dr. Vandell also served as an independent director of SIR from October 2012 to August 2015. In March 2016, Dr. Vandell was appointed as an independent member of the board of directors of the PREDEX Fund, a mutual fund invested in privately offered, non-traded, perpetual-life institutional real estate funds. Dr. Vandell currently serves as the Dean’s Professor Emeritus of Economics and Public Policy and Director Emeritus of the Center for Real Estate at the Paul Merage School of Business at the University of California-Irvine (UCI), having joined UCI in July 2006. He also has held courtesy appointments at UCI’s School of Law and the Department of Planning, Policy and Design in the School of Social Ecology since 2008. Before joining UCI, Dr. Vandell was on the faculty of the University of Wisconsin-Madison for 17 years (1989-2006), where he served as the Tiefenthaler Chaired Professor of Real Estate and Urban Land Economics, the Director of the Center for Urban Land Economics Research, and the Chairman of the Department of Real Estate and Urban Land Economics. His first academic appointment was at Southern Methodist University (1976-1989), where he ultimately served as Professor and Chairman of the Department of Real Estate and Regional Science. Dr. Vandell has researched and consulted extensively in the areas of real estate investment, urban/real estate/environmental economics, mortgage finance, housing economics and policy, and valuation theory and is principal in the consulting firm KDV Associates, providing expert testimony in major litigation matters internationally. He has also previously served as a board member for firms representing the commercial banking, REIT and shopping center sectors. Dr. Vandell received his Ph.D. from the Massachusetts Institute of Technology in Urban Studies and Planning, his M.C.P. in City and Regional Planning from Harvard University, and his undergraduate and master’s degrees in Mechanical Engineering from Rice University. He has authored or co-authored over 70 publications and has been invited to provide numerous presentations on the topics of finance, economics and real estate.
Our board of directors, excluding Dr. Vandell, has determined that Dr. Vandell is qualified to serve as one of our directors due to Dr. Vandell’s prior position as a real estate and finance professor and extensive consultative experience in the real estate industry.
G. Brian Christie has served as one of our independent directors since August 2013. Mr. Christie has practiced as an attorney in the real estate, corporate and banking fields since 1979. Mr. Christie currently serves as a principal of Christie Law Firm, a position he has held since 2005. From 1998 to 2005, Mr. Christie served as Chief Executive Officer of Liti Holographics, Inc., a 3-D optical technology company. From 1992 to 1997, Mr. Christie served as a Director, Executive Vice President and General Counsel of ARV Assisted Living, Inc., or ARV, a company which acquired, developed and operated multifamily apartments, senior apartments and assisted living apartments. While at ARV, Mr. Christie played an integral role in the listing of ARV on NASDAQ. Prior to joining ARV, Mr. Christie was a partner at the law firm of Good, Wildman, Hegness and Walley. Mr. Christie received a Bachelor of Arts from Calvary Bible College, a Master of Theology from Dallas Theological Seminary and a Juris Doctor from the University of Texas Law School. Mr. Christie is a member of the State Bar of California, the State Bar of Virginia, the State Bar of Texas (inactive), and the American Bar Association.
Our board of directors, excluding Mr. Christie, has determined that Mr. Christie is qualified to serve as one of our directors due to Mr. Christie’s prior experience as a director and officer in the multifamily industry.
Thomas H. Purcell has served as one of our independent directors since August 2013. Mr. Purcell has been actively involved in the real estate development business since 1972. Since September 2009, Mr. Purcell has served as Chairman and Chief Executive Officer of the Curci Companies, a real estate investment company that owns and manages office, industrial and retail property throughout the western United States. From April 1998 to August 2009, Mr. Purcell was Co-Founder and President of Spring Creek Investors, LLC, a private equity capital business focused on real estate development. From 1996 to 1998, Mr. Purcell served as President of Diversified Shopping Centers, where he developed and managed neighborhood and community shopping centers. From 1977 to 1996, Mr. Purcell was Co-Founder and President of a shopping center development business that developed and renovated over four million square feet of retail shopping centers. Prior to 1977, Mr. Purcell was employed at a shopping center development company where he headed the development and construction management team and served as the controller. Since 2007, Mr. Purcell has been a board member of Bixby Land Company, a private industrial REIT, where he also chairs the investment committee and is a member of the audit and compensation committees. Mr. Purcell is a member of the International Council of Shopping Centers, or ICSC, and previously served as Western Division Vice President and on the Board of Trustees and Executive Committee of ICSC and was a trustee of the ICSC Educational Foundation. He formerly served as a board member of the California Business Properties Association and an advisory board member of Buchanan Street Partners and Western National Realty Fund. Mr. Purcell received a Bachelor of Science in Finance from the University of Southern California.
Our board of directors, excluding Mr. Purcell, has determined that Mr. Purcell is qualified to serve as one of our directors due to Mr. Purcell’s prior experience as an executive of real estate investment and development companies.
Ned W. Brines has served as one of our independent directors since March 2020. Mr. Brines also served as an independent director of SIR from October 2012 to March 2020, an independent director of STAR III from January 2016 to March 2020 and served as an independent trustee of Stira Alcentra Global Credit Fund from March 2017 to May 2019. Mr. Brines is presently the Director of Investments for Arnel & Affiliates where he oversees the management of the assets of a private family with
61
significant and diversified holdings. From 2012 to 2016, Mr. Brines served as the Chief Investment Officer for the Citizen Trust Wealth Management and Trust division of Citizens Business Bank, where he was responsible for the investment management discipline, process, products and related sources. In addition, in September 2008 Mr. Brines founded Montelena Asset Management, a California based registered investment adviser firm. From June 2010 to July 2012, Mr. Brines served as a portfolio manager for Andell Holdings, a private family office with significant and diversified holdings. From May 2001 to September 2008, Mr. Brines served as a Senior Vice President and senior portfolio manager with Provident Investment Counsel in Pasadena, managing its Small Cap Growth Fund with $1.6 billion in assets under management. Mr. Brines was with Roger Engemann & Associate in Pasadena from September 1994 to March 2001 where he served as both an analyst and portfolio manager for their mid cap mutual fund and large cap Private Client business as the firm grew from $3 billion to over $19 billion in assets under management. Mr. Brines earned a Master of Business Administration degree from the University of Southern California and a Bachelor of Science degree from San Diego State University. Mr. Brines also holds the Chartered Financial Analyst designation and is involved in various community activities including serving on the investment committee of City of Hope, as well as the Orange County Regional Counsel for San Diego State University.
Our board of directors, excluding Mr. Brines, has determined that Mr. Brines is qualified to serve as one of our directors due to Mr. Brines’ prior investment management experience.
Stephen R. Bowie has served as one of our independent directors since March 2020. Mr. Bowie also served as an independent director of STAR III from January 2016 to March 2020. Mr. Bowie currently is a partner with Pacific Development Group, a position he has held since 1987, specializing in the development and management of neighborhood and community shopping centers throughout California, with a primary responsibility in the development of new projects. From 1979 to 1987, Mr. Bowie served as president of Bowie Development Company, Inc., a California corporation. Mr. Bowie earned a Bachelor of Science degree in business administration from the University of Southern California. Mr. Bowie is a member of the International Council of Shopping Centers and a licensed real estate broker in California, and serves on multiple boards, including the Northrise University Initiative 501(c)(3) and the Northrise University Board of Trustees.
Our board of directors, excluding Mr. Bowie, has determined that Mr. Bowie is qualified to serve as one of our directors due to Mr. Bowie’s prior experience in the real estate industry.
Kevin J. Keating has served as our Chief Financial Officer and Treasurer since November 2017 and September 2013, respectively, and as our advisor’s Treasurer and Chief Accounting Officer since September 2013, where he focuses on the accounting function and compliance responsibilities for us and our advisor. Mr. Keating also served as Chief Financial Officer and Treasurer of SIR, positions he held from November 2017 and April 2011, respectively, through the SIR Merger in March 2020, and Chief Financial Officer and Treasurer of STAR III from November 2017 and August 2015, respectively, through the STAR III Merger in March 2020. Mr. Keating served as the controller of SIR from January 2011 to March 2011. Mr. Keating served as Senior Audit Manager with BDO, USA, LLP (formerly BDO Seidman, LLP), an accounting and audit firm, from June 2006 to January 2011. From June 2004 to June 2006, Mr. Keating served as Vice President and Corporate Controller of Endocare, Inc., a medical device manufacturer. Mr. Keating has extensive experience working with public companies and served as Assistant Controller and Audit Manager for Ernst & Young LLP from 1988 to 1999. Mr. Keating holds a Bachelor of Science in Accounting from St. John’s University in New York, New York and is a certified public accountant.
Ana Marie del Rio has served as our Secretary and Compliance Officer since September 2013. Ms. del Rio also served as Secretary and Compliance Officer of SIR, positions she held from its inception in May 2009 through the SIR Merger in March 2020, and Secretary and Compliance Officer of STAR III, positions held from August 2015 through the STAR III Merger in March 2020. Ms. del Rio also serves as the Chief Legal Officer for Steadfast Companies and manages its Legal Services and Risk Management Departments. Ms. del Rio works closely with Steadfast Management Company, Inc. in the management of Steadfast Companies’ residential apartment homes, especially in the area of compliance.
Prior to joining Steadfast Companies in April 2003, Ms. del Rio was a partner in the public finance group at Orrick, Herrington & Sutcliffe, LLP, where she practiced from September 1993 to April 2003, representing both issuers and underwriters in financing single-family and multifamily housing and other types of public-private and redevelopment projects. From 1979 to 1993, Ms. del Rio co-owned and operated a campaign consulting and research company specializing in local campaigns and ballot measures. Ms. del Rio received a Juris Doctor from the University of the Pacific, McGeorge School of Law, and a Master of Public Administration and a Bachelor of Arts from the University of Southern California. Ms. del Rio serves on the Board of Directors of Project Access, a nonprofit corporation, and is a lecturer for the University of California, Irvine, School of Law, Community and Economic Development Clinic.
62
The Audit Committee
Our board of directors has established an audit committee. The audit committee’s function is to assist our board of directors in fulfilling its responsibilities by overseeing: (1) the systems of our internal accounting and financial controls; (2) our financial reporting processes; (3) the independence, objectivity and qualification of our independent auditors; (4) the annual audit of our financial statements; and (5) our accounting policies and disclosures. The members of the audit committee are G. Brian Christie, Thomas H. Purcell and Kerry D. Vandell. All of the members of the audit committee are “independent” as defined by our charter. Our shares are not listed for trading on any national securities exchange and therefore our audit committee members are not subject to the independence requirements of the New York Stock Exchange, or NYSE, or any other national securities exchange. However, each member of our audit committee is “independent” as defined by the NYSE. All members of the audit committee have significant financial and/or accounting experience. Our board of directors has determined that Dr. Vandell satisfies the SEC’s requirements for and serves as our “audit committee financial expert.”
Investment Committee
Our board of directors has established an investment committee. Our board of directors has delegated to the investment committee: (1) certain responsibilities with respect to investment in specific investments proposed by our advisor and (2) the authority to review our investment policies and procedures on an ongoing basis. The investment committee must at all times be comprised of at least three members, a majority of whom must be independent directors. The current members of the investment committee are Rodney F. Emery, G. Brian Christie and Thomas H. Purcell, with Mr. Emery serving as the chairman of the investment committee.
With respect to investments, the investment committee has the authority to approve all acquisitions, developments and dispositions of real estate and real estate-related assets consistent with our investment objectives, for a purchase price, total project cost or sales price of up to 10% of the cost of our total assets as of the date of investment. Approval of our board of directors is required with respect to acquisitions, developments and dispositions of real estate and real estate-related assets with a purchase price, total project cost or sales price of more than 10% of the cost of our total assets as of the date of investment.
Valuation Committee
Our board of directors has established a valuation committee. The valuation committee’s function, as recommended by the IPA, is to perform the following functions in connection with the determination of an estimated per share value of our common stock: (1) ratify and approve the engagement of valuation advisory services, its scope of work and any amendments thereto, (2) review and approve the proposed valuation process and methodology to be used to determine the estimation of the per share value of our common stock, or valuation, (3) review the reasonableness of the valuation or range of value resulting from the process and (4) recommend the final proposed valuation for approval by the board of directors. The members of the valuation committee are Thomas Purcell, G. Brian Christie and Kerry Vandell, with Mr. Purcell serving as chairman of the valuation committee.
Special Committee
Our board of directors has established a special committee. The special committee’s function is limited to the evaluation, negotiation and approval of (1) any agreement, arrangement or other transaction by and between our company, our advisor or any other affiliate of our sponsor related to compensation payable by our company to our advisor or any other affiliate of our sponsor in connection with the pursuit of strategic alternatives; (2) any strategic alternatives in which a counter party has expressed an interest in the contemporaneous or subsequent purchase of any other transaction related to Steadfast Companies; and (3) any other transaction which the board specifically identifies and delegates authority to the special committee. The members of the special committee are Thomas Purcell, G. Brian Christie and Kerry Vandell, with Mr. Purcell serving as the chairman of the committee.
Delinquent Section 16(a) Reports
Section 16(a) of the Exchange Act requires each director, officer and individual beneficially owning more than 10% of our common stock to file with the SEC, within specified time frames, initial statements of beneficial ownership (Form 3) of our common stock and statements of changes in beneficial ownership (Forms 4 and 5) of our common stock. These specified time frames require the reporting of changes in ownership within two business days of the transaction giving rise to the reporting obligation. Reporting persons are required to furnish us with copies of all Section 16(a) forms filed with the SEC. Based solely on a review of the copies of such forms furnished to us during and with respect to the fiscal year ended December 31, 2019, or written representations that no additional forms were required, we believe that all required Section 16(a) filings were timely and correctly made by reporting persons during the year ended December 31, 2019.
63
Code of Conduct and Ethics
We have adopted a Code of Ethics that applies to all of our executive officers and directors, including but not limited to, our principal executive officer, principal financial officer and principal accounting officer. Our Code of Ethics can be found at our website: http://www.steadfastreits.com. If, in the future, we amend, modify or waive a provision in our Code of Ethics, we may, rather than filing a Current Report on Form 8-K, satisfy the disclosure by posting such information on our website as necessary.
ITEM 11. EXECUTIVE COMPENSATION
Compensation of Executive Officers
Our executive officers do not receive compensation directly from us for services rendered to us and we do not intend to pay any compensation to our executive officers. We do not reimburse our advisor directly or indirectly for the salary or other compensation paid to any of our executive officers. As a result, we do not, nor has our board of directors considered, a compensation policy for our executive officers. Accordingly, we have not included a Compensation Discussion and Analysis in this annual report or other related disclosures pursuant to Item 402 of Regulation S-K and paragraphs (e)(4) and (e)(5) of Item 407 of Regulation S-K with respect to our executive officers. Our executive officers are officers and/or employees of, or hold an indirect ownership interest in, our advisor and/or its affiliates, and our executive officers are compensated by these entities, in part, for their services to us. See Item 13. “Certain Relationships and Related Transactions, and Director Independence—Certain Transactions with Related Persons” for a discussion of the fees paid to our advisor and its affiliates.
Compensation of Directors
If a director is also one of our executive officers or an affiliate of our advisor, we do not pay any compensation to that person for services rendered as a director. The amount and form of compensation payable to our independent directors for their service to us is determined by our board of directors, based upon recommendations from our advisor. Four of our executive officers, Messrs. Rodney F. Emery and Kevin Keating and Mses. Ana Marie del Rio and Ella Neyland, manage, control or are affiliated with our advisor, and through our advisor, they are involved in recommending the compensation to be paid to our independent directors.
We have provided below certain information regarding compensation earned by or paid to our directors during the fiscal year ended December 31, 2019.
Name | Fees Earned or Paid in Cash in 2019(1) | Stock Awards | Option Awards | Non-Equity Incentive Plan Compensation | Change in Pension Value and Nonqualified Deferred Compensation | All Other Compensation | Total | |||||||||||||||||||||
G. Brian Christie(2)(3) | $ | 153,500 | $ | 26,389 | $ | — | $ | — | $ | — | $ | — | $ | 179,889 | ||||||||||||||
Thomas H. Purcell(2)(3) | 160,000 | 26,389 | — | — | — | — | 186,389 | |||||||||||||||||||||
Kerry D. Vandell(2)(3) | 162,500 | 26,389 | — | — | — | — | 188,889 | |||||||||||||||||||||
Ned W. Brines(4) | — | — | — | — | — | — | — | |||||||||||||||||||||
Stephen R. Bowie(4) | — | — | — | — | — | — | — | |||||||||||||||||||||
Ella S. Neyland(5) | — | — | — | — | — | — | — | |||||||||||||||||||||
Rodney F. Emery(5) | — | — | — | — | — | — | — | |||||||||||||||||||||
$ | 476,000 | $ | 79,167 | $ | — | $ | — | $ | — | $ | — | $ | 555,167 | |||||||||||||||
_________________
(1) | The amounts shown in this column include payments made to members of the special committee, which was formed during the year ended December 31, 2018. The members of the special committee are our independent directors. It was agreed that each independent director will receive retainers of $42,500 with the special committee chairperson receiving an additional $7,500. In addition, each member receives meeting fees as described below; provided there is no daily limit for special committee meeting fees. |
(2) | Independent directors. |
(3) | On November 6, 2019, each of our three independent directors was granted 1,666 shares of restricted common stock in connection with their re-election to the board of directors pursuant to our Independent Directors Compensation Plan (described below). The grant date fair value of the stock was $15.84 per share for an aggregate amount of $26,389 for |
64
each independent director. Of these shares of restricted common stock granted in 2019, each independent director had 1,250 shares of restricted common stock that remain unvested as of December 31, 2019. The amounts shown in this column reflect the aggregate fair value of shares of restricted stock granted, computed as of the grant date in accordance with Financial Accounting Standards Board Accounting Standards Codification Topic 718.
(4) | On March 6, 2020, we issued 3,333 restricted shares of our common stock to each of Ned W. Brines and Stephen R. Bowie in connection with their appointment to our board of directors. |
(5) | Directors who are also our executive officers or executive officers of our affiliates do not receive compensation for services rendered as a director. |
Cash Compensation
We pay each of our independent directors:
• | an annual retainer of $55,000 (the audit committee chairperson receives an additional $10,000 annual retainer); |
• | $2,500 for each in-person board of directors meeting attended; |
• | $1,500 for each in-person committee meeting attended; and |
• | $1,000 for each teleconference meeting of the board of directors or committee. |
We will not pay in excess of $4,000 for any one set of meetings attended on any given day.
Equity Plan Compensation
Our board of directors has approved and adopted the Steadfast Apartment REIT, Inc. Independent Directors Compensation Plan, or the Plan, which operates as a sub-plan of the Steadfast Apartment REIT, Inc. Amended and Restated 2013 Incentive Plan, or the Incentive Plan. Under the Incentive Plan and subject to such Incentive Plan’s conditions and restrictions, each of our current independent directors was entitled to receive 3,333 shares of restricted common stock once we raised $2,000,000 in gross offering proceeds from our public offering. Each subsequent independent director that joins our board of directors receives 3,333 shares of restricted common stock upon election to our board of directors. In addition, on the date following an independent director’s re-election to our board of directors, he or she receives 1,666 shares of restricted common stock. Grants of restricted common stock are subject to share availability under the Incentive Plan. The shares of restricted common stock granted pursuant to the Incentive Plan generally vest in four equal annual installments beginning on the date of grant and ending on the third anniversary of the date of grant; provided, however, that the restricted stock will become fully vested on the earlier to occur of: (1) the termination of the independent director’s service as a director due to his or her death or “disability”, or (2) a “change in control” of the Company (as such terms are defined in the Incentive Plan).
Compensation Committee Interlocks and Insider Participation
We currently do not have a compensation committee of our board of directors because we do not pay, or plan to pay, any compensation to our officers. There are no interlocks or insider participation as to compensation decisions required to be disclosed pursuant to SEC regulations.
ITEM 12. SECURITY OWNERSHIP OF CERTAIN BENEFICIAL OWNERS AND MANAGEMENT AND RELATED STOCKHOLDER MATTERS
Equity Compensation Plan Information
The following table provides information about our common stock that may be issued upon the exercise of options, warrants and rights under the Incentive Plan as of December 31, 2019.
Plan Category | Number of Securities to be Issued Upon Exercise of Outstanding Options, Warrants and Rights | Weighted-Average Exercise Price of Outstanding Options, Warrants and Rights | Number of Securities Remaining Available for Future Issuance Under Equity Compensation Plans | ||||||
Equity compensation plans approved by security holders: | — | — | 960,013 | ||||||
Equity compensation plans not approved by security holders: | N/A | N/A | N/A | ||||||
Total | — | — | 960,013 | ||||||
65
Security Ownership of Certain Beneficial Owners
The following table shows, as of March 6, 2020, the amount of our common stock beneficially owned (unless otherwise indicated) by: (1) any person who is known by us to be the beneficial owner of more than 5% of the outstanding shares of our common stock, (2) our directors, (3) our executive officers, and (4) all of our directors and executive officers as a group.
Name and Address of Beneficial Owner(1) | Amount and Nature of Beneficial Ownership(2) | Percentage | |||
Rodney F. Emery(3) | 382,764 | * | |||
G. Brian Christie | 13,329 | * | |||
Thomas H. Purcell(4) | 19,248 | * | |||
Kerry D. Vandell | 15,109 | * | |||
Ned W. Brines | 32,316 | * | |||
Stephen R. Bowie | 18,698 | * | |||
Ella S. Neyland | 7,834 | * | |||
Kevin J. Keating | 4,241 | * | |||
Ana Marie del Rio | 11,173 | * | |||
All officers and directors as a group (seven persons) | 504,712 | * | |||
_________________
* Less than 1% of the outstanding common stock.
(1) The address of each named beneficial owner is c/o Steadfast Apartment REIT, Inc., 18100 Von Karman Avenue, Suite 500, Irvine, CA, 92612.
(2) None of the shares are pledged as security.
(3) Includes 26,687 shares owned by Steadfast REIT Investments, LLC, 289,746 shares owned by Steadfast Income Advisor, LLC and 11,440 shares owned by Steadfast Apartment Advisor III, LLC, which is primarily indirectly owned and controlled by Rodney F. Emery.
(4) | Includes 3,704 shares owned by THP Management, LLC, which is primarily owned and controlled by Thomas H. Purcell. |
66
ITEM 13. CERTAIN RELATIONSHIPS AND RELATED TRANSACTIONS, AND DIRECTOR INDEPENDENCE
Certain Transactions with Related Persons
The following describes all transactions during the year ended December 31, 2019 involving us, our directors, our advisor, our sponsor and any affiliate thereof and all such proposed transactions. See also Note 7 (Related Party Arrangements) to the consolidated financial statements included in this annual report. Our independent directors are specifically charged with and have examined the fairness of such transactions to our stockholders, and have determined that all such transactions are fair and reasonable to us.
Ownership Interests
On September 3, 2013, our sponsor purchased 13,500 shares of our common stock for an aggregate purchase price of $202,500 and was admitted as our initial stockholder. Our sponsor is majority owned and controlled indirectly by Rodney F. Emery, our chairman of the board of directors and chief executive officer. On September 3, 2013, our advisor purchased 1,000 shares of our convertible stock for an aggregate purchase price of $1,000. As of December 31, 2019, our advisor owned 100% of our outstanding convertible stock. We are the general partner of our operating partnership. Steadfast Apartment REIT Limited Partner, LLC, our wholly-owned subsidiary, has made a $1,000 capital contribution to our operating partnership as the initial limited partner. Following the SIR Merger and STAR Merger, our sponsor owned 26,687 shares of our common stock.
Prior to the mergers, our then outstanding convertible stock would convert into shares of our common stock if and when: (A) we have made total distributions on the then-outstanding shares of our common stock equal to the original issue price of those shares plus an aggregate 6.0% cumulative, non-compounded, annual return on the original issue price of those shares, (B) we list our common stock for trading on a national securities exchange, or (C) our advisory agreement is terminated or not renewed (other than for “cause” as defined in our advisory agreement). In the event of a termination or non-renewal of our advisory agreement for cause, all of the shares of the convertible stock will be repurchased by us for $1.00. In general, each share of our convertible stock would convert into a number of shares of common stock equal to 1/1000 of the quotient of (A) 15% of the excess of (1) our “enterprise value” plus the aggregate value of distributions paid to date on the then outstanding shares of our common stock over (2) the aggregate purchase price paid by stockholders for those outstanding shares of common stock plus an aggregated 6.0% cumulative, non-compounded, annual return on the original issue price of those outstanding shares, divided by (B) our enterprise value divided by the number of outstanding shares of common stock on an as-converted basis, in each case calculated as of the date of the conversion. Shares of our convertible stock are not paid dividends and as of the date hereof all shares of convertible stock remained outstanding. Following the SIR Merger and STAR Merger, our sponsor exchanged the convertible stock for new Class A convertible stock with substantially similar terms as described above, but which also takes into account distributions received by SIR and STAR III stockholders prior to the mergers. See “—Class A Convertible Stock.”
Our Relationships with our Advisor and our Sponsor
Steadfast Apartment Advisor, LLC is our advisor and, as such, supervises and manages our day-to-day operations and selects our real property investments and real estate-related assets, subject to oversight by our board of directors. Our advisor also provides marketing, sales and client services on our behalf. Our advisor is owned by our sponsor. Mr. Emery, our chairman of the board and chief executive officer, owns an 86% interest in Steadfast REIT Holdings, LLC, or Steadfast Holdings, the parent of our sponsor. Ms. Ana Marie del Rio, our secretary, owns a 7% interest in Steadfast Holdings. Since 2014, Ms. Neyland has earned an annual 5% profit interest from Steadfast Holdings. Crossroads Capital Multifamily, LLC, or Crossroads Capital Multifamily, owns a 25% membership interest in our sponsor. Pursuant to the Third Amended and Restated Operating Agreement of our sponsor, effective as of January 1, 2014, as amended, distributions are allocated to each member of our sponsor in an amount equal to such member’s accrued and unpaid 10% preferred return, as defined in the Third Amended and Restated Operating Agreement. Thereafter, all distributions to Crossroads Capital Multifamily are subordinated to distributions to the other member of our sponsor, Steadfast REIT Holdings, until Steadfast Holdings has received an amount equal to certain expenses, including certain organization and offering costs, incurred by Steadfast Holdings and its affiliates on our behalf.
All of our other officers and directors, other than our independent directors, are officers of our advisor and officers, limited partners and/or members of our sponsor and other affiliates of our advisor.
We and our operating partnership entered into the advisory agreement with our advisor and our operating partnership which had a one-year term expiring December 13, 2020, subject to an unlimited number of successive one-year renewals upon mutual consent of the parties. We may terminate the advisory agreement without cause or penalty upon 60 days’ written notice and immediately upon fraud, criminal conduct, willful misconduct, gross negligence or material breach of the advisory agreement by our advisor or our advisor’s bankruptcy. If we terminate the advisory agreement, we will pay our advisor all unpaid advances for operating expenses and all earned but unpaid fees. In connection with the SIR Merger and STAR III Merger, we
67
entered into an Amended and Restated Advisory Agreement, effective as of March 6, 2020. See “—Amended and Restated Advisory Agreement.”
Services provided by our advisor under the terms of the advisory agreement include the following:
• | finding, presenting and recommending investment opportunities to us consistent with our investment policies and objectives; |
• | making investment decisions for us, subject to the limitations in our charter and the direction and oversight of our board of directors; |
• | structuring the terms and conditions of our investments, sales and joint ventures; |
• | acquiring investments on our behalf in compliance with our investment objectives and policies; |
• | sourcing and structuring our loan originations; |
• | arranging for financing and refinancing of investments; |
• | entering into service agreements for our loans; |
• | supervising and evaluating each loan servicer’s and property manager’s performance; |
• | reviewing and analyzing the operating and capital budgets of the properties underlying our investments and the properties we may acquire; |
• | entering into leases and service contracts for our properties; |
• | assisting us in obtaining insurance; |
• | generating our annual budget; |
• | reviewing and analyzing financial information for each of our assets and our overall investment portfolio; |
• | formulating and overseeing the implementation of strategies for the administration, promotion, management, financing and refinancing, marketing, servicing and disposition of our investments; |
• | performing investor relations services; |
• | maintaining our accounting and other records and assisting us in filing all reports required to be filed with the SEC, the Internal Revenue Service and other regulatory agencies; |
• | engaging and supervising the performance of our agents, including our registrar and transfer agent; and |
• | performing any other services reasonably requested by us. |
The above summary is provided to illustrate the material functions that our advisor performs for us as an advisor and is not intended to include all of the services that may be provided to us by our advisor, its affiliates or third parties. Our advisor has also entered into an Advisory Services Agreement with Crossroads Capital Advisors, whereby Crossroads Capital Advisors provides certain advisory services to us on behalf of our advisor.
Fees and Expense Reimbursements Paid to our Advisor
Pursuant to the terms of our advisory agreement, we paid our advisor the fees described below during the year ended December 31, 2019.
• | We paid our advisor an acquisition fee of 1.0% of the cost of investment, which includes the amount actually paid or budgeted to fund the acquisition, origination, development, construction or improvement of any real property or real estate-related asset acquired. For the year ended December 31, 2019, we incurred and paid to our advisor acquisition fees of $48,343. |
• | We paid our advisor a loan coordination fee equal to 1.0% of the initial amount of the new debt financed or outstanding debt assumed in connection with the acquisition, development, construction, improvement or origination of a property or a real estate-related asset. In addition, in connection with any financing or the refinancing of any debt (in each case, other than identified at the time of the acquisition of a property or a real estate-related asset), we paid our advisor or its affiliate a loan coordination fee equal to 0.75% of the amount of debt financed or refinanced. In some instances, we and our advisor agreed to a loan coordination fee of $100,000 per loan refinanced. For the year ended December 31, 2019, we incurred $942,833 and paid $342,833 of loan coordination fees. |
• | We paid our advisor an annual investment management fee that is payable monthly in an amount equal to one-twelfth of 1.0% of (1) the cost of investments in real properties and real estate-related assets acquired directly by us or (2) our |
68
allocable cost of each investment in real property or real estate-related asset acquired through a joint venture. The investment management fee is calculated including the amount actually paid or budgeted to fund acquisition fees, acquisition expenses, cost of development, construction or improvement and any debt attributable to such investments, or our proportionate share thereof in the case of investments made through joint ventures. For the year ended December 31, 2019, we incurred investment management fees to our advisor of $16,722,860. During the same period we paid $12,632,561 in investment management fees to our advisor.
• | We paid our advisor a disposition fee of up to one-half of the brokerage commissions paid but in no event to exceed 1.0% of the sales price of each property or real estate-related asset sold if our advisor or its affiliates provides a substantial amount of services, as determined by a majority of our independent directors, in connection with the sale of a real property or real estate-related asset. To the extent the disposition fee is paid upon the sale of any assets other than real property, it will be included as an operating expense for purposes of the 2%/25% Guidelines (discussed below). With respect to a property held in a joint venture, the foregoing commission will be reduced to a percentage of such amounts reflecting our economic interest in the joint venture. For the year ended December 31, 2019, we incurred $591,000 and paid $0 of disposition fees. |
In addition to the fees we pay to our advisor pursuant to the advisory agreement, we also reimburse our advisor and its affiliates for the costs and expenses described below.
• | We reimbursed our advisor and its affiliates for organization and offering expenses for actual legal, accounting, tax, printing mailing and filing fees, charges of our transfer agent, expenses of organizing the company, data processing fees, advertising and sales literature costs, out-of-pocket due diligence costs, and amounts to reimburse our advisor or its affiliates for the salaries of its employees and other costs in connection with preparing supplemental sales materials and providing other administrative services in connection with our initial public offering. Any such reimbursement did not exceed actual expenses incurred by our advisor. For the year ended December 31, 2019, we incurred $0 and paid $228,665 to our advisor for the reimbursement of organization and offering expenses. Following the termination of our initial public offering, our advisor had an obligation to reimburse us to the extent total organization and offering expenses (including sales commissions and dealer manager fees) borne by us exceeded 15% of the gross proceeds raised in the initial public offering. Total organization and offering expenses borne by us did not exceed 15% of the gross offering proceeds in our public offering. |
• | Subject to the 2%/25% Guidelines discussed below, we reimburse our advisor for all expenses incurred by our advisor in providing services to us, including our allocable share of our advisor’s overhead, such as rent, employee costs, utilities and information technology costs; provided, however, that no reimbursement shall be made for costs of such personnel to the extent that personnel are used in transactions for which our advisor receives an acquisition fee, investment management fee, loan coordination fee or disposition fee or for the employee costs our advisor pays to our executive officers. For the year ended December 31, 2019, we incurred and reimbursed our advisor $1,826,725 and $1,457,164 for administrative services. |
• | We reimburse our advisor for acquisition expenses incurred related to the selection, evaluation, acquisition and development of real property investments and real estate-related investments as long as total acquisition fees and expenses (including any loan coordination fees at acquisition) relating to the purchase of an investment do not exceed 4.5% of the contract price of the property unless such excess is approved by our board of directors. For the year ended December 31, 2019, we incurred and reimbursed our advisor acquisition expenses of $650,041 and $651,648, respectively. |
2%/25% Guidelines
As described above, our advisor and its affiliates are entitled to reimbursement of actual expenses incurred for administrative and other services provided to us for which they do not otherwise receive a fee. However, we will not reimburse our advisor or its affiliates at the end of any fiscal quarter for “total operating expenses” that for the four consecutive fiscal quarters then ended, or the expense year, exceeded the greater of (1) 2% of our average invested assets or (2) 25% of our net income, which we refer to as the “2%/25% Guidelines,” and our advisor must reimburse us quarterly for any amounts by which our total operating expenses exceed the 2%/25% Guidelines in the expense year, unless our independent directors have determined that such excess expenses were justified based on unusual and non-recurring factors.
For purposes of the 2%/25% Guidelines, “total operating expenses” means all costs and expenses paid or incurred by us, as determined under GAAP, that are in any way related to our operation or to corporate business, including advisory fees, but excluding (1) the expenses of raising capital such as organization and offering expenses, legal, audit, accounting, underwriting, brokerage, listing, registration and other fees, printing and other such expenses and taxes incurred in connection with the issuance, distribution, transfer, registration and listing of our shares of common stock, (2) interest payments, (3) taxes, (4) non-cash expenditures such as depreciation, amortization and bad debt reserves, (5) incentive fees, (6) acquisition fees and acquisition expenses (including expenses relating to potential acquisitions that we do not close) and investment management
69
fees, (7) real estate commissions on the sale of a real property, and (8) other expenses connected with the acquisition, disposition, management and ownership of real estate interests, mortgage loans or other property (including the costs of foreclosure, insurance premiums, legal services, maintenance, repair and improvement of real property).
At December 31, 2019, our total operating expenses did not exceed the 2%/25% Guideline.
Selling Commissions and Fees Paid to our Dealer Manager
The dealer manager for our initial public offering of common stock was Stira Capital Markets Group, LLC (formerly Steadfast Capital Markets Group, LLC), an affiliate of our sponsor. Our dealer manager is a licensed broker-dealer registered with FINRA. As the dealer manager for our initial public offering, Stira Capital Markets Group was entitled to certain selling commissions, dealer manager fees and reimbursements relating to raising capital. The dealer manager agreement with our dealer manager provides for the following compensation:
• | We paid our dealer manager selling commissions of up to 7% of the gross offering proceeds from the sale of our shares, all of which could be reallowed to participating broker-dealers. We allowed a participating broker-dealer to elect to receive the 7% selling commission at the time of sale or elect to have the selling commission paid on a trailing basis. A participating broker-dealer electing to receive a trailing selling commission will be paid as follows: 3% at the time of sale and the remaining 4% paid ratably (1% per year) on each of the first four anniversaries of the sale. For the year ended December 31, 2019, we paid $228,665 in selling commissions to our dealer manager. We terminated our initial public offering on March 24, 2016, and as of December 31, 2019, expect to pay trailing selling commissions subsequent to that date of $71,287. |
• | We paid our dealer manager a dealer manager fee of 3% of the gross offering proceeds from the sale of our shares (a portion of which could be reallowed to participating broker-dealers). For the year ended December 31, 2019, no dealer manager fees were paid to our dealer manager. |
Fees and Reimbursements Paid to Our Property Manager
• | We have entered into property management agreements (each, as amended from time to time, a “property management agreement”) with Steadfast Management Company, Inc., or the property manager, an affiliate of our sponsor, or the “property manager”, in connection with the management of our multifamily properties. Pursuant to each property management agreement, we pay the property manager a monthly management fee equal to a range from 2.5% to 3.0% of each property’s gross revenues (as defined in the respective property management agreements) for each month. Each property management agreement has an initial one-year term and will continue thereafter on a month-to-month basis unless either party gives prior 60 days’ notice of its desire to terminate the property management agreement, provided that we may terminate the property management agreement at any time upon a determination of gross negligence, willful misconduct or bad acts of the property manager or its employees or upon an uncured breach of the agreement upon 30 days’ prior written notice to the property manager. For the year ended December 31, 2019, we incurred $5,016,845 and paid $5,009,096 of property management fees to our property manager. |
• | The property management agreements specify that we are to reimburse the property manager for the salaries and related benefits of on-site personnel. For the year ended December 31, 2019, we incurred and reimbursed on-site personnel costs of $15,230,722 and $15,155,066, respectively, to our property manager. |
• | The property management agreements also specify certain other fees payable to the property manager for benefit administration, information technology infrastructure, licenses, support, and training services and capital expenditures supervision. For the year ended December 31, 2019, we incurred and reimbursed other fees of $3,478,456 and $3,451,202, respectively. For the year ended December 31, 2019, we incurred and reimbursed capital expenditures of $107,576. |
Merger with Steadfast Income REIT, Inc.
On August 5, 2019, we, SIR, our operating partnership, Steadfast Income REIT Operating Partnership, L.P., the operating partnership of SIR, and SIR Merger Sub entered into the SIR Merger Agreement. Pursuant to the terms and conditions of the SIR Merger Agreement, on March 6, 2020, SIR merged with and into SIR Merger Sub with SIR Merger Sub surviving the SIR Merger. Following the SIR Merger, SIR Merger Sub, as the surviving entity, will continue as our wholly-owned subsidiary. In accordance with the applicable provisions of the MGCL, the separate existence of SIR ceased.
At the effective time of the SIR Merger, each issued and outstanding share of SIR common stock (or a fraction thereof), $0.01 par value per share converted into 0.5934 shares of our common stock.
70
Merger with Steadfast Apartment REIT III, Inc.
On August 5, 2019, we, STAR III, our operating partnership, Steadfast Apartment REIT III Operating Partnership, L.P., the operating partnership of STAR III, and STAR III Merger Sub entered into the STAR III Merger Agreement.
Pursuant to the terms and conditions of the STAR III Merger Agreement, on March 6, 2020, STAR III merged with and into STAR III Merger Sub with STAR III Merger Sub surviving the STAR III Merger. Following the STAR III Merger, STAR III Merger Sub, as the surviving entity, will continue as our wholly-owned subsidiary. In accordance with the applicable provisions of the MGCL, the separate existence of STAR III ceased.
At the effective time of the STAR III Merger, each issued and outstanding share of STAR III common stock (or a fraction thereof), $0.01 par value per share was converted into 1.430 shares of our common stock.
Each of SIR and STAR III were non-listed REITs sponsored by our sponsor and their external advisors were affiliates of our advisor.
Combined Company
The combined company after the mergers retains the name “Steadfast Apartment REIT, Inc.” Each merger is intended to qualify as a “reorganization” under, and within the meaning of, Section 368(a) of the Internal Revenue Code.
As of the closing of the mergers, our portfolio (unaudited) consisted of (1) 69 properties (including one property held for development) in 14 states, with an average effective rent of $1,173 and (2) a 10% interest in one unconsolidated joint venture that owned 20 multifamily properties with a total of 4,584 apartment homes. Based on occupancy as of December 31, 2019, our portfolio had an occupancy rate of 94.9%, an average age of 20 years and gross real estate assets value of $3,375,635,000 (unaudited).
Amended and Restated Advisory Agreement
Concurrently with the execution of the merger agreements, we and our advisor entered into the Amended and Restated STAR Advisory Agreement, or the Amended STAR Advisory Agreement, which became effective at the effective time of the mergers. Among other things, the Amended STAR Advisory Agreement provided for incentive and performance fees to be paid to our advisor in certain circumstances.
On March 5, 2020, we and our advisor entered into the Amended and Restated STAR Advisory Agreement (the “A&R Advisory Agreement”), which became effective at the effective time of the mergers and the Amended STAR Advisory Agreement described above never took effect. The A&R Advisory Agreement, among other things, removes any incentive fees and performance fees that our advisor would have been entitled to receive under the Amended STAR Advisory Agreement before its election to receive the Class A convertible stock.
The A&R Advisory Agreement also changes the fees structure paid to our advisor following the merger. The fees earned by our advisor pursuant to the A&R Advisory Agreement are more fully described in the table below.
Type of Fee | Combined Company Rates Per A&R Advisory Agreement | ||
Investment Management | 1.0% (50% cash & 50% stock) | ||
Acquisition | 0.5 | % | |
Disposition | 0.5 | % | |
Financing | 0.5 | % | |
Refinancing | 0.5% (all stock) | ||
__________________________
Class A Convertible Stock
In connection with the mergers, we and our advisor exchanged the then outstanding convertible stock for new Class A convertible stock. The Class A convertible stock will be converted into shares of our common stock if (1) we have made total distributions of money or other property by us, SIR and STAR III to their respective holders of common shares (with respect to SIR and STAR III, including in each case distributions paid to SIR and STAR III stockholders prior to the closing of the mergers), which we refer to collectively as the “Class A Distributions,” equal to the original issue price of our shares of common stock, shares of common stock of SIR and shares of common stock of STAR III, or the Common Equity, plus an aggregate 6.0% cumulative, non-compounded, annual return on the original issue price of those shares, (2) we list our common stock for trading on a national securities exchange or enter into a merger whereby holders of our common stock receive listed securities of another issuer or (3) our advisory agreement is terminated or not renewed (other than for “cause” as defined in our advisory agreement), each of the above is referred to as a “Triggering Event.” Upon any of these Triggering Events, each share
71
of Class A convertible stock will be converted into a number of shares of our common stock equal to 1/1000 of the quotient of (A) 15% of the amount, if any, by which (i) the “Class A Enterprise Value” plus the aggregate value of the Class A Distributions paid to date on the Common Equity exceeds (ii) the aggregate purchase price paid by stockholders for the Common Equity plus an aggregated 6.0% cumulative, non-compounded, annual return on the original issue price of the Common Equity as of the date of the Triggering Event, divided by (B) the Class A Enterprise Value divided by the number of our outstanding common shares on an as-converted basis as of the date of Triggering Event. In the event of a termination or non-renewal of our advisory agreement for cause, all of the shares of the Class A convertible stock will be repurchased by us for $1.00.
Payments to our Construction Manager
• | We have entered into construction management agreements with Pacific Coast Land & Construction, Inc., or the construction manager, an affiliate of our sponsor, in connection with capital improvements and renovation or value-enhancement projects for certain of our properties. The construction management fee payable with respect to each property under the construction management agreement ranged from 8.0% to 12.0% of the costs of the improvements for which the construction manager has planning and oversight authority. Generally, each construction management agreement can be terminated by either party with 30 days’ prior written notice to the other party. For the year ended December 31, 2019, we incurred $1,340,387 and paid $1,306,911 of construction management fees to our construction manager. |
• | The construction management agreements also specify that we are to reimburse the construction manager for the salaries and related benefits of certain of its employees for time spent working on capital improvements and renovations. We may also reimburse the construction manager for the salaries and related benefits of certain of its employees for time spent working on capital improvements and renovations. For the year ended December 31, 2019, we incurred and reimbursed labor costs of $467,295 and $487,973, respectively, to our construction manager. |
Other Transactions
• | We deposit amounts with an affiliate of our sponsor to fund a prepaid insurance deductible account to cover the cost of required insurance deductibles across all properties owned by us and other affiliated entities of our sponsor. Upon filing a major claim, proceeds from the insurance deductible account may be used by us or another affiliate of our sponsor. In addition, we deposit amounts with an affiliate of our sponsor to cover the cost of property and property related insurance across certain of our properties. For the year ended December 31, 2019, we incurred and funded $2,301,972 and $2,742,723, respectively, into the prepaid insurance deductible and property insurance accounts to an affiliate of our sponsor and earned and received $0 and $75,000 in insurance proceeds from an affiliate of our sponsor upon filing claims. |
• | We rent apartment homes to an affiliate of our sponsor for use as regional offices. For the year ended December 31, 2019, we earned and received $58,980 of rental revenue from our affiliates. |
• | We entered into a development services agreement with Steadfast Multifamily Development, Inc., an affiliate of our advisor, or the developer, in connection with the Garrison Station development project, pursuant to which the developer will receive a development fee equal to 4% of the hard and soft costs of the development project as specified in the development services agreement and reimbursement for certain expenses for overseeing the development project. 75% of the development fee will be paid in 14 monthly installments and the remaining 25% will be paid upon delivery by the developer to us of a certificate of occupancy. For the year ended December 31, 2019, we incurred $151,071 and paid $100,714 of development services fees to the developer. |
Currently Proposed Transactions
Other than as described above, there are no currently proposed material transactions with related persons other than those covered by the terms of the agreements described above.
Policies and Procedures for Transactions with Related Persons
In order to reduce or eliminate certain potential conflicts of interest, our charter and our advisory agreement contain restrictions and conflict resolution procedures relating to transactions we enter into with our advisor, our directors or their respective affiliates. Each of the restrictions and procedures that apply to transactions with our advisor and its affiliates will also apply to any transaction with any entity or real estate program controlled by our advisor and its affiliates. As a general rule, any related party transaction must be approved by a majority of the directors (including a majority of independent directors) not otherwise interested in the transaction. In determining whether to approve or authorize a particular related party transaction, these persons will consider whether the transaction between us and the related party is fair and reasonable to us and has terms and conditions no less favorable to us than those available from unaffiliated third parties.
72
We have also adopted a Code of Ethics that applies to each of our officers and directors, which we refer to as “covered persons.” The Code of Ethics sets forth certain conflicts of interest policies that limit and govern certain matters among us, the covered persons, our advisor and their respective affiliates.
Director Independence
Although our shares are not listed for trading on any national securities exchange, a majority of the members of our board of directors and all of the members of the audit committee are “independent” as defined by the NYSE. The NYSE standards provide that to qualify as an independent director, in addition to satisfying certain bright-line criteria, the board of directors must affirmatively determine that a director has no material relationship with us (either directly or as a partner, stockholder or officer of an organization that has a relationship with us). In addition, we have determined that these directors are independent pursuant to the definition of independence in our charter, which is based on the definition included in the North American Securities Administrators Association, Inc.’s Statement of Policy Regarding Real Estate Investment Trusts, as revised and adopted on May 7, 2007. Our board of directors has determined that G. Brian Christie, Thomas H. Purcell, Kerry D. Vandell, Ned W. Brines and Stephen R. Bowie each satisfies the bright-line criteria and that none has a relationship with us that would interfere with such person’s ability to exercise independent judgment as a member of our board of directors. None of these directors has ever served as (or is related to) an employee of ours or any of our predecessors or acquired companies or received any compensation from us or any such other entities except for compensation directly related to service as a director. Therefore, we believe that all of these directors are independent directors.
ITEM 14. PRINCIPAL ACCOUNTANT FEES AND SERVICES
Independent Registered Public Accounting Firm
During the years ended December 31, 2019 and 2018, Ernst & Young LLP, or Ernst & Young, served as our independent registered public accounting firm and provided us with certain tax and other services. Ernst & Young has served as our independent auditor since our formation.
Pre-Approval Policies
The audit committee charter imposes a duty on our audit committee to pre-approve all auditing services performed for us by our independent auditors as well as all permitted non-audit services in order to ensure that the provision of such services does not impair the auditors’ independence. In determining whether or not to pre-approve services, our audit committee will consider whether the service is a permissible service under the rules and regulations promulgated by the SEC. Our audit committee, may, in its discretion, delegate to one or more of its members the authority to pre-approve any audit or non-audit services to be performed by the independent auditors, provided any such approval is presented to and approved by the full audit committee at its next scheduled meeting.
All services rendered by Ernst & Young for the years ended December 31, 2019 and 2018 were pre-approved in accordance with the policies and procedures described above.
Principal Independent Registered Public Accounting Firm Fees
Our audit committee reviewed the audit and non-audit services performed by Ernst & Young, as well as the fees charged by Ernst & Young for such services. In its review of the non-audit service fees, our audit committee considered whether the provision of such services is compatible with maintaining the independence of Ernst & Young. The aggregate fees billed to us for professional accounting services, including the audit of our annual financial statements by Ernst & Young for the years ended December 31, 2019 and 2018, are set forth in the table below.
2019 | 2018 | ||||||
Audit fees | $ | 529,125 | $ | 497,652 | |||
Audit-related fees | 208,334 | — | |||||
Tax fees | 120,718 | 111,033 | |||||
All other fees | — | 1,720 | |||||
Total | $ | 858,177 | $ | 610,405 | |||
For purposes of the preceding table, Ernst & Young’s professional fees are classified as follows:
73
• | Audit fees - These are fees for professional services performed for the audit of our annual financial statements and the required review of quarterly financial statements and other procedures performed by Ernst & Young in order for them to be able to form an opinion on our consolidated financial statements. These fees also cover services that are normally provided by independent auditors in connection with statutory and regulatory filings or engagements. |
• | Audit-related fees - These are fees for assurance and related services that traditionally are performed by independent auditors that are reasonably related to the performance of the audit or review of the financial statements, such as due diligence related to acquisitions and dispositions, attestation services that are not required by statute or regulation, internal control reviews and consultation concerning financial accounting and reporting standards. |
• | Tax fees - These are fees for all professional services performed by professional staff in our independent auditor’s tax division, except those services related to the audit of our financial statements. These include fees for tax compliance, tax planning and tax advice, including federal, state and local issues. Services may also include assistance with tax audits and appeals before the Internal Revenue Service and similar state and local agencies, as well as federal, state and local tax issues related to due diligence. |
• | All other fees - These are fees for any services not included in the above-described categories. |
74
PART IV
ITEM 15. EXHIBITS, FINANCIAL STATEMENT SCHEDULES
a. Financial Statement Schedules
See the Index to Financial Statements at page F-1 of this report.
The following financial statement schedule is included herein at page F-41 of this report:
Schedule III - Real Estate Assets and Accumulated Depreciation and Amortization
b. Exhibits
EXHIBIT LIST
Exhibit | Description | ||
2.1 | |||
2.2 | |||
3.1 | |||
3.2 | |||
4.1 | |||
4.2 | |||
4.3 | |||
4.4 | |||
4.5 | |||
4.6 | |||
4.7* | |||
10.1 | |||
10.2 | |||
10.3 | |||
75
10.4 | |||
10.5 | |||
10.6 | |||
10.7 | |||
10.8 | |||
10.9 | |||
10.10 | |||
10.11 | |||
10.12 | |||
10.13 | |||
10.14 | |||
10.15 | |||
10.16 | |||
10.17 | |||
10.18 | |||
10.19 | |||
10.20 | |||
10.21 | |||
76
10.22 | |||
10.23 | |||
10.24 | |||
10.25 | |||
10.26 | |||
10.27 | |||
10.28 | |||
10.29 | |||
10.30 | |||
10.31 | |||
10.32 | |||
10.33 | |||
10.34 | |||
10.35 | |||
10.36 | |||
10.37 | |||
10.38 | |||
10.39 | |||
77
10.40 | |||
10.41 | |||
10.42 | |||
10.43 | |||
10.44 | |||
10.45 | |||
10.46 | |||
10.47 | |||
10.48 | |||
10.49 | |||
10.50 | |||
10.51 | |||
10.52 | |||
78
10.53 | |||
10.54 | |||
10.55 | |||
10.56 | |||
10.57 | |||
10.58 | |||
10.59 | |||
10.60 | |||
10.61 | |||
10.62 | |||
10.63 | |||
10.64 | |||
10.65 | |||
10.66 | |||
10.67 | |||
10.68 | |||
10.69 | |||
10.70 | |||
79
10.71 | |||
10.72 | |||
21.1* | |||
23.1* | |||
31.1* | |||
31.2* | |||
32.1** | |||
32.2** | |||
99.1* | |||
99.2 | |||
101.INS* | XBRL Instance Document | ||
101.SCH* | XBRL Taxonomy Extension Schema Document | ||
101.CAL* | XBRL Taxonomy Extension Calculation Linkbase Document | ||
101.LAB* | XBRL Taxonomy Extension Labels Linkbase Document | ||
101.PRE* | XBRL Taxonomy Extension Presentation Linkbase Document | ||
101.DEF* | XBRL Taxonomy Extension Definition Linkbase Document | ||
____________________________
* | Filed herewith | |||
** | In accordance with Item 601(b)(32) of Regulation S-K, this Exhibit is not deemed “filed” for purposes of Section 18 of the Exchange Act or otherwise subject to the liabilities of that section. Such certifications will not be deemed incorporated by reference into any filing under the Securities Act or the Exchange Act, except to the extent that the registrant specifically incorporates it by reference. | |||
ITEM 16. FORM 10-K SUMMARY
The Company has elected not to provide summary information.
80
STEADFAST APARTMENT REIT, INC.
INDEX TO CONSOLIDATED FINANCIAL STATEMENTS
All other schedules are omitted because they are not applicable or the required information is shown in the financial statements or notes thereto.
F-1
REPORT OF INDEPENDENT REGISTERED PUBLIC ACCOUNTING FIRM
The Board of Directors and Stockholders of
Steadfast Apartment REIT, Inc.
Opinion on the Financial Statements
We have audited the accompanying consolidated balance sheets of Steadfast Apartment REIT, Inc. (the “Company”) as of December 31, 2019 and 2018, the related consolidated statements of operations, stockholders’ equity and cash flows for each of the three years in the period ended December 31, 2019, and the related notes and financial statement schedule listed in the Index at Item 15(a), Schedule III - Real Estate Assets and Accumulated Depreciation and Amortization (collectively referred to as the “consolidated financial statements”). In our opinion, the consolidated financial statements present fairly, in all material respects, the financial position of the Company at December 31, 2019 and 2018, and the results of its operations and its cash flows for each of the three years in the period ended December 31, 2019, in conformity with U.S. generally accepted accounting principles.
Basis for Opinion
These financial statements are the responsibility of the Company’s management. Our responsibility is to express an opinion on the Company’s financial statements based on our audits. We are a public accounting firm registered with the Public Company Accounting Oversight Board (United States) (PCAOB) and are required to be independent with respect to the Company in accordance with the U.S. federal securities laws and the applicable rules and regulations of the Securities and Exchange Commission and the PCAOB.
We conducted our audits in accordance with the standards of the PCAOB. Those standards require that we plan and perform the audit to obtain reasonable assurance about whether the financial statements are free of material misstatement, whether due to error or fraud. The Company is not required to have, nor were we engaged to perform, an audit of its internal control over financial reporting. As part of our audits we are required to obtain an understanding of internal control over financial reporting but not for the purpose of expressing an opinion on the effectiveness of the Company’s internal control over financial reporting. Accordingly, we express no such opinion.
Our audits included performing procedures to assess the risks of material misstatement of the financial statements, whether due to error or fraud, and performing procedures that respond to those risks. Such procedures included examining, on a test basis, evidence regarding the amounts and disclosures in the financial statements. Our audits also included evaluating the accounting principles used and significant estimates made by management, as well as evaluating the overall presentation of the financial statements. We believe that our audits provide a reasonable basis for our opinion.
/s/ Ernst & Young LLP
We have served as the Company’s auditor since 2013.
Irvine, California
March 12, 2020
F-2
STEADFAST APARTMENT REIT, INC.
CONSOLIDATED BALANCE SHEETS
December 31, | |||||||
2019 | 2018 | ||||||
ASSETS | |||||||
Assets: | |||||||
Real Estate: | |||||||
Land | $ | 151,294,208 | $ | 151,294,208 | |||
Building and improvements | 1,369,256,465 | 1,342,307,250 | |||||
Total real estate held for investment, cost | 1,520,550,673 | 1,493,601,458 | |||||
Less accumulated depreciation and amortization | (277,033,046 | ) | (206,006,568 | ) | |||
Total real estate held for investment, net | 1,243,517,627 | 1,287,594,890 | |||||
Real estate held for development | 5,687,977 | — | |||||
Real estate held for sale, net | 21,665,762 | 69,044,852 | |||||
Total real estate, net | 1,270,871,366 | 1,356,639,742 | |||||
Cash and cash equivalents | 74,806,649 | 58,604,804 | |||||
Restricted cash | 73,614,452 | 13,858,768 | |||||
Rents and other receivables | 2,032,774 | 1,836,406 | |||||
Assets related to real estate held for sale | 118,570 | 275,203 | |||||
Other assets | 5,513,315 | 2,923,725 | |||||
Total assets | $ | 1,426,957,126 | $ | 1,434,138,648 | |||
LIABILITIES AND STOCKHOLDERS’ EQUITY | |||||||
Liabilities: | |||||||
Accounts payable and accrued liabilities | $ | 30,265,713 | $ | 30,066,810 | |||
Notes Payable: | |||||||
Mortgage notes payable, net | 560,098,815 | 502,143,306 | |||||
Credit facilities, net | 548,460,230 | 548,012,437 | |||||
Total notes payable, net | 1,108,559,045 | 1,050,155,743 | |||||
Distributions payable | 4,021,509 | 3,953,499 | |||||
Due to affiliates | 7,305,570 | 1,711,168 | |||||
Liabilities related to real estate held for sale | 788,720 | 2,263,468 | |||||
Total liabilities | 1,150,940,557 | 1,088,150,688 | |||||
Commitments and contingencies (Note 9) | |||||||
Redeemable common stock | 1,202,711 | — | |||||
Stockholders’ Equity: | |||||||
Preferred stock, $0.01 par value per share; 100,000,000 shares authorized, no shares issued and outstanding | — | — | |||||
Common stock, $0.01 par value per share; 999,999,000 shares authorized, 52,607,695 and 51,723,801 shares issued and outstanding at December 31, 2019 and 2018, respectively | 526,077 | 517,238 | |||||
Convertible stock, $0.01 par value per share; 1,000 shares authorized, issued and outstanding as of December 31, 2019 and 2018, respectively | 10 | 10 | |||||
Additional paid-in capital | 698,453,981 | 684,140,823 | |||||
Cumulative distributions and net losses | (424,166,210 | ) | (338,670,111 | ) | |||
Total stockholders’ equity | 274,813,858 | 345,987,960 | |||||
Total liabilities and stockholders’ equity | $ | 1,426,957,126 | $ | 1,434,138,648 | |||
See accompanying notes to consolidated financial statements.
F-3
STEADFAST APARTMENT REIT, INC.
CONSOLIDATED STATEMENTS OF OPERATIONS
Year Ended December 31, | |||||||||||
2019 | 2018 | 2017 | |||||||||
Revenues: | |||||||||||
Rental income | $ | 172,445,306 | $ | 167,709,639 | $ | 161,595,441 | |||||
Other income | 1,090,373 | 1,414,549 | 1,441,518 | ||||||||
Total revenues | 173,535,679 | 169,124,188 | 163,036,959 | ||||||||
Expenses: | |||||||||||
Operating, maintenance and management | 43,473,179 | 42,490,381 | 41,133,450 | ||||||||
Real estate taxes and insurance | 25,152,761 | 23,501,730 | 22,745,539 | ||||||||
Fees to affiliates | 25,861,578 | 25,976,226 | 24,343,413 | ||||||||
Depreciation and amortization | 73,781,883 | 70,993,280 | 68,417,556 | ||||||||
Interest expense | 49,273,750 | 44,374,484 | 34,944,073 | ||||||||
General and administrative expenses | 7,440,680 | 6,386,131 | 5,244,554 | ||||||||
Total expenses | 224,983,831 | 213,722,232 | 196,828,585 | ||||||||
Loss before other income (expenses) | (51,448,152 | ) | (44,598,044 | ) | (33,791,626 | ) | |||||
Other income (expenses): | |||||||||||
Gain on sales of real estate, net | 11,651,565 | — | — | ||||||||
Interest income | 865,833 | 271,478 | 20,491 | ||||||||
Insurance proceeds in excess of losses incurred | 448,047 | 201,717 | 147,294 | ||||||||
Loss on debt extinguishment | (41,609 | ) | (4,975,497 | ) | — | ||||||
Total other income (expenses) | 12,923,836 | (4,502,302 | ) | 167,785 | |||||||
Net loss | $ | (38,524,316 | ) | $ | (49,100,346 | ) | $ | (33,623,841 | ) | ||
Loss per common share — basic and diluted | $ | (0.74 | ) | $ | (0.96 | ) | $ | (0.67 | ) | ||
Weighted average number of common shares outstanding — basic and diluted | 52,204,410 | 51,312,947 | 50,358,618 | ||||||||
See accompanying notes to consolidated financial statements.
F-4
STEADFAST APARTMENT REIT, INC.
CONSOLIDATED STATEMENTS OF STOCKHOLDERS’ EQUITY
FOR THE YEARS ENDED DECEMBER 31, 2019, 2018 AND 2017
Common Stock | Convertible Stock | Additional Paid-In Capital | Cumulative Distributions & Net Losses | Total Stockholders’ Equity | ||||||||||||||||||||||
Shares | Amount | Shares | Amount | |||||||||||||||||||||||
BALANCE, December 31, 2016 | 49,698,486 | $ | 496,985 | 1,000 | $ | 10 | $ | 625,996,383 | $ | (164,445,092 | ) | $ | 462,048,286 | |||||||||||||
Issuance of common stock | 1,583,829 | 15,838 | — | — | 23,322,254 | — | 23,338,092 | |||||||||||||||||||
Transfers to redeemable common stock | — | — | — | — | (10,025,412 | ) | — | (10,025,412 | ) | |||||||||||||||||
Repurchase of common stock | (439,675 | ) | (4,397 | ) | — | — | (6,186,340 | ) | — | (6,190,737 | ) | |||||||||||||||
Distributions declared ($0.90 per share of common stock) | — | — | — | — | — | (45,321,063 | ) | (45,321,063 | ) | |||||||||||||||||
Amortization of stock-based compensation | — | — | — | — | 79,858 | — | 79,858 | |||||||||||||||||||
Net loss | — | — | — | — | — | (33,623,841 | ) | (33,623,841 | ) | |||||||||||||||||
BALANCE, December 31, 2017 | 50,842,640 | 508,426 | 1,000 | 10 | 633,186,743 | (243,389,996 | ) | 390,305,183 | ||||||||||||||||||
Issuance of common stock | 1,512,493 | 15,125 | — | — | 22,698,850 | — | 22,713,975 | |||||||||||||||||||
Commissions on sales of common stock and related dealer manager fees to affiliates | — | — | — | — | 32,414 | — | 32,414 | |||||||||||||||||||
Transfers from redeemable common stock | — | — | — | — | 37,028,102 | — | 37,028,102 | |||||||||||||||||||
Repurchase of common stock | (631,332 | ) | (6,313 | ) | — | — | (8,879,903 | ) | — | (8,886,216 | ) | |||||||||||||||
Distributions declared ($0.90 per share of common stock) | — | — | — | — | — | (46,179,769 | ) | (46,179,769 | ) | |||||||||||||||||
Amortization of stock-based compensation | — | — | — | — | 74,617 | — | 74,617 | |||||||||||||||||||
Net loss | — | — | — | — | — | (49,100,346 | ) | (49,100,346 | ) | |||||||||||||||||
BALANCE, December 31, 2018 | 51,723,801 | 517,238 | 1,000 | 10 | 684,140,823 | (338,670,111 | ) | 345,987,960 | ||||||||||||||||||
Issuance of common stock | 1,359,564 | 13,596 | — | — | 21,208,786 | — | 21,222,382 | |||||||||||||||||||
Repurchase of common stock | (475,670 | ) | (4,757 | ) | — | — | (6,966,878 | ) | — | (6,971,635 | ) | |||||||||||||||
Distributions declared ($0.90 per share of common stock) | — | — | — | — | — | (46,971,783 | ) | (46,971,783 | ) | |||||||||||||||||
Amortization of stock-based compensation | — | — | — | — | 71,250 | — | 71,250 | |||||||||||||||||||
Net loss | — | — | — | — | — | (38,524,316 | ) | (38,524,316 | ) | |||||||||||||||||
BALANCE, December 31, 2019 | 52,607,695 | $ | 526,077 | 1,000 | $ | 10 | $ | 698,453,981 | $ | (424,166,210 | ) | $ | 274,813,858 | |||||||||||||
See accompanying notes to consolidated financial statements.
F-5
STEADFAST APARTMENT REIT, INC.
CONSOLIDATED STATEMENTS OF CASH FLOWS
Year ended December 31, | |||||||||||
2019 | 2018 | 2017 | |||||||||
Cash Flows from Operating Activities: | |||||||||||
Net loss | $ | (38,524,316 | ) | $ | (49,100,346 | ) | $ | (33,623,841 | ) | ||
Adjustments to reconcile net loss to net cash provided by operating activities: | |||||||||||
Depreciation and amortization | 73,781,883 | 70,993,280 | 68,417,556 | ||||||||
Loss on disposal of buildings and improvements | 204,344 | 493,941 | 109,321 | ||||||||
Amortization of deferred financing costs | 1,019,355 | 1,056,545 | 1,012,380 | ||||||||
Amortization of stock-based compensation | 71,250 | 74,617 | 79,858 | ||||||||
Change in fair value of interest rate cap agreements | 225,637 | (87,160 | ) | 447,668 | |||||||
Gain on sales of real estate | (11,651,565 | ) | — | — | |||||||
Amortization of loan discount | — | 207,074 | 354,984 | ||||||||
Loss on debt extinguishment | 41,609 | 4,975,497 | — | ||||||||
Insurance claim recoveries | (822,569 | ) | (441,087 | ) | (341,250 | ) | |||||
Changes in operating assets and liabilities: | |||||||||||
Rents and other receivables | (271,366 | ) | (114,341 | ) | (60,878 | ) | |||||
Other assets | 186,991 | (151,179 | ) | 279,756 | |||||||
Accounts payable and accrued liabilities | (327,620 | ) | 6,290,350 | (1,380,056 | ) | ||||||
Due to affiliates | 5,144,622 | (639,916 | ) | (625,107 | ) | ||||||
Net cash provided by operating activities | 29,078,255 | 33,557,275 | 34,670,391 | ||||||||
Cash Flows from Investing Activities: | |||||||||||
Acquisition of real estate held for development | (2,158,815 | ) | — | — | |||||||
Additions to real estate investments | (26,689,336 | ) | (18,049,643 | ) | (26,826,024 | ) | |||||
Additions to real estate held for development | (2,920,469 | ) | — | — | |||||||
Escrow deposits for pending real estate acquisitions | (2,800,300 | ) | (100,000 | ) | — | ||||||
Capitalized acquisition costs related to mergers | (704,298 | ) | — | — | |||||||
Purchase of interest rate cap agreements | (18,000 | ) | (43,200 | ) | (300,000 | ) | |||||
Net proceeds from sales of real estate investments | 57,107,943 | — | — | ||||||||
Proceeds from settlement of interest rate cap agreements | — | 270,000 | — | ||||||||
Proceeds from insurance claims | 897,569 | 441,087 | 341,250 | ||||||||
Net cash provided by (used in) investing activities | 22,714,294 | (17,481,756 | ) | (26,784,774 | ) | ||||||
Cash Flows from Financing Activities: | |||||||||||
Proceeds from issuance of mortgage notes payable | 261,645,000 | 160,850,000 | 197,832,000 | ||||||||
Principal payments on mortgage notes payable | (202,728,946 | ) | (611,459,963 | ) | (289,590 | ) | |||||
Borrowings from credit facilities | — | 562,669,000 | 10,000,000 | ||||||||
Principal payments on credit facilities | — | (56,000,000 | ) | (186,300,000 | ) | ||||||
Payments of commissions on sale of common stock and related dealer manager fees | (228,665 | ) | (229,973 | ) | (234,942 | ) | |||||
Payment of loan financing deposits | (452,300 | ) | — | — | |||||||
Payment of deferred financing costs | (1,573,716 | ) | (4,528,781 | ) | (965,063 | ) | |||||
Payment of debt extinguishment costs | — | (1,019,491 | ) | — | |||||||
Distributions to common stockholders | (25,681,391 | ) | (23,399,025 | ) | (21,884,846 | ) | |||||
Repurchase of common stock | (6,971,635 | ) | (8,886,216 | ) | (6,190,737 | ) | |||||
Net cash provided by (used in) financing activities | 24,008,347 | 17,995,551 | (8,033,178 | ) | |||||||
Net increase (decrease) in cash, cash equivalents and restricted cash | 75,800,896 | 34,071,070 | (147,561 | ) | |||||||
Cash, cash equivalents and restricted cash, beginning of year | 72,738,775 | 38,667,705 | 38,815,266 | ||||||||
Cash, cash equivalents and restricted cash, end of year | $ | 148,539,671 | $ | 72,738,775 | $ | 38,667,705 | |||||
F-6
STEADFAST APARTMENT REIT, INC.
CONSOLIDATED STATEMENTS OF CASH FLOWS (CONTINUED)
Year ended December 31, | |||||||||||
2019 | 2018 | 2017 | |||||||||
Supplemental Disclosures of Cash Flow Information: | |||||||||||
Interest paid (net of capitalized interest of $106,523, $0 and $0, respectively) | $ | 48,080,199 | $ | 41,773,839 | $ | 32,842,583 | |||||
Supplemental Disclosures of Noncash Flow Transactions: | |||||||||||
Distributions payable | $ | 4,021,509 | $ | 3,953,499 | $ | 3,886,730 | |||||
Distributions paid to common stockholders through common stock issuances pursuant to the distribution reinvestment plan | $ | 21,222,382 | $ | 22,713,975 | $ | 23,338,092 | |||||
Redeemable common stock | $ | 1,202,711 | $ | — | $ | 36,397,062 | |||||
Redemptions payable | $ | 797,289 | $ | 2,000,000 | $ | 2,631,038 | |||||
Accounts payable and accrued liabilities from additions to real estate investments | $ | 1,013,254 | $ | 838,202 | $ | 1,779,899 | |||||
Due to affiliates from additions to real estate investments | $ | 128,536 | $ | 41,091 | $ | 188,175 | |||||
Accounts payable & accrued liabilities from capitalized acquisition costs related to the mergers | $ | 925,748 | $ | — | $ | — | |||||
Accounts payable & accrued liabilities from additions to real estate held for development | $ | 293,325 | $ | — | $ | — | |||||
Due to affiliates for commissions on sale of common stock and related dealer manager fees | $ | 71,288 | $ | 299,952 | $ | 562,339 | |||||
Restricted cash held as substitution deposit for MCFA from proceeds from sales of real estate investments | $ | 36,740,983 | $ | — | $ | — | |||||
Operating lease right-of-use asset, net | $ | 32,917 | $ | — | $ | — | |||||
Operating lease liabilities, net | $ | 35,413 | $ | — | $ | — | |||||
See accompanying notes to consolidated financial statements.
F-7
STEADFAST APARTMENT REIT, INC.
NOTES TO CONSOLIDATED FINANCIAL STATEMENTS
DECEMBER 31, 2019
1. Organization and Business
Steadfast Apartment REIT, Inc. (the “Company”) was formed on August 22, 2013, as a Maryland corporation that elected to qualify as a real estate investment trust (“REIT”) commencing with the taxable year ended December 31, 2014. On September 3, 2013, the Company was initially capitalized with the sale of 13,500 shares of common stock to Steadfast REIT Investments, LLC (the “Sponsor”) at a purchase price of $15.00 per share for an aggregate purchase price of $202,500. Steadfast Apartment Advisor, LLC (the “Advisor”), a Delaware limited liability company formed on August 22, 2013, invested $1,000 in the Company in exchange for 1,000 shares of non-participating, non-voting convertible stock (the “Convertible Stock”) as described in Note 6 (Stockholders’ Equity).
The Company owns and operates a diverse portfolio of multifamily properties located in targeted markets throughout the United States. As of December 31, 2019, the Company owned 32 multifamily properties comprising a total of 11,195 apartment homes and one parcel of land held for the development of apartment homes. The Company may acquire additional multifamily properties or pursue multifamily developments in the future. For more information on the Company’s real estate portfolio, see Note 3 (Real Estate).
Public Offering
On December 30, 2013, the Company commenced its initial public offering to offer a maximum of 66,666,667 shares of common stock for sale to the public at an initial price of $15.00 per share (with discounts available for certain categories of purchasers) (the “Primary Offering”). The Company also registered up to 7,017,544 shares of common stock for sale pursuant to the Company’s distribution reinvestment plan (the “DRP,” and together with the Primary Offering, the “Public Offering”) at an initial price of $14.25 per share. The Company terminated its Public Offering on March 24, 2016, but continues to offer shares of common stock pursuant to the DRP. As of the termination of the Primary Offering on March 24, 2016, the Company had sold 48,625,651 shares of common stock in the Public Offering for gross proceeds of $724,849,631, including 1,011,561 shares of common stock issued pursuant to the DRP for gross offering proceeds of $14,414,752. As of December 31, 2019, the Company had issued 54,276,237 shares of common stock for gross offering proceeds of $809,562,356, including 6,662,210 shares of common stock issued pursuant to the DRP for gross offering proceeds of $99,127,477.
On February 14, 2017, the Company’s board of directors determined an estimated value per share of the Company’s common stock of $14.85 as of December 31, 2016. On March 14, 2018, the Company’s board of directors determined an estimated value per share of the Company’s common stock of $15.18 as of December 31, 2017. On March 12, 2019, the Company’s board of directors determined an estimated value per share of the Company’s common stock of $15.84 as of December 31, 2018. In connection with the determination of an estimated value per share, the Company’s board of directors determined a price per share for the DRP of $14.85, $15.18 and $15.84, effective March 1, 2017, April 1, 2018 and April 1, 2019, respectively. The Company’s board of directors may again, from time to time, in its sole discretion, change the price at which the Company offers shares pursuant to the DRP to reflect changes in the Company’s estimated value per share and other factors that the Company’s board of directors deems relevant.
The business of the Company is externally managed by the Advisor, pursuant to the Amended and Restated Advisory Agreement dated December 13, 2013, by and among the Company, Steadfast Apartment REIT Operating Partnership, L.P. (the “Operating Partnership”) and the Advisor (as may be amended, the “Advisory Agreement”). The Advisory Agreement is subject to annual renewal by the Company’s board of directors. In connection with the closing of the Mergers (defined and discussed below), the Company and the Advisor entered into an Amended and Restated Advisory Agreement dated March 6, 2020. The current term of the Advisory Agreement expires on March 6, 2021. Subject to certain restrictions and limitations, the Advisor manages the Company’s day-to-day operations, manages the Company’s portfolio of properties, sources and presents investment opportunities to the Company’s board of directors and provides investment management services on the Company’s behalf. The Advisor has also entered into an Advisory Services Agreement with Crossroads Capital Advisors, LLC (“Crossroads Capital Advisors”), whereby Crossroads Capital Advisors provides certain advisory services to the Company on behalf of the Advisor. Stira Capital Markets Group, LLC (formerly known as Steadfast Capital Markets Group, LLC) (the “Dealer Manager”), an affiliate of the Advisor, served as the dealer manager for the Public Offering. The Dealer Manager was responsible for marketing the Company’s shares of common stock offered pursuant to the Public Offering. The Advisor, along with the Dealer Manager, provides marketing, investor relations and other administrative services on the Company’s behalf.
F-8
STEADFAST APARTMENT REIT, INC.
NOTES TO CONSOLIDATED FINANCIAL STATEMENTS - CONTINUED
DECEMBER 31, 2019
Substantially all of the Company’s business is conducted through the Operating Partnership. The Company is the sole general partner of the Operating Partnership. The Company and Steadfast Apartment REIT Limited Partner, LLC, a Delaware limited liability company and a wholly-owned subsidiary of the Company, entered into the Limited Partnership Agreement of Steadfast Apartment REIT Operating Partnership L.P. on September 3, 2013 (as amended, the “Partnership Agreement”).
As the Company accepted subscriptions for shares of its common stock, the Company transferred substantially all of the net offering proceeds from its Public Offering to the Operating Partnership as a contribution in exchange for partnership interests and the Company’s percentage ownership in the Operating Partnership increased proportionately. The Partnership Agreement provides that the Operating Partnership is operated in a manner that will enable the Company to (1) satisfy the requirements for being classified as a REIT for tax purposes, (2) avoid any federal income or excise tax liability and (3) ensure that the Operating Partnership will not be classified as a “publicly traded partnership” for purposes of Section 7704 of the Internal Revenue Code of 1986, as amended (the “Internal Revenue Code”), which classification could result in the Operating Partnership being taxed as a corporation. In addition to the administrative and operating costs and expenses incurred by the Operating Partnership in acquiring and operating real properties, the Operating Partnership pays all of the Company’s administrative costs and expenses, and such expenses are treated as expenses of the Operating Partnership.
Merger with Steadfast Income REIT, Inc.
On August 5, 2019, the Company, Steadfast Income REIT, Inc. (“SIR”), the Operating Partnership, the operating partnership of SIR and SI Subsidiary, LLC, a wholly-owned subsidiary of the Company (“SIR Merger Sub”) entered into an Agreement and Plan of Merger (the “SIR Merger Agreement”). Pursuant to the terms and conditions of the SIR Merger Agreement, on March 6, 2020, SIR merged with and into SIR Merger Sub with SIR Merger Sub surviving the merger (the “SIR Merger”). Following the SIR Merger, SIR Merger Sub, as the surviving entity, will continue as the Company’s wholly-owned subsidiary. In accordance with the applicable provisions of the Maryland General Corporation Law (“MGCL”), the separate existence of SIR ceased.
At the effective time of the SIR Merger, each issued and outstanding share of SIR common stock (or a fraction thereof), $0.01 par value per share converted into 0.5934 shares of the Company’s common stock.
Merger with Steadfast Apartment REIT III, Inc.
On August 5, 2019, the Company, Steadfast Apartment REIT III, Inc. (“STAR III”), the Operating Partnership, the operating partnership of STAR III and SIII Subsidiary, LLC, a wholly-owned subsidiary of the Company (“STAR III Merger Sub”) entered into an Agreement and Plan of Merger (the “STAR III Merger Agreement”). Pursuant to the terms and conditions of the STAR III Merger Agreement, on March 6, 2020, STAR III merged with and into STAR III Merger Sub with STAR III Merger Sub surviving the merger (the “STAR III Merger”, and together with the SIR Merger, the “Mergers”). Following the STAR III Merger, STAR III Merger Sub, as the surviving entity, will continue as a wholly-owned subsidiary of the Company. In accordance with the applicable provisions of the MGCL, the separate existence of STAR III ceased.
At the effective time of the STAR III Merger, each issued and outstanding share of STAR III common stock (or a fraction thereof), $0.01 par value per share was converted into 1.430 shares of the Company’s common stock.
Combined Company
The combined company after the mergers retains the name “Steadfast Apartment REIT, Inc.” Each merger is intended to qualify as a “reorganization” under, and within the meaning of, Section 368(a) of the Internal Revenue Code.
As of the closing of the mergers, the Company’s portfolio (unaudited) consisted of (1) 69 properties (including one property held for development) in 14 states, with an average effective rent of $1,173 and (2) a 10% interest in one unconsolidated joint venture that owned 20 multifamily properties with a total of 4,584 apartment homes. Based on occupancy as of December 31, 2019, the Company’s portfolio had an occupancy rate of 94.9%, an average age of 20 years and gross real estate assets value of $3,375,635,000 (unaudited).
As a result of the completion of the mergers, the Company’s financial information materially changed; however, the financial information included in this Annual Report on Form 10-K reflects only the Company’s stand-alone, historical financial results.
F-9
STEADFAST APARTMENT REIT, INC.
NOTES TO CONSOLIDATED FINANCIAL STATEMENTS - CONTINUED
DECEMBER 31, 2019
2. Summary of Significant Accounting Policies
There have been no significant changes to the Company’s accounting policies since it filed its audited financial statements in its Annual Report on Form 10-K for the year ended December 31, 2018, other than the adoption of Accounting Standards Update (“ASU”) 2016-02, as further described below.
Principles of Consolidation and Basis of Presentation
The consolidated financial statements include the accounts of the Company, the Operating Partnership and its subsidiaries. All significant intercompany balances and transactions are eliminated in consolidation. The financial statements of the Company’s subsidiaries are prepared using accounting policies consistent with those of the Company.
The accompanying consolidated financial statements are prepared in accordance with U.S. generally accepted accounting principles (“GAAP”) as contained within the Financial Accounting Standards Board (“FASB”), Accounting Standards Codification (“ASC”) and the rules and regulations of the SEC. Square footage, occupancy and certain other measures used to describe real estate included in the notes to the consolidated financial statements are presented on an unaudited basis.
Use of Estimates
The preparation of the consolidated financial statements in conformity with GAAP requires the Company to make estimates and assumptions that affect the amounts reported in the consolidated financial statements and accompanying notes. Actual results could materially differ from those estimates.
Real Estate Assets
Depreciation and Amortization
Real estate costs related to the development, construction and improvement of properties are capitalized. Acquisition costs related to business combinations are expensed as incurred. Acquisition costs related to asset acquisitions are capitalized. On January 1, 2017, the Company early adopted ASU 2017-01, Business Combinations (Topic 805): clarifying the definition of a business (“ASU 2017-01”), that clarifies the definition of a business with the objective of adding guidance to assist entities with evaluating whether transactions should be accounted for as acquisitions (or disposals) of businesses. ASU 2017-01 now forms part of ASC 805, Business Combinations (“ASC 805”). Repair and maintenance and tenant turnover costs are charged to expense as incurred and significant replacements and betterments are capitalized. Repair and maintenance and tenant turnover costs include all costs that do not extend the useful life of the real estate asset. The Company considers the period of future benefit of an asset to determine its appropriate useful life and anticipates the estimated useful lives of assets by class to be generally as follows:
Buildings | 27.5 years | |
Building improvements | 5-25 years | |
Tenant improvements | Shorter of lease term or expected useful life | |
Tenant origination and absorption costs | Remaining term of related lease | |
Furniture, fixtures, and equipment | 5-10 years | |
Real Estate Purchase Price Allocation
Prior to its adoption of ASU 2017-01, which now forms part of ASC 805, the Company recorded the acquisition of income-producing real estate or real estate that will be used for the production of income as a business combination. All assets acquired and liabilities assumed in a business combination were measured at their acquisition-date fair values. Acquisition costs were expensed as incurred. Upon adoption of ASU 2017-01, the Company records the acquisition of income-producing real estate or real estate that are used for the production of income as an asset acquisition. All assets acquired and liabilities assumed in the asset acquisition are measured at their acquisition date fair values. Acquisition costs are capitalized and allocated between land, buildings and improvements and tenant origination and associated costs on the consolidated balance sheet.
The Company assesses the acquisition-date fair values of all tangible assets, identifiable intangible assets and assumed liabilities using methods similar to those used by independent appraisers (e.g., discounted cash flow analysis) and that utilize appropriate discount and/or capitalization rates and available market information. Estimates of future cash flows are based on a
F-10
STEADFAST APARTMENT REIT, INC.
NOTES TO CONSOLIDATED FINANCIAL STATEMENTS - CONTINUED
DECEMBER 31, 2019
number of factors including historical operating results, known and anticipated trends, and market and economic conditions. The fair value of tangible assets of an acquired property considers the value of the property as if it was vacant.
Intangible assets include the value of in-place leases, which represents the estimated value of the net cash flows of the in-place leases to be realized, as compared to the net cash flows that would have occurred had the property been vacant at the time of acquisition and subject to lease-up.
The Company estimates the value of tenant origination and absorption costs by considering the estimated carrying costs during hypothetical expected lease-up periods, considering current market conditions. In estimating carrying costs, the Company estimates the amount of lost rentals using market rates during the expected lease-up periods.
The Company amortizes the value of in-place leases to expense over the remaining non-cancelable term of the respective leases. Should a tenant terminate its lease, the unamortized portion of the in-place lease value and customer relationship intangibles would be charged to expense in that period.
The Company records above-market and below-market in-place lease values for acquired properties based on the present value (using an interest rate that reflects the risks associated with the leases acquired) of the difference between (1) the contractual amounts to be paid pursuant to the in-place leases and (2) the Company’s estimate of fair market lease rates for the corresponding in-place leases, measured over a period equal to the remaining non-cancelable term of the lease. The Company amortizes any capitalized above-market or below-market lease values as a reduction or increase to rental income over the remaining non-cancelable terms of the respective leases.
The total amount of other intangible assets acquired will be further allocated to in-place lease values and customer relationship intangible values based on the Company’s evaluation of the specific characteristics of each tenant’s lease and its overall relationship with that respective tenant. Characteristics that the Company considers in allocating these values include the nature and extent of existing business relationships with the tenant, growth prospects for developing new business with the tenant, and the tenant’s credit quality and expectations of lease renewals (including those existing under the terms of the lease agreement), among other factors.
Estimates of the fair values of the tangible assets, identifiable intangible assets and assumed liabilities require the Company to make significant assumptions to estimate market lease rates, property-operating expenses, carrying costs during lease-up periods, discount rates, market absorption periods, and the number of years the property will be held for investment. The use of inappropriate assumptions could result in an incorrect valuation of acquired tangible assets, identifiable intangible assets and assumed liabilities, which could impact the amount of the Company’s net income (loss).
Impairment of Real Estate Assets
The Company accounts for its real estate assets in accordance with ASC 360, Property, Plant and Equipment (“ASC 360”). ASC 360 requires the Company to continually monitor events and changes in circumstances that could indicate that the carrying amounts of the Company’s real estate and related intangible assets may not be recoverable. When indicators of potential impairment suggest that the carrying value of real estate and related intangible assets and liabilities may not be recoverable, the Company assesses the recoverability of the assets by estimating whether the Company will recover the carrying value of the asset through its undiscounted future cash flows and its eventual disposition. Based on this analysis, if the Company does not believe that it will be able to recover the carrying value of the real estate and related intangible assets and liabilities, the Company records an impairment loss to the extent that the carrying value exceeds the estimated fair value of the real estate and related intangible assets and liabilities. If any assumptions, projections or estimates regarding an asset changes in the future, the Company may have to record an impairment to reduce the net book value of such individual asset. The Company did not record any impairment loss on its real estate assets during the years ended December 31, 2019, 2018 and 2017.
Revenue Recognition - Operating Leases
On January 1, 2019, the Company adopted the lease accounting standards under ASC 842, Leases (“ASC 842”), including the package of practical expedients for all leases that commenced before the effective date of January 1, 2019. Accordingly, the Company (i) did not reassess whether any expired or existing contracts are or contain leases, (ii) did not reassess the lease classification for any expired or existing lease, and (iii) did not reassess initial direct costs for any existing leases. The Company did not elect the practical expedient related to using hindsight to reevaluate the lease term.
In addition, ASC 842 provides an optional transition method to allow entities to apply the new lease accounting standards at the adoption date and recognize a cumulative-effect adjustment to the opening balance of retained earnings. The Company adopted this transition method upon its adoption of the lease accounting standards of ASC 842, which did not result in a
F-11
STEADFAST APARTMENT REIT, INC.
NOTES TO CONSOLIDATED FINANCIAL STATEMENTS - CONTINUED
DECEMBER 31, 2019
cumulative effect adjustment to the opening balance of retained earnings on January 1, 2019. The Company’s comparative periods presented in the financial statements will continue to be reported under the lease accounting standards of ASC 840, Leases.
In accordance with ASC 842, tenant reimbursements are included in the single lease component of the lease contract (the right of the lessee to use the leased space) and therefore are accounted for as variable lease payments and are recorded as rental income on the Company’s statement of operations beginning January 1, 2019. In addition, the Company adopted the practical expedient available under ASC 842 to not separate nonlease components from the associated lease component and instead to account for those components as a single component if the nonlease components otherwise would be accounted for under the new revenue recognition standard ASC 606, Revenue from Contracts with Customers, and if certain conditions are met, specifically related to tenant reimbursements for common area maintenance which would otherwise be accounted for under the revenue recognition standard. The Company believes the two conditions have been met for tenant reimbursements for common area maintenance as (i) the timing and pattern of transfer of the nonlease components and associated lease components are the same and (ii) the lease component would be classified as an operating lease. Accordingly, tenant reimbursements for common area maintenance are also accounted for as variable lease payments and recorded as rental income on the Company’s statement of operations beginning January 1, 2019. The Company recognized $172,445,306 of rental income related to operating lease payments, of which $17,679,788 was for variable lease payments for the year ended December 31, 2019, respectively.
The Company leases apartment homes under operating leases with terms generally of one year or less. Generally, credit investigations are performed for prospective residents and security deposits are obtained. The Company recognizes minimum rent, including rental abatements, lease incentives and contractual fixed increases attributable to operating leases, on a straight-line basis over the term of the related leases when collectibility is probable and records amounts expected to be received in later years as deferred rent receivable.
Rents and Other Receivables
In accordance with ASC 842, the Company makes a determination of whether the collectibility of the lease payments in an operating lease is probable. If the Company determines the lease payments are not probable of collection, the Company would fully reserve for any contractual lease payments, deferred rent receivable, and variable lease payments and would recognize rental income only if cash is received. The Company exercises judgment in establishing these allowances and considers payment history and current credit status of tenants in developing these estimates. Due to the short-term nature of the operating leases, the Company does not maintain a deferred rent receivable related to the straight-lining of rents. Beginning January 1, 2019, these changes to the Company’s collectibility assessment are reflected as an adjustment to rental income.
Cash and Cash Equivalents
The Company considers all highly liquid investments purchased with an original maturity of three months or less to be cash equivalents. Cash equivalents may include cash and short-term investments. Short-term investments are stated at cost, which approximates fair value. As of December 31, 2019 and 2018, the Company had amounts in excess of federally insured limits in deposit accounts with a financial institution. The Company limits such deposits to financial institutions with high credit standing.
Restricted Cash
Restricted cash represents those cash accounts for which the use of funds is restricted by loan covenants and cash is placed with a qualified intermediary for reinvestment under Section 1031 of the Internal Revenue Code. As of December 31, 2019, the Company had a restricted cash balance of $73,614,452, which includes $36,740,983 in allocated loan amounts held by the lender of the Company’s master credit facility as collateral for two properties sold during the year, $24,720,969 of cash proceeds from the sale of two properties that are being held by qualified intermediaries as of December 31, 2019 and $12,152,500 related to amounts set aside as impounds for future property tax payments, property insurance payments and tenant improvement payments as required by agreements with the Company lenders. As of December 31, 2018, the Company had a restricted cash balance of $13,858,768, which represents amounts set aside as impounds for future property tax payments, property insurance payments and tenant improvement payments as required by agreements with the Company’s lenders. In connection with two property sales completed in 2019, the Company was required to deposit $36,740,983, as collateral for the loan amount allocated in the Company’s master credit facility to the sold properties, $31,749,791 of which was funded from proceeds from the sales of the properties. For more information on the Company’s master credit facility, see Note 5 (Debt).
F-12
STEADFAST APARTMENT REIT, INC.
NOTES TO CONSOLIDATED FINANCIAL STATEMENTS - CONTINUED
DECEMBER 31, 2019
The following table represents the components of the cash, cash equivalents and restricted cash presented on the accompanying consolidated statements of cash flows for the years ended December 31, 2019 and 2018:
December 31, | ||||||||
2019 | 2018 | |||||||
Cash and cash equivalents | $ | 74,806,649 | $ | 58,604,804 | ||||
Restricted cash | 73,614,452 | 13,858,768 | ||||||
Assets related to real estate held for sale | 118,570 | 275,203 | ||||||
Total cash, cash and cash equivalents and restricted cash | $ | 148,539,671 | $ | 72,738,775 | ||||
Deferred Financing Costs
The Company capitalizes deferred financing costs such as commitment fees, legal fees and other third-party costs associated with obtaining commitments for financing that result in a closing of such financing, as a contra liability against the respective outstanding debt balance. The Company amortizes these costs over the terms of the respective financing agreements using the effective interest method. The Company expenses unamortized deferred financing costs when the associated debt is refinanced or repaid before maturity unless specific rules are met that would allow for the carryover of such costs to the refinanced debt. Costs incurred in seeking financing transactions that do not close are expensed in the period in which it is determined that the financing will not close.
Derivative Financial Instruments
The Company accounts for its derivative instruments in accordance with ASC 815, Derivatives and Hedges. The Company’s objective in using derivatives is to add stability to interest expense and to manage the Company’s exposure to interest rate movements or other identified risks. To accomplish these objectives, the Company may use various types of derivative instruments to manage fluctuations in cash flows resulting from interest rate risk attributable to changes in the benchmark interest rate of LIBOR or other applicable benchmark rates.
The Company measures its derivative instruments and hedging activities at fair value and records them as an asset or liability, depending on its rights or obligations under the applicable derivative contract. For derivatives designated as fair value hedges, the changes in the fair value of both the derivative instrument and the hedged items are recorded in earnings. Derivatives used to hedge the exposure to variability in expected future cash flows, or other types of forecasted transactions, are considered cash flow hedges. For derivatives designated as cash flow hedges, the effective portions of changes in fair value of the derivatives are reported in other comprehensive income (loss) and are subsequently reclassified into earnings when the hedged item affects earnings. Changes in fair value of derivative instruments not designated as hedges and ineffective portions of hedges are recognized in earnings in the affected period. The Company assesses the effectiveness of each hedging relationship by comparing the changes in fair value or cash flows of the derivative hedging instrument with the changes in fair value or cash flows of the designated hedged item or transaction.
As of December 31, 2019 and 2018, the Company did not have any derivatives designated as cash flow or fair value hedges, nor are derivatives being used for trading or speculative purposes.
Fair Value Measurements
Under GAAP, the Company is required to measure certain financial instruments at fair value on a recurring basis. In addition, the Company is required to measure other assets and liabilities at fair value on a non-recurring basis (e.g., carrying value of impaired real estate loans receivable and long-lived assets). Fair value is defined as the price that would be received upon the sale of an asset or paid to transfer a liability in an orderly transaction between market participants at the measurement date. The GAAP fair value framework uses a three-tiered approach. Fair value measurements are classified and disclosed in one of the following three categories:
• | Level 1: unadjusted quoted prices in active markets that are accessible at the measurement date for identical assets or liabilities; |
• | Level 2: quoted prices for similar instruments in active markets, quoted prices for identical or similar instruments in markets that are not active, and model-derived valuations in which significant inputs and significant value drivers are observable in active markets; and |
F-13
STEADFAST APARTMENT REIT, INC.
NOTES TO CONSOLIDATED FINANCIAL STATEMENTS - CONTINUED
DECEMBER 31, 2019
• | Level 3: prices or valuation techniques where little or no market data is available that requires inputs that are both significant to the fair value measurement and unobservable. |
When available, the Company utilizes quoted market prices from an independent third-party source to determine fair value and will classify such items in Level 1 or Level 2. In instances where the market is not active, regardless of the availability of a nonbinding quoted market price, observable inputs might not be relevant and could require the Company to make a significant adjustment to derive a fair value measurement. Additionally, in an inactive market, a market price quoted from an independent third party may rely more on models with inputs based on information available only to that independent third party. When the Company determines the market for a financial instrument owned by the Company to be illiquid or when market transactions for similar instruments do not appear orderly, the Company uses several valuation sources (including internal valuations, discounted cash flow analysis and quoted market prices) and will establish a fair value by assigning weights to the various valuation sources.
The following describes the valuation methodologies used by the Company to measure fair value, including an indication of the level in the fair value hierarchy in which each asset or liability is generally classified.
Interest rate cap agreements - The Company has entered into certain interest rate cap agreements. These derivatives are recorded at fair value. Fair value was based on a model-driven valuation using the associated variable rate curve and an implied market volatility, both of which were observable at commonly quoted intervals for the full term of the interest rate cap agreements. Therefore, the Company’s interest rate cap agreements were classified within Level 2 of the fair value hierarchy and are included in other assets in the accompanying consolidated balance sheets. Changes in the fair value of the interest rate cap agreements are recorded as interest expense in the accompanying consolidated statements of operations.
The following tables reflect the Company’s assets required to be measured at fair value on a recurring basis on the consolidated balance sheets:
December 31, 2019 | ||||||||||||
Fair Value Measurements Using | ||||||||||||
Level 1 | Level 2 | Level 3 | ||||||||||
Assets: | ||||||||||||
Interest rate cap agreements | $ | — | $ | 132 | $ | — | ||||||
December 31, 2018 | ||||||||||||
Fair Value Measurements Using | ||||||||||||
Level 1 | Level 2 | Level 3 | ||||||||||
Assets: | ||||||||||||
Interest rate cap agreements | $ | — | $ | 207,769 | $ | — | ||||||
Changes in assumptions or estimation methodologies can have a material effect on these estimated fair values. In this regard, the derived fair value estimates cannot be substantiated by comparison to independent markets and, in many cases, may not be realized in an immediate settlement of the instrument.
Fair Value of Financial Instruments
The accompanying consolidated balance sheets include the following financial instruments: cash and cash equivalents, restricted cash, rents and other receivables, accounts payable and accrued liabilities, distributions payable, due to affiliates and notes payable.
The Company considers the carrying value of cash and cash equivalents, restricted cash, rents and other receivables, accounts payable and accrued liabilities and distributions payable to approximate the fair value of these financial instruments based on the short duration between origination of the instruments and their expected realization. The fair value of amounts due to affiliates is not determinable due to the related party nature of such amounts. The Company has determined that its notes payable, net are classified as Level 3 within the fair value hierarchy.
F-14
STEADFAST APARTMENT REIT, INC.
NOTES TO CONSOLIDATED FINANCIAL STATEMENTS - CONTINUED
DECEMBER 31, 2019
The fair value of the notes payable, net is estimated using a discounted cash flow analysis using borrowing rates available to the Company for debt instruments with similar terms and maturities. As of December 31, 2019 and 2018, the fair value of the notes payable was $1,153,445,768 and $1,042,358,884, respectively, compared to the carrying value of $1,108,559,045 and $1,050,155,743, respectively.
Accounting for Stock-Based Compensation
The Company amortizes the fair value of stock-based compensation awards to expense over the vesting period and records any dividend equivalents earned as dividends for financial reporting purposes. Stock-based compensation awards are valued at the fair value on the date of grant and amortized as an expense over the vesting period.
Distribution Policy
The Company elected to be taxed, and currently qualifies, as a REIT commencing with the taxable year ended December 31, 2014. To maintain its qualification as a REIT, the Company intends to make distributions each taxable year equal to at least 90% of its REIT taxable income (which is determined without regard to the dividends-paid deduction or net capital gain and which does not necessarily equal net income as calculated in accordance with GAAP). Distributions declared during the year ended December 31, 2019, were based on daily record dates and calculated at a rate of $0.002466 per share per day during the period from January 1, 2019 to December 31, 2019.
Distributions to stockholders are determined by the board of directors of the Company and are dependent upon a number of factors relating to the Company, including funds available for the payment of distributions, financial condition, the timing of property acquisitions, capital expenditure requirements and annual distribution requirements in order for the Company to qualify as a REIT under the Internal Revenue Code. During the years ended December 31, 2019 and 2018, the Company declared distributions totaling $0.900 and $0.900 per share of common stock, respectively.
Operating Expenses
Pursuant to the Company’s Articles of Amendment and Restatement (the “Charter”), the Company is limited in the amount of certain operating expenses it may record on a rolling four-quarter basis to the greater of 2% of average invested assets and 25% of net income. Operating expenses include all costs and expenses incurred by the Company, as determined under GAAP, that in any way are related to the operation of the Company, excluding expenses of raising capital, interest payments, taxes, property operating expenses, non-cash expenditures, incentive fees, acquisition fees and expenses and investment management fees. During the four quarters ended December 31, 2019, the Company recorded operating expenses of $6,156,934, which includes $1,826,725 incurred by the Advisor and affiliates of the Company, on behalf of the Company, none of which was in excess of the 2%/25% limitation, and are included in general and administrative expenses in the accompanying consolidated statements of operations. Operating expenses of $463,301 remain payable and are included in due to affiliates in the accompanying consolidated balance sheet as of December 31, 2019.
Income Taxes
The Company elected to be taxed, and currently qualifies, as a REIT under the Internal Revenue Code and has operated as such commencing with the taxable year ended December 31, 2014. To qualify as a REIT, the Company must meet certain organizational and operational requirements, including the requirement to distribute at least 90% of the Company’s annual REIT taxable income to stockholders (which is computed without regard to the dividends-paid deduction or net capital gain and which does not necessarily equal net income as calculated in accordance with GAAP). As a REIT, the Company generally will not be subject to federal income tax to the extent it distributes qualifying dividends to its stockholders. If the Company fails to qualify as a REIT in any taxable year, it would be subject to federal income tax on its taxable income at regular corporate income tax rates and generally would not be permitted to qualify for treatment as a REIT for federal income tax purposes for the four taxable years following the year during which qualification is lost, unless the Internal Revenue Service grants the Company relief under certain statutory provisions. Such an event could materially and adversely affect the Company’s net income and net cash available for distribution to stockholders. However, the Company believes it is organized and operates in such a manner as to qualify for treatment as a REIT.
The Company follows ASC 740, Income Taxes, to recognize, measure, present and disclose in its accompanying consolidated financial statements uncertain tax positions that the Company has taken or expects to take on a tax return. As of December 31, 2019 and 2018, the Company had no liabilities for uncertain tax positions that it believes should be recognized in its accompanying consolidated financial statements. Due to uncertainty regarding the realization of certain deferred tax assets, the Company has established valuation allowances, primarily in connection with the net operating loss carryforwards related to
F-15
STEADFAST APARTMENT REIT, INC.
NOTES TO CONSOLIDATED FINANCIAL STATEMENTS - CONTINUED
DECEMBER 31, 2019
the Company. The Company has not been assessed material interest or penalties by any major tax jurisdictions. The Company’s evaluations were performed for all open tax years ended December 31, 2019. As of December 31, 2019, the Company’s tax return for calendar year 2018, 2017 and 2016 remain subject to examination by major tax jurisdictions.
Per Share Data
Basic loss per share attributable to common stockholders for all periods presented are computed by dividing net loss by the weighted average number of shares of the Company’s common stock outstanding during the period. Diluted loss per share is computed based on the weighted average number of shares of the Company’s common stock and all potentially dilutive securities, if any. Distributions declared per common share assume each share was issued and outstanding each day during the period. Nonvested shares of the Company’s restricted common stock and convertible stock give rise to potentially dilutive shares of the Company’s common stock but such shares were excluded from the computation of diluted earnings per share because such shares were anti-dilutive during the period.
Segment Disclosure
The Company has determined that it has one reportable segment with activities related to investing in multifamily properties. The Company’s investments in real estate are in different geographic regions, and management evaluates operating performance on an individual asset level. However, as each of the Company’s assets has similar economic characteristics, tenants and products and services, its assets have been aggregated into one reportable segment.
Reclassifications
Certain amounts in the Company’s prior period consolidated financial statements were reclassified to conform to the current period presentation. These reclassifications did not change the results of operations of prior periods. On January 1, 2019, the Company adopted ASU 2016-02, as further described below. As a result, all income earned pursuant to tenant leases is reflected as one line item “Rental Income,” in the consolidated statements of operations. To facilitate comparability, the Company has reclassified the prior period’s lease and non-lease income consistently with the current periods presented.
The table below provides a reconciliation of the prior period presentation of the income statement line items that were reclassified in the Company’s consolidated statements of operations to conform to the current period presentation, pursuant to the adoption of the new lease accounting standard and election of the single component practical expedient:
Year Ended December 31, | ||||||||
2018 | 2017 | |||||||
Rental income (presentation prior to January 1, 2019) | $ | 150,900,039 | $ | 146,032,596 | ||||
Tenant reimbursements(1) (presentation prior to January 1, 2019) | 16,809,600 | 15,562,845 | ||||||
Rental income (presentation effective January 1, 2019) | $ | 167,709,639 | $ | 161,595,441 | ||||
_________________
(1) Tenant reimbursements include reimbursements for recoverable costs.
Recent Accounting Pronouncements
In February 2016, the FASB established ASC Topic 842, Leases (“ASC 842”), by issuing ASU 2016-02, which requires lessees to recognize right-of-use assets and lease liabilities for operating leases on the balance sheet and disclose key information about leasing arrangements. ASC 842 also makes targeted changes to lessor accounting. ASC 842 was subsequently amended by ASU 2018-01, Land Easement Practical Expedient for Transition to Topic 842 (“ASU 2018-01”), ASU 2018-10, Codification Improvements to Topic 842 (“ASU 2018-10”), ASU 2018-11, Targeted Improvements (“ASU 2018-11”) and ASU 2018-20, Leases (Topic 842), Narrow-scope Improvements for Lessors (“ASU 2018-20”). ASC 842 requires a modified retrospective transition approach that was effective in the first quarter of 2019, subject to early adoption. The Company elected an optional transition method that allows entities to initially apply ASC 842 at the adoption date (January 1, 2019) and recognize a cumulative-effect adjustment to the opening balance of retained earnings in the period of adoption. The Company evaluated the impact of ASC 842 on its leases both as it relates to the Company acting as a lessee and as a lessor. As it relates to the Company as lessor, see our revenue recognition policy above.
As it relates to the Company as a lessee, the Company elected to apply each of the practical expedients described in ASC 842-10-65-1(f) that allowed the Company, among other things, to not reassess lease classification conclusions or initial direct
F-16
STEADFAST APARTMENT REIT, INC.
NOTES TO CONSOLIDATED FINANCIAL STATEMENTS - CONTINUED
DECEMBER 31, 2019
cost accounting as of December 31, 2018, therefore these leases continue to be accounted for as operating leases. The Company also elected the practical expedient described in ASC 842-20-25-2 not to apply the recognition requirements in ASC 842 to short-term leases and instead, to recognize lease payments in the consolidated statement of operations on a straight-line basis over the lease term. The Company did not experience a material impact on the recognition of leases in the consolidated financial statements because the quantity of leased equipment by the Company is limited and immaterial to the consolidated financial statements. Upon adoption, the Company recognized an initial operating lease right-of-use asset, net, of $7,656 and an operating lease liability, net, of $7,720.
In June 2016, the FASB issued ASU 2016-13, Financial Instruments-Credit Losses (“ASU 2016-13”). ASU 2016-13 requires more timely recording of credit losses on loans and other financial instruments that are not accounted for at fair value through net income (loss), including loans held for investment, held-to-maturity debt securities, trade and other receivables, net investment in leases and other such commitments. ASU 2016-13 requires that financial assets measured at amortized cost be presented at the net amount expected to be collected, through an allowance for credit losses that is deducted from the amortized cost basis. The amendments in ASU 2016-13 require the Company to measure all expected credit losses based upon historical experience, current conditions, and reasonable and supportable forecasts that affect the collectability of the financial assets and eliminates the “incurred loss” methodology in current GAAP. In November 2018, the FASB issued ASU 2018-19, Codification Improvements to Topic 326, Financial Instruments - Credit Losses (“ASU 2018-19”), which clarifies that operating lease receivables accounted for under ASC 842 Leases, are not in the scope of the new credit losses guidance. The effective date and transition requirements for this guidance are the same as for ASU 2016-13. ASU 2016-13 is effective for annual periods beginning after December 15, 2019, including interim periods within those fiscal years. Early adoption is permitted for annual periods beginning after December 15, 2018, including interim periods within those fiscal years. Based on its evaluation, the Company does not expect a material impact on its consolidated financial statements and related disclosures from the adoption of ASU 2016-13 because the only financial assets that are within the scope of this guidance are rents and other receivables, which materially pertain to operating lease receivables, that are specifically excluded from ASU 2016-13.
In August 2018, the FASB issued ASU 2018-13, Fair Value Measurement (Topic 820): Disclosure Framework-Changes to the Disclosure Requirements for Fair Value Measurement (“ASU 2018-13”). The FASB issued ASU 2018-13 to improve the effectiveness of fair value measurement disclosures by adding, eliminating, and modifying certain disclosure requirements. The issuance of ASU 2018-13 is part of a disclosure framework project. The disclosure framework project’s objective and primary focus are to improve the effectiveness of disclosures in the notes to financial statements by facilitating clear communication of the information required by GAAP that is most important to users of each entity’s financial statements. Achieving the objective of improving the effectiveness of the notes to financial statements includes: (1) the development of a framework that promotes consistent decisions by the FASB board about disclosure requirements and (2) the appropriate exercise of discretion by reporting entities. The amendments in ASU 2018-13 modify the disclosure requirements on fair value measurements in Topic 820, Fair Value Measurement, based on the concepts in FASB Concepts Statement, Conceptual Framework for Financial Reporting-Chapter 8: Notes to Financial Statements, including the consideration of costs and benefits. ASU 2018-13 removed certain disclosure requirements under Topic 820 such as the disclosure requirements of the valuation process for level 3 fair value measurements and modified and added certain of the disclosure requirements in Topic 820. ASU 2018-13 requires prospective and retrospective application depending on the amendment and is effective for annual periods beginning after December 15, 2019, including interim periods within those fiscal years. Early adoption is permitted. The Company is currently evaluating the impact ASU 2018-13 will have on its consolidated financial statements and related disclosures and believes that certain disclosures of interest rate cap agreements in its consolidated financial statements may be impacted by the adoption of ASU 2018-13.
3. Real Estate
As of December 31, 2019, the Company owned 32 multifamily properties comprising a total of 11,195 apartment homes and one parcel of land held for the development of apartment homes. The total contract acquisition price of the Company’s real estate portfolio was $1,451,454,728, including development costs. As of December 31, 2019 and 2018, the Company’s portfolio was approximately 94.6% and 93.9% occupied and the average monthly rent was $1,200 and $1,163, respectively.
F-17
STEADFAST APARTMENT REIT, INC.
NOTES TO CONSOLIDATED FINANCIAL STATEMENTS - CONTINUED
DECEMBER 31, 2019
As of December 31, 2019 and 2018, accumulated depreciation and amortization related to the Company’s consolidated real estate properties were as follows:
December 31, 2019 | ||||||||||||||||||||
Assets | ||||||||||||||||||||
Land | Building and Improvements(1) | Total Real Estate Held for Investment | Real Estate Under Development | Real Estate Held for Sale | ||||||||||||||||
Investments in real estate | $ | 151,294,208 | $ | 1,369,256,465 | $ | 1,520,550,673 | $ | 5,687,977 | $ | 27,285,576 | ||||||||||
Less: Accumulated depreciation and amortization | — | (277,033,046 | ) | (277,033,046 | ) | — | (5,619,814 | ) | ||||||||||||
Net investments in real estate and related lease intangibles | $ | 151,294,208 | $ | 1,092,223,419 | $ | 1,243,517,627 | $ | 5,687,977 | $ | 21,665,762 | ||||||||||
____________________
(1) | During the year ended December 31, 2019, the Company capitalized $1,630,046 of costs related to the mergers with SIR and STAR III, included in building and improvements in the accompanying consolidated balance sheets (described further below). |
December 31, 2018 | ||||||||||||||||||||
Assets | ||||||||||||||||||||
Land | Building and Improvements | Total Real Estate | Real Estate Under Development | Real Estate Held for Sale | ||||||||||||||||
Investments in real estate | $ | 151,294,208 | $ | 1,342,307,250 | $ | 1,493,601,458 | $ | — | $ | 81,710,446 | ||||||||||
Less: Accumulated depreciation and amortization | — | (206,006,568 | ) | (206,006,568 | ) | — | (12,665,594 | ) | ||||||||||||
Net investments in real estate and related lease intangibles | $ | 151,294,208 | $ | 1,136,300,682 | $ | 1,287,594,890 | $ | — | $ | 69,044,852 | ||||||||||
Depreciation and amortization expense was $73,781,883, $70,993,280 and $68,417,556 for the years ended December 31, 2019, 2018 and 2017, respectively.
Depreciation of the Company’s buildings and improvements was $73,780,075, $70,993,280 and $67,407,444 for the years ended December 31, 2019, 2018 and 2017, respectively.
Amortization of the Company’s tenant origination and absorption costs was $0, $0 and $1,010,112 for the years ended December 31, 2019, 2018 and 2017, respectively. Tenant origination and absorption costs had a weighted-average amortization period as of the date of acquisition of less than one year. As of March 31, 2017, all tenant origination and absorption costs were fully amortized and written off.
Real Estate Under Development
During the year ended December 31, 2019, the Company acquired the following land held for the development of apartment homes:
Development Name | Location | Purchase Date | Land Held for Development | Construction in Progress | Total Carrying Value | |||||||||||
Garrison Station | Murfreesboro, TN | 5/30/2019 | $ | 2,469,183 | $ | 3,218,794 | $ | 5,687,977 | ||||||||
Capitalized Acquisition Costs Related to the Then-Pending Mergers with SIR and STAR III
The SIR Merger and STAR III Merger are each accounted for as an asset acquisition. In accordance with the asset acquisition method of accounting, costs incurred to acquire the asset are capitalized as part of the acquisition price. Upon
F-18
STEADFAST APARTMENT REIT, INC.
NOTES TO CONSOLIDATED FINANCIAL STATEMENTS - CONTINUED
DECEMBER 31, 2019
signing both the SIR Merger Agreement and the STAR III Merger Agreement on August 5, 2019, the SIR Merger and STAR III Merger were considered probable of occurring, at which point the Company began to capitalize the merger related acquisition costs to building and improvements in the accompanying consolidated balance sheets. Prior to such date, the merger related acquisition costs were expensed to general and administrative expenses in the accompanying consolidated statements of operations.
Operating Leases
As of December 31, 2019, the Company’s real estate portfolio comprised 11,195 residential apartment homes and was 96.0% leased by a diverse group of residents. The residential lease terms consist of lease durations equal to twelve months or less.
Some residential leases contain provisions to extend the lease agreements, options for early termination after paying a specified penalty and other terms and conditions as negotiated. The Company retains substantially all of the risks and benefits of ownership of the real estate assets leased to tenants. Generally, upon the execution of a lease, the Company requires security deposits from tenants in the form of a cash deposit. Amounts required as security deposits vary depending upon the terms of the respective leases and the creditworthiness of the tenant, but generally are not significant amounts. Therefore, exposure to credit risk exists to the extent that a receivable from a tenant exceeds the amount of its security deposit. Security deposits received in cash related to tenant leases are included in accounts payables and accrued liabilities in the accompanying consolidated balance sheets and totaled $4,351,837 and $4,130,860 as of December 31, 2019 and 2018, respectively.
As of December 31, 2019 and 2018, no tenant represented over 10% of the Company’s annualized base rent.
2019 Property Dispositions
Randall Highlands Apartments
On March 31, 2015, the Company, through an indirect wholly-owned subsidiary, acquired Randall Highlands Apartments, a multifamily property located in North Aurora, Illinois, containing 146 apartment homes. The purchase price of Randall Highlands Apartments was $32,115,000, exclusive of closing costs. On September 26, 2019, the Company sold Randall Highlands Apartments for $31,000,000, resulting in a gain of $3,329,078, which includes reductions to the net book value of the property due to historical depreciation and amortization expense. The purchaser of Randall Highlands Apartments is not affiliated with the Company or the Advisor.
Club at Summer Valley
On August 28, 2014, the Company, through an indirect wholly-owned subsidiary, acquired Club at Summer Valley, a multifamily property located in Austin, Texas, containing 260 apartment homes. The purchase price of Club at Summer Valley was $21,500,000, exclusive of closing costs. On December 27, 2019, the Company sold Club at Summer Valley for $28,100,000, resulting in a gain of $8,322,487, which includes reductions to the net book value of the property due to historical depreciation and amortization expense. The purchaser of Club at Summer Valley was not affiliated with the Company or the Advisor.
F-19
STEADFAST APARTMENT REIT, INC.
NOTES TO CONSOLIDATED FINANCIAL STATEMENTS - CONTINUED
DECEMBER 31, 2019
The results of operations for the years ended December 31, 2019, 2018 and 2017, through the dates of sale for Randall Highlands Apartments and Club at Summer Valley, were included in continuing operations on the Company’s consolidated statements of operations and are as follows:
Year Ended December 31, | |||||||||||
2019 | 2018 | 2017 | |||||||||
Revenues: | |||||||||||
Rental income | $ | 5,286,118 | $ | 6,023,145 | $ | 5,920,141 | |||||
Other income | 31,948 | 21,334 | 37,274 | ||||||||
Total revenues | 5,318,066 | 6,044,479 | 5,957,415 | ||||||||
Expenses: | |||||||||||
Operating, maintenance and management | 1,472,787 | 1,672,252 | 1,613,247 | ||||||||
Real estate taxes and insurance | 1,177,087 | 1,390,246 | 1,268,383 | ||||||||
Fees to affiliates | 277,437 | 255,045 | 231,384 | ||||||||
Depreciation and amortization | 1,617,604 | 2,251,678 | 2,143,607 | ||||||||
Interest expense | — | 827,862 | 1,146,313 | ||||||||
General and administrative expenses | 37,127 | 36,585 | 30,058 | ||||||||
Total expenses | 4,582,042 | 6,433,668 | 6,432,992 | ||||||||
Total income (loss) | $ | 736,024 | $ | (389,189 | ) | $ | (475,577 | ) | |||
Real Estate Held for Sale
Terrace Cove Apartment Homes
As of December 31, 2019, Terrace Cove Apartment Homes, a multifamily property located in Austin, Texas, met all the criteria to be classified as held for sale. Terrace Cove Apartment Homes was sold on February 5, 2020 to an unaffiliated buyer. See Note 12 (Subsequent Events). The real estate, other assets, mortgage notes and other liabilities related to Terrace Cove Apartment Homes are disclosed separately for the periods presented in the accompanying consolidated balance sheets.
The results of operations from Terrace Cove Apartment Homes for the years ended December 31, 2019, 2018 and 2017, which are summarized in the following table, were included in continuing operations on the Company’s consolidated statements of operations.
Year Ended December 31, | |||||||||||
2019 | 2018 | 2017 | |||||||||
Revenues | $ | 3,699,745 | $ | 3,539,193 | $ | 3,409,879 | |||||
Expenses | 3,159,989 | 3,829,428 | 4,054,472 | ||||||||
Total Income (Loss) | $ | 539,756 | $ | (290,235 | ) | $ | (644,593 | ) | |||
F-20
STEADFAST APARTMENT REIT, INC.
NOTES TO CONSOLIDATED FINANCIAL STATEMENTS - CONTINUED
DECEMBER 31, 2019
4. Other Assets
As of December 31, 2019 and 2018, other assets consisted of:
December 31, | |||||||
2019 | 2018 | ||||||
Prepaid expenses | $ | 1,521,084 | $ | 1,690,959 | |||
Interest rate cap agreements | 132 | 207,769 | |||||
Escrow deposits for pending real estate acquisitions | 2,600,300 | 100,000 | |||||
Other deposits | 1,342,615 | 924,997 | |||||
Operating lease right-of-use assets, net | 49,184 | — | |||||
Other assets | $ | 5,513,315 | $ | 2,923,725 | |||
5. Debt
Mortgage Notes Payable
The following is a summary of mortgage notes payable, net secured by real property as of December 31, 2019 and 2018:
December 31, 2019 | ||||||||||||||||
Interest Rate Range | Weighted Average Interest Rate | |||||||||||||||
Type | Number of Instruments | Maturity Date Range | Minimum | Maximum | Principal Outstanding | |||||||||||
Variable rate(1) | 2 | 1/1/2025 - 9/1/2025 | 1-Mo LIBOR + 1.88% | 1-Mo LIBOR + 2.28% | 3.82% | $ | 75,670,000 | |||||||||
Fixed rate | 14 | 7/1/2025 - 5/1/2054 | 3.36 | % | 4.60 | % | 3.96% | 488,805,387 | ||||||||
Mortgage notes payable, gross | 16 | 3.94% | 564,475,387 | |||||||||||||
Deferred financing costs, net(2) | (4,376,572 | ) | ||||||||||||||
Mortgage notes payable, net | $ | 560,098,815 | ||||||||||||||
December 31, 2018 | ||||||||||||||||
Interest Rate Range | Weighted Average Interest Rate | |||||||||||||||
Type | Number of Instruments | Maturity Date Range | Minimum | Maximum | Principal Outstanding | |||||||||||
Variable rate(1) | 8 | 12/1/2024 - 11/1/2025 | 1-Mo LIBOR + 1.88% | 1-Mo LIBOR + 2.28% | 4.53% | $ | 277,432,000 | |||||||||
Fixed rate | 7 | 7/1/2025 - 5/1/2054 | 4.34 | % | 4.60 | % | 4.45% | 228,127,333 | ||||||||
Mortgage notes payable, gross | 15 | 4.49% | 505,559,333 | |||||||||||||
Deferred financing costs, net(2) | (3,416,027 | ) | ||||||||||||||
Mortgage notes payable, net | $ | 502,143,306 | ||||||||||||||
___________
(1) | See Note 10 (Derivative Financial Instruments) for a discussion of the interest rate cap agreements used to manage the exposure to interest rate movement on the Company’s variable rate loans. |
F-21
STEADFAST APARTMENT REIT, INC.
NOTES TO CONSOLIDATED FINANCIAL STATEMENTS - CONTINUED
DECEMBER 31, 2019
(2) | Accumulated amortization related to deferred financing costs as of December 31, 2019 and 2018 was $2,215,461 and $1,602,290, respectively. |
Stoneridge Farms Financing
On July 30, 2019, one of the Company’s indirect wholly-owned subsidiaries entered into a loan agreement with Berkeley Point Capital LLC, d/b/a Newmark Knight Frank (“Berkeley Point”), for the principal amount of $45,711,000. The loan agreement provides for a term loan with a maturity date of August 1, 2029, unless the maturity date is accelerated pursuant to the loan agreement’s terms. The loan accrues interest at a fixed rate of 3.36% per annum. The entire outstanding principal balance and any accrued and unpaid interest on the loan is due on the maturity date. Interest only payments on the loan are payable monthly in arrears on specified dates as set forth in the loan agreement and interest and principal payments are due beginning September 1, 2024. Monthly payments are due and payable on the first day of each month, commencing September 1, 2019. The loan is secured by Stoneridge Farms, a 336-unit property located in Smyrna, Tennessee. The Company paid $228,555 in loan origination fees to Berkeley Point in connection with the financing, and paid the Advisor a loan coordination fee of $342,833.
Refinancing Transactions
On September 27, 2019 and October 1, 2019, the Company, through its wholly-owned subsidiaries (each, a “Borrower” and collectively, the “Borrowers”), refinanced $201,762,000 of existing variable rate loans with its existing lender, PNC Bank National Association (“PNC Bank”), with new fixed rate Freddie Mac loans in an aggregate principal amount of $215,934,000. Each of the loans has a maturity date of October 1, 2029. Interest only payments are payable monthly through November 1, 2024, with interest and principal payments due monthly thereafter. The Borrowers paid $809,753 in the aggregate in loan origination fees to PNC Bank in connection with the refinancing, and the Advisor earned loan coordination fees of $600,000. The refinancing transactions are treated as loan modifications in accordance with ASC 470 Debt, with lender direct expenses capitalized as deferred financing costs in mortgage notes payable, net in the accompanying consolidated balance sheets and third-party loan fees expensed in interest expense in the accompanying consolidated statements of operations.
The following is a summary of the refinancing of mortgage notes payable secured by real property during the year ended December 31, 2019:
Property | Closing Date | Lender | Interest Rate | Loan Amount | ||||||
Delano at North Richland Hills | 9/27/2019 | PNC Bank | 3.56% | $ | 32,159,000 | |||||
Lakeside at Coppell | 9/27/2019 | PNC Bank | 3.56% | 48,251,000 | ||||||
Meadows at North Richland Hills | 10/1/2019 | PNC Bank | 3.56% | 26,888,000 | ||||||
Park Valley | 10/1/2019 | PNC Bank | 3.56% | 49,100,000 | ||||||
PeakView by Horseshoe Lake | 10/1/2019 | PNC Bank | 3.56% | 38,421,000 | ||||||
Reveal on Cumberland | 10/1/2019 | PNC Bank | 3.56% | 21,115,000 | ||||||
$ | 215,934,000 | |||||||||
Construction loan
On October 16, 2019, the Company entered into an agreement with PNC Bank for a construction loan related to the development of Garrison Station in an aggregate principal amount not to exceed $19,800,000 for a thirty-six month initial term and two twelve month mini-perm extensions. The rate of interest will be at the one-month London Interbank Offered Rate (“LIBOR”) plus 2.00%, which then reduces to the one-month LIBOR plus 1.80% upon achieving completion as defined in the construction loan agreement and at debt service coverage ratio of 1.15x. The loan includes a 0.4% fee at closing, a 0.1% fee upon exercising the mini-perm and a 0.1% fee upon extending the mini-perm, each payable to PNC Bank. There is an exit fee of 1% which will be waived if permanent financing is secured through PNC Bank or one of their affiliates. No amounts were outstanding on this construction loan at December 31, 2019.
F-22
STEADFAST APARTMENT REIT, INC.
NOTES TO CONSOLIDATED FINANCIAL STATEMENTS - CONTINUED
DECEMBER 31, 2019
Credit Facilities
Master Credit Facility
On July 31, 2018, (the “Closing Date”), 16 indirect wholly-owned subsidiaries of the Company terminated the existing mortgage loans with their lenders for an aggregate principal amount of $479,318,649 and entered into a Master Credit Facility Agreement (“MCFA”) with Berkeley Point Capital, LLC (“Facility Lender”) for an aggregate principal amount of $551,669,000. The MCFA provides for three tranches: (i) a fixed rate loan in the aggregate principal amount of $331,001,400 that accrues interest at 4.43% per annum; (ii) a fixed rate loan in the aggregate principal amount of $137,917,250 that accrues interest at 4.57%; and (iii) a variable rate loan in the aggregate principal amount of $82,750,350 that accrues interest at the one-month LIBOR plus 1.70%. The loans have a maturity date of August 1, 2028, unless the maturity date is accelerated in accordance with the terms of the loan documents. Interest only payments are payable monthly through August 1, 2025, with interest and principal payments due monthly thereafter. The Company paid $1,930,842 in the aggregate in loan origination fees to the Facility Lender in connection with the refinancings, and paid the Advisor a loan coordination fee of $2,758,345. During the year ended December 31, 2019, the Company sold two properties and was required to deposit $36,740,983 as substitution for the loan amount allocated in the MCFA to the sold properties, $31,749,791 of which was funded from proceeds from the sales of the properties.
CME Loans
On the Closing Date, five indirect wholly-owned subsidiaries of the Company terminated the existing mortgage loans with their lenders for an aggregate principal amount of $131,318,742 and entered into new loan agreements with PNC Bank, for an aggregate principal amount of $160,850,000. Each loan agreement provides for a term loan (each a “CME Loan” and, collectively the “CME Loans”) with a maturity date of August 1, 2028, unless the maturity date is accelerated with the loan terms. Each CME Loan accrues interest at a fixed rate of 4.43% per annum. The entire outstanding principal balance and any accrued and unpaid interest on each of the CME Loans are due on the maturity date. Interest only payments on the CME Loans are payable monthly in arrears on specified dates as set forth in each loan agreement and interest and principal payments are due beginning September 1, 2023. Monthly payments are due and payable on the first day of each month, commencing September 1, 2018. The Company paid $643,400 in the aggregate in loan origination fees to PNC Bank in connection with the refinancings, and paid the Advisor a loan coordination fee of $804,250.
Revolving Line of Credit
On May 18, 2016, the Company entered into a line of credit facility (the “Line of Credit”) with PNC Bank in an amount not to exceed $65,000,000. The Line of Credit provided for advances (each, an “LOC Loan” and collectively, the “LOC Loans”) solely for the purpose of financing the costs in connection with acquisitions and development of real estate projects and for general corporate purposes (subject to certain debt service and loan to value requirements). The Line of Credit had a maturity date of May 17, 2019, subject to extension (the “LOC Maturity Date”). The Company terminated the Line of Credit in January 2019.
As of December 31, 2019 and 2018, the advances obtained and certain financing costs incurred under the MCFA and the Line of Credit, which are included in credit facilities, net, in the accompanying consolidated balance sheets, are summarized in the following table:
Amount of Advance as of December 31, | ||||||||
2019 | 2018 | |||||||
Principal balance on revolving line of credit, gross(1) | $ | — | $ | — | ||||
Principal balance on master credit facility, gross | 551,669,000 | 551,669,000 | ||||||
Deferred financing costs, net on master credit facility(2) | (3,208,770 | ) | (3,612,316 | ) | ||||
Deferred financing costs, net on revolving line of credit(3) | — | (44,247 | ) | |||||
Credit facilities, net | $ | 548,460,230 | $ | 548,012,437 | ||||
F-23
STEADFAST APARTMENT REIT, INC.
NOTES TO CONSOLIDATED FINANCIAL STATEMENTS - CONTINUED
DECEMBER 31, 2019
______________
(1) | At December 31, 2018, Landings of Brentwood was pledged as collateral pursuant to the Line of Credit. On January 9, 2019, the Company terminated the Line of Credit. |
(2) | Accumulated amortization related to deferred financing costs in respect of the MCFA as of December 31, 2019 and 2018, was $832,187 and $428,641, respectively. |
(3) | Accumulated amortization related to deferred financing costs in respect of the Line of Credit as of December 31, 2019 and 2018, was $0 and $280,753, respectively. |
Maturities and Interest
The following is a summary of the Company’s aggregate maturities as of December 31, 2019:
Maturities During the Years Ending December 31, | ||||||||||||||||||||||||||||
Contractual Obligations | Total | 2020 | 2021 | 2022 | 2023 | 2024 | Thereafter | |||||||||||||||||||||
Principal payments on outstanding debt obligations(1) | $ | 1,116,144,387 | $ | 1,149,183 | $ | 2,298,283 | $ | 2,384,828 | $ | 3,237,578 | $ | 5,720,370 | $ | 1,101,354,145 | ||||||||||||||
______________
(1) | Scheduled principal payments on outstanding debt obligations are based on the terms of the notes payable agreements. Amounts exclude the amortization of deferred financing costs associated with the notes payable. |
The Company’s notes payable contain customary financial and non-financial debt covenants. As of December 31, 2019 and 2018, the Company was in compliance with all debt covenants.
For the years ended December 31, 2019, 2018 and 2017, the Company incurred interest expense of $49,273,750, $44,374,484 and $34,944,074, respectively. Interest expense for the years ended December 31, 2019, 2018 and 2017 includes amortization of deferred financing costs of $1,019,355, $1,056,545 and $1,012,380, net unrealized loss (gain) from the change in fair value of interest rate cap agreements of $225,637, $(87,160) and $447,668, amortization of loan discount of $0, $207,074 and $354,984, seasoning fees on the Credit Facility of $0, $0 and $85,426, line of credit commitment fees of $2,137, $57,007 and $45,680 and costs associated with the refinancing of debt of $496,684, $587,520 and $664,880, net of capitalized interest of $106,523, $0 and $0, respectively. The capitalized interest is included in real estate held for development on the consolidated balance sheets.
Interest expense of $3,954,686 and $4,006,127 was payable as of December 31, 2019 and 2018, respectively, and is included in accounts payable and accrued liabilities in the accompanying consolidated balance sheets.
6. Stockholders’ Equity
General
Under the Charter, the total number of shares of capital stock authorized for issuance is 1,100,000,000 shares, consisting of 999,999,000 shares of common stock with a par value of $0.01 per share, 1,000 shares of convertible stock with a par value of $0.01 per share and 100,000,000 shares of preferred stock with a par value of $0.01 per share.
Common Stock
The shares of the Company’s common stock entitle the holders to one vote per share on all matters upon which stockholders are entitled to vote, to receive dividends and other distributions as authorized by the Company’s board of directors in accordance with the Maryland General Corporation Law and to all rights of a stockholder pursuant to the Maryland General Corporation Law. The common stock has no preferences or preemptive, conversion or exchange rights.
On September 3, 2013, the Company issued 13,500 shares of common stock to the Sponsor for $202,500. From inception through March 24, 2016, the date of the termination of the Primary Offering, the Company had issued 48,625,651 shares of common stock in its Public Offering for offering proceeds of $640,012,497, including 1,011,561 shares of common stock issued pursuant to the DRP for total proceeds of $14,414,752, net of offering costs of $84,837,134. Following the termination of the Public Offering, the Company continues to offer shares pursuant to the DRP. As of December 31, 2019, the Company had
F-24
STEADFAST APARTMENT REIT, INC.
NOTES TO CONSOLIDATED FINANCIAL STATEMENTS - CONTINUED
DECEMBER 31, 2019
issued 54,276,237 shares of common stock for offering proceeds of $724,725,222, including 6,662,210 shares of common stock issued pursuant to the DRP for total proceeds of $99,127,477, net of offering costs of $84,837,134. The offering costs primarily consisted of selling commissions and dealer manager fees paid in the Primary Offering.
As further discussed in Note 8 (Incentive Award Plan and Independent Director Compensation), the shares of restricted common stock vest and become non-forfeitable in four equal annual installments beginning on the date of grant and ending on the third anniversary of the date of grant or will become fully vested and become non-forfeitable on the earlier to occur of (1) the termination of the independent director’s service as a director due to his or her death or disability or (2) a change in control of the Company.
The issuance and vesting activity for the years ended December 31, 2019, 2018 and 2017 for the restricted stock issued to the Company’s independent directors were as follows:
Year Ended December 31, | |||||||||
2019 | 2018 | 2017 | |||||||
Nonvested shares at the beginning of the period | 7,497 | 7,497 | 9,997 | ||||||
Granted shares | 4,998 | 4,998 | 4,998 | ||||||
Vested shares | (4,998 | ) | (4,998 | ) | (7,498 | ) | |||
Nonvested shares at the end of the period | 7,497 | 7,497 | 7,497 | ||||||
Additionally, the weighted average fair value of restricted common stock issued to the Company’s independent directors for the years ended December 31, 2019, 2018 and 2017 was as follows:
Grant Year | Weighted Average Fair Value | |||
2017 | $ | 14.85 | ||
2018 | 15.18 | |||
2019 | 15.84 | |||
Included in general and administrative expenses is $71,250, $74,617 and $79,858 for the years ended December 31, 2019, 2018 and 2017, respectively, for compensation expense related to the issuance of restricted common stock. As of December 31, 2019, the compensation expense related to the issuance of the restricted common stock not yet recognized was $98,177. The weighted average remaining term of the restricted common stock was approximately one year as of December 31, 2019. As of December 31, 2019, no shares of restricted common stock issued to the independent directors have been forfeited.
Convertible Stock
The Company issued 1,000 shares of Convertible Stock to the Advisor for $1,000. The Convertible Stock will convert into shares of common stock if and when: (A) the Company has made total distributions on the then-outstanding shares of its common stock equal to the original issue price of those shares plus an aggregate 6.0% cumulative, non-compounded, annual return on the original issue price of those shares, (B) the Company lists its common stock for trading on a national securities exchange, or (C) the Advisory Agreement is terminated or not renewed (other than for “cause” as defined in the Advisory Agreement). In the event of a termination or non-renewal of the Advisory Agreement for cause, all of the shares of the Convertible Stock will be repurchased for $1.00. In general, each share of Convertible Stock will convert into a number of shares of common stock equal to 1/1000 of the quotient of (A) 15% of the excess of (1) the Company’s “enterprise value” plus the aggregate value of distributions paid to date on the then outstanding shares of the Company’s common stock over (2) the aggregate purchase price paid by stockholders for those outstanding shares of common stock plus an aggregated 6.0% cumulative, non-compounded, annual return on the original issue price of those outstanding shares, divided by (B) the Company’s enterprise value divided by the number of outstanding shares of common stock on an as-converted basis, in each case calculated as of the date of the conversion.
Preferred Stock
The Charter also provides the Company’s board of directors with the authority to issue one or more classes or series of preferred stock, and prior to the issuance of such shares of preferred stock, the board of directors shall have the power from time to time to classify or reclassify, in one or more series, any unissued shares and designate the preferences, rights and
F-25
STEADFAST APARTMENT REIT, INC.
NOTES TO CONSOLIDATED FINANCIAL STATEMENTS - CONTINUED
DECEMBER 31, 2019
privileges of such shares of preferred stock. The Company’s board of directors is authorized to amend the Charter without the approval of the stockholders to increase the aggregate number of authorized shares of capital stock or the number of shares of any class or series that the Company has authority to issue. As of December 31, 2019 and 2018, no shares of the Company’s preferred stock were issued and outstanding.
Distribution Reinvestment Plan
The Company’s board of directors has approved the DRP through which common stockholders may elect to reinvest an amount equal to the distributions declared on their shares of common stock in additional shares of the Company’s common stock in lieu of receiving cash distributions. The purchase price per share under the DRP was initially $14.25. On March 12, 2019, March 14, 2018 and February 14, 2017, the Company’s board of directors approved a price per share for the DRP of $15.84, $15.18 and $14.85, effective April 1, 2019, April 1, 2018 and March 1, 2017, respectively, in connection with the determination of an estimated value per share of the Company’s common stock.
The Company’s board of directors may again, in its sole discretion, from time to time, change this price based upon changes in the Company’s estimated value per share and other factors that the Company’s board of directors deems relevant.
No sales commissions or dealer manager fees are payable on shares sold through the DRP. The Company’s board of directors may amend, suspend or terminate the DRP at its discretion at any time upon ten days’ notice to the Company’s stockholders. Following any termination of the DRP, all subsequent distributions to stockholders will be made in cash.
Share Repurchase Plan and Redeemable Common Stock
The Company’s share repurchase plan may provide an opportunity for stockholders to have their shares of common stock repurchased by the Company, subject to certain restrictions and limitations. No shares can be repurchased under the Company’s share repurchase plan until after the first anniversary of the date of purchase of such shares; provided, however, that this holding period shall not apply to repurchases requested within two years after the death or disability of a stockholder.
From March 29, 2016, the date the Company first published an estimated value per share, until April 14, 2018, the purchase price for shares repurchased under the Company’s share repurchase plan was as follows:
Share Purchase Anniversary | Repurchase Price on Repurchase Date(1) | |
Less than 1 year | No Repurchase Allowed | |
1 year | 92.5% of Estimated Value per Share(2) | |
2 years | 95.0% of Estimated Value per Share(2) | |
3 years | 97.5% of Estimated Value per Share(2) | |
4 years | 100.0% of Estimated Value per Share(2) | |
In the event of a stockholder’s death or disability(3) | Average Issue Price for Shares(4) | |
________________
(1) | As adjusted for any stock dividends, combinations, splits, recapitalizations or any similar transaction with respect to the shares of common stock. Repurchase price includes the full amount paid for each share, including all sales commissions and dealer manager fees. |
(2) The “Estimated Value per Share” is the most recent publicly disclosed estimated value per share determined by the Company’s board of directors.
(3) | The required one-year holding period does not apply to repurchases requested within two years after the death or disability of a stockholder. |
(4) | The purchase price per share for shares repurchased upon the death or disability of a stockholder will be equal to the average issue price per share for all of the stockholder’s shares. |
On March 14, 2018, the board of directors of the Company determined to amend the terms of the Company’s share repurchase plan effective as of April 15, 2018 to (1) limit the amount of shares repurchased pursuant to the Company’s share repurchase plan each quarter to $2,000,000 and (2) revise the repurchase price to an amount equal to 93% of the Estimated Value per Share. Pursuant to the amended share repurchase plan, the current share repurchase price is $14.73 per share, which represents 93% of the Estimated Value per Share of $15.84. As discussed in more detail below, the board of directors of the
F-26
STEADFAST APARTMENT REIT, INC.
NOTES TO CONSOLIDATED FINANCIAL STATEMENTS - CONTINUED
DECEMBER 31, 2019
company further amended the share repurchase plan on March 3, 2020 in connection with the mergers. Prior to the March 3, 2020 amendments, the share repurchase price was further reduced based on how long the stockholder had held the shares as follows:
Share Purchase Anniversary | Repurchase Price on Repurchase Date(1) | |
Less than 1 year | No Repurchase Allowed | |
1 year | 92.5% of the Share Repurchase Price(2) | |
2 years | 95.0% of the Share Repurchase Price(2) | |
3 years | 97.5% of the Share Repurchase Price(2) | |
4 years | 100.0% of the Share Repurchase Price(2) | |
In the event of a stockholder’s death or disability(3) | Average Issue Price for Shares(4) | |
________________
(1) | As adjusted for any stock dividends, combinations, splits, recapitalizations or any similar transaction with respect to the shares of common stock. Repurchase price includes the full amount paid for each share, including all sales commissions and dealer manager fees. |
(2) The “Share Repurchase Price” equals 93% of the Estimated Value per Share.
(3) | The required one-year holding period does not apply to repurchases requested within two years after the death or disability of a stockholder. |
(4) | The purchase price per share for shares repurchased upon the death or disability of a stockholder will be equal to the average issue price per share for all of the stockholder’s shares. |
The purchase price per share for shares repurchased pursuant to the Company’s share repurchase plan will be further reduced by the aggregate amount of net proceeds per share, if any, distributed to the Company’s stockholders prior to the Repurchase Date (defined below) as a result of the sale of one or more of the Company’s assets that constitutes a return of capital as a result of such sales.
Repurchases of shares of the Company’s common stock are made quarterly upon written request to the Company at least 15 days prior to the end of the applicable quarter. Repurchase requests are honored approximately 30 days following the end of the applicable quarter (“Repurchase Date”). Stockholders may withdraw their repurchase request at any time up to three business days prior to the Repurchase Date.
In connection with the announcement of the then-proposed SIR Merger and STAR III Merger, on August 5, 2019, the Company’s board of directors approved the Amended and Restated Share Repurchase Plan (the “Amended & Restated SRP”), which became effective September 5, 2019, and applied to repurchases made on the repurchase dates subsequent to the effective date of the Amended & Restated SRP. Under the Amended & Restated SRP, the Company only repurchased shares of common stock in connection with the death or qualifying disability (as determined by the Company’s board in its sole discretion) of a stockholder, subject to certain terms and conditions specified in the Amended & Restated SRP. Repurchases pursuant to the Amended and Restated SRP will continue to be limited to $2,000,000 per quarter. On March 3, 2020, in connection with the closing of the SIR Merger and the STAR III Merger, the Company’s board of directors amended its share repurchase plan to: (1) allow all stockholders to request repurchases (as opposed to death and disability only), (2) limit the amount of shares repurchased pursuant to the SRP each quarter to $4,000,000 and (3) set the repurchase price in all instances (including death and disability) to an amount equal to 93% of the most recent publicly disclosed estimated value per share. The $4,000,000 quarterly limit and the repurchase price of 93% of the Estimated Value per Share will take effect upon 30 days’ notice to stockholders and will be in effect on the repurchase date at April 30, 2020 with respect to redemptions for the first quarter ending March 31, 2020 (the “First Quarter Redemptions”); provided, however, the Company will continue to limit First Quarter Redemptions to death and disability only. The Amended & Restated SRP will be open to all repurchase requests beginning April 1, 2020.
The Company is not obligated to repurchase shares of its common stock under the share repurchase plan. In no event shall repurchases under the share repurchase plan exceed 5% of the weighted average number of shares of common stock outstanding during the prior calendar year or the $2,000,000 limit for any quarter put in place by the Company’s board of directors, which will be increased to $4,000,000 beginning in the second quarter of 2020. There is no fee in connection with a
F-27
STEADFAST APARTMENT REIT, INC.
NOTES TO CONSOLIDATED FINANCIAL STATEMENTS - CONTINUED
DECEMBER 31, 2019
repurchase of shares of the Company’s common stock pursuant to the Company’s share repurchase plan. As of December 31, 2019 and 2018, the Company had recorded $797,289 and $2,000,000, respectively, which represents 53,152 (pursuant to the Amended & Restated SRP) and 138,961 shares of common stock, respectively, in accounts payable and accrued liabilities on the accompanying consolidated balance sheets related to these unfulfilled repurchase requests, all of which were repurchased on the January 31, 2020 and 2019 repurchase dates.
During the year ended December 31, 2019, the Company repurchased a total of 475,670 shares with a total repurchase value of $6,971,635 and received requests for repurchases of 904,967 shares with a total repurchase value of $13,240,859. During the year ended December 31, 2018, the Company repurchased a total of 631,332 shares with a total repurchase value of $8,886,216 and received requests for the repurchase of 1,814,302 shares with a total repurchase value of $25,249,054, respectively.
The Company cannot guarantee that the funds set aside for the share repurchase plan will be sufficient to accommodate all repurchase requests made in any quarter. In the event that the Company does not have sufficient funds available to repurchase all of the shares of the Company’s common stock for which repurchase requests have been submitted in any quarter, priority will be given to repurchase requests in the case of the death or disability of a stockholder. If the Company repurchases less than all of the shares subject to a repurchase request in any quarter, with respect to any shares which have not been repurchased, the Company will treat the shares that have not been repurchased as a request for repurchase in the following quarter pursuant to the limitations of the share repurchase plan and when sufficient funds are available, unless the stockholder withdraws the request for repurchase. Such pending requests will be honored among all requests for repurchases in any given repurchase period as follows: first, pro rata as to repurchases sought upon a stockholder’s death or disability; next in exigent circumstances as determined by the Company’s board of directors in its sole discretion and finally, pro rata as to other repurchase requests.
The Company’s board of directors may, in its sole discretion, amend, suspend or terminate the share repurchase plan at any time upon 30 days’ notice to its stockholders if it determines that the funds available to fund the share repurchase plan are needed for other business or operational purposes or that amendment, suspension or termination of the share repurchase plan is in the best interest of the Company’s stockholders. Therefore, a stockholder may not have the opportunity to make a repurchase request prior to any potential termination or suspension of the Company’s share repurchase plan. The share repurchase plan will terminate in the event that a secondary market develops for the Company’s shares of common stock.
For the year ended December 31, 2019, the Company reclassified $1,202,711, net pursuant to the share repurchase plan from accounts payable to temporary equity, which is included as redeemable common stock on the accompanying consolidated balance sheets. For the year ended December 31, 2018, the Company reclassified $37,028,102, net of $8,886,216 of fulfilled redemption requests, from temporary equity to permanent equity, which is included as additional paid-in capital on the accompanying consolidated balance sheets.
Distributions
The Company’s long-term goal is to pay distributions solely from cash flow from operations. However, because the Company may receive income from interest or rents at various times during the Company’s fiscal year and because the Company may need cash flow from operations during a particular period to fund capital expenditures and other expenses, the Company expects that at times during the Company’s operational stage, the Company will declare distributions in anticipation of cash flow that the Company expects to receive during a later period, and the Company expects to pay these distributions in advance of its actual receipt of these funds. The Company’s board of directors has the authority under its organizational documents, to the extent permitted by Maryland law, to fund distributions from sources such as borrowings, offering proceeds or advances and the deferral of fees and expense reimbursements by the Advisor, in its sole discretion. The Company has not established a limit on the amount of proceeds it may use to fund distributions from sources other than cash flow from operations. If the Company pays distributions from sources other than cash flow from operations, the Company will have fewer funds available and stockholders’ overall return on their investment in the Company may be reduced.
To maintain the Company’s qualification as a REIT, the Company must make aggregate annual distributions to its stockholders of at least 90% of its REIT taxable income (which is computed without regard to the dividends-paid deduction or net capital gain and which does not necessarily equal net income as calculated in accordance with GAAP). If the Company meets the REIT qualification requirements, the Company generally will not be subject to federal income tax on the income that the Company distributes to its stockholders each year.
Distributions Declared
The Company’s board of directors approved a cash distribution that accrued at a rate of $0.002466 per day for each share of the Company’s common stock during the years ended December 31, 2019 and 2018, which, if paid over a 365-day period, is
F-28
STEADFAST APARTMENT REIT, INC.
NOTES TO CONSOLIDATED FINANCIAL STATEMENTS - CONTINUED
DECEMBER 31, 2019
equivalent to a 6.0% annualized distribution rate based on a purchase price of $15.00 per share of the Company’s common stock. The distributions declared accrue daily to stockholders of record as of the close of business on each day and are payable in cumulative amounts on or before the third day of each calendar month with respect to the prior month. There is no guarantee that the Company will continue to pay distributions at this rate or at all.
Distributions declared for the years ended December 31, 2019 and 2018 were $46,971,783 and $46,179,769, including $21,105,794 and $22,603,893, or 1,347,105 shares and 1,497,359 shares of common stock, respectively, attributable to the DRP.
As of December 31, 2019 and 2018, $4,021,509 and $3,953,499 of distributions declared were payable, which included $1,744,240 and $1,860,828, or 110,116 shares and 122,584 shares of common stock, attributable to the DRP, respectively.
Distributions Paid
For the years ended December 31, 2019 and 2018, the Company paid cash distributions of $25,681,391 and $23,399,025, which related to distributions declared for each day in the period from December 1, 2018 through November 30, 2019 and December 1, 2017 through November 30, 2018, respectively. Additionally, for the years ended December 31, 2019 and 2018, 1,354,560 and 1,507,497 shares of common stock were issued pursuant to the DRP for gross offering proceeds of $21,222,382 and $22,713,975, respectively. For the years ended December 31, 2019 and 2018, the Company paid total distributions of $46,903,773 and $46,113,000, respectively.
7. Related Party Arrangements
The Company entered into the Advisory Agreement with the Advisor. Pursuant to the Advisory Agreement, the Company is obligated to pay the Advisor specified fees upon the provision of certain services, the investment of funds in real estate and real estate-related investments and the management of the Company’s investments and for other services (including, but not limited to, the disposition of investments). Subject to the limitations described below, the Company is also obligated to reimburse the Advisor and its affiliates for organization and offering costs incurred by the Advisor and its affiliates on behalf of the Company, as well as acquisition and origination expenses and certain operating expenses incurred on behalf of the Company or incurred in connection with providing services to the Company.
F-29
STEADFAST APARTMENT REIT, INC.
NOTES TO CONSOLIDATED FINANCIAL STATEMENTS - CONTINUED
DECEMBER 31, 2019
Amounts attributable to the Advisor and its affiliates incurred (earned) for the years ended December 31, 2019, 2018 and 2017 are as follows:
Incurred (Earned) For the Year Ended December 31, | ||||||||||||
2019 | 2018 | 2017 | ||||||||||
Consolidated Statements of Operations: | ||||||||||||
Expensed | ||||||||||||
Investment management fees(1) | $ | 16,645,427 | $ | 15,743,185 | $ | 16,904,458 | ||||||
Acquisition expenses(2) | 98,594 | — | — | |||||||||
Loan coordination fees(1) | 942,833 | 3,562,595 | 1,483,740 | |||||||||
Disposition fees(3) | 591,000 | — | — | |||||||||
Disposition transaction costs(3) | 6,566 | — | — | |||||||||
Property management: | ||||||||||||
Fees(1) | 5,016,845 | 4,886,436 | 4,706,698 | |||||||||
Reimbursement of onsite personnel(4) | 15,230,722 | 14,959,964 | 14,194,648 | |||||||||
Reimbursement of other(1) | 3,256,473 | 1,784,010 | 1,248,100 | |||||||||
Reimbursement of property operations(4) | 108,616 | 82,461 | 103,320 | |||||||||
Reimbursement of property G&A(2) | 113,367 | 49,916 | 92,488 | |||||||||
Other operating expenses(2) | 1,826,725 | 1,175,061 | 1,449,733 | |||||||||
Insurance proceeds(2) | — | (150,000 | ) | (172,213 | ) | |||||||
Property insurance(5) | 2,301,972 | 1,394,218 | 909,568 | |||||||||
Rental revenue(6) | (58,980 | ) | (21,589 | ) | — | |||||||
Consolidated Balance Sheets: | ||||||||||||
Capitalized | ||||||||||||
Acquisition fees(7) | 48,343 | — | — | |||||||||
Acquisition expenses(8) | 551,447 | 26,113 | — | |||||||||
Capitalized development services fee(7) | 151,071 | — | — | |||||||||
Capitalized investment management fees(7) | 77,433 | — | — | |||||||||
Capitalized development costs(7) | 2,445 | — | — | |||||||||
Capital expenditures(9) | 107,576 | 7,295 | 28,691 | |||||||||
Construction management: | ||||||||||||
Fees(9) | 1,340,387 | 585,532 | 1,453,859 | |||||||||
Reimbursement of labor costs(9) | 467,295 | 908,206 | 2,551,463 | |||||||||
Deferred financing costs(10) | 3,594 | 18,923 | — | |||||||||
$ | 48,829,751 | $ | 45,012,326 | $ | 44,954,553 | |||||||
_____________________
(1) | Included in fees to affiliates in the accompanying consolidated statements of operations. |
(2) | Included in general and administrative expenses in the accompanying consolidated statements of operations. |
(3) | Included in gain on sales of real estate, net in the accompanying consolidated statements of operations. |
(4) | Included in operating, maintenance and management in the accompanying consolidated statements of operations. |
(5) | Property related insurance expense and the amortization of the prepaid insurance deductible account are included in general and administrative expenses in the accompanying consolidated statements of operations. The amortization of the prepaid property insurance is included in operating, maintenance and management expenses in the accompanying |
F-30
STEADFAST APARTMENT REIT, INC.
NOTES TO CONSOLIDATED FINANCIAL STATEMENTS - CONTINUED
DECEMBER 31, 2019
consolidated statements of operations. The prepaid insurance is included in other assets in the accompanying consolidated balance sheets upon payment.
(6) | Included in rental income in the accompanying consolidated statements of operations. |
(7) | Included in real estate held for development in the accompanying consolidated balance sheets. |
(8) | Included in total real estate, net in the accompanying consolidated balance sheets. |
(9) | Included in building and improvements in the accompanying consolidated balance sheets. |
(10) | Included in notes payable, net in the accompanying consolidated balance sheets. |
F-31
STEADFAST APARTMENT REIT, INC.
NOTES TO CONSOLIDATED FINANCIAL STATEMENTS - CONTINUED
DECEMBER 31, 2019
Amounts attributable to the Advisor and its affiliates paid (received) for the years ended December 31, 2019, 2018 and 2017 are as follows:
Paid (Received) During the Year Ended December 31, | ||||||||||||
2019 | 2018 | 2017 | ||||||||||
Consolidated Statements of Operations: | ||||||||||||
Expensed | ||||||||||||
Investment management fees | $ | 12,580,939 | $ | 15,687,320 | $ | 18,317,568 | ||||||
Acquisition expenses | 98,594 | — | — | |||||||||
Loan coordination fees | 342,833 | 4,290,695 | 755,640 | |||||||||
Disposition transaction costs | 6,566 | — | — | |||||||||
Property management: | ||||||||||||
Fees | 5,009,096 | 4,872,734 | 4,685,475 | |||||||||
Reimbursement of onsite personnel | 15,155,066 | 14,958,751 | 14,022,282 | |||||||||
Reimbursement of other | 3,247,684 | 1,783,971 | 1,245,748 | |||||||||
Reimbursement of property operations | 97,151 | 82,461 | 103,320 | |||||||||
Reimbursement of property G&A | 106,367 | 49,916 | 92,488 | |||||||||
Other operating expenses | 1,457,164 | 1,157,836 | 1,585,631 | |||||||||
Insurance proceeds | (75,000 | ) | (75,000 | ) | (172,213 | ) | ||||||
Property insurance | 2,742,723 | 1,323,074 | 1,001,744 | |||||||||
Rental revenue | (58,980 | ) | (21,589 | ) | — | |||||||
Consolidated Balance Sheets: | ||||||||||||
Capitalized | ||||||||||||
Acquisition fees | 48,343 | — | — | |||||||||
Acquisition expenses | 553,054 | 24,507 | — | |||||||||
Capitalized development services fee | 100,714 | — | — | |||||||||
Capitalized investment management fees | 51,622 | — | — | |||||||||
Capitalized development costs | 2,445 | — | — | |||||||||
Capital expenditures | 107,576 | 7,295 | 28,691 | |||||||||
Construction management: | ||||||||||||
Fees | 1,306,911 | 700,410 | 1,431,290 | |||||||||
Reimbursement of labor costs | 487,973 | 941,879 | 2,665,299 | |||||||||
Deferred financing costs | 3,594 | 18,923 | — | |||||||||
Additional paid-in capital | ||||||||||||
Selling commissions | 228,665 | 262,387 | 234,942 | |||||||||
$ | 43,601,100 | $ | 46,065,570 | $ | 45,997,905 | |||||||
F-32
STEADFAST APARTMENT REIT, INC.
NOTES TO CONSOLIDATED FINANCIAL STATEMENTS - CONTINUED
DECEMBER 31, 2019
Amounts attributable to the Advisor and its affiliates that are payable (prepaid) as of December 31, 2019 and 2018, are as follows:
Payable (Prepaid) as of December 31, | ||||||||
2019 | 2018 | |||||||
Consolidated Statements of Operations: | ||||||||
Expensed | ||||||||
Investment management fees | $ | 4,120,353 | $ | 55,865 | ||||
Loan coordination fees | 600,000 | — | ||||||
Disposition fees | 591,000 | — | ||||||
Property management: | ||||||||
Fees | 418,173 | 410,424 | ||||||
Reimbursement of onsite personnel | 843,763 | 768,107 | ||||||
Reimbursement of other | 50,778 | 41,989 | ||||||
Reimbursement of property operations | 11,465 | — | ||||||
Reimbursement of property G&A | 7,000 | — | ||||||
Other operating expenses | 463,301 | 93,740 | ||||||
Insurance proceeds | — | (75,000 | ) | |||||
Property insurance | (542,324 | ) | (101,573 | ) | ||||
Consolidated Balance Sheets: | ||||||||
Capitalized | ||||||||
Acquisition expenses | — | 1,607 | ||||||
Capitalized development services fee | 50,357 | — | ||||||
Capitalized investment management fees | 25,811 | — | ||||||
Construction management: | ||||||||
Fees | 43,757 | 10,281 | ||||||
Reimbursement of labor costs | 8,525 | 29,203 | ||||||
Additional paid-in capital | ||||||||
Selling commissions | 71,287 | 299,952 | ||||||
$ | 6,763,246 | $ | 1,534,595 | |||||
Investment Management Fee
The Company pays the Advisor a monthly investment management fee equal to one-twelfth of 1.0% of (1) the cost of investments in real properties and real estate-related assets acquired directly by the Company or (2) the Company’s allocable cost of each investment in real property or real estate-related asset acquired through a joint venture. The investment management fee is calculated including the amount actually paid or budgeted to fund acquisition fees, acquisition expenses, cost of development, construction or improvement and any debt attributable to such investments, or the Company’s proportionate share thereof in the case of investments made through joint ventures.
Acquisition Fees and Expenses
The Company pays the Advisor an acquisition fee equal to 1.0% of the cost of investment, which includes the amount actually paid or budgeted to fund the acquisition, origination, development, construction or improvement (i.e. value-enhancement) of any real property or real estate-related asset acquired. In addition to acquisition fees, the Company reimburses the Advisor for amounts directly incurred by the Advisor and amounts the Advisor pays to third parties in connection with the selection, evaluation, acquisition and development of a property or acquisition of real estate-related assets, whether or not the Company ultimately acquires the property or the real estate-related assets.
F-33
STEADFAST APARTMENT REIT, INC.
NOTES TO CONSOLIDATED FINANCIAL STATEMENTS - CONTINUED
DECEMBER 31, 2019
The Charter limits the Company’s ability to pay acquisition fees if the total of all acquisition fees and expenses relating to the purchase would exceed 4.5% of the contract purchase price. Under the Charter, a majority of the Company’s board of directors, including a majority of the independent directors, is required to approve any acquisition fees (or portion thereof) that would cause the total of all acquisition fees and expenses relating to an acquisition to exceed 4.5% of the contract purchase price. In connection with the purchase of securities, the acquisition fee may be paid to an affiliate of the Advisor that is registered as a FINRA member broker-dealer if applicable FINRA rules would prohibit the payment of the acquisition fee to a firm that is not a registered broker-dealer.
Loan Coordination Fee
The Company pays the Advisor or its affiliate a loan coordination fee equal to 1.0% of the initial amount of the new debt financed or outstanding debt assumed in connection with the acquisition, development, construction, improvement or origination of a property or a real estate-related asset. In addition, in connection with any financing or the refinancing of any debt (in each case, other than identified at the time of the acquisition of a property or a real estate-related asset), the Company pays the Advisor or its affiliate a loan coordination fee equal to 0.75% of the amount of debt financed or refinanced. In some instances, the Company and the Advisor agreed to a loan coordination fee of $100,000 per loan refinanced.
Property Management Fees and Expenses
The Company has entered into property management agreements (each, as amended from time to time, a “Property Management Agreement”) with Steadfast Management Company, Inc., an affiliate of the Sponsor (the “Property Manager”), in connection with the management of each of the Company’s properties. At December 31, 2019, the property management fee payable with respect to each property under the Property Management Agreements ranged from 2.5% to 3.0% of the annual gross revenue collected at the property, as determined by the Advisor and approved by a majority of the Company’s board of directors, including a majority of the independent directors. Each Property Management Agreement has an initial one-year term and continues thereafter on a month-to-month basis unless either party gives 60 days’ prior notice of its desire to terminate the Property Management Agreement, provided that the Company may terminate the Property Management Agreement at any time upon a determination of gross negligence, willful misconduct or bad acts of the Property Manager or its employees or upon an uncured breach of the Property Management Agreement upon 30 days’ prior written notice to the Property Manager.
In addition to the property management fee, the Property Management Agreements also specify certain other reimbursements payable to the Property Manager for benefit administration, information technology infrastructure, licenses, support and training services and capital expenditures supervision. The Company also reimburses the Property Manager for the salaries and related benefits of on-site property management employees.
Construction Management Fees and Expenses
The Company has entered into construction management agreements (each a “Construction Management Agreement”) with Pacific Coast Land & Construction, Inc., an affiliate of the Sponsor (the “Construction Manager”), in connection with capital improvements and renovation or value-enhancement projects for certain properties the Company acquires. The construction management fee payable with respect to each property under the Construction Management Agreements ranges from 8.0% to 12.0% of the costs of the improvements for which the Construction Manager has planning and oversight authority. Generally, each Construction Management Agreement can be terminated by either party with 30 days’ prior written notice to the other party. Construction management fees are capitalized to the respective real estate properties in the period in which they are incurred as such costs relate to capital improvements and renovations for apartment homes taken out of service while they undergo the planned renovation.
The Company may also reimburse the Construction Manager for the salaries and related benefits of certain of its employees for time spent working on capital improvements and renovations.
Development Services
In some instances, the Company may enter into a Development Services Agreement with Steadfast Multifamily Development, Inc., an affiliate of the Advisor, (the “Developer”), in connection with a development project, pursuant to which the Developer will receive a development fee and reimbursement for certain expenses for overseeing the development project. The Company entered into a Development Services Agreement with the Developer in connection with the Garrison Station development project that provided for a development fee equal to 4% of the hard and soft costs of the development project as specified in the Development Services Agreement. 75% of the development fee will be paid in 14 monthly installments and the remaining 25% will be paid upon delivery by the Developer to the Company of a certificate of occupancy.
F-34
STEADFAST APARTMENT REIT, INC.
NOTES TO CONSOLIDATED FINANCIAL STATEMENTS - CONTINUED
DECEMBER 31, 2019
Property Insurance
The Company deposits amounts with an affiliate of the Sponsor to fund a prepaid insurance deductible account to cover the cost of required insurance deductibles across all properties of the Company and other affiliated entities. Upon filing a major claim, proceeds from the insurance deductible account may be used by the Company or another affiliate of the Sponsor. In addition, the Company deposits amounts with an affiliate of the Sponsor to cover the cost of property and property related insurance across certain properties of the Company.
Other Operating Expense Reimbursement
In addition to the various fees paid to the Advisor, the Company is obligated to pay directly or reimburse all expenses incurred by the Advisor in providing services to the Company, including the Company’s allocable share of the Advisor’s overhead, such as rent, employee costs, utilities and information technology costs. The Company will not reimburse the Advisor for employee costs in connection with services for which the Advisor or its affiliates receive acquisition fees or disposition fees or for the salaries the Advisor pays to the Company’s executive officers.
The Charter limits the Company’s total operating expenses during any four fiscal quarters to the greater of 2% of the Company’s average invested assets or 25% of the Company’s net income for the same period (the “2%/25% Limitation”). The Company may reimburse the Advisor, at the end of each fiscal quarter, for operating expenses incurred by the Advisor; provided, however, that the Company shall not reimburse the Advisor at the end of any fiscal quarter for operating expenses that exceed the 2%/25% Limitation unless the independent directors have determined that such excess expenses were justified based on unusual and non-recurring factors. The Advisor must reimburse the Company for the amount by which the Company’s operating expenses for the preceding four fiscal quarters then ended exceed the 2%/25% Limitation, unless approved by the independent directors. For purposes of determining the 2%/25% Limitation amount, “average invested assets” means the average monthly book value of the Company’s assets invested directly or indirectly in equity interests and loans secured by real estate during the 12-month period before deducting depreciation, bad debts reserves or other non-cash reserves. “Total operating expenses” means all expenses paid or incurred by the Company that are in any way related to the Company’s operation, including the Company’s allocable share of Advisor overhead, but excluding (a) the expenses of raising capital such as organization and offering expenses, legal, audit, accounting, underwriting, brokerage, listing, registration and other fees, printing and other such expenses and taxes incurred in connection with the issuance, distribution, transfer, listing and registration of shares of the Company’s common stock; (b) interest payments; (c) taxes; (d) non-cash expenditures such as depreciation, amortization and bad debt reserves; (e) reasonable incentive fees based on the gain in the sale of the Company’s assets; (f) acquisition fees and acquisition expenses (including expenses relating to potential acquisitions that the Company does not close) and investment management fees; (g) real estate commissions on the resale of investments; and (h) other expenses connected with the acquisition, disposition, management and ownership of investments (including the costs of foreclosure, insurance premiums, legal services, maintenance, repair and improvement of real property).
For the year ended December 31, 2019, the Advisor and its affiliates incurred $1,826,725 of the Company’s operating expenses, including the allocable share of the Advisor’s overhead expenses of $1,390,109, none of which were in excess of the 2%/25% Limitation and are included in the $7,440,680 of general and administrative expenses recognized by the Company.
As of December 31, 2019, the Company’s total operating expenses, as defined above, did not exceed the 2%/25% Limitation.
For the year ended December 31, 2018, the Advisor and its affiliates incurred $1,175,061 of the Company’s operating expenses, including the allocable share of the Advisor’s overhead expenses of $790,466, none of which were in excess of the 2%/25% Limitation and are included in the $6,386,131 of general and administrative expenses recognized by the Company.
For the year ended December 31, 2017, the Advisor and its affiliates incurred $1,449,733 of the Company’s operating expenses, including the allocable share of the Advisor’s overhead expenses of $974,471, none of which were in excess of the 2%/25% Limitation and are included in the $5,244,554 of general and administrative expenses recognized by the Company.
Disposition Fee
If the Advisor or its affiliates provide a substantial amount of services in connection with the sale of a property or real estate-related asset as determined by a majority of the Company’s independent directors, the Company will pay the Advisor or its affiliates a fee equivalent to one-half of the brokerage commissions paid, but in no event to exceed 1% of the sales price of each property or real estate-related asset sold. To the extent the disposition fee is paid upon the sale of any assets other than real property, it will be included as an operating expense for purposes of the 2%/25% Limitation. In connection with the sale of
F-35
STEADFAST APARTMENT REIT, INC.
NOTES TO CONSOLIDATED FINANCIAL STATEMENTS - CONTINUED
DECEMBER 31, 2019
securities, the disposition fee may be paid to an affiliate of the Advisor that is registered as a FINRA member broker-dealer if applicable FINRA rules would prohibit the payment of the disposition fee to a firm that is not a registered broker-dealer.
Selling Commissions and Dealer Manager Fees
The Company entered into the Dealer Manager Agreement with the Dealer Manager in connection with the Public Offering. The Company paid the Dealer Manager up to 7% and 3% of the gross offering proceeds from the Primary Offering as selling commissions and dealer manager fees, respectively. The Dealer Manager reallowed 100% of sales commissions earned to participating broker-dealers. The Dealer Manager could also reallow to any participating broker-dealer a portion of the dealer manager fee that was attributable to that participating broker-dealer for certain marketing costs of that participating broker-dealer. The Dealer Manager negotiated the reallowance of the dealer manager fee on a case-by-case basis with each participating broker-dealer subject to various factors associated with the cost of the marketing program. The Company allowed a participating broker-dealer to elect to receive the 7% selling commissions at the time of sale or elect to have the selling commission paid on a trailing basis. A participating broker-dealer that elected to receive a trailing selling commission is paid as follows: 3% at the time of sale and the remaining 4% paid ratably (1% per year) on each of the first four anniversaries of the sale. A reduced selling commission and dealer manager fee was paid in connection with volume discounts and certain other categories of sales. No selling commissions or dealer manager fee was paid with respect to shares of common stock issued pursuant to the DRP. The Company terminated the Public Offering on March 24, 2016, and as of December 31, 2019 and 2018, expects to pay trailing selling commissions of $71,287 and $299,952, respectively, which were charged to additional paid-in capital and included within amounts due to affiliates in the accompanying consolidated balance sheets.
8. Incentive Award Plan and Independent Director Compensation
The Company has adopted an incentive award plan (the “Incentive Award Plan”) that provides for the grant of equity awards to its employees, directors and consultants and those of the Company’s affiliates. The Incentive Award Plan authorizes the grant of non-qualified and incentive stock options, restricted stock awards, restricted stock units, stock appreciation rights, dividend equivalents and other stock-based awards or cash-based awards.
Under the Company’s independent directors’ compensation plan, which is a sub-plan of the Incentive Award Plan, each of the Company’s independent directors received 3,333 shares of restricted common stock once the Company raised $2,000,000 in gross offering proceeds in the Public Offering. Each subsequent independent director that joins the Company’s board of directors receives 3,333 shares of restricted common stock upon election to the Company’s board of directors. In addition, on the date following an independent director’s re-election to the Company’s board of directors, he or she receives 1,666 shares of restricted common stock. One-fourth of the shares of restricted common stock generally vest and become non-forfeitable upon issuance and the remaining portion will vest in three equal annual installments beginning on the date of grant and ending on the third anniversary of the date of grant; provided, however, that the restricted stock will become fully vested and become non-forfeitable on the earlier to occur of (1) the termination of the independent director’s service as a director due to his or her death or disability, or (2) a change in control of the Company. These restricted stock awards entitle the holders to participate in distributions even if the shares are not fully vested.
The Company recorded stock-based compensation expense of $71,250, $74,617 and $79,858 for the years ended December 31, 2019, 2018 and 2017, respectively, related to the independent directors’ restricted common stock.
In addition to the stock awards, the Company pays each of its independent directors an annual retainer of $55,000, prorated for any partial term (the audit committee chairperson receives an additional $10,000 annual retainer, prorated for any partial term). The independent directors are also paid for attending meetings as follows: (i) $2,500 for each board meeting attended in person, (ii) $1,500 for each committee meeting attended in person in such director’s capacity as a committee member, (iii) $1,000 for each board meeting attended via teleconference (not to exceed $4,000 for any one set of meetings attended on any given day). In connection with meetings of the special committee, the independent directors received $1,000 for each teleconference meeting and $1,500 for each in-person meeting. The chairman of the special committee also received a $50,000 retainer and the other special committee members received a $42,500 retainer. All directors also receive reimbursement of reasonable out of pocket expenses incurred in connection with attendance at meetings of the board of directors. Director compensation is an operating expense of the Company that is subject to the operating expense reimbursement obligation of the Advisor discussed in Note 7 (Related Party Arrangements). For the years ended December 31, 2019, 2018 and 2017, the Company recorded an operating expense of $395,000, $496,000 and $242,500, respectively, which is included in general and administrative expenses in the accompanying consolidated statements of operations and capitalized $13,500, $0 and $0, respectively, which is included in building and improvements in the accompanying consolidated balance sheets, related to the
F-36
STEADFAST APARTMENT REIT, INC.
NOTES TO CONSOLIDATED FINANCIAL STATEMENTS - CONTINUED
DECEMBER 31, 2019
independent directors’ annual retainer and attending board meetings. As of December 31, 2019 and 2018, $61,750 and $151,750, respectively, related to the independent directors’ annual retainer and board meetings attendance is included in accounts payable and accrued liabilities in the consolidated balance sheets.
9. Commitments and Contingencies
Economic Dependency
The Company is dependent on the Advisor for certain services that are essential to the Company, including the identification, evaluation, negotiation, purchase and disposition of real estate and real estate-related investments; management of the daily operations of the Company’s real estate and real estate-related investment portfolio; and other general and administrative responsibilities. In the event that the Advisor is unable to provide such services, the Company will be required to obtain such services from other sources. The Company may not be able to retain services from such other sources on favorable terms or at all.
Concentration of Credit Risk
The geographic concentration of the Company’s portfolio makes it particularly susceptible to adverse economic developments in the Atlanta, Georgia, Dallas/Fort Worth, Texas and Nashville, Tennessee apartment markets. Any adverse economic or real estate developments in these markets, such as business layoffs or downsizing, relocations of businesses, increased competition from other apartment communities, decrease in demand for apartments or any other changes, could adversely affect the Company’s operating results and its ability to make distributions to stockholders.
Environmental
As an owner of real estate, the Company is subject to various environmental laws of federal, state and local governments. The Company is not aware of any environmental liability that could have a material adverse effect on its financial condition or results of operations. However, changes in applicable environmental laws and regulations, the uses and conditions of properties in the vicinity of the Company’s properties, the activities of its tenants and other environmental conditions of which the Company is unaware with respect to the properties could result in future environmental liabilities.
Legal Matters
From time to time, the Company is subject, or party, to legal proceedings that arise in the ordinary course of its business. Management is not aware of any legal proceedings of which the outcome is reasonably likely to have a material adverse effect on the Company’s results of operations or financial condition nor is the Company aware of any such legal proceedings contemplated by government agencies.
10. Derivative Financial Instruments
The Company uses interest rate derivatives with the objective of managing exposure to interest rate movements thereby minimizing the effect of interest rate changes and the effect they could have on future cash flows. Interest rate cap agreements are used to accomplish this objective. The following table provides the terms of the Company’s interest rate derivative instruments that were in effect at December 31, 2019 and 2018:
December 31, 2019 | ||||||||||||||||||
Type | Maturity Date Range | Based on | Number of Instruments | Notional Amount | Variable Rate | Weighted Average Rate Cap | Fair Value | |||||||||||
Interest Rate Cap | 1/1/2020 - 8/1/2021 | One-Month LIBOR | 9 | $ | 343,017,350 | 1.76% | 3.45% | $ | 132 | |||||||||
December 31, 2018 | ||||||||||||||||||
Type | Maturity Date Range | Based on | Number of Instruments | Notional Amount | Variable Rate | Weighted Average Rate Cap | Fair Value | |||||||||||
Interest Rate Cap | 1/1/2019 - 8/1/2021 | One-Month LIBOR | 22 | $ | 713,237,850 | 2.52% | 3.46% | $ | 207,769 | |||||||||
F-37
STEADFAST APARTMENT REIT, INC.
NOTES TO CONSOLIDATED FINANCIAL STATEMENTS - CONTINUED
DECEMBER 31, 2019
The interest rate cap agreements are not designated as effective cash flow hedges. Accordingly, the Company records any changes in the fair value of the interest rate cap agreements as interest expense. The change in the fair value of the interest rate cap agreements for the years ended December 31, 2019, 2018 and 2017, resulted in an unrealized loss (gain) of $225,637, $(87,160) and $447,668, respectively, which is included in interest expense in the accompanying consolidated statements of operations. During the years ended December 31, 2019 and 2018, the Company acquired interest rate cap agreements of $18,000 and $43,200, respectively, and received settlement proceeds from interest rate cap agreements of $0 and $270,000, respectively. The fair value of the interest rate cap agreements of $132 and $207,769 as of December 31, 2019 and 2018, respectively, is included in other assets on the accompanying consolidated balance sheets.
11. Selected Quarterly Results (unaudited)
Presented below is a summary of the Company’s unaudited quarterly financial information for the years ended December 31, 2019 and 2018:
First Quarter | Second Quarter | Third Quarter | Fourth Quarter | Total | |||||||||||||||||
2019 | |||||||||||||||||||||
Revenues | $ | 42,585,226 | $ | 43,214,828 | $ | 44,190,840 | $ | 43,544,785 | $ | 173,535,679 | |||||||||||
Net loss | $ | (12,359,273 | ) | $ | (11,993,009 | ) | $ | (10,389,807 | ) | $ | (3,782,227 | ) | $ | (38,524,316 | ) | ||||||
Loss per common share, basic and diluted | $ | (0.24 | ) | $ | (0.23 | ) | $ | (0.20 | ) | $ | (0.07 | ) | $ | (0.74 | ) | ||||||
Distributions declared per common share | $ | 0.222 | $ | 0.224 | $ | 0.227 | $ | 0.227 | $ | 0.900 | |||||||||||
2018 | |||||||||||||||||||||
Revenues | $ | 41,179,932 | $ | 42,288,498 | $ | 43,096,196 | $ | 42,559,562 | $ | 169,124,188 | |||||||||||
Net loss | $ | (8,018,094 | ) | $ | (8,946,178 | ) | $ | (20,671,331 | ) | $ | (11,464,743 | ) | $ | (49,100,346 | ) | ||||||
Loss per common share, basic and diluted | $ | (0.16 | ) | $ | (0.17 | ) | $ | (0.40 | ) | $ | (0.23 | ) | $ | (0.96 | ) | ||||||
Distributions declared per common share | $ | 0.222 | $ | 0.224 | $ | 0.227 | $ | 0.227 | $ | 0.900 | |||||||||||
12. Subsequent Events
Distributions Paid
On January 2, 2020, the Company paid distributions of $4,021,509, which related to distributions declared for each day in the period from December 1, 2019 through December 31, 2019 and consisted of cash distributions paid in the amount of $2,277,269 and $1,744,240 in shares issued pursuant to the DRP.
On February 3, 2020, the Company paid distributions of $4,018,365, which related to distributions declared for each day in the period from January 1, 2020 through January 31, 2020 and consisted of cash distributions paid in the amount of $2,285,142 and $1,733,223 in shares issued pursuant to the DRP.
On March 2, 2020, the Company paid distributions of $3,762,953, which related to distributions declared for each day in the period from February 1, 2020 through February 29, 2020 and consisted of cash distributions paid in the amount of $2,154,494 and $1,608,459 in shares issued pursuant to the DRP.
Shares Repurchased
On January 31, 2020, the Company repurchased 53,152 shares of its common stock for a total repurchase value of $797,289, or $15.00 average price per share, pursuant to the Company’s share repurchase plan.
Acquisition of Eleven10 at Farmers Market
On January 28, 2020, the Company acquired a fee simple interest in Eleven10 at Farmers Market (the “Farmers Market Property”) located in Dallas, Texas, for a purchase price of $61,000,000, exclusive of closing costs. The Company financed the acquisition of the Farmers Market Property with a combination of: (1) cash proceeds from the dispositions of Randall Highlands and Club at Summer Valley in a tax-free exchange pursuant to Section 1031 of the Internal Revenue Code and (2) the assumption of a loan in the aggregate principal amount of $36,515,122. The Farmers Market Property contains 313 apartment homes consisting of 70 studio apartments, 168 one-bedroom apartments, 73 two-bedroom apartments and two three-bedroom apartments that average 837 square feet.
F-38
STEADFAST APARTMENT REIT, INC.
NOTES TO CONSOLIDATED FINANCIAL STATEMENTS - CONTINUED
DECEMBER 31, 2019
Disposition of Terrace Cove Apartment Homes
On February 5, 2020, the Company, through STAR Terrace Cove, LLC (“STAR Terrace Cove”), an indirect, wholly-owned subsidiary of the Company, sold its fee simple interest in Terrace Cove Apartment Homes, a 304-unit multifamily property located in Austin, Texas, to an unaffiliated third-party buyer. STAR Terrace Cove sold Terrace Cove Apartment Homes for an aggregate sales price of $33,875,000, excluding closing costs, resulting in a gain of $11,384,616, which includes reductions to the net book value of the property due to historical depreciation and amortization expense.
Acquisition of Patina Flats at the Foundry
On February 11, 2020, the Company acquired a fee simple interest in Patina Flats at the Foundry (the “Patina Flats Property”) located in Loveland, Colorado, for a purchase price of $44,100,000, exclusive of closing costs. The Company financed the acquisition of the Patina Flats Property with a combination of: (1) cash proceeds from the disposition of Terrace Cove Apartment Homes in a tax-free exchange pursuant to Section 1031 of the Internal Revenue Code and (2) an advance of $31,271,471 pursuant to the Company’s MCFA. The Patina Flats Property contains 155 apartment homes consisting of 44 studio apartments, 80 one-bedroom apartments, 27 two-bedroom apartments and four three-bedroom apartments that average 685 square feet, in addition to seven retail spaces with 15,206 square feet.
Amendment to the MCFA
On February 11, 2020, in connection with the financing of the Patina Flats Property, the Company and the Facility Lender amended the MCFA to include as collateral for the MCFA the Patina Flats Property and Fielders Creek, an unencumbered multifamily property owned by the Company. The Company also increased its outstanding borrowings pursuant to the MCFA by $40,468,000, a portion of which was attributable to the acquisition of the Patina Flats Property.
Mergers
Merger with Steadfast Income REIT, Inc.
On August 5, 2019, the Company, SIR, the Operating Partnership, the operating partnership of SIR and SIR Merger Sub entered into the SIR Merger Agreement. Pursuant to the terms and conditions of the SIR Merger Agreement, on March 6, 2020, SIR merged with and into SIR Merger Sub with SIR Merger Sub surviving the SIR Merger. Following the SIR Merger, SIR Merger Sub, as the surviving entity, will continue as the Company’s wholly-owned subsidiary. In accordance with the applicable provisions of the MGCL, the separate existence of SIR ceased.
At the effective time of the SIR Merger, each issued and outstanding share of SIR common stock (or a fraction thereof), $0.01 par value per share converted into 0.5934 shares of the Company’s common stock.
Merger with Steadfast Apartment REIT III, Inc.
On August 5, 2019, the Company, STAR III, the Operating Partnership, the operating partnership of STAR III and STAR III Merger Sub entered into the STAR III Merger Agreement. Pursuant to the terms and conditions of the STAR III Merger Agreement, on March 6, 2020, STAR III merged with and into STAR III Merger Sub with STAR III Merger Sub surviving the STAR III Merger. Following the STAR III Merger, STAR III Merger Sub, as the surviving entity, will continue as a wholly-owned subsidiary of the Company. In accordance with the applicable provisions of the MGCL, the separate existence of STAR III ceased.
At the effective time of the STAR III Merger, each issued and outstanding share of STAR III common stock (or a fraction thereof), $0.01 par value per share was converted into 1.430 shares of the Company’s common stock.
Combined Company
The combined company after the mergers retains the name “Steadfast Apartment REIT, Inc.” Each merger is intended to qualify as a “reorganization” under, and within the meaning of, Section 368(a) of the Internal Revenue Code.
As of the closing of the mergers, the Company’s portfolio (unaudited) consisted of (1) 69 properties (including one property held for development) in 14 states, with an average effective rent of $1,173 and (2) a 10% interest in one unconsolidated joint venture that owned 20 multifamily properties with a total of 4,584 apartment homes. Based on occupancy as of December 31, 2019, the Company’s portfolio had an occupancy rate of 94.9%, an average age of 20 years and gross real estate assets value of $3,375,635,000 (unaudited).
F-39
STEADFAST APARTMENT REIT, INC.
NOTES TO CONSOLIDATED FINANCIAL STATEMENTS - CONTINUED
DECEMBER 31, 2019
As a result of the completion of the mergers, the Company’s financial information materially changed; however, the financial information included in this Annual Report on Form 10-K reflects only the Company’s stand-alone, historical financial results.
Amended and Restated Advisory Agreement
In connection with the closing of the mergers, the Company and the Advisor entered into an Amended and Restated Advisory Agreement. For more information on the Amended and Restated Advisory Agreement, see Item 13 “Certain Relationships and Related Transactions, and Director Independence—Amended and Restated Advisory Agreement.”
Class A Convertible Stock
In connection with the closing of the mergers, the Company and the Advisor exchanged the then outstanding convertible stock for new Class A convertible stock. For more information on the Amended and Restated Advisory Agreement, see Item 13 “Certain Relationships and Related Transactions, and Director Independence—Class A Convertible Stock.”
Distributions Declared
On March 10, 2020, the Company’s board of directors approved and authorized a daily distribution to stockholders of record as of the close of business on each day of the period commencing on April 1, 2020 and ending on June 30, 2020. The distributions will be equal to $0.002459 per share of the Company’s common stock per day. The distributions for each record date in April 2020, May 2020 and June 2020 will be paid in May 2020, June 2020 and July 2020, respectively. The distributions will be payable to stockholders from legally available funds therefor.
Expansion of Our Board of Directors
At the time of the closing of the SIR Merger and the STAR III Merger, the Company’s board of directors increased the size of the board of directors from five members to seven members. The Company’s board of directors also appointed Ned W. Brines and Stephen R. Bowie to the board of directors. Mr. Brines previously served as a board member of SIR and STAR III and Mr. Bowie previously served as a board member of STAR III. Messrs. Brines and Bowie are independent directors.
Shares Issued to New Board Members
On March 6, 2020, the Company issued 3,333 restricted shares of common stock to each of Ned W. Brines and Stephen R. Bowie in connection with their appointment to the Company’s board of directors.
F-40
STEADFAST APARTMENT REIT, INC.
SCHEDULE III
REAL ESTATE ASSETS AND ACCUMULATED DEPRECIATION AND AMORTIZATION
DECEMBER 31, 2019
Initial Cost of Company(2) | Gross Amount at which Carried at Close of Period | ||||||||||||||||||||||||||||||||||||||||||||
Description | Location | Ownership Percent | Encumbrances(1) | Land | Building and Improvements(3) | Total | Cost Capitalized Subsequent to Acquisition | Land | Building and Improvements(3) | Total(4) | Accumulated Depreciation | Original Date of Construction | Date Acquired | ||||||||||||||||||||||||||||||||
Villages at Spring Hill Apartments | Spring Hill, TN | 100 | % | $ | — | $ | 1,130,314 | $ | 13,069,686 | $ | 14,200,000 | $ | 2,866,240 | $ | 1,130,314 | $ | 15,516,306 | $ | 16,646,620 | $ | (4,343,566 | ) | 1994 | 5/22/2014 | |||||||||||||||||||||
Harrison Place Apartments | Indianapolis, IN | 100 | % | — | 3,087,687 | 24,776,563 | 27,864,250 | 3,319,331 | 3,087,687 | 27,608,137 | 30,695,824 | (7,161,240 | ) | 2001 | 6/30/2014 | ||||||||||||||||||||||||||||||
Terrace Cove Apartment Homes | Austin, TX | 100 | % | — | 5,469,361 | 18,030,639 | 23,500,000 | 4,572,901 | 5,469,361 | 21,816,215 | 27,285,576 | (5,619,814 | ) | 1986 | 8/28/2014 | ||||||||||||||||||||||||||||||
The Residences on McGinnis Ferry | Suwanee, GA | 100 | % | — | 8,682,823 | 89,817,177 | 98,500,000 | 12,263,306 | 8,682,823 | 99,936,598 | 108,619,421 | (24,102,324 | ) | 1998/2002 | 10/16/2014 | ||||||||||||||||||||||||||||||
The 1800 at Barrett Lakes | Kennesaw, GA | 100 | % | 40,623,442 | 7,012,787 | 41,987,213 | 49,000,000 | 9,322,646 | 7,012,787 | 50,080,305 | 57,093,092 | (12,761,547 | ) | 1988/1997 | 11/20/2014 | ||||||||||||||||||||||||||||||
The Oasis | Colorado Springs, CO | 100 | % | 39,499,673 | 4,325,607 | 35,674,393 | 40,000,000 | 4,090,982 | 4,325,607 | 38,967,139 | 43,292,746 | (9,194,939 | ) | 1996 | 12/19/2014 | ||||||||||||||||||||||||||||||
Columns on Wetherington | Florence, KY | 100 | % | — | 1,276,787 | 23,723,213 | 25,000,000 | 2,697,507 | 1,276,787 | 25,870,327 | 27,147,114 | (6,175,033 | ) | 2002 | 2/26/2015 | ||||||||||||||||||||||||||||||
Preston Hills at Mill Creek | Buford, GA | 100 | % | — | 5,813,218 | 45,186,782 | 51,000,000 | 7,382,247 | 5,813,218 | 50,976,336 | 56,789,554 | (12,308,044 | ) | 2000 | 3/10/2015 | ||||||||||||||||||||||||||||||
Eagle Lake Landing Apartments | Speedway, IN | 100 | % | — | 1,607,980 | 17,592,020 | 19,200,000 | 1,807,409 | 1,607,980 | 18,741,236 | 20,349,216 | (3,794,866 | ) | 1976 | 3/27/2015 | ||||||||||||||||||||||||||||||
Reveal on Cumberland | Fishers, IN | 100 | % | 20,827,267 | 3,299,502 | 25,939,054 | 29,238,556 | 806,236 | 3,299,502 | 26,257,503 | 29,557,005 | (5,502,265 | ) | 2014 | 3/30/2015 | ||||||||||||||||||||||||||||||
Heritage Place Apartments | Franklin, TN | 100 | % | 8,590,932 | 1,697,036 | 7,952,964 | 9,650,000 | 2,114,454 | 1,697,036 | 9,886,777 | 11,583,813 | (2,513,721 | ) | 1982 | 4/27/2015 | ||||||||||||||||||||||||||||||
Rosemont at East Cobb | Marietta, GA | 100 | % | 13,258,252 | 3,599,586 | 12,850,414 | 16,450,000 | 4,009,030 | 3,599,586 | 16,245,972 | 19,845,558 | (4,149,120 | ) | 1980 | 5/21/2015 | ||||||||||||||||||||||||||||||
Ridge Crossings Apartments | Hoover, AL | 100 | % | 57,668,758 | 7,747,295 | 64,252,705 | 72,000,000 | 7,684,306 | 7,747,295 | 70,108,207 | 77,855,502 | (15,173,252 | ) | 1991 | 5/28/2015 | ||||||||||||||||||||||||||||||
Bella Terra at City Center | Aurora, CO | 100 | % | — | 5,895,389 | 31,704,611 | 37,600,000 | 4,091,541 | 5,895,389 | 34,992,146 | 40,887,535 | (8,007,284 | ) | 1980 | 6/11/2015 | ||||||||||||||||||||||||||||||
Hearthstone at City Center | Aurora, CO | 100 | % | — | 7,219,143 | 46,180,857 | 53,400,000 | 6,391,865 | 7,219,143 | 50,961,362 | 58,180,505 | (11,516,127 | ) | 1984 | 6/25/2015 | ||||||||||||||||||||||||||||||
Arbors at Brookfield | Mauldin, SC | 100 | % | — | 7,553,349 | 59,246,651 | 66,800,000 | 10,272,478 | 7,553,349 | 67,780,979 | 75,334,328 | (14,812,776 | ) | 1989 | 6/30/2015 | ||||||||||||||||||||||||||||||
Carrington Park | Kansas City, MO | 100 | % | — | 2,517,886 | 36,962,114 | 39,480,000 | 3,082,972 | 2,517,886 | 39,143,330 | 41,661,216 | (7,535,022 | ) | 2007 | 8/19/2015 | ||||||||||||||||||||||||||||||
Delano at North Richland Hills | North Richland Hills, TX | 100 | % | 31,814,165 | 3,941,458 | 34,558,542 | 38,500,000 | 4,390,514 | 3,941,458 | 37,921,586 | 41,863,044 | (8,373,974 | ) | 2003 | 8/26/2015 | ||||||||||||||||||||||||||||||
F-41
STEADFAST APARTMENT REIT, INC.
SCHEDULE III
REAL ESTATE ASSETS AND ACCUMULATED DEPRECIATION AND AMORTIZATION
DECEMBER 31, 2019
Initial Cost of Company(2) | Gross Amount at which Carried at Close of Period | ||||||||||||||||||||||||||||||||||||||||||||
Description | Location | Ownership Percent | Encumbrances(1) | Land | Building and Improvements(3) | Total | Cost Capitalized Subsequent to Acquisition | Land | Building and Improvements(3) | Total(4) | Accumulated Depreciation | Original Date of Construction | Date Acquired | ||||||||||||||||||||||||||||||||
Meadows at North Richland Hills | North Richland Hills, TX | 100 | % | $ | 26,580,102 | $ | 4,054,337 | $ | 28,545,663 | $ | 32,600,000 | $ | 4,142,575 | $ | 4,054,337 | $ | 31,757,691 | $ | 35,812,028 | $ | (7,351,708 | ) | 1999 | 8/26/2015 | |||||||||||||||||||||
Kensington by the Vineyard | Euless, TX | 100 | % | 34,111,658 | 3,938,677 | 42,261,323 | 46,200,000 | 1,273,401 | 3,938,677 | 42,288,541 | 46,227,218 | (7,678,065 | ) | 1997 | 8/26/2015 | ||||||||||||||||||||||||||||||
Monticello by the Vineyard | Euless, TX | 100 | % | 41,229,964 | 5,386,400 | 46,813,600 | 52,200,000 | 4,504,090 | 5,386,400 | 49,993,880 | 55,380,280 | (10,245,545 | ) | 2002 | 9/23/2015 | ||||||||||||||||||||||||||||||
The Shores | Oklahoma City, OK | 100 | % | 23,653,152 | 2,100,531 | 34,149,469 | 36,250,000 | 447,089 | 2,100,531 | 33,678,096 | 35,778,627 | (5,691,021 | ) | 2013 | 9/29/2015 | ||||||||||||||||||||||||||||||
Lakeside at Coppell | Coppell, TX | 100 | % | 47,883,143 | 4,789,210 | 55,710,790 | 60,500,000 | 2,257,271 | 4,789,210 | 56,433,998 | 61,223,208 | (10,016,155 | ) | 1999 | 10/7/2015 | ||||||||||||||||||||||||||||||
Meadows at River Run | Bolingbrook, IL | 100 | % | 42,438,707 | 1,899,956 | 56,600,044 | 58,500,000 | 4,315,692 | 1,899,956 | 59,554,925 | 61,454,881 | (11,076,712 | ) | 2001 | 10/30/2015 | ||||||||||||||||||||||||||||||
PeakView at T-Bone Ranch | Greeley, CO | 100 | % | — | 2,461,583 | 37,838,417 | 40,300,000 | 1,708,157 | 2,461,583 | 38,738,340 | 41,199,923 | (6,420,582 | ) | 2002 | 12/11/2015 | ||||||||||||||||||||||||||||||
Park Valley Apartments | Smyrna, GA | 100 | % | 48,575,513 | 9,991,810 | 41,408,190 | 51,400,000 | 6,665,625 | 9,991,810 | 46,857,826 | 56,849,636 | (9,238,653 | ) | 1987 | 12/11/2015 | ||||||||||||||||||||||||||||||
PeakView by Horseshoe Lake | Loveland, CO | 100 | % | 38,003,137 | 2,436,847 | 41,763,153 | 44,200,000 | 2,254,179 | 2,436,847 | 43,210,077 | 45,646,924 | (7,778,423 | ) | 2002 | 12/18/2015 | ||||||||||||||||||||||||||||||
Stoneridge Farms | Smyrna, TN | 100 | % | 45,340,950 | 4,064,811 | 43,685,189 | 47,750,000 | 4,075,414 | 4,064,811 | 46,765,284 | 50,830,095 | (8,222,816 | ) | 2005 | 12/30/2015 | ||||||||||||||||||||||||||||||
Fielder’s Creek | Englewood, CO | 100 | % | — | 4,219,943 | 28,180,057 | 32,400,000 | 2,128,715 | 4,219,943 | 29,633,703 | 33,853,646 | (5,059,781 | ) | 1983 | 3/23/2016 | ||||||||||||||||||||||||||||||
Landings of Brentwood | Brentwood, TN | 100 | % | — | 14,525,434 | 95,474,566 | 110,000,000 | 10,327,187 | 14,525,434 | 102,562,037 | 117,087,471 | (16,666,054 | ) | 1986-89 | 5/18/2016 | ||||||||||||||||||||||||||||||
1250 West Apartments | Marietta, GA | 100 | % | — | 9,304,511 | 46,467,989 | 55,772,500 | 2,419,683 | 9,304,511 | 47,302,830 | 56,607,341 | (6,652,226 | ) | 1987 / 95 | 8/12/2016 | ||||||||||||||||||||||||||||||
Sixteen50 @ Lake Ray Hubbard | Rockwall, TX | 100 | % | — | 5,712,311 | 57,616,149 | 63,328,460 | 1,464,366 | 5,712,311 | 57,617,912 | 63,330,223 | (7,510,205 | ) | 2009 | 9/29/2016 | ||||||||||||||||||||||||||||||
Garrison Station | Murfreesboro, TN | 100 | % | — | 2,469,183 | 3,218,794 | 5,687,977 | — | 2,469,183 | 3,218,794 | 5,687,977 | — | N/A | 5/30/2019 | |||||||||||||||||||||||||||||||
$ | 560,098,815 | $ | 159,232,752 | $ | 1,289,238,991 | $ | 1,448,471,743 | $ | 139,149,411 | $ | 159,232,752 | $ | 1,392,424,395 | $ | 1,551,657,147 | $ | (282,652,860 | ) | |||||||||||||||||||||||||||
______________
(1) Encumbrances are net of deferred financing costs associated with the loans for each individual property listed above.
(2) Initial Cost of Company represents costs at acquisition that are included in real estate on the accompanying consolidated balance sheets.
(3) Building and improvements include tenant origination and absorption costs.
F-42
STEADFAST APARTMENT REIT, INC.
SCHEDULE III
REAL ESTATE ASSETS AND ACCUMULATED DEPRECIATION AND AMORTIZATION
DECEMBER 31, 2019
(4) The aggregate cost of real estate for federal income tax purposes was $1.6 billion (unaudited) as of December 31, 2019.
(5) Encumbrances exclude the principal balance of $551,669,000 and associated deferred financing costs of $3,208,770 related to the master credit facility.
A summary of activity for real estate and accumulated depreciation for the years ended December 31, 2019, 2018 and 2017:
2019 | 2018 | 2017 | ||||||||||
Real Estate: | ||||||||||||
Balance at the beginning of the year | $ | 1,575,311,904 | $ | 1,558,892,731 | $ | 1,535,484,890 | ||||||
Acquisitions | 5,687,977 | — | — | |||||||||
Improvements | 26,699,432 | 16,960,862 | 26,307,813 | |||||||||
Cost of real estate sold | (55,806,464 | ) | — | — | ||||||||
Write-off of disposed and fully depreciated and amortized assets | (235,702 | ) | (541,689 | ) | (2,899,972 | ) | ||||||
Balance at the end of the year | $ | 1,551,657,147 | $ | 1,575,311,904 | $ | 1,558,892,731 | ||||||
Accumulated depreciation: | ||||||||||||
Balance at the beginning of the year | $ | 218,672,162 | $ | 147,726,630 | $ | 82,099,725 | ||||||
Depreciation expense | 73,781,883 | 70,993,280 | 68,417,556 | |||||||||
Write-off of accumulated depreciation and amortization of real estate assets sold | (9,768,019 | ) | — | — | ||||||||
Write-off of disposed and fully depreciated and amortized assets | (33,166 | ) | (47,748 | ) | (2,790,651 | ) | ||||||
Balance at the end of the year | $ | 282,652,860 | $ | 218,672,162 | $ | 147,726,630 | ||||||
F-43
SIGNATURES
Pursuant to the requirements of Section 13 or 15(d) of the Securities Exchange Act of 1934, the registrant has duly caused this report to be signed on its behalf by the undersigned, thereunto duly authorized, in the City of Irvine, State of California, on March 12, 2020.
Steadfast Apartment REIT, Inc. | ||
By: | /s/ Rodney F. Emery | |
Rodney F. Emery | ||
Chief Executive Officer and Chairman of the Board | ||
Pursuant to the requirements of the Securities Exchange Act of 1934, this report has been signed below by the following persons on behalf of the registrant and in the capacities and on the dates indicated:
Name | Title | Date | ||
Chief Executive Officer and | ||||
/s/ Rodney F. Emery | Chairman of the Board | |||
Rodney F. Emery | (principal executive officer) | March 12, 2020 | ||
Chief Financial Officer and Treasurer | ||||
/s/ Kevin J. Keating | (principal financial officer and principal accounting officer) | March 12, 2020 | ||
Kevin J. Keating | ||||
/s/ Ella S. Neyland | President and Director | |||
Ella S. Neyland | March 12, 2020 | |||
/s/ G. Brian Christie | Director | |||
G. Brian Christie | March 12, 2020 | |||
/s/ Thomas H. Purcell | Director | |||
Thomas H. Purcell | March 12, 2020 | |||
/s/ Kerry D. Vandell | Director | |||
Kerry D. Vandell | March 12, 2020 | |||
/s/ Ned W. Brines | Director | |||
Ned W. Brines | March 12, 2020 | |||
/s/ Stephen R. Bowie | Director | March 12, 2020 | ||
Stephen R. Bowie | ||||