Attached files
| file | filename |
|---|---|
| EX-32.2 - EX-32.2 - Select Interior Concepts, Inc. | ck1723866-ex322_11.htm |
| EX-32.1 - EX-32.1 - Select Interior Concepts, Inc. | ck1723866-ex321_9.htm |
| EX-31.2 - EX-31.2 - Select Interior Concepts, Inc. | ck1723866-ex312_7.htm |
| EX-31.1 - EX-31.1 - Select Interior Concepts, Inc. | ck1723866-ex311_8.htm |
| EX-23.1 - EX-23.1 - Select Interior Concepts, Inc. | ck1723866-ex231_6.htm |
| EX-21.1 - EX-21.1 - Select Interior Concepts, Inc. | ck1723866-ex211_10.htm |
| EX-10.31 - EX-10.31 - Select Interior Concepts, Inc. | ck1723866-ex1031_238.htm |
| EX-10.30 - EX-10.30 - Select Interior Concepts, Inc. | ck1723866-ex1030_240.htm |
| EX-10.29 - EX-10.29 - Select Interior Concepts, Inc. | ck1723866-ex1029_241.htm |
| EX-10.28 - EX-10.28 - Select Interior Concepts, Inc. | ck1723866-ex1028_237.htm |
| EX-10.8 - EX-10.8 - Select Interior Concepts, Inc. | ck1723866-ex108_124.htm |
| EX-4.1 - EX-4.1 - Select Interior Concepts, Inc. | ck1723866-ex41_126.htm |
UNITED STATES
SECURITIES AND EXCHANGE COMMISSION
Washington, D.C. 20549
FORM 10-K
(Mark One)
|
☒ |
ANNUAL REPORT PURSUANT TO SECTION 13 OR 15(d) OF THE SECURITIES EXCHANGE ACT OF 1934 |
For the fiscal year ended December 31, 2019
OR
|
☐ |
TRANSITION REPORT PURSUANT TO SECTION 13 OR 15(d) OF THE SECURITIES EXCHANGE ACT OF 1934 FOR THE TRANSITION PERIOD FROM TO |
Commission File Number: 001-38632
SELECT INTERIOR CONCEPTS, INC.
(Exact name of Registrant as specified in its Charter)
|
Delaware |
47-4640296 |
|
(State or other jurisdiction of incorporation or organization) |
(I.R.S. Employer |
|
|
|
|
400 Galleria Parkway, Suite 1760 Atlanta, Georgia |
30339 |
|
(Address of principal executive offices) |
(Zip Code) |
Registrant’s telephone number, including area code: (888) 701-4737
Securities registered pursuant to Section 12(b) of the Act:
|
Title of each class |
|
Trading Symbol(s) |
|
Name of each exchange on which registered |
|
Class A Common Stock, par value $0.01 per share |
|
SIC |
|
The Nasdaq Stock Market LLC |
Securities registered pursuant to Section 12(g) of the Act: None
Indicate by check mark if the Registrant is a well-known seasoned issuer, as defined in Rule 405 of the Securities Act. YES ☐ NO ☒
Indicate by check mark if the Registrant is not required to file reports pursuant to Section 13 or 15(d) of the Act. YES ☐ NO ☒
Indicate by check mark whether the Registrant: (1) has filed all reports required to be filed by Section 13 or 15(d) of the Securities Exchange Act of 1934 during the preceding 12 months (or for such shorter period that the Registrant was required to file such reports), and (2) has been subject to such filing requirements for the past 90 days. YES ☒ NO ☐
Indicate by check mark whether the Registrant has submitted electronically every Interactive Data File required to be submitted pursuant to Rule 405 of Regulation S-T (§232.405 of this chapter) during the preceding 12 months (or for such shorter period that the Registrant was required to submit such files). YES ☒ NO ☐
Indicate by check mark whether the registrant is a large accelerated filer, an accelerated filer, a non-accelerated filer, smaller reporting company, or an emerging growth company. See the definitions of “large accelerated filer,” “accelerated filer,” “smaller reporting company,” and “emerging growth company” in Rule 12b-2 of the Exchange Act.
|
Large accelerated filer |
|
☐ |
|
Accelerated filer |
|
☒ |
|
|
|
|
|
|||
|
Non-accelerated filer |
|
☐ |
|
Smaller reporting company |
|
☐ |
|
|
|
|
|
|
|
|
|
Emerging growth company |
|
☒ |
|
|
|
|
If an emerging growth company, indicate by check mark if the registrant has elected not to use the extended transition period for complying with any new or revised financial accounting standards provided pursuant to Section 13(a) of the Exchange Act. ☐
Indicate by check mark whether the Registrant is a shell company (as defined in Rule 12b-2 of the Exchange Act). YES ☐ NO ☒
The aggregate market value of the voting and non-voting common equity held by non-affiliates of the Registrant, based on the closing price of the shares of common stock on The Nasdaq Stock Market on June 30, 2019, was $285.7 million.
The number of shares of Registrant’s Common Stock outstanding as of March 1, 2020 was 25,181,857.
DOCUMENTS INCORPORATED BY REFERENCE
Certain portions of the Registrant’s Definitive Proxy Statement relating to its 2020 Annual Meeting of Stockholders (to be filed with the U.S. Securities and Exchange Commission not later than 120 days after the end of the fiscal year covered by this Annual Report) are incorporated by reference into Part III of this Annual Report on Form 10-K, as indicated herein.
|
|
|
Page |
|
|
|
|
|
Item 1. |
3 |
|
|
Item 1A. |
6 |
|
|
Item 1B. |
26 |
|
|
Item 2. |
26 |
|
|
Item 3. |
26 |
|
|
Item 4. |
26 |
|
|
|
|
|
|
|
|
|
|
Item 5. |
27 |
|
|
Item 6. |
29 |
|
|
Item 7. |
Management’s Discussion and Analysis of Financial Condition and Results of Operations |
30 |
|
Item 7A. |
43 |
|
|
Item 8. |
44 |
|
|
Item 9. |
Changes in and Disagreements With Accountants on Accounting and Financial Disclosure |
44 |
|
Item 9A. |
44 |
|
|
Item 9B. |
45 |
|
|
|
|
|
|
|
|
|
|
Item 10. |
46 |
|
|
Item 11. |
46 |
|
|
Item 12. |
Security Ownership of Certain Beneficial Owners and Management and Related Stockholder Matters |
46 |
|
Item 13. |
Certain Relationships and Related Transactions, and Director Independence |
46 |
|
Item 14. |
46 |
|
|
|
|
|
|
|
|
|
|
Item 15. |
47 |
|
|
Item 16 |
50 |
i
Special Note Regarding Forward-Looking Statements and Information
This Annual Report on Form 10-K for the fiscal year ended December 31, 2019 (which we refer to as this “Annual Report”) contains forward-looking statements and cautionary statements within the meaning of the federal securities laws. Forward-looking statements relate to expectations, beliefs, projections, forecasts, future plans and strategies, anticipated events or trends, and similar expressions concerning matters that are not historical facts. Some of the forward-looking statements can be identified by the use of terms such as “may,” “intend,” “might,” “plan,” “can,” “will,” “should,” “could,” “would,” “expect,” “believe,” “estimate,” “anticipate,” “continue,” “goal,” “predict,” “project,” “potential,” or the negative of these terms, and similar expressions. These forward-looking statements are subject to risks, contingencies, and uncertainties that are beyond our control. Further, new factors emerge from time to time that may cause our business not to develop as we expect, and it is not possible for us to predict all of them. Factors that may cause actual results to differ materially from those expressed or implied by the forward-looking statements include, but are not limited to, the following:
|
|
• |
the cyclical nature of our businesses and the seasonality of the building products supply and services industry; |
|
|
• |
our dependency upon the homebuilding industry, repair and remodel activity, the economy, the credit markets, and other important factors; |
|
|
• |
general economic and financial conditions; |
|
|
• |
competition in our highly fragmented industry and the markets in which we operate; |
|
|
• |
exposure to warranty, casualty, construction defect and various other claims and litigation; |
|
|
• |
product shortages, loss of key suppliers, our dependence on third-party suppliers and manufacturers, and the development of alternatives to distributors in the supply chain; |
|
|
• |
changes in the costs of the products we install; |
|
|
• |
ability to implement our business strategies and achieve our growth objectives; |
|
|
• |
acquisition and integration risks; |
|
|
• |
increased operating costs; |
|
|
• |
the impact of inflation and deflation; |
|
|
• |
our inability to attract and retain highly skilled employees; |
|
|
• |
adverse credit and financial markets events and conditions; |
|
|
• |
credit sale risks; |
|
|
• |
retention of key personnel; |
|
|
• |
performance of individual locations; |
|
|
• |
environmental, health and safety laws and regulations; |
|
|
• |
the impact of federal, state and local regulations; |
|
|
• |
computer data processing systems; |
|
|
• |
our inability to cancel before the end of the term or renew many of the leases for our facilities; |
|
|
• |
the loss of our significant customers or a reduction in the quantity of products they purchase; |
|
|
• |
requirements of being a public company; |
|
|
• |
risks related to our internal controls; |
|
|
• |
the possibility of securities litigation; |
1
|
|
• |
our inability to obtain additional capital on acceptable terms, if at all; |
|
|
• |
increases in interest rates; and |
|
|
• |
risks related to other factors discussed under “Risk Factors” and elsewhere in this Annual Report. |
You should read this Annual Report completely and with the understanding that actual future results may be materially different from expectations expressed in any forward-looking statements. All forward-looking statements made in this Annual Report are qualified by these cautionary statements. These forward-looking statements are made only as of the date of this Annual Report, and we do not undertake any obligation, other than as may be required by law, to update or revise any forward-looking statements to reflect changes in assumptions, the occurrence of events, unanticipated or otherwise, or changes in future operating results over time or otherwise.
Comparisons of results for current and any prior periods are not intended to express any future trends, or provide indications of future performance, and should only be viewed as historical data.
2
Company Overview
Select Interior Concepts, Inc. (collectively with all of its subsidiaries, “SIC,” the “Company,” “we,” “us” and “our”) is an installer and nationwide distributor of interior building products with market positions in residential interior design services.
Through our Residential Design Services (which we refer to as “RDS”) operating segment, we serve national and regional homebuilders by providing an integrated, outsourced solution for the design, consultation, sourcing, distribution and installation needs of their homebuyer customers. Through our 18 design centers, our designers work closely with homebuyers in the selection of a broad array of interior products and finishes, including flooring, cabinets, countertops, wall tile, and related interior items, primarily for newly constructed homes. We then coordinate the ordering, fulfillment and installation of many of these interior products to provide a streamlined experience for the homebuyer. With our design centers and our product sourcing and installation capabilities, we enable our homebuilder customers to outsource critical aspects of their business to us, thereby increasing their sales, profitability, and return on capital.
We also have leading market positions in the selection and importation of natural and engineered stone slabs for kitchen and bathroom countertops and specialty tiles through our Architectural Surfaces Group (which we refer to as “ASG”) operating segment. ASG sources natural and engineered stone from a global supply base, and markets these materials through a national network of distribution centers and showrooms at 23 different locations. In addition to serving the new residential and commercial construction markets with these materials, we also distribute them to the repair and remodel (which we refer to as “R&R”) market.
Our History
The SIC platform originated in September 2014, when affiliates of Trive Capital Management LLC (which we refer to as “Trive Capital”) acquired RDS, which in turn acquired the assets of PT Tile Holdings, LP (which we refer to as “Pinnacle”) in February 2015, and 100% of the equity interests in Greencraft Holdings, LLC (which we refer to as “Greencraft”) in December 2017. RDS then acquired the assets of Summit Stoneworks, LLC (which we refer to as “Summit”) in August 2018, 100% of the equity interests in T.A.C. Ceramic Tile Co. (which we refer to as “TAC”) in December 2018, and acquired the assets of Intown Design, Inc., Intown Granite of Charlotte, Inc., and Granitec, LLC, (collectively, “Intown”) in March 2019.
Affiliates of Trive Capital also formed a consolidation platform in the stone countertop market by acquiring 100% of the equity interests in Architectural Granite & Marble, LLC in June 2015, which in turn acquired the assets of Bermuda Import-Export, Inc. (which we refer to as “Modul”) in July 2016, 100% of the equity interests in Pental Granite and Marble, LLC (which we refer to as “Pental”) in February 2017, and the assets of Cosmic Stone & Tile Distributors, Inc. (which we refer to as “Cosmic”) in October 2017, and these acquired businesses were combined to form ASG. ASG then acquired the assets of Elegant Home Design, LLC (which we refer to as “Bedrock”) in January 2018, the assets of NSI, LLC (which we refer to as “NSI”) in March 2018, and the assets of The Tuscany Collection, LLC (which we refer to as “Tuscany”) in August 2018.
November 2017 Restructuring Transactions
In November 2017, Select Interior Concepts, Inc. and the former equity holders of RDS and ASG completed a series of restructuring transactions (collectively, the “November 2017 restructuring transactions”) pursuant to which Select Interior Concepts, Inc. acquired all of the outstanding equity interests in each of RDS and ASG, including all of their respective wholly-owned subsidiaries. Following the November 2017 restructuring transactions, Select Interior Concepts, Inc. became a holding company that wholly owns RDS and ASG.
3
RDS enters into exclusive service agreements with homebuilders at the beginning of certain new community development projects to provide them with a single-source solution for the design center operations, consultation, sourcing, fulfillment, and installation phases of the homebuilding process. At our design centers, our design staff work directly with homebuyers to help them achieve their design, styling, and product needs, leveraging our web-based preference analysis and proprietary software system to enable real-time pricing of interior options.
During the initial design phase of a new residential development, RDS often assists builders with upfront planning of design elements and interior options. These alternatives then become the standard packages and design options which are the basis from which the new homebuyer makes upgrade selections. During the initial construction phase, RDS offers a full suite of interior customization options to homebuyers in its design centers, providing the opportunity to upgrade to higher priced options that are not part of the homebuilder’s standard package. These upgrades result in higher revenue and profitability for both RDS and the homebuilder, who shares in the incremental revenue from any upgrades. RDS also provides installation services, ensuring that the finished product meets the homebuyer’s specifications.
RDS’ collection of design options enables homebuyers to customize their homes with high quality interior finishes and provides homebuilders with a single partner to handle the majority of the interior design elements in a new home. RDS offers numerous interior surface categories which includes flooring, cabinets, countertops and wall tile.
Architectural Surfaces Group
Our ASG segment imports and distributes natural and engineered stone slabs, as well as tile, through 23 strategically positioned showrooms and warehouse locations across the United States. Our stone slabs include marble, granite, porcelain and quartz, for use as kitchen and bathroom countertops, and our tiles consist of ceramic and porcelain for flooring, backsplash, and wall tile applications. We provide our services throughout markets in the Northeast, Southeast, Southwest, Midwest, Mountain West, and West Coast regions of the United States and offer a targeted merchandising strategy, including displaying our products in customer-oriented showrooms that cater to professional interior designers and architects as well as homeowners. Our product lines are tailored to the specific geographic regions that we serve.
We have relationships with a wide array of stone slab quarries, manufacturers and distributors around the world and offer our customers a broad and consistent selection of high-quality stone slabs from a global supply chain.
Competition
Our markets are highly fragmented and competitive. We face competition from large home improvement stores, national and regional interior surface retailers and distributors, and independent design centers. Some of our competitors are organizations that are larger, are better capitalized, have operated longer, have product offerings that extend beyond our product suite, and have a more established market presence with substantially greater financial, marketing, personnel, and other resources than we have. In addition, while we believe that there is a relatively low threat of new internet-only entrants due to the nature of our products, the growth opportunities presented by e-commerce could outweigh these challenges and result in increased competition.
Suppliers
We purchase materials from both domestic and foreign suppliers. We have relationships with qualified suppliers who allow us to access products in a timely and efficient manner and have not historically experienced significant disruption in supply of the products we purchase. In some instances, we have agreements with our suppliers, but these agreements are generally terminable by either party without notice or on limited notice. Many of our suppliers also offer us favorable terms based on the volume of our purchases.
4
Backlog represents the transaction price for contracts for which work has not been performed and excludes unexercised contract options and potential modifications. Backlog is not a guarantee of future revenues as contractual commitments may change. There can be no assurance that backlog will result in revenues within the expected timeframe, if at all. We estimate backlog was $574.3 million as of December 31, 2019 and $409.1 million as of December 31, 2018.
Customer Concentration
For the years ended December 31, 2018, and 2017, the Company recognized revenue from one customer which accounted for 11.4% and 12.6% of total revenue, respectively. There was no customer that accounted for over 10% of total revenue for the year ended December 31, 2019. There were no customers that accounted for 10% or more of total accounts receivable, as of December 31, 2019 and 2018.
Cyclicality and Seasonality
Our businesses are both cyclical and seasonal based on the homebuilding industry in the markets we serve. Because of the timing of installation of our major product lines, which are mainly installed near the end of the construction process, as well as overall housing seasonality for our RDS segment, our sales activity for the RDS segment is normally weighted toward the second half of the calendar year.
Homebuilding-based businesses are also generally cyclical. Our financial performance will be impacted by economic changes nationally and locally in the markets we serve. The building products supply industry is dependent on new home construction and subject to cyclical market pressures. Our operations are subject to fluctuations arising from changes in supply and demand, national and international economic conditions, labor costs, competition, government regulation, trade policies, and other factors that affect the homebuilding industry such as demographic trends, interest rates, single-family housing starts, employment levels, consumer confidence, and the availability of credit to homebuilders, contractors and homeowners.
After the dramatic recession that ran from 2007 to 2009, there have been ten straight years of relatively steady growth. While we believe that the underlying fundamentals of demand for new housing units and residential investment are indicative of continued growth into the future, there can be no assurance that macroeconomic or other factors will not change unexpectedly and cause a downturn in housing construction.
As of December 31, 2019, we employed a total of approximately 1,850 employees. None of these employees is a party to a collective bargaining agreement.
Executive Officers
See Item 10. Directors, Executive Officers of the Registrant, and Corporate Governance.
Government Regulation
We are subject to various federal, state and local laws and regulations applicable to our businesses generally in the jurisdictions in which we operate, including those relating to employment, import and export, public health and safety, work place safety, product safety, transportation, zoning, and the environment. We operate our businesses in accordance with standards and procedures designed to comply with applicable laws and regulations, and we believe that we are in compliance in all material respects with such laws and regulations.
Insurance and Risk Management
We use a combination of insurance policies specific to particular purposes to provide us with protection against potential liability for workers’ compensation, general liability, product liability, director and officers’ liability, employer’s liability, property damage, auto liability, and other casualty and property risks. Changes in legal
5
trends and interpretations, variability in inflation rates, changes in workers’ compensation and general liability premiums and deductibles, changes in the nature and method of claims settlement, benefit level changes due to changes in applicable laws, insolvency of insurance carriers, and changes in discount rates could all affect ultimate settlements of claims. We evaluate our insurance requirements on an ongoing basis to ensure we maintain adequate levels of coverage.
Legal Proceedings
From time to time, we are involved in various lawsuits, claims and other legal proceedings that arise in the ordinary course of business. While the outcomes of these matters are generally not presently determinable, we do not believe that any of these proceedings, individually or in the aggregate, would be expected to have a material adverse effect on our financial position, results of operations or cash flows.
Intellectual Property
We possess proprietary knowledge and software programs, as well as registered trademarks that are important to our businesses. We make, and will continue to make, efforts to protect our intellectual property rights; however, the actions taken by us may be inadequate to prevent others from using similar intellectual property. In addition, third parties may assert claims against our use of intellectual property and we may be unable to successfully resolve such claims.
Available information
Our internet website address is www.selectinteriorconcepts.com. Our annual reports on Form 10-K, quarterly reports on Form 10-Q, current reports on Form 8-K, and amendments to those reports filed or furnished pursuant to Section 13(a) or 15(d) of the Exchange Act are available free of charge through our website as soon as reasonably practicable after we electronically file them with or furnish them to the SEC. Our Code of Business Conduct and Ethics and the charters of the Audit, Compensation, and Nominating and Corporate Governance Committees of our Board of Directors are also posted on our website. Each of these documents is also available in print to any stockholder who requests it.
Risks Related to Our Business and Industry
The industry in which we operate is dependent upon the U.S. residential homebuilding industry, repair and remodel activity, the economy, the credit markets, and other important factors, many of which are beyond our control.
The building products supply and services industry in the United States is highly dependent on new home construction and the R&R market, which in turn are dependent upon a number of factors, including interest rates, consumer confidence, employment rates, wage rates, foreclosure rates, housing inventory levels, housing demand, the availability of land, local zoning and permitting processes, the availability of construction financing and the health of the economy and mortgage markets. Unfavorable changes in demographics, credit markets, consumer confidence, health care costs, housing affordability, housing inventory levels, a weakening of the national economy or of any regional or local economy in which we operate and other factors beyond our control could adversely affect consumer spending, result in decreased demand for homes and adversely affect our businesses.
The U.S. homebuilding industry underwent a significant downturn that began in mid-2006 and began to stabilize in late 2011. The downturn in the homebuilding industry resulted in a substantial reduction in demand for our products and services, which in turn had a significant adverse effect on our businesses during that time. There is significant uncertainty regarding the timing and extent of recovery in home construction and R&R activity and resulting product demand levels, and any decline may materially adversely affect our businesses, financial condition, operating results, and cash flows. For example, some analysts project that the demand for residential construction may be negatively impacted as the number of renting households has increased in recent years and a shortage in the
6
supply of affordable housing is expected to result in lower home ownership rates. Further, even if homebuilding activity fully recovers, the impact of such recovery on our businesses may be dampened if the average selling price or average size of new single-family homes decreases, which could cause homebuilders to decrease spending on our products and services.
We also rely on home R&R activity. High unemployment levels, high mortgage delinquency and foreclosure rates, lower home prices, limited availability of mortgage and home improvement financing, and significantly lower housing turnover may restrict consumer spending, particularly on discretionary items such as home improvement projects, and affect consumer confidence levels leading to reduced spending in the R&R end market. Furthermore, with even a slight decline in the economy, nationally or in any of the markets in which we operate, consumer preferences and purchasing practices and the strategies of our customers may adjust in a manner that could result in changes to the nature and prices of products demanded by the end consumer and our customers and could adversely affect our businesses and results of operations.
In addition, beginning in 2007, the mortgage markets experienced substantial disruption due to increased defaults, primarily as a result of credit quality deterioration. The disruption resulted in a stricter regulatory environment and reduced availability of mortgages for potential homebuyers due to a tighter credit market and stricter standards to qualify for mortgages. Mortgage financing and commercial credit for smaller homebuilders, as well as for the development of new residential lots, continue to be constrained compared to pre-2007 levels. As the housing industry is dependent upon the economy as well as potential homebuyers’ access to mortgage financing and homebuilders’ access to commercial credit, the housing industry may not fully recover to pre-2007 levels. Prolonged weakness or another downturn in the homebuilding industry would have a significant adverse effect on our businesses, financial condition, and results of operations.
A significant portion of our, and in particular RDS’s, business is in the state of California. A slowdown in the economy or a decline in homebuilding activity in California, or the occurrence of a natural disaster, could have a disproportionately negative effect on our business, financial condition, operating results, and cash flows.
A significant portion of RDS’s business is in the state of California. In 2019 and 2018, we derived approximately 39% and 51%, respectively, of our consolidated net revenue, and RDS derived approximately 52% and 78%, respectively, of its net revenue, from customers in California. We expect that a significant portion of our and RDS’s revenue will continue to depend on sales within the State of California for the foreseeable future. As such, we are more susceptible to adverse developments in California than competitors with more diversified operations or if RDS had a more geographically diverse business. A slowdown in the economy, or a decline in homebuilding activity, in California could have a disproportionately negative effect on our business, financial condition, operating results and cash flows. In addition, California has historically been at greater risk of certain natural disasters and other risks, such as earthquakes, wildfires, droughts, mudslides, and civil disturbances. At times, these events have disrupted parts or all of the California economy.
A significant decline in the general economy or the new home construction or R&R markets, and/or a deterioration in expectations regarding the homebuilding market, could cause us to record significant non-cash impairment charges, which could negatively affect our earnings and reduce stockholders’ equity.
A significant decline in the general economy or the new home construction or R&R markets, and/or a deterioration in expectations regarding the homebuilding market, could cause us to record significant non-cash, pre-tax impairment charges for goodwill or other long-lived assets, which are not determinable at this time and which could negatively affect our earnings and reduce stockholders’ equity. In addition, as a result of our acquisition strategy, we have recorded goodwill and may incur impairment charges in connection with prior and future acquisitions. If the value of goodwill or other intangible assets is impaired, our earnings and stockholders’ equity would be adversely affected.
Our businesses are cyclical and significantly affected by changes in general and local economic conditions.
The building products supply and services industry is subject to cyclical market pressures. Demand for our products and services is highly sensitive to general and local economic conditions over which we have no control, including changes in:
7
|
|
• |
the production schedules of our homebuilder customers; |
|
|
• |
short- and long-term interest rates; |
|
|
• |
inflation; |
|
|
• |
employment levels and job and personal income growth; |
|
|
• |
housing demand from population growth, household formation and other demographic changes; |
|
|
• |
availability and pricing of mortgage financing for homebuyers and commercial financing for developers of multi-family homes and subcontractors; |
|
|
• |
consumer confidence generally and the confidence of potential homebuyers in particular; |
|
|
• |
U.S. and global financial and political system and credit market stability; |
|
|
• |
private party and government mortgage loan programs and federal and state regulation, oversight and legal action regarding lending, appraisal, foreclosure and short sale practices; |
|
|
• |
federal and state personal income tax rates and provisions, including provisions for the deduction of mortgage loan interest payments, real estate taxes and other expenses; |
|
|
• |
federal, state and local energy efficiency programs, regulations, codes and standards; and |
|
|
• |
general economic conditions in the markets in which we compete. |
Unfavorable changes in these conditions could adversely affect consumer spending, result in decreased demand for homes, and adversely affect our businesses generally. Any deterioration in economic conditions or increased uncertainty regarding economic conditions could have a material adverse effect on our businesses, financial condition, results of operations, and prospects.
The building products supply and services industry is seasonal and affected by weather-related conditions.
Our industry is seasonal. Seasonal changes and other weather-related conditions can adversely affect our businesses and operations through a decline in both the use of our products and demand for our services. Although weather patterns affect our operating results throughout the year, our first and fourth quarters have historically been, and are generally expected to continue to be, the most adversely affected by weather patterns in some of our markets, causing reduced construction activity. To the extent that severe weather conditions, such as unusually prolonged cold conditions, hurricanes, severe storms, earthquakes, floods, fires, droughts, other natural disasters or similar events occur in the markets in which we operate, construction or installation activity could be reduced, delayed or halted and our businesses may be adversely affected.
In addition, the levels of fabrication, distribution, and installation of our products generally follow activity in the construction industry, which typically occurs in the spring, summer and fall. Warmer and drier weather during the second and third quarters typically result in higher activity and revenue levels during those quarters. Markets in which we operate that are impacted by winter weather, such as snow storms and extended periods of rain, experience a slowdown in construction activity during the beginning and the end of each calendar year, and this winter slowdown contributes to traditionally lower sales in our first and fourth quarters.
Our industry and the markets in which we operate are highly fragmented and competitive, and increased competitive pressure may adversely affect our businesses, financial condition, results of operations, and cash flows.
The building products supply and services industry is highly fragmented and competitive. We face significant competition from local, regional and national building materials chains, design centers, fabricators, and subcontractors, as well as from privately-owned single-site enterprises. Competition varies depending on product line, type of customer and geographic area. Any of these competitors may (i) foresee the course of market development more accurately than we do, (ii) offer products and services that are deemed superior to ours, (iii) have
8
the ability to produce or supply similar products and services at a lower cost, (iv) install building products at a lower cost, (v) develop stronger relationships with suppliers, fabricators, homebuilders, and other customers in our markets, (vi) develop a superior network of distribution centers in our markets, (vii) adapt more quickly to new technologies, new installation techniques, or evolving customer requirements, or (viii) have access to financing on more favorable terms than we can obtain. As a result, we may not be able to compete successfully with our competitors. In addition, home center retailers, which have historically concentrated their sales efforts on retail consumers and small contractors, may in the future intensify their marketing efforts to professional homebuilders. Furthermore, certain product manufacturers sell and distribute their products directly to production homebuilders. The volume of such direct sales could increase in the future. Additionally, manufacturers and specialty distributors who sell products to us may elect to sell and distribute directly to homebuilders in the future or enter into exclusive supplier arrangements with other distributors. Consolidation of production homebuilders may result in increased competition for their business. Finally, we may not be able to maintain our operating costs or product prices at a level sufficiently low for us to compete effectively. If we are unable to compete effectively, our financial condition, results of operations, and cash flows may be adversely affected.
Our customers consider the performance and quality of the products we distribute, our customer service and price when deciding whether to use our services or purchase the products we distribute. Excess industry capacity for certain products in several geographic markets could lead to increased price competition. We may be unable to maintain our operating costs or product prices at a level that is sufficiently low for us to compete effectively. If we are unable to compete effectively with our existing competitors or new competitors enter the markets in which we operate, our financial condition, results of operations, and cash flows may be adversely affected.
Furthermore, in the event that increased demand leads to higher costs for the products we install, we may have limited, if any, ability to pass on cost increases in a timely manner or at all due to the fragmented and competitive nature of our industry, which may lead to an adverse effect on our financial condition, results of operations, and cash flows.
We are exposed to warranty, casualty, construction defect, contract, tort, employment and other claims, and legal proceedings related to our businesses, the products we distribute, the services we provide, and services provided for us by third parties.
In the ordinary course of business, we are subject to various claims and litigation. Any such claims, whether with or without merit, could be time consuming and expensive to defend and could divert management’s attention and resources. As a subcontractor, we are regularly subject to construction defects claims on various housing tracts. We may not always be able to successfully defend or be excused from the lawsuits related to these claims and could be subject to substantial losses.
We are also from time to time subject to casualty, contract, tort and other claims relating to our businesses, the products we have distributed in the past or may in the future distribute, and the services we have provided in the past or may in the future provide, either directly or through third parties. If any such claim were adversely determined, our financial condition, results of operations, and cash flows could be adversely affected if we were unable to seek indemnification for such claims or were not adequately insured for such claims. We rely on manufacturers and other suppliers to provide us with the products we sell or distribute. Since we do not have direct control over the quality of products that are manufactured or supplied to us by third-parties, we are particularly vulnerable to risks relating to the quality of such products.
In addition, we are exposed to potential claims arising from the conduct of our employees, builders and their subcontractors, and third-party installers for which we may be liable. We and they are subject to regulatory requirements and risks applicable to general contractors, which include management of licensing, permitting and quality of third-party installers. As they apply to our businesses, if we fail to manage these processes effectively or provide proper oversight of these services, we could suffer lost sales, fines and lawsuits, as well as damage to our reputation, which could adversely affect our businesses and results of operations.
9
Product shortages, loss of key suppliers or failure to develop relationships with qualified suppliers, our dependence on third-party suppliers and manufacturers, or the development of alternatives to distributors in the supply chain, could adversely affect our businesses, financial condition, results of operations, and cash flows.
Our ability to offer a wide variety of products to our customers is dependent upon our ability to obtain adequate product supply from manufacturers and other suppliers. Generally, our products are obtainable from various sources and in sufficient quantities to meet our operating needs. However, the loss of, or a substantial decrease in the availability of, products from our suppliers or the loss of key supplier arrangements could adversely impact our businesses, financial condition, results of operations, and cash flows. In prior downturns in the housing industry, manufacturers have reduced capacity by closing plants and production lines within plants. Even if such capacity reductions are not permanent, there may be a delay in manufacturers’ ability to increase capacity in times of rising demand. If the demand for products from manufacturers and other suppliers exceeds the available supply, we may be unable to source additional products in sufficient quantity or quality in a timely manner and the prices for the products that we install could rise. These developments could affect our ability to take advantage of market opportunities and limit our growth prospects.
Our ability to continue to identify and develop relationships with qualified suppliers who can satisfy our high standards for quality and our need to access products in a timely and efficient manner is a significant challenge. Our ability to access products also can be adversely affected by the financial instability of suppliers, suppliers’ non-compliance with applicable laws, tariffs and import duties, supply disruptions, shipping interruptions or costs, and other factors beyond our control, including disruptions related to the coronavirus. The loss of, or a substantial decrease in the availability of, products from our suppliers or the loss of key supplier arrangements could adversely impact our financial condition, results of operations, and cash flows.
Although in some instances we have agreements with our suppliers, these agreements are generally terminable by either party without notice or on limited notice. Many of our suppliers also offer us favorable terms based on the volume of our purchases. If market conditions change, suppliers may stop offering us favorable terms. Failure by our suppliers to continue to supply us with products on favorable terms, commercially reasonable terms, or at all, could put pressure on our operating margins or have a material adverse effect on our financial condition, results of operations, and cash flows.
In addition, our larger customers, such as homebuilders, fabricators, and dealers, could begin purchasing more of their product needs directly from manufacturers, which would result in decreases in our net sales and earnings. Our suppliers could invest in infrastructure to expand their own sales forces and sell more products directly to our customers, which also would negatively impact our businesses. These changes in the supply chain could adversely affect our financial condition, results of operations, and cash flows.
A material disruption at one of our suppliers’ facilities or loss of a supplier relationship could prevent us from meeting customer demand, reduce our sales and negatively affect our overall financial results.
Any of the following events could cease or limit our or our suppliers’ operations unexpectedly: fires, floods, earthquakes, hurricanes, on-site or off-site environmental incidents or other catastrophes; utility and transportation infrastructure disruptions; labor difficulties; other operational problems; war, and acts of terrorism; pandemics and other global health crises; or other unexpected events. Any downtime or facility damage at our suppliers could prevent us from meeting customer demand for our products or require us to make more expensive purchases from a competing supplier. If our suppliers were to incur significant downtime, our ability to satisfy customer requirements could be impaired, resulting in customers seeking products from other distributors as well as decreased customer satisfaction and lower sales and operating income. In addition, a loss of a supplier relationship could harm our operations. Because we purchase from a limited number of suppliers, the effects of any particular shutdown or facility damage or loss of a supplier relationship could be significant to our operations.
In addition, our suppliers’ inability to produce or procure the necessary raw materials to supply finished goods to us may adversely impact our results of operations, cash flows, and financial position.
10
If we fail to qualify for supplier rebates or are unable to maintain or adequately renegotiate our rebate arrangements, our gross margins and income could be adversely affected.
Many of our products, such as flooring, tile and finish carpentry, are purchased pursuant to rebate arrangements that entitle us to receive a rebate based on the volume of our purchases. Such arrangements generally require us to purchase minimum quantities in certain geographies or product categories and result in higher rebates with increased quantities of purchases. These rebates effectively reduce the costs of our products and we manage our businesses to take advantage of these programs. When assessing the desirability of acquisitions, we consider the effects of such acquisitions on our ability to qualify for rebates. Rebate arrangements are subject to renegotiation with our suppliers from time to time. In addition, consolidation of suppliers may result in the reduction or elimination of rebate programs in which we participate. If we are unable to qualify for these rebates, are unable to renew rebate programs on desirable terms or are unable to obtain the expected rebate benefits of our acquisitions, or a supplier materially reduces or stops offering rebates, our costs could increase and our gross margins and income could be adversely affected.
Changes in product mix or the costs of the products we install can decrease our profit margins.
The principal building products that we distribute and install have been subject to price changes in the past, some of which have been significant. Our operating results for individual quarterly periods can be, and have been, adversely affected by a delay between when building product cost increases are implemented and when we are able to increase prices for our products and services, if at all. Our supplier purchase prices often depend on volume requirements. If we do not meet these volume requirements, our costs could increase and our margins may be adversely affected. In addition, while we have been able to achieve cost savings through volume purchasing and our relationships with suppliers, we may not be able to continue to receive advantageous pricing for the products that we supply, which could have a material adverse effect on our financial condition, results of operations, and cash flows.
Our profitability is also impacted by the mix of products that we install. Recent trends indicate more of our homebuilder customers are moving to entry- to mid-level homes with less upgrades. There can be no assurance that the current product mix will continue, and any shift to options with lower profit margin could adversely impact our businesses, financial condition, results of operations, and cash flows.
Political and economic uncertainty and unrest in foreign countries where our suppliers are located could adversely affect our operating results.
In 2019, approximately 43% and 1% of ASG’s purchased goods came from products that were obtained directly from suppliers located in Vietnam and China, respectively. We are subject to risks and uncertainties associated with changing economic and political conditions in these or other foreign countries in which we source, or in the future may source, any of our products, such as:
|
|
• |
increased import duties, tariffs, trade restrictions, and quotas; |
|
|
• |
work stoppages; |
|
|
• |
economic uncertainties (including inflation); |
|
|
• |
adverse foreign government regulations, government control, or sudden changes in laws and regulations; |
|
|
• |
wars, fears of war, and terrorist attacks; |
|
|
• |
pandemics and other global crises; and |
|
|
• |
organizing activities and political unrest. |
We cannot predict if, when, or the extent to which, the countries in which we source our products will experience any of the above events. Any event causing a disruption, delay or cessation of imports from foreign locations would likely increase the cost or reduce the supply of products available to us, and cause us to seek alternative sources for our products, which may only be available on less advantageous terms, and would adversely affect our operating results.
11
The importation of building materials into the United States could expose us to additional risk.
A significant portion of the building materials that we distribute and/or install come from foreign jurisdictions outside North America. Such materials may be imported because they may not be available for domestic purchase in the United States or because there may be a shortfall of inventory available locally. Despite our efforts to ensure the merchantability of these products, such products may not adhere to U.S. standards or laws. In addition, pricing of these products can be impacted by changes to the relative value of the U.S. dollar over the applicable foreign currency in the long-term, which could negatively impact our margins. Importation of such building materials could subject us to greater risk, including currency risk, and lawsuits by customers or governmental entities.
We may be unable to effectively manage our inventory and working capital as our sales volume increases or the prices of the products we distribute fluctuate, which could have a material adverse effect on our businesses, financial condition, and results of operations.
We purchase certain materials, including wood and laminate flooring, natural and engineered stone, and tile for wall and flooring applications, from manufacturers or quarries, which are then sold to customers as an installed product or as a prefabricated and installed product. We must maintain and have adequate working capital to purchase sufficient inventory to meet customer demand. Due to the lead times required by our suppliers, we order products in advance of expected sales. As a result, we are required to forecast our sales and purchase accordingly. In periods characterized by significant changes in economic growth and activity in the commercial and residential construction and home R&R end markets, it can be especially difficult to forecast our sales accurately. We must also manage our working capital to fund our inventory purchases. Excessive increases in the market prices of certain products can put negative pressure on our operating cash flows by requiring us to invest more in inventory. In the future, if we are unable to effectively manage our inventory and working capital as we attempt to expand our businesses, or if we make changes to how we manage our payments to suppliers, our cash flows may be negatively affected, which could have a material adverse effect on our businesses, financial condition, and results of operations.
We are subject to significant pricing pressures from homebuilders, contractors, fabricators, dealers and other customers.
Large homebuilders, contractors, fabricators, and dealers have historically been able to exert significant pressure on their outside suppliers and distributors to keep prices low in the highly fragmented building products supply and services industry. In addition, continued consolidation in the residential homebuilding industry and changes in builders’ purchasing policies and payment practices could result in even further pricing pressure. For example, there has been a recent trend of large publicly-traded homebuilders acquiring other large homebuilders, which increases their market share and buying power. Our homebuilder customers may be acquired by other homebuilders that we do not currently have relationships with, which may make it difficult for us to maintain our current market share and margins. A decline in the selling prices of the products we distribute and the services we provide could adversely impact our operating results. To the extent that our inventory at the time was purchased at higher costs, this could result in lower margins. Alternatively, due to the rising market price environment, our suppliers may increase prices or reduce discounts on the products we distribute and we may be unable to pass on any cost increase to our customers, thereby resulting in reduced margins and profits. Overall, these pricing pressures may adversely affect our results of operations, and cash flows.
The loss of any of our significant customers or a reduction in the quantity of products they purchase could affect our financial health.
Our ten largest customers generated approximately 31% of our consolidated revenue for the year ended December 31, 2019. No one customer generated more than 10% of our consolidated revenue for the year ended December 31, 2019. We cannot guarantee that we will maintain or improve our relationships with these customers or that we will continue to supply these customers at historical levels. Due to the weak housing market over the past several years relative to long-term averages, many of our homebuilder and fabricator customers substantially reduced their construction activity. Some homebuilder customers exited or severely curtailed building activity in certain of our markets. In the future, additional homebuilder customers may exit or decrease their building activity in one or more of our markets.
12
Continued consolidation among homebuilders could also result in a loss of some of our present customers to our competitors. The loss of one or more of our significant customers or deterioration in our existing relationships with any of our customers could adversely affect our financial condition, results of operations, and cash flows.
Furthermore, our customers are not required to purchase any minimum amount of product from us. Should our customers purchase the products we distribute or install in significantly lower quantities than they have in the past, or should the customers of any business that we acquire purchase products from us in significantly lower quantities than they had prior to our acquisition of such business, such decreased purchases could have a material adverse effect on our financial condition, results of operations, and cash flows.
In an attempt to diversify and expand its customer base, RDS may target smaller homebuilders. This exposes RDS to additional risks, such as increased non-payment risk of those customers, especially during times of economic uncertainty and tight credit markets.
RDS’s customers may be affected by shortages in labor supply, increased labor costs or labor disruptions, which could have a material adverse effect on our financial condition, results of operations, and cash flows.
Our customers require a qualified labor force to build homes and communities, and we require a qualified labor force to install our products in those homes. Access to qualified labor and subcontractors by our customers and us may be affected by circumstances beyond their or our control, including:
|
|
• |
shortages of qualified trades people, such as flooring, tile and cabinet installers, carpenters, roofers, electricians and plumbers, especially in key markets; |
|
|
• |
changes in immigration laws and trends in labor force migration; and |
|
|
• |
increases in subcontractor and professional services costs. |
Labor shortages can be further exacerbated if demand for housing increases. Any of these circumstances could also give rise to delays in the start or completion of, or could increase the cost of, building homes. Such delays and cost increases would also have an effect on our ability to generate sales from homebuyers and could have a material adverse effect on our businesses, financial condition, results of operations, and cash flows.
Our backlog estimates for our RDS segment may not be accurate and may not generate expected levels of future revenues or translate into profits.
Estimates of future financial results are inherently unreliable. Our backlog estimates of potential future revenue for our RDS segment require substantial judgment and are based on a number of assumptions, including management’s current assessment of customer contracts that exist as of the date the estimates are made and the expected revenue to be derived from sales related to remaining housing lots to be fulfilled under existing service agreements for active residential developments. A number of factors could result in actual revenue being less than the amounts reflected in our estimates, such as upgrade rates or upgrade amounts being lower than expected, or modification or cancellation of contracts by homebuilders. Actual rates and amounts may differ from historical experiences used to estimate potential future revenue. Accordingly, there can be no assurance that we will actually generate the specified revenue or that the actual revenue will be generated within the estimated period. If such revenue fails to materialize, we could experience a reduction in revenue and a decline in profitability, which could result in a deterioration of our financial position and liquidity.
13
We may not timely identify or effectively respond to consumer needs, expectations or trends, which could adversely affect our relationship with customers, the demand for our products and services and our market share.
It is difficult to predict successfully the products and services our customers will demand. The success of our businesses depends in part on our ability to identify and respond promptly to changes in demographics, consumer preferences, expectations, needs and weather conditions, while also managing inventory levels. For example, a significant portion of the product that we distribute is natural stone. If a natural stone product becomes unavailable for any reason or the color and quality changes within the quarry we purchase from, we may not be able to replace that particular color or quality with an acceptable alternative. In general, the products we sell are affected by style trends, customer preferences and changes thereto. Failure to identify timely or effectively respond to changing consumer preferences, expectations, and building product needs could possibly result in obsolete or devalued inventory, and adversely affect our relationship with customers, the demand for our products and services, and our market share.
The success of our businesses depends, in part, on our ability to execute on our growth strategy, which includes opening new branches and pursuing strategic acquisitions.
Our long-term business strategy depends in part on increasing our sales and growing our market share through opening new branches, including through our greenfield initiatives, and strategic acquisitions. A significant portion of our historical growth has occurred through acquisitions, and our business plan provides for continued growth through acquisitions in the future. We are presently evaluating, and we expect to continue to evaluate on an ongoing basis, a variety of possible acquisition transactions, including both smaller acquisitions and larger acquisitions that would be material. We cannot predict the timing of any contemplated transactions, and there can be no assurances that we will identify suitable acquisition opportunities or, if we do identify such opportunities, that any transaction can be consummated on acceptable terms. We may be unable to continue to grow our businesses through acquisitions. Our recent growth and our acquisition strategy have placed, and will continue to place, significant demands on our management’s time, which may divert their attention from our businesses, and may lead to significant due diligence and other expenses regardless of whether we pursue or consummate any acquisition. Failure to identify suitable transaction partners and to consummate transactions on acceptable terms, as well as the commitment of time and resources in connection with such transactions, could have a material adverse effect on our businesses, financial condition, and results of operations. Additionally, we may not be able to finance acquisitions through acceptable financing terms or at all.
To a large extent, our growth strategy depends on RDS and ASG forming a strong, scalable platform. Our platform was formed in November 2017 and continues to be developed. There can be no assurance that we will be able to implement this platform across all, if any, markets, products and services where we currently plan to grow.
Any inability to successfully integrate our recent or future acquisitions could have a material adverse effect on us.
Acquisitions typically require integration of the acquired companies’ sales and marketing, distribution, purchasing, finance and administrative functions, as well as exposure to different legal and regulatory regimes in jurisdictions in which we have not previously operated. We may not be able to integrate successfully any business we acquire into our existing business or may not be able to do so in a timely, efficient and cost-effective manner. Our inability to complete the integration of new businesses in a timely and orderly manner could increase costs and lower profits. Factors affecting the successful integration of acquired businesses include, but are not limited to, the following:
|
|
• |
our inability to manage acquired businesses or control integration costs and other costs relating to acquisitions; |
|
|
• |
diverting the attention of our management and that of the acquired business; |
|
|
• |
merging or linking different accounting and financial reporting systems and systems of internal controls; |
|
|
• |
merging computer, technology and other information networks and systems; |
14
|
|
• |
assimilating personnel, human resources and other administrative departments and potentially contrasting corporate cultures; |
|
|
• |
failure to retain existing key personnel of the acquired businesses and recruit qualified new employees at new locations; |
|
|
• |
disrupting our relationship with, or loss of, key customers or suppliers; |
|
|
• |
incurring or guaranteeing additional indebtedness; |
|
|
• |
interfering with, or loss of momentum in, our ongoing business or that of the acquired company; and |
|
|
• |
delays or cost-overruns in the integration process. |
Any of these acquisition or other integration-related issues could divert management’s attention and resources from our day-to-day operations, cause significant disruption to our businesses, and lead to substantial additional costs. Our inability to realize the anticipated benefits of an acquisition or to successfully integrate acquired companies as well as other transaction-related issues could have a material adverse effect on our businesses, financial condition, and results of operations.
We may not be able to expand into new geographic markets, which may impact our ability to grow our businesses.
We intend to continue to pursue our growth strategy to expand into new geographic markets for the foreseeable future. Our expansion into new geographic markets may present competitive, distribution and other challenges that differ from the challenges we currently face. In addition, we may be less familiar with the customers in these markets and may ultimately face different or additional risks, as well as increased or unexpected costs, compared to those we experience in our existing markets. We may also be unfamiliar with the labor force in these markets and may have difficulty finding and retaining necessary skilled or qualified workers on acceptable terms, or at all. Expansion into new geographic markets may also expose us to direct competition with companies with whom we have limited or no past experience as competitors. Furthermore, some of our customer and supplier agreements may restrict the markets where we are able to distribute certain products, and these limitations could negatively impact our ability to achieve success in new markets. To the extent we rely upon expanding into new geographic markets and do not meet, or are unprepared for, any new challenges posed by such expansion, our future sales growth could be negatively impacted, our operating costs could increase, and our businesses, operations, and financial results could be negatively affected.
We occupy many of our facilities under long-term non-cancellable leases, and we may be unable to renew our leases at the end of their terms.
Many of our facilities and distribution centers are located on leased premises. Many of our current leases are non-cancellable and typically have initial terms ranging from one to 12 years, and most provide options to renew for specified periods of time. We believe that leases we enter into in the future will likely be long-term and non-cancellable and have similar renewal options. If we close or idle a facility, we would most likely remain committed to perform our obligations under the applicable lease, which would include, among other things, payment of the base rent, insurance, taxes and other expenses on the leased property for the balance of the lease term. The inability to terminate leases when idling a facility or exiting a geographic market can have a significant adverse impact on our financial condition, results of operations, and cash flows.
In addition, at the end of the lease term and any renewal period for a facility, we may be unable to renew the lease without substantial additional cost, if at all. If we are unable to renew our facility leases, we may close or relocate a facility, which could subject us to construction and other costs and risks, which in turn could have a material adverse effect on our businesses and results of operations. In addition, we may not be able to secure a replacement facility in a location that is as commercially viable, including easy access to transportation and shipping, as the lease we are unable to renew. For example, closing a facility, even during the time of relocation, will reduce the sales that the facility would have contributed to our net revenue. Additionally, the net revenue and profit, if any, generated at a relocated facility may not equal the net revenue and profit generated at the existing one.
15
Natural or man-made disruptions to our facilities may adversely affect our businesses and operations.
We currently maintain a broad network of distribution facilities throughout the United States. Any widespread disruption to our facilities or those of our suppliers resulting from fire, earthquake, weather-related events, an act of terrorism or any other cause could damage a significant portion of our facilities and inventory and could materially impair our ability to distribute our products to customers. We could incur significantly higher costs and longer lead times associated with distributing our products to our customers during the time that it takes for us to reopen or replace a damaged facility. In addition, any shortages of fuel or significant fuel cost increases could disrupt our ability to distribute products to our customers. Disruptions to the national or local transportation infrastructure systems, including those related to a domestic terrorist attack, may also affect our ability to keep our operations and services functioning properly. If any of these events were to occur, our financial condition, results of operations, and cash flows could be materially adversely affected.
The implementation of new initiatives related to our operating software systems and related technology could disrupt our operations, and these initiatives might not provide the anticipated benefits or might fail.
We have made, and we plan to continue to make, significant investments in our operating software systems and related technology. These initiatives are designed to streamline our operations to allow our employees to continue to provide high quality service to our customers, while simplifying customer interaction and providing our customers with a more interconnected purchasing experience. The cost and potential problems and interruptions associated with the implementation of these initiatives, including those associated with managing third-party service providers and employing new web-based tools and services, could disrupt or reduce the efficiency of our operations. In the event that we grow very rapidly, there can be no assurance that we will be able to keep up, expand or adapt our IT infrastructure to meet evolving demand on a timely basis and at a commercially reasonable cost, or at all. In addition, our new and upgraded technology might cost more than anticipated or might not provide the anticipated benefits, or it might take longer than expected to realize the anticipated benefits or the initiatives might fail altogether. Because the success of our growth strategy depends in part on our IT infrastructure, problems with any related initiatives may adversely affect our businesses, operations, and results of operations.
We are subject to cybersecurity risks, and a disruption or breach of our IT systems could adversely impact our businesses and operations.
We rely on the accuracy, capacity and security of our IT systems, some of which are managed or hosted by third parties, and our ability to continually update these systems in response to the changing needs of our businesses. We have incurred costs and may incur significant additional costs in order to implement security measures that we feel are appropriate to protect our IT systems. Our security measures are focused on the prevention, detection and remediation of damage from computer viruses, natural or man-made disasters, unauthorized access, cyberattacks and other similar disruptions. Despite our security measures, our IT systems and infrastructure may be vulnerable to attacks by hackers or breached due to employee error, malfeasance or other disruptions. Any attacks on our IT systems could result in our systems or data being breached or damaged by computer viruses or unauthorized physical or electronic access, which could lead to delays in receiving inventory and supplies or filling customer orders, and adversely affect our customer service and relationships. Such a breach could result in not only business disruption, but also theft of our intellectual property or other competitive information or unauthorized access to controlled data and any personal information stored in our IT systems. To the extent that any data is lost or destroyed, or any confidential information is inappropriately disclosed or used, it could adversely affect our competitive position or customer relationships. In addition, any such access, disclosure or other loss of information could result in legal claims or proceedings, damage our reputation, and cause a loss of confidence in our businesses, products and services, which could adversely affect our businesses, financial condition, profitability, and cash flows.
To date, we do not believe we have experienced a material breach of our IT systems. As cyber-attacks become more sophisticated generally, we may be required to incur significant costs to strengthen our systems from outside intrusions and/or maintain insurance coverage related to the threat of such attacks. While we have implemented administrative and technical controls and taken other preventive actions to reduce the risk of cyber incidents and protect our IT, they may be insufficient to prevent physical and electronic break-ins, cyber-attacks, or other security breaches to our computer systems.
16
Our success depends to a significant degree upon the contributions of certain key personnel and other members of our management team, each of whom would be difficult to replace. If any of our key personnel were to cease employment with us, our operating results could suffer. Further, the process of attracting and retaining suitable replacements for key personnel whose services we may lose would result in transition costs and would divert the attention of other members of our senior management from our existing operations. The loss of services from key personnel or a limitation in their availability could materially and adversely impact our businesses, prospects, liquidity, financial condition and results of operations. Further, such a loss could be negatively perceived in the capital markets. We have not obtained and do not expect to obtain key man life insurance that would provide us with proceeds in the event of death or disability of any of our key personnel.
An inability to attract and retain highly skilled employees could adversely affect our businesses.
To execute our growth plan, we must attract and retain highly qualified personnel. Competition for these personnel is intense. We have, from time to time, experienced, and we expect to continue to experience, difficulty in hiring and retaining employees with appropriate qualifications, such as build tradesmen for finish carpentry and for installation of tile, flooring and cabinets. Many of the companies with which we compete for experienced personnel have greater resources than us. If we hire employees from competitors or other companies, their former employers may attempt to assert that these employees or we have breached their legal obligations, resulting in a diversion of our time and resources. If we fail to attract new personnel or fail to retain and motivate our current personnel, our businesses and future growth prospects could be adversely affected.
RDS’s business and results of operations are significantly dependent on the availability and skill of subcontractors.
We engage subcontractors to perform the installation of the products that we sell to our customers. Accordingly, the timing and quality of our installations depends on the availability and skill of our subcontractors. While we believe that our relationships with subcontractors are good, we generally do not have long-term contractual commitments with any subcontractors, and we can provide no assurance that skilled subcontractors will continue to be available at reasonable rates and in our markets. Competition for skilled contractors can be significant in our markets. The inability to contract with skilled subcontractors at reasonable rates and on a timely basis could have a material adverse effect on our business, results of operations, and financial condition.
Despite our quality control efforts, we may discover that our subcontractors have failed to adhere to proper construction practices or improperly installed materials in the homes of our customers. The adverse costs of satisfying our warranty and other legal obligations in these instances may be significant and we may be unable to recover the costs of warranty-related repairs from subcontractors, suppliers and insurers, which could have a material impact on our business, results of operations, and financial condition.
If any of RDS’s subcontractors are characterized as employees, we would be subject to employment and withholding liabilities.
We structure our relationships with our subcontractors in a manner that we believe results in an independent contractor relationship, not an employee relationship. An independent contractor is generally distinguished from an employee by his or her degree of autonomy and independence in providing services. A high degree of autonomy and independence is generally indicative of a contractor relationship, while a high degree of control is generally indicative of an employment relationship. Although we believe that our subcontractors are properly characterized as independent contractors, tax or other regulatory authorities may in the future challenge our characterization of these relationships. If such regulatory authorities or state, federal or foreign courts were to determine that our subcontractors are employees, and not independent contractors, we would be required to withhold income taxes, to withhold and pay social security, Medicare and similar taxes, and to pay unemployment and other related payroll taxes. We would also be liable for unpaid past taxes and subject to penalties. As a result, any determination that these subcontractors are employees could have a material adverse effect on our business, financial condition, and results of operations.
17
Changes in employment laws may adversely affect our businesses.
Various states in which we operate are considering or have already adopted new immigration laws or enforcement programs, and, from time to time, the U.S. Congress and Department of Homeland Security consider and implement changes to federal immigration laws, regulations or enforcement programs. These changes may increase our compliance and oversight obligations, which could subject us to additional costs and make our hiring process more cumbersome or reduce the availability of potential employees. Although we take steps to verify the employment eligibility status of all our employees, some of our employees may, without our knowledge, be unauthorized workers. Unauthorized workers are subject to deportation and may subject us to fines or penalties and, if any of our workers are found to be unauthorized, we could experience adverse publicity that negatively impacts our brand and may make it more difficult to hire and retain qualified employees. Termination of a significant number of employees who were unauthorized employees may disrupt our operations, cause temporary increases in our labor costs as we train new employees and result in additional adverse publicity. We could also become subject to fines, penalties and other costs related to claims that we did not fully comply with all recordkeeping obligations of federal and state immigration laws. These factors could have a material adverse effect on our businesses, financial condition, and results of operations.
Changes in legislation and government policy may have a material adverse effect on our businesses in the future.
Dynamic changes in legislation and government policy may have a material adverse effect on our business. Specifically, with an upcoming presidential election in November 2020, proposed legislation and regulatory changes discussed during and after the election could have a material impact on us including, but not limited to, modifications to international trade policy and increased regulation. Furthermore, existing tariffs imposed on goods imported from abroad that are used in our businesses are likely to remain in place through November 2020, however, those tariffs may be removed by executive order or expanded based upon the outcome of the presidential election. One of the Company’s subsidiaries, Architectural Granite & Marble, LLC, imports quartz surface products, and its operations are subject to interruption due to increases or expansion in duties and tariffs. For the year ended December 31, 2019, we purchased an estimated $121.8 million of material sourced from outside the United States. Similarly, currently unknown future geopolitical events between the United States and other countries, including India, Turkey, Spain, Vietnam, the European Union, and China could result in additional disruptions impacting the operations of the Company.
In addition, actions before the U.S. Department of Commerce (which we refer to as the “DOC”) and the U.S. International Trade Commission (which we refer to as the “ITC”) continue to present risk to the operations of the Company. For example, in May 2019, Cambria Company LLC – a domestic producer of slab quartz - filed a petition seeking imposition of antidumping and countervailing duties against quartz surface products imported from India and Turkey. A risk exists that additional future actions before the ITC and DOC could disrupt the operations of the Company.
We are currently unable to predict the extent of the changes to existing legislative and regulatory environments relevant to our businesses, or how those and potential future changes would impact our businesses. To the extent that such changes have a negative impact on us or the industries we serve, including the imposition of additional duties or tariffs discussed above or otherwise, these changes may materially and adversely impact our businesses, financial condition, results of operations, and cash flows.
18
Risks Related to Our Indebtedness
We may use additional leverage in executing our business strategy, which may adversely affect our businesses.
As of December 31, 2019, the principal amount of our total indebtedness was approximately $186.2 million, consisting of (i) $22.2 million under the SIC revolving credit facility, (ii) $153.8 million under the ASG term loan, and (iii) $10.2 million of vehicle and equipment loans, capital leases, and other term debt. Additionally, as of December 31, 2019, there was also $0.4 million of outstanding letters of credit. We had the ability to access approximately $75.6 million of unused borrowings available under the SIC revolving credit facility as of December 31, 2019, and, as part of our growth strategy, we may incur a significant amount of additional debt in the future. Our existing indebtedness is recourse to us and we anticipate that future indebtedness will likewise be recourse. If new debt is added to our current debt levels, the related risk that we now face could intensify.
Our board of directors will consider a number of factors when evaluating our level of indebtedness and when making decisions regarding the incurrence of new indebtedness, including the purchase price of assets to be acquired with debt financing, the estimated market value of our assets and the ability of particular assets, and our company as a whole, to generate cash flow to cover the expected debt service. As a means of sustaining our long-term financial health and limiting our exposure to unforeseen dislocations in the debt and financing markets, we currently expect to remain conservatively capitalized; however, our charter does not contain a limitation on the amount of debt we may incur and our board of directors may change our target debt levels at any time without the approval of our stockholders.
Incurring a substantial amount of debt could have important consequences for our businesses, including:
|
|
• |
making it more difficult for us to satisfy our obligations with respect to our debt or to our trade or other creditors; |
|
|
• |
increasing our vulnerability to adverse economic or industry conditions; |
|
|
• |
limiting our ability to obtain additional financing on acceptable terms, or at all, to fund capital expenditures and acquisitions, particularly when the availability of financing in the capital markets is limited; |
|
|
• |
requiring a substantial portion of our cash flows from operations for the payment of interest on our debt and reducing our ability to use our cash flows to fund working capital, capital expenditures, acquisitions, and general corporate requirements; |
|
|
• |
limiting our flexibility in planning for, or reacting to, changes in our business and the industry in which we operate; and |
|
|
• |
placing us at a competitive disadvantage to less leveraged competitors. |
We cannot assure you that our businesses will generate sufficient cash flow from operations or that future borrowings will be available to us through capital markets financings or under our credit facilities or otherwise in an amount sufficient to enable us to pay our indebtedness, or to fund our other liquidity needs. We cannot assure you that we will be able to refinance any of the indebtedness that we will incur on commercially reasonable terms, or at all. In addition, we may incur additional indebtedness in order to finance our operations or to repay our indebtedness. If we cannot service our indebtedness, we may have to take actions such as selling assets, seeking additional debt or equity or reducing or delaying capital expenditures, strategic acquisitions, investments and alliances. We cannot assure you that any such actions, if necessary, could be effected on commercially reasonable terms, or at all, or on terms that would be advantageous to our stockholders or on terms that would not require us to breach the terms and conditions of our existing or future financing arrangements.
19
Our current financing arrangements contain, and our future financing arrangements likely will contain, restrictive covenants relating to our operations.
Our current financing arrangements contain, and the financing arrangements we enter into in the future likely will contain, covenants (financial and otherwise) affecting our ability to incur additional debt, incur liens, make certain investments, sell our shares, reduce liquidity below certain levels, make distributions to our stockholders and otherwise affect our operating policies. The restrictions contained in our financing arrangements could also limit our ability to plan for or react to market conditions, meet capital needs or make acquisitions or otherwise restrict our activities or business plans. If we fail to meet or satisfy any of these covenants in our financing arrangements, we would be in default under these arrangements, and our lenders could elect to declare outstanding amounts due and payable, terminate their commitments, require the posting of additional collateral and enforce their respective interests against existing collateral. In addition, our financing arrangements may contain cross-default provisions. As a result, if we default in our payment or performance obligations under one of our financing arrangements and, in some cases, if the amount due thereunder is accelerated, other financing arrangements, if any, may be declared in default and accelerated even though we are meeting payment and performance obligations on those other arrangements. If this occurs, we may not have sufficient available cash to pay all amounts that are then due and payable under our financing arrangements, and we may have to seek additional debt or equity financing, which may not be available on acceptable terms. If alternative financing is not available, we may have to curtail our investment activities and/or sell assets in order to obtain the funds required to make the accelerated payments or seek ways to restructure the loan obligations. If we default on several of our financing arrangements or any single significant financing arrangement, it could have a material adverse effect on our businesses, prospects, liquidity, financial condition, and results of operations.
Interest expense on debt we will incur may limit our cash available to fund our growth strategies.
Our current financing arrangements have, and any additional debt we subsequently incur may have, a floating rate of interest. Higher interest rates could increase debt service requirements on our current floating rate debt and on any floating rate debt we subsequently incur, and could reduce funds available for operations, future business opportunities or other purposes. If we need to repay debt during periods of rising interest rates, we could be required to refinance our then-existing debt on unfavorable terms or liquidate one or more of our assets to repay such debt at times which may not permit realization of the maximum return on such assets and could result in a loss. The occurrence of either or both of such events could materially and adversely affect our cash flows and results of operations.
We may require additional capital in the future and may not be able to secure adequate funds on terms acceptable to us.
The expansion and development of our businesses may require significant capital, which we may be unable to obtain, to fund our capital expenditures, operating expenses, working capital needs, and potential strategic acquisitions. In accordance with our growth strategy, we may opportunistically raise additional debt capital to help fund the growth of our businesses, subject to market and other conditions, but such debt capital may not be available to us on a timely basis, or at all, to meet our cash requirements. Further, our capital requirements may vary materially from those currently planned if, for example, our revenues do not reach expected levels or we have to incur unforeseen capital expenditures and make investments to maintain our competitive position. If this is the case, we may require additional financing sooner than anticipated or we may have to delay or abandon some or all of our development and expansion plans or otherwise forego market opportunities.
To a large extent, our cash flow generation ability is subject to general economic, financial, competitive, legislative and regulatory factors and other factors that are beyond our control. We cannot assure you that our businesses will generate cash flow from operations in an amount sufficient to enable us to fund our liquidity needs. As a result, we may need to refinance all or a portion of our debt on or before its maturity or obtain additional equity or debt financing. We cannot assure you that we will be able to do so on favorable terms, if at all. Any inability to generate sufficient cash flow, refinance our debt or incur additional debt on favorable terms could adversely affect our financial condition and could cause us to be unable to service our debt and may delay or prevent the expansion of our businesses.
20
Risks Related to Our Organization and Structure
Certain anti-takeover defenses and applicable law may limit the ability of a third party to acquire control of us.
Our amended and restated certificate of incorporation (which we refer to as our “charter”), our amended and restated bylaws (which we refer to as our “bylaws”), and Delaware law contain provisions that may delay or prevent a transaction or a change in control of our Company that might involve a premium paid for shares of our common stock or otherwise be in the best interests of our stockholders, which could adversely affect the market price of our common stock. Certain of these provisions are described below.
Selected provisions of our charter and bylaws. Our charter and/or bylaws contain anti-takeover provisions that:
|
|
• |
authorize our board of directors, without further action by the stockholders, to issue up to 50,000,000 shares of preferred stock in one or more series, and with respect to each such series, to fix the number of shares constituting that series, the powers, rights and preferences of the shares of that series, and the qualifications, limitations and restrictions of that series; |
|
|
• |
require that, subject to the express rights, if any, of the holders of any series of preferred stock, actions to be taken by our stockholders may be taken only at an annual or special meeting of our stockholders and not by written consent; |
|
|
• |
specify that special meetings of our stockholders can be called only by the chairman of our board of directors, our chief executive officer, our president, or the majority of our board of directors; |
|
|
• |
provide that our bylaws may be amended by our board of directors without stockholder approval; |
|
|
• |
provide that, subject to the express rights, if any, of the holders of any series of preferred stock, directors may be removed from office only by the affirmative vote of the holders of at least a majority of the voting power of our capital stock entitled to vote generally in the election of directors; |
|
|
• |
provide that vacancies on our board of directors or newly created directorships resulting from an increase in the number of our directors may be filled only by a vote of a majority of directors then in office, although less than a quorum; |
|
|
• |
provide that, subject to the express rights, if any, of the holders of any series of preferred stock, any amendment, alteration or repeal of our charter provisions, or the adoption of any new or additional provision, inconsistent with our charter provisions relating to the management of our Company by our board of directors, the calling of special meetings of our stockholders, the prohibition against stockholder action by written consent, and amendment of our charter, requires the affirmative vote of the holders of at least 66 2⁄3% of the voting power of our capital stock entitled to vote generally in the election of directors; |
|
|
• |
provide that the stockholders may amend, alter or repeal our bylaws, or adopt new or additional provisions of our bylaws, only with the affirmative vote of at least 66 2⁄3% of the voting power of our capital stock entitled to vote generally; and |
|
|
• |
establish advance notice procedures for stockholders to submit nominations of candidates for election to our board of directors and other proposals to be brought before a stockholders meeting. |
Selected provisions of Delaware law. We are a Delaware corporation, and we have elected to be subject to Section 203 of the General Corporation Law of the State of Delaware (which we refer to as the “DGCL”) by provision of our charter. In general, Section 203 of the DGCL prevents an “interested stockholder” (as defined in the DGCL) from engaging in a “business combination” (as defined in the DGCL) with us for three years following the date that person becomes an interested stockholder unless one or more of the following occurs:
|
|
• |
before that person became an interested stockholder, our board of directors approved the transaction in which the interested stockholder became an interested stockholder or approved the business combination; |
21
|
|
• |
following the transaction in which that person became an interested stockholder, the business combination is approved by our board of directors and authorized at a meeting of stockholders by the affirmative vote of the holders of at least 66 2/3% of our outstanding voting stock not owned by the interested stockholder. |
The DGCL generally defines “interested stockholder” as any person who, together with affiliates and associates, is the owner of 15% or more of our outstanding voting stock or is our affiliate or associate and was the owner of 15% or more of our outstanding voting stock at any time within the three-year period immediately before the date of determination.
Termination of the employment agreements with the members of our management team could be costly and prevent a change in control of the Company.
The employment agreements we have entered into with Tyrone Johnson, Nadeem Moiz, Kendall Hoyd and Shawn Baldwin, our Chief Executive Officer, Chief Financial Officer, President—RDS, and General Counsel and Secretary, respectively, each provide that if their employment with us terminates under certain circumstances, we may be required to pay them significant amounts of severance compensation, thereby making it costly to terminate their employment. Furthermore, these provisions could delay or prevent a transaction or a change in control of the Company that might involve a premium paid for shares of our Class A Common Stock or otherwise be in the best interests of our stockholders, which could adversely affect the market price of our Class A Common Stock.
Our bylaws provide that the state and federal courts located within the State of Delaware will be the exclusive forum for substantially all disputes between us and our stockholders, and further provide that the federal district courts of the United States of America will be the exclusive forum for resolving any complaint asserting a cause of action arising under the Securities Act, which could limit our stockholders’ ability to obtain a favorable judicial forum for disputes with us or our directors, officers, or employees.
Our bylaws provide that the state or federal courts located within the State of Delaware will be the exclusive forum for:
|
|
• |
any derivative action or proceeding brought on our behalf; |
|
|
• |
any action asserting a claim of breach of a fiduciary duty owed by any of our directors, officers or other employees to us or our stockholders; |
|
|
• |
any action asserting a claim arising pursuant to any provision of the DGCL; |
|
|
• |
any civil action to interpret, apply, enforce or determine the validity of the provisions of our charter or our bylaws; and |
|
|
• |
any action asserting a claim governed by the internal affairs doctrine. |
Our bylaws also provide that the federal district courts of the United States of America will be the exclusive forum for the resolution of any complaint asserting a cause of action arising under the Securities Act. Furthermore, our bylaws provide that any person or entity purchasing or otherwise acquiring any interest in any of our securities will be deemed to have notice of and consented to the choice of forum provisions of our bylaws described above.
22
These choice of forum provisions may limit a stockholder’s ability to bring a claim in a judicial forum that such stockholder finds favorable for disputes with us or any of our directors, officers or other employees, which may discourage lawsuits against us and our directors, officers and other employees. The enforceability of similar choice of forum provisions in other companies’ bylaws has been challenged in legal proceedings, and it is possible that, in connection with one or more actions or proceedings described above, a court could find the choice of forum provisions contained in our bylaws to be inapplicable or unenforceable. If a court were to find either choice of forum provision in our bylaws to be inapplicable or unenforceable in an action, we may incur additional costs associated with resolving such dispute in other jurisdictions, which could seriously harm our business and financial condition.
We are an “emerging growth company” and, as a result of the reduced disclosure and governance requirements applicable to emerging growth companies, our Class A Common Stock may be less attractive to investors.
We are an “emerging growth company,” as defined in the Jumpstart Our Business Startups Act of 2012 (which we refer to as the “JOBS Act”), and we are eligible to take advantage of certain exemptions from various reporting requirements applicable to other public companies but not to emerging growth companies, including, but not limited to, a requirement to present only two years of audited financial statements in the registration statement for the emerging growth company’s initial public offering of common equity securities, an exemption from the auditor attestation requirement of Section 404 of the Sarbanes-Oxley Act of 2002 (which we refer to as the “Sarbanes-Oxley Act”), reduced disclosure about executive compensation arrangements pursuant to the rules applicable to smaller reporting companies, no requirement to seek non-binding advisory votes on executive compensation or golden parachute arrangements and not being required to comply with any requirement that may be adopted by the Public Company Accounting Oversight Board regarding a supplement to the auditor’s report providing additional information about the audit and the financial statements. We have elected to adopt these reduced disclosure requirements.
Section 102(b)(1) of the JOBS Act exempts emerging growth companies from being required to comply with new or revised financial accounting standards until private companies (that is, those that have not had a Securities Act registration statement declared effective or do not have a class of securities registered under the Securities Exchange Act of 1934, as amended (which we refer to as the “Exchange Act”)) are required to comply with the new or revised financial accounting standards. In addition, Section 107 of the JOBS Act provides that an “emerging growth company” can take advantage of the extended transition period provided in Section 7(a)(2)(B) of the Securities Act for complying with new or revised financial accounting standards. An emerging growth company can therefore delay the adoption of certain accounting standards until those standards would otherwise apply to private companies. We have elected to use the extended transition period for complying with new or revised accounting standards under Section 102(b)(2) of the JOBS Act. This election allows us to delay the adoption of new or revised accounting standards that have different effective dates for public and private companies until those standards apply to private companies. As a result, our financial statements may not be comparable to companies that comply with public company effective dates.
If we are unable to maintain effective internal control over financial reporting, investors may lose confidence in the accuracy and completeness of our financial reports, which could adversely affect the market price of our Class A Common Stock.
As a public company, we are required to maintain internal control over financial reporting and to report any material weaknesses in such internal control. We continue to take advantage of the exemptions contained in the JOBS Act, and our independent registered public accounting firm is not required to report on the effectiveness of our internal control over financial reporting pursuant to Section 404(b) of the Sarbanes-Oxley Act until the later of the year following our first annual report required to be filed with the SEC, or the date we are no longer an “emerging growth company” as defined in the JOBS Act and we are an accelerated filer or large accelerated filer within the meaning of Section 12b-2 of the Exchange Act. At such time, our independent registered public accounting firm may issue a report that is adverse in the event it is not satisfied with the level at which our controls are documented, designed or operating.
23
If we are unable to maintain effective internal control over financial reporting or if, in the future, we identify other control deficiencies or material weaknesses in our accounting and financial reporting processes, or if our independent registered public accounting firm is unable to express an opinion as to the effectiveness of our internal control over financial reporting, investors may lose confidence in the accuracy and completeness of our financial reports and the market price of our Class A Common Stock could be negatively affected, and we could become subject to litigations or investigations by the SEC, the Nasdaq Stock Market or other regulatory authorities, or derivative or securities lawsuits from shareholders, which could require additional financial and management resources.
Operation on multiple Enterprise Resource Planning (which we refer to as “ERP”) information systems may negatively impact our operations.
We are highly dependent on our information systems infrastructure to process orders, purchase materials, track inventory, ship products in a timely manner, prepare invoices to our customers, maintain internal controls, produce financial data, and otherwise carry on our businesses in the ordinary course. Our RDS segment is implementing a system in early 2020 that will enhance its ability to scale rapidly. Our ASG segment has significant operations on two different ERP platforms that are migrating to one ERP platform in 2020. While we believe we have the experience, skill and management abilities, as well as access to the necessary experts and consultants, to plan and execute these projects without significant disruption to our businesses, ERP implementations and conversions are very complex and inherently subject to risks and uncertainty. There is no assurance that the projects will succeed or that failures in the design, programming, software or implementation of these projects will not cause significant disruption to our businesses. Such a disruption could cause project cost overruns, which may be significant, losses in revenue, increases in operating costs, and reduced customer satisfaction, all of which would lead to a decline in profitability over the short term and possibly the long term.
We are a holding company and conduct all of our operations through our subsidiaries.
We are a holding company and substantially all of our businesses are conducted through our direct and indirect subsidiaries. We derive all of our operating income from RDS, ASG, and their respective subsidiaries. Other than any cash we may retain, substantially all of our assets will be held by our direct and indirect subsidiaries. We will rely on the earnings and cash flows of RDS, ASG, and their respective subsidiaries.
We rely on the earnings and cash flows of our subsidiaries, which are paid to us by our subsidiaries in the form of dividends and other payments or distributions, to meet our debt service and other obligations. The ability of our subsidiaries to pay dividends or make other payments or distributions to us will depend on their respective operating results and may be restricted by, among other things, the laws of their jurisdiction of organization (which may limit the amount of funds available for the payment of dividends and other distributions to us), the terms of existing and future indebtedness and other agreements of our subsidiaries and the covenants of any future outstanding indebtedness that our subsidiaries incur.
Risks Related to the Ownership of our Class A Common Stock
A trading market for our Class A Common Stock may not be sustained and our Class A Common Stock prices could decline.
Although our Class A Common Stock is currently listed for trading on the Nasdaq Capital Market under the symbol “SIC,” an active trading market for the shares of our Class A Common Stock may not be sustained. Accordingly, no assurance can be given as to the following:
|
|
• |
the likelihood that an active trading market for shares of our Class A Common Stock will be sustained; |
|
|
• |
the liquidity of any such market; |
|
|
• |
the ability of our stockholders to sell their shares of Class A Common Stock; or |
|
|
• |
the price that our stockholders may obtain for their Class A Common Stock. |
24
In addition, the securities markets in general and our Class A Common Stock have experienced price and volume volatility over the past year. The market price and volume of our Class A Common Stock may continue to experience fluctuations not only due to general stock market conditions but also due to government regulatory action, tax laws, interest rates and a change in sentiment in the market regarding our industry, operations or business prospects. In addition to the other risk factors discussed in this section, the price and volume volatility of our Class A Common Stock may be affected by:
|
|
• |
actual or anticipated variations in our quarterly operating results; |
|
|
• |
changes in market valuations of similar companies; |
|
|
• |
adverse market reaction to the level of our indebtedness; |
|
|
• |
additions or departures of key personnel; |
|
|
• |
actions by stockholders; |
|
|
• |
speculation in the press or investment community; |
|
|
• |
negative publicity regarding us specifically or our businesses generally; |
|
|
• |
general market, economic and political conditions, including an economic slowdown or dislocation in the global credit markets; |
|
|
• |
our operating performance and the performance of other similar companies; |
|
|
• |
changes in accounting principles; and |
|
|
• |
passage of legislation or other regulatory developments that adversely affect us or the building products supply and services industry. |
If an active market is not maintained, or if our Class A Common Stock continues to experience price and volume volatility, the market price of our Class A Common Stock may decline.
In May 2019, the Company announced that its Board of Directors had initiated a comprehensive review of strategic, operational and financial alternatives to enhance shareholder value. The Board of Directors continues its ongoing review of strategic alternatives and expects to conclude its review within the next several months. There can be no assurance that the review of strategic alternatives will result in a transaction or other outcome.
If securities analysts do not publish research or reports about our Company, or if they downgrade our Class A Common Stock, the price of our Class A Common Stock could decline.
The trading market for our Class A Common Stock could be influenced by any research and reports that securities or industry analysts publish about us or our Company. We currently have limited research coverage by securities and industry analysts, with only one analyst covering us. If no other securities or industry analysts commence coverage of our Company, the trading price for our Class A Common Stock could be negatively impacted. In the event one or more securities or industry analysts covering our Company downgrade our Class A Common Stock or publish inaccurate or unfavorable research about our Company, our Class A Common Stock price would likely decline. If any of these analysts ceases coverage of our Company or fails to publish reports on us regularly, demand for our Class A Common Stock could decrease, which could cause our Class A Common Stock price and trading volume to decline.
We do not intend to pay dividends on our common stock for the foreseeable future.
We currently intend to retain our future earnings, if any, to finance the development and expansion of our businesses and, therefore, do not intend to pay cash dividends on our common stock for the foreseeable future. Any future determination to pay dividends will be at the discretion of our board of directors and will depend on our financial condition, results of operations, capital requirements, restrictions contained in any financing instruments and such other factors as our board of directors deems relevant in its discretion. Accordingly, you may need to sell your shares of our Class A Common Stock to realize a return on your investment, and you may not be able to sell your shares at or above the price you paid for them, or at all for an indefinite period of time, except as permitted under the Securities Act and the applicable securities laws of any other jurisdiction.
25
Item 1B. Unresolved Staff Comments.
None.
We have 59 distinct locations, each of which is leased. Our corporate headquarters are located at 400 Galleria Parkway, Suite 1760, Atlanta, Georgia 30339.
The locations and uses of our top 20 branches, which comprise approximately 81% of our revenue, are as follows:
|
Location |
|
Segment |
|
Purpose |
|
Anaheim, CA (East Hunter Avenue) |
|
RDS |
|
Design Center / Office / Warehouse |
|
Anaheim, CA (Blue Gum Street) |
|
RDS |
|
Distribution / Office / Warehouse |
|
Atlanta, GA |
|
RDS |
|
Office / Fabrication / Warehouse |
|
Austin, TX |
|
ASG |
|
Showroom / Distribution / Office / Warehouse |
|
Buda, TX |
|
RDS |
|
Office / Fabrication / Warehouse |
|
Denver, CO |
|
ASG |
|
Showroom / Distribution / Office / Warehouse |
|
Escondido, CA |
|
RDS |
|
Design Center / Distribution / Office / Warehouse |
|
Fairfield, CA |
|
RDS |
|
Office / Warehouse |
|
Lenexa, KS |
|
ASG |
|
Showroom / Distribution / Office / Warehouse |
|
La Mirada, CA |
|
RDS |
|
Design Center / Distribution / Office / Warehouse |
|
Livermore, CA |
|
RDS |
|
Design Center / Distribution / Office / Warehouse |
|
Manassas, VA |
|
RDS |
|
Design Center / Office / Warehouse |
|
Oklahoma City, OK |
|
ASG |
|
Showroom / Distribution / Office / Warehouse |
|
Phoenix, AZ |
|
RDS |
|
Design Center / Office / Warehouse |
|
Portland, OR |
|
ASG |
|
Showroom / Distribution / Office / Warehouse |
|
Seattle, WA |
|
ASG |
|
Showroom / Distribution / Office / Warehouse |
|
Simi Valley, CA (Agate Court) |
|
RDS |
|
Office / Warehouse |
|
Sun Valley, CA |
|
ASG |
|
Showroom / Distribution / Office / Warehouse |
|
Tacoma, WA |
|
ASG |
|
Showroom / Distribution / Office / Warehouse |
|
Van Nuys, CA |
|
ASG |
|
Showroom / Distribution / Office / Warehouse |
From time to time, we are involved in various lawsuits, claims and other legal proceedings that arise in the ordinary course of business. While the outcomes of these matters are generally not presently determinable, we do not believe that any of these proceedings, individually or in the aggregate, would be expected to have a material adverse effect on our financial position, results of operations or cash flows.
Item 4. Mine Safety Disclosures.
Not applicable.
26
Item 5. Market for Registrant’s Common Equity, Related Stockholder Matters and Issuer Purchases of Equity Securities.
Market Information
Our Class A Common Stock is traded on the Nasdaq Capital Market under the ticker symbol “SIC.” The range of high and low sale prices of our common stock as reported by the Nasdaq is set forth in the table below:
|
|
|
1st Qtr |
|
|
2nd Qtr |
|
|
3rd Qtr |
|
|
4th Qtr |
|
||||
|
Fiscal Year 2019 |
|
|
|
|
|
|
|
|
|
|
|
|
|
|
|
|
|
High |
|
$ |
14.73 |
|
|
$ |
14.00 |
|
|
$ |
13.76 |
|
|
$ |
13.10 |
|
|
Low |
|
$ |
7.25 |
|
|
$ |
9.95 |
|
|
$ |
10.57 |
|
|
$ |
8.80 |
|
|
Fiscal Year 2018 (1) |
|
|
|
|
|
|
|
|
|
|
|
|
|
|
|
|
|
High |
|
$ |
- |
|
|
$ |
- |
|
|
$ |
13.00 |
|
|
$ |
10.92 |
|
|
Low |
|
$ |
- |
|
|
$ |
- |
|
|
$ |
9.65 |
|
|
$ |
5.94 |
|
|
(1) |
Class A Common Stock did not begin trading until August 2018, which is in the third quarter of fiscal year 2018. |
Holders
On March 1, 2020, there were 263 stockholders of record of our Class A Common Stock.
Dividends
We have never paid any cash dividends on our capital stock and have no current plans to pay any cash dividends. Our current policy is to retain any future earnings for use in our business.
Securities Authorized for Issuance Under Equity Compensation Plans
The information regarding securities authorized for issuance under equity compensation plans will be set forth in our 2020 Proxy Statement under the heading “Securities Authorized for Issuance under Equity Compensation,” which is incorporated herein by reference.
Unregistered Sales of Equity Securities and Use of Proceeds
The following table provides information regarding the repurchase of our common stock for the three months ended December 31, 2019:
|
Period |
|
Total Number of Shares Purchased(1) |
|
|
Average Price Paid per Share |
|
|
Total Number of Shares Purchased as Part of Publicly Announced Plans or Programs |
|
|
Maximum Number of Shares That May Yet be Purchased Under the Plans or Programs |
|
||||
|
October 1, 2019 — October 31, 2019 |
|
|
7,526 |
|
|
$ |
11.59 |
|
|
|
— |
|
|
|
— |
|
|
November 1, 2019 — November 30, 2019 |
|
|
7,479 |
|
|
|
10.28 |
|
|
|
— |
|
|
|
— |
|
|
December 1, 2019 — December 31, 2019 |
|
|
— |
|
|
|
— |
|
|
|
— |
|
|
|
— |
|
|
Total |
|
|
15,005 |
|
|
$ |
10.94 |
|
|
|
— |
|
|
|
— |
|
|
(1) |
Represents shares surrendered to the Company by employees to satisfy tax withholding obligations arising in connection with the vesting of 50,147 shares of restricted stock awarded under our 2017 Plan. |
27
The Company repurchased 800,000 shares of Class A Common Stock at a price of $0.01 per share in April 2019 as part of a repurchase agreement with affiliates of Trive Capital Management LLC. These shares were subsequently retired during the three months ended June 30, 2019.
The graph below compares the cumulative total returns of our Class A Common Stock with that of the Nasdaq Composite Index, Russell 2000 Index and the S&P Small Cap 600 Index, for the period commencing on August 16, 2018 (the date our Class A Common Stock commenced trading on the Nasdaq Capital Market) and ending on December 31, 2019. All values assume an initial investment of $100 on August 16, 2018 and reinvestment of dividends. Following the commencement period of August 16, 2018, the data on the graph represents month-end values based on the last trading day of each month. The comparisons are based on historical data and are not indicative of, nor intended to forecast, the future performance of our Class A Common Stock.
Comparison of Cumulative Total Return
among Select Interior Concepts, Inc., Nasdaq Composite Index, Russell 2000 Index,
and S&P Small Cap 600 Index
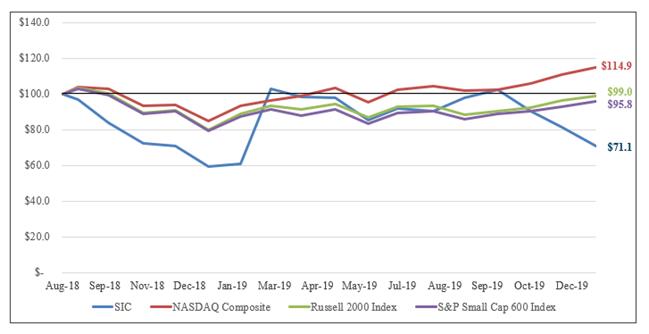
28
Item 6. Selected Financial Data.
The following table summarizes certain financial data for the periods presented:
|
|
|
Year Ended December 31, |
|
|||||||||
|
(in thousands, except share data) |
|
2019 |
|
|
2018 |
|
|
2017 |
|
|||
|
Statements of Operations Data: |
|
|
|
|
|
|
|
|
|
|
|
|
|
Total revenue |
|
$ |
610,373 |
|
|
$ |
489,757 |
|
|
$ |
352,952 |
|
|
Gross profit |
|
|
164,074 |
|
|
|
133,454 |
|
|
|
103,889 |
|
|
Gross margin |
|
|
26.9 |
% |
|
|
27.2 |
% |
|
|
29.4 |
% |
|
Income from operations |
|
$ |
19,258 |
|
|
$ |
12,097 |
|
|
$ |
6,162 |
|
|
Total other expense, net |
|
|
10,753 |
|
|
|
13,583 |
|
|
|
14,189 |
|
|
Income (loss) before provision for income taxes |
|
$ |
8,505 |
|
|
$ |
(1,486 |
) |
|
$ |
(8,026 |
) |
|
Provision for income taxes |
|
|
1,521 |
|
|
|
989 |
|
|
|
3,320 |
|
|
Net income (loss) |
|
$ |
6,984 |
|
|
$ |
(2,475 |
) |
|
$ |
(11,346 |
) |
|
Balance Sheet Data (end of year): |
|
|
|
|
|
|
|
|
|
|
|
|
|
Cash, cash equivalents and restricted cash |
|
$ |
5,002 |
|
|
$ |
6,362 |
|
|
$ |
5,547 |
|
|
Accounts receivable, net |
|
|
63,419 |
|
|
|
63,601 |
|
|
|
45,284 |
|
|
Inventory |
|
|
104,741 |
|
|
|
108,270 |
|
|
|
87,629 |
|
|
Total assets |
|
|
420,275 |
|
|
|
416,014 |
|
|
|
320,246 |
|
|
Accounts payable |
|
|
42,734 |
|
|
|
37,265 |
|
|
|
38,491 |
|
|
Accrued expenses and other current liabilities |
|
|
16,661 |
|
|
|
27,620 |
|
|
|
19,840 |
|
|
Line of credit |
|
|
21,871 |
|
|
|
36,706 |
|
|
|
19,269 |
|
|
Long-term debt, net of current portion and financing fees |
|
|
141,299 |
|
|
|
142,442 |
|
|
|
86,897 |
|
|
Total liabilities |
|
|
259,000 |
|
|
|
267,320 |
|
|
|
172,159 |
|
|
Stockholders' equity |
|
|
161,275 |
|
|
|
148,694 |
|
|
|
148,088 |
|
|
Supplemental Financial Data: |
|
|
|
|
|
|
|
|
|
|
|
|
|
Cash provided by (used in): |
|
|
|
|
|
|
|
|
|
|
|
|
|
Operating activities |
|
$ |
30,955 |
|
|
$ |
12,212 |
|
|
$ |
(8,367 |
) |
|
Investing activities |
|
|
(24,641 |
) |
|
|
(80,624 |
) |
|
|
(118,836 |
) |
|
Financing activities |
|
|
(10,674 |
) |
|
|
72,227 |
|
|
|
128,024 |
|
|
Net income (loss) per common share: |
|
|
|
|
|
|
|
|
|
|
|
|
|
Basic |
|
$ |
0.28 |
|
|
$ |
(0.10 |
) |
|
$ |
(0.22 |
) |
|
Diluted |
|
$ |
0.27 |
|
|
$ |
(0.10 |
) |
|
$ |
(0.22 |
) |
|
Weighted average number of common shares outstanding: |
|
|
|
|
|
|
|
|
|
|
|
|
|
Basic |
|
|
25,296,955 |
|
|
|
25,634,342 |
|
|
|
25,614,626 |
|
|
Diluted |
|
|
25,431,677 |
|
|
|
25,634,342 |
|
|
|
25,614,626 |
|
Basic and Diluted EPS and weighted average shares outstanding includes both Class A Common Stock and Class B Common Stock for the year ended December 31, 2017. In August 2018, each then-remaining share of Class B Common Stock was automatically converted into one share of Class A Common Stock, resulting in no shares of Class B Common Stock left outstanding.
29
Item 7. Management’s Discussion and Analysis of Financial Condition and Results of Operations.
MANAGEMENT’S DISCUSSION AND ANALYSIS
OF FINANCIAL CONDITION AND RESULTS OF OPERATIONS
The following information should be read in conjunction with Item 6. “Selected Financial Data” above and the accompanying consolidated financial statements and related notes included in this Annual Report.
The following discussion may contain forward-looking statements that reflect our plans, estimates, and beliefs. Our actual results could differ materially from those discussed in these forward-looking statements. Factors that could cause or contribute to these differences include those factors discussed below and elsewhere in this Annual Report, particularly in the sections entitled “Special Note Regarding Forward-Looking Statements and Information” and “Risk Factors” included elsewhere in this Annual Report.
Overview
Select Interior Concepts, Inc. (collectively with all of its subsidiaries, “SIC,” the “Company,” “we,” “us” and “our”) is an installer and nationwide distributor of interior building products with market positions in residential interior design services. Through our Residential Design Services (which we refer to as “RDS”) operating segment, we serve national and regional homebuilders by providing an integrated, outsourced solution for the design, consultation, sourcing, distribution and installation needs of their homebuyer customers. Through our 18 design centers, our designers work closely with homebuyers in the selection of a broad array of interior products and finishes, including flooring, cabinets, countertops, wall tile, and related interior items, primarily for newly constructed homes. We then coordinate the ordering, fulfillment and installation of many of these interior product categories to provide for the homebuyer. With our design centers and our product sourcing and installation capabilities, we enable our homebuilder customers to outsource critical aspects of their business to us, thereby increasing their sales, profitability, and return on capital. We also have leading market positions in the selection and importation of natural and engineered stone slabs for kitchen and bathroom countertops and specialty tiles through our other operating segment, Architectural Surfaces Group (which we refer to as “ASG”). ASG sources natural and engineered stone from a global supply base and markets these materials through a national network of 23 distribution centers and showrooms. In addition to serving the new residential and commercial construction markets with these materials, we also distribute them to the repair and remodel (which we refer to as “R&R”) market.
Operating Segments
We have defined each of our operating segments based on the nature of its operations and its management structure and product offerings. Our management decisions are made by our Chief Executive Officer, whom we have determined to be our Chief Operating Decision Maker. Our two reportable segments are described below.
Residential Design Services
RDS, our interior design and installation segment, is a service business that provides design center operation, interior design, product sourcing, and installation services to homebuilders, homeowners, general contractors and property managers. Products sold and installed by RDS include flooring, countertops, cabinets, and wall tile. New single-family and multi-family construction are the primary end markets, although we intend to explore growth opportunities in other markets, such as the R&R market.
Architectural Surfaces Group
ASG, our natural and engineered stone countertop distribution segment, distributes granite, marble, porcelain and quartz slabs for countertop and other uses, and ceramic and porcelain tile for flooring and backsplash and wall tile applications. Primary end markets are new residential and commercial construction and the R&R market.
30
Key Factors Affecting Operating Results
Our operating results are impacted by changes in the levels of new residential construction and of the demand for products and services in the R&R market. These are in turn affected by a broad range of macroeconomic factors including the rate of economic growth, unemployment, job and wage growth, interest rates, multi-family project financing, and residential mortgage lending conditions. Other important underlying factors include demographic variables such as household formation, immigration and aging trends, housing stock and vacant inventory levels, changes in the labor force, raw materials prices, the legal environment, and local and regional development and construction regulation.
Material Costs
The materials that we distribute and install are sourced through a wide array of quarries, manufacturers, and distributors located in North America, South America, Europe, Africa and Asia. As demand for these products continues to grow with housing demand, we expect that we may be subject to cost increases from time to time. There is no guarantee that our relationships with our customers will be such that we can pass these increases on to our customers. Affordability issues in new residential construction could temper our homebuilder customers’ ability to raise their prices, which could in turn limit our ability to increase prices to compensate for increases in our costs of materials. We believe, however, that over the long term, these same forces affecting housing prices would also limit our suppliers’ ability to increase prices, which would help us maintain our margins.
Labor Costs
Installation labor is a significant component of our aggregate labor force of approximately 1,850 employees. With the unemployment rate at 3.5% in December 2019 according to the U.S. Bureau of Labor Statistics, there is no guarantee that we will be able to attract the type and quality of skilled labor that we need in sufficient quantities to accomplish our growth plans. Correspondingly, we expect that tight labor markets will continue to lead to upward pressure on wages and could impact our gross profit margin and overall profitability negatively.
We believe, however, that our scale will continue to give us the ability to provide steady work, an attractive benefits package, and a beneficial work environment, particularly as compared to our smaller competitors. Over time, we expect that the combination of these factors will gradually increase our relative advantage over smaller and less sophisticated competitors.
Operating and Administrative Costs
We incur costs related to the operation and administration of our businesses that are reported as period expenses separately from Cost of Goods Sold. These expenses include, but are not limited to, project management, customer service, human resources, accounting, information technology, general management, public company costs, and others. These costs will likely continue to grow as our businesses grow, but we believe that, overall, they will grow more slowly than the rate at which our gross profit grows due to improved utilization rates of these resources and the fact that we have implemented and intend to continue to implement scalable technology and process improvements that increase the efficiency of our operations.
Non-GAAP Measures
In addition to the results reported in accordance with United States generally accepted accounting principles (which we refer to as “GAAP”), we have provided information in this Report relating to EBITDA, Adjusted EBITDA, and Adjusted EBITDA margin. We have provided definitions below for these non-GAAP financial measures and have provided the tables above reconciling these non-GAAP financial measures to the comparable GAAP financial measures.
We believe that these non-GAAP financial measures provide valuable information regarding our earnings and business trends by excluding specific items that we believe are not indicative of the ongoing operating results of our businesses, providing a useful way for investors to make a comparison of our performance over time and against other companies in our industry.
31
We have provided these non-GAAP financial measures as supplemental information to our GAAP financial measures and believe these non-GAAP measures provide investors with additional meaningful financial information regarding our operating performance and cash flows. Our management and board of directors also use these non-GAAP measures as supplemental measures to evaluate our businesses and the performance of management, including the determination of performance-based compensation, to make operating and strategic decisions, and to allocate financial resources. We believe that these non-GAAP measures also provide meaningful information for investors and securities analysts to evaluate our historical and prospective financial performance. These non-GAAP measures should not be considered a substitute for or superior to GAAP results. Furthermore, the non-GAAP measures presented by us may not be comparable to similarly titled measures of other companies.
EBITDA is defined as consolidated net income before interest, taxes and depreciation and amortization. Adjusted EBITDA is defined as consolidated net income before (i) interest expense, (ii) income tax expense, (iii) depreciation and amortization expense, (iv) stock compensation expense, and (v) adjustments for costs that are deemed to be transitional in nature or not related to our core operations, such as severance and employee related reorganization costs, purchase accounting fair value adjustments, strategic alternatives costs, facility closure costs, and professional, financing and legal fees related to business acquisitions, or similar transitional costs and expenses related to business investments, greenfield investments, and integrating acquired businesses into our Company. Adjusted EBITDA margin is calculated as a percentage of our net revenue. EBITDA, Adjusted EBITDA, and Adjusted EBITDA margin are non-GAAP financial measures used by us as supplemental measures in evaluating our operating performance.
Key Components of Results of Operations
Net Revenue. Revenue at our RDS segment is recognized on a percentage of completion basis over the terms of the performance obligation with the homebuilder or other contracted customer. In our ASG segment, net revenue is derived from the sale of stone products and is recognized at a point in time when such products have been accepted at the customer’s designated location and the performance obligation is completed.
Cost of Revenue. Cost of revenue consists of the direct costs associated with revenue earned by the sale and installation of our interior products in the case of our RDS segment, or by delivering product in the case of our ASG segment. In our RDS segment, cost of revenue includes direct material costs associated with each project, the direct labor costs associated with installation (including taxes, benefits and insurance), rent, utilities and other period costs associated with warehouses and fabrication shops, depreciation associated with warehouses, material handling, fabrication and delivery costs, and other costs directly associated with delivering and installing product in our customers’ projects, offset by vendor rebates. In our ASG segment, cost of revenue includes direct material costs, inbound and outbound freight costs, overhead (such as rent, utilities and other period costs associated with product warehouses), depreciation associated with fixed assets used in warehousing, material handling and warehousing activities, warehouse labor, taxes, benefits and other costs directly associated with receiving, storing, handling and delivering product to customers in revenue earning transactions.
Gross Profit and Gross Margin. Gross profit is revenue less the associated cost of revenue. Gross margin is gross profit divided by revenue.
Operating Expenses. Operating expenses include overhead costs such as general management, project management, purchasing, sales, customer service, accounting, human resources, depreciation and amortization, information technology, public company costs and all other forms of wage and salary cost associated with operating our businesses, and the taxes and benefits associated with those costs. We also include other general-purpose expenses, including, but not limited to, office supplies, office rents, legal, consulting, insurance, and non-cash stock compensation costs. Professional services expenses, including audit and legal, and transaction costs are also included in operating expenses.
Depreciation and Amortization. Depreciation and amortization expenses represent the estimated decline over time of the value of tangible assets such as vehicles, equipment and tenant improvements, and intangible assets such as customer lists and trade names. We recognize the expenses on a straight-line basis over the estimated economic life of the asset in question.
32
Interest Expense. Interest expense represents amounts paid to or which have become due during the period to lenders and lessors under credit agreements and capital leases, as well as the amortization of debt issuance costs.
Income Taxes. Income taxes are recorded using the asset and liability method of accounting for income taxes. Under the asset and liability method, deferred tax assets and liabilities are recognized for the deferred tax consequences attributable to temporary differences between the financial statement carrying amounts of existing assets and liabilities and their respective tax basis. Deferred tax assets and liabilities are measured using enacted tax rates expected to apply to taxable income in the years in which those differences are expected to be recovered or settled.
Results of Operations
Year Ended December 31, 2019 Compared to Year Ended December 31, 2018
Net Revenue. For the year ended December 31, 2019, net revenue increased by $120.6 million, or 24.6%, to $610.4 million, from $489.8 million for the year ended December 31, 2018. Net revenue for the years ended December 31, 2019 and 2018 is adjusted for the elimination of intercompany sales of $3.0 million and $2.6 million, respectively.
In our RDS segment, net revenue increased by $100.2 million, or 37.3%, to $368.6 million for the year ended December 31, 2019, from $268.4 million for the year ended December 31, 2018. The increase was primarily due to the acquisitions of Summit, TAC, and Intown, which accounted for $104.1 million of the growth in RDS revenues. During the period, revenues from organic sales decreased $3.9 million as we continue to face softening in the Southern California housing market of the Western region, which is our largest market.
In our ASG segment, net revenue increased by $20.8 million, or 9.3%, to $244.8 million for the year ended December 31, 2019, from $224.0 million for the year ended December 31, 2018. The increase was due to the acquisitions of Bedrock, NSI, and Tuscany, which collectively accounted for $8.0 million of ASG growth, with the remainder of the growth of $12.8 million in our ASG segment attributable to increased revenue from organic volume, price and product mix and new locations started in 2018.
Cost of Revenue. For the year ended December 31, 2019, cost of revenue increased by $90.0 million, or 25.3%, to $446.3 million, from $356.3 million for the year ended December 31, 2018. Cost of revenue for the year ended December 31, 2019 and 2018 is adjusted for the elimination of intercompany sales of $3.1 million and $2.5 million, respectively.
In our RDS segment, cost of revenue increased by $75.3 million, or 38.8%, to $269.8 million for the year ended December 31, 2019, from $194.5 million for the year ended December 31, 2018. The acquisitions of Summit, TAC and Intown were primarily responsible for this increase, contributing $74.6 million. The remaining increase of $0.8 million is due to additional costs in the organic business.
In our ASG segment, cost of revenue increased by $15.2 million, or 9.2%, to $179.5 million for the year ended December 31, 2019, from $164.3 million for the year ended December 31, 2018. This was partially due to the acquisitions of Bedrock, NSI, and Tuscany, which contributed $5.8 million of the increase, with the remaining increase due to costs associated with organic growth.
Gross Profit and Margin. For the year ended December 31, 2019, gross profit increased by $30.6 million, or 22.9%, to $164.1 million, from $133.5 million for the year ended December 31, 2018. For the year ended December 31, 2019, gross margin decreased by 0.3% to 26.9%, from 27.2% for the year ended December 31, 2018.
In our RDS segment, gross margin decreased by 0.7% to 26.8% for the year ended December 31, 2019, from 27.5% for the year ended December 31, 2018. This decrease is due to an unfavorable product mix primarily due to entry- to mid-level homebuilding comprising a larger share of project activity in our markets.
In our ASG segment, gross margin remained consistent, increasing by only 0.1% to 26.7% for the year ended December 31, 2019, from 26.6% for the year ended December 31, 2018, due to the non-recurrence of non-cash inventory expenses that were recorded in the prior year, offset by higher supply chain related costs and lower margin sales in the full year 2019.
33
Operating Expense. For the year ended December 31, 2019, operating expenses increased by $23.5 million, or 19.3%, to $144.8 million, from $121.4 million for the year ended December 31, 2018.
In our RDS segment, operating expenses increased by $21.6 million to $81.2 million for the year ended December 31, 2019, from $59.6 million for the year ended December 31, 2018. This increase was primarily related to the acquisitions of Summit, TAC, and Intown.
In our ASG segment, operating expenses decreased by $2.3 million to $45.4 million for the year ended December 31, 2019, from $47.7 million for the year ended December 31, 2018. This decrease was due to one-time non-recurring expenses related to the Bedrock and Tuscany acquisitions, and expenses related to the opening of new locations incurred during the year ended December 31, 2018.
The remaining $4.2 million of the increase in operating expenses was related to an increase in the amount of equity-based compensation awarded in 2019 in the amount of $3.1 million, as well as other overhead costs at the corporate level that were in place for a full year in 2019 compared to only a partial year in 2018.
Depreciation and Amortization. For the year ended December 31, 2019, depreciation and amortization expenses increased by $3.7 million, or 17.9%, to $24.2 million, from $20.5 million for the year ended December 31, 2018.
In our RDS segment, depreciation and amortization expenses increased by $3.3 million, or 33.9%, to $12.9 million for the year ended December 31, 2019, from $9.6 million for the year ended December 31, 2018, which was primarily due to depreciation and amortization associated with the assets acquired in the Summit, TAC, and Intown acquisitions.
In our ASG segment, depreciation and amortization expenses increased by $0.3 million, or 3.0%, to $11.2 million for the year ended December 31, 2019 from $10.8 million for the year ended December 31, 2018, which is primarily due to amortization associated with the Tuscany acquisition.
Interest Expense. For the year ended December 31, 2019, interest expense increased by $5.8 million, or 50.7%, to $17.2 million, from $11.4 million for the year ended December 31, 2018. This increase is primarily due to the borrowings associated with funding the TAC and Intown acquisitions offset by lower interest rates.
Income Taxes. For the year ended December 31, 2019, we recognized income tax expense of $1.5 million, an increase of $0.5 million from income tax expense of $1.0 million for the year ended December 31, 2018. The increase in income taxes is due primarily to the increase in pre-tax income in 2019 compared to 2018.
Net (Loss) Income. For the year ended December 31, 2019, net income increased by $9.5 million to $7.0 million, from a net loss of $2.5 million for the year ended December 31, 2018.
Adjusted EBITDA. For the year ended December 31, 2019, Adjusted EBITDA increased by $5.5 million to $59.9 million from $54.4 million for the year ended December 31, 2018, primarily as a result of the factors discussed above.
34
|
|
For the Year Ended December 31, |
|
||||||
|
(in thousands) |
|
2019 |
|
|
2018 |
|
||
|
Consolidated net income (loss) |
|
$ |
6,984 |
|
|
$ |
(2,475 |
) |
|
Income tax expense |
|
|
1,521 |
|
|
|
989 |
|
|
Interest expense |
|
|
17,220 |
|
|
|
11,468 |
|
|
Depreciation and amortization |
|
|
24,157 |
|
|
|
20,487 |
|
|
EBITDA |
|
|
49,882 |
|
|
|
30,469 |
|
|
Equity-based compensation |
|
|
5,740 |
|
|
|
2,626 |
|
|
Purchase accounting fair value adjustments |
|
|
(6,029 |
) |
|
|
2,109 |
|
|
Acquisition and integration related costs |
|
|
2,862 |
|
|
|
5,018 |
|
|
Employee related reorganization costs |
|
|
1,762 |
|
|
|
1,807 |
|
|
Other non-recurring costs |
|
|
2,776 |
|
|
|
8,326 |
|
|
IPO and public readiness costs |
|
|
— |
|
|
|
4,066 |
|
|
Strategic alternatives costs |
|
|
2,880 |
|
|
|
— |
|
|
Adjusted EBITDA |
|
$ |
59,873 |
|
|
$ |
54,421 |
|
Adjusted EBITDA Margin. For the year ended December 31, 2019, Adjusted EBITDA margin decreased to 9.8%, from 11.1% for the year ended December 31, 2018, primarily as a result of the factors discussed above.
Year Ended December 31, 2018 Compared to Year Ended December 31, 2017
Net Revenue. For the year ended December 31, 2018, net revenue increased by $136.8 million, or 38.8%, to $489.8 million, from $353.0 million for the year ended December 31, 2017. Net revenue for the year ended December 31, 2018 and 2017 is adjusted for the elimination of intercompany sales of $2.6 million and $1.4 million, respectively.
In our RDS segment, revenue increased by $75.2 million, or 38.9%, to $268.4 million for the year ended December 31, 2018, from $193.2 million for the year ended December 31, 2017. This increase was largely due to the acquisitions of Greencraft and Summit Stoneworks, which accounted for $55.6 million of the RDS growth. Additionally, organic revenue increased $19.6 million through continued expansion of share in new geographies, increased product offerings, and price/mix.
In our ASG segment, net revenue increased by $62.9 million, or 39.0%, to $224.0 million for the year ended December 31, 2018, from $161.1 million for the year ended December 31, 2017. This increase was largely due to the acquisitions of Cosmic, Bedrock, NSI, Pental and Tuscany which accounted for $52.5 million of the growth. Additionally, organic revenue increased $10.4 million due to volume increases, greenfield expansion, and price/mix.
Cost of Revenue. For the year ended December 31, 2018, cost of revenue increased by $107.2 million, or 43.0%, to $356.3 million, from $249.1 million for the year ended December 31, 2017. Cost of revenue for the year ended December 31, 2018 and 2017 is adjusted for the elimination of intercompany sales of $2.5 million and $1.3 million, respectively.
In our RDS segment, cost of revenue increased by $54.3 million, or 38.7%, to $194.5 million for the year ended December 31, 2018, from $140.2 million for the year ended December 31, 2017. The acquisitions of Greencraft and Summit drove $37.8 million of the year over year increase. The remaining $16.5 million increase in cost of revenues was substantially driven by an increase in sales in the legacy RDS business.
In our ASG segment, cost of revenue increased by $54.2 million, or 49.2%, to $164.3 million for the year ended December 31, 2018, from $110.1 million for the year ended December 31, 2017. This increase was primarily due to the acquisitions of Cosmic, Bedrock, NSI, Pental and Tuscany contributing $41.1 million, as well as a $13.1 million increase in cost of revenue in the legacy ASG business.
Gross Profit and Margin. For the year ended December 31, 2018, gross profit increased by $29.6 million, or 28.5%, to $133.5 million, from $103.9 million for the year ended December 31, 2017. For the year ended December 31, 2018, gross margin decreased by 2.2% to 27.2%, from 29.4% for the year ended December 31, 2017.
35
In our RDS segment, gross margin increased by 0.1% to 27.5% for the year ended December 31, 2018, from 27.4% for the year ended December 31, 2017. This increase was the result of improved margins from acquisitions and a slight shift in product and customer mix, partially offset by higher depreciation in cost of revenue.
In our ASG segment, gross margin decreased by 5.0% to 26.6% for the year ended December 31, 2018, from 31.6% for the year ended December 31, 2017. This decrease in margin was driven by the ramp up of our greenfield sites that delivered lower contribution margin than the base business as anticipated, lower margin from the opportunistic acquisitions of Cosmic, NSI and Bedrock, one-time non-cash charges, and higher depreciation in cost of revenue.
Operating Expenses. For the year ended December 31, 2018, operating expenses increased by $23.7 million, or 24.3%, to $121.4 million, from $97.7 million for the year ended December 31, 2017. This increase in operating expenses was primarily due to selling, general, and administrative expenses from acquired businesses, non-cash long-term incentive plan expenses, one-time nonrecurring costs for completed acquisitions, the opening of greenfield locations, investments in SIC infrastructure as a new public company, the addition of M&A resources, and higher depreciation and amortization.
In our RDS segment, operating expenses increased by $6.5 million to $59.6 million for the year ended December 31, 2018, from $53.1 million for the year ended December 31, 2017. This increase was related to the Greencraft and Summit acquisitions, sales and marketing expenses to support increased revenues, and other expenses related to the growth of the business.
In our ASG segment, operating expenses increased by $4.7 million to $47.7 million for the year ended December 31, 2018, from $43.0 million for the year ended December 31, 2017. This increase was related to the Cosmic, Bedrock, NSI, Pental and Tuscany acquisitions, and expenses related to the opening of greenfield locations.
The remaining $14.0 million of the increase in operating expenses was related to costs for developing public company infrastructure, mergers and acquisitions resources, and stock-based compensation accrual expense incurred by the SIC parent company.
Depreciation and Amortization. For the year ended December 31, 2018, depreciation and amortization expenses increased by $5.7 million, or 38.5%, to $20.5 million, from $14.8 million for the year ended December 31, 2017.
In our RDS segment, depreciation and amortization expenses increased by $2.7 million, or 39.1%, to $9.6 million for the year ended December 31, 2018, from $6.9 million for the year ended December 31, 2017. This was primarily due to the depreciation associated with the acquired Greencraft and Summit assets and amortization related to intangible assets recognized in the purchase accounting for the Greencraft and Summit acquisitions.
In our ASG segment, depreciation and amortization expenses increased by $2.8 million, or 35.0%, to $10.8 million for the year ended December 31, 2018 from $8.0 million for the year ended December 31, 2017. Amortization of intangible assets acquired in the Bedrock and Tuscany acquisitions accounted for the majority of this increase with the remaining increase due to the depreciation of additional assets from new locations.
Interest Expense. For the year ended December 31, 2018, interest expense decreased by $2.3 million, or 16.8%, to $11.4 million, from $13.7 million for the year ended December 31, 2017. Our interest expense was reduced because we decreased our borrowing significantly by paying off our RDS term loan and repaying a significant amount of our ASG term debt with proceeds from the November 2017 private offering and private placement. We offset this decrease by increasing our long-term debt to finance the Greencraft, Bedrock, Tuscany, Summit and TAC acquisitions.
Income Taxes. For the year ended December 31, 2018, we recognized income tax expense of $1.0 million, a decrease of $2.3 million from income tax expense of $3.3 million for the year ended December 31, 2017. Our deferred tax assets were revalued as a result of the Tax Cuts and Jobs Act in December 2017, which resulted in a $5.3 million increase to income tax expense in 2017.
36
Net (Loss) Income. For the year ended December 31, 2018, net loss decreased by $8.8 million to $2.5 million, from $11.3 million for the year ended December 31, 2017.
Adjusted EBITDA. For the year ended December 31, 2018, Adjusted EBITDA increased to $54.4 million, from $47.0 million for the year ended December 31, 2017, as a result of $7.7 million in organic growth and $13.7 million of incremental operating profit from acquisitions, partially offset by $14.0 million of additional cost and investments in SIC infrastructure as a new public company, establishing M&A resources, and increased cost of revenue and operating expenses in both operating segments.
|
|
|
For the Year Ended December 31, |
|
|||||
|
(in thousands) |
|
2018 |
|
|
2017 |
|
||
|
Consolidated net (loss) income |
|
$ |
(2,475 |
) |
|
$ |
(11,346 |
) |
|
Income tax expense |
|
|
989 |
|
|
|
3,320 |
|
|
Interest expense |
|
|
11,468 |
|
|
|
13,749 |
|
|
Depreciation and amortization |
|
|
20,487 |
|
|
|
14,816 |
|
|
EBITDA |
|
|
30,469 |
|
|
|
20,539 |
|
|
Equity-based compensation |
|
|
2,626 |
|
|
|
16,794 |
|
|
Purchase accounting fair value adjustments |
|
|
2,109 |
|
|
|
— |
|
|
Acquisition and integration related costs |
|
|
5,018 |
|
|
|
695 |
|
|
Employee related reorganization costs |
|
|
1,807 |
|
|
|
1,176 |
|
|
Other non-recurring costs |
|
|
8,326 |
|
|
|
61 |
|
|
IPO and public readiness costs |
|
|
4,066 |
|
|
|
6,724 |
|
|
Consulting fees to Trive Capital |
|
|
— |
|
|
|
1,008 |
|
|
Adjusted EBITDA |
|
$ |
54,421 |
|
|
$ |
46,997 |
|
Adjusted EBITDA Margin. For the year ended December 31, 2018, Adjusted EBITDA margin decreased to 11.1%, from 13.3% for the year ended December 31, 2017. The decrease in the Adjusted EBITDA margin was primarily due to investments in SIC for public company infrastructure, establishing a business development function, certain acquisitions by ASG that have slightly lower margins than ASG’s legacy business, and increased costs of revenue and operating expenses in both operating segments.
Liquidity and Capital Resources
Working capital is the largest element of our capital needs, as inventory and receivables are our most significant investments. We also require funding for acquisitions, to cover ongoing operating expenses, and to meet required obligations related to financing, such as lease payments and principal and interest payments.
Our capital resources primarily consist of cash from operations and borrowings under our revolving credit facilities, capital equipment leases, and operating leases. As our revenue and profitability have improved during the recovery of the housing market, we have used increased borrowing capacity under our revolving credit facilities to fund working capital needs. We have utilized capital leases and secured equipment loans to finance our vehicles and equipment needed for both replacement and expansion purposes.
As of December 31, 2019, we had $5.0 million of cash and cash equivalents and $75.6 million of available borrowing capacity under our revolving credit facilities. Based on our positive cash flow, our ability to effectively manage working capital needs, and available borrowing capacity, we believe that we have sufficient funding available to finance our operations.
Financing Sources; Debt
SIC Credit Facility
In June 2018, the Company and certain of its subsidiaries entered into an amended and restated loan, security and guaranty agreement, dated as of June 28, 2018, which was amended on December 11, 2018, July 23, 2019 and August 19, 2019 (which we refer to as the “SIC Credit Facility”), with Bank of America, N.A. The SIC Credit Facility is used by the Company, including both RDS and ASG, for operational purposes. Pursuant to the SIC Credit
37
Facility, the Company has a borrowing-base-governed revolving credit facility that provides for borrowings of up to an aggregate of $100 million (after it was increased by $10 million through the amendment entered into on August 19, 2019).
All revolving loans under the SIC Credit Facility are due and payable in full on June 28, 2023, subject to acceleration upon certain conditions.
The Company is required to meet certain financial and nonfinancial covenants pursuant to the SIC Credit Facility. The Company was in compliance with all financial and nonfinancial covenants as of December 31, 2019.
As of December 31, 2019, $22.2 million of indebtedness was outstanding under the SIC Credit Facility. The Company also had $0.4 million of outstanding letters of credit under the SIC Credit Facility at December 31, 2019.
On February 28, 2017, AG&M and Pental, as the borrowers, entered into a financing agreement, as amended, with third party lenders (which we refer to as the “Term Loan Facility”), which initially provided for a $105.0 million term loan facility. The Term Loan Facility was amended in June 2018 to define the borrowers as Select Interior Concepts, Inc. and its subsidiaries. The Term Loan Facility was subsequently amended in December 2018 to increase the borrowing capacity to $174.2 million and in July 2019 to amend certain covenants. On August 19, 2019, the Term Loan Facility was further amended, resulting in an adjusted rate of interest payable on borrowings under the Term Loan Facility. Additionally, the August 19, 2019 amendment imposes a prepayment premium with respect to an optional prepayment of the term loans under the Financing Agreement occurring within fifteen months of August 19, 2019 (other than prepayments in connection with a change of control) in an amount equal to 1.50% of any such principal amount prepaid.
All term loans under the Term Loan Facility are due and payable in full on February 28, 2023, subject to acceleration upon certain conditions.
The Company is required to meet certain financial and nonfinancial covenants pursuant to the Term Loan Facility. The Company was in compliance with all financial and nonfinancial covenants as of December 31, 2019.
As of December 31, 2019, approximately $153.8 million of indebtedness was outstanding under the Term Loan Facility.
Vehicle and Equipment Financing
We have used various secured loans and leases to finance our acquisition of vehicles and equipment. As of December 31, 2019, approximately $10.2 million of indebtedness was outstanding under vehicle and equipment loans and capital leases.
Historical Cash Flow Information
Working Capital
Inventory and accounts receivable represent approximately 75% of our tangible assets as of December 31, 2019, and accordingly, management of working capital is important to our businesses. Working capital (defined as current assets less current liabilities, excluding debt and cash) totaled $113.4 million at December 31, 2019, compared to $100.2 million at December 31, 2018. Working capital levels have increased primarily due to the Intown acquisition and the decrease in earn-out liabilities.
In our RDS segment, for the year ended December 31, 2019, working capital increased by $17.8 million to $34.7 million, compared to $16.9 million for the year ended December 31, 2018. This increase is primarily due to the decrease in accrued liabilities related to earn-out obligations and an increase in working capital due to the acquisition of Intown.
38
In our ASG segment, for the year ended December 31, 2019, working capital decreased by $5.2 million to $79.7 million, compared to $84.9 million for the year ended December 31, 2018. This decrease was largely due to accounts receivable decreases and an increase in accounts payable due to timing of payments.
Cash Flows Provided by Operating Activities
Net cash provided by operating activities was $31.0 million and $12.2 million for the years ended December 31, 2019 and 2018, respectively. Net income (loss) was $7.0 million and $(2.5) million for the years ended December 31, 2019 and 2018, respectively.
Adjustments for noncash expenses included in the calculation of net cash provided by operating activities, including amortization and depreciation, changes in deferred income taxes and other noncash items, totaled $23.1 and $21.8 million for the years ended December 31, 2019 and 2018, respectively. Changes in operating assets and liabilities resulted in net cash provided (used) of $0.9 million and $(7.1) million for the years ended December 31, 2019 and 2018, respectively.
Cash Flows Used in Investing Activities
For the year ended December 31, 2019, cash flow used in investing activities was $24.7 million, with $11.5 million resulting from our investments in acquisitions, $1.0 million for the indemnity payment related to the Bedrock acquisition, and $3.0 million for the escrow payment related to the Greencraft acquisition. Capital expenditures for property and equipment, net of proceeds from disposals, totaled $9.1 million. For the year ended December 31, 2018, cash flow used in investing activities was $80.6 million, with $72.1 million resulting from our investments in acquisitions. Capital expenditures for property and equipment, net of proceeds from disposals, totaled $8.5 million.
Cash Flows (Used in) / Provided by Financing Activities
Net cash (used) provided by financing activities was $(10.7) million and $72.2 million for the years ended December 31, 2019 and 2018, respectively. Cash flows used in financing activities supported our acquisition strategies.
For the year ended December 31, 2019, we borrowed an additional $11.5 million in term debt to fund the Intown acquisition and made principal payments of $1.9 million, for a net increase in term debt of $9.6 million. We also received $2.7 million in an ERP financing transaction. During the year ended December 31, 2019, aggregate net payments on the SIC Credit Facility were $14.9 million and payments on notes payable were $1.9 million. We also classified $5.8 million of the total $8.0 million Greencraft earn-out payment as a financing activity, as this was the fair value of the contingent liability accrued at purchase.
For the year ended December 31, 2018, we borrowed an additional $57.2 million in term debt, with debt issuance costs of $0.5 million, and made principal payments of $2.5 million. Aggregate net borrowings on the SIC Credit Facility were $17.9 million, with issuance costs of $0.5 million. Proceeds from employee stock purchases were $0.6 million.
Contractual Obligations
In the table below, we set forth our enforceable and legally binding obligations as of December 31, 2019. Some of the amounts included in the table are based on management’s estimates and assumptions about these obligations, including their duration, the possibility of renewal, anticipated actions by third parties, and other factors. Because these estimates and assumptions are necessarily subjective, our actual payments may vary from those reflected in the table.
39
|
|
|
Payments due by period |
|
|||||||||||||||||
|
(in thousands) |
|
Total |
|
|
Less than 1 year |
|
|
1 to 3 years |
|
|
3 - 5 years |
|
|
More than 5 years |
|
|||||
|
Long-Term Debt Obligations(1) |
|
$ |
154,666 |
|
|
$ |
12,260 |
|
|
$ |
2,303 |
|
|
$ |
140,103 |
|
|
|
— |
|
|
Capital Lease Obligations(2) |
|
|
10,241 |
|
|
|
2,752 |
|
|
|
5,054 |
|
|
|
1,971 |
|
|
|
464 |
|
|
Operating Lease Obligations(3) |
|
|
54,732 |
|
|
|
15,241 |
|
|
|
24,941 |
|
|
|
9,627 |
|
|
|
4,923 |
|
|
Purchase Obligations(4) |
|
|
41,417 |
|
|
|
39,417 |
|
|
|
2,000 |
|
|
|
— |
|
|
|
— |
|
|
Total |
|
$ |
261,056 |
|
|
$ |
69,670 |
|
|
$ |
34,298 |
|
|
$ |
151,701 |
|
|
$ |
5,387 |
|
|
(1) |
Long-term debt obligations include principal payments on our term loans as well as our notes payable. Long-term debt obligations do not include interest or fees on the unused portion of our revolving letters of credit or financing fees associated with the issuance of debt. |
|
(2) |
Capital lease obligations include minimum lease payments on capital leases for vehicles and equipment purchased. |
|
(3) |
We lease certain locations, including, but not limited to, corporate offices, warehouses, fabrication shops, and design centers. For additional information, see Note 11—Commitments and Contingencies to our consolidated financial statements included in this Annual Report. |
|
(4) |
These amounts take into account a contract with a supplier of engineered stone on an exclusive basis in certain states within the United States. As part of the terms of the exclusive right to distribute the products provided under the contract, we are obligated to take delivery of a certain minimum amount of product from this supplier. If we fall short of these minimum purchase requirements in any given calendar year, we have agreed to negotiate with the supplier to arrive at a mutually acceptable resolution. There are no financial penalties to us if such commitments are not met; however, in such a case, the supplier has reserved the right, under the contract, to withdraw the exclusive distribution rights granted to us. The amount of the payment is estimated by multiplying the minimum quantity required under the contract by the average price paid in 2019. This amounts to approximately $37.4 million in 2020. |
In February 2020, a new exclusive rights agreement was entered into with the same vendor under similar terms, but with increased purchase obligation amounts through December 31, 2025. The total purchase obligation payments for less than 1 year increases from $39.4 million to $73.7 million and the obligations for 1-3 years increases from $2 million to $199.5 million as a result of the new agreement. The additional purchase obligation amount under the new agreement for 3-5 years is $282.7 million and more than 5 years is $184.6 million. For additional information, see Note 11—Commitments and Contingencies to our consolidated financial statements included in this Annual Report.
In addition to the contractual obligations set forth above, as of December 31, 2019, we had an aggregate of approximately $22.2 million of indebtedness outstanding under the SIC Credit Facility.
Off-Balance Sheet Arrangements
As of December 31, 2019, with the exception of operating leases that we typically use in the ordinary course of business, we were not party to any material off-balance sheet financial arrangements that are reasonably likely to have a current or future effect on our financial condition or operating results. We do not have any relationship with unconsolidated entities or financial partnerships for the purpose of facilitating off-balance sheet arrangements or for other contractually narrow or limited purposes.
40
Critical Accounting Policies and Estimates
Management’s discussion and analysis of our financial condition and results of operations is based upon our consolidated financial statements, which have been prepared in accordance with GAAP. The preparation of our consolidated financial statements requires us to make estimates and assumptions that affect the reported amounts of assets, liabilities, revenues and expenses, and related disclosure of contingent assets and liabilities. Certain accounting policies involve judgments and uncertainties to such an extent that there is a reasonable likelihood that materially different amounts could have been reported using different assumptions or under different conditions. We evaluate our estimates and assumptions on a regular basis. We base our estimates on historical experience and various other assumptions that are believed to be reasonable under the circumstances, the results of which form the basis for making judgments about the carrying values of our assets and liabilities that are not readily apparent from other sources. Actual results may differ from these estimates and assumptions used in preparation of our consolidated financial statements.
Revenue Recognition
The Company’s revenue derived from the sale of imported granite, marble, and related items, primarily in our ASG operating segment, is recognized at a point in time when control over a product is transferred to a customer. This transfer occurs primarily when goods are picked up by a customer at the branch or when goods are delivered to a customer location.
The Company’s contracts with its home builder customers within our RDS operating segment are usually short-term in nature and will generally range in length from several days to several weeks. The Company’s contracts related to multi-family and commercial projects are generally long-term in nature. We recognize revenue from both short-term and long-term contracts for each distinct performance obligation identified over time on a percentage-of-completion basis of accounting, utilizing the output method as a measure of progress, as we believe this represents the best measure of when goods and services are transferred to the customer.
Revenue is measured at the transaction price, which is based on the amount of consideration the Company expects to receive in exchange for transferring the promised goods or services to the customer. The transaction price will include estimates of variable consideration, such as any returns and sales incentives. Applicable customer sales taxes, when remitted, are recorded as a liability and excluded from revenue on a net basis.
In the fourth quarter of 2019, the Company adopted ASU 2014-09, the new accounting standard under ASC Topic 606, using the modified retrospective method as of January 1, 2019.
Cost of Revenue
RDS’s cost of revenue is comprised of the costs of materials and labor to purchase and install products for our customers.
ASG’s cost of revenue primarily consists of purchased materials, sourcing fees for inventory procurement, and freight costs.
RDS and ASG also include payroll taxes and benefits, workers’ compensation insurance, vehicle-related expenses and overhead costs, including rent, depreciation, utilities, property taxes, repairs and maintenance costs in the cost of revenue.
Our cost of revenue is reduced by rebates provided by suppliers in the period the rebate is earned.
41
Accounts receivable are recorded at net realizable value. We continually assess the collectability of outstanding customer invoices; and if deemed necessary, maintain an allowance for estimated losses resulting from the non-collection of customer receivables. In estimating this allowance, we consider factors such as: historical collection experience, a customer’s current creditworthiness, customer concentrations, personal guarantees, credit insurance, age of the receivable balance both individually and in the aggregate and general economic conditions that may affect a customer’s ability to pay. We have the ability to place liens against the significant amount of RDS customers in order to secure receivables. Actual customer collections could differ from our estimates. At December 31, 2019 and 2018, the allowance for doubtful accounts was $0.8 million and $0.5 million, respectively.
Inventories
Inventories consist of stone slabs, tile and sinks, and include the costs to acquire the inventories and bring them to their existing location and condition. Inventory also includes flooring, cabinets, doors and trim, glass, and countertops, which have not yet been installed, as well as labor and related costs for installations in process. Inventory is valued at the lower of cost (using the specific identification and first-in, first-out methods) or net realizable value.
Intangible Assets
Intangible assets consist of customer relationships, trade names and non-compete agreements. We consider all our intangible assets to have definite lives and such intangible assets are amortized on the straight-line method over the estimated useful lives of the respective assets or on an accelerated basis based on the expected cash flows generated by the existing customers as follows:
|
|
|
Range of estimated useful lives |
|
Weighted average useful life |
|
Customer relationships |
|
2 years – 15 years |
|
10 years |
|
Trade names |
|
3 years – 11 years |
|
8 years |
|
Non-compete agreements |
|
Life of agreement |
|
4 years |
Business Combinations
We record business combinations using the acquisition method of accounting. Under the acquisition method of accounting, identifiable assets acquired and liabilities assumed are recorded at their acquisition date fair values. The excess of the purchase price over the estimated fair value is recorded as goodwill. Changes in the estimated fair values of net assets recorded for acquisitions prior to the finalization of more detailed analysis, but not to exceed one year from the date of acquisition, will adjust the amount of the purchase price allocable to goodwill. Measurement period adjustments are reflected in the period in which they occur.
Goodwill
Goodwill represents the excess of the cost of an acquired entity over the fair value of the acquired net assets. We account for goodwill in accordance with FASB ASC topic 350, Intangibles-Goodwill and Other Intangible Assets, which among other things, addresses financial accounting and reporting requirements for acquired goodwill and other intangible assets having indefinite useful lives. ASC topic 350 requires goodwill to be carried at cost, prohibits the amortization of goodwill and requires us to test goodwill for impairment at least annually. We test for impairment of goodwill annually during the fourth quarter or more frequently if events or changes in circumstances indicate that the goodwill may be impaired. Events or changes in circumstances which could trigger an impairment review include a significant adverse change in legal factors or in the business climate, an adverse action or assessment by a regulator, unanticipated competition, a loss of key personnel, significant changes in the manner of our use of the acquired assets or the strategy for our overall business, significant negative industry or economic trends, or significant underperformance relative to expected historical or projected future results of operations. We identified RDS and ASG as reporting units and determined each reporting unit’s fair value substantially exceeded such reporting unit’s carrying value. There were no impairment charges related to goodwill for the years ended December 31, 2019 and 2018.
42
We account for equity-based awards by measuring the awards at the date of grant and recognizing the grant-date fair value as an expense using either straight-line or accelerated attribution, depending on the specific terms of the award agreements over the requisite service or performance period, which is usually equivalent to the vesting period.
Income Taxes
The provision for income taxes is accounted for under the asset and liability method prescribed by ASC 740 (Topic 740, Income Taxes). Deferred tax assets and liabilities are recognized for the future tax consequences attributable to differences between the financial statement carrying amounts of existing assets and liabilities and their respective tax bases, operating losses and tax credit carryforwards. Deferred tax assets and liabilities are measured using the enacted tax rates expected to apply to taxable income in the years in which those temporary differences are expected to be recovered or settled. The effect on deferred tax assets and liabilities of a change in tax rates is recognized in income in the period the tax rate changes are enacted.
We recognize the tax benefit from an uncertain tax position only if it is more likely than not the tax position will be sustained on examination by the taxing authorities, based on the technical merits of the position. The tax benefits recognized in the financial statements from such positions are then measured based on the largest benefit that has a greater than 50% likelihood of being realized upon settlement.
On December 22, 2017, the Tax Cuts and Jobs Act (which we refer to as the “Tax Act”) was adopted into law. The Tax Act makes broad and complex changes to the Internal Revenue Code of 1986, including, but not limited to, (i) reducing the U.S. federal corporate tax rate from 35% to 21%; (ii) eliminating the corporate alternative minimum tax (“AMT”) and changing how existing AMT credits are realized; (iii) creating a new limitation on deductible interest expense; and (iv) changing rules related to uses and limitation of net operating loss carryforwards created in tax years beginning after December 31, 2017.
Our policy is to recognize interest and/or penalties related to all tax positions as income tax expense. To the extent that accrued interest and penalties do not ultimately become payable, amounts accrued will be reduced and reflected as a reduction of the overall income tax provision in the period that such determination is made. We have recognized $0.4 million and $0.5 million in combined interest and penalties related to uncertain tax positions for the years ended December 31, 2019 and 2018, respectively.
Recent Accounting Pronouncements
See Note 1 – Organization and Business Description to our audited consolidated financial statements included in this Annual Report for a description of recent accounting pronouncements issued.
Item 7A. Quantitative and Qualitative Disclosures About Market Risk.
Interest Rate Risk
We borrow from lenders using financial instruments such as revolving lines of credit, term loans, and notes payable. In many cases, the interest costs we incur under these agreements is calculated using a variable rate that will fluctuate with changes in a published short-term market interest rate index, such as LIBOR. Accordingly, there is no guarantee as to what our interest payments and expense will be in the future. In an economic environment where short term rates (under one year) may increase or continue to increase at any time, there can be no assurance that interest rates will not be higher in the future and have an adverse effect on our financial soundness. At December 31, 2019, we had outstanding variable rate borrowings of approximately $176.0 million. Assuming the current level of borrowing under the variable rate debt facilities, a hypothetical one-percentage point increase (decrease) in interest rates on our variable rate debt would increase (decrease) our annual interest expense by approximately $1.8 million.
For variable rate debt, interest rate changes generally do not affect the fair value of the debt instrument, but do impact future earnings and cash flows, assuming other factors are held constant. We did not utilize swaps, forward or option contracts on interest rates or commodities, or other types of derivative financial instruments during the
43
years ended December 31, 2019, 2018, and 2017. We have not entered into and currently do not hold derivatives for trading or speculative purposes.
The United Kingdom’s Financial Conduct Authority has announced the intent to phase out the use of LIBOR by the end of 2021. If LIBOR is discontinued, we may need to renegotiate the terms of certain of credit instruments which utilize LIBOR as a benchmark in determining the interest rate, to replace LIBOR with the new standard that is established. As a result, we may incur incremental costs in transitioning to a new standard, and interest rates on our current or future indebtedness may be adversely affected by the new standard. There is currently no definitive information regarding the future utilization of LIBOR or any particular replacement rate. As such, the potential effect of any such event on our cost of capital cannot yet be determined, but we do not expect it to have a material impact on our consolidated financial condition, results of operations, or cash flows.
Foreign Currency Exchange Rate Risk
We purchase materials from both domestic and foreign suppliers. While predominantly all of the suppliers receive payments in U.S. dollars and, as such, we are not currently exposed to any foreign currency exchange rate risk, there can be no assurance that the payments to suppliers in the future will not be affected by exchange fluctuations between the U.S. dollar and the local currencies of these foreign suppliers.
Item 8. Financial Statements and Supplementary Data.
The information required by this Item is incorporated herein by reference to the financial statements set forth in Item 15 (Exhibits, Financial Statement Schedules) of Part IV of this Annual Report.
Item 9. Changes in and Disagreements with Accountants on Accounting and Financial Disclosure.
None.
Item 9A. Controls and Procedures.
Evaluation of Disclosure Controls and Procedures
Our management, under the supervision and with the participation of our management, including our Chief Executive Officer and Chief Financial Officer (which we refer to as, together, the “Certifying Officers”), evaluated the effectiveness of our disclosure controls and procedures, as defined by Rules 13a-15(e) and 15d-15(e) under the Exchange Act, as of December 31, 2019. Based on the evaluation of our disclosure controls and procedures, our Certifying Officers concluded that our disclosure controls and procedures were effective as of December 31, 2019
Changes in Internal Control over Financial Reporting
There was no change in our internal control over financial reporting identified in connection with the evaluation required by Rule 13a-15(d) and 15d-15(d) of the Exchange Act that occurred during the period covered by this report that has materially affected, or is reasonably likely to materially affect, our internal control over financial reporting.
44
Management’s Report on Internal Controls Over Financial Reporting
We are responsible for establishing and maintaining internal control over financial reporting (as defined in Rules 13a-15(f) and 15d-15(f) under the Exchange Act). Because of its inherent limitations, internal control over financial reporting is not intended to provide absolute assurance that a misstatement of our financial statements would be prevented or detected. Our management, including our Certifying Officers, conducted an evaluation of the effectiveness of our internal control over financial reporting based on the framework in Internal Control - Integrated Framework (2013) issued by the Committee of Sponsoring Organizations of the Treadway Commission. Based on their assessment, our Certifying Officers concluded that our internal control over financial reporting was effective as of December 31, 2019 to provide reasonable assurance regarding the reliability of financial reporting and the preparation of consolidated financial statements for external reporting purposes in accordance with U.S. generally accepted accounting principles.
This Annual Report on Form 10-K does not include an attestation report of our registered public accounting firm due to an exemption established by rules of the SEC for emerging growth companies as defined in the JOBS Act.
None.
45
Item 10. Directors, Executive Officers of the Registrant and Corporate Governance
The information required by this Item will be set forth in our definitive proxy statement (which we refer to as our “2020 Proxy Statement”) to be filed in connection with our 2020 Annual Meeting of Stockholders (which Proxy Statement will be filed with the SEC within 120 days of December 31, 2019). The information required by this Item to be contained in our 2020 Proxy Statement under the headings “Election of Directors,” “Executive Compensation” and “Section 16(a) Beneficial Ownership Reporting Compliance” is incorporated herein by reference.
Our Code of Business Conduct and Ethics is available in the “Investors—Corporate Governance—Governance Highlights—Governance Documents” section of our website located at www.selectinteriorconcepts.com. To the extent required by applicable rules of the SEC and the Nasdaq Stock Market, we intend to disclose on our website any amendments to, or waivers from, any provision of our Code of Business Conduct and Ethics that apply to our Company's directors and executive officers, including our principal executive officer, principal financial officer or controller, or persons performing similar functions.
Item 11. Executive Compensation
The information required by this Item will be set forth in our 2020 Proxy Statement under the heading “Executive Compensation,” which information is incorporated herein by reference.
Item 12. Security Ownership of Certain Beneficial Owners and Management and Related Stockholder Matters
The information required by this Item will be set forth in our 2020 Proxy Statement under the heading “Security Ownership of Certain Beneficial Owners and Management and Related Stockholder Matters” and “Equity Compensation Plan Information,” which is incorporated herein by reference.
Item 13. Certain Relationships and Related Transactions, and Director Independence
The information required by this Item will be set forth in our 2020 Proxy Statement under the heading “Related Transactions and Director Independence” which information is incorporated herein by reference.
Item 14. Principal Accountant Fees and Services
The information required by this Item will be set forth in our 2020 Proxy Statement under the heading “Fees Paid to Our Independent Registered Accounting Firm,” which information is incorporated herein by reference.
46
Item 15. Exhibits, Financial Statement Schedules.
(a) The following documents are filed as part of this Annual Report on Form 10-K: Exhibits.
1. Financial Statements. The following financial statements of the Company are included in a separate section of this Annual Report on Form 10-K commencing on the page numbers specified below:
|
Consolidated Financial Statements |
|
|
|
|
|
F-2 |
||
|
|
F-3 |
||
|
|
F-4 |
||
|
|
F-5 |
||
|
|
F-6 |
||
|
|
F-7 |
||
2. Financial Statements Schedules. See “Schedule I – SIC’s Condensed Parent Company Only Financial Statements” beginning on page F-50.
3. Exhibits. The following exhibits are either filed herewith or incorporated herein by reference:
|
Exhibit Number |
|
Description |
|
|
|
|
|
3.1 |
|
|
|
|
|
|
|
3.2 |
|
|
|
|
|
|
|
4.1* |
|
|
|
|
|
|
|
10.1 † |
|
|
|
|
|
|
|
10.2 † |
|
|
|
|
|
|
|
10.3 † |
|
|
|
|
|
|
|
10.4 † |
|
|
|
|
|
|
|
10.5 † |
|
|
|
|
|
|
|
10.6 † |
|
47
|
|
|
|
|
10.7 † |
|
|
|
|
|
|
|
10.8 †* |
|
|
|
|
|
|
|
10.9 † |
|
|
|
|
|
|
|
10.10 † |
|
|
|
|
|
|
|
10.11 † |
|
|
|
|
|
|
|
10.12 † |
|
|
|
|
|
|
|
10.13 |
|
|
|
|
|
|
|
10.14 |
|
|
|
|
|
|
|
10.15 |
|
|
|
|
|
|
|
10.16 |
|
|
|
|
|
|
|
10.17 |
|
|
|
|
|
|
|
10.18 |
|
48
|
|
|
|
|
10.19 |
|
|
|
|
|
|
|
10.20 |
|
|
|
|
|
|
|
10.21 |
|
|
|
|
|
|
|
10.22 |
|
|
|
|
|
|
|
10.23 |
|
|
|
|
|
|
|
10.24 |
|
|
|
|
|
|
|
10.25 |
|
|
|
|
|
|
|
10.26 |
|
|
|
|
|
|
|
10.27 |
|
|
|
|
|
|
|
10.28* |
|
Retention Agreement, dated as of July 12, 2019, by and between the Company and Tyrone Johnson. |
|
|
|
|
|
10.29* |
|
Retention Agreement, dated as of July 12, 2019, by and between the Company and Nadeem Moiz. |
|
|
|
|
|
10.30* |
|
Retention Agreement, dated as of July 12, 2019, by and between the Company and Kendall R. Hoyd. |
|
|
|
|
|
10.31* |
|
Retention Agreement, dated as of July 12, 2019, by and between the Company and Shawn K. Baldwin. |
|
|
|
|
|
21.1* |
|
|
|
|
|
|
|
23.1* |
|
|
|
|
|
|
|
31.1* |
|
|
|
|
|
|
|
31.2* |
|
|
|
|
|
|
|
32.1* |
|
|
|
|
|
|
49
|
|
||
|
|
|
|
|
101.INS |
|
XBRL Instance Document. |
|
|
|
|
|
101.SCH |
|
XBRL Taxonomy Extension Schema Document. |
|
|
|
|
|
101.CAL |
|
XBRL Taxonomy Extension Calculation Linkbase Document. |
|
|
|
|
|
101.DEF |
|
XBRL Taxonomy Extension Definition Linkbase Document. |
|
|
|
|
|
101.LAB |
|
XBRL Taxonomy Extension Label Linkbase Document. |
|
|
|
|
|
101.PRE |
|
XBRL Taxonomy Extension Presentation Linkbase Document. |
|
* |
Filed herewith. |
|
† |
Management contract or compensatory plan or arrangement. |
None.
50
Pursuant to the requirements of Section 13 or 15(d) of the Securities Exchange Act of 1934, as amended, the Registrant has duly caused this Report to be signed on its behalf by the undersigned, thereunto duly authorized.
|
|
|
Select Interior Concepts, Inc. |
|
|
|
|
|
|
|
Date: March 12, 2020 |
|
By: |
/s/ Tyrone Johnson |
|
|
|
|
Tyrone Johnson |
|
|
|
|
Chief Executive Officer and Director (Principal Executive Officer) |
Pursuant to the requirements of the Securities Exchange Act of 1934, as amended, this Report has been signed below by the following persons on behalf of the Registrant in the capacities and on the dates indicated.
|
Signature |
|
Title |
|
Date |
|
|
|
|
|
|
|
|
|
/s/ Tyrone Johnson |
|
Chief Executive Officer and Director |
|
March 12, 2020 |
|
|
Tyrone Johnson |
|
(Principal Executive Officer) |
|
|
|
|
|
|
|
|
|
|
|
/s/ Nadeem Moiz |
|
Chief Financial Officer |
|
March 12, 2020 |
|
|
Nadeem Moiz |
|
(Principal Financial and Accounting Officer) |
|
|
|
|
|
|
|
|
|
|
|
/s/ J. David Smith |
|
Chairman of the Board of Directors |
|
March 12, 2020 |
|
|
J. David Smith |
|
|
|
|
|
|
|
|
|
|
|
|
|
/s/ Donald F. McAleenan |
|
Director |
|
March 12, 2020 |
|
|
Donald F. McAleenan |
|
|
|
|
|
|
|
|
|
|
|
|
|
/s/ Robert Scott Vansant |
|
Director |
|
March 12, 2020 |
|
|
Robert Scott Vansant |
|
|
|
|
|
|
|
|
|
|
|
|
|
/s/ S. Tracy Coster |
|
Director |
|
March 12, 2020 |
|
|
S. Tracy Coster |
|
|
|
|
|
|
|
|
|
|
|
|
|
/s/ Brett G. Wyard |
|
Director |
|
March 12, 2020 |
|
|
Brett G. Wyard |
|
|
|
|
|
|
|
|
|
|
|
|
|
/s/ Bryant Riley |
|
Director |
|
March 12, 2020 |
|
|
Bryant Riley |
|
|
|
|
|
51
Index to Consolidated Financial Statements
Consolidated Financial Statements
|
|
F-2 |
|
|
|
F-3 |
|
|
|
F-4 |
|
|
|
F-5 |
|
|
|
F-6 |
|
|
|
F-7 |
|
|
|
F-50 |
F-1
REPORT OF INDEPENDENT REGISTERED PUBLIC ACCOUNTING FIRM
Board of Directors and Shareholders
Select Interior Concepts, Inc.
Opinion on the financial statements
We have audited the accompanying consolidated balance sheets of Select Interior Concepts, Inc. (a Delaware corporation) and subsidiaries (the “Company”) as of December 31, 2019 and 2018, the related consolidated statements of operations, changes in shareholders’ equity, and cash flows for each of the three years in the period ended December 31, 2019, and the related notes and financial statement schedule included under Item 15(a) (collectively referred to as the “financial statements”). In our opinion, the financial statements present fairly, in all material respects, the financial position of the Company as of December 31, 2019 and 2018, and the results of its operations and its cash flows for each of the three years in the period ended December 31, 2019, in conformity with accounting principles generally accepted in the United States of America.
Basis for opinion
These financial statements are the responsibility of the Company’s management. Our responsibility is to express an opinion on the Company’s financial statements based on our audits. We are a public accounting firm registered with the Public Company Accounting Oversight Board (United States) (“PCAOB”) and are required to be independent with respect to the Company in accordance with the U.S. federal securities laws and the applicable rules and regulations of the Securities and Exchange Commission and the PCAOB.
We conducted our audits in accordance with the standards of the PCAOB. Those standards require that we plan and perform the audit to obtain reasonable assurance about whether the financial statements are free of material misstatement, whether due to error or fraud. The Company is not required to have, nor were we engaged to perform, an audit of its internal control over financial reporting. As part of our audits we are required to obtain an understanding of internal control over financial reporting but not for the purpose of expressing an opinion on the effectiveness of the Company’s internal control over financial reporting. Accordingly, we express no such opinion.
Our audits included performing procedures to assess the risks of material misstatement of the financial statements, whether due to error or fraud, and performing procedures that respond to those risks. Such procedures included examining, on a test basis, evidence supporting the amounts and disclosures in the financial statements. Our audits also included evaluating the accounting principles used and significant estimates made by management, as well as evaluating the overall presentation of the financial statements. We believe that our audits provide a reasonable basis for our opinion.
/s/ GRANT THORNTON LLP
We have served as the Company’s auditor since 2017.
Los Angeles, California
March 12, 2020
F-2
Select Interior Concepts Consolidated Financial Statements
Select Interior Concepts, Inc. and Subsidiaries
As of December 31, 2019 and 2018
|
|
|
As of December 31, |
|
|||||
|
(in thousands, except share data) |
|
2019 |
|
|
2018 |
|
||
|
Assets |
|
|
|
|
|
|
|
|
|
Current assets |
|
|
|
|
|
|
|
|
|
Cash |
|
$ |
5,002 |
|
|
$ |
6,362 |
|
|
Restricted cash |
|
|
— |
|
|
|
3,000 |
|
|
Accounts receivable, net of allowance for doubtful accounts of $849 and $500 at December 31, 2019 and 2018, respectively |
|
|
63,419 |
|
|
|
63,601 |
|
|
Inventories |
|
|
104,741 |
|
|
|
108,270 |
|
|
Prepaid expenses and other current assets |
|
|
11,083 |
|
|
|
2,809 |
|
|
Income taxes receivable |
|
|
2,184 |
|
|
|
1,263 |
|
|
Total current assets |
|
|
186,429 |
|
|
|
185,305 |
|
|
Property and equipment, net of accumulated depreciation of $21,020 and $13,038 at December 31, 2019 and 2018, respectively |
|
|
26,494 |
|
|
|
19,798 |
|
|
Deferred tax assets, net |
|
|
10,550 |
|
|
|
9,355 |
|
|
Goodwill |
|
|
99,789 |
|
|
|
94,593 |
|
|
Customer relationships, net of accumulated amortization of $48,251 and $35,877 at December 31, 2019 and 2018, respectively |
|
|
71,989 |
|
|
|
79,843 |
|
|
Intangible assets, net of accumulated amortization of $7,471 and $4,068 at December 31, 2019 and 2018, respectively |
|
|
18,759 |
|
|
|
20,872 |
|
|
Other assets |
|
|
6,265 |
|
|
|
6,248 |
|
|
Total assets |
|
$ |
420,275 |
|
|
$ |
416,014 |
|
|
Liabilities and stockholders’ equity |
|
|
|
|
|
|
|
|
|
Current liabilities |
|
|
|
|
|
|
|
|
|
Current portion of long-term debt, net of financing fees of $511 at December 31, 2019 and 2018, respectively |
|
$ |
11,749 |
|
|
$ |
1,368 |
|
|
Current portion of capital lease obligations |
|
|
2,395 |
|
|
|
500 |
|
|
Accounts payable |
|
|
42,734 |
|
|
|
37,265 |
|
|
Income taxes payable |
|
|
— |
|
|
|
984 |
|
|
Accrued expenses and other current liabilities |
|
|
16,661 |
|
|
|
27,620 |
|
|
Customer deposits |
|
|
8,627 |
|
|
|
9,908 |
|
|
Total current liabilities |
|
|
82,166 |
|
|
|
77,645 |
|
|
Line of credit |
|
|
21,871 |
|
|
|
36,706 |
|
|
Long-term debt, net of current portion and financing fees of $1,107 and $1,618 at December 31, 2019 and 2018, respectively |
|
|
141,299 |
|
|
|
142,442 |
|
|
Long-term capital lease obligations |
|
|
6,907 |
|
|
|
1,544 |
|
|
Other long-term liabilities |
|
|
6,757 |
|
|
|
8,983 |
|
|
Total liabilities |
|
|
259,000 |
|
|
|
267,320 |
|
|
Commitments and contingencies (Note 11) |
|
|
— |
|
|
|
— |
|
|
Stockholders' equity |
|
|
|
|
|
|
|
|
|
Class A common stock, par value $0.01 per share; 100,000,000 shares authorized; 25,139,542 shares issued and 25,106,402 outstanding at December 31, 2019 and 25,682,669 issued and outstanding at December 31, 2018 |
|
|
251 |
|
|
|
257 |
|
|
Treasury stock, 33,140 shares at December 31, 2019, at cost |
|
|
(391 |
) |
|
|
— |
|
|
Additional paid-in capital |
|
|
161,396 |
|
|
|
156,601 |
|
|
Retained earnings (accumulated deficit) |
|
|
19 |
|
|
|
(8,164 |
) |
|
Total stockholders’ equity |
|
|
161,275 |
|
|
|
148,694 |
|
|
Total liabilities and stockholders' equity |
|
$ |
420,275 |
|
|
$ |
416,014 |
|
See accompanying notes to consolidated financial statements.
F-3
Select Interior Concepts, Inc. and Subsidiaries
Consolidated Statements of Operations
For the Years Ended December 31, 2019, 2018 and 2017
|
|
|
Year Ended December 31, |
|
|||||||||
|
(in thousands, except share data) |
|
2019 |
|
|
2018 |
|
|
2017 |
|
|||
|
Revenue, net |
|
$ |
610,373 |
|
|
$ |
489,757 |
|
|
$ |
352,952 |
|
|
Cost of revenue |
|
|
446,299 |
|
|
|
356,303 |
|
|
|
249,063 |
|
|
Gross profit |
|
|
164,074 |
|
|
|
133,454 |
|
|
|
103,889 |
|
|
Selling, general and administrative expenses |
|
|
144,816 |
|
|
|
121,357 |
|
|
|
97,727 |
|
|
Income from operations |
|
|
19,258 |
|
|
|
12,097 |
|
|
|
6,162 |
|
|
Other expense: |
|
|
|
|
|
|
|
|
|
|
|
|
|
Interest expense |
|
|
17,220 |
|
|
|
11,426 |
|
|
|
12,761 |
|
|
Loss on extinguishments of debt |
|
|
— |
|
|
|
42 |
|
|
|
988 |
|
|
Other (income) expense, net |
|
|
(6,467 |
) |
|
|
2,115 |
|
|
|
439 |
|
|
Total other expense, net |
|
|
10,753 |
|
|
|
13,583 |
|
|
|
14,188 |
|
|
Income (loss) before provision for income taxes |
|
|
8,505 |
|
|
|
(1,486 |
) |
|
|
(8,026 |
) |
|
Provision for income taxes |
|
|
1,521 |
|
|
|
989 |
|
|
|
3,320 |
|
|
Net income (loss) |
|
$ |
6,984 |
|
|
$ |
(2,475 |
) |
|
$ |
(11,346 |
) |
|
Less: net loss attributable to Predecessor |
|
|
— |
|
|
|
— |
|
|
|
(5,657 |
) |
|
Net income (loss) attributable to Select Interior Concepts, Inc. |
|
$ |
6,984 |
|
|
$ |
(2,475 |
) |
|
$ |
(5,689 |
) |
|
Income (loss) per basic and diluted share of common stock |
|
|
|
|
|
|
|
|
|
|
|
|
|
Basic Class A Common Stock |
|
$ |
0.28 |
|
|
$ |
(0.10 |
) |
|
$ |
(0.22 |
) |
|
Basic Class B Common Stock |
|
|
— |
|
|
|
— |
|
|
$ |
(0.22 |
) |
|
Diluted Class A Common Stock |
|
$ |
0.27 |
|
|
$ |
(0.10 |
) |
|
$ |
(0.22 |
) |
|
Diluted Class B Common Stock |
|
|
— |
|
|
|
— |
|
|
$ |
(0.22 |
) |
|
Weighted average shares outstanding |
|
|
|
|
|
|
|
|
|
|
|
|
|
Basic Class A Common Stock |
|
|
25,296,955 |
|
|
|
25,634,342 |
|
|
|
19,650,000 |
|
|
Basic Class B Common Stock |
|
|
— |
|
|
|
— |
|
|
|
5,964,626 |
|
|
Diluted Class A Common Stock |
|
|
25,431,677 |
|
|
|
25,634,342 |
|
|
|
19,650,000 |
|
|
Diluted Class B Common Stock |
|
|
— |
|
|
|
— |
|
|
|
5,964,626 |
|
See accompanying notes to consolidated financial statements.
F-4
Select Interior Concepts, Inc. and Subsidiaries
Consolidated Statements of Changes in Equity
For the Years Ended December 31, 2019, 2018 and 2017
|
|
|
Predecessor |
|
|
Class A Stockholders |
|
|
Class B Stockholders |
|
|
|
|
|
|
|
|
|
|
|
|
|
|
|
|
|
|||||||||||||||
|
(in thousands, except share data) |
|
Member Units |
|
|
Members’ Capital |
|
|
Class A Common Stock Shares |
|
|
Class A Common Stock |
|
|
Class B Common Stock Shares |
|
|
Class B Common Stock |
|
|
Treasury Stock, at Cost |
|
|
Total Additional Paid-in Capital |
|
|
Total Retained Earnings (Accumulated Deficit) |
|
|
Total |
|
||||||||||
|
Balance as of January 1, 2017 |
|
|
55,920,939 |
|
|
$ |
39,741 |
|
|
|
— |
|
|
$ |
— |
|
|
|
— |
|
|
$ |
— |
|
|
$ |
— |
|
|
$ |
— |
|
|
$ |
— |
|
|
$ |
39,741 |
|
|
Issuance of Class E-1 Units to existing members |
|
|
21,736,168 |
|
|
|
— |
|
|
|
— |
|
|
|
— |
|
|
|
— |
|
|
|
— |
|
|
|
— |
|
|
|
— |
|
|
|
— |
|
|
|
— |
|
|
Issuance of Class E-2 Units to Aquarius Seller, Inc. and an existing member |
|
|
7,156,106 |
|
|
|
10,030 |
|
|
|
— |
|
|
|
— |
|
|
|
— |
|
|
|
— |
|
|
|
— |
|
|
|
— |
|
|
|
— |
|
|
|
10,030 |
|
|
Dividends issued |
|
|
— |
|
|
|
(35,421 |
) |
|
|
— |
|
|
|
— |
|
|
|
— |
|
|
|
— |
|
|
|
— |
|
|
|
— |
|
|
|
— |
|
|
|
(35,421 |
) |
|
Equity-based compensation (See Note 12) |
|
|
4,175,844 |
|
|
|
7,345 |
|
|
|
— |
|
|
|
— |
|
|
|
— |
|
|
|
— |
|
|
|
— |
|
|
|
— |
|
|
|
— |
|
|
|
7,345 |
|
|
Net loss prior to November 2017 Restructuring Transactions and November 2017 Private Offering and Private Placement |
|
|
— |
|
|
|
(5,657 |
) |
|
|
— |
|
|
|
— |
|
|
|
— |
|
|
|
— |
|
|
|
— |
|
|
|
— |
|
|
|
— |
|
|
|
(5,657 |
) |
|
Balance prior to November 2017 Restructuring Transactions and November 2017 Private Offering and Private Placement |
|
|
88,989,057 |
|
|
|
16,038 |
|
|
|
— |
|
|
|
— |
|
|
|
— |
|
|
|
— |
|
|
|
— |
|
|
|
— |
|
|
|
— |
|
|
|
16,038 |
|
|
Contribution of member units for Class B Common Stock |
|
|
(57,361,484 |
) |
|
|
(10,264 |
) |
|
|
— |
|
|
|
— |
|
|
|
9,244,112 |
|
|
|
92 |
|
|
|
— |
|
|
|
10,172 |
|
|
|
— |
|
|
|
- |
|
|
Repurchase of member units |
|
|
(31,627,573 |
) |
|
|
(5,774 |
) |
|
|
— |
|
|
|
— |
|
|
|
— |
|
|
|
— |
|
|
|
— |
|
|
|
(56,952 |
) |
|
|
— |
|
|
|
(62,726 |
) |
|
Repurchase and retirement of Class B Common Stock |
|
|
— |
|
|
|
— |
|
|
|
— |
|
|
|
— |
|
|
|
(5,379,486 |
) |
|
|
(53 |
) |
|
|
— |
|
|
|
(59,981 |
) |
|
|
— |
|
|
|
(60,034 |
) |
|
Sale of Class A Common Stock in November 2017 Private Offering and Private Placement, including follow-on offering of 3,000,000 shares of Class A Common Stock |
|
|
— |
|
|
|
— |
|
|
|
21,750,000 |
|
|
|
217 |
|
|
|
— |
|
|
|
— |
|
|
|
— |
|
|
|
240,284 |
|
|
|
— |
|
|
|
240,501 |
|
|
Deferred tax asset adjustment |
|
|
— |
|
|
|
— |
|
|
|
— |
|
|
|
— |
|
|
|
— |
|
|
|
— |
|
|
|
— |
|
|
|
19,845 |
|
|
|
— |
|
|
|
19,845 |
|
|
Balance subsequent to November 2017 Restructuring Transactions and November 2017 Private Offering and Private Placement |
|
|
— |
|
|
|
— |
|
|
|
21,750,000 |
|
|
|
217 |
|
|
|
3,864,626 |
|
|
|
39 |
|
|
|
— |
|
|
|
153,368 |
|
|
|
— |
|
|
|
153,624 |
|
|
Equity-based compensation |
|
|
— |
|
|
|
— |
|
|
|
— |
|
|
|
— |
|
|
|
— |
|
|
|
— |
|
|
|
— |
|
|
|
152 |
|
|
|
— |
|
|
|
152 |
|
|
Net loss subsequent to November 2017 Restructuring Transactions and November 2017 Private Offering and Private Placement |
|
|
— |
|
|
|
— |
|
|
|
— |
|
|
|
— |
|
|
|
— |
|
|
|
— |
|
|
|
— |
|
|
|
— |
|
|
|
(5,689 |
) |
|
|
(5,689 |
) |
|
Balance as of December 31, 2017 |
|
|
— |
|
|
|
— |
|
|
|
21,750,000 |
|
|
|
217 |
|
|
|
3,864,626 |
|
|
|
39 |
|
|
|
— |
|
|
|
153,520 |
|
|
|
(5,689 |
) |
|
|
148,087 |
|
|
Equity-based compensation |
|
|
— |
|
|
|
— |
|
|
|
27,646 |
|
|
|
— |
|
|
|
|
|
|
|
— |
|
|
|
— |
|
|
|
2,528 |
|
|
|
— |
|
|
|
2,528 |
|
|
Issuances of Class A and Class B Stock |
|
|
— |
|
|
|
— |
|
|
|
752 |
|
|
|
1 |
|
|
|
39,645 |
|
|
|
|
|
|
|
— |
|
|
|
553 |
|
|
|
— |
|
|
|
554 |
|
|
Special stock dividend and Class B cancellation |
|
|
— |
|
|
|
— |
|
|
|
226,511 |
|
|
|
2 |
|
|
|
(226,511 |
) |
|
|
(2 |
) |
|
|
— |
|
|
|
— |
|
|
|
— |
|
|
|
— |
|
|
Conversion of Class B Stock to Class A Stock |
|
|
— |
|
|
|
— |
|
|
|
3,677,760 |
|
|
|
37 |
|
|
|
(3,677,760 |
) |
|
|
(37 |
) |
|
|
— |
|
|
|
— |
|
|
|
— |
|
|
|
— |
|
|
Net loss |
|
|
— |
|
|
|
— |
|
|
|
— |
|
|
|
— |
|
|
|
— |
|
|
|
— |
|
|
|
— |
|
|
|
— |
|
|
|
(2,475 |
) |
|
|
(2,475 |
) |
|
Balance as of December 31, 2018 |
|
|
— |
|
|
|
— |
|
|
|
25,682,669 |
|
|
|
257 |
|
|
|
— |
|
|
|
— |
|
|
|
— |
|
|
|
156,601 |
|
|
|
(8,164 |
) |
|
|
148,694 |
|
|
Cumulative effect adjustment (Note 3) |
|
|
— |
|
|
|
— |
|
|
|
— |
|
|
|
— |
|
|
|
— |
|
|
|
— |
|
|
|
— |
|
|
|
— |
|
|
|
1,199 |
|
|
|
1,199 |
|
|
Equity-based compensation |
|
|
— |
|
|
|
— |
|
|
|
— |
|
|
|
— |
|
|
|
— |
|
|
|
— |
|
|
|
— |
|
|
|
4,797 |
|
|
|
— |
|
|
|
4,797 |
|
|
Issuance of Class A common stock due to restricted stock vesting |
|
|
— |
|
|
|
— |
|
|
|
256,873 |
|
|
|
2 |
|
|
|
— |
|
|
|
— |
|
|
|
— |
|
|
|
(2 |
) |
|
|
— |
|
|
|
— |
|
|
Repurchase of Class A common stock |
|
|
— |
|
|
|
— |
|
|
|
— |
|
|
|
— |
|
|
|
— |
|
|
|
— |
|
|
|
(391 |
) |
|
|
— |
|
|
|
— |
|
|
|
(391 |
) |
|
Retirement of Class A common stock |
|
|
— |
|
|
|
— |
|
|
|
(800,000 |
) |
|
|
(8 |
) |
|
|
— |
|
|
|
— |
|
|
|
— |
|
|
|
— |
|
|
|
— |
|
|
|
(8 |
) |
|
Net income |
|
|
— |
|
|
|
— |
|
|
|
— |
|
|
|
— |
|
|
|
— |
|
|
|
— |
|
|
|
— |
|
|
|
— |
|
|
|
6,984 |
|
|
|
6,984 |
|
|
Balance as of December 31, 2019 |
|
|
— |
|
|
$ |
— |
|
|
|
25,139,542 |
|
|
$ |
251 |
|
|
|
— |
|
|
$ |
— |
|
|
$ |
(391 |
) |
|
$ |
161,396 |
|
|
$ |
19 |
|
|
$ |
161,275 |
|
See accompanying notes to consolidated financial statements.
F-5
Select Interior Concepts, Inc. and Subsidiaries
Consolidated Statements of Cash Flows
For the Years Ended December 31, 2019, 2018 and 2017
|
|
|
Year Ended December 31, |
|
|||||||||
|
(in thousands) |
|
2019 |
|
|
2018 |
|
|
2017 |
|
|||
|
Cash flows from operating activities |
|
|
|
|
|
|
|
|
|
|
|
|
|
Net income (loss) |
|
$ |
6,984 |
|
|
$ |
(2,475 |
) |
|
$ |
(11,346 |
) |
|
Adjustments to reconcile net income (loss) to net provided by cash (used in) operating activities: |
|
|
|
|
|
|
|
|
|
|
|
|
|
Depreciation and amortization |
|
|
24,157 |
|
|
|
20,487 |
|
|
|
14,816 |
|
|
Change in fair value of earn-out liabilities |
|
|
(6,029 |
) |
|
|
2,109 |
|
|
|
— |
|
|
Equity-based compensation |
|
|
5,740 |
|
|
|
2,528 |
|
|
|
7,497 |
|
|
Deferred (benefit from) provision for income taxes |
|
|
(1,494 |
) |
|
|
(4,186 |
) |
|
|
2,929 |
|
|
Amortized interest on deferred debt issuance costs |
|
|
610 |
|
|
|
663 |
|
|
|
558 |
|
|
Loss on extinguishment of debt |
|
|
— |
|
|
|
42 |
|
|
|
988 |
|
|
Increase (decrease) in allowance for doubtful accounts |
|
|
349 |
|
|
|
283 |
|
|
|
(127 |
) |
|
(Gain) loss on disposal of property and equipment, net |
|
|
(223 |
) |
|
|
(139 |
) |
|
|
57 |
|
|
Changes in operating assets and liabilities: |
|
|
|
|
|
|
|
|
|
|
|
|
|
Accounts receivable |
|
|
1,225 |
|
|
|
(4,370 |
) |
|
|
(8,784 |
) |
|
Inventories |
|
|
979 |
|
|
|
1,209 |
|
|
|
(24,024 |
) |
|
Prepaid expenses and other current assets |
|
|
(3,012 |
) |
|
|
151 |
|
|
|
(1,616 |
) |
|
Other assets |
|
|
(12 |
) |
|
|
(174 |
) |
|
|
(110 |
) |
|
Accounts payable |
|
|
5,194 |
|
|
|
(11,891 |
) |
|
|
9,166 |
|
|
Accrued expenses and other current liabilities |
|
|
(2,212 |
) |
|
|
3,847 |
|
|
|
2,965 |
|
|
Income taxes payable / receivable |
|
|
(1,905 |
) |
|
|
1,240 |
|
|
|
(2,405 |
) |
|
Customer deposit |
|
|
(1,281 |
) |
|
|
2,888 |
|
|
|
1,069 |
|
|
Other long-term liabilities |
|
|
1,885 |
|
|
|
— |
|
|
|
— |
|
|
Net cash provided by (used in) operating activities |
|
|
30,955 |
|
|
|
12,212 |
|
|
|
(8,367 |
) |
|
Cash flows used in investing activities |
|
|
|
|
|
|
|
|
|
|
|
|
|
Purchase of property and equipment |
|
|
(9,169 |
) |
|
|
(8,507 |
) |
|
|
(4,218 |
) |
|
Proceeds from disposal of property and equipment |
|
|
65 |
|
|
|
6 |
|
|
|
144 |
|
|
Acquisition of T.A.C. Ceramic Tile Co., net of cash acquired |
|
|
— |
|
|
|
(40,189 |
) |
|
|
— |
|
|
Acquisition of Summit Stoneworks, LLC |
|
|
— |
|
|
|
(16,000 |
) |
|
|
— |
|
|
Acquisition of The Tuscany Collection, LLC |
|
|
— |
|
|
|
(4,152 |
) |
|
|
— |
|
|
Acquisition of NSI, LLC |
|
|
— |
|
|
|
(290 |
) |
|
|
— |
|
|
Acquisition of Elegant Home Design, LLC (Indemnity payment in 2019) |
|
|
(1,000 |
) |
|
|
(11,492 |
) |
|
|
— |
|
|
Acquisition of Pental Granite and Marble, LLC, net of cash acquired |
|
|
— |
|
|
|
— |
|
|
|
(88,001 |
) |
|
Acquisition of Greencraft Holdings, LLC, net of cash acquired (Escrow release payment in 2019) |
|
|
(3,000 |
) |
|
|
— |
|
|
|
(26,762 |
) |
|
Acquisition of Intown Design, Inc. |
|
|
(11,537 |
) |
|
|
— |
|
|
|
— |
|
|
Net cash used in investing activities |
|
|
(24,641 |
) |
|
|
(80,624 |
) |
|
|
(118,837 |
) |
|
Cash flows provided by (used in) financing activities |
|
|
|
|
|
|
|
|
|
|
|
|
|
Dividends issued |
|
|
— |
|
|
|
— |
|
|
|
(35,421 |
) |
|
Repurchase of member units |
|
|
— |
|
|
|
— |
|
|
|
(62,725 |
) |
|
Repurchase and retirement of Class B Common Stock |
|
|
— |
|
|
|
— |
|
|
|
(60,035 |
) |
|
Proceeds from November 2017 Private Offering and Private Placement, net of issuance costs of $18.0 million |
|
|
— |
|
|
|
— |
|
|
|
240,501 |
|
|
Payment of Greencraft Holdings, LLC earn-out liability |
|
|
(5,794 |
) |
|
|
— |
|
|
|
— |
|
|
Proceeds from ERP financing |
|
|
2,725 |
|
|
|
— |
|
|
|
— |
|
|
Proceeds from issuance of equity |
|
|
— |
|
|
|
553 |
|
|
|
30 |
|
|
Proceeds from (payments on) line of credit, net |
|
|
(14,934 |
) |
|
|
17,886 |
|
|
|
8,242 |
|
|
Proceeds from term loan |
|
|
11,500 |
|
|
|
57,250 |
|
|
|
130,000 |
|
|
Term loan deferred issuance costs |
|
|
— |
|
|
|
(958 |
) |
|
|
(2,952 |
) |
|
Purchase of treasury stock |
|
|
(399 |
) |
|
|
— |
|
|
|
— |
|
|
Payments on notes payable and capital leases |
|
|
(1,921 |
) |
|
|
(1,454 |
) |
|
|
(667 |
) |
|
Principal payments on long-term debt |
|
|
(1,851 |
) |
|
|
(1,050 |
) |
|
|
(88,949 |
) |
|
Net cash provided by (used in) financing activities |
|
|
(10,674 |
) |
|
|
72,227 |
|
|
|
128,024 |
|
|
Net (decrease) increase in cash and restricted cash |
|
|
(4,360 |
) |
|
|
3,815 |
|
|
|
820 |
|
|
Cash and restricted cash, beginning of period |
|
|
9,362 |
|
|
|
5,547 |
|
|
$ |
4,727 |
|
|
Cash and restricted cash, end of period |
|
$ |
5,002 |
|
|
$ |
9,362 |
|
|
$ |
5,547 |
|
|
Supplemental disclosures of cash flow information |
|
|
|
|
|
|
|
|
|
|
|
|
|
Cash paid for interest |
|
$ |
16,411 |
|
|
$ |
10,445 |
|
|
$ |
12,146 |
|
|
Cash paid for income taxes, net of refunds |
|
$ |
4,899 |
|
|
$ |
3,845 |
|
|
$ |
2,762 |
|
|
Supplemental disclosures of non-cash investing and financing activities |
|
|
|
|
|
|
|
|
|
|
|
|
|
Deferred tax asset adjustment related to November 2017 Restructuring Transactions |
|
$ |
— |
|
|
$ |
— |
|
|
$ |
19,845 |
|
|
Acquisition of Pental Granite and Marble, LLC, Rollover Equity |
|
$ |
— |
|
|
$ |
— |
|
|
$ |
10,000 |
|
|
Contribution of 57,361,484 member units for 9,244,112 shares of Class B Common Stock |
|
$ |
— |
|
|
$ |
— |
|
|
$ |
10,264 |
|
|
Measurement period adjustment related to acquisition of Greencraft Holdings, LLC |
|
$ |
— |
|
|
$ |
317 |
|
|
$ |
— |
|
|
Measurement period adjustment related to acquisition of T.A.C. Ceramic Tile Co. |
|
$ |
498 |
|
|
$ |
— |
|
|
$ |
— |
|
|
Earn-out purchase price adjustment for Summit Stoneworks, LLC |
|
$ |
— |
|
|
$ |
1,851 |
|
|
$ |
— |
|
|
Earn-out purchase price adjustment for T.A.C. Ceramic Tile Co. |
|
$ |
— |
|
|
$ |
2,265 |
|
|
$ |
— |
|
|
Earn-out purchase price adjustment for Intown Design, Inc. |
|
$ |
2,010 |
|
|
$ |
— |
|
|
$ |
— |
|
|
Acquisition of Elegant Home Design, LLC, indemnity holdback |
|
$ |
— |
|
|
$ |
1,000 |
|
|
$ |
— |
|
|
Acquisition of equipment and vehicles with long-term debt and capital leases |
|
$ |
8,251 |
|
|
$ |
1,804 |
|
|
$ |
1,270 |
|
See accompanying notes to consolidated financial statements.
F-6
Select Interior Concepts, Inc. and Subsidiaries
Notes to Consolidated Financial Statements
1. Organization and Business Description
Organization and Nature of Operations
These financial statements reflect the consolidated operations of Select Interior Concepts, Inc. (“SIC” or the “Company”).
SIC is a Delaware corporation that was restructured in November 2017 to be a holding company on which to consolidate diversified building products and services companies with a primary focus on providing products and services related to the interior of all types of buildings. Through its two primary operating subsidiaries and segments, Residential Design Services, LLC (f/k/a TCFI LARK LLC) (“RDS”) and Architectural Surfaces Group, LLC (f/k/a TCFI G&M LLC) (“ASG”), SIC imports and distributes natural and engineered stone slabs for kitchen and bathroom countertops, operates design centers that merchandise interior products, and provides installation services. SIC’s interior product offerings include flooring, cabinets, countertops, and wall tile. RDS operates throughout California, Reno, Nevada, Phoenix, Arizona, Austin, Texas, Manassas, Virginia, Elkridge, Maryland, Atlanta, Georgia, and Charlotte, North Carolina. ASG has operations in the Northeast, Southeast, Southwest, Midwest, Mountain West, and West Coast regions of the United States.
The SIC platform originated in September 2014, when affiliates of Trive Capital Management LLC (“Trive Capital”) acquired RDS, which in turn acquired the assets of PT Tile Holdings, LP (“Pinnacle”) in February 2015, and 100% of the equity interests in Greencraft Holdings, LLC (“Greencraft”) in December 2017. RDS then acquired the assets of Summit Stoneworks, LLC (“Summit”) in August 2018, 100% of the equity interests in T.A.C. Ceramic Tile Co. (which we refer to as “TAC”) in December 2018, and acquired the assets of Intown Design, Inc., Intown Granite of Charlotte, Inc., and Granitec, LLC, (collectively, “Intown”) in March 2019.
Affiliates of Trive Capital also formed a consolidation platform in the stone countertop market by establishing TCFI G&M LLC, a Delaware limited liability company formed on May 26, 2015. TCFI G&M LLC acquired 100% of the equity interests in Architectural Granite & Marble, LLC in June 2015, which in turn acquired the assets of Bermuda Import-Export, Inc. (“Modul”) in July 2016, 100% of the equity interests in Pental Granite and Marble, LLC (“Pental”) in February 2017, and the assets of Cosmic Stone & Tile Distributors, Inc. (“Cosmic”) in October 2017. On January 17, 2018, TCFI G&M LLC changed its name to Architectural Surfaces Group, LLC (a/k/a ASG). ASG then acquired the assets of Elegant Home Design, LLC (Bedrock”) in January 2018, the assets of NSI, LLC (“NSI”) in March 2018, and the assets of The Tuscany Collection, LLC (“Tuscany”) in August 2018.
Reorganization
On November 22, 2017, SIC and the former equity holders of RDS and ASG completed a series of restructuring transactions (collectively, the “November 2017 Restructuring Transactions”) whereby (i) certain former equity holders of RDS and ASG (collectively referred to as the “Rollover Stockholders”) contributed a certain amount of equity interests in RDS and ASG to SIC in exchange for shares of Class B common stock, par value $0.01 per share, of SIC (“Class B Common Stock”) (such transaction referred to as the “Contribution and Exchange”), (ii) SIC used a certain amount of proceeds from the November 2017 Private Offering and Private Placement (described below) to purchase from certain former equity holders of RDS and ASG the remaining equity interests in each of RDS and ASG (that were not initially contributed to SIC as part of the Contribution and Exchange), and (iii) after the preceding transactions, RDS and ASG became wholly-owned subsidiaries of SIC. SIC was wholly owned by Trive Capital and was inactive until the November 2017 Restructuring Transactions. Prior to the November 2017 Restructuring Transactions, SIC, RDS, and ASG were all under the common control of Trive Capital.
F-7
Select Interior Concepts, Inc. and Subsidiaries
Notes to Consolidated Financial Statements
1. Organization and Business Description (Continued)
Concurrent with the November 2017 Restructuring Transactions, SIC completed a private offering and private placement of 18,750,000 shares of its Class A common stock, par value $0.01 per share (“Class A Common Stock”), to new investors, at a public offering price of $12.00 per share for gross proceeds of approximately $225 million (prior to payment of discounts and fees to the initial purchaser and placement agent and offering expenses) (the “November 2017 Private Offering and Private Placement”). The net proceeds from the November 2017 Private Offering and Private Placement were primarily used by SIC to (i) repurchase 2,379,486 shares of Class B Common Stock from Trive Capital for approximately $26.6 million, (ii) purchase, from certain Rollover Stockholders, the remaining outstanding equity interests in each of RDS and ASG (that were not initially contributed to SIC as part of the Contribution and Exchange) for approximately $62.7 million, and (iii) repay outstanding indebtedness totaling $112.8 million to third-party lenders and pay $0.3 million of lending related fees. The remainder of the net proceeds was used by SIC for transaction expenses related to the November 2017 Private Offering and Private Placement, working capital and general corporate purposes.
In accordance with the terms of the November 2017 Private Offering and Private Placement, in December 2017, SIC completed an additional sale of 3,000,000 shares of Class A Common Stock to new investors at an offering price of $12.00 per share for total gross proceeds of approximately $36.0 million (prior to payment of discounts and fees to the initial purchaser and placement agent and offering expenses). These net proceeds were used by SIC to repurchase an additional 3,000,000 shares of Class B Common Stock from certain Rollover Stockholders.
The reorganization transactions were treated as a combination of entities under common control with assets and liabilities transferred at their carrying amounts in a manner similar to a pooling of interests. Accordingly, the 2017 consolidated historical results of SIC includes the results under the “as if pooling” method.
Transition to Public Company
On August 13, 2018, the SEC declared effective the Company’s Registration Statement on Form S-1, which contained a prospectus pursuant to which certain selling stockholders of the Company may offer and sell shares of Class A Common Stock. On August 16, 2018, the Company’s Class A Common Stock commenced trading on the Nasdaq Capital Market under the ticker symbol “SIC.”
2. Summary of Significant Accounting Policies
Basis of Presentation and Consolidation
The accompanying consolidated financial statements include the accounts of SIC, its wholly owned subsidiaries RDS and ASG, and their wholly owned subsidiaries, and are presented using the accrual basis of accounting in accordance with accounting principles generally accepted in the United States of America (“U.S. GAAP”). All significant intercompany accounts and transactions have been eliminated in combination. References to the “ASC” hereafter refer to the Accounting Standards Codification established by the Financial Accounting Standards Board (“FASB”) as the source of authoritative U.S. GAAP.
The November 2017 Restructuring Transactions resulting in the transfer of RDS and ASG to subsidiaries of SIC was determined to be a combination of interests between commonly controlled entities and, as such, the Company accounted for the transactions using “as if pooling” accounting. Accordingly, the consolidated and results of SIC includes the results of both RDS and ASG for all of 2017 under the “as if pooling” method. The assets and liabilities of RDS and ASG will also be reflected at their historical cost, as determined in accordance with the requirements of ASC 805 when consolidated into the accounts of SIC in a manner similar to a pooling of interests.
F-8
Select Interior Concepts, Inc. and Subsidiaries
Notes to Consolidated Financial Statements
2. Summary of Significant Accounting Policies (Continued)
Earnings (Loss) per Common Share
For the years ended December 31, 2019 and 2018, basic earnings per share for common stock is computed by dividing net income (loss) by the weighted average number of shares of common stock outstanding. For the years ended December 31, 2019 and 2018, common stock consists of only Class A Common Stock, since in August 2018, each then remaining share of Class B Common Stock was automatically converted into one share of Class A Common Stock, resulting in no shares of Class B Common Stock left outstanding. Diluted earnings per share for common stock is computed by dividing net income (loss) plus the dilutive effect of restricted stock-based awards using the treasury stock method.
For the period between the November 2017 Restructuring Transactions and the November 2017 Private Offering and Private Placement and December 31, 2017, the basic earnings per share for both Class A and Class B Common Stock is computed by dividing net income (loss) for the period subsequent to the November 2017 Restructuring Transactions and the November 2017 Private Offering and Private Placement by the weighted average number of shares of common stock outstanding during the period subsequent to the November 2017 Restructuring Transactions and the November 2017 Private Offering and Private Placement. Diluted earnings per share for both Class A and Class B Common Stock is computed by dividing net income for the period subsequent to the November 2017 Restructuring Transactions and the November 2017 Private Offering and Private Placement by the weighted average number of shares of common stock outstanding during the period subsequent to the November 2017 Restructuring Transactions and the November 2017 Private Offering and Private Placement, plus the dilutive effect of restricted stock-based awards using the treasury stock method. Income (loss) earned prior to the November 2017 Restructuring Transactions and the November 2017 Private Offering and Private Placement is attributable to the LLC members and, as such, is not reflected in earnings per share.
The following table sets forth the computation of basic and diluted loss per share for the years ended December 31, 2019 and 2018, and the period between the November 2017 Restructuring Transactions and the November 2017 Private Offering and Private Placement and December 31, 2017:
|
(in thousands, except share and per share data) |
|
Year Ended December 31, 2019 |
|
|
Year Ended December 31, 2018 |
|
|
Period Ended December 31, 2017 |
|
|||
|
Net income (loss) |
|
$ |
6,984 |
|
|
$ |
(2,475 |
) |
|
$ |
(5,689 |
) |
|
Weighted average shares of common stock outstanding: |
|
|
|
|
|
|
|
|
|
|
|
|
|
Basic common stock outstanding |
|
|
25,296,955 |
|
|
|
25,634,342 |
|
|
|
25,614,626 |
|
|
Dilutive common stock outstanding |
|
|
25,431,677 |
|
|
|
25,634,342 |
|
|
|
25,614,626 |
|
|
Earnings per share of common stock: |
|
|
|
|
|
|
|
|
|
|
|
|
|
Basic common stock outstanding |
|
$ |
0.28 |
|
|
$ |
(0.10 |
) |
|
$ |
(0.22 |
) |
|
Dilutive common stock outstanding |
|
$ |
0.27 |
|
|
$ |
(0.10 |
) |
|
$ |
(0.22 |
) |
All restricted stock awards outstanding totaling 825,976 at December 31, 2018, and 356,368 at December 31, 2017, were excluded from the computation of diluted earnings per share in 2018 and 2017 because the Company reported a net loss and the effect of inclusion would have been antidilutive.
Use of Estimates
The preparation of consolidated financial statements in accordance with U.S. GAAP requires management to make estimates and assumptions that affect the reported amounts of assets and liabilities and contingencies at the date of the consolidated financial statements and the reported revenues and expenses. Actual results may vary materially from the estimates that were used. The Company’s significant accounting estimates include the determination of allowances for doubtful accounts, inventory reserves, the lives and methods for recording depreciation and amortization on property and equipment, the fair value of reporting units and indefinite life intangible assets, deferred income taxes, revenue recognition, warranties, returns and the purchase price allocations used in the Company’s acquisitions.
F-9
Select Interior Concepts, Inc. and Subsidiaries
Notes to Consolidated Financial Statements
2. Summary of Significant Accounting Policies (Continued)
Restricted Cash
At December 31, 2018, the Company had restricted cash of $3.0 million. The restricted cash consisted of funds held in escrow related to the Greencraft acquisition. Upon release and payment of these funds in 2019, no amount of restricted cash is held as of December 31, 2019.
Fair Value Measurement
ASC 820-10 requires entities to disclose the fair value of financial instruments, both assets and liabilities recognized and not recognized on the balance sheet for which it is practicable to estimate fair value. ASC 820-10 defines the fair value of a financial instrument as the amount at which the instrument could be exchanged in a current transaction between willing parties.
The three levels of the fair value hierarchy are as follows:
Level 1—Valuations based on unadjusted quoted prices in active markets for identical assets or liabilities that the entity has the ability to access.
Level 2—Valuations based on quoted prices for similar assets or liabilities, quoted prices in markets that are not active, or other inputs that are observable or can be corroborated by observable data for substantially the full term of the assets or liabilities.
Level 3—Valuations based on inputs that are unobservable, supported by little or no market activity and that are significant to the fair value of the assets or liabilities.
The level of the fair value hierarchy in which the fair value measurement falls is determined by the lowest level input that is significant to the fair value measurement.
The Company records contingent consideration, or earn-outs, associated with certain acquisitions. These earn-outs are adjusted to fair value at each reporting period and any change to fair value based on a change in certain factors, such as the risk adjusted rate or estimates for the outcome of specified milestone goals, will result in an adjustment to the fair value of the liability. These adjustments are recorded to income/expense as a measurement period adjustment.
There is no earn-out liability recorded as of December 31, 2019 associated with the acquisition of Summit Stoneworks, LLC (“Summit”) in August 2018. The recorded fair value liability for the earn-out as of December 31, 2018 was $1.9 million. This liability was classified as a Level 3 fair value estimate at December 31, 2018 and is no longer a Level 3 fair value estimate as of December 31, 2019 as the underlying inputs are now known and the earn-out target criteria was not met. Adjustments reducing the fair value of the earn-out liability by $1.9 million were recorded within other (income) expense for the year ended December 31, 2019.
There is no earn-out liability recorded as of December 31, 2019 associated with the acquisition of T.A.C. Ceramic Tile Co, LLC (“TAC”) in December 2018. The recorded fair value liability for the earn-out as of December 31, 2018 was $2.3 million. This liability was classified as a Level 3 fair value estimate at December 31, 2018 and is no longer a Level 3 fair value estimate as of December 31, 2019 as the underlying inputs are now known and the earn-out target criteria was not met. Adjustments reducing the fair value of the earn-out liability by $2.3 million were recorded within other (income) expense for the year ended December 31, 2019.
The earn-out liability associated with the acquisition of Intown Design, Inc., Intown Granite of Charlotte, Inc., and Granitec, LLC, (collectively, “Intown”) in March 2019 is classified as Level 3 and is valued using an option pricing model. The allocated fair value of this liability was estimated at $2.0 million at acquisition. The fair value of this earn-out liability was reduced to zero as of December 31, 2019. The assumptions used in preparing the option pricing model include estimates for future earnings from Intown products and services, a volatility factor of 25%, and a risk adjusted rate of 12% at December 31, 2019. An adjustment decreasing the fair value of the earn-out liability by $2.0 million was recorded within other (income) expense for the year ended December 31, 2019.
F-10
Select Interior Concepts, Inc. and Subsidiaries
Notes to Consolidated Financial Statements
2. Summary of Significant Accounting Policies (Continued)
The earn-out liability associated with the acquisition of Greencraft Holdings, LLC (“Greencraft”) in December 2017 was paid to the former owners in May 2019 in the amount of $8.0 million. As of December 31, 2018, the fair value of this earn-out was recorded as $7.9 million.
At December 31, 2019 and December 31, 2018, the carrying value of the Company’s cash, accounts receivable, accounts payable, and short-term obligations approximate their respective fair values because of the short maturities of these instruments. The recorded values of the line of credit, term loans, and notes payable approximate their fair values, as interest rates approximate market rates. The Company recognizes transfers between levels at the end of the reporting period as if the transfers occurred on the last day of the reporting period. There were no transfers during 2019 or 2018, other than the Summit and TAC earn-out liabilities from Level 3 during 2019 and the Greencraft earn-out liability from Level 3 during 2018 due to the availability of observable and known inputs to calculate the fair value of the liabilities as of December 31, 2019 and 2018, respectively.
Accounts Receivable
Accounts receivable are recorded at net realizable value. The Company continually assesses the collectability of outstanding customer invoices; and if deemed necessary, maintains an allowance for estimated losses resulting from the non-collection of customer receivables. In estimating this allowance, the Company considers factors such as: historical collection experience, a customer’s current creditworthiness, customer concentrations, personal guarantees, credit insurance, age of the receivable balance both individually and in the aggregate and general economic conditions that may affect a customer’s ability to pay. The Company also has the ability to place liens against the significant amount of RDS customers in order to secure receivables. Actual customer collections could differ from the Company’s estimates. At December 31, 2019 and 2018, the Company’s allowance for doubtful accounts was $0.8 million and $0.5 million, respectively.
Inventories
Inventories consist of stone slabs, tile and sinks, and include the costs to acquire the inventories and bring them to their existing location and condition. Inventory also includes flooring, cabinets, doors and trim, glass, and countertops, which have not yet been installed, as well as labor and related costs for installations in process. Inventory is valued at the lower of cost (using the specific identification and first-in, first-out methods) or net realizable value.
Property and Equipment
Property and equipment are stated at cost, net of accumulated depreciation and amortization. The Company capitalizes internal-use software as property and equipment under ASC 350-40, Internal-Use Software. Depreciation and amortization are provided for on a straight-line basis over the estimated useful lives of the related assets as follows:
|
|
|
Range of estimated useful lives |
|
Machinery and equipment |
|
5 - 7 years |
|
Vehicles |
|
3 - 5 years |
|
Furniture and fixtures |
|
3 - 7 years |
|
Computer equipment |
|
3 - 5 years |
|
Leasehold improvements |
|
Shorter of 15 years or the remaining lease term |
F-11
Select Interior Concepts, Inc. and Subsidiaries
Notes to Consolidated Financial Statements
2. Summary of Significant Accounting Policies (Continued)
Intangible Assets
Intangible assets consist of customer relationships, trade names and non-compete agreements. The Company considers all its intangible assets to have definite lives and are being amortized on the straight-line method over the estimated useful lives of the respective assets or on an accelerated basis based on the expected cash flows generated by the existing customers as follows:
|
|
|
Range of estimated useful lives |
|
Weighted average useful life |
|
Customer relationships |
|
2 years – 15 years |
|
10 years |
|
Trade names |
|
3 years – 11 years |
|
8 years |
|
Non-compete agreements |
|
Life of agreement |
|
4 years |
Business Combinations
The Company records business combinations using the acquisition method of accounting. Under the acquisition method of accounting, identifiable assets acquired and liabilities assumed are recorded at their acquisition date fair values. The excess of the purchase price over the estimated fair value is recorded as goodwill. Changes in the estimated fair values of net assets recorded for acquisitions prior to the finalization of more detailed analysis, but not to exceed one year from the date of acquisition, will adjust the amount of the purchase price allocable to goodwill. Measurement period adjustments are reflected in the period in which they occur.
Impairment of Long-Lived Assets
The Company reviews the recoverability of its long-lived assets, such as property and equipment and intangible assets, whenever events or changes in circumstances occur that indicate the carrying value of the asset or asset group may not be recoverable, or at least annually. The assessment for possible impairment is based on the Company’s ability to recover the carrying value of the asset or asset group from the expected future undiscounted cash flows of the related operations. If the aggregate of these cash flows is less than the carrying value of such assets, an impairment loss is recognized for the difference between the estimated fair value and the carrying value. The measurement of impairment requires management to estimate future cash flows and the fair value of long-lived assets. There were no impairment losses on long-lived assets for the years ended December 31, 2019 and 2018.
Goodwill
Goodwill represents the excess of the cost of an acquired entity over the fair value of the acquired net assets. The Company accounts for goodwill in accordance with FASB ASC topic 350, Intangibles-Goodwill and Other Intangible Assets, which among other things, addresses financial accounting and reporting requirements for acquired goodwill and other intangible assets having indefinite useful lives. ASC topic 350 requires goodwill to be carried at cost, prohibits the amortization of goodwill and requires the Company to test goodwill for impairment at least annually. The Company tests for impairment of goodwill annually during the fourth quarter or more frequently if events or changes in circumstances indicate that the goodwill may be impaired. Events or changes in circumstances which could trigger an impairment review include a significant adverse change in legal factors or in the business climate, an adverse action or assessment by a regulator, unanticipated competition, a loss of key personnel, significant changes in the manner of the Company’s use of the acquired assets or the strategy for the Company’s overall business, significant negative industry or economic trends, or significant underperformance relative to expected historical or projected future results of operations. The Company identified RDS and ASG as reporting units and determined each reporting unit’s fair value substantially exceeded such reporting unit’s carrying value. There were no impairment charges related to goodwill for the years ended December 31, 2019 and 2018. (See Note 8).
F-12
Select Interior Concepts, Inc. and Subsidiaries
Notes to Consolidated Financial Statements
2. Summary of Significant Accounting Policies (Continued)
Debt Issuance Costs
Debt issuance costs related to a recognized debt liability are deferred and amortized over the related term of the debt as non-cash interest expense and are presented on the consolidated balance sheets as a direct deduction from the carrying amount of the related debt liability. Debt issuance costs are amortized using the effective interest method or on a straight-line basis when it approximates the effective interest method.
Sales Tax
The Company’s policy is to present taxes collected from customers and remitted to governmental authorities on a net basis. The Company records the amounts collected as a current liability and relieves such liability upon remittance to the taxing authority without impacting revenues or expenses.
Warranty Obligations
The Company offers supplier-specific product warranties to its customers. In estimating future warranty obligations, the Company considers various relevant factors, including its warranty policies and practices and those of its suppliers, the historical frequency of claims, the cost to replace products under warranty, and the amounts expected to be reimbursed by suppliers. On certain products, customer warranty claims are covered directly by the manufacturer of the product. Management estimates its warranty obligation at December 31, 2019 and 2018, to be minimal, and therefore, the Company has not recorded a significant provision for accrued warranty costs.
Operating Leases
The Company accounts for rent expense for its operating leases on a straight-line basis in accordance with authoritative guidance on accounting for leases. The Company leases its corporate, administrative, retail and manufacturing facilities over terms expiring between 2020 and 2029. The Company also leases certain office and warehouse equipment over terms expiring between 2020 and 2023. The term of the lease is considered its initial obligation period, which does not include option periods. The leases may have renewal clauses exercisable at the option of the Company and contain rent holidays and/or rent escalation clauses. The Company includes scheduled rent holidays and rent escalation clauses for the purposes of recognizing straight-line rent over the lease term.
Capital Leases
The Company finances the acquisition of certain vehicles and equipment with capital leases. The acquisition costs are recognized as property, plant and equipment (“PP&E”) on the consolidated balance sheets at fair value at the inception of the lease, or, if lower, at the present value of the minimum lease payments as determined at the inception of the lease. The acquisition costs are amortized over the useful life on the same basis as owned vehicles or, where shorter, the term of the capital lease. Amortization expense is recorded as accumulated amortization on the consolidated balance sheets. The capital lease liability owed to the lessor is included in the consolidated balance sheets as a capital lease obligation. Lease payments are apportioned between interest expense and a reduction of the lease obligation so as to achieve a constant rate of interest on the remaining balance of the liability.
Revenue Recognition
The Company’s revenue derived from the sale of imported granite, marble, and related items, primarily in our ASG operating segment, is recognized at a point in time when control over a product is transferred to a customer. This transfer occurs primarily when goods are picked up by a customer at the branch or when goods are delivered to a customer location.
The Company’s contracts with its home builder customers within our RDS operating segment are usually short-term in nature and will generally range in length from several days to several weeks. The Company’s contracts related to multi-family and commercial projects are generally long-term in nature. We recognize revenue from both short-term and long-term contracts for each distinct performance obligation identified over time on a percentage-of-completion basis of accounting, utilizing the output method as a measure of progress, as we believe this represents the best measure of when goods and services are transferred to the customer.
F-13
Select Interior Concepts, Inc. and Subsidiaries
Notes to Consolidated Financial Statements
2. Summary of Significant Accounting Policies (Continued)
Revenue is measured at the transaction price, which is based on the amount of consideration the Company expects to receive in exchange for transferring the promised goods or services to the customer. The transaction price will include estimates of variable consideration, such as any returns and sales incentives. Applicable customer sales taxes, when remitted, are recorded as a liability and excluded from revenue on a net basis.
In the fourth quarter of 2019, the Company adopted ASU 2014-09, the new accounting standard under ASC Topic 606, using the modified retrospective method as of January 1, 2019. (See Note 3)
Cost of Revenue
RDS’ cost of revenue is comprised of the costs of materials and labor to purchase and install products for the Company’s customers.
ASG’s cost of revenue primarily consists of purchased materials, sourcing fees for inventory procurement, and freight costs.
RDS and ASG also include payroll taxes and benefits, workers’ compensation insurance, vehicle-related expenses and overhead costs, including rent, depreciation, utilities, property taxes, repairs and maintenance costs in the cost of revenue.
The Company’s cost of revenue is reduced by rebates provided by suppliers in the period the rebate is earned.
Shipping and Handling Charges
Fees charged to customers for shipping and handling of product are included in revenues. The costs for shipping and handling of product are recorded as a component of cost of revenue. Additionally, we consider shipping and handling costs charged to a customer as a fulfillment cost rather than a promised service and expense as incurred.
Advertising
The Company expenses advertising costs as incurred. Advertising expense for the years ended December 31, 2019, 2018, and 2017 totaled $1.2 million, $2.5 million and $1.4 million, respectively.
Equity based compensation
The Company accounts for equity based awards by measuring the awards at the date of grant and recognizing the grant-date fair value as an expense using either straight-line or accelerated attribution, depending on the specific terms of the award agreements over the requisite service or performance period, which is usually equivalent to the vesting period. Forfeitures are recognized as they occur. (See Note 12)
Income Taxes
The provision for income taxes is accounted for under the asset and liability method prescribed by ASC 740 (Topic 740, Income Taxes). Deferred tax assets and liabilities are recognized for the future tax consequences attributable to differences between the financial statement carrying amounts of existing assets and liabilities and their respective tax bases, operating losses and tax credit carryforwards. Deferred tax assets and liabilities are measured using the enacted tax rates expected to apply to taxable income in the years in which those temporary differences are expected to be recovered or settled. The effect on deferred tax assets and liabilities of a change in tax rates is recognized in income in the period the tax rate changes are enacted.
The Company recognizes the tax benefit from an uncertain tax position only if it is more likely than not the tax position will be sustained on examination by the taxing authorities, based on the technical merits of the position. The tax benefits recognized in the financial statements from such positions are then measured based on the largest benefit that has a greater than 50% likelihood of being realized upon settlement.
F-14
Select Interior Concepts, Inc. and Subsidiaries
Notes to Consolidated Financial Statements
2. Summary of Significant Accounting Policies (Continued)
On December 22, 2017, the Tax Cuts and Jobs Act (the “Tax Act”) was adopted into law. The Tax Act makes broad and complex changes to the Internal Revenue Code of 1986, including, but not limited to, (i) reducing the U.S. federal corporate tax rate from 35% to 21%; (ii) eliminating the corporate alternative minimum tax (“AMT”) and changing how existing AMT credits are realized; (iii) creating a new limitation on deductible interest expense; and (iv) changing rules related to uses and limitation of net operating loss carryforwards created in tax years beginning after December 31, 2017.
The Company’s policy is to recognize interest and/or penalties related to all tax positions as income tax expense. To the extent that accrued interest and penalties do not ultimately become payable, amounts accrued will be reduced and reflected as a reduction of the overall income tax provision in the period that such determination is made. The Company has recognized $0.4 and $0.5 million in combined interest and penalties related to uncertain tax positions for the year ended December 31, 2019 and 2018, respectively.
Segment Reporting
In accordance with ASC 280-10-50-1, an operating segment is a component of an entity that has all the following characteristics:
|
|
a. |
It engages in business activities from which it may earn revenues and incur expenses. |
|
|
b. |
Its discrete financial information is available. |
|
|
c. |
Its operating results are regularly reviewed by the public entity’s chief operating decision maker to make decisions about resources to be allocated to the segment and assess its performance. |
The Company has identified two operating segments that meet all three of the criteria, RDS and ASG. Each of these operating segments provides products and services that generate revenue and incur expenses as they engage in business activities and maintains discrete financial information. Additionally, the Company’s chief operating decision maker, the Chief Executive Officer, reviews financial performance, approves budgets and allocates resources at the RDS and ASG operating segment level.
Recently Issued and Adopted Accounting Pronouncements
The Company is an “emerging growth company,” as defined in Section 2(a) of the Securities Act, as modified by the Jumpstart Our Business Startups Act of 2012 (the “JOBS Act”). The JOBS Act permits emerging growth companies to take advantage of an extended transition period to comply with new or revised accounting standards applicable to public companies. The Company has elected to use the extended transition period for complying with new or revised accounting standards under Section 107 of the JOBS Act. This election allows the Company to delay the adoption of new or revised accounting standards that have different effective dates for public and private companies until those standards apply to private companies.
In May 2014, the FASB issued Accounting Standards Update (“ASU”) 2014-09, Revenue from Contracts with Customers (Topic 606). The ASU establishes a comprehensive revenue recognition standard for virtually all industries in U.S. GAAP, including those that previously followed industry-specific guidance, such as the real estate, construction, and software industries. The ASU core principal is to recognize revenue to depict the transfer of goods or services to customers in an amount that reflects the consideration to which the entity expects to be entitled in exchange for those goods or services. During 2014-2016, the FASB issued various amendments to this topic and the amendments clarified certain positions and extended the implementation date until annual periods beginning after December 15, 2018. During the quarter ended December 31, 2019, the Company adopted this guidance on a modified retrospective basis. For contracts which were not completed as of January 1, 2019, revenue related to our short-term contracts with homebuilder customers, primarily in our RDS operating segment, are now recognized over time based on the extent of progress towards completion of the individual performance obligations, instead of under the completed contract method, because of continuous transfer of control to the customer. There was no material impact on our revenue recognition for our multi-family contracts that are currently recognized under the existing percentage-of-completion method of accounting, due to the comparable methodology of revenue recognition under the updated guidance. There was also no material impact from adoption related to our sales of imported granite, marble, and related items of our ASG operating segment, as the Company has concluded that it has substantially similar performance obligations and recognition timing under the amended guidance. We recognized the cumulative effect of initially applying the standard as an adjustment to the opening balance of retained earnings on January 1, 2019 of approximately $1.2 million. (See Note 3).
F-15
Select Interior Concepts, Inc. and Subsidiaries
Notes to Consolidated Financial Statements
2. Summary of Significant Accounting Policies (Continued)
In August 2016, the FASB issued ASU 2016–15, Statement of Cash Flows (Topic 230): Classification of Certain Cash Receipts and Cash Payments (a consensus of the Emerging Issues Task Force), which provides specific guidance on eight cash flow classification and presentation issues arising from certain cash receipts and cash payments that currently result in diverse practices. The amendments provide guidance in the presentation and classification of certain cash receipts and cash payments in the statement of cash flows including debt prepayment or debt extinguishment costs, settlement of zero-coupon debt instruments, contingent consideration payments made after a business combination, proceeds from the settlement of insurance claims, proceeds from the settlement of corporate-owned life insurance policies and distributions received from equity method investees. As an emerging growth company utilizing the extended transition period for new accounting pronouncements, ASU 2016-15 is effective for annual reporting periods beginning after December 15, 2018, and interim periods within fiscal years beginning after December 15, 2019. The amendments in this ASU are applied using a retrospective approach. The adoption did not have a significant effect on the Company’s consolidated financial position or results of operations.
In November 2016, the FASB issued ASU No. 2016-18, Restricted Cash. ASU 2016-18 is intended to reduce the diversity in practice around how restricted cash is classified within the statement of cash flows. ASU 2016-18 is effective for annual reporting periods beginning after December 15, 2017, including interim periods within that reporting period, with early adoption permitted. The Company has evaluated the impact of ASU 2016-18, and, adopted the new standard, and the Company will not present the release of restricted cash as an investing activity cash inflow. Instead, restricted cash balances have been and will be included in the beginning and ending cash, cash equivalents and restricted cash balances in the statement of cash flows.
In January 2017, the FASB issued ASU 2017-01, Business Combination (Topic 805)—Clarifying the Definition of a Business. This ASU provides additional guidance in regards to evaluating whether a transaction should be treated as an asset acquisition (or disposal) or a business combination. Particularly, the amendments to this ASU provide that when substantially all of the fair value of the gross assets acquired (or disposed of) is concentrated in a single identifiable asset or a group of similar identifiable assets, the set is not a business. This clarification reduces the number of transactions that needs further evaluation for business combination. The Company adopted this standard on January 1, 2019 in evaluating acquisitions.
In February 2018, the FASB issued ASU 2018-02, Reclassification of Certain Tax Effects from Accumulated Other Comprehensive Income, which permits reclassification of the income tax effects of the Tax Act on other accumulated comprehensive income (“AOCI”) to retained earnings. This guidance may be adopted retrospectively to each period (or periods) in which the income tax effects of the Tax Act related to items remaining in AOCI are recognized, or at the beginning of the period of adoption. The guidance became effective for annual periods beginning after December 15, 2018, including interim periods within those annual periods, with early adoption permitted. The adoption of this standard did not have a material impact on the Company’s consolidated financial statements and related disclosures.
Accounting Pronouncements Issued but Not Yet Adopted
In February 2016, the FASB issued ASU 2016-02, Leases (Topic 842), which requires the recognition of lease assets and lease liabilities by lessees for those leases classified as operating leases under previous standards. For leases with a term of 12 months or less, a lessee is permitted to make an accounting policy election by class of asset not to recognize lease assets and lease liabilities. In November 2019, the FASB issued ASU 2019-10, Financial Instruments — Credit Losses (Topic 326), Derivatives and Hedging (Topic 815), and Leases (Topic 842): Effective Dates which delays the effective date of ASU 2016-02 until fiscal years beginning after December 15, 2020, and interim periods within fiscal years beginning after December 15, 2021. The Company is currently evaluating the impact of the provisions of ASU 2016-02 on the presentation of its consolidated financial statements and related disclosures.
F-16
Select Interior Concepts, Inc. and Subsidiaries
Notes to Consolidated Financial Statements
2. Summary of Significant Accounting Policies (Continued)
In June 2016, the FASB issued ASU 2016-13, “Measurement of Credit Losses on Financial Instruments,” (ASU 2016-03) which amends ASC 326 “Financial Instruments—Credit Losses.” Subsequent to the issuance of ASU 2016-13, ASC 326 was amended by various updates that amend and clarify the impact and implementation of the aforementioned update. The new guidance introduces the current expected credit loss (CECL) model, which will require an entity to record an allowance for credit losses for certain financial instruments and financial assets, including trade receivables, based on expected losses rather than incurred losses. Under this update, on initial recognition and at each reporting period, an entity will be required to recognize an allowance that reflects the entity’s current estimate of credit losses expected to be incurred over the life of the financial instrument. In November 2019, the FASB issued ASU 2019-10, Financial Instruments — Credit Losses (Topic 326), Derivatives and Hedging (Topic 815), and Leases (Topic 842): Effective Dates which delays the effective date of ASU 2016-13 until fiscal years beginning after December 15, 2021. The Company is currently evaluating the impact of the provisions of ASU 2016-13 on the presentation of its consolidated financial statements and related disclosures.
In January 2017, the FASB issued ASU No. 2017-04, Intangibles — Goodwill and Other (Topic 350): Simplifying the Test for Goodwill Impairment, which simplifies the goodwill impairment test by eliminating the step 2 requirement to determine the fair value of its assets and liabilities at the impairment testing date. ASU 2017-04 is effective for annual periods beginning after December 15, 2021. The Company is currently evaluating the effect of this ASU on the Company’s consolidated financial statements and related disclosures.
In August 2018, the FASB issued ASU 2018-13, Fair Value Measurement (Topic 820) - Disclosure Framework (ASU 2018-13). The updated guidance improves the disclosure requirements for fair value measurements. The updated guidance is effective for fiscal years, and interim periods within those fiscal years, beginning after December 15, 2019. Early adoption is permitted for any removed or modified disclosures. The Company is currently assessing the impact of adopting the updated provisions.
Also, in August 2018, the FASB issued ASU 2018-15, Intangibles—Goodwill and Other—Internal-Use Software (Subtopic 350-40) No. 2018-15 Customer’s Accounting for Implementation Costs Incurred in a Cloud Computing Arrangement That Is a Service Contract (ASU 2018-15). ASU 2018-15 provides additional guidance on the accounting for costs of implementation activities performed in a cloud computing arrangement that is a service contract. The amendments in ASU 2018-15 align the requirements for capitalizing implementation costs incurred in a hosting arrangement that is a service contract with the requirements for capitalizing implementation costs incurred to develop or obtain internal-use software (and hosting arrangements that include an internal use software license). Costs for implementation activities in the application development stage are capitalized depending on the nature of the costs, while costs incurred during the preliminary project and post implementation stages are expensed as the activities are performed. ASU 2018-15 is effective for fiscal years beginning after December 15, 2020. Early adoption of the amendments in ASU 2018-15 is permitted, including adoption in any interim period, for all entities. The amendments in ASU 2018-15 should be applied either retrospectively or prospectively to all implementation costs incurred after the date of adoption. The Company is currently assessing the effect this guidance may have on its consolidated financial statements.
In December 2019, the FASB issued ASU 2019-12, “Simplifying the Accounting for Income Taxes” which amends ASC 740 “Income Taxes” (ASC 740). This update is intended to simplify accounting for income taxes by removing certain exceptions to the general principles in ASC 740 and amending existing guidance to improve consistent application of ASC 740. This update is effective for fiscal years beginning after December 15, 2021. The guidance in this update has various elements, some of which are applied on a prospective basis and others on a retrospective basis with earlier application permitted. The Company is currently evaluating the effect of this ASU on the Company’s consolidated financial statements and related disclosures.
F-17
Select Interior Concepts, Inc. and Subsidiaries
Notes to Consolidated Financial Statements
In the fourth quarter of 2019, the Company adopted ASU 2014-09, the new accounting standard under ASC Topic 606, using the modified retrospective method as of January 1, 2019. Results for reporting periods beginning after January 1, 2019 are presented under Topic 606, while prior period amounts are not adjusted and continue to be reported in accordance with the previous standard, Topic 605.
The Company recorded a $1.2 million cumulative effect adjustment as an increase to opening retained earnings due to the impact of adopting Topic 606, with the impact primarily related to the change in accounting for certain of the RDS short-term home builder contracts that were previously accounted for on a completed contract basis, whereas, under ASC 606, the Company now recognizes revenue associated with these contracts for the individual performance obligations over time as the service is performed and the transfer of control occurs. There was no impact upon adoption on long-term multi-family or commercial contracts that were already recognized under the percentage-of-completion method of accounting under Topic 605. Additionally, there was no material impact related to the sales of imported granite, marble, and related items of the ASG operating segment, due to similar performance obligations and recognition timing under the amended guidance.
The cumulative effect of the changes made to the Consolidated Balance Sheet as of January 1, 2019 for the adoption of Topic 606 was as follows (in thousands):
|
Consolidated Balance Sheet |
|
Balance at December 31, 2018 |
|
|
Adjustments due to 606 Adoption |
|
|
Balance at January 1, 2019 |
|
|||
|
Assets |
|
|
|
|
|
|
|
|
|
|
|
|
|
Prepaid expenses and other current assets |
|
$ |
2,809 |
|
|
$ |
5,261 |
|
|
$ |
8,070 |
|
|
Deferred tax assets, net |
|
|
9,355 |
|
|
|
(409 |
) |
|
|
8,946 |
|
|
Inventory |
|
|
108,270 |
|
|
|
(3,455 |
) |
|
|
104,815 |
|
|
|
|
|
|
|
|
|
|
|
|
|
|
|
|
Liabilities |
|
|
|
|
|
|
|
|
|
|
|
|
|
Accrued expenses and other current liabilities |
|
$ |
27,620 |
|
|
$ |
198 |
|
|
$ |
27,818 |
|
|
|
|
|
|
|
|
|
|
|
|
|
|
|
|
Equity |
|
|
|
|
|
|
|
|
|
|
|
|
|
Accumulated deficit |
|
$ |
(8,164 |
) |
|
$ |
1,199 |
|
|
$ |
(6,965 |
) |
F-18
Select Interior Concepts, Inc. and Subsidiaries
Notes to Consolidated Financial Statements
Impact of Topic 606 Revenue Recognition Standard on 2019 Financial Statement Line Items
In accordance with the new revenue standard requirements, the disclosure of the impact of adoption on the Company’s Consolidated Statement of Operations and Consolidated Balance Sheet was as follows (in thousands):
|
|
|
For the year ended December 31, 2019 |
|
|||||||||
|
Consolidated Statement of Operations |
|
As Reported |
|
|
Balances without Adoption |
|
|
Impact of Adoption |
|
|||
|
Revenue, net |
|
$ |
610,373 |
|
|
$ |
609,899 |
|
|
$ |
474 |
|
|
Cost of revenue |
|
|
446,299 |
|
|
|
445,890 |
|
|
|
409 |
|
|
Selling, general, and administrative expenses |
|
|
144,816 |
|
|
|
144,832 |
|
|
|
(16 |
) |
|
Provision for income taxes |
|
|
1,521 |
|
|
|
1,500 |
|
|
|
21 |
|
|
Net income |
|
|
6,984 |
|
|
|
6,924 |
|
|
|
60 |
|
|
|
|
As of December 31, 2019 |
|
|||||||||
|
Consolidated Balance Sheet |
|
As Reported |
|
|
Balances without Adoption |
|
|
Impact of Adoption |
|
|||
|
Assets |
|
|
|
|
|
|
|
|
|
|
|
|
|
Prepaid expenses and other current assets |
|
$ |
11,083 |
|
|
$ |
5,348 |
|
|
$ |
5,735 |
|
|
Income taxes receivable |
|
|
2,184 |
|
|
|
1,561 |
|
|
|
623 |
|
|
Inventory |
|
|
104,741 |
|
|
|
108,605 |
|
|
|
(3,864 |
) |
|
Deferred tax assets, net |
|
|
10,550 |
|
|
|
11,603 |
|
|
|
(1,053 |
) |
|
|
|
|
|
|
|
|
|
|
|
|
|
|
|
Liabilities |
|
|
|
|
|
|
|
|
|
|
|
|
|
Accrued expenses and other current liabilities |
|
$ |
16,661 |
|
|
$ |
16,479 |
|
|
$ |
182 |
|
|
|
|
|
|
|
|
|
|
|
|
|
|
|
|
Equity |
|
|
|
|
|
|
|
|
|
|
|
|
|
Retained earnings (accumulated deficit) |
|
$ |
19 |
|
|
$ |
(1,240 |
) |
|
$ |
1,259 |
|
Contract Balances
The timing of revenue recognition, billings, and cash collections results in billed accounts receivable, revenue in excess of billings, customer deposits, and billings in excess of revenue recognized in the Company’s Consolidated Balance Sheets.
Contract assets
The Company’s contract assets consist of unbilled amounts typically resulting from sales under contracts when the revenue recognized exceeds the amount billed to the customer, generally in the RDS operating segment revenues derived from homebuilders and commercial and multifamily projects. Contract assets are recorded in other current assets in the Company’s Consolidated Balance Sheets. The Company had contract assets of $5.7 million as of December 31, 2019. For comparative purposes, the contract assets as of January 1, 2019 that reflect the adoption of ASC 606 are $5.3 million. The Company’s contract assets generally become unconditional and are reclassified to receivables in the quarter subsequent to each balance sheet date.
Contract liabilities
The Company records contract liabilities when it receives payment prior to fulfilling a performance obligation or has billings in excess of revenue recognized. Contract liabilities related to revenues are recorded in customer deposits in the Company’s Consolidated Balance Sheets. The Company had total contract liabilities of $8.6 million and $9.9 million as of December 31, 2019 and 2018, respectively. Contract liabilities are normally recognized to net sales within three to six months subsequent to each balance sheet date.
F-19
Select Interior Concepts, Inc. and Subsidiaries
Notes to Consolidated Financial Statements
Remaining Performance Obligations
Remaining performance obligations related to ASC 606 represent the aggregate transaction price allocated to performance obligations with an original contract term greater than one year which are fully or partially unsatisfied at the end of the period, and relate primarily to multi-family or commercial revenue. For the years ended December 31, 2019 and 2018, multi-family and commercial projects accounted for approximately 3% and 2% of the Company’s combined revenues, respectively. As of December 31, 2019, the aggregate amount of the transaction price allocated to remaining uncompleted contracts was $4.5 million. The Company expects to satisfy remaining performance obligations and recognize revenue on substantially all of these uncompleted contracts over the next 12 months. The Company does not disclose the value of unsatisfied performance obligations for contracts with an original expected length of one year or less.
Revenue from contracts with customers is disaggregated differently for each reporting segment as this is how management evaluates the nature, amount, timing and uncertainty of revenue and cash flows as affected by economic factors. RDS operating segment revenues are disaggregated by geographic area within the United States. ASG operating segment revenues are disaggregated by product category.
The following table presents net revenue for the RDS operating segment disaggregated by geographical area for the year ended December 31, 2019:
|
RDS |
|
|
|
|
|
|
|
|
|
(in thousands) |
|
2019 |
|
|
% |
|
||
|
East |
|
$ |
93,274 |
|
|
|
25 |
% |
|
Central |
|
|
17,100 |
|
|
|
5 |
% |
|
West |
|
|
258,200 |
|
|
|
70 |
% |
|
|
|
$ |
368,574 |
|
|
|
100 |
% |
The East consists of Virginia, Maryland, North Carolina and Georgia; the Central consists of Texas, and the West consists of California, Nevada and Arizona.
The following table presents net revenue for the ASG operating segment disaggregated by product category for the year ended December 31, 2019:
|
ASG |
|
|
|
|
|
|
|
|
|
(in thousands) |
|
2019 |
|
|
% |
|
||
|
Quartz |
|
$ |
138,500 |
|
|
|
57 |
% |
|
Stone |
|
|
75,511 |
|
|
|
31 |
% |
|
Tile |
|
|
20,211 |
|
|
|
8 |
% |
|
Other |
|
|
10,567 |
|
|
|
4 |
% |
|
|
|
$ |
244,789 |
|
|
|
100 |
% |
4. Concentrations, Risks and Uncertainties
The Company maintains cash balances primarily at one commercial bank per legal entity. The accounts are insured by the Federal Deposit Insurance Corporation up to $250,000. The amounts held in financial institutions periodically exceed the federally insured limit. Management believes that the financial institutions are financially sound and the risk of loss is minimal.
Credit is extended for some customers and is based on financial condition, and generally, collateral is not required. Credit losses are provided for in the consolidated financial statements and consistently have been within management’s expectations.
For the years ended December 31, 2018 and 2017, the Company recognized revenue from one customer which accounted for 11.4% and 12.6% of total revenue, respectively. The Company did not have any one customer which accounted for more than 10% of total revenues during the year ended December 31, 2019. There were no customers which accounted for 10% or more of total accounts receivable, as of December 31, 2019 and 2018.
F-20
Select Interior Concepts, Inc. and Subsidiaries
Notes to Consolidated Financial Statements
Intown Acquisition
On March 1, 2019, RDS acquired the assets of Intown Design, Inc., Intown Granite of Charlotte, Inc., and Granitec, LLC, (collectively, “Intown”), an installer of residential and light commercial countertops and cabinets, for total cash consideration of $10.7 million at closing and an additional $0.8 million of purchase price adjustments that were funded in June 2019. The purchase agreement also provides for potential earn-out consideration to the former shareholders of Intown in connection with the achievement of certain 2019 and 2020 financial milestones. The final earn-out payment has no maximum limit, but if certain targets are not met, there may be no earn-out payment. The contingent earn-out consideration had an estimated purchase price fair value of $2.0 million as of March 31, 2019. As of December 31, 2019, the fair value of the earn-out was reduced to zero. This adjustment of $2.0 million was recorded within other (income) expense as of December 31, 2019.
The upfront cash paid for the Intown acquisition was financed with additional borrowings from the Company’s third-party financing agreement described in Note 10. The Intown acquisition was accounted for under the acquisition method of accounting, and the assets acquired and liabilities assumed, including identifiable intangible assets, were recorded based on their respective fair values as of the acquisition date. The total purchase price consisted of the following:
|
(in thousands) |
|
Amount |
|
|
|
Cash consideration |
|
$ |
11,537 |
|
|
Fair value of earn-out |
|
|
2,010 |
|
|
|
|
$ |
13,547 |
|
RDS acquired Intown to further diversify RDS’ geographic mix and channel strength. The goodwill recorded reflects the strategic value of the acquisition beyond the net value of its assets acquired less liabilities assumed. Goodwill of $0.1 million is deductible for tax purposes.
The Company incurred approximately $0.4 million in direct acquisition costs, all of which were expensed as incurred, and are included in general and administrative expenses in the consolidated statements of operations. The Company has performed a valuation of the acquired assets and assumed liabilities of Intown. Using the total consideration for the acquisition, the Company has estimated the allocations to such assets and liabilities. The following table summarizes the allocation of the purchase price as of the transaction’s closing date.
|
(in thousands) |
|
Amount |
|
|
|
Accounts receivable |
|
$ |
1,392 |
|
|
Inventory |
|
|
1,155 |
|
|
Property and equipment |
|
|
1,092 |
|
|
Goodwill |
|
|
4,698 |
|
|
Other intangible assets |
|
|
5,310 |
|
|
Total assets acquired |
|
$ |
13,647 |
|
|
Total liabilities |
|
|
100 |
|
|
Total consideration |
|
$ |
13,547 |
|
An adjustment of approximately $0.8 million was recorded in the fourth quarter of 2019 to reduce the fair value of inventory and to increase the value of goodwill. From the date of acquisition to December 31, 2019, Intown generated revenue of $17.8 million and net income of $2.2 million, which are included in the Company’s Condensed consolidated statements of operations.
Pro Forma Results
The following unaudited pro forma information for the year ended December 31, 2019 and 2018 has been prepared to give effect to the acquisition of Intown as if the acquisition had occurred on January 1, 2018. The pro forma information takes into account the preliminary purchase price allocation. The final allocation could differ materially from the preliminary allocation used in the pro forma adjustments. This pro forma information does not purport to represent what the actual results of operations of the Company would have been had the Intown acquisition occurred on such date, nor does it purport to predict the results of operations for future periods.
F-21
Select Interior Concepts, Inc. and Subsidiaries
Notes to Consolidated Financial Statements
|
|
|
Year Ended December 31, |
|
|||||
|
|
|
2019 |
|
|
2018 |
|
||
|
(in thousands) |
|
(unaudited) |
|
|||||
|
Pro Forma: |
|
|
|
|
|
|
|
|
|
Total revenue |
|
$ |
613,225 |
|
|
$ |
510,465 |
|
|
Net income (loss) |
|
$ |
6,787 |
|
|
$ |
(1,736 |
) |
Our pro forma assumptions are as follows:
|
|
• |
Revenues and costs of sales were based on actual results for the years ended December 31, 2019 and 2018. |
|
|
• |
General and administrative expenses were based on actual results adjusted by $0.1 million and $0.7 million for the years ended December 31, 2019 and 2018, respectively, for the impact of the amortization expense of the intangible assets acquired with the acquisition. |
|
|
• |
Actual interest expense was adjusted by $0.2 million and $1.1 million for the years ended December 31, 2019 and 2018, respectively, for the imputed interest on the acquired debt issued to fund the acquisition. |
|
|
• |
Income taxes were adjusted to impute the Company’s corporate rate during the period on the pro forma income before taxes. |
Bedrock Acquisition
On January 31, 2018, ASG acquired the assets of a slab and tile distributor, Elegant Home Design, LLC (“Bedrock”), for total consideration of $12.5 million with cash consideration of $11.5 million and $1.0 million accrued liability recorded as security for and source of payment of sellers’ obligations that occur within one year subsequent to the acquisition. The outstanding balance remaining of $1.0 million was paid in cash to the sellers in 2019. In addition to the consideration paid for Bedrock, the Company agreed to pay up to an additional $3.0 million to be allocated among three individuals, subject to Bedrock meeting certain financial conditions defined in the purchase agreement and such individuals maintaining continuous employment with the Company through January 31, 2019. These financial conditions were not met and accordingly, no payout was made to these individuals. The Company did not record any compensation expense associated with this provision in 2019 or 2018.
The Bedrock acquisition was financed with $6.25 million of borrowing from the Company’s term loan described in Note 10 and the remainder from ASG’s line of credit described in Note 9. The Bedrock acquisition was accounted for under the acquisition method of accounting, and the assets acquired and liabilities assumed, including identifiable intangible assets, were recorded based on their respective estimated fair values as of the acquisition date.
ASG acquired Bedrock to further expand its distribution presence in the Midwest, and to gain access to new geographies, supply chains, products, and distribution rights. The goodwill recorded reflects the strategic value of the acquisition beyond the net value of its assets acquired less liability assumed. The goodwill is deductible for tax purposes.
The Company incurred approximately $0.1 million in direct acquisition costs, all of which were expensed as incurred, and are included in general and administrative expenses in the consolidated statements of operations. The Company has performed a valuation of the acquired assets and assumed liabilities of Bedrock. The following table summarizes the allocation of the purchase price as of the transaction’s closing date:
F-22
Select Interior Concepts, Inc. and Subsidiaries
Notes to Consolidated Financial Statements
|
(in thousands) |
|
Amount |
|
|
|
Accounts receivable |
|
$ |
2,543 |
|
|
Inventory |
|
|
13,425 |
|
|
Other current assets |
|
|
163 |
|
|
Property and equipment |
|
|
374 |
|
|
Goodwill |
|
|
381 |
|
|
Other intangible assets |
|
|
1,505 |
|
|
Other assets |
|
|
60 |
|
|
Total assets acquired |
|
$ |
18,451 |
|
|
Total liabilities |
|
|
5,959 |
|
|
Total consideration |
|
$ |
12,492 |
|
From the date of the Bedrock acquisition to December 31, 2018, Bedrock generated revenue of $27.7 million and net income of $1.9 million, which are included in the Company’s consolidated statements of operations.
Pro Forma Results
The following unaudited pro forma information for the years ended December 31, 2018 and 2017 has been prepared to give effect to the acquisition of Bedrock as if the acquisition had occurred on January 1, 2017. The pro forma information takes into account the purchase price allocation. This pro forma information does not purport to represent what the actual results of operations of the Company would have been had the Bedrock acquisition occurred on such date, nor does it purport to predict the results of operations for future periods.
|
|
|
Year Ended December 31, |
|
|||||
|
|
|
2018 |
|
|
2017 |
|
||
|
(in thousands) |
|
(unaudited) |
|
|||||
|
Pro Forma: |
|
|
|
|
|
|
|
|
|
Total revenue |
|
$ |
491,984 |
|
|
$ |
381,231 |
|
|
Net (loss) |
|
$ |
(2,445 |
) |
|
$ |
(10,568 |
) |
Pro forma assumptions are as follows:
|
|
• |
Revenues and costs of sales were based on actual results for the years ended December 31, 2018 and 2017. |
|
|
• |
Selling, general and administrative expenses were based on actual results adjusted by $0.02 million and $0.3 million for the years ended December 31, 2018 and 2017, respectively, for the impact of the amortization expense of the intangible assets acquired with the acquisition. |
|
|
• |
Actual interest expense was adjusted by $0.05 million and $0.7 million for the years ended December 31, 2018 and 2017, respectively, for the imputed interest on the acquired debt issued to fund the acquisition. |
|
|
• |
Income taxes were adjusted to impute the Company’s corporate effective rate during the period on the pro forma income before taxes. |
NSI Acquisition
On March 19, 2018, ASG acquired the assets of NSI, LLC, a Maryland limited liability company (“NSI”), for approximately $0.3 million in cash. The NSI acquisition and related transaction costs were financed by ASG’s line of credit described in Note 9. The NSI acquisition was accounted for under the acquisition method of accounting, and the assets acquired and liabilities assumed, including identifiable intangible assets, were recorded based on their respective estimated fair values as of the acquisition date.
F-23
Select Interior Concepts, Inc. and Subsidiaries
Notes to Consolidated Financial Statements
The Company performed a valuation of the acquired assets and assumed liabilities of NSI. The goodwill is deductible for tax purposes. The following table summarizes the estimated allocation of the preliminary purchase price as of the transaction’s closing date:
|
(in thousands) |
|
Amount |
|
|
|
Accounts receivable |
|
$ |
251 |
|
|
Inventory |
|
|
689 |
|
|
Goodwill |
|
|
390 |
|
|
Total assets acquired |
|
$ |
1,330 |
|
|
Total liabilities |
|
|
1,040 |
|
|
Total consideration |
|
$ |
290 |
|
From the date of the NSI acquisition to December 31, 2018, revenue and net income generated by NSI was not significant. Pro forma revenues and net income for the years ended December 31, 2018 and 2017, respectively, were not significant. There were no significant direct acquisition costs associated with the NSI acquisition.
Tuscany Acquisition
On August 22, 2018, ASG acquired the assets of The Tuscany Collection, LLC (“Tuscany”), a distributor of natural stone, quartz and tile in Las Vegas, Nevada, for approximately $4.2 million in cash. The Tuscany acquisition and related transaction costs were financed by the Company’s line of credit described in Note 9. The Tuscany acquisition was accounted for under the acquisition method of accounting and the assets acquired and liabilities assumed, including identifiable intangible assets, were recorded based on their respective estimated fair values as of the acquisition date.
The Company incurred approximately $0.1 million in direct acquisition costs, all of which were expensed as incurred, and are included in general and administrative expenses in the consolidated statements of operations. The Company has performed a valuation of the acquired assets and assumed liabilities of Tuscany. The following table summarizes the estimated allocation of the purchase price as of the transaction’s closing date:
|
(in thousands) |
|
Amount |
|
|
|
Accounts receivable |
|
$ |
167 |
|
|
Inventory |
|
|
2,258 |
|
|
Goodwill |
|
|
1,081 |
|
|
Other intangible assets |
|
|
2,685 |
|
|
Other current assets |
|
|
161 |
|
|
Total assets acquired |
|
$ |
6,352 |
|
|
Total liabilities |
|
|
2,200 |
|
|
Total consideration |
|
$ |
4,152 |
|
Total goodwill deductible for tax purposes is $1.1 million. From the date of the Tuscany acquisition to December 31, 2018, revenue and net income generated by Tuscany was not significant. Pro forma revenues and net income for the periods ended December 31, 2018 and 2017, respectively, were not significant.
Summit Acquisition
On August 31, 2018, RDS acquired the assets of Summit Stoneworks, LLC (“Summit”), which is located in Austin, Texas, and is engaged in builder design services and the fabrication and installation of stone products for commercial and residential applications, for $16 million in cash. The agreement also provides for potential earn-out consideration of up to $3.5 million to the former shareholders of Summit for the achievement of certain 2018 and 2019 financial milestones. The contingent earn-out consideration had an estimated fair value of $1.9 million at the date of acquisition and at December 31, 2018, which was subsequently reduced to zero during 2019. During the year ended December 31, 2019, no payments were made on the earn-out as the financial milestones were not met. An adjustment of $1.9 million was recorded within other (income) expense as of December 31, 2019. The Summit acquisition was financed from the Company’s term loan described in Note 10. The Summit acquisition was accounted for under the acquisition method of accounting and the assets acquired and liabilities assumed, including identifiable intangible assets, were recorded based on their respective fair values as of the acquisition date.
F-24
Select Interior Concepts, Inc. and Subsidiaries
Notes to Consolidated Financial Statements
The total purchase price consisted of the following:
|
(in thousands) |
|
Amount |
|
|
|
Cash consideration |
|
$ |
16,000 |
|
|
Fair value of earn-out |
|
|
1,851 |
|
|
|
|
$ |
17,851 |
|
The Company incurred approximately $0.3 million in direct acquisition costs, all of which were expensed as incurred, and are included in general and administrative expenses in the consolidated statements of operations. The Company performed a valuation of the acquired assets and assumed liabilities of Summit.
The acquisition expands the scale of the RDS segment into Austin and San Antonio, Texas markets. The goodwill recorded reflects the strategic value of the acquisition beyond the net value of its assets acquired less liability assumed.
The following table summarizes the allocation of the purchase price as of the transaction’s closing date:
|
(in thousands) |
|
Amount |
|
|
|
Accounts receivable |
|
$ |
1,249 |
|
|
Inventory |
|
|
1,059 |
|
|
Property and equipment |
|
|
1,042 |
|
|
Goodwill |
|
|
8,304 |
|
|
Other intangible assets |
|
|
8,280 |
|
|
Other assets |
|
|
14 |
|
|
Total assets acquired |
|
$ |
19,948 |
|
|
Total liabilities |
|
|
2,097 |
|
|
Total consideration |
|
$ |
17,851 |
|
Total goodwill deductible for tax purposes is $6.4 million. From the date of the Summit acquisition to December 31, 2018, Summit generated revenue of $5.8 million and net income of $0.4 million, which are included in the Company’s consolidated statements of operations.
Pro Forma Results
The following unaudited pro forma information for the year ended December 31, 2018 and 2017 has been prepared to give effect to the acquisition of Summit as if the acquisition had occurred on January 1, 2017. The pro forma information takes into account the purchase price allocation. This pro forma information does not purport to represent what the actual results of operations of the Company would have been had the Summit acquisition occurred on such date, nor does it purport to predict the results of operations for future periods.
|
|
|
Year Ended December 31, |
|
|||||
|
|
|
2018 |
|
|
2017 |
|
||
|
(in thousands) |
|
(unaudited) |
|
|||||
|
Pro Forma: |
|
|
|
|
|
|
|
|
|
Total revenue |
|
$ |
500,785 |
|
|
$ |
370,645 |
|
|
Net (loss) |
|
$ |
(3,954 |
) |
|
$ |
(12,205 |
) |
F-25
Select Interior Concepts, Inc. and Subsidiaries
Notes to Consolidated Financial Statements
Pro forma assumptions are as follows:
|
|
• |
Revenues and costs of sales were based on actual results for the years ended December 31, 2018 and 2017. |
|
|
• |
Selling, general and administrative expenses were based on actual results adjusted by $0.8 million and $1.1 million for the years ended December 31, 2018 and 2017, respectively, for the impact of the amortization expense of the intangible assets acquired with the acquisition. |
|
|
• |
Actual interest expense was adjusted by $0.6 million and $0.9 million for the years ended December 31, 2018 and 2017, respectively, for the imputed interest on the acquired debt issued to fund the acquisition. |
|
|
• |
Income taxes were adjusted to impute the Company’s corporate effective rate during the period on the pro forma income before taxes. |
TAC Acquisition
On December 31, 2018, RDS purchased 100% of the issued and outstanding equity interests of T.A.C. Ceramic Tile Co. (“TAC”), which is located in Manassas, Virginia, and specializes in design center selections and installation of all types of interior flooring surfaces, including tile, hardwood and carpet, for cash consideration of $41.2 million.
The agreement also provides for potential earn-out consideration to the former shareholders of TAC for the achievement of certain 2019 financial milestones. The contingent earn-out consideration had an estimated fair value of $2.3 million at the date of acquisition which was reduced to zero as of December 31, 2019. During the year ended December 31, 2019, no payments were made on the earn-out as the financial milestones were not met. This adjustment of $2.3 million was recorded within other (income) expense for the year ended December 31, 2019. The TAC acquisition was financed from the Company’s term loan described in Note 10. The TAC acquisition was accounted for under the acquisition method of accounting and the assets acquired and liabilities assumed, including identifiable intangible assets, were recorded based on their respective fair values as of the acquisition date.
The total purchase price consisted of the following:
|
(in thousands) |
|
Amount |
|
|
|
Cash consideration |
|
$ |
41,210 |
|
|
Fair value of earn-out |
|
|
2,265 |
|
|
|
|
$ |
43,475 |
|
The Company incurred approximately $0.7 million in direct acquisition costs, all of which were expensed as incurred, and are included in general and administrative expenses in the consolidated statements of operations. Additionally, $0.4 million of deferred issuance costs incurred were capitalized. The Company has performed a valuation of the acquired assets and assumed liabilities of TAC. Using the total consideration for the TAC acquisition, the Company has estimated the allocations to such assets and liabilities.
The acquisition expands the scale of the RDS and diversifies RDS across geography, channel and product line, including the East region. The acquisition will also assist in introducing a range of additional products to customers, including countertops and cabinets. These factors are the basis for the excess purchase price paid over the value of the assets acquired and liabilities assumed, resulting in goodwill.
F-26
Select Interior Concepts, Inc. and Subsidiaries
Notes to Consolidated Financial Statements
The following table summarizes the estimated allocation of the purchase price as of the transaction’s closing date:
|
(in thousands) |
|
Amount |
|
|
|
Cash |
|
$ |
1,217 |
|
|
Accounts receivable |
|
|
6,966 |
|
|
Inventory |
|
|
4,093 |
|
|
Other current assets |
|
|
87 |
|
|
Property and equipment |
|
|
943 |
|
|
Goodwill |
|
|
18,292 |
|
|
Other intangible assets |
|
|
19,865 |
|
|
Other assets |
|
|
4,873 |
|
|
Total assets acquired |
|
$ |
56,336 |
|
|
Current liabilities |
|
|
1,895 |
|
|
Deferred income taxes |
|
|
6,099 |
|
|
Other long-term liabilities |
|
|
4,867 |
|
|
Total liabilities |
|
$ |
12,861 |
|
|
Total consideration |
|
$ |
43,475 |
|
A purchase price adjustment of approximately $0.5 million was recorded in the fourth quarter of 2019 to reduce the fair value of inventory and fixed assets and to increase the value of goodwill. Included in other long-term liabilities at the date of acquisition is an estimated uncertain tax position of $4.4 million, as well as $0.5 million of combined interest and penalties, which is offset by a corresponding indemnification receivable recorded in other assets, as all tax liabilities pre-acquisition are indemnified by the former owners. As TAC was acquired on December 31, 2018, no revenue or net income generated by TAC was included in the Company’s 2018 consolidated statements of operations.
Pro Forma Results
The following unaudited pro forma information for the years ended December 31, 2018 and 2017 has been prepared to give effect to the acquisition of TAC as if the acquisition had occurred on January 1, 2017. The pro forma information takes into account the preliminary purchase price allocation. This pro forma information does not purport to represent what the actual results of operations of the Company would have been had the TAC acquisition occurred on such date, nor does it purport to predict the results of operations for future periods.
|
|
|
Year Ended December 31, |
|
|||||
|
|
|
2018 |
|
|
2017 |
|
||
|
(in thousands) |
|
(unaudited) |
|
|||||
|
Pro Forma: |
|
|
|
|
|
|
|
|
|
Total revenue |
|
$ |
562,219 |
|
|
$ |
413,584 |
|
|
Net (loss) |
|
$ |
(2,793 |
) |
|
$ |
(12,308 |
) |
Pro forma assumptions are as follows:
|
|
• |
Revenues and costs of sales were based on actual results for the years ended December 31, 2018 and 2017 |
|
|
• |
Selling, general and administrative expenses were based on actual results adjusted by $1.8 million and $1.8 million for the years ended December 31, 2018 and 2017, respectively, for the impact of the amortization expense of the intangible assets acquired with the acquisition. Selling, general and administrative expenses were also adjusted by $4.4 million and $3.7 million for the years ended December 31, 2018 and 2017, respectively, for the impact of significant nonrecurring charges. |
|
|
• |
Actual interest expense was adjusted by $0.6 million and $0.7 million for the years ended December 31, 2018 and 2017, respectively, for the imputed interest on the acquired debt issued to fund the acquisition. |
|
|
• |
Income taxes were adjusted to impute the Company’s corporate effective rate during the period on the pro forma income before taxes. |
F-27
Select Interior Concepts, Inc. and Subsidiaries
Notes to Consolidated Financial Statements
Pental Acquisition
On February 28, 2017, ASG executed an agreement to purchase 100% of the equity interests of Aquarius Seller, Inc., a company incorporated in the state of Washington. Aquarius Seller, Inc. held 100% of the equity interests of Pental Granite and Marble, LLC (“Pental”), a Washington limited liability company engaged in the selling of granite, marble and related products. Total consideration for the purchase of Aquarius Seller, Inc. was $88.6 million in cash, and 7,134,701.65 Class E2 Units of ASG with an estimated fair value of $10.0 million. Total capitalization changes due to the acquisition resulted in the issuance of 21,736,168 Class E-1 Units, 7,156,104 Class E-2 Units and 568,435 Class C Units of G&M.
Also on February 28, 2017, ASG entered into a financing agreement with a third-party lender to borrow amounts up to $105.0 million to be used for purposes of refinancing ASG’s existing debt, funding a portion of the purchase price for the acquisition of Aquarius Seller, Inc. and funding other amounts defined in the financing agreement. In conjunction with the acquisition of Aquarius Seller, Inc., availability under ASG’s line of credit was increased to $40.0 million.
The total purchase price consisted of the following:
|
(in thousands) |
|
Amount |
|
|
|
Cash consideration |
|
$ |
88,638 |
|
|
Rollover equity |
|
|
10,000 |
|
|
|
|
$ |
98,638 |
|
The acquisition was accounted for under the acquisition method of accounting and the assets acquired and liabilities assumed, including identifiable intangible assets, were recorded based on their respective preliminary estimated fair values as of the acquisition date. The excess of purchase price consideration over the estimated net fair value of assets acquired has been allocated to goodwill. Any change in the estimated fair value of the assets acquired, liabilities assumed and rollover equity subsequent to the closing date, including changes from events after the closing date, will be recognized in earnings in the period the estimated fair value changes.
ASG incurred approximately $3.4 million in direct acquisition costs, all of which were expensed as incurred, and are included in general and administrative expenses in the consolidated statements of operations.
Management believes the acquisition creates a stronger combined entity primarily due to the increased geographic markets the combined entity will service and the broadening of the company’s product offering. These two factors are the basis for the excess purchase price paid over the value of the assets acquired and liabilities assumed, resulting in goodwill.
The following is a summary of the purchase price allocation for the Company’s acquisition of Pental:
|
(in thousands) |
|
Amount |
|
|
|
Cash |
|
$ |
637 |
|
|
Accounts receivable |
|
|
5,389 |
|
|
Inventory |
|
|
30,694 |
|
|
Property and equipment |
|
|
2,306 |
|
|
Intangible assets subject to amortization |
|
|
43,800 |
|
|
Goodwill |
|
|
25,388 |
|
|
Other assets |
|
|
412 |
|
|
Total assets acquired |
|
$ |
108,626 |
|
|
Total liabilities |
|
|
9,988 |
|
|
Total consideration |
|
$ |
98,638 |
|
From the date of the Pental acquisition to December 31, 2017, Pental generated net revenue of $84.7 million and a net income of $16.2 million, which are included in the consolidated statements of operations.
F-28
Select Interior Concepts, Inc. and Subsidiaries
Notes to Consolidated Financial Statements
Pro Forma Results
The following unaudited pro forma information for the period ended December 31, 2017, has been prepared to give effect to the acquisition of Pental as if the acquisition had occurred on January 1, 2017. This pro forma information does not purport to represent what the actual results of operations of the Company would have been had this acquisition occurred on such date, nor does it purport to predict the results of operations for future periods.
|
|
|
Year Ended December 31, |
|
|
|
|
|
2017 |
|
|
|
(in thousands) |
|
(unaudited) |
|
|
|
Pro Forma: |
|
|
|
|
|
Total revenue |
|
$ |
367,013 |
|
|
Net (loss) income |
|
$ |
(11,263 |
) |
Pro forma assumptions are as follows:
|
|
• |
Revenues and costs of sales were based on actual results adjusted for intercompany eliminations for the year ended December 31, 2017. |
|
|
• |
General and administrative expenses were based on actual results adjusted by $0.7 million for the year ended December 31, 2017, for the impact of the amortization expense of the intangible assets acquired with the acquisition. |
|
|
• |
Actual interest expense was adjusted by $1.2 million for the year ended December 31, 2017, for the imputed interest on the acquired debt issued to fund the acquisition. |
|
|
• |
Income taxes were adjusted to impute the Company’s corporate rate on the pro forma income before taxes. |
Cosmic Acquisition
On October 2, 2017, ASG executed an asset purchase agreement with Cosmic Stone & Tile Distributors, Inc. (“Cosmic”), a New Jersey corporation. Cosmic was established in 1993 and is a slab and tile distributor serving the Tri-State area and most Mid-Atlantic States. The total purchase price was $2.0 million in cash and a $0.2 accrued liability recorded as security for and source of payment of seller’s obligations as defined in the purchase agreement that occur within one year subsequent to the acquisition. The outstanding balance remaining of $0.2 million was paid in cash to the sellers in October 2018. The purchase price was allocated as $2.0 million in inventory and $0.2 in property and equipment. From the date of the Cosmic acquisition to December 31, 2017, net revenue and net income generated by Cosmic was not significant. Pro forma revenue and net income for the period ended December 31, 2017 was not significant.
Management believes the Cosmic acquisition created a stronger combined entity through expansion into the Tri-State and Mid-Atlantic regions.
F-29
Select Interior Concepts, Inc. and Subsidiaries
Notes to Consolidated Financial Statements
Greencraft Acquisition
On December 29, 2017, RDS executed an agreement to purchase 100% of the equity interests of Greencraft Holdings, LLC (“Greencraft”), an Arizona limited liability company, which provides full-service as a general contractor, performing installations and renovation-based construction services with revenues generated largely from cabinet and flooring installations. Greencraft wholly owns Casa Verde, Stone and Tile, and Greencraft Interiors. Total consideration for the acquisition was $33.0 million with cash consideration of $24.2 million, $3.0 million cash placed in escrow, and an earn-out with an acquisition date fair value of $5.8 million. The agreement provides for the amount in escrow as security for and source of payment of seller’s obligations as defined in the purchase agreement that occur within one year subsequent to the acquisition. An adjustment to the total consideration of $0.3 million was recorded during 2018. The balance remaining in escrow at December 31, 2018 was released to the sellers in January 2019. The Company has included the $3.0 million placed in escrow as restricted cash on the consolidated balance sheets and has included a liability in accrued expenses and other current liabilities for $3.0 million, the fair value of the liability due to the sellers at the release date. The agreement also provided for potential earn-out consideration of up to $8.0 million to the former shareholders of Greencraft for the achievement of certain 2018 financial milestones. The earn-out estimated fair value was $7.9 million as of December 31, 2018 and was recorded in accrued expenses and other current liabilities. The fair value at December 31, 2018, was calculated using the actual results achieved on the 2018 financial milestones. The earn-out was paid to the former owners in May 2019 in the amount of $8.0 million. The change in the fair value of the earn-out of $0.1 million and $2.1 million was recorded as other (income) expense for the years ended December 31, 2019 and 2018, respectively. The acquisition was financed with $13.5 million of long-term debt and the remaining with funds from the line of credit.
The total purchase price consisted of the following:
|
(in thousands) |
|
Amount |
|
|
|
Cash consideration |
|
$ |
27,218 |
|
|
Fair value of earn-out |
|
|
5,794 |
|
|
|
|
$ |
33,012 |
|
The acquisition was accounted for under the acquisition method of accounting and the assets acquired and liabilities assumed, including identifiable intangible assets, were recorded based on their respective preliminary estimated fair values as of the acquisition date. The excess of purchase price consideration over the estimated net fair value of assets acquired has been allocated to goodwill. Any change in the estimated fair value of the assets acquired and liabilities assumed subsequent to the closing date, including changes from events after the closing date, will be recognized in earnings in the period the estimated fair value changes.
RDS incurred approximately $0.4 million in direct acquisition costs, all of which were expensed as incurred, and are included in general and administrative expenses in the consolidated statements of operations.
Management believes the Greencraft acquisition created a stronger combined entity due to Greencraft’s presence and reputation in Arizona as well as its expertise with cabinets installation and renovation-based construction services. These two factors are the basis for the excess purchase price paid over the value of the assets acquired and liabilities assumed, resulting in goodwill.
F-30
Select Interior Concepts, Inc. and Subsidiaries
Notes to Consolidated Financial Statements
The following is a summary of the purchase price allocation for the Company’s acquisition of Greencraft:
|
(in thousands) |
|
Amount |
|
|
|
Cash |
|
$ |
191 |
|
|
Accounts receivable |
|
|
2,606 |
|
|
Inventory |
|
|
1,259 |
|
|
Property and equipment |
|
|
676 |
|
|
Intangible assets subject to amortization |
|
|
18,285 |
|
|
Goodwill |
|
|
10,702 |
|
|
Other assets |
|
|
433 |
|
|
Total assets acquired |
|
$ |
34,152 |
|
|
Total liabilities |
|
|
1,140 |
|
|
Total consideration |
|
$ |
33,012 |
|
During the two days from the date of acquisition to December 31, 2017, Greencraft did not generate any net revenue or net income.
Pro Forma Results
The following unaudited pro forma information for the period ended December 31, 2017, has been prepared to give effect to the acquisition of Greencraft as if the acquisition had occurred on January 1, 2017. This pro forma information does not purport to represent what the actual results of operations of the Company would have been had this acquisition occurred on such date, nor does it purport to predict the results of operations for future periods.
|
|
|
Year Ended December 31, |
|
|
|
|
|
2017 |
|
|
|
(in thousands) |
|
(unaudited) |
|
|
|
Pro Forma: |
|
|
|
|
|
Total revenue |
|
$ |
386,873 |
|
|
Net (loss) income |
|
$ |
(9,861 |
) |
Pro forma assumptions are as follows:
|
|
• |
Revenues and costs of sales were based on actual results for the year ended December 31, 2017. |
|
|
• |
General and administrative expenses were based on actual results adjusted by $1.9 million for the year ended December 31, 2017, for the impact of the amortization expense of the intangible assets acquired with the acquisition. |
|
|
• |
Actual interest expense was adjusted by $1.4 million for the year ended December 31, 2017, for the imputed interest on the acquired debt issued to fund the acquisition. |
|
|
• |
Income taxes were adjusted to impute the Company’s corporate rate on the pro forma income before taxes. |
6. Inventories
Inventories are valued at the lower of cost (using specific identification and first-in first-out methods) or net realizable value. The significant components of inventory consisted of the following at December 31:
|
(in thousands) |
|
2019 |
|
|
2018 |
|
||
|
Raw materials |
|
$ |
102,438 |
|
|
$ |
103,193 |
|
|
Installations in process |
|
|
2,303 |
|
|
|
5,077 |
|
|
|
|
$ |
104,741 |
|
|
$ |
108,270 |
|
F-31
Select Interior Concepts, Inc. and Subsidiaries
Notes to Consolidated Financial Statements
7. Property and equipment, net
Property and equipment consisted of the following at December 31:
|
(in thousands) |
|
2019 |
|
|
2018 |
|
||
|
Vehicles |
|
$ |
10,759 |
|
|
$ |
8,553 |
|
|
Machinery and equipment |
|
|
9,672 |
|
|
|
4,513 |
|
|
Leasehold improvements |
|
|
8,962 |
|
|
|
7,992 |
|
|
Furniture and fixtures |
|
|
6,906 |
|
|
|
7,058 |
|
|
Computer equipment and internal-use software |
|
|
10,167 |
|
|
|
4,194 |
|
|
Other |
|
|
1,048 |
|
|
|
526 |
|
|
|
|
$ |
47,514 |
|
|
$ |
32,836 |
|
|
Less: accumulated depreciation and amortization |
|
|
(21,020 |
) |
|
|
(13,038 |
) |
|
Property and equipment, net |
|
$ |
26,494 |
|
|
$ |
19,798 |
|
Depreciation and amortization expense of property and equipment totaled $8.4 million, $6.6 million and $3.9 million for the years ended December 31, 2019, 2018, and 2017, respectively. For the year ended December 31, 2019, $3.7 million and $4.7 million of depreciation and amortization expense was included in cost of goods sold and general and administrative expense, respectively. For the year ended December 31, 2018, $3.7 million and $2.9 million of depreciation and amortization expense was included in cost of goods sold and general and administrative expense, respectively. For the year ended December 31, 2017, $2.1 million and $1.8 million of depreciation and amortization expense was included in cost of goods sold and general and administrative expense, respectively.
8. Goodwill and Intangible Assets
Goodwill
The change in carrying amount of goodwill by reporting unit was as follows:
|
(in thousands) |
|
ASG |
|
|
RDS |
|
|
Total Goodwill |
|
|||
|
December 31, 2017 |
|
$ |
43,712 |
|
|
$ |
22,614 |
|
|
$ |
66,326 |
|
|
NSI Acquisition |
|
|
390 |
|
|
|
— |
|
|
|
390 |
|
|
Bedrock Acquisition |
|
|
381 |
|
|
|
— |
|
|
|
381 |
|
|
Tuscany Acquisition |
|
|
1,081 |
|
|
|
— |
|
|
|
1,081 |
|
|
Summit Acquisition |
|
|
— |
|
|
|
8,304 |
|
|
|
8,304 |
|
|
TAC Acquisition |
|
|
— |
|
|
|
17,794 |
|
|
|
17,794 |
|
|
Greencraft measurement period adjustment |
|
|
— |
|
|
|
317 |
|
|
|
317 |
|
|
December 31, 2018 |
|
$ |
45,564 |
|
|
$ |
49,029 |
|
|
$ |
94,593 |
|
|
Intown Acquisition |
|
|
— |
|
|
|
4,698 |
|
|
|
4,698 |
|
|
TAC measurement period adjustment |
|
|
— |
|
|
|
498 |
|
|
|
498 |
|
|
December 31, 2019 |
|
$ |
45,564 |
|
|
$ |
54,225 |
|
|
$ |
99,789 |
|
F-32
Select Interior Concepts, Inc. and Subsidiaries
Notes to Consolidated Financial Statements
8. Goodwill and Intangible Assets (Continued)
Intangibles Assets
The following table provides the gross carrying amount, accumulated amortization and net book value for each class of intangible assets by reporting unit as of December 31, 2019:
|
(in thousands) |
|
Gross Carrying Amount |
|
ASG |
|
|
RDS |
|
|
Total Gross Carrying Amount |
|
|||
|
Customer relationships |
|
|
|
$ |
60,180 |
|
|
$ |
60,060 |
|
|
$ |
120,240 |
|
|
Trade names |
|
|
|
|
7,740 |
|
|
|
18,090 |
|
|
|
25,830 |
|
|
Non-Compete agreements |
|
|
|
|
50 |
|
|
|
350 |
|
|
|
400 |
|
|
|
|
|
|
$ |
67,970 |
|
|
$ |
78,500 |
|
|
$ |
146,470 |
|
|
(in thousands) |
|
Accumulated Amortization |
|
ASG |
|
|
RDS |
|
|
Total Accumulated Amortization |
|
|||
|
Customer relationships |
|
|
|
$ |
(19,410 |
) |
|
$ |
(28,841 |
) |
|
$ |
(48,251 |
) |
|
Trade names |
|
|
|
|
(2,300 |
) |
|
|
(5,013 |
) |
|
|
(7,313 |
) |
|
Non-Compete agreements |
|
|
|
|
(21 |
) |
|
|
(137 |
) |
|
|
(158 |
) |
|
|
|
|
|
$ |
(21,731 |
) |
|
$ |
(33,991 |
) |
|
$ |
(55,722 |
) |
|
(in thousands) |
|
Net Book Value |
|
ASG |
|
|
RDS |
|
|
Total Net Book Value |
|
|||
|
Customer relationships |
|
|
|
$ |
40,770 |
|
|
$ |
31,219 |
|
|
$ |
71,989 |
|
|
Trade names |
|
|
|
|
5,440 |
|
|
|
13,077 |
|
|
|
18,517 |
|
|
Non-Compete agreements |
|
|
|
|
29 |
|
|
|
213 |
|
|
|
242 |
|
|
|
|
|
|
$ |
46,239 |
|
|
$ |
44,509 |
|
|
$ |
90,748 |
|
The following table provides the gross carrying amount, accumulated amortization and net book value for each class of intangible assets by reporting unit as of December 31, 2018:
|
(in thousands) |
|
Gross Carrying Amount |
|
ASG |
|
|
RDS |
|
|
Total Gross Carrying Amount |
|
|||
|
Customer relationships |
|
|
|
$ |
60,180 |
|
|
$ |
55,540 |
|
|
$ |
115,720 |
|
|
Trade names |
|
|
|
|
7,740 |
|
|
|
16,800 |
|
|
|
24,540 |
|
|
Non-Compete agreements |
|
|
|
|
50 |
|
|
|
350 |
|
|
|
400 |
|
|
|
|
|
|
$ |
67,970 |
|
|
$ |
72,690 |
|
|
$ |
140,660 |
|
|
(in thousands) |
|
Accumulated Amortization |
|
ASG |
|
|
RDS |
|
|
Total Accumulated Amortization |
|
|||
|
Customer relationships |
|
|
|
$ |
(13,268 |
) |
|
$ |
(22,609 |
) |
|
$ |
(35,877 |
) |
|
Trade names |
|
|
|
|
(1,457 |
) |
|
|
(2,543 |
) |
|
|
(4,000 |
) |
|
Non-Compete agreements |
|
|
|
|
(9 |
) |
|
|
(59 |
) |
|
|
(68 |
) |
|
|
|
|
|
$ |
(14,734 |
) |
|
$ |
(25,211 |
) |
|
$ |
(39,945 |
) |
|
(in thousands) |
|
Net Book Value |
|
ASG |
|
|
RDS |
|
|
Total Net Book Value |
|
|||
|
Customer relationships |
|
|
|
$ |
46,912 |
|
|
$ |
32,931 |
|
|
$ |
79,843 |
|
|
Trade names |
|
|
|
|
6,283 |
|
|
|
14,257 |
|
|
|
20,540 |
|
|
Non-Compete agreements |
|
|
|
|
41 |
|
|
|
291 |
|
|
|
332 |
|
|
|
|
|
|
$ |
53,236 |
|
|
$ |
47,479 |
|
|
$ |
100,715 |
|
F-33
Select Interior Concepts, Inc. and Subsidiaries
Notes to Consolidated Financial Statements
8. Goodwill and Intangible Assets (Continued)
Amortization expense on intangible assets totaled $15.8 million, $13.9 million, and $10.9 million during the years ended December 31, 2019, 2018, and 2017, respectively.
The estimated annual amortization expense for the next five years and thereafter is as follows:
|
Year Ending December 31: |
|
|
|
|
|
2020 |
|
$ |
12,734 |
|
|
2021 |
|
|
12,603 |
|
|
2022 |
|
|
12,402 |
|
|
2023 |
|
|
12,038 |
|
|
2024 |
|
|
10,313 |
|
|
Thereafter |
|
|
30,658 |
|
|
|
|
$ |
90,748 |
|
9. Lines of Credit
SIC Credit Facility
In June 2018, the Company and certain of its subsidiaries entered into an amended and restated loan, security and guaranty agreement, dated as of June 28, 2018, which was amended on December 11, 2018, July 23, 2019 and August 19, 2019 (“SIC Credit Facility”), with a commercial bank, which amended and restated each of the RDS credit agreement and the ASG credit agreement in their entirety. The SIC Credit Facility will be used by the Company, including both RDS and ASG, for operational purposes. Pursuant to the SIC Credit Facility, the Company has a borrowing-base-governed revolving credit facility that provides for borrowings up to an aggregate of $90 million, which was increased to $100 million through amendment entered into on August 19, 2019.
Under the terms of the SIC Credit Facility, the Company has the ability to request the issuance of letters of credit up to a maximum aggregate stated amount of $15 million. The ability to borrow revolving loans under the SIC Credit Facility is reduced on a dollar-for-dollar basis by the aggregate stated amount of all outstanding letters of credit. The indebtedness outstanding under the SIC Credit Facility is secured by substantially all of the assets of the Company and its subsidiaries.
The revolving loans under the SIC Credit Facility bear interest at a floating rate equal to an index rate (which the Company can elect between an index based on a LIBOR based rate or an index based on a Prime, Federal Funds or LIBOR based rate) plus an applicable margin. The applicable margin is determined quarterly based on the borrowers’ average daily availability (calculated by reference to their accounts receivable and inventory that comprise their borrowing base) during the immediately preceding fiscal quarter. Upon the occurrence of certain events of default under the SIC Credit Facility, the interest rate applicable to the obligations thereunder may be increased by two hundred basis points (2.00%). All revolving loans under the SIC Credit Facility are due and payable in full on June 28, 2023, subject to earlier acceleration upon certain conditions. Letter of credit obligations under the SIC Credit Facility are due and payable on the date set forth in the respective loan documents or upon demand by the lender.
Under the SIC Credit Facility, the Company and its subsidiaries are required to comply with certain customary restrictive covenants that, among other things and with certain exceptions, limit the ability of the Company and its subsidiaries, as applicable, to (i) incur additional indebtedness and liens in connection therewith, (ii) pay dividends and make certain other restricted payments, (iii) effect mergers or consolidations, (iv) enter into transactions with affiliates, (v) sell or dispose of property or assets, and (vi) engage in unrelated lines of business.
As of December 31, 2019, $22.2 million was outstanding under the SIC Credit Facility. The Company also has $0.4 million in letters of credit outstanding at December 31, 2019. The SIC Credit Facility is subject to certain financial covenants. At December 31, 2019, the Company was in compliance with the financial covenants.
F-34
Select Interior Concepts, Inc. and Subsidiaries
Notes to Consolidated Financial Statements
9. Lines of Credit (Continued)
The Company incurred debt issuance costs of $0.5 million in connection with the SIC Credit Facility. These costs will be amortized to non-cash interest expense over the term of the agreement on a straight-line basis which approximates the effective interest method. Non-cash interest expense related to these costs was $0.1 million and $0.05 million for the years ended December 31, 2019 and 2018, respectively. At December 31, 2019 and 2018, SIC had $0.3 million and $0.4 million, respectively, of unamortized debt issuance costs related to the SIC Credit Facility. These costs are shown as a direct deduction of the line of credit liability in the accompanying Company’s consolidated balance sheets.
10. Long-Term Debt
Long-term debt consisted of the following at December 31:
|
(in thousands) |
|
2019 |
|
|
2018 |
|
||
|
RDS equipment and vehicle notes |
|
$ |
489 |
|
|
$ |
956 |
|
|
ASG term loans |
|
|
154,177 |
|
|
|
144,983 |
|
|
|
|
|
154,666 |
|
|
|
145,939 |
|
|
Unamortized debt issuance costs |
|
|
(1,618 |
) |
|
|
(2,129 |
) |
|
Total long-term debt |
|
|
153,048 |
|
|
|
143,810 |
|
|
Current portion of long-term debt, net of financing fees |
|
$ |
11,749 |
|
|
$ |
1,368 |
|
|
Long-term debt, net of current portion and financing fees |
|
$ |
141,299 |
|
|
$ |
142,442 |
|
RDS Equipment and Vehicle Notes
RDS has financed the acquisition of certain vehicles, property, and equipment with notes payable that mature at various times through May 2023. As of December 31, 2019 and 2018, the outstanding balance on equipment and vehicle notes payable, totaled $0.5 million and $1.0 million, respectively. These notes are secured by the vehicles and equipment that were financed and require monthly interest and principal payments. The aggregate of the monthly payments was approximately $0.03 million and $0.05 million at December 31, 2019 and 2018, respectively. The interest rates on the notes ranged from 0% to 8.85% per annum for 2019 and 2018, and the weighted-average interest rate on the outstanding balances at December 31, 2019 and 2018, was 5.12% and 4.85% respectively.
In December 2015, ASG entered into a loan agreement with a financial institution offering a term loan in the aggregate amount of $1.7 million to finance the purchase of equipment. Amounts due under the term loan bear interest at 3.75% per annum with interest payable monthly. Principal payments are due in monthly installments beginning April 8, 2016 through maturity (March 8, 2021). At December 31, 2019 and 2018, ASG had $0.4 million and $0.7 million outstanding on this loan, respectively.
On February 28, 2017, AG&M and Pental, as the borrowers, entered into a financing agreement, as amended, with the lenders party thereto and Cerberus Business Finance, LLC, as the agent for the lenders (“Term Loan Facility”), which initially provided for a $105.0 million term loan facility. The Term Loan Facility was amended in June 2018 to define the borrowers as Select Interior Concepts, Inc. and its subsidiaries, was amended in August 2018 to adjust the borrowing capacity to $101.4 million, and was amended in December 2018 to increase the borrowing capacity to $174.2 million. The Company borrowed an additional $11.5 million under the Term Loan Facility to fund the acquisition of Intown on March 1, 2019. In July 2019, the agreement was amended to revise certain covenants. On August 19, 2019, the Term Loan Facility was further amended, resulting in an adjusted rate of interest payable on borrowings under the Term Loan Facility. Additionally, the August 19, 2019 amendment imposes a prepayment premium with respect to an optional prepayment of the term loans under the Financing Agreement occurring within fifteen months of August 19, 2019 (other than prepayments in connection with a change of control) in an amount equal to 1.50% of any such principal amount prepaid.
F-35
Select Interior Concepts, Inc. and Subsidiaries
Notes to Consolidated Financial Statements
10. Long-Term Debt (Continued)
Subsequent to the August 2019 amendment, borrowings under the Term Loan Facility bear interest per year equal to either: (i) the base rate plus 4.75% for a base rate loan, or (ii) the LIBOR rate plus 6.75% for a LIBOR loan in the event the Leverage Ratio is greater than 2.40 to 1:00. In the event the leverage ratio is less than 2.40 to 1.00, the rates decrease to either (i) the base rate plus 4.25% for a base rate loan, or (ii) the LIBOR rate plus 6.25% for a LIBOR loan. The base rate is the greater of the publicly announced interest rate by the reference bank as its reference rate, the base commercial lending rate or prime rate, and 3.5% per annum. The interest rate assessed as of December 31, 2019 was 8.45%. Interest is payable monthly with principal payments due in quarterly installments beginning July 1, 2017 through maturity (February 28, 2023).
Following the delivery of audited annual financial statements for each fiscal year, the Term Loan Facility requires the Company to prepay amounts outstanding under the Term Loan Facility with (i) 75% of the excess cash flow of the Company minus the aggregate principal amount of all optional prepayments made in such preceding fiscal year, if the leverage ratio is greater than 3.25:1.00, or (ii) 50% of the excess cash flow of the Company minus the aggregate principal amount of all optional prepayments made in such preceding fiscal year, if the leverage ratio is less than or equal to 3.25:1.00.
In addition, the Term Loan Facility also requires the Company to prepay amounts outstanding, subject to certain exceptions (and, with respect to clauses (i) and (ii) below, certain limited reinvestment rights), with: (i) 100% of the net proceeds of any asset disposition in excess of $0.75 million in any fiscal year, (ii) 100% of any insurance or condemnation awards that are greater than $2.5 million, (iii) 100% of the net proceeds of any equity issuances, (iv) 100% of the net proceeds of any issuance of indebtedness (other than certain permitted indebtedness), and (v) 100% of any net cash proceeds received outside the ordinary course of business. The estimated prepayment amount due under the terms of the agreement in 2020 is $10.6 million, which is classified within the current portion of long-term debt on the consolidated balance sheet as of December 31, 2019.
All term loans under the Term Loan Facility are due and payable in full on February 28, 2023, subject to earlier acceleration upon certain conditions.
Under the Term Loan Facility, the Company is required to comply with certain customary restrictive covenants that, among other things and with certain exceptions, limit the ability of the Company to (i) incur additional indebtedness and liens, (ii) pay dividends and make certain other distributions, (iii) sell or dispose of property or assets, (iv) make loans, (v) make payment of certain debt, (vi) make fundamental changes, (vii) enter into transactions with affiliates, and (viii) engage in any new businesses. The Term Loan Facility also contains certain customary representations and warranties, affirmative covenants, and reporting obligations.
As of December 31, 2019 and 2018, the Company had $153.8 million and $144.2 million outstanding, respectively, under the Term Loan Facility.
Substantially all of the Company’s assets are collateral for these loans except assets collateralized by the SIC Credit Facility which hold a senior position. These assets include all of the Company’s accounts receivable and inventory. The Company is also restricted from paying dividends to its stockholders. Additionally, substantially all of the net assets of the Company’s subsidiaries are restricted by the Term Loan Facility from providing loans, advances and dividends to the SIC parent company. The Company is required to meet certain financial and nonfinancial covenants pursuant to these term loans. The Company was in compliance with all financial and nonfinancial covenants as of December 31, 2019.
ASG incurred debt issuance costs in connection with its term loans. These costs are being amortized to non-cash interest expense over the terms of the related notes on a straight-line basis, which approximates the effective interest rate method. Non-cash interest expense related to these costs was $0.5 million for each of the years ended December 31, 2019, 2018 and 2017. Additionally, ASG expensed the remaining unamortized debt issuance costs for the refinanced debt of $0.6 million as extinguishment of debt in February 2017. At December 31, 2019 and 2018, the unamortized debt issuance costs related to the term loans totaled $1.6 million and $2.1 million, respectively, and are shown as a direct deduction from the liability on the accompanying consolidated balance sheets.
F-36
Select Interior Concepts, Inc. and Subsidiaries
Notes to Consolidated Financial Statements
10. Long-Term Debt (Continued)
Future Maturities
At December 31, 2019, the future maturities of the Company’s long-term debt for each of the next five years and thereafter are as follow:
|
2020 |
|
$ |
12,260 |
|
|
2021 |
|
|
1,191 |
|
|
2022 |
|
|
1,112 |
|
|
2023 |
|
|
140,103 |
|
|
|
|
$ |
154,666 |
|
|
Unamortized balance remaining of financing fees |
|
|
(1,618 |
) |
|
Total long-term debt net of financing fees |
|
|
153,048 |
|
|
Current portion of long-term debt net of financing fees |
|
|
(11,749 |
) |
|
Long term debt net of financing fees |
|
$ |
141,299 |
|
11. Commitments and Contingencies
Equity Tracking Incentive Plan
RDS granted exit payments under the Equity Tracking Incentive Program during 2015 to four executives. The executives were eligible to receive an exit payment if certain equity targets are met upon an Exit event. The amount of the Exit Payment would be based on the additional equity value achieved by the Company above the initial equity investment by TCFI LARK, LLC, net of all of the anticipated Exit Payments, on the first to occur of the following events: (i) RDS’ initial public offering, (ii) the sale of all or substantially all of the assets of RDS to an unrelated person or entity, or (iii) any other similar transaction in which Trive Capital sells or transfers all of its ownership to an unrelated third party. The Exit Payment shall vest according to the vesting scheduled denoted in the arrangement and will be settled in cash. If the executive ceases to be employed by RDS and its subsidiaries for any or no reason (other than termination for cause) prior to an Exit, the executive may become vested up to a maximum of 50% of the Exit Payment depending on the length of continued employment. The remaining 50% of the Exit Payment will vest only if the executive is employed through the date of the Exit. The Company did not recognize a liability on the date of grant or at December 31, 2016 as the relevant event had not occurred. With the November 2017 Private Offering and Private Placement item (iii) above triggered the payment under the Equity Tracking Incentive Plan to the four executives. For the year ended December 31, 2017, RDS recognized $3.5 million of general and administrative expense on the consolidated statements of operations related to these payments.
Leases
The Company leases certain vehicles and equipment under leases classified as capital leases. The leased vehicles are included as property, plant and equipment and amortized to accumulated amortization on a straight line basis over the life of the lease, typically four years. The total acquisition cost included in PP&E related to the leased vehicles is $11.2 million and $2.7 million at December 31, 2019 and 2018, respectively. Total accumulated amortization related to the leased vehicles is $1.6 million and $0.5 million at December 31, 2019 and 2018, respectively, with amortization expense totaling $1.1 million, $0.5 million and $0.05 million for the years ended December 31, 2019, 2018 and 2017, respectively. Included in the capital lease balances is approximately $2.7 million of assets that were sold and subsequently leased back during 2019 related to certain ERP software and equipment. The transaction did not qualify for sale-leaseback accounting and no sale was recognized. Proceeds from the transaction were reported as a financing activity in the statement of cash flows for the year ended December 31, 2019.
RDS leases its corporate, administrative, fabrication and warehousing facilities under long-term non-cancelable operating lease agreements expiring at various dates through December 2023. The monthly rents are subject to annual increases and generally require the payment of utilities, real estate taxes, insurance and repairs. Three of RDS’ facility leases are with a company owned by a stockholder of SIC and six of RDS’ facility leases are with employees or contractors of RDS.
F-37
Select Interior Concepts, Inc. and Subsidiaries
Notes to Consolidated Financial Statements
11. Commitments and Contingencies (Continued)
RDS also has operating leases for certain office equipment and vehicles under long-term lease agreements expiring at various dates through 2022.
ASG leases its facilities and equipment under long-term non-cancellable operating lease agreements expiring at various dates through October 2029. The facility leases contain predetermined fixed escalations of the minimum rentals. One of ASG’s facility leases are with companies owned by a related party.
SIC leases its corporate facilities under a long-term non-cancelable operating lease through October 2022.
The Company recognizes rent expense on a straight-line basis and records the difference between the recognized rent expense and amounts payable under the lease as deferred rent. Aggregate deferred rent at December 31, 2019 and 2018 was $2.2 million and $1.9 million, respectively. Aggregate rent expense for the years ended December 31, 2019, 2018, and 2017 totaled $19.1 million, $14.3 million and $7.5 million, respectively.
Aggregate future minimum payments under capital leases and noncancelable operating leases at December 31, 2019 are as follows:
|
(in thousands) |
|
Capital Lease Obligations |
|
|
Related Party Operating Lease Obligations |
|
|
Third Party Operating Lease Obligations |
|
|
Net Lease Commitments |
|
||||
|
2020 |
|
$ |
2,752 |
|
|
$ |
2,449 |
|
|
$ |
12,792 |
|
|
$ |
17,993 |
|
|
2021 |
|
|
2,736 |
|
|
|
2,385 |
|
|
|
11,237 |
|
|
|
16,358 |
|
|
2022 |
|
|
2,318 |
|
|
|
2,030 |
|
|
|
9,289 |
|
|
|
13,637 |
|
|
2023 |
|
|
1,111 |
|
|
|
1,282 |
|
|
|
5,856 |
|
|
|
8,249 |
|
|
2024 |
|
|
860 |
|
|
|
- |
|
|
|
2,489 |
|
|
|
3,349 |
|
|
Thereafter |
|
|
464 |
|
|
|
- |
|
|
|
4,923 |
|
|
|
5,387 |
|
|
Total minimum lease payments |
|
$ |
10,241 |
|
|
$ |
8,146 |
|
|
$ |
46,586 |
|
|
$ |
64,973 |
|
|
Less: amount representing interest |
|
|
939 |
|
|
|
|
|
|
|
|
|
|
|
|
|
|
Present value of net minimum lease payments |
|
|
9,302 |
|
|
|
|
|
|
|
|
|
|
|
|
|
|
Less: current maturities of capital lease obligations |
|
|
2,395 |
|
|
|
|
|
|
|
|
|
|
|
|
|
|
Long-term capital lease obligations |
|
$ |
6,907 |
|
|
|
|
|
|
|
|
|
|
|
|
|
F-38
Select Interior Concepts, Inc. and Subsidiaries
Notes to Consolidated Financial Statements
11. Commitments and Contingencies (Continued)
Litigation
The Company experiences routine litigation in the normal course of its business. Production residential builders in California are primarily sued for alleged construction defects. As a practice, residential builders name all subcontractors in the lawsuit whether or not the subcontractor has any connection, direct or indirect, with the alleged defect. The Company, as a subcontractor, is involved in these lawsuits as a result. The Company generally has no or minimal liability in the majority of these lawsuits. The Company’s insurance policies’ self-insured retention (“SIR”) or/deductible typically ranges from $0.01 million to $0.02 million. In the event that the Company has exposure beyond its SIR/deductible, the Company’s general liability policy is triggered and the general liability insurance and the insurance carrier defends the Company in the lawsuit and is responsible for additional exposure up to policy limits. The Company has consistently maintained general liability insurance with $2.0 million aggregate and $1.0 million per occurrence limits. Management does not believe that any pending or threatened litigation will have a material adverse effect on the Company’s combined business, financial condition, results of operations, and/or cash flows.
Indemnification
In the normal course of business, the Company enters into contracts and agreements that contain a variety of representations and warranties and provide for general indemnifications, including to lessors of office and warehouse space for certain actions arising during the Company’s tenancy and to the Company’s customers. The Company’s exposure under these agreements is unknown because it involves claims that may be made against the Company in the future but have not yet been made. To date, the Company has not paid any claims or been required to defend any action related to its indemnification obligations. However, the Company may record charges in the future as a result of these indemnification obligations.
Exclusive Distributor Rights
Pental’s main supplier has agreed to allow Pental exclusive distribution rights in 23 states in the United States. To maintain these rights, Pental must meet certain minimum purchase requirements. Purchase volumes through December 31, 2020 must be a minimum purchase of 90 containers per month. Using an estimated price per container based on the 2019 average price per container the future minimum purchases to maintain the exclusive rights as of December 31, 2019 are as follows:
|
(in thousands) |
|
Amount |
|
|
|
2020 |
|
$ |
37,417 |
|
An updated exclusive distributor rights agreement with Pental’s main supplier was entered into in February 2020 and supersedes the arrangement in place at December 31, 2019. The new agreement now encompasses all of the ASG segment and not only Pental. The updated minimum purchase volumes agreed to, using an estimated price per container based on the 2019 average price per container, through December 31, 2025 are as follows:
|
(in thousands) |
|
Amount |
|
|
|
2020 |
|
$ |
71,715 |
|
|
2021 |
|
|
89,384 |
|
|
2022 |
|
|
108,093 |
|
|
2023 |
|
|
128,880 |
|
|
2024 |
|
|
153,824 |
|
|
2025 |
|
|
184,589 |
|
|
|
|
$ |
736,485 |
|
F-39
Select Interior Concepts, Inc. and Subsidiaries
Notes to Consolidated Financial Statements
11. Commitments and Contingencies (Continued)
If the Company falls short of these minimum requirements in any given calendar year, the Company has agreed to negotiate with the supplier to arrive at a mutually acceptable resolution. There are no financial penalties to the Company if such commitments are not met; however, the supplier reserves the right to remove exclusive distribution rights privileges.
Purchase Commitments
The Company also has contracted to minimum purchase commitments with certain suppliers. RDS has committed to purchase $2 million in products annually for each of the calendar years 2020 and 2021 with a certain supplier. Financial penalties for not achieving the minimum purchase commitment amount are equal to 15% of the shortfall amount.
12. Stock Compensation
On November 22, 2017, the Company adopted the Select Interior Concepts, Inc. 2017 Incentive Compensation Plan (the “2017 Plan”). Upon the adoption of the 2017 Plan, the maximum aggregate number of shares issuable thereunder was 2,561,463 shares. As of December 31, 2019, there were approximately 1,825,123 shares of the Company’s common stock subject to outstanding awards and approximately 411,426 shares of the Company’s common stock were reserved and available for future awards under the 2017 Plan.
On March 26, 2019, the board of directors adopted the Select Interior Concepts, Inc. 2019 Long-Term Incentive Plan (the “2019 Incentive Plan”), which was approved at the 2019 Annual Meeting of Stockholders on May 15, 2019. The 2019 Incentive Plan serves as the successor to the 2017 Plan; however, shares continue to be available for award grants under the 2017 plan following the effectiveness of the 2019 plan. The maximum aggregate number of shares issuable under the 2019 plan is 1,700,000. No awards had been issued under the 2019 Incentive Plan as of December 31, 2019.
The 2017 Plan and the 2019 Incentive Plan (collectively, “the Plans”), permit the grant of incentive stock options to employees and the grant of nonstatutory stock options, performance awards, restricted stock, restricted stock units, stock appreciation rights, and other stock-based awards to the Company’s employees, directors and consultants at the sole discretion of the Company’s board of directors.
Stock Options
The Company’s board of directors administers the Plans, selects the individuals to whom options will be granted, and determines the number of options to be granted and the term and exercise price of each option. Incentive stock options granted pursuant to the terms of the Plans cannot be granted with an exercise price of less than 100% of the fair market value of the underlying stock on the date of grant (110% if the award is issued to a 10% or more stockholder of the Company). The term of the options granted under the Plan cannot be greater than ten years; five years for incentive stock options granted to optionees who have a greater than 10% ownership interest in the Company.
If an option expires under the Plans, such as upon termination of employment, becomes unexercisable without having been exercised in full, is surrendered pursuant to an option exchange program, or settled in a manner that does not result in the issuance of shares, the unpurchased shares will become available for future grant or sale under the Plans. If the employee does not exercise vested options upon termination, these options will expire and revert back to the option pool of the Plans. The Company’s policy is to issue new shares of common stock upon the exercise of stock options.
The Company’s has not had any stock option activity under the Plans for the years ended December 31, 2019, 2018 and 2017.
F-40
Select Interior Concepts, Inc. and Subsidiaries
Notes to Consolidated Financial Statements
12. Stock Compensation (Continued)
Restricted Stock
Restricted stock awards and restricted stock unit awards are grants of shares of the Company’s common stock or rights to receive shares of the Company’s common stock that are subject to various restrictions, including restrictions on transferability, vesting and forfeiture provisions. Recipients of restricted stock awards generally will have voting and dividend rights with respect to such shares prior to vesting, subject to such awards’ forfeiture provisions, unless the board of directors provides otherwise. Recipients of restricted stock unit awards generally will not have voting and dividend rights unless and until shares of common stock are issued with respect to such awards. Shares of restricted stock that do not vest for any reason will be forfeited by the recipient and will revert to the Company.
For the year ended December 31, 2019, 1,453,205 restricted stock units were granted to certain directors, executives, and key employees, and such awards are subject to vesting over a period ranging from one to three years, and certain other conditions, including continuous service to the Company, following the date of the restricted stock unit agreement. The shares vest ratably on an annual basis. Additionally, restricted stock units were granted to certain executives and include both a service and a performance condition. The performance condition is achievement of a 2021 earnings target and the level of achievement of the earnings target determines the number of shares that will be issued. The number of shares to be issued at achievement of 100% of the earnings target is 573,824, and up to 1,147,648 shares will be issued upon achievement of 200% of the earnings target. The 200% target share amount of 1,147,648 is included as granted in the table below of nonvested shares outstanding.
The Company estimated the fair value of these shares on the date the shares were granted and recognizes the resulting fair value over the requisite service period. The grant date fair value for the restricted stock units during the years ended December 31, 2019, 2018 and 2017 was determined using the closing share price on the date of grant.
A summary of the restricted stock activity for the Plans for the years ended December 31, 2019, 2018 and 2017 is as follows:
|
(in thousands) |
|
Nonvested Shares Outstanding |
|
|
Weighted Average Grant Date Fair Value |
|
||
|
Nonvested shares at January 1, 2017 |
|
|
— |
|
|
|
— |
|
|
Granted |
|
|
356,368 |
|
|
$ |
12.00 |
|
|
Forfeited |
|
|
— |
|
|
|
— |
|
|
Vested |
|
|
— |
|
|
|
— |
|
|
Nonvested shares at December 31, 2017 |
|
|
356,368 |
|
|
$ |
12.00 |
|
|
Granted |
|
|
779,016 |
|
|
$ |
11.83 |
|
|
Forfeited |
|
|
(281,762 |
) |
|
|
12.00 |
|
|
Vested |
|
|
(27,646 |
) |
|
|
12.00 |
|
|
Nonvested shares at December 31, 2018 |
|
|
825,976 |
|
|
$ |
11.84 |
|
|
Granted |
|
|
1,453,205 |
|
|
$ |
12.99 |
|
|
Forfeited |
|
|
(197,185 |
) |
|
|
12.00 |
|
|
Vested |
|
|
(256,873 |
) |
|
|
11.79 |
|
|
Nonvested shares at December 31, 2019 |
|
|
1,825,123 |
|
|
$ |
12.75 |
|
As of December 31, 2019, total remaining equity-based compensation expense for unvested restricted stock is $10.6 million, which is expected to be recognized over a weighted average remaining period of 2.1 years. Equity -based compensation expense recognized for restricted stock for the years ended December 31, 2019, 2018 and 2017 was $4.7 million, $2.5 million and $0.2, respectively. The recognized tax benefit for stock compensation expense for the year ended December 31, 2019 and 2018 was $0.4 million and $1.0 million, respectively. There was no significant tax benefit recorded for stock compensation expense in 2017.
F-41
Select Interior Concepts, Inc. and Subsidiaries
Notes to Consolidated Financial Statements
12. Stock Compensation (Continued)
In addition to the 1,825,123 nonvested shares outstanding, management awarded 2019 annual compensation bonuses in equity shares instead of cash. These bonuses are estimated to be settled in the first quarter of 2020 and will be settled at fixed amounts using the stock price on or around the date of settlement. The estimated number of shares to be awarded to executives upon settlement in 2020 is approximately 108,726 shares, using the estimated annual compensation cost and closing stock price at December 31, 2019. The compensation expense associated with these awards is $1.0 million for the year ended December 31, 2019. The related liability associated with these bonuses is recorded in accrued expenses and other current liabilities as of December 31, 2019.
Phantom Stock
Phantom stock awards are grants of shares of the Company’s common stock that are settled in cash and subject to various restrictions, including restrictions on transferability, vesting and forfeiture provisions. Recipients of phantom stock awards generally will not have voting and dividend rights with respect to such shares upon grant without regard to vesting, unless the Company’s board of directors provides otherwise. Shares of phantom stock that do not vest for any reason will be forfeited by the recipient and will revert to the Company.
On November 22, 2017, concurrent with November 2017 Private Offering and Private Placement, 356,368 shares of phantom stock were granted to certain members of the executive management team and members of the Company’s board of directors subject to certain vesting conditions including continuous service to the Company and meeting other Company performance conditions, following the date of the phantom stock agreement. As a result of the cash-settlement feature of these awards, the Company considers these awards to be liability awards, which are measured at fair value at each reporting date and the pro-rata vested portion of the award is recognized as a liability to the extent that the performance condition is deemed probable. The fair value for the shares of phantom stock granted on November 22, 2017 was estimated using the most current price paid for Class A Common Stock traded between a buyer and a seller.
The Company recorded phantom stock-based compensation expense of $0.01 million, $0.01 million and $0.8 million related to these shares for the years ended December 31, 2019, 2018 and 2017, respectively.
A summary of the phantom stock activity for the years ended December 31, 2019, 2018 and 2017 is as follows:
|
(in thousands) |
|
Number of Phantom Restricted Outstanding |
|
|
|
Nonvested shares at January 1, 2017 |
|
|
— |
|
|
Granted |
|
|
356,368 |
|
|
Forfeited |
|
|
— |
|
|
Vested |
|
|
(70,440 |
) |
|
Nonvested shares at December 31, 2017 |
|
|
285,928 |
|
|
Granted |
|
|
— |
|
|
Forfeited |
|
|
(281,762 |
) |
|
Vested |
|
|
(1,389 |
) |
|
Nonvested shares at December 31, 2018 |
|
|
2,777 |
|
|
Granted |
|
|
— |
|
|
Forfeited |
|
|
(1,389 |
) |
|
Vested |
|
|
(694 |
) |
|
Nonvested shares at December 31, 2019 |
|
|
694 |
|
As of December 31, 2019, total remaining equity-based compensation expense for unvested phantom stock is less than $0.01 million, which is expected to be recognized over a weighted average remaining period of less than 1 year.
F-42
Select Interior Concepts, Inc. and Subsidiaries
Notes to Consolidated Financial Statements
13. Provision for Income Taxes
At December 31, 2019, 2018 and 2017, the components of the provision for income taxes reflected on the consolidated statements of operations are as follows:
|
(in thousands) |
|
2019 |
|
|
2018 |
|
|
2017 |
|
|||
|
Current: |
|
|
|
|
|
|
|
|
|
|
|
|
|
Federal |
|
$ |
1,728 |
|
|
$ |
3,604 |
|
|
$ |
17 |
|
|
State |
|
|
1,287 |
|
|
|
1,571 |
|
|
|
374 |
|
|
Total current |
|
|
3,015 |
|
|
|
5,175 |
|
|
|
391 |
|
|
Deferred: |
|
|
|
|
|
|
|
|
|
|
|
|
|
Federal |
|
|
618 |
|
|
|
(2,871 |
) |
|
|
3,712 |
|
|
State |
|
|
(2,112 |
) |
|
|
(1,315 |
) |
|
|
(783 |
) |
|
Total deferred |
|
|
(1,494 |
) |
|
|
(4,186 |
) |
|
|
2,929 |
|
|
Provision for income taxes |
|
$ |
1,521 |
|
|
$ |
989 |
|
|
$ |
3,320 |
|
The following is a reconciliation of expected income tax expense (computed by applying the federal statutory income tax rate to income before taxes) to actual income tax expense.
|
(in thousands) |
|
2019 |
|
|
2018 |
|
|
2017 |
|
|||
|
Income taxes at federal statutory rate |
|
$ |
1,786 |
|
|
$ |
(280 |
) |
|
$ |
(2,756 |
) |
|
State income taxes, net of federal benefit |
|
|
(651 |
) |
|
|
148 |
|
|
|
(248 |
) |
|
Transaction costs |
|
|
— |
|
|
|
968 |
|
|
|
64 |
|
|
TAC earn-out |
|
|
(476 |
) |
|
|
— |
|
|
|
— |
|
|
Equity-based compensation |
|
|
134 |
|
|
|
— |
|
|
|
— |
|
|
Permanent items |
|
|
298 |
|
|
|
294 |
|
|
|
1,729 |
|
|
State rate changes |
|
|
(293 |
) |
|
|
(27 |
) |
|
|
(140 |
) |
|
162(m) limitation |
|
|
345 |
|
|
|
— |
|
|
|
— |
|
|
Other, net |
|
|
378 |
|
|
|
(114 |
) |
|
|
124 |
|
|
Domestic production activities deductions |
|
|
— |
|
|
|
— |
|
|
|
(97 |
) |
|
Tax Cuts and Jobs Act |
|
|
— |
|
|
|
— |
|
|
|
5,372 |
|
|
2015 IRS audit |
|
|
— |
|
|
|
— |
|
|
|
228 |
|
|
Flow-through income |
|
|
— |
|
|
|
— |
|
|
|
(956 |
) |
|
Provision for income taxes |
|
$ |
1,521 |
|
|
$ |
989 |
|
|
$ |
3,320 |
|
At December 31, 2019, the Company's effective income tax rate is different from what would be expected if the federal statutory rate were applied to net income before taxes primarily due to permanent adjustments, equity-based compensation, uncertain tax positions related to TAC provision, and state income taxes. At December 31, 2018, the Company’s effective income tax rate is different from what would be expected if the federal statutory rate were applied to net income before taxes primarily due to permanent adjustments, capitalized transaction costs, and state income taxes. At December 31, 2017, the Company’s effective income tax rate is different from the federal statutory rate primarily due to the impact of the Tax Act noted below. The equity holders of ASG, prior to the November 2017 Restructuring Transactions, separately accounted for their share of ASG’s income, deduction and losses on their income tax returns. In addition, the effective rate differed from the statutory rate for RDS as a result of permanent favorable adjustments and state income taxes. The November 2017 Restructuring Transaction was treated as a combination of entities under common control, which resulted in a higher basis for tax vs. book. This resulted in the recognition of deferred tax assets totaling approximately $19.7 million (tax effected) which is recognized as contributed capital.
F-43
Select Interior Concepts, Inc. and Subsidiaries
Notes to Consolidated Financial Statements
13. Provision for Income Taxes (Continued)
The components of deferred tax assets and liabilities are as follows as of December 31, 2019 and 2018:
|
(in thousands) |
|
2019 |
|
|
2018 |
|
||
|
Deferred tax assets |
|
|
|
|
|
|
|
|
|
Accrued liabilities |
|
$ |
1,555 |
|
|
$ |
682 |
|
|
State income taxes |
|
|
103 |
|
|
|
208 |
|
|
Intangible assets |
|
|
4,919 |
|
|
|
5,396 |
|
|
Net operating loss |
|
|
994 |
|
|
|
— |
|
|
Inventory |
|
|
4,351 |
|
|
|
3,228 |
|
|
Equity-based compensation |
|
|
999 |
|
|
|
659 |
|
|
Other, net |
|
|
902 |
|
|
|
558 |
|
|
Interest limitation |
|
|
676 |
|
|
|
— |
|
|
Total deferred tax assets |
|
|
14,499 |
|
|
|
10,731 |
|
|
Deferred tax liabilities |
|
|
|
|
|
|
|
|
|
Property and equipment |
|
|
(2,562 |
) |
|
|
(1,376 |
) |
|
Prepaids |
|
|
(370 |
) |
|
|
— |
|
|
ASC 606 method change |
|
|
(1,017 |
) |
|
|
— |
|
|
Total deferred tax liabilities |
|
|
(3,949 |
) |
|
|
(1,376 |
) |
|
Net deferred tax assets (liabilities) |
|
$ |
10,550 |
|
|
$ |
9,355 |
|
Deferred income taxes reflect the net effects of temporary differences between the amounts of assets and liabilities for financial reporting purposes. The Company has not provided for a valuation allowance against any of its deferred tax assets, as management has determined it is more likely than not that these deferred tax assets will be realized. In assessing the realization of deferred tax assets, management considers whether it is more likely than not that all or some portion of the deferred tax assets will not be realized. The ultimate realization of deferred tax assets is dependent upon the generation of future taxable income during the periods in which the temporary differences become deductible. Management considers the scheduled reversal of deferred tax liabilities and projected future taxable income in making this assessment.
On December 22, 2017, the President of the United States signed into law the Tax Act. The Tax Act amends the Internal Revenue Code to reduce tax rates and modify policies, credits, and deductions for individuals and businesses. For businesses, the Act reduced the corporate tax rate from a maximum of 35% to a flat 21% rate. The rate reduction was effective on January 1, 2018. Because of the rate reduction, the Company reduced the deferred tax asset balance as of December 31, 2017 by $5.3 million. In December 2017, the SEC issued Staff Accounting Bulletin No. 118 (SAB 118), which provides guidance on accounting for the income tax effects of the Tax Act. SAB 118 provides a measurement period that should not extend beyond one year from the Tax Act enactment date for companies to complete the accounting relating to the Tax Act under Accounting Standards Codification Topic 740. Income Taxes (ASC 740). In accordance with SAB 118, a company must reflect the income tax effects of those aspects of the Tax Act for which the accounting under ASC 740 is complete. To the extent that a company’s accounting for Tax Act-related income tax effects is incomplete, but the company is able to determine a reasonable estimate, it must record a provisional estimate in its financial statements. If a company cannot determine a provisional estimate to be included in its financial statements, it should continue to apply ASC 740 on the basis of the provisions of the tax laws that were in effect immediately before the enactment of the Tax Act. The Company completed its evaluation of the Act of 2017 on its December 31, 2018 financial statements and adjusted its provision for the year ended December 31, 2018 accordingly.
As of December 31, 2019, the Company had gross state net operating loss carryforwards of $21.9 million, carrying forward indefinitely. As of December 31, 2019, unrecognized tax benefits relate entirely to pre-acquisition TAC tax returns. Assessments related to TAC for tax years through the December 31, 2018 transaction date are the responsibility of former TAC management. The Company is fully indemnified for income taxes prior to the acquisition, as well as any related interest and penalties. The Company does not expect any significant increases or decreases to the Company’s unrecognized tax benefits within the next 12 months. The Company is subject to examinations by federal taxing authorities for the tax years 2016 – 2019 and by state taxing authorities for the tax years 2015—2019. The Company is not currently under any tax examinations. The Company analyzes filing positions in all of the federal and state jurisdictions where it is required to file income tax returns, and all open tax years in these jurisdictions to determine if there are any uncertain tax positions on its tax returns.
F-44
Select Interior Concepts, Inc. and Subsidiaries
Notes to Consolidated Financial Statements
13. Provision for Income Taxes (Continued)
A reconciliation of the beginning and ending amounts of unrecognized tax positions are as follows:
|
(in thousands) |
|
2019 |
|
|
2018 |
|
||
|
Unrecognized tax positions, beginning of year |
|
$ |
4,364 |
|
|
$ |
— |
|
|
Gross increase - current period tax positions |
|
|
— |
|
|
|
— |
|
|
Gross decrease - current period tax positions |
|
|
— |
|
|
|
— |
|
|
Gross increase - prior period tax positions |
|
|
298 |
|
|
|
4,364 |
|
|
Gross decrease - prior period tax positions |
|
|
(395 |
) |
|
|
— |
|
|
Expiration of statute of limitations |
|
|
(269 |
) |
|
|
— |
|
|
Unrecognized tax positions, end of year |
|
$ |
3,998 |
|
|
$ |
4,364 |
|
Of the Company’s total unrecognized tax benefits of $4.0 million, there would be no impact to the annual effective tax rate if recognized as the uncertain tax positions are fully indemnified. The Company’s policy is to recognize interest and/or penalties related to all tax positions as income tax expense. To the extent that accrued interest and penalties do not ultimately become payable, amounts accrued will be reduced and reflected as a reduction of the overall income tax provision in the period that such determination is made. Accrued interest and penalties were $0.9 million and $0.5 million as of December 31, 2019 and 2018, respectively. The Company recognized $0.2 million in interest and $0.2 million in penalties related to uncertain tax positions for the year ended December 31, 2019. If recognized, there would be no impact to the effective tax rate as the interest and penalties are fully indemnified. For the year ended December 31, 2018, the Company recognized $0.2 million in interest and $0.3 million in penalties related to uncertain tax positions. No interest or penalties were accrued as of December 31, 2017.
Pursuant of Internal Revenue Code Sections 382, annual use of the Company’s net operating loss carryforwards may be limited in the event a cumulative change in ownership of more than 50% occurs within a three-year period.
14. Employee Benefit Plan
The Company maintains a qualified 401(k) plan for the benefit of its employees. Substantially all employees are eligible to participate in the plan. Under the plan, eligible participants are permitted to make salary deferral contributions to the plan. In addition, the plan provides for employer matching. During the years ended December 31, 2019, 2018 and 2017, the Company contributed $1.5 million, $0.9 million, and $0.6 million to the plan, respectively.
15. Related Party Transactions
Consulting Agreement
During the year ended December 31, 2017, both RDS and ASG had a consulting agreement with Trive Capital (former affiliates of which collectively held more than 5% of the Company’s common stock and are affiliated with Christopher Zugaro, the former chairman of the Company’s board of directors). Under each such respective agreement, RDS and ASG were each required to pay Trive Capital an annual nonrefundable consulting fee of $0.4 million, payable in four quarterly installments of $0.1 million each, plus the reimbursement of expenses. Each consulting agreement also allowed for additional consulting work outside of the scope of the agreement to be provided by Trive Capital and billed separately to each company. The agreement was terminated at the time of the November 2017 Restructuring Transaction. Consulting fees plus expenses that were expensed to Trive Capital during the year ended December 31, 2017 totaled $2.8 million. There was no outstanding balance due to Trive Capital at December 31, 2019 or 2018.
F-45
Select Interior Concepts, Inc. and Subsidiaries
Notes to Consolidated Financial Statements
15. Related Party Transactions (Continued)
Facility Rent
RDS leases three of its facilities from a trust affiliated with a stockholder of the Company. Additionally, as a result of recent acquisitions, RDS also leased seven of its facilities during 2019 from current employees, contractors, or former owners of acquired businesses. Rent expense under all these leases totaled $2.2 million during the year ended December 31, 2019, and $0.8 million during the years ended December 31, 2018 and 2017. No amounts were unpaid at December 31, 2019 and 2018. (See Note 11).
ASG leases office space from 521 Digiulian Boulevard, LLC, a company owned by a current employee and former owner of NSI. Rent expense under this lease was $0.1 million for the years ended December 31, 2019 and 2018. There was no expense under this lease during the year ended December 31, 2017. No amounts were unpaid under this lease at December 31, 2019 and 2018. (See Note 11).
ASG leases office space in New Jersey that was owned by a former employee (who is no longer employed by the Company in 2019). Rent expense under this lease was $0.3 million, $0.4 million, and $0.2 million for the years ended December 31, 2019, 2018, and 2017, respectively. No amounts were unpaid at December 31, 2019 and 2018. (See Note 11).
Subcontractors and Suppliers
Two of RDS employees have family members that have an ownership interest in flooring subcontracting companies that do business with RDS. During the years ended December 31, 2019, 2018, and 2017, these companies performed a total of $1.2 million, $1.6 million, and $3.2 million in subcontract work for RDS, respectively. Amounts due and recorded as accounts payable at December 31, 2019 and 2018 were $0.1 million and $0.01 million, respectively.
Design services were also provided to RDS by designers affiliated with current Greencraft employees beginning in 2018. During the years ended December 31, 2019 and 2018, expenses incurred with this design company were $0.1 million and $0.08 million, respectively. No amounts were unpaid at December 31, 2019 and 2018.
Other Consulting Services
A consulting firm affiliated with an officer of the Company has performed various consulting services for the Company related to human resources, accounting, and project management. During the years ended December 31, 2019, 2018, and 2017, the Company incurred approximately $0.3 million, $0.2 million, and $0.3 million of costs with this consulting firm, respectively. No amounts were unpaid at December 31, 2019. Amounts due and recorded as accounts payable at December 31, 2018 were $0.01 million.
An ASG executive and a stockholder of the Company terminated employment with ASG as of June 30, 2017. The stockholder continued to provide business consulting services for ASG through June 30, 2018. During the years ended December 31, 2018 and 2017, ASG incurred $0.05 million and $0.06 million, respectively, of consulting costs with this stockholder. There were no consulting costs associated with this stockholder during 2019. No amounts were unpaid at December 31, 2019 and 2018.
F-46
Select Interior Concepts, Inc. and Subsidiaries
Notes to Consolidated Financial Statements
The Company’s operations are classified into two operating segments: RDS and ASG. Under RDS, the Company offers interior design and installation services, and under ASG, the Company performs natural and engineered surfaces distribution. These operating segments represent strategic business areas which, although they operate separately and provide their own distinctive services, enables the Company to more effectively offer the complete line of interior design and selection services, merchandising, and complex supply chain management. While individual acquisitions, for a time, may have discrete financial information before being fully integrated, RDS and ASG are the only operating and reporting segments for which both discrete financial information is available and is reviewed by management for the purpose of making operating decisions and assessing financial performance.
Inter-segment eliminations result primarily from the sale of ASG inventory to the RDS segment, including the related profit margin, as well as some intercompany borrowings recorded in the form of intercompany payables and receivables.
In addition, certain corporate-level costs incurred at a corporate level or at the reporting unit level that benefit the segments are not allocated. These costs include: corporate payroll costs, legal, professional service fees, interest expense, including amortization of deferred financing costs, and taxes and equity-based compensation.
F-47
Select Interior Concepts, Inc. and Subsidiaries
Notes to Consolidated Financial Statements
16. Segment Information (Continued)
The Company evaluates performance of the respective segments based upon revenue and operating income. Information for the years presented is provided below:
|
|
|
For the Years Ended December 31, |
|
|||||||||
|
(in thousands) |
|
2019 |
|
|
2018 |
|
|
2017 |
|
|||
|
Net revenue: |
|
|
|
|
|
|
|
|
|
|
|
|
|
RDS |
|
$ |
368,574 |
|
|
$ |
268,362 |
|
|
$ |
193,204 |
|
|
ASG |
|
|
244,789 |
|
|
|
223,971 |
|
|
|
161,114 |
|
|
Elimination of intercompany sales |
|
|
(2,990 |
) |
|
|
(2,576 |
) |
|
|
(1,366 |
) |
|
Consolidated total |
|
$ |
610,373 |
|
|
$ |
489,757 |
|
|
$ |
352,952 |
|
|
|
|
|
|
|
|
|
|
|
|
|
|
|
|
Operating income (loss): |
|
|
|
|
|
|
|
|
|
|
|
|
|
RDS |
|
$ |
17,544 |
|
|
$ |
14,252 |
|
|
$ |
(161 |
) |
|
ASG |
|
|
19,860 |
|
|
|
11,925 |
|
|
|
7,966 |
|
|
Elimination of intercompany activity |
|
|
96 |
|
|
|
(46 |
) |
|
|
(74 |
) |
|
Unallocated corporate operating loss |
|
|
(18,242 |
) |
|
|
(14,034 |
) |
|
|
(1,569 |
) |
|
Consolidated total |
|
$ |
19,258 |
|
|
$ |
12,097 |
|
|
$ |
6,162 |
|
|
|
|
|
|
|
|
|
|
|
|
|
|
|
|
Capital expenditures: |
|
|
|
|
|
|
|
|
|
|
|
|
|
RDS |
|
$ |
7,155 |
|
|
$ |
1,684 |
|
|
$ |
1,289 |
|
|
ASG |
|
|
1,986 |
|
|
|
6,539 |
|
|
|
2,793 |
|
|
Unallocated corporate capital expenditures |
|
|
28 |
|
|
|
284 |
|
|
|
- |
|
|
Consolidated total |
|
$ |
9,169 |
|
|
$ |
8,507 |
|
|
$ |
4,082 |
|
|
|
|
|
|
|
|
|
|
|
|
|
|
|
|
Depreciation and amortization: |
|
|
|
|
|
|
|
|
|
|
|
|
|
RDS |
|
$ |
12,896 |
|
|
$ |
9,634 |
|
|
$ |
6,853 |
|
|
ASG |
|
|
11,159 |
|
|
|
10,833 |
|
|
|
7,963 |
|
|
Unallocated corporate depreciation and amortization |
|
|
102 |
|
|
|
20 |
|
|
|
- |
|
|
Consolidated total |
|
$ |
24,157 |
|
|
$ |
20,487 |
|
|
$ |
14,816 |
|
|
|
|
|
|
|
|
|
|
|
|
|
|
|
|
|
|
As of December 31, |
|
|
|
|
|
|||||
|
(in thousands) |
|
2019 |
|
|
2018 |
|
|
|
|
|
||
|
Goodwill: |
|
|
|
|
|
|
|
|
|
|
|
|
|
RDS |
|
$ |
54,225 |
|
|
$ |
49,029 |
|
|
|
|
|
|
ASG |
|
|
45,564 |
|
|
|
45,564 |
|
|
|
|
|
|
Consolidated total |
|
$ |
99,789 |
|
|
$ |
94,593 |
|
|
|
|
|
|
|
|
|
|
|
|
|
|
|
|
|
|
|
|
Other intangible assets, net: |
|
|
|
|
|
|
|
|
|
|
|
|
|
RDS |
|
$ |
44,509 |
|
|
$ |
47,479 |
|
|
|
|
|
|
ASG |
|
|
46,239 |
|
|
|
53,236 |
|
|
|
|
|
|
Consolidated total |
|
$ |
90,748 |
|
|
$ |
100,715 |
|
|
|
|
|
|
|
|
|
|
|
|
|
|
|
|
|
|
|
|
Total assets: |
|
|
|
|
|
|
|
|
|
|
|
|
|
RDS |
|
$ |
182,754 |
|
|
$ |
170,724 |
|
|
|
|
|
|
ASG |
|
|
217,655 |
|
|
|
230,505 |
|
|
|
|
|
|
Consolidation entries |
|
|
36 |
|
|
|
(1,016 |
) |
|
|
|
|
|
Unallocated assets, including corporate |
|
|
19,830 |
|
|
|
15,801 |
|
|
|
|
|
|
Consolidated total |
|
$ |
420,275 |
|
|
$ |
416,014 |
|
|
|
|
|
F-48
Select Interior Concepts, Inc. and Subsidiaries
Notes to Consolidated Financial Statements
17. Selected Quarterly Financial Data (Unaudited)
Selected summarized quarterly financial information is as follows for the periods presented:
|
(In thousands, except per share data) |
|
Quarter Ended |
|
|||||||||||||
|
Fiscal 2019 (a) |
|
December 31 |
|
|
September 30 |
|
|
June 30 |
|
|
March 31 |
|
||||
|
Total revenue |
|
$ |
155,242 |
|
|
$ |
159,395 |
|
|
$ |
158,342 |
|
|
$ |
136,920 |
|
|
Gross profit |
|
|
38,770 |
|
|
|
42,338 |
|
|
|
44,168 |
|
|
|
38,733 |
|
|
Income from operations |
|
|
2,952 |
|
|
|
6,209 |
|
|
|
6,750 |
|
|
|
3,266 |
|
|
Net income |
|
|
3,177 |
|
|
|
2,458 |
|
|
|
1,162 |
|
|
|
127 |
|
|
Basic EPS |
|
$ |
0.13 |
|
|
$ |
0.10 |
|
|
$ |
0.05 |
|
|
$ |
0.00 |
|
|
Diluted EPS |
|
$ |
0.13 |
|
|
$ |
0.10 |
|
|
$ |
0.05 |
|
|
$ |
0.00 |
|
|
Fiscal 2018 (b) |
|
|
|
|
|
|
|
|
|
|
|
|
|
|
|
|
|
Total revenue |
|
$ |
132,957 |
|
|
$ |
127,553 |
|
|
$ |
124,861 |
|
|
$ |
104,386 |
|
|
Gross profit |
|
|
34,628 |
|
|
|
36,470 |
|
|
|
34,406 |
|
|
|
27,950 |
|
|
Income from operations |
|
|
3,533 |
|
|
|
4,004 |
|
|
|
3,610 |
|
|
|
950 |
|
|
Net (loss) income |
|
|
(1,833 |
) |
|
|
753 |
|
|
|
(86 |
) |
|
|
(1,309 |
) |
|
Basic EPS |
|
$ |
(0.07 |
) |
|
$ |
0.03 |
|
|
$ |
— |
|
|
$ |
(0.05 |
) |
|
Diluted EPS |
|
$ |
(0.07 |
) |
|
$ |
0.03 |
|
|
$ |
— |
|
|
$ |
(0.05 |
) |
|
|
(a) |
The 2019 quarterly results presented will not sum to 2019 annual results due to the adoption of ASU 2014-19 during the quarter ended December 31, 2019. The quarter ended December 31, 2019 is presented under the previous standard, ASC Topic 605. |
|
|
(b) |
Basic and Diluted EPS includes both Class A Common Stock and Class B Common Stock for the quarters ended June 30, 2018 and March 30, 2018. In August 2018, each then remaining share of Class B Common Stock was automatically converted into one share of Class A Common Stock, resulting in no shares of Class B Common Stock left outstanding. |
18. Subsequent Events
Events occurring after December 31, 2019, have been evaluated for possible adjustment to the consolidated financial statements or disclosure as of March 12, 2020, which is the date the consolidated financial statements were available to be issued. No subsequent events were identified for adjustment or disclosure in the consolidated financial statements other than the disclosure of a new distributor agreement entered into by the ASG segment in February 2020 (See Note 11—Commitments and Contingencies).
F-49
Schedule I – SIC’s Condensed Parent Company Only Financial Statements
Select Interior Concepts, Inc.
Parent Company Only
Condensed Balance Sheets
|
(in thousands, except share data) |
|
As of December 31, 2019 |
|
|
As of December 31, 2018 |
|
||
|
Assets |
|
|
|
|
|
|
|
|
|
Investment in wholly owned subsidiaries |
|
$ |
187,571 |
|
|
$ |
161,145 |
|
|
Other assets |
|
|
397 |
|
|
|
468 |
|
|
Total assets |
|
$ |
187,968 |
|
|
$ |
161,613 |
|
|
Liabilities and stockholders' equity |
|
|
|
|
|
|
|
|
|
Due to subsidiaries |
|
$ |
23,466 |
|
|
$ |
11,183 |
|
|
Accrueds and other liabilities |
|
|
3,227 |
|
|
|
1,736 |
|
|
Total liabilities |
|
|
26,693 |
|
|
|
12,919 |
|
|
Stockholders' equity: |
|
|
|
|
|
|
|
|
|
Class A common stock, par value $0.01 per share; 100,000,000 shares authorized; 25,139,542 shares issued and 25,106,402 outstanding at December 31, 2019 and 25,682,669 issued and outstanding at December 31, 2018 |
|
|
251 |
|
|
|
257 |
|
|
Treasury stock, 33,140 shares at December 31, 2019, at cost |
|
|
(391 |
) |
|
|
— |
|
|
Additional paid in capital |
|
|
161,396 |
|
|
|
156,601 |
|
|
Retained earnings (accumulated deficit) |
|
|
19 |
|
|
|
(8,164 |
) |
|
Total stockholders' equity |
|
|
161,275 |
|
|
|
148,694 |
|
|
Total liabilities and stockholders' equity |
|
$ |
187,968 |
|
|
$ |
161,613 |
|
See Notes to Condensed Parent Company Only Financial Statements
F-50
Select Interior Concepts, Inc.
Parent Company Only
Condensed Statements of Operations
|
(in thousands) |
|
Year Ended December 31, 2019 |
|
|
Year Ended December 31, 2018 |
|
|
Period Ended December 31, 2017 |
|
|||
|
Equity in net income (loss) of subsidiaries |
|
$ |
25,226 |
|
|
$ |
11,559 |
|
|
$ |
(4,120 |
) |
|
Operating expenses |
|
|
(18,242 |
) |
|
|
(14,034 |
) |
|
|
(1,569 |
) |
|
Net income (loss) |
|
$ |
6,984 |
|
|
$ |
(2,475 |
) |
|
$ |
(5,689 |
) |
See Notes to Condensed Parent Company Only Financial Statements
F-51
Select Interior Concepts, Inc.
Parent Company Only
Condensed Statements of Cash Flows
|
(in thousands) |
|
Year Ended December 31, 2019 |
|
|
Year Ended December 31, 2018 |
|
|
Period Ended December 31, 2017 |
|
|||
|
Cash flows used in operating activities: |
|
|
|
|
|
|
|
|
|
|
|
|
|
Net income (loss) |
|
$ |
6,984 |
|
|
$ |
(2,475 |
) |
|
$ |
(5,689 |
) |
|
Adjustments to reconcile net income to net cash provided by operating activities: |
|
|
|
|
|
|
|
|
|
|
|
|
|
Equity in net income of subsidiaries |
|
|
(25,226 |
) |
|
|
(11,559 |
) |
|
|
4,120 |
|
|
Depreciation and amortization |
|
|
102 |
|
|
|
21 |
|
|
|
— |
|
|
Equity-based compensation |
|
|
5,740 |
|
|
|
2,528 |
|
|
|
152 |
|
|
Changes in assets and liabilities: |
|
|
|
|
|
|
|
|
|
|
|
|
|
Changes in operating assets |
|
|
(3 |
) |
|
|
(204 |
) |
|
|
— |
|
|
Changes in accrued expenses |
|
|
547 |
|
|
|
677 |
|
|
|
976 |
|
|
Net cash used in operating activities |
|
$ |
(11,856 |
) |
|
$ |
(11,012 |
) |
|
$ |
(441 |
) |
|
Cash flows used in investing activities: |
|
|
|
|
|
|
|
|
|
|
|
|
|
Purchase of equipment |
|
|
(28 |
) |
|
|
(284 |
) |
|
|
— |
|
|
Investment in subsidiaries |
|
|
— |
|
|
|
— |
|
|
|
(117,741 |
) |
|
Net cash used in investing activities |
|
$ |
(28 |
) |
|
$ |
(284 |
) |
|
$ |
(117,741 |
) |
|
Cash flows provided by financing activities: |
|
|
|
|
|
|
|
|
|
|
|
|
|
Repurchase and retirement of Class B Common Stock |
|
|
— |
|
|
|
— |
|
|
|
(60,035 |
) |
|
Repurchase of member units |
|
|
— |
|
|
|
— |
|
|
|
(62,725 |
) |
|
Contributions |
|
|
— |
|
|
|
— |
|
|
|
240,501 |
|
|
Purchase of treasury stock |
|
|
(399 |
) |
|
|
— |
|
|
|
— |
|
|
Borrowings from subsidiaries |
|
|
12,283 |
|
|
|
10,743 |
|
|
|
441 |
|
|
Proceeds from issuance of equity |
|
|
— |
|
|
|
553 |
|
|
|
— |
|
|
Net cash provided by financing activities |
|
$ |
11,884 |
|
|
$ |
11,296 |
|
|
$ |
118,182 |
|
|
Net change in cash and cash equivalents |
|
|
— |
|
|
|
— |
|
|
|
— |
|
|
Cash and cash equivalents: |
|
|
|
|
|
|
|
|
|
|
|
|
|
Beginning |
|
|
— |
|
|
|
— |
|
|
|
— |
|
|
Ending |
|
$ |
— |
|
|
$ |
— |
|
|
$ |
— |
|
See Notes to Condensed Parent Company Only Financial Statements
F-52
Notes to Condensed Parent Company Only Financial Statements
Note 1. Description of Select Interior Concepts Inc.
These financial statements reflect the consolidated operations of Select Interior Concepts, Inc. (“SIC”). SIC is a Delaware corporation that was restructured in November 2017 to be a holding company on which to consolidate diversified building products and services companies with a primary focus on the interiors of all types of buildings. SIC owns 100% of its two primary operating subsidiaries and segments, Residential Design Services and Architectural Surfaces Group. SIC has no significant operations or assets other than its ownership in Residential Design Services and Architectural Surfaces Group. Accordingly, SIC is dependent upon its subsidiaries to fund its obligations.
Note 2. Basis of Presentation
The accompanying Condensed Parent Only Financial Statements include the amounts of SIC and its investment in its subsidiaries under the equity method, and do not present the financial statements of SIC and its subsidiaries on a consolidated basis. Under the equity method, investments in subsidiaries are stated at cost plus contributions and equity in undistributed income (loss) of subsidiaries less distributions received since the date of acquisition. There have been no distributions in 2019, 2018 and 2017. Income tax considerations were evaluated under the separate return method, resulting in no net tax benefits for SIC as a separate entity. The period ended December 31, 2017 represents the period between the November 2017 Restructuring Transactions and the November 2017 Private Offering and Private Placement and December 31, 2017. These Condensed Parent Company Only Financial Statements should be read in conjunction with the consolidated financial statements of Select Interior Concepts, Inc. and subsidiaries and the accompanying Notes to the consolidated financial statements.
F-53