Attached files
| file | filename |
|---|---|
| EX-32.1 - EXHIBIT 32.1 - GP STRATEGIES CORP | exhibit321-gpx123119.htm |
| EX-31.2 - EXHIBIT 31.2 - GP STRATEGIES CORP | exhibit312-gpx123119.htm |
| EX-31.1 - EXHIBIT 31.1 - GP STRATEGIES CORP | exhibit311-gpx123119.htm |
| EX-23 - EXHIBIT 23 - GP STRATEGIES CORP | exhibit2312312019.htm |
| EX-21 - EXHIBIT 21 - GP STRATEGIES CORP | exhibit2112312019.htm |
| EX-10.30 - EXHIBIT 10.30 - GP STRATEGIES CORP | exhibit1030formofperforman.htm |
| EX-10.29 - EXHIBIT 10.29 - GP STRATEGIES CORP | exhibit1029employmentagree.htm |
| EX-10.28 - EXHIBIT 10.28 - GP STRATEGIES CORP | exhibit1028employmentagree.htm |
| EX-10.27 - EXHIBIT 10.27 - GP STRATEGIES CORP | exhibit1027thirdamendmentt.htm |
| EX-4.1 - EXHIBIT 4.1 - GP STRATEGIES CORP | exhibit41descriptionofsecu.htm |
UNITED STATES
SECURITIES AND EXCHANGE COMMISSION
WASHINGTON, D.C. 20549
FORM 10-K
x Annual Report Pursuant to Section 13 or 15(d) of The Securities Exchange Act of 1934
For the fiscal year ended December 31, 2019
¨ Transition Report Pursuant to Section 13 or 15(d) of The Securities Exchange Act of 1934
For the transition period from to
Commission File Number 1-7234
GP STRATEGIES CORPORATION
(Exact name of Registrant as specified in its charter)
Delaware | 52-0845774 |
(State of Incorporation) | (I.R.S. Employer Identification No.) |
70 Corporate Center | |
11000 Broken Land Parkway, Suite 200, Columbia, MD | 21044 |
(Address of principal executive offices) | (Zip Code) |
(443) 367-9600
Registrant’s telephone number, including area code:
Securities registered pursuant to Section 12(b) of the Act:
Title of Each Class | Trading Symbol | Name of each exchange on which registered: |
Common Stock, $.01 par value | GPX | New York Stock Exchange, Inc. |
Securities registered pursuant to Section 12(g) of the Act: None
Indicate by check mark if the registrant is a well-known seasoned issuer, as defined in Rule 405 of the Securities Act. Yes ¨ No x
Indicate by check mark if the registrant is not required to file reports pursuant to Section 13 or 15(d) of the Act. Yes ¨ No x
Indicate by check mark whether the registrant (1) has filed all reports required to be filed by Section 13 or 15(d) of the Securities Exchange Act of 1934 during the preceding 12 months (or for such shorter period that the Registrant was required to file such reports), and (2) has been subject to such filing requirements for the past 90 days. Yes x No ¨
Indicate by check mark whether the registrant has submitted electronically and posted on its corporate Web site, if any, every Interactive Data File required to be submitted and posted pursuant to Rule 405 of Regulation S-T (§232.405 of this chapter) during the preceding 12 months (or for such shorter period that the registrant was required to submit and post such files). Yes x No ¨
Indicate by check mark if disclosure of delinquent filers pursuant to Item 405 of Regulation S-K is not contained herein, and will not be contained, to the best of registrant’s knowledge, in definitive proxy or information statements incorporated by reference in Part III of this Form 10-K or any amendment to this Form 10-K. ¨
Indicate by check mark whether the registrant is a large accelerated filer, an accelerated filer, a non-accelerated filer or a smaller reporting company. See the definitions of “large accelerated filer,” “accelerated filer” and “smaller reporting company” in Rule 12b-2 of the Exchange Act.
Large accelerated filer | ¨ | Accelerated filer | x | Non-accelerated filer | ¨ | Smaller reporting company | ¨ | Emerging growth company | ¨ |
If an emerging growth company, indicate by check mark if the registrant has elected not to use the extended transition period for complying with any new or revised financial accounting standards provided pursuant to Section 13(a) of the Exchange Act. ¨
Indicate by check mark whether the registrant is a shell company (as defined in Rule 12(b)-2 of the Exchange Act). Yes ¨ No x
The aggregate market value of the outstanding shares of the Registrant’s Common Stock, par value $.01 per share, held by non-affiliates as of June 30, 2019 was approximately $191,101,000.
The number of shares outstanding of the registrant’s Common Stock as of February 25, 2020:
Class | Outstanding | |
Common Stock, par value $.01 per share | 17,080,664 shares | |
Portions of the registrant’s definitive Proxy Statement for its 2020 Annual Meeting of Stockholders are incorporated herein by reference into Part III hereof.
Table of Contents
Page | ||
Cautionary Statement Regarding Forward-Looking Statements
This report contains forward-looking statements within the meaning of Section 27A of the Securities Act of 1933, as amended, and Section 21E of the Securities Exchange Act of 1934, as amended (the “Exchange Act”). The Private Securities Litigation Reform Act of 1995 provides a “safe harbor” for forward looking statements. Forward–looking statements are not statements of historical facts, but rather reflect our current expectations concerning future events and results. We use words such as “expects,” “intends,” “believes,” “may,” “will,” “should,” “could,” “anticipates,” “estimates,” “plans” and similar expressions to indicate forward-looking statements, but their absence does not mean a statement is not forward-looking. Because these forward-looking statements are based upon management’s expectations and assumptions and are subject to risks and uncertainties, there are important factors that could cause actual results to differ materially from those expressed or implied by these forward-looking statements, including, but not limited to, those factors set forth under Item 1A - Risk Factors and those other risks and uncertainties detailed in our periodic reports and registration statements filed with the Securities and Exchange Commission (“SEC”). We caution that these risk factors may not be exhaustive. We operate in a continually changing business environment, and new risk factors emerge from time to time. We cannot predict these new risk factors, nor can we assess the effect, if any, of the new risk factors on our business or the extent to which any factor or combination of factors may cause actual results to differ from those expressed or implied by these forward-looking statements.
If any one or more of these expectations and assumptions proves incorrect, actual results will likely differ materially from those contemplated by the forward-looking statements. Even if all of the foregoing assumptions and expectations prove correct, actual results may still differ materially from those expressed in the forward-looking statements as a result of factors we may not anticipate or that may be beyond our control. While we cannot assess the future impact that any of these differences could have on our business, financial condition, results of operations and cash flows or the market price of shares of our common stock, the differences could be significant. We do not undertake to update any forward-looking statements made by us, whether as a result of new information, future events or otherwise. You are cautioned not to unduly rely on such forward-looking statements when evaluating the information presented in this report.
Company Information Available on the Internet
Our Internet address is www.gpstrategies.com. We make available free of charge through our Internet site, our annual reports on Form 10-K; quarterly reports on Form 10-Q; current reports on Form 8-K; and any amendment to those reports filed or furnished pursuant to the Exchange Act as soon as reasonably practicable after such material is electronically filed with, or furnished to, the SEC.
PART I
Item 1: Business
Company Overview
GP Strategies Corporation, which is a New York Stock Exchange (“NYSE”) listed company traded under the symbol GPX, is a global performance improvement solutions provider of training, digital learning solutions, management consulting and engineering services. References in this report to “GP Strategies,” the “Company,” “we” and “our” are to GP Strategies Corporation and its subsidiaries, collectively.
We are a global performance improvement and learning solutions provider focused on improving the effectiveness of organizations by delivering innovative and superior training, consulting and business improvement services, customized to meet the specific needs of our clients. We also provide leadership development, sales training, platform adoption, management consulting, engineering and technical services, learning outsourcing and multimedia solutions which enhance our customized learning capabilities and diversify our service offerings. We have global execution capabilities and provide services to a large customer base across a broad range of industries in over 50 countries. We serve leading companies in the automotive, financial services and insurance, pharmaceutical, oil and gas, power, chemical, electronics and technology, manufacturing, software, retail, healthcare, education and food and beverage industries, as well as government agencies. We have over five decades of experience in developing solutions to optimize workforce performance by providing services and products to our clients that assist them in successfully aligning their employees, processes and technologies.
1
We have focused on building our custom performance improvement and learning business through internal growth and the acquisition of complementary businesses. Since 2006, we have completed over 30 acquisitions to strengthen our capabilities in specific training and technical service areas, expand our global presence, and increase our customer base and market sector reach. As a result, we’ve added product sales training and leadership training, and strengthened our digital learning and content development expertise, while also expanding further internationally. Our acquisitions have also expanded our market sector reach, added new customers and enhanced our service offerings through the addition of new complementary services. We also invested in global expansion through the establishment of over twenty new subsidiaries in select countries since 2013 to support new global outsourcing contracts. We believe our expanded infrastructure and the ability to deliver globally will allow us to better support our existing client base as well as win new business for our comprehensive service offerings.
In 2019, we divested certain non-core assets. We sold our tuition program management business on October 1, 2019 and our alternative fuels design and engineering business on January 1, 2020.
Operating Segments
As of December 31, 2019, we operated through two reportable business segments: (i) Workforce Excellence and (ii) Business Transformation Services. We are organized into two operating segments aligned by complementary service lines and supported by a business development organization aligned by industry sector. Our two segments each consist of two global practice areas which are focused on providing similar and/or complementary products and services across our diverse customer base and within targeted markets. Within each practice are various service lines having specific areas of expertise. Marketing and communications, sales, accounting, finance, legal, human resources, information systems and other administrative services are organized at the corporate level. Business development and sales resources are aligned by industry sector to support existing customer accounts and new customer development across both segments.
Workforce Excellence. The Workforce Excellence segment advises and partners with leading organizations in designing, implementing, operating and supporting their talent management and workforce strategies, enabling them to gain greater competitive edge in their markets. This segment consists of two practices:
• | Managed Learning Services - this practice focuses on creating value for our customers by delivering a suite of talent management and learning design, development, operational and support services that can be delivered as large scale outsourcing arrangements, managed services contracts and project-based service engagements. The Managed Learning Services offerings include strategic learning and development consulting services, digital learning content design and development solutions and a suite of managed learning operations services, including: managed facilitation and delivery, managed training administration and logistics, help desk support, event management and vendor management. |
• | Engineering & Technical Services - this practice focuses on capital intensive, inherently hazardous and/or highly complex technical services in support of both U.S. government and global commercial industries. Our products and services include design, development and delivery of technical work-based learning, CapEx (plant launch) initiatives, engineering design and construction management, fabrication, and management services, operational excellence consulting, chemical demilitarization services, homeland security services, emergency management support services along with all forms of technical documentation. We deliver world-class asset management and performance improvement consulting to a host of industries. Our proprietary EtaPRO® Performance and Condition Monitoring System provides a suite of real-time digital solutions for hundreds of facilities and is installed in power-generating units around the world. We also provide thousands of technical courses in a web-based off-the-shelf delivery format through our GPiLEARN+™ portal. |
Business Transformation Services. The Business Transformation Services segment works with organizations to execute complex business strategies by linking business systems, processes and workforce performance to clear and measurable results. We have a holistic methodology to establishing direction and closing the gap between strategy and execution. Our approach equips business leaders and teams with the tools and capability to deliver high-performance results. This segment consists of two practices:
• | Sales Enablement - this practice provides custom product sales training and service technical training, primarily to automotive manufacturers, designed to better educate customer salesforces as well as service technicians with respect to new product features and designs, in effect rapidly increasing the salesforce and technician knowledge base and enabling them to address retail customer needs. Furthermore, this segment helps our clients assess their customer relationship marketing strategy and connect with their customers on a one-to-one basis, including custom print and digital publications. We have been a custom product sales and service technical training provider and leader in serving manufacturing customers in the U.S. automotive industry for over 40 years. |
2
• | Organizational Development - this practice works with organizations to design and execute an integrated people performance system. This translates to helping organizations set strategy, carry that strategy through every level of the organization and ensure that their people have the right skills, knowledge, tools, processes and technology to enable transformation and achieve business results. Solutions include strategy, leadership, employee engagement and culture consulting, enterprise technology implementation and adoption solutions, and organization design and business performance consulting. |
Segment Financial Information
For financial information about our business segments and geographic operations and revenue, see Note 15 to the accompanying Consolidated Financial Statements.
Services and Products
Our personnel come from varied backgrounds in the corporate, technical, military and government arenas. They use their professional knowledge to create cost-effective solutions to address modern business and governmental performance challenges. Our training, consulting and engineering services and related product offerings are discussed in more detail below.
Training. We provide custom training services and products to support our customers’ existing operations, as well as the launch of new plants, products, equipment, technologies and processes. Our training services are comprehensive, covering all aspects of an organization's needs, including:
• | Content and Curriculum Development. Services include a fundamental analysis of the client’s needs, curriculum design, instructional material development (in hard copy, electronic/software or other format), information technology service support and delivery. Our instructional delivery capabilities include traditional classroom, structured on-the-job training (OJT), just-in-time methods, computer-based, web-based, video-based and the full spectrum of digital learning technologies. |
• | Digital Learning Solutions. As organizations become increasingly global and matrixed, single-source training solutions and learning interventions don't always fit every audience and business need. Learning and Development (L&D) teams must consider blended solutions that include a range of modalities and methodologies. In an increasingly digital world with evolving online learning and social platforms, bots, artificial intelligence and more, we have expertise to help organizations vet and select the right platforms to purchase, understand the best way to implement them and help teams adapt learning strategies and approaches to business problems and training requests in order to remain relevant and respond to disruption. |
• | Learning & Training Outsourcing. We offer a wide range of managed learning services, including design, delivery and global management of comprehensive learning programs for national and multinational businesses and government organizations. We can deliver our services individually or as a complete, integrated training solution. Solutions include the management of our customers’ training departments, as well as administrative processes, such as vendor management, call center/help desk administration and learning management system (LMS) administration. Our services encompass a wide spectrum of learning engagements ranging from focusing on a single aspect of a learning process to multi-year contracts where we manage the learning infrastructure of our customer. |
• | Documentation Development. Training-related documentation products include custom instructor and student training manuals, job aids to support technical skills development and instructional materials suitable for web-based and blended learning solutions. |
• | Specialized Training Areas. Our professionals possess diverse skills in multiple industries that enable us to address specialized training needs, including technical training, machine and equipment maintenance training, product sales training and incentive programs, leadership development training, regulatory training, environmental training and homeland security training. |
Consulting. Our consulting services include training-related consulting services as well as strategic business transformation and specialized consulting, including the areas of:
• | Business Transformation Consulting. We partner with organizations to bridge the gap between strategy development and execution by aligning their people, processes and technologies to business outcomes. |
3
• | Learning & Development Transformation Consulting. We work with organizations on their learning and development transformation encompassing strategy development, governance, and execution that align with their key performance objectives and business goals. |
• | Organization & Leadership Development. We recognize that true success occurs when all parts of the organization are aligned and prepared to tackle challenges in a unified manner. We work with organizations to design leadership development programs to serve the strategic and culture shifts their businesses need from their leaders. |
• | Change Management. We offer change-management strategies to help our customer's employees accept, adopt and perform in new ways and be open to change. |
• | Lean Enterprise. Our Lean and Six Sigma experts provide high-level lean enterprise consulting services, as well as training in the concept, methods and application of lean enterprise and other quality practices, organizational development and change management. |
• | Engineering. We provide engineering consulting services to support regulatory and environmental compliance, modification of facilities and processes, plant performance improvement, reliability-centered maintenance practices and plant start-up activities. |
• | Information Technology. Consulting services include IT consulting and platform adoption services, system selection consulting, operations continuity assessment, planning, training and procedure development. |
• | Customer Loyalty. Our Sales Enablement practice provides consultation on customer loyalty programs and supports those services with brand loyalty publications, incentive programs and customer-focused sales training. We develop personalized publications for automotive clients which establish a link between the manufacturer/dealer and each customer. |
• | Homeland Security and Emergency Management. We deliver consulting services from physical security assessments to all-hazards emergency planning and preparedness. These services include training, exercises and documentation. |
• | Maintenance & Reliability. We help manufacturers develop strategies, assessments and leadership alignment tactics for maintenance and reliability programs, as well as provide the training, management systems and documentation that support an enduring culture of waste elimination and variability reduction. |
Engineering and Technical Services. Our staff includes civil, mechanical and electrical engineers who are equipped to provide engineering, technical support services, consulting expertise, design capabilities and evaluation services. Our engineering customers typically operate in technically complex industries such as oil and gas, power, chemical, aerospace, transportation and manufacturing industries. Our engineering services support facilities, processes and systems in multiple capacities, including:
• | Power Plant Performance. We deliver multiple solutions to optimize power plant assets and mitigate risk. We have also developed proprietary products to support the power industry, including our EtaPRO® platform, a real-time software system for keeping equipment and facilities running efficiently and reliably through process anomaly detection, real-time KPI’s, and early warning of potential equipment failure. EtaPRO® is installed on over 570 GW of power generation world-wide. |
• | Technical Support. Services in this area include procedure writing and configuration control for capital intensive facilities, plant start-up assistance, logistics support (e.g., inventory management and control), implementation and engineering assistance for facility or process modifications, facility management for high technology training environments, staff augmentation and help-desk support for standard and customized client desktop applications. |
4
Competitive Strengths
We believe our key competitive strengths include:
Global Delivery and Single-Source Custom Training Solutions Provider. We believe we are one of the largest independent single-source custom training solutions providers with the capability of delivering globally in the markets in which we compete. We provide managed learning services solutions spanning the full life-cycle of the training process, including the management of training departments and administrative processes for our customers. We believe that the breadth of our service and product offerings, which encompass fully integrated managed learning services solutions as well as discrete services, allows us to better serve the needs of our clients by providing them with a single-source solution for custom training, consulting and technical and engineering services. We believe that the integration of our services into a single platform, together with our global presence and delivery capabilities, allows our customers to leverage an enterprise-wide solution to address their performance improvement needs in a way that streamlines their internal operations, improves the speed and efficiency at which critical know-how is disseminated on a firm-wide basis, and enables them to achieve their desired performance improvement goals.
Outstanding Reputation in the Industry. We have continued to build an outstanding reputation in the learning and training industry through the delivery of our solutions and have received numerous awards. 2019 highlights include:
Industry Awards
• | Training Industry, Inc., The Top Training Companies™ lists are developed based on extensive, proprietary research and analysis of companies around the world. They examine the capabilities, experience, and expertise of hundreds of learning organizations. In 2019, we appeared on the Top 20 lists in the following categories: Assessment & Evaluation, Content Development, Gamification, Health & Safety Training, IT Training, Leadership Training, Sales Training, and Training Outsourcing. |
• | Brandon Hall HCM Excellence recognizes the best organizations that have successfully deployed programs and strategies that have achieved measurable results. We received ten Brandon Hall Excellence in Learning Awards and one for Excellence in Learning Technology. |
• | Chief Learning Officer Learning in Practice recognizes industry leaders who have demonstrated excellence in the design and delivery of employee development programs. We won gold for excellence in technology innovation and silver for excellence in partnership. |
Customer Supplier Awards - GP Strategies has been recognized by two strategic clients with a prestigious Supplier of the Year Award, including:
• | AVANGRID - Recognized as a Supplier of the Year for Health and Safety. This award is given to suppliers that have shown commitment and have provided value to AVANGRID's strategic plan. |
• | General Motors - Recognizes GM’s best suppliers that have consistently exceeded GM’s expectation, creating outstanding value, or introducing innovations to the company. This is the third consecutive year GP Strategies has been recognized. |
Partner Awards - GP Strategies was presented with a Service Excellence award by one of our strategic partners, SAP. We won the Service Excellence category in the EMEA North Awards for partner excellence. The Service Excellence award recognizes SAP partners for their achievement in gaining solution certifications for their knowledge and expertise across all SAP Technologies.
Scalable Technology Platform. Our training programs are delivered both online and in classroom settings. We have the ability to work with outside information technology (IT) vendors in combination with our own proprietary software in order to deliver a scalable technology platform capable of addressing training needs of various size and commitment, ranging from a one-time project to a multi-year training program.
5
Legacy Technical Expertise. In the 1960’s, we began providing technical services to the U.S. Navy nuclear submarine program and the nuclear electric-power generation industry, and have since maintained and expanded our reputation for providing technically complex consulting, engineering, and training services. Many of our employees have engineering degrees, technical training or years of relevant technical industry experience. Through repeat projects with industry leaders we have acquired significant industry experience in providing highly technical consulting services. We believe that our technical expertise allows us to address market opportunities for complex business challenges that require in-depth expertise and certifications typically acquired over several years of specialized training and many years of experience. We also believe that our ability to provide both training-related and business consulting services allows us to gain insight into operations of our customers, understand the challenges they face and develop optimal solutions to meet these challenges. In addition, we believe that the knowledge that we develop while working with our clients provides us with a significant competitive advantage as those clients look to expand the scope of services outsourced to third party service providers.
Well Positioned to Capitalize on the Large Product Sales Training Market. We believe that the introduction of new products with advanced features, combined with the growing amount and accessibility of information available to consumers, requires companies to maintain a highly skilled and technologically current sales force to effectively capture customer interest and confidence. In-house implementation of product sales training programs can be expensive and time-consuming as these programs typically involve significant levels of face-to-face training, in some cases across a large global sales force. In addition, product sales training tends to be a continuous process, as the pace of new products and features in many cases requires year-round updating of the sales force. We believe we have one of the industry’s leading product sales training platforms, and are well positioned to benefit from increased training outsourcing as companies look for ways to reduce costs.
Highly Qualified and Dedicated Employees and Tenured Management Team. Our most important asset is our people, as their wide-ranging skill sets enable us to serve our diverse and expanding global client base. As a result, we are committed to the continued development of our employees. We offer our employees technical, functional, industry, managerial and leadership skill development and training throughout their careers with us. We seek to reinforce our employees’ commitment to our clients, culture and values through a comprehensive performance management system and a career philosophy that rewards both individual performance and teamwork. We also benefit from the skill and experience of our executive management team, who together have in excess of 100 years of experience in the training industry and have an average tenure with our company of over 20 years.
Contracts
We currently perform under fixed price (including fixed-fee per transaction), time-and-materials and cost-reimbursable contracts.
The following table illustrates the percentage of our total revenue attributable to each type of contract for the year ended December 31, 2019:
Fixed fee per transaction | 54 | % |
Fixed price | 20 | |
Time-and-materials, including fixed rate | 23 | |
Cost-reimbursable | 3 | |
Total revenue | 100 | % |
Fixed price contracts (including fixed-fee per transaction) provide for payment to us of pre-determined amounts as compensation for the delivery of specific products or services, without regard to the actual costs incurred. We bear the risk that increased or unexpected costs required to perform the specified services may reduce our profit or cause us to sustain a loss, but we have the opportunity to derive increased profit if the costs required to perform the specified services are less than expected. Fixed price contracts generally permit the client to terminate the contract on written notice; in the event of such termination we would typically be paid a proportionate amount of the fixed price.
Time-and-materials contracts generally provide for billing of services based upon the hourly billing rates of the employees performing the services and the actual expenses incurred multiplied by a specified mark-up factor up to a certain aggregate dollar amount. Our time-and-materials contracts include certain contracts under which we have agreed to provide training, engineering and technical services at fixed hourly rates. Time-and-materials contracts generally permit the client to control the amount, type and timing of the services to be performed by us and to terminate the contract on written notice. If a contract is terminated, we are typically paid for the services we have provided through the date of termination.
6
Cost-reimbursable contracts provide for us to be reimbursed for our actual direct and indirect costs plus a fee. These contracts also are generally subject to termination at the convenience of the client. If a contract is terminated, we are typically reimbursed for our costs through the date of termination, plus the cost of an orderly termination, and paid a proportionate amount of the fee.
International
We conduct our business globally and outside the United States primarily through our wholly owned subsidiaries. We may continue to create new subsidiaries as our business expands. Through these subsidiaries, we are capable of providing substantially the same services and products as are available to clients in the United States, although modified as appropriate to address the language, business practices and cultural factors unique to each client and country. In combination with our subsidiaries, we are able to coordinate the delivery to multi-national clients of services and products that achieve consistency on a global, enterprise-wide basis. Revenue from operations outside the United States represented approximately 36% and 33% of our consolidated revenue for the years ended December 31, 2019 and 2018, respectively (see Note 15 to the accompanying Consolidated Financial Statements).
Customers
During 2019, we provided services to over 500 customers. Significant customers include multinational automotive manufacturers, such as General Motors Company, Hyundai Motor Company, Ford Motor Company and Fiat Chrysler; financial services companies such as HSBC, Bank of America, SunTrust Banks and PNC Bank; governmental agencies, such as the U.S. Department of Defense, U.S. Department of Commerce, U.S. Department of Health and Human Services and the Skills Funding Agency in the United Kingdom; U.S. Government prime contractors, such as Lockheed Martin, Bechtel National, Inc. and General Dynamics; commercial electric power utilities, such as Eskom, Entergy and National Grid; pharmaceutical companies, such as Novartis AG, Bristol-Myers Squibb, Merck & Co. and Pfizer; and other large multinational companies, such as Microsoft, CIGNA Corporation, Rockwell Automation, Deere & Company, and Boeing. During the year ended December 31, 2019, we provided services to 148 customers in the Fortune 500 and 124 customers in the Global Fortune 500.
We have a market concentration of revenue in both the automotive sector and the financial & insurance sector. Revenue from the automotive industry accounted for approximately 28%, 23% and 22% of our consolidated revenue for the years ended December 31, 2019, 2018 and 2017, respectively. In addition, we have a concentration of revenue from a single automotive customer, which accounted for approximately 13%, 14% and 13% of our consolidated revenue for the years ended December 31, 2019, 2018 and 2017, respectively. As of December 31, 2019 accounts receivable from a single automotive customer totaled $17.2 million, or 13% of our consolidated accounts receivable balance. Revenue from the financial & insurance industry accounted for approximately 16%, 19% and 20% of our consolidated revenue for the years ended December 31, 2019, 2018 and 2017, respectively. In addition, we have a concentration of revenue from a single financial services customer, which accounted for approximately 10%, 13% and 14% of our consolidated revenue for the years ended December 31, 2019, 2018 and 2017, respectively. As of December 31, 2019, billed and unbilled accounts receivable from a single financial services customer totaled $15.4 million, or 8%, of our consolidated accounts receivable and unbilled revenue balances. No other single customer accounted for more than 10% of our consolidated revenue in 2019 or consolidated accounts receivable balance as of December 31, 2019.
We believe the nature of our business, which includes established relationships with our clients, provides us with a platform from which to drive revenues and gives us visibility into our future performance. We have long-standing relationships with many of our clients, with over 80% of our top 25 clients having used our services for five or more years. Additionally, over 90% of our annual revenue is generated from client relationships that existed in the prior year. We also had a backlog for services under executed contracts of $349.8 million as of December 31, 2019.
Employees
Our principal resource is our personnel. As of December 31, 2019, we had 4,856 employees. We also utilize additional adjunct instructors and consultants as needed. Our future success depends to a significant degree upon our ability to continue to attract, retain and integrate into our operations instructors, engineers, technical personnel and consultants who possess the skills and experience required to meet the needs of our clients.
We utilize a variety of methods to attract and retain personnel. We believe that the compensation and benefits offered to our employees are competitive with the compensation and benefits available from other organizations with which we compete for personnel. In addition, we encourage the professional development of our employees, both internally via GP University (our own
7
internal training resource) and through third parties, and we also offer tuition reimbursement for job-related educational costs. We believe that we have good relations with our employees.
Competition
We face a highly competitive environment. The principal competitive factors are the experience and capability of service personnel, performance, quality and functionality of products, reputation and price. The training industry is large, highly fragmented and competitive, with low barriers to entry and no single competitor accounting for a significant market share. According to Training Industry, Inc., global external training expenditures totaled approximately $99.7 billion in 2019. Our competitors include several large publicly traded and privately held companies, vocational and technical training schools, degree-granting colleges and universities, continuing education programs and thousands of small privately held training providers and individuals. In addition, many of our clients maintain internal training departments, which have the resources and ability to provide the same or similar services in-house. Some of our competitors offer services and products at lower prices, and some competitors have significantly greater financial, managerial, technical, marketing and other resources. Moreover, we expect to face additional competition from new entrants into the training and performance improvement market due, in part, to the evolving nature of the market and the relatively low barriers to entry. There can be no assurance that we will be successful against such competition.
Engineering and consulting services such as those that we provide are performed by many of the customers themselves, large architectural and engineering firms that have expanded their range of services beyond design and construction activities, large consulting firms, information technology companies, major suppliers of equipment and individuals and independent service companies similar to us. The engineering and construction markets are highly competitive and require substantial resources and capital investment in equipment, technology and skilled personnel. Many of our competitors for our engineering and technical consulting services have greater financial resources than we do. Competition also places downward pressure on our contract prices and profit margins. We cannot provide any assurance that we will be able to compete successfully, and the failure to do so could adversely affect our business and financial condition.
Sales & Marketing
In 2018, sales, marketing and proposal resources were centralized to better position ourselves to achieve the growth goals of the organization. We operate as an integrated, customer-centric team to ensure our go-to-customer strategy directly supports the business strategy. We use our online digital presence, attendance at trade shows, presentations at industry and trade association conferences, press releases, industry award submissions, webinars and workshops given by our personnel to serve important marketing functions. We also carry out selective print and digital advertising and conduct targeted marketing campaigns to current and prospective clients. In addition, we use our social media channels, such as LinkedIn, Facebook, Twitter, YouTube, SlideShare and a Company blog on our website, as a means of sharing thought leadership content, disclosing information about the Company, our services and other topics important to our clients. By staying ahead of the market trends and engaging with clients, we are able to identify possible opportunities to expand the services we are providing them as well as extend the current services we are providing. In other cases, clients ask us to bid competitively. In both cases, we submit proposals to the client for evaluation. The period between submission of a proposal to final award can range from 30 days or less (generally for noncompetitive, short-term contracts), to a year or more (generally for large, competitive multi-year contracts).
Backlog
Our backlog for services under executed contracts and subcontracts was approximately $349.8 million and $318.0 million as of December 31, 2019 and 2018, respectively. We anticipate that approximately 85 percent of our backlog as of December 31, 2019 will be recognized as revenue during 2020. However, the rate at which services are performed under certain contracts, and thus the rate at which backlog will be recognized, may be at the discretion of the client and most contracts are, as mentioned above, subject to termination by the client upon written notice.
8
Item 1A: Risk Factors
The following are some of the factors that we believe could cause our actual results to differ materially from historical results and from the results contemplated by the forward-looking statements contained in this report and other public statements made by us. Additional risks and uncertainties not presently known to us, or that we currently see as immaterial, may also harm our business. Most of these risks are generally beyond our control. If any of the risks or uncertainties described below, or any such additional risks and uncertainties actually occur, our business, results of operations and financial condition could be materially and adversely affected.
Changing economic conditions in the United States, the United Kingdom and the other countries in which we conduct our operations could harm our business, results of operations and financial condition.
Our revenues and profitability are related to general levels of economic activity and employment primarily in the United States and the United Kingdom. As a result, economic recession in both of those countries could harm our business and financial condition. A significant portion of our revenues is derived from Fortune 500 companies and their global equivalents, which historically have decreased expenditures for external training during economic downturns. If the economies in which these companies operate are weakened in any future period, these companies may reduce their expenditures on external training, and other products and services supplied by us, which could materially and adversely affect our business, results of operations and financial condition. As we expand our business globally, we might be subject to additional risks associated with economic conditions in the countries into which we enter or in which we expand our operations. There is significant uncertainty about the economic effect of the U.K.’s formal departure from the European Union on January 31, 2020, subject to a transition period expected to last until December 31, 2020. See “The United Kingdom’s withdrawal from the EU may adversely impact our operations in the United Kingdom and elsewhere.”
Our revenue and financial condition could be adversely affected by the loss of business from significant customers, including financial services institutions and automotive manufacturers.
During the years ended December 31, 2019, 2018 and 2017, revenue from our customers in the financial services & insurance sector accounted for approximately 16%, 19% and 20%, respectively, of our consolidated revenue. In addition, we have a concentration of revenue from a single financial services customer, which accounted for approximately 10%, 13% and 14% of our consolidated revenue for the years ended December 31, 2019, 2018 and 2017, respectively. As of December 31, 2019, billed and unbilled accounts receivable from this customer totaled $15.4 million, or 8%, of our consolidated accounts receivable and unbilled revenue balances. A default in payment from this client or a decline in the volume of business from this client and other major financial services customers could adversely affect our business and financial condition.
During the years ended December 31, 2019, 2018 and 2017, revenue from our customers in the automotive industry accounted for approximately 28%, 23% and 22%, respectively, of our consolidated revenue. In addition, we have a concentration of revenue from a single automotive customer, which accounted for approximately 13%, 14% and 13% of our consolidated revenue for the years ended December 31, 2019, 2018 and 2017, respectively. As of December 31, 2019, accounts receivable from a single automotive customer totaled $17.2 million, or 13% of our consolidated accounts receivable balance. Historically, U.S. auto manufacturers have been negatively impacted during times of economic downturns and recession, resulting in significant reductions in vehicle sales requiring the auto manufacturers to cut costs. A decline in the volume of business from automotive customers could adversely affect our business and financial condition.
Substantially all of our contracts are subject to termination on written notice and, therefore, our operations are dependent upon our customers’ continued satisfaction with our services and their continued inability or unwillingness to perform those services themselves or to engage other third-parties to deliver such services.
9
Our successful performance of learning services under our Global Master Agreement with HSBC is subject to many risks.
On July 2, 2013, we entered into an agreement (the “Global Master Agreement”) with HSBC Holdings plc (“HSBC”) to provide global learning services. The Global Master Agreement, as originally written and as amended and restated in 2017, established a contractual framework pursuant to which we and certain of our wholly owned subsidiaries entered into local services agreements with certain members of HSBC’s group of companies in respect of countries in which the learning services have been provided by us. The initial term of the Global Master Agreement was three years. In January 2016, we announced that HSBC exercised its option to extend the Global Master Agreement for two additional years, which extended the contract to July 2018. Effective February 23, 2018, the Global Master Agreement was extended to July 2019. On November 6, 2018, we entered into an amended and restated Global Master Agreement with HSBC. The initial term of the Global Master Agreement, as amended and restated, is approximately three years, two months. HSBC has the right to extend the Global Master Agreement for one additional two-year term. The Global Master Agreement fixes the billing rates to be charged for most services to be provided by us for the initial term (years one to three) and the first year of the option term (year four). During the second year of the option term (year five), any increases in billing rates are restricted by reference to the level of indexation set out in the relevant local services agreement.
The Global Master Agreement includes certain minimum service level requirements that we must meet or exceed. If we fail to meet a given performance standard, HSBC will, in certain circumstances, receive a credit against the charges otherwise due.
Additionally, HSBC has the right to periodically engage a third party to perform benchmark studies to determine whether our services, the level and quality to which our services are being provided and the applicable charges under the Global Master Agreement are within the top quartile for best-value-for-money for comparable services provided by our competitors. If the benchmark report states that any benchmarked service is not within the top quartile for best-value-for-money for services comparable to our benchmarked services etc., then we must implement changes as soon as reasonably practicable.
HSBC has the right to terminate the Global Master Agreement and the relevant HSBC contracting party has the right to terminate any local services agreement to which it is a party, in whole or in part, for, among other things, convenience on three months’ written notice.
Our successful performance of the Global Master Agreement and the associated local services agreements, is subject to many risks, including the effect(s) that fixed prices for four years, the indexation of rates, the service level credits and the benchmarking requirements may have on our ability to perform services in a profitable manner; additional currency exchange rate exposure; local tax requirements and our need to concurrently maintain reliable payroll, accounting, purchasing, tax management, employment practices, project management, asset management and information technology infrastructure in many countries.
The price of our common stock is highly volatile and could decline regardless of our operating performance.
The market price of our common stock could fluctuate in response to, among other things:
• | changes in economic and general market conditions; |
• | changes in the outlook and financial condition of certain of our significant customers and industries in which we have a concentration of business; |
• | changes in financial estimates, treatment of our tax assets or liabilities or investment recommendations by securities analysts following our business; |
• | changes in accounting standards, policies, guidance, interpretations or principles; |
• | sales of common stock by our directors, officers and significant stockholders; |
• | factors affecting securities of companies included in the Russell 2000R Index, in which our common stock is included; |
• | our failure to achieve operating results consistent with securities analysts’ projections; and |
• | the operating and stock price performance of competitors. |
These factors might adversely affect the trading price of our common stock and prevent you from selling your common stock at or above the price at which you purchased it. In addition, in recent periods, the stock market has experienced significant price and volume fluctuations. This volatility has had a significant impact on the market price of securities issued by many companies, including ours and others in our industry. These changes can occur without regard to the operating performance of the affected companies. As a result, the price of our common stock could fluctuate based upon factors that have little or nothing to do with our company, and these fluctuations could materially reduce our share price.
10
A substantial portion of our assets consists of goodwill and intangible assets, which are subject to impairment. We could incur material asset impairment charges in future periods.
Our acquisitions in recent years have not involved the acquisition of significant tangible assets and, as a result, a significant portion of the purchase price in each case was allocated to goodwill and other intangible assets. As of December 31, 2019, we had goodwill of $171.6 million and other intangible assets of $16.3 million in connection with acquisitions. In accordance with U.S. GAAP, goodwill is reviewed annually for impairment unless circumstances or events indicate that an impairment test should be performed sooner to determine if there has been any impairment to value. The review for impairment is based on several factors requiring judgment. A decrease in expected cash flows, change in market conditions, or a material decline in our stock price, among other things, may indicate potential impairment of recorded goodwill.
We tested our goodwill at the reporting unit level as of October 1, 2019 and 2018 and there was no indication of impairment. Each of our reporting units had a significant excess fair value over its respective carrying value, with the exception of the Organizational Development reporting unit which had a fair value that exceeded its carrying value by 11% as of the October 1, 2019 testing date. The Organizational Development reporting unit has a significant amount of goodwill attributable to previously completed acquisitions. If it fails to meet its financial projections, or if other adverse market conditions occur (such as a sustained material decrease in our stock price) which would lower the fair value of the business, we could incur material goodwill and other intangible asset impairment charges in the future. We will continue to test for impairment on an annual basis or on an interim basis if events and circumstances indicate a possible impairment.
Our financial results are subject to quarterly fluctuations, which may result in volatility or declines in our stock price.
We experience, and expect to continue to experience, fluctuations in quarterly operating results. Consequently, you should not deem our results for any particular quarter to be necessarily indicative of future results. Factors that may affect quarterly operating results in the future include:
• | the overall level of services and products sold; |
• | the volume of publications shipped by our Sales Enablement practice each quarter, because revenue and cost of publications contracts are recognized in the quarter during which the publications ship; |
• | fluctuations in project profitability; |
• | the gain or loss of material clients; |
• | the timing, structure and magnitude of acquisitions; |
• | participant training volume and general levels of outsourcing demand from clients in the industries that we serve; |
• | the budget and purchasing cycles of our clients, especially of the governments and government agencies that we serve; |
• | the commencement or completion of client engagements or services and products in a particular quarter; |
• | currency fluctuations; and |
• | the general level of economic activity. |
Accordingly, it is difficult for us to forecast our growth and results of operations on a quarterly basis. If we fail to meet expectations of investors or analysts, our stock price may fall rapidly and without notice. Furthermore, the fluctuation of quarterly operating results may render less meaningful period-to-period comparisons of our operating results.
Sagard Capital Partners, L.P. (“Sagard”) may exert influence over us and could delay or deter a change of control or other business combination or otherwise cause us to take actions with which other stockholders may disagree.
As of December 31, 2019, Sagard beneficially owned 3,639,367 shares or 21.4% of our outstanding common stock. In addition, until Sagard owns less than certain specified amounts of common stock or certain other conditions have been met, Sagard is entitled to designate an individual to serve on our board of directors. As a result, Sagard may exert influence over our decision to enter into any corporate transaction or with respect to any transaction that requires the approval of stockholders, regardless of whether other stockholders believe that the transaction is in their own best interests. This could have the effect of delaying, deterring or preventing a change of control or other business combination that might otherwise be beneficial to our stockholders.
11
We are vulnerable to the cyclical nature of the markets we serve.
The demand for our services and products is dependent upon training and marketing budgets and the existence of projects with training, engineering, procurement, construction or management needs. Although downturns can impact our entire business, the automotive, financial and insurance, manufacturing, electronics and semiconductors, construction, alternative fuels and energy industries are examples of sectors that are cyclical in nature and have been affected from time to time by fluctuations in either national or worldwide demand for our services. Industries such as these and many of the others we serve have historically been and might continue to be vulnerable to general downturns and are and might continue to be cyclical in nature. During economic downturns, our clients might demand better terms. In addition, many of our training contracts are subject to modification in the event of certain material changes in the business or demand for our services. Our government clients also might face budget deficits that prohibit them from funding proposed and existing projects. As a result, our past results have varied considerably and could continue to vary depending upon the demand for future projects in the industries that we serve.
We may continue making acquisitions as part of our growth strategy, which subjects us to numerous risks that could have a material adverse effect on our business, financial condition and results of operations.
As part of our growth strategy, we may continue to pursue selective acquisitions of businesses that broaden our service and product offerings, deepen our capabilities and allow us to enter attractive new domestic and international markets. Pursuit of acquisitions exposes us to many risks, including that:
• | acquisitions may require significant capital resources and divert management’s attention from our existing business; |
• | acquisitions may not provide the benefits anticipated; |
• | acquisitions could subject us to contingent or other liabilities, including liabilities arising from events or conduct predating the acquisition of a business that were not known to us at the time of the acquisition; |
• | we may incur significantly greater expenditures in integrating an acquired business than had been initially anticipated; |
• | acquisitions may create unanticipated tax and accounting problems; and |
• | acquisitions may result in a material weakness in our internal controls if we are not able to successfully establish and implement proper controls and procedures for the acquired business. |
Our failure to successfully accomplish future acquisitions or to manage and integrate completed or future acquisitions could have a material adverse effect on our business, financial condition or results of operations. We can provide no assurances that we:
• | will identify suitable acquisition candidates; |
• | can consummate acquisitions on acceptable terms; |
• | can successfully compete for acquisition candidates against larger companies with significantly greater resources; |
• | can successfully integrate any acquired business into our operations or successfully manage the operations of any acquired business; or |
• | will be able to retain an acquired company’s significant client relationships, goodwill and key personnel or otherwise realize the intended benefits of any acquisition. |
In addition, acquisitions might involve our entry into new businesses that might not be as profitable as we expect. We can provide no assurances that our expectations regarding the profitability of future acquisitions will prove to be accurate. Acquisitions might also increase our exposure to the risks inherent in certain markets or industries.
As a result of completed and possible future acquisitions, our past performance is not indicative of future performance, and investors should not base their expectations as to our future performance on our historical results.
Future acquisitions may require that we incur debt or issue dilutive equity.
Future acquisitions may require us to incur additional debt, under our existing credit facility or otherwise, or issue equity, resulting in additional leverage or dilution of ownership.
12
Difficulties in integrating acquired businesses could result in reduced revenues and income.
We might not be able to integrate successfully any business we have acquired or could acquire in the future. The integration of the businesses could be complex and time consuming and will place a significant strain on our management, administrative services personnel and information systems. This strain could disrupt our business. Furthermore, we could be adversely impacted by liabilities of acquired businesses. We could encounter substantial difficulties, costs and delays involved in integrating common accounting, information and communication systems, operating procedures, internal controls and human resources practices, including incompatibility of business cultures and the loss of key employees and customers. Also, depending on the type of acquisition, a key element of our strategy may include retaining management and key personnel of the acquired business to operate the acquired business for us. Our inability to retain these individuals could materially impair the value of an acquired business. In addition, small businesses acquired by us may have greater difficulty competing for new work as a result of being part of our larger entity. These difficulties could reduce our ability to gain customers or retain existing customers, and could increase operating expenses, resulting in reduced revenues and income and a failure to realize the anticipated benefits of acquisitions.
Our leverage could adversely affect our financial condition or operating flexibility if we fail to comply with certain covenants under the Credit Agreement.
Our Credit Agreement contains operating covenants that may, subject to exceptions, limit our ability and the ability of our subsidiaries to, among other things:
• | create, incur or assume certain liens; |
• | make certain restricted payments, investments and loans; |
• | create, incur or assume additional indebtedness or guarantees; |
• | create restrictions on the payment of dividends or other distributions to us from our restricted subsidiaries; |
• | engage in M&A transactions, consolidations, sale-leasebacks, joint ventures, and asset and security sales and dispositions; |
• | pay dividends or redeem or repurchase our capital stock; |
• | alter the business that we and our subsidiaries conduct; |
• | engage in certain transactions with affiliates; |
• | modify the terms of certain indebtedness; |
• | prepay, redeem or purchase certain indebtedness; and |
• | make material changes to accounting and reporting practices. |
In addition, the Credit Agreement includes a financial covenant that requires us not to exceed a maximum consolidated leverage ratio (the ratio of funded debt to Consolidated EBITDA, as defined in the Credit Agreement). Operating results below a certain level or other adverse factors, including a significant increase in interest rates, could result in us being unable to comply with certain covenants. If we violate any applicable covenants and are unable to obtain waivers, our agreements governing our indebtedness or other applicable agreement could be declared in default and could be accelerated, which could permit, in the case of secured debt, the lenders to foreclose on our assets securing the debt thereunder. If the indebtedness is accelerated, we may not be able to repay our debt or borrow sufficient funds to refinance it. Even if we are able to obtain new financing, it may not be on commercially reasonable terms or on terms that are acceptable to us. If our debt is in default for any reason, our cash flows, financial results or financial condition could be materially and adversely affected. In addition, complying with these covenants may make it more difficult for us to successfully execute our business strategy and compete against companies that are not subject to such restrictions.
Our business and financial condition could be adversely affected by government limitations on contractor profitability.
A significant portion of our revenue and profit is derived from contracts with the U.S. Government and subcontracts with prime contractors of the U.S. Government. The U.S. Government places limitations on contractor profitability; therefore, government-related contracts might have lower profit margins than the contracts we enter into with commercial customers.
A negative audit or other actions by the U.S. Government could adversely affect our future operating performance.
As a U.S. Government contractor, we must comply with laws and regulations relating to U.S. Government contracts and are subject to an increased risk of investigations, criminal prosecution, civil fraud, whistleblower lawsuits and other legal actions and liabilities to which companies with solely commercial customers are not subject. We are subject to audit and investigation by the Defense Contract Audit Agency ("DCAA") and other government agencies with respect to our compliance with federal laws, regulations
13
and standards. These audits may occur several years after the period to which the audit relates. The DCAA, in particular, also reviews the adequacy of, and our compliance with, our internal control systems and policies, including our purchasing, property, estimating, compensation and management information systems. Any payments received by us from the U.S. Government for allowable direct and indirect costs are subject to adjustment after audit by government auditors and repayment to the government if the payments exceed allowable costs as defined in the government contracts, which could result in a material adjustment of the payments received by us under such contracts. In addition, any costs found to be improperly allocated to a specific contract will not be reimbursed. If we are found to be in violation of the law, we may be subject to civil or criminal penalties or administrative sanctions, including contract termination, the assessment of penalties and suspension or debarment from doing business with U.S. Government agencies. For example, many of the contracts we perform for the U.S. Government are subject to the Service Contract Act, which requires hourly employees to be paid certain specified wages and benefits. If the Department of Labor determines that we violated the Service Contract Act or its implementing regulations, we could be suspended for a period of time from winning new government contracts or renewals of existing contracts, which could materially and adversely affect our future operating performance.
Furthermore, our reputation could suffer serious harm if allegations of impropriety were made against us. If we are suspended or prohibited from contracting with the U.S. Government, or any significant U.S. Government agency, if our reputation or relationship with U.S. Government agencies becomes impaired or if the U.S. Government otherwise ceases doing business with us or significantly decreases the amount of business it does with us, it could materially and adversely affect our operating performance and could result in additional expenses and a loss of revenue.
We are a party to fixed price contracts and may enter into similar contracts in the future, which could result in reduced profits or losses if we are not able to accurately estimate or control costs or meet specific service levels.
A significant portion of our revenue is attributable to contracts entered into on a fixed price basis, which allows us to benefit from cost savings, but we carry the burden of cost overruns. If our initial estimates are incorrect, or if unanticipated circumstances arise, we could experience cost overruns which would result in reduced profits or even result in losses on these contracts. Our financial condition is dependent upon our ability to maximize our earnings from our contracts. Lower earnings or losses caused by cost overruns could have a negative impact on our financial results.
Under time and materials contracts, we are paid for labor at negotiated hourly billing rates and for certain expenses. Under cost-reimbursable contracts, which are subject to a contract ceiling amount, we are reimbursed for allowable costs and paid a fee, which may be fixed or performance based. However, if costs exceed the contract ceiling or are not allowable under the provisions of the contract or applicable regulations, we may not be able to obtain reimbursement for all such costs.
Our inability to successfully estimate and manage costs on each of these contract types may materially and adversely affect our financial condition. Cost overruns also may adversely affect our ability to sustain existing programs and obtain future contract awards.
Also, many of our contracts include clauses that tie our compensation to the achievement of agreed-upon performance standards. If we fail to satisfy these measures, it could significantly reduce or eliminate our fees under the contracts. Clients also often have the right to terminate a contract and pursue damage claims under the contract for serious or repeated failure to meet these service commitments. These provisions could increase the variability in revenues and margins earned on those contracts.
Our revenues may be adversely affected if we fail to win competitively awarded contracts or to receive renewal or follow-on contracts.
We obtain many of our significant contracts through a competitive bidding process. Competitive bidding presents a number of risks, including, without limitation:
• | the need to compete against companies or teams of companies that may have more financial and marketing resources and more experience in bidding on and performing major contracts than we have; |
• | the need to compete against companies or teams of companies that may be long-term, entrenched incumbents for a particular contract for which we are competing; |
• | the need to compete to retain existing contracts that have in the past been awarded to us; |
• | the expense and delay that may arise if our competitors protest or challenge new contract awards; |
• | the need to submit proposals for scopes of work in advance of the completion of their design, which may result in unforeseen cost overruns; |
14
• | the substantial cost and managerial time and effort, including design, development and marketing activities necessary to prepare bids and proposals for contracts that we may not win; |
• | the need to develop, introduce and implement new and enhanced solutions to our customers’ needs; |
• | the need to locate and contract with teaming partners and subcontractors; and |
• | the need to accurately estimate the resources and costs that will be required to perform over the term of the contract and any extension periods for any fixed price or fixed rate contract that we win. |
There are no assurances that we will continue to win competitively awarded contracts or to receive renewal or follow-on contracts. Renewal and follow-on contracts are important because our contracts are for fixed terms. These terms vary from shorter than one year to over five years, particularly for contracts with extension options. The loss of revenues from our failure to win competitively awarded contracts or to obtain renewal or follow-on contracts may be significant because competitively awarded contracts account for a substantial portion of our sales.
Our backlog is subject to reduction and cancellation, which could negatively impact our future revenues or earnings.
Our backlog for services under executed contracts (including subcontracts and purchase orders) was approximately $349.8 million, $318.0 million and $268.6 million as of December 31, 2019, 2018 and 2017, respectively. There can be no assurance that the revenues projected in our backlog will be realized or, if realized, will result in profits. Further, contract terminations or reductions in the original scope of contracts reflected in our backlog might occur at any time as discussed below in more detail.
Our backlog consists of projects for which we have signed contracts from customers. The rate at which services are performed under contracts, and thus the rate at which backlog will be recognized, may be at the discretion of the client. We cannot predict with certainty when or if backlog will be performed. In addition, even where a project proceeds as scheduled, it is possible that customers could default or otherwise fail to pay amounts owed to us. Material delays, terminations or payment defaults under contracts included in our backlog could have a material adverse effect on our business, results of operations and financial condition.
In addition, most of our contracts are subject to termination by the client upon written notice. Reductions in our backlog due to termination by a customer or for other reasons could materially and adversely affect the revenues and earnings we actually receive from contracts included in our backlog. If we experience terminations of significant contracts or significant scope adjustments to contracts reflected in our backlog, our financial condition, results of operations, and cash flow could be materially and adversely impacted.
We rely on third parties, including subcontractors, suppliers, teaming partners, software vendors and others to deliver the services we must provide to our customers and to operate our business, and disputes with or the failure to perform satisfactorily of such a third party could materially and adversely affect our performance, our ability to obtain future work, and our ability to manage our business effectively.
Many of our contracts involve subcontracts or agreements with other companies upon which we rely to perform a portion of the services or products we must provide to our customers. We also rely on third parties to provide us services and products we use for other functions in the operation of our business. There is a risk that we may have disputes with these third parties, including disputes regarding the quality and timeliness of services or work provided by the third party. A failure by one or more of third parties on whom we rely to satisfactorily provide, on a timely basis, the agreed upon services or products may materially and adversely impact our ability to perform our obligations to our customer or effectively operate our business. Third party performance deficiencies could expose us to liability and have a material adverse effect on our results of operations.
Also, from time to time we have entered, and expect to continue to enter, into joint venture, teaming and other similar arrangements which involve risks and uncertainties. These risks and uncertainties could result in reduced profits or, in some cases, significant losses for us with respect to the joint venture, teaming and other similar arrangements.
We maintain a workforce based upon anticipated staffing needs. If we do not receive future contract awards or if these awards are delayed or reduced in scope or funding, we could incur significant costs.
Our estimates of future staffing requirements depend in part on the timing of new contract awards. We make our estimates in good faith, but our estimates could be inaccurate or change based upon new information. In the case of larger projects, it is particularly difficult to predict whether we will receive a contract award and when the award will be announced. In some cases the contracts that are awarded require staffing levels that are different, sometimes lower, than the levels anticipated when the work was proposed. The uncertainty of contract award timing and changes in scope or funding can present difficulties in matching our workforce size
15
with our contract needs. If an expected contract award is delayed or not received, or if a contract is awarded for a smaller scope of work than proposed, we could incur significant costs associated with making or failing to make reductions in staff.
Failure to continue to attract and retain qualified personnel could harm our business.
Our principal resource is our personnel. A significant portion of our revenue is derived from services and products that are delivered by instructors, engineers, technical personnel and consultants. Our consulting, technical training and engineering services require the employment of individuals with specific skills, training, licensure and backgrounds. An inability to hire or maintain employees with the required skills, training, licensure or backgrounds could have a material adverse effect on our ability to provide quality services, to expand the scope of our service offerings or to attract or retain customers or to accept contracts, which could negatively impact our business and financial condition. In order to initiate and develop client relationships and execute our growth strategy, we must continue to hire and maintain qualified salespeople. We must also continue to attract and develop capable management personnel to guide our business and supervise the use of our resources.
Similarly, our U.S. Government contracts require employment of individuals with specified skills, work experience, licensures, security clearances and backgrounds. An inability to hire or maintain employees with the required skills, work experience, licensure, security clearances or backgrounds could have a material adverse effect on our ability to win new contracts or satisfy existing contractual obligations, and could result in additional expenses or possible loss of revenue.
Competition for qualified personnel can be intense. We cannot assure you that qualified personnel will continue to be available to us or will be available to us when our needs arise or on terms favorable to us. Any failure to attract or retain qualified instructors, engineers, technical personnel, consultants, salespeople and managers in sufficient numbers could have a material adverse effect on our business and financial condition.
The loss of our key personnel, including our executive management team, could harm our business.
Our success is largely dependent upon the experience and continued services of our executive management team and our other key personnel. The loss of one or more of our key personnel and a failure to attract, develop or promote suitable replacements for them could materially and adversely affect our business, results of operation or financial condition. Since 2017, we have had significant changes in our executive management team. In 2017, our President indicated an intention to leave in 2019 and in November 2017 we promoted one of our senior vice presidents to be our new President. We also removed two Executive Vice Presidents who each had led one of our business segments, hired a new Chief Sales Officer, replaced our Chief Financial Officer and reorganized our business from four into two segments effective January 1, 2018.
Competition could materially and adversely affect our performance.
The training industry is highly fragmented and competitive, with low barriers to entry and no single competitor accounting for a significant market share. Our competitors include divisions of several large publicly traded and privately held companies, vocational and technical training schools, degree-granting colleges and universities, continuing education programs and thousands of small privately held training providers and individuals. In addition, many of our clients maintain internal training departments, which have the resources and ability to provide the same or similar services in-house. Some of our competitors offer similar services and products at lower prices, and some competitors have significantly greater financial, managerial, technical, marketing and other resources. Moreover, we expect to face additional competition from new entrants into the training and performance improvement market due, in part, to the evolving nature of the market and the relatively low barriers to entry.
The engineering and construction markets in which we compete are also highly competitive. Many of our competitors are niche engineering and construction companies. In some instances, it is necessary for us to partner with those competitors who meet the small business administration’s criteria for a small business in order to win contract awards. This competition places downward pressure on our contract prices and profit margins. Intense competition is expected to continue in our training, engineering and technical services markets, presenting us with significant challenges in our ability to maintain strong growth rates and acceptable profit margins. If we are unable to meet these competitive challenges, we could lose market share to our competitors and experience an overall reduction in our profits.
We cannot provide any assurance that we will be able to compete successfully in the industries or markets in which we compete, and the failure to do so could materially and adversely affect our business, results of operations and financial condition.
16
Failure to keep pace with technology and changing market needs could harm our business.
Our future success will depend upon our ability to adapt to changing client needs, to gain expertise in technological advances rapidly and to respond quickly to evolving industry trends and market needs. Many of our clients are demanding that our services be available across the U.S. and worldwide. We cannot assure you that we will be able to expand our operations into all geographic areas into which our multinational clients seek to use our services or that we will be able to attract and retain qualified personnel to provide our services in all such geographic areas. We also cannot assure you that we will be successful in adapting to advances in technology or marketing our services and products in advanced formats. In addition, services and products delivered in the newer formats might not provide comparable training results. Furthermore, subsequent technological advances might render moot any successful expansion of the methods of delivering our services and products. If we are unable to develop new means of delivering our services and products due to capital, personnel, technological or other constraints, our business, results of operations and financial condition could be materially and adversely affected.
We have only a limited ability to protect the intellectual property rights that are important to our success, and we face the risk that our services or products may infringe upon the intellectual property rights of others.
Our future success depends, in part, upon our ability to protect our proprietary methodologies and other intellectual property, including our EtaPRO™ software. Existing laws of some countries in which we provide or license or intend to provide or license our services or products may offer only limited protection of our intellectual property rights. We rely upon a combination of trade secrets, confidentiality policies, non-disclosure and other contractual arrangements and copyright and trademark laws to protect our intellectual property rights. The steps we take in this regard might not be adequate to prevent or deter infringement or other misappropriation of our intellectual property, and we may not be able to detect unauthorized use or take appropriate and timely steps to enforce our intellectual property rights. Protecting our intellectual property rights might also consume significant management time and resources.
We cannot be sure that our services and products, or the products of others that we offer to our clients, do not infringe on the intellectual property rights of third parties, and we might have infringement claims asserted against us or against our clients. These claims might harm our reputation, result in financial liabilities and prevent us from offering some services or products. We have generally agreed in our contracts to indemnify our clients against expenses or liabilities resulting from claimed infringements of the intellectual property rights of third parties. In some instances, the amount of these indemnities could be greater than the revenues we receive from the client. Any claims or litigation in this area, whether we ultimately win or lose, could be time-consuming and costly, injure our reputation or require us to enter into royalty or licensing arrangements. We might not be able to enter into these royalty or licensing arrangements on acceptable terms. Any limitation on our ability to provide or license a service or product could cause us to lose revenue-generating opportunities and require us to incur additional expenses to develop new or modified solutions for future projects.
Our information technology systems are subject to risks that we cannot control.
Our information technology systems, including technology systems provided by third parties, are dependent upon global communications providers, web browsers, telephone systems, and other aspects of the Internet infrastructure that have experienced system failures and electrical outages in the past. Our systems are susceptible to slow access and download times, outages from fire, floods, power loss, telecommunications failures, hacking, and similar events. Our servers are vulnerable to computer viruses, hacking, and similar disruptions from unauthorized tampering with our computer systems. The occurrence of any of these events could disrupt or damage our information technology systems and inhibit our internal operations, our ability to provide services to our customers, and the ability of our customers to access our information technology systems. This could result in our loss of customers, loss of revenue or a reduction in demand for our services, or affect the ability to manage our business effectively.
17
We identified material weaknesses in our internal control over financial reporting related to our implementation of a new global enterprise resource planning system (ERP) on October 1, 2018, and subsequent post-implementation processing as well as our risk assessment over certain key financial processes. Until remediated, there is the possibility that a material misstatement in our consolidated financial statements may not be prevented or detected on a timely basis, which could result in loss of investor confidence and adversely impact our stock price.
Internal controls related to the operation of technology systems and risk assessment over key financial processes are critical to maintaining adequate internal control over financial reporting. As disclosed in Part II, Item 9A, management identified material weaknesses in internal control related to ineffective controls over the implementation of the ERP system in the areas of user access and program change-management as well as ineffective risk assessment to ensure controls were designed and implemented to respond to the risks within the revenue and human resources processes as well as other processes within TTi Global, Inc. As a result, management concluded that our internal control over financial reporting was not effective as of December 31, 2019 and 2018. We remediated a material weakness related to system development lifecycle controls, and are implementing remedial measures to address the current material weaknesses. While there can be no assurance that our efforts will be successful, we plan to remediate the material weaknesses prior to the end of 2020. However, certain material weaknesses that we had planned to remediate by the end of 2019 continue to exist and we may not be able to remediate the current material weaknesses by the end of 2020. These remediation efforts could result in additional expenses. If we are unable to remediate the material weaknesses, or are otherwise unable to maintain effective internal control over financial reporting or disclosure controls and procedures, our ability to record, process and report financial information accurately, and to prepare financial statements within required time periods, could be adversely affected, which could subject us to litigation or investigations requiring management resources and payment of legal and other expenses, negatively affecting investor confidence in our financial statements and adversely impact our stock price.
A breach of our security measures (or security measures of third-parties we have engaged) could harm our business, results of operations and financial condition.
Our databases contain our confidential data and confidential data of our clients and our clients’ customers, employees and vendors, including sensitive personal data. As a result, we are subject to numerous laws and regulations designed to protect this information, such as the European Union General Data Protection Regulation, the California Consumer Privacy Act and various U.S. federal and state laws governing the protection of health or other personally identifiable information. These laws and regulations are increasing in complexity and number, change frequently and sometimes conflict among the various countries in which we operate. We have implemented security measures, both directly and with third-party subcontractors and service providers, with the intent of maintaining the security of any confidential information which has been entrusted to us against unauthorized access through our information systems or by other electronic transmission or through the misdirection, theft or loss of physical media. A party, including one of our employees, who is able to circumvent our security measures could misappropriate such confidential information or interrupt our operations. Many of our contracts require us to comply with specific data security requirements. If we are unable to maintain our compliance with these data security requirements or any person, including any of our current or former employees, penetrates our network security or misappropriates sensitive data, we could be subject to significant liabilities to our clients or other parties or subject to legal actions for breaching these data security requirements or other contractual confidentiality provisions. These liabilities might not be subject to a contractual limit of liability or an exclusion of consequential or indirect damages and could be significant. Furthermore, unauthorized disclosure of sensitive or confidential data of our clients or other parties, whether through breach of our computer systems, systems failure or otherwise, could also damage our reputation and cause us to lose existing and potential clients. We may also be subject to civil actions, regulatory enforcement actions, and criminal prosecution for breaches related to such data or need to expend significant capital and other resources to continue to protect against security breaches or to address any problem they may cause. In addition, our liability insurance, which includes cyber insurance, might not be sufficient in type or amount to cover us against claims related to security breaches, cyberattacks and other related breaches.
Our international sales and operations expose us to various political and economic risks, which could have a material adverse effect on our business, results of operations and financial condition.
Our revenue outside of the U.S. was approximately 36%, 33% and 31% of our total revenue for the years ended December 31, 2019, 2018 and 2017, respectively. We conduct our business globally. We may continue to expand our global operations into countries other than those in which we currently operate. It could also involve expanding into less developed countries, which may have less political, social or economic stability and less developed infrastructure and legal systems. We may encounter challenges adapting to cultural differences compared to the U.S. International sales and operations might be subject to a variety of risks, including:
• | greater difficulty in staffing and managing foreign operations; |
18
• | greater risk of uncollectible accounts; |
• | longer collection cycles; |
• | logistical and communications challenges; |
• | potential adverse changes in laws and regulatory practices, including export license requirements, trade barriers, tariffs and tax laws; |
• | changes in labor conditions, burdens and costs of compliance with a variety of foreign laws; |
• | political and economic instability; |
• | increases in duties and taxation; |
• | exchange rate risks; |
• | greater difficulty in protecting intellectual property; |
• | general economic and political conditions in these foreign markets; |
• | acts of war or terrorism or natural disasters, and limits on the ability of governments to respond to such acts; |
• | restrictions on the transfer of funds into or out of a particular country; or |
• | nationalization of foreign assets and other forms of governmental protectionism. |
As we expand our business into new countries, we may increase our exposure to the risks discussed above. An adverse development relating to one or more of these risks could affect our relationships with our customers or could have a material adverse effect on our business, results of operations and financial condition.
The United Kingdom’s withdrawal from the EU may adversely impact our operations in the United Kingdom and elsewhere.
On January 31, 2020, the United Kingdom formally left the European Union and the U.K. is in the process of negotiating its exit from the EU (generally referred to as “Brexit”). The U.K. will remain subject to the EU’s rules and regulations during a transition period ending December 31, 2020. The impact of Brexit on our business will depend, in part, on the outcome of tariff, trade, regulatory and other negotiations during this transition period and on the ultimate manner and terms of the U.K.’s withdrawal from the EU.
The UK withdrawal from the EU could create new challenges in our operations, such as instability in global financial and foreign exchange markets. This instability could include volatility in the value of the British pound and European euro, legal uncertainty and potentially divergent national laws and regulations. In addition, the absence of trade agreements between the UK and other EU countries may adversely affect the operation of our cross-border engagements between certain of these countries, including as a result of the potential loss of the E.U. “passport,” or any other potential restriction on free travel of U.K. citizens to Europe, and vice versa.
At the time of this filing, we cannot predict the impact that the UK’s actual exit from the EU will have on our business generally and our UK and European operations more specifically, and no assurance can be given that our operating results, financial condition and prospects would not be adversely impacted by the result.
We are subject to risks associated with currency fluctuations, which could have a material adverse effect on our results of operations and financial condition.
Approximately 36% of our revenue for the year ended December 31, 2019 was denominated in foreign currencies. British Pound Sterling-denominated revenue represented approximately 15% of our revenue for the year ended December 31, 2019. As a result, changes in the exchange rates of foreign currencies to the U.S. dollar will affect our reported consolidated U.S. dollar revenue, cost of revenue and operating margins and could result in exchange gains or losses. The impact of future exchange rate fluctuations on our results of operations cannot be accurately predicted.
Business disruptions could adversely affect our future sales, financial condition, reputation or stock price or increase costs and expenses.
Our business, and that of our key suppliers and customers, may be impacted by disruptions including, but not limited to, threats to physical security, information technology attacks or failures, damaging weather or other acts of nature and pandemics or other public health crises. Such disruptions could affect our internal operations or services provided to customers, adversely impacting our sales, financial condition, reputation or stock price or increase our costs and expenses.
19
Our financial condition and results of operations for fiscal 2020 could be adversely affected by the recent coronavirus outbreak.
In December 2019, a novel strain of coronavirus was reported to have surfaced in Wuhan, China. While initially concentrated in China, at the time of this filing, the outbreak has now spread to other countries and infections have been reported globally including in the United States. The outbreak has resulted in increased travel restrictions and extended shutdown of certain businesses. While these restrictions and closures are expected to be temporary, the duration of the business disruption, reduced customer activity and related financial impact cannot be reasonably estimated at this time but could negatively affect the results of our operations. The extent to which the coronavirus impacts our results will depend on future developments, which are highly uncertain and cannot be predicted, including new information which may emerge concerning the severity of the coronavirus and the actions to contain the coronavirus or treat its impact, among others.
We are subject to potential liabilities which are not covered by our insurance.
We engage in activities in which there are substantial risks of potential liability. We have provided services involving electric power distribution and generation, nuclear power, chemical weapons destruction, petrochemical process training, pipeline operations, volatile fuels such as hydrogen and liquefied natural gas (“LNG”), environmental remediation, engineering design and construction management. We maintain a global insurance program (including general liability coverage) covering the businesses we currently own. Claims by or against any covered insured could reduce the amount of available insurance coverage for the other insureds and for other claims. In addition, certain liabilities might not be covered at all, such as deductibles, self-insured retentions, amounts in excess of applicable insurance limits and claims that fall outside the coverage of our policies.
Although we believe that we currently have appropriate insurance coverage, we do not have coverage for all of the risks to which we are subject and we may not be able to obtain appropriate coverage on a cost-effective basis in the future.
Some of our policies, such as our professional liability insurance policy, provide coverage on a “claims-made” basis covering only claims actually made during the policy period then in effect. To the extent that a risk is not insured within our then-available coverage limits, insured under a low-deductible policy, indemnified against by a third party or limited by an enforceable waiver or limitation of liability, claims could be material and could materially and adversely affect our business, results of operations and financial condition.
Our authorized preferred stock and certain provisions in our amended and restated by-laws could make a third party acquisition of us difficult.
Our restated certificate of incorporation, as amended, (“restated certificate”), allows us to issue up to 10,000,000 shares of preferred stock, the rights, preferences, qualifications, limitations and restrictions of which may be fixed by the Board of Directors without any further vote or action by the stockholders. In addition, our amended and restated bylaws provide, among other things, that stockholders seeking to bring business before or to nominate candidates for election as directors at an annual meeting of stockholders must provide us with timely advance written notice of their proposal in a prescribed form. Our amended and restated bylaws also provide that stockholders desiring to call a special meeting for any purpose, must submit to us a request in writing of stockholders representing at least 50% of the combined voting power of all issued and outstanding classes of capital stock and stating the purpose of such meeting. The ability to issue preferred stock and such provisions in our bylaws might have the effect of delaying, discouraging or preventing a change in control that might otherwise be beneficial to stockholders and might materially and adversely affect the market price of our common stock.
In addition, some provisions of Delaware law, particularly the “business combination” statute in Section 203 of Delaware General Corporation Law, might also discourage, delay or prevent someone from acquiring us or merging with us. As a result of these provisions in our charter documents and Delaware law, the price investors might be willing to pay in the future for shares of our common stock might be limited.
20
Our restated certificate allows us to redeem or otherwise dispose shares of our common stock owned by a foreign stockholder if certain U.S. Government agencies threaten termination of any of our contracts as a result of such an ownership interest.
The United States Departments of Energy and Defense have policies regarding foreign ownership, control or influence over government contractors who have access to classified information, and might conduct an inquiry as to whether any foreign interest has beneficial ownership of 5% or more of a contractor’s or subcontractor’s voting securities. If either Department determines that an undue risk to the defense and security of the United States exists as a result of foreign ownership, control or influence over a government contractor (including as a result of a potential acquisition), it might, among other things, terminate the contractor’s or subcontractor’s existing contracts. Our restated certificate allows us to redeem or require the prompt disposition of all or any portion of the shares of our common stock owned by a foreign stockholder beneficially owning 5% or more of the outstanding shares of our common stock if either Department threatens termination of any of our contracts as a result of such an ownership interest. These provisions may have the additional effect of delaying, discouraging or preventing a change in control and might materially and adversely affect the market price of our common stock. In connection with the sale of shares of common stock to Sagard in December 2009, we agreed to render these provisions, as well as other anti-takeover measures, inapplicable to Sagard.
Item 1B: Unresolved Staff Comments
None.
Item 2: Properties
We do not own any significant real property, but we and our subsidiaries lease an aggregate of approximately 568,000 square feet of primarily office and related space at various locations throughout the United States and Europe and other countries in which we have operations. We occupy approximately 45,000 square feet in an office building in Columbia, Maryland for our corporate headquarters under a lease which expires in 2025. We also lease offices to support our operations in 25 other cities across the U.S., including Troy, Michigan and Indianapolis, Indiana, and we lease office space to support our international locations in Canada, the United Kingdom, France, Germany, the Netherlands, Denmark, Poland, Switzerland, South Africa, the United Arab Emirates, Romania, Turkey, Australia, mainland China, Hong Kong, India, Japan, Malaysia, Singapore, Thailand, the Philippines, Argentina, Brazil, Chile, Colombia, and Mexico.
We believe that our properties have been well maintained, are suitable and adequate for us to operate at present levels and the productive capacity and extent of utilization of the facilities are appropriate for our existing real estate requirements. Upon expiration of these leases, we do not anticipate any difficulty in obtaining renewals or alternative space.
Item 3: Legal Proceedings
None.
Item 4: Mine Safety Disclosures
None.
21
PART II
Item 5: Market for the Registrant’s Common Equity, Related Stockholder Matters and Issuer Purchases of Equity Securities
Our common stock, $0.01 par value, is traded on the New York Stock Exchange. The following table presents our high and low market prices for the last two fiscal years. During the periods presented below, we have not paid any cash dividends.
2019 | ||||||||
Quarter | High | Low | ||||||
First | $ | 17.13 | $ | 11.92 | ||||
Second | 16.03 | 12.03 | ||||||
Third | 16.68 | 12.33 | ||||||
Fourth | 14.47 | 10.94 | ||||||
2018 | ||||||||
Quarter | High | Low | ||||||
First | $ | 26.80 | $ | 20.30 | ||||
Second | 23.00 | 17.50 | ||||||
Third | 19.55 | 16.40 | ||||||
Fourth | 18.39 | 11.77 | ||||||
The number of shareholders of record of our common stock as of February 25, 2020 was 616. Shares of our common stock that are registered in the name of a broker or other nominee are listed as a single shareholder on our record listing, even though they are held for a number of individual shareholders. As such, our actual number of shareholders is higher than the number of shareholders of record.
We have not declared or paid any cash dividends on our common stock during the two most recent fiscal years. We do not anticipate paying cash dividends on our common stock in the foreseeable future and intend to retain future earnings to finance the growth and development of our business.
22
Performance Graph
The following graph assumes $100 was invested on December 31, 2014 in GP Strategies Common Stock, and compares the share price performance with the NYSE Market Index and a peer group index which consists of the companies included in Standard Industrial Classification (SIC) 8200, Educational Services. Values are as of December 31 of the specified year assuming that all dividends were reinvested.
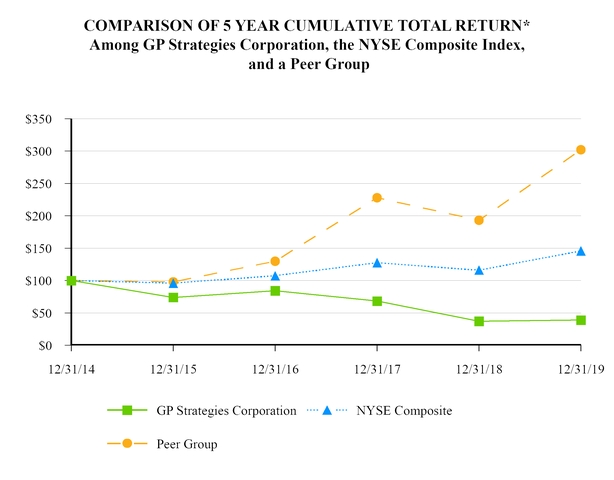
*$100 invested on 12/31/14 in stock or index, including reinvestment of dividends.
Fiscal year ending December 31.
Company / Index | Year ended December 31, | |||||||||||||||||||||||
Name | 2014 | 2015 | 2016 | 2017 | 2018 | 2019 | ||||||||||||||||||
GP Strategies Corp. | $ | 100.00 | $ | 74.01 | $ | 84.29 | $ | 68.38 | $ | 37.16 | $ | 38.99 | ||||||||||||
NYSE Market Index | 100.00 | 95.91 | 107.36 | 127.46 | 116.06 | 145.66 | ||||||||||||||||||
Peer Group Index | 100.00 | 97.97 | 129.88 | 227.91 | 193.08 | 302.06 | ||||||||||||||||||
23
Issuer Purchases of Equity Securities
The following table provides information about our share repurchase activity for the three months ended December 31, 2019:
Issuer Purchases of Equity Securities | ||||||||||||||
Month | Total number of shares purchased | Average price paid per share | Total number of shares purchased as part of publicly announced program (1) | Approximate dollar value of shares that may yet be purchased under the program | ||||||||||
October 1 - 31, 2019 | — | $ | — | — | $ | 3,755,000 | ||||||||
November 1 - 30, 2019 | 3,114(2) | $ | 12.58 | — | $ | 3,755,000 | ||||||||
December 1 - 31, 2019 | 8,069(2) | $ | 13.18 | — | $ | 3,755,000 | ||||||||
(1) | Represents shares repurchased in the open market in connection with our share repurchase program under which we may repurchase shares of our common stock from time to time in the open market subject to prevailing business and market conditions and other factors. There is no expiration date for the repurchase program. |
(2) | Includes shares surrendered to satisfy tax withholding obligations on restricted stock units which vested during these periods. |
24
Item 6: Selected Financial Data
The selected financial data presented below should be read in conjunction with “Management’s Discussion and Analysis of Financial Condition and Results of Operations” in Item 7 and our consolidated financial statements and the notes thereto included elsewhere in this report. Our consolidated statement of operations data for the years ended December 31, 2019, 2018, and 2017 and our consolidated balance sheet data as of December 31, 2019 and 2018 have been derived from our audited consolidated financial statements included elsewhere in this report. Our consolidated statement of operations data for the years ended December 31, 2016 and 2015 and our consolidated balance sheet data as of December 31, 2017, 2016, and 2015 have been derived from audited consolidated financial statements which are not presented in this report.
Years ended December 31, | ||||||||||||||||||||
Statement of Operations Data | 2019 | 2018 | 2017 | 2016 | 2015 | |||||||||||||||
(In thousands, except per share amounts) | ||||||||||||||||||||
Revenue | $ | 583,290 | $ | 515,160 | $ | 509,208 | $ | 490,559 | $ | 490,280 | ||||||||||
Gross profit | 89,213 | 77,743 | 82,027 | 80,157 | 81,992 | |||||||||||||||
Interest expense | 6,058 | 2,945 | 3,132 | 1,568 | 1,381 | |||||||||||||||
Income before income taxes (1) | 22,369 | 14,763 | 19,689 | 30,034 | 29,623 | |||||||||||||||
Net income | 15,189 | 9,836 | 12,891 | 20,247 | 18,789 | |||||||||||||||
Diluted earnings per share | 0.90 | 0.59 | 0.76 | 1.21 | 1.09 | |||||||||||||||
(1) | Includes a $12.1 million gain on the sale of our tuition program management business on October 1, 2019 which is described more fully in Note 4 to the Consolidated Financial Statements. |
December 31, | ||||||||||||||||||||
Balance Sheet Data | 2019 | 2018 | 2017 | 2016 | 2015 | |||||||||||||||
(In thousands) | ||||||||||||||||||||
Cash | $ | 8,159 | $ | 13,417 | $ | 23,612 | $ | 16,346 | $ | 21,030 | ||||||||||
Short-term borrowings | — | — | 37,696 | 17,694 | 34,084 | |||||||||||||||
Working capital | 92,918 | 103,944 | 49,785 | 59,859 | 40,322 | |||||||||||||||
Total assets | 448,902 | 434,738 | 365,007 | 315,601 | 302,969 | |||||||||||||||
Long-term debt, including current maturities | 82,870 | 116,500 | 28,000 | 40,000 | 24,444 | |||||||||||||||
Stockholders’ equity | 209,914 | 186,569 | 188,054 | 167,496 | 158,344 | |||||||||||||||
25
Item 7: Management’s Discussion and Analysis of Financial Condition and Results of Operations
The following discussion and analysis provides information we believe is relevant to an assessment and understanding of our consolidated results of operations and financial condition. The discussion should be read in conjunction with the Consolidated Financial Statements and Notes thereto for the year ended December 31, 2019 which are located in Item 8 of this report.
General Overview
We are a global performance improvement solutions provider of training, digital learning solutions, management consulting and engineering services that seeks to improve the effectiveness of organizations by providing services and products that are customized to meet the specific needs of clients. Clients include Fortune 500 companies and governmental and other commercial customers in a variety of industries. We believe we are a global leader in performance improvement, with over five decades of experience in providing solutions to optimize workforce performance.
As of December 31, 2019, we operated through two reportable business segments: (i) Workforce Excellence and (ii) Business Transformation Services. We are organized into two operating segments aligned by complementary service lines and supported by a business development organization aligned by industry sector. Our two segments each consist of two global practice areas which are focused on providing similar and/or complementary products and services across our diverse customer base and within targeted markets. Within each practice are various service lines having specific areas of expertise. Marketing and communications, sales, accounting, finance, legal, human resources, information systems and other administrative services are organized at the corporate level. Business development and sales resources are aligned by industry sector to support existing customer accounts and new customer development across both segments. Further information regarding our business segments is discussed below.
Workforce Excellence. The Workforce Excellence segment advises and partners with leading organizations in designing, implementing, operating and supporting their talent management and workforce strategies, enabling them to gain greater competitive edge in their markets. This segment consists of two practices:
• | Managed Learning Services - this practice focuses on creating value for our customers by delivering a suite of talent management and learning design, development, operational and support services that can be delivered as large scale outsourcing arrangements, managed services contracts and project-based service engagements. The Managed Learning Services offerings include strategic learning and development consulting services, digital learning content design and development solutions and a suite of managed learning operations services, including: managed facilitation and delivery, managed training administration and logistics, help desk support, event management and vendor management. |
• | Engineering & Technical Services - this practice focuses on capital intensive, inherently hazardous and/or highly complex technical services in support of both U.S. government and global commercial industries. Our products and services include design, development and delivery of technical work-based learning, CapEx (plant launch) initiatives, engineering design and construction management, fabrication, and management services, operational excellence consulting, chemical demilitarization services, homeland security services, emergency management support services along with all forms of technical documentation. We deliver world-class asset management and performance improvement consulting to a host of industries. Our proprietary EtaPRO® Performance and Condition Monitoring System provides a suite of real-time digital solutions for hundreds of facilities and is installed in power-generating units around the world. We also provide thousands of technical courses in a web-based off-the-shelf delivery format through our GPiLEARN+™ portal. |
Business Transformation Services. The Business Transformation Services segment works with organizations to execute complex business strategies by linking business systems, processes and workforce performance to clear and measurable results. We have a holistic methodology to establishing direction and closing the gap between strategy and execution. Our approach equips business leaders and teams with the tools and capability to deliver high-performance results. This segment consists of two practices:
• | Sales Enablement - this practice provides custom product sales training and service technical training, primarily to automotive manufacturers, designed to better educate customer salesforces as well as service technicians with respect to new product features and designs, in effect rapidly increasing the salesforce and technician knowledge base and enabling them to address retail customer needs. Furthermore, this segment helps our clients assess their customer relationship marketing strategy and connect with their customers on a one-to-one basis, including custom print and digital publications. We have been a custom product sales and service technical training provider and leader in serving manufacturing customers in the U.S. automotive industry for over 40 years. |
26
• | Organizational Development - this practice works with organizations to design and execute an integrated people performance system. This translates to helping organizations set strategy, carry that strategy through every level of the organization and ensure that their people have the right skills, knowledge, tools, processes and technology to enable transformation and achieve business results. Solutions include strategy, leadership, employee engagement and culture consulting, enterprise technology implementation and adoption solutions, and organization design and business performance consulting. |
We discuss our business in more detail in Item 1. Business and the risk factors affecting our business in Item 1A. Risk Factors.
Business Strategy
We seek to increase shareholder value by pursuing the following strategies:
Continuously enhance our learning services offerings and capabilities. We believe the demand for learning and development services will continue to increase. In a knowledge based economy, this demand is driven by ever increasing technology, processes, products, and turnover of personnel. The rate and effectiveness of the transfer of knowledge to the workforce of our clients, their partners, and even their customers can positively impact their performance. We plan to meet this demand by continuously expanding our services and capabilities through organic growth initiatives based upon our technical expertise as well as through targeted acquisitions. Our acquisitions in recent years have added automotive industry training and platform adoption capabilities to our services offerings, strengthened our digital learning and custom training content development services in both the commercial and government sectors, and expanded our geographical reach. We believe that the breadth of our service and product offerings allows us to effectively compete for customers by offering a comprehensive solution for custom training, consulting, engineering and technical services. We will continue to focus on increasing our capabilities to drive incremental growth from new, as well as existing, clients.
Develop and maintain strong client relationships. We plan to preserve and grow our business by cross-selling our services and capabilities across and within our existing client base. We have a successful track record of increasing our share of wallet with a number of our clients, many of whom we estimate currently outsource only a fraction of their training expenditures. We believe that as our clients benefit from the efficient, cost-effective and flexible training solutions and services that we provide, many of them will find it beneficial to increase the scope of training services that they outsource to third party providers. We believe that the strength of our relationships with our existing clients, including the insight and knowledge into their operations that we have developed through these relationships, when combined with the broad range of our service and product offerings, provide us with an advantage when competing for these additional expenditures.
Leverage managed learning capabilities. We have a demonstrated ability to provide training services across a wide spectrum of learning engagements from transactional multi-week assignments focused on a single aspect of a learning process to multi-year contracts where we manage the learning infrastructure of our customer. Integrated managed learning engagements typically require us to assume responsibility for the development, delivery and administration of learning functions and are generally carried out under multi-year agreements. We intend to leverage our managed learning capabilities to expand the customers and markets we serve.
Expand global platform. We believe international markets offer growth opportunities for our services. We established over twenty new subsidiaries in select countries since 2013 to support new global outsourcing contracts.We intend to leverage our enhanced infrastructure as well as to further establish our global platform in order to deliver our comprehensive offerings to new and existing clients on a global basis. In our experience, many of our clients are seeking access to additional international markets and as such we intend to enhance our international capabilities. In order to support their business expansion we are providing employee training solutions across organizations in different countries and different languages, while maintaining quality and consistency in the overall training program. By moving into specific international markets with our existing clients, we are able to not only deepen our relationships with those clients, but are also able to develop expertise in those markets that we can leverage to additional customers. We believe that following this strategy provides us with opportunities to gain access to international markets with established client relationships in those markets.
27
Significant Events
Restructuring Plan
In December 2017, we announced a new organizational structure and plan to improve operating results by increasing organic growth and reducing operating costs. We also hired a chief sales officer in January 2018 to establish a structured and more centralized business development capability that will align our diverse market sector expertise with our service offerings. In connection with the reorganization, we initiated restructuring and transition activities to improve operational efficiency, reduce costs and better position the Company to drive future revenue growth. During the fourth quarter of 2017, we incurred restructuring charges of $3.3 million consisting primarily of severance costs and during the year ended December 31, 2018, we incurred restructuring charges of $2.9 million, consisting primarily of facility consolidation costs and severance expense. These restructuring activities were complete as of June 30, 2018. The total remaining liability under this restructuring plan was $0.1 million and $1.9 million as of December 31, 2019 and 2018, respectively.
In connection with the acquisition of TTi Global, Inc. in December 2018, we initiated restructuring and transition activities in the first quarter of 2019 to reduce costs and eliminate redundant positions to realize synergies with the acquired business. For the year ended December 31, 2019, we recorded $1.6 million of restructuring charges in connection with these activities. The total remaining liability under these restructuring activities was $0.2 million as of December 31, 2019. These restructuring activities associated with the TTi Global acquisition were substantially complete as of December 31, 2019.
Divestitures
Sale of Tuition Program Management Business
On October 1, 2019, we sold our tuition program management business pursuant to an Asset Purchase Agreement with Bright Horizons Children's Centers LLC (the "buyer"). The purchase price was $20.0 million which was paid on closing, other than $1.5 million which is being held in escrow to secure possible indemnification claims pursuant to the terms of an escrow agreement which expires October 1, 2020. An additional $0.1 million was paid to the buyer in January 2020 based on the final calculation of assumed liabilities as defined in the asset purchase agreement. We recognized a pre-tax gain of $12.1 million, net of $0.1 million of direct selling costs, on the sale of the business. The gain recorded represents the difference between the purchase price and the carrying value of the business, which primarily included goodwill of $7.7 million.
Sale of Alternative Fuels Division
Effective January 1, 2020, we closed the sale of our Alternative Fuels Division pursuant to an Asset Purchase Agreement with Cryogenic Industries, LLC. The purchase price is up to $6.0 million, subject to adjustment based on a final calculation of net working capital as defined in the asset purchase agreement. Of the total purchase consideration, we received an advance payment of $1.5 million on December 31, 2019 and the remaining upfront consideration of $3.5 million on January 2, 2020 based on the estimated net working capital. In addition, up to $0.5 million of the purchase price is subject to the achievement of certain milestones under an assigned contract through the period December 31, 2021. The purchase price adjustment for closing net working capital is expected to be finalized during the first quarter of 2020.
Acquisitions
Below is a summary of the acquisitions we completed during 2018 and 2017. We did not complete any acquisitions in 2019. See Note 3 to the accompanying Consolidated Financial Statements for further details, including the purchase price allocations.
2018 Acquisitions
TTi Global
On November 30, 2018, we entered into a Share Purchase Agreement with TTi Global, Inc. ("TTi Global") and its stockholders and acquired all of the outstanding shares of TTi Global. The transaction under the Share Purchase Agreement includes the acquisition of TTi Global’s subsidiaries (except for its UK and Spain subsidiaries and dormant entities) and certain affiliated companies. The Company purchased TTi Global’s UK and Spain subsidiaries in a separate transaction in August 2018 which is discussed further below. TTi Global is a provider of training, staffing, research and consulting solutions to industries across various sectors with automotive as a core focus. The total upfront purchase price for TTi Global was $14.2 million of cash paid upon closing on November 30, 2018, subject to reduction based on a minimum working capital requirement, as defined in the Share
28
Purchase Agreement. During the third quarter of 2019, the seller paid us $0.9 million in settlement of the working capital adjustment. The acquired TTi Global business is included in the Business Transformation Services segment and the results of its operations have been included in the consolidated financial statements beginning December 1, 2018. The pro-forma impact of the acquisition is not material to our results of operations.
TTi Europe
On August 7, 2018, we acquired the entire share capital of TTi (Europe) Limited, a subsidiary of TTi Global, Inc. (TTi Europe), a provider of training and research services primarily for the automotive industry located in the United Kingdom. The upfront purchase price was $3.0 million in cash. The acquired TTi Europe business is included in the Business Transformation Services segment and the results of its operations have been included in the consolidated financial statements beginning August 7, 2018. The pro-forma impact of the acquisition is not material to our results of operations.
IC Axon
On May 1, 2018, we acquired the entire share capital of IC Acquisition Corporation, a Delaware corporation, and its subsidiary, IC Axon Inc., a Canadian corporation (IC Axon). IC Axon develops science-driven custom learning solutions for pharmaceutical and life science customers. The upfront purchase price was $30.5 million in cash. In addition, the purchase agreement requires up to an additional $3.5 million of consideration, contingent upon the achievement of an earnings target during a twelve-month period subsequent to the closing of the acquisition. No contingent consideration was payable as the earnings target was not achieved. The acquired IC Axon business is included in the Workforce Excellence segment and the results of its operations have been included in the consolidated financial statements beginning May 1, 2018. The pro-forma impact of the acquisition is not material to our results of operations.
Hula Partners
On January 2, 2018, we acquired the business and certain assets of Hula Partners, a provider of SAP Success Factors Human Capital Management (HCM) implementation services. The purchase price was $10.0 million which was paid in cash at closing. The acquired Hula Partners business is included in the Business Transformation Services segment and the results of its operations have been included in the consolidated financial statements beginning January 2, 2018. The pro-forma impact of the acquisition is not material to our results of operations.
2017 Acquisitions
YouTrain
On August 31, 2017, we acquired the entire share capital of YouTrain Limited ("YouTrain"), an independent training company delivering IT, digital and life sciences skills training in Scotland and North West England. The upfront purchase price was $4.9 million which was paid in cash at closing and a completion accounts payment of $0.2 million which was paid to the sellers during the fourth quarter of 2017. The acquired YouTrain business is included in the Workforce Excellence segment and the results of its operations have been included in the consolidated financial statements beginning September 1, 2017. The pro-forma impact of the acquisition is not material to our results of operations. The acquired YouTrain business is included in our acquiring United Kingdom subsidiary and its functional currency is the British Pound Sterling.
CLS Performance Solutions Limited
On August 31, 2017, we acquired the business and certain assets of CLS Performance Solutions Limited ("CLS"), an independent provider of Enterprise Resource Planning (ERP) end user adoption and training services in the United Kingdom. The upfront purchase price was $0.4 million which was paid in cash at closing. In addition, the purchase agreement required up to an additional $2.2 million of consideration contingent upon the achievement of certain earnings targets during the twelve-month period following the completion of the acquisition. No contingent consideration was paid as the earnings targets were not achieved. The acquired CLS business is included in the Business Transformation Services segment, and the results of its operations have been included in the consolidated financial statements beginning September 1, 2017. The pro-forma impact of the acquisition is not material to our results of operations. The acquired CLS business is included in our acquiring United Kingdom subsidiary and its functional currency is the British Pound Sterling.
Emantras
Effective April 1, 2017, we acquired the business and certain assets of Emantras, a digital education company that provides engaging learning experiences and effective knowledge delivery through award-winning digital and mobile solutions with offices in Fremont, California and Chennai, India. This acquisition strengthens our eLearning development capabilities, allowing us to better serve our customer base with the latest digital learning solutions. The upfront purchase price was $3.2 million in cash. In addition, the
29
purchase agreement required up to an additional $0.3 million of consideration, contingent upon the achievement of an earnings target during the twelve-month period following completion of the acquisition, plus a percentage of any earnings in excess of the specified earnings target. No contingent consideration was paid as the earnings target was not achieved. The acquired Emantras business is included in the Workforce Excellence segment, and the results of its operations have been included in the consolidated financial statements beginning April 1, 2017. The pro-forma impact of the acquisition is not material to our results of operations. The India-based operations of the acquired Emantras business is included in our India subsidiary and its functional currency is the Indian Rupee.
McKinney Rogers
On February 1, 2017, we acquired the business and certain assets of McKinney Rogers, a provider of strategic consulting services with offices in New York and London. This acquisition expands our solutions offerings, giving us the ability to leverage McKinney Rogers' intellectual property and consulting methodologies to help our global client base meet strategic business goals. The upfront purchase price was $3.3 million in cash. In addition, the purchase agreement required up to an additional $18.0 million of consideration, $6.0 million of which was contingent upon the achievement of certain earnings targets during the five-month period ended April 30, 2017 and $12.0 million of which is contingent upon the achievement of certain earnings targets during the three twelve-month periods following completion of the acquisition. In July 2017, we paid the seller $1.0 million in respect of the contingent consideration for the five-month period ended April 30, 2017. No contingent consideration was paid with respect to the two twelve-month periods following the acquisition as the earnings targets for those periods were not achieved. In July 2019, we entered into an amendment to the asset purchase agreement that implemented certain changes, including the elimination of the third year earnout for the period ended January 31, 2020. The acquired McKinney Rogers business is included in the Business Transformation Services segment, and the results of its operations have been included in the consolidated financial statements beginning February 1, 2017. The pro-forma impact of the acquisition is not material to our results of operations.
Share Repurchase Program
We have a share repurchase program under which we may repurchase shares of our common stock from time to time in the open market, subject to prevailing business and market conditions and other factors. During the year ended December 31, 2019 we did not repurchase shares and during the years ended December 31, 2018 and 2017, we repurchased approximately 354,000 and 182,000 shares, respectively, of our common stock in the open market for a total cost of approximately $8.0 million and $4.3 million, respectively. As of December 31, 2019, there was approximately $3.8 million available for future repurchases under the buyback program. There is no expiration date for the repurchase program.
30
Results of Operations
Operating Highlights
Year ended December 31, 2019 compared to the year ended December 31, 2018
During the year ended December 31, 2019, our revenue increased $68.1 million, or 13.2%, to $583.3 million compared to $515.2 million for the year ended December 31, 2018. The revenue increase was comprised of a $13.0 million increase in our Workforce Excellence segment and a $55.1 million increase in our Business Transformation Services segment. Foreign currency exchange rate changes resulted in a total $7.5 million decrease in U.S. dollar reported revenue during 2019. The changes in revenue and gross profit are discussed in further detail below by segment.
Operating income, the components of which are discussed in detail below, increased $8.4 million or 42.9% during the year ended December 31, 2019. The increase in operating income is largely due to a $12.1 million pre-tax gain on the sale of our tuition program management business in October 2019. In addition, we had a $11.5 million increase in gross profit and a $1.3 million decrease in restructuring charges during 2019 compared to 2018. These increases in operating income were partially offset by a $9.6 million increase in general and administrative expenses, a $3.1 million increase in sales and marketing expense, and a $3.8 million decrease in the gain on change in fair value of contingent consideration during 2019 compared to 2018.
For the year ended December 31, 2019, we had income before income taxes of $22.4 million compared to $14.8 million for the year ended December 31, 2018. Net income was $15.2 million, or $0.90 per diluted share, for the year ended December 31, 2019 compared to $9.8 million, or $0.59 per diluted share, for 2018. Diluted weighted average shares outstanding were $16.9 million for the year ended December 31, 2019 compared to $16.7 million for the year ended December 31, 2018.
Revenue
Years ended December 31, | ||||||||
2019 | 2018 | |||||||
(Dollars in thousands) | ||||||||
Workforce Excellence | $ | 329,795 | $ | 316,814 | ||||
Business Transformation Services | 253,495 | 198,346 | ||||||
$ | 583,290 | $ | 515,160 | |||||
Workforce Excellence revenue increased $13.0 million or 4.1% during the year ended December 31, 2019 compared to 2018. The increase in revenue is comprised of the following:
• | a $16.6 million net increase in revenue in our Managed Learning Services practice primarily due to the following: |
◦ | a $5.1 million increase in revenue from the IC Axon business acquired on May 1, 2018; |
◦ | a $10.2 million net increase in revenue for managed learning and training content development services primarily due to new training outsourcing contracts; and |
◦ | a $1.3 million increase in vocational skills training services provided to the UK government. |
• | a $1.9 million net increase in revenue in our Engineering & Technical Services practice primarily due to an increase in chemical demilitarization training services for the U.S. government and an increase in disaster relief services, partially offset by a net decrease in engineering and technical training services. |
These increases were offset by a $5.5 million net decrease in revenue due to changes in foreign currency exchange rates.
Business Transformation Services revenue increased $55.1 million or 27.8% during the year ended December 31, 2019 compared to 2018. The net increase in revenue is comprised of the following:
◦ | a $57.7 million net increase in our Sales Enablement practice primarily due to the following: |
◦ | a $49.1 million increase due to incremental revenue contributed by the TTi Global and TTi Europe acquisitions completed on December 1, 2018 and August 7, 2018, respectively; and |
31
• | a $8.6 million net increase in automotive sales training services largely due to new vehicle launch events and other new projects for automotive clients. |
◦ | a $0.6 million net decrease in revenue in our Organizational Development practice primarily due to a decline in human capital management system implementation services, partially offset by an increase in strategic consulting services. |
These revenue increases were offset by a $2.0 million net decrease in revenue due to changes in foreign currency exchange rates.
Gross profit
Years ended December 31, | ||||||||||||
2019 | 2018 | |||||||||||
% Revenue | % Revenue | |||||||||||
(Dollars in thousands) | ||||||||||||
Workforce Excellence | $ | 55,855 | 16.9% | $ | 50,875 | 16.1% | ||||||
Business Transformation Services | 33,358 | 13.2% | 26,868 | 13.5% | ||||||||
$ | 89,213 | 15.3% | $ | 77,743 | 15.1% | |||||||
Workforce Excellence gross profit of $55.9 million, or 16.9%, of revenue for the year ended December 31, 2019 increased by $5.0 million, or 9.8%, compared to gross profit of $50.9 million or 16.1% of revenue for the year ended December 31, 2018. The net increase in gross profit is primarily due to the following:
• | a $4.3 million net increase in gross profit in our Managed Learning Services practice primarily due to the revenue increases noted above, partially offset by a decline in gross profit for our vocational skills training services provided to the UK government due to a change in the funding model; and |
• | a $1.6 million net increase in gross profit in our Engineering & Technical Services practice primarily due to the revenue increases noted above, as well as improved profitability in our alternative fuels business; partially offset by |
• | a $0.9 million net decrease in gross profit due to changes in foreign currency exchange rates. |
Business Transformation Services gross profit of $33.4 million, or 13.2%, of revenue for the year ended December 31, 2019 increased by $6.5 million, or 24.2%, when compared to gross profit of $26.9 million, or 13.5%, of revenue for the year ended December 31, 2018. The increase is primarily due to $4.6 million of gross profit contributed by the acquired TTi business, a $0.6 million increase in gross profit in our Sales Enablement practice, and a $1.3 million increase in gross profit in our Organizational Development practice.
General and administrative expenses
General and administrative expenses increased $9.6 million or 17.6% from $54.8 million for the year ended December 31, 2018 to $64.5 million for the year ended December 31, 2019. The increase in general and administrative expenses is primarily due to a $4.5 million increase in G&A expense associated with the acquired TTi businesses and a $2.0 million increase due to internal labor costs that were capitalized in connection with our financial system implementation in 2018 but that are included in G&A expense in 2019. In addition, there was a $2.8 million increase in bad debt expense primarily due to an additional reserve of $2.2 million recognized in the fourth quarter of 2019 resulting from a settlement agreement relating to outstanding accounts receivable on a contract that was previously terminated by a foreign oil and gas client in 2017. There was also a $0.3 million net increase in miscellaneous other G&A expenses largely due to an increase in external accounting and tax consulting fees.
Sales and marketing expenses
Sales and marketing expenses increased $3.1 million or 64.1% from $4.8 million for the year ended December 31, 2018 to $7.9 million for the year ended December 31, 2019. The increase in sales and marketing expenses is primarily due to labor and benefits expense relating to the hiring of additional business development personnel as well as marketing personnel, some of which represents new investments and some of which results from centralizing marketing resources that were previously recorded in cost of revenue.
32
Restructuring charges
Restructuring expense were $1.6 million and $2.9 million for the years ended December 31, 2019 and 2018, respectively. In connection with the acquisition of TTi Global, Inc. in December 2018, we initiated restructuring and transition activities in the first quarter of 2019 to reduce costs and eliminate redundant positions to realize synergies with the acquired business. We recognized restructuring charges of $1.6 million during the year ended December 31, 2019 relating to these restructuring activities. During the year ended December 31, 2018, we recognized $2.9 million of restructuring charges in connection with the reorganization that was initiated in December 2017.
Gain on change in fair value of contingent consideration, net
During the years ended December 31, 2019 and 2018, we recognized a net gain of $0.7 million and $4.4 million, respectively, on the change in fair value of contingent consideration related to acquisitions. The gains are due to lower earnings for the acquired businesses compared to our original forecasts, resulting in a reversal of the contingent consideration liabilities. See Note 3 to the Consolidated Financial Statements for a detailed discussion of the accounting for the changes in fair value of contingent consideration during the year ended December 31, 2019.
Interest expense
Interest expense increased $3.1 million to $6.1 million for the year ended December 31, 2019 compared to $2.9 million for the year ended December 31, 2018. The net increase is due to a $2.0 million increase in interest expense due to both an increase in interest rates and higher borrowings under the Credit Agreement, as well as a $1.1 million non-recurring reversal of an interest accrual during the second quarter of 2018 related to an unremitted value-added tax associated with prior year client billings which was favorably settled during the second quarter of 2018.
Other income (expense)
Other income was $0.4 million compared to other expense of $1.9 million for the years ended December 31, 2019 and 2018, respectively. The increase in other income was primarily due to a $1.6 million decrease in foreign currency losses primarily related to the effect of exchange rates on intercompany receivables and payables and third party receivables and payables that are denominated in currencies other than the functional currency of our legal entities. There was also a net $0.8 million improvement in other income due to a $0.5 million gain in the third quarter of 2019 related to a divested business for which a $0.3 million loss on disposal was included in other expense during the third quarter of 2018. In addition, there was a $0.4 million increase in miscellaneous other income. Partially offsetting these improvements was a $0.4 million loss on a litigation settlement, including legal costs, during the fourth quarter of 2019, which is included in other income (expense).
Gain on sale of business
On October 1, 2019, we sold our tuition program management business pursuant to an Asset Purchase Agreement with Bright Horizons Children's Centers LLC (the "buyer"). The purchase price was $20.0 million which was paid on closing, other than $1.5 million which is being held in escrow to secure possible indemnification claims pursuant to the terms of an escrow agreement which expires October 1, 2020. An additional $0.1 million was paid to the buyer in January 2020 based on the final calculation of assumed liabilities as defined in the asset purchase agreement. We recognized a pre-tax gain of $12.1 million, net of $0.1 million of direct selling costs, on the sale of the business. The gain recorded represents the difference between the purchase price and the carrying value of the business, which primarily included goodwill of $7.7 million.
Income taxes
Income tax expense was $7.2 million for the year ended December 31, 2019 compared to $4.9 million for the year ended December 31, 2018. Our effective income tax rate was 32.1% and 33.4% for the years ended December 31, 2019 and 2018, respectively. The decrease in the effective income tax rate in 2019 compared to 2018 is primarily due to a change in the mix of income from higher to lower taxing jurisdictions. See Note 10 to the accompanying Consolidated Financial Statements for further information regarding income taxes.
33
Results of Operations for Fiscal 2018 compared to 2017
For a comparison of our results of operations for the years ended December 31, 2018 and 2017, see "Part II, Item 7. Management's Discussion and Analysis of Financial Condition and Results of Operations" of our annual report on Form 10-K for the fiscal year ended December 31, 2018, filed with the SEC on April 1, 2019.
Liquidity and Capital Resources
Working Capital
For the year ended December 31, 2019, our working capital decreased $11.0 million from $103.9 million at December 31, 2018 to $92.9 million at December 31, 2019. We believe that cash generated from operations and borrowings available under our Credit Agreement ($25.8 million of available borrowings as of December 31, 2019 based on our consolidated leverage ratio) will be sufficient to fund our working capital and other requirements for at least the next twelve months.
As of December 31, 2019, the amount of cash held outside of the U.S. by foreign subsidiaries was $7.6 million. The Tax Cuts and Jobs Act of 2017 includes a mandatory one-time tax on accumulated earnings of foreign subsidiaries, and as a result, all previously unremitted earnings for which no U.S. deferred tax liability had been accrued have now been subject to U.S. tax. Notwithstanding the U.S. taxation of these amounts, we intend to continue to invest these earnings, as well as our capital in these subsidiaries, indefinitely outside of the U.S. and do not expect to incur any significant, additional taxes related to such amounts.
Share Repurchase Program
We have a share repurchase program under which we may repurchase shares of our common stock from time to time in the open market, subject to prevailing business and market conditions and other factors. Repurchases are made at management’s discretion in accordance with applicable federal securities law. The amount and timing of share repurchases depend on a variety of factors, including market conditions and prevailing stock prices. The share repurchase authorization does not obligate us to acquire any specific number of shares in any period, and may be modified, suspended or discontinued at any time at the discretion of our Board of Directors. During the year ended December 31, 2019, we did not repurchase shares of our common stock in the open market. During the years ended 2018 and 2017, we repurchased approximately 354,000 and 182,000 shares, respectively, of our common stock in the open market for a total cost of approximately $8.0 million and $4.3 million respectively. As of December 31, 2019, there was approximately $3.8 million available for future repurchases under the current buyback program. There is no expiration date for the repurchase program.
Acquisition-Related Payments
As of December 31, 2019, we didn't have any remaining contingent consideration liabilities outstanding in connection with previously completed acquisitions.
Proceeds from Divestitures
In connection with the sale of our tuition program management business which is discussed further in Note 4 to the Consolidated Financial Statements, we received cash proceeds of $18.7 million in October 2019. In addition, $1.5 million of the purchase price is being held in escrow to secure possible indemnification claims pursuant to the terms of an escrow agreement which expires October 1, 2020.
In connection with the sale of our Alternative Fuels Division effective January 1, 2020, we received upfront cash proceeds of $1.5 million on December 31, 2019 and $3.5 million of cash proceeds on January 2, 2020. In addition, up to $0.5 million of the purchase price is subject to the achievement of certain milestones under an assigned contract through the period December 31, 2021. The purchase price is also subject to adjustment for closing net working capital which is expected to be finalized during the first quarter of 2020.
34
Significant Customers & Concentration of Credit Risk
We have a market concentration of revenue in both the automotive sector and the financial services & insurance sector. Revenue from the automotive industry accounted for approximately 28%, 23% and 22% of our consolidated revenue for the years ended December 31, 2019, 2018 and 2017, respectively. In addition, we have a concentration of revenue from a single automotive customer, which accounted for approximately 13%, 14% and 13% of our consolidated revenue for the years ended December 31, 2019 , 2018 and 2017, respectively. As of December 31, 2019, accounts receivable from a single automotive customer totaled $17.2 million, or 13% of our consolidated accounts receivable balance.
Revenue from the financial services & insurance industry accounted for approximately 16%, 19% and 20% of our consolidated revenue for the years ended December 31, 2019, 2018 and 2017, respectively. In addition, we have a concentration of revenue from a single financial services customer, which accounted for approximately 10%, 13% and 14% of our consolidated revenue for the years ended December 31, 2019, 2018 and 2017, respectively. As of December 31, 2019, billed and unbilled accounts receivable from a single financial services customer totaled $15.4 million, or 8%, of our consolidated accounts receivable and unbilled revenue balances. No other single customer accounted for more than 10% of our consolidated revenue in 2019 or consolidated accounts receivable balance as of December 31, 2019.
Cash Flows
Year ended December 31, 2019 compared to the year ended December 31, 2018
Our cash balance decreased $5.3 million from $13.4 million as of December 31, 2018 to $8.2 million as of December 31, 2019. The decrease in cash during the year ended December 31, 2019 resulted from cash provided by operating activities of $13.4 million, cash provided by investing activities of $16.0 million, cash used in financing activities of $32.3 million and a $2.3 million negative effect due to exchange rate changes on cash.
Cash provided by operating activities was $13.4 million for the year ended December 31, 2019 compared to $11.2 million in 2018. The increase in cash provided by operating activities is primarily due to an increase in net income and non-cash add backs to net income and favorable changes in working capital accounts during 2019 compared to 2018.
Cash provided by investing activities was $16.0 million for the year ended December 31, 2019 compared to cash used in investing activities of $61.8 million in 2018. The increase in cash from investing activities is due to $20.0 million of cash proceeds from divestitures in 2019 compared to $55.3 million of cash used to complete acquisitions in 2018. In addition, there was $0.9 million decrease in capitalized software development costs in 2019 compared to 2018.
Cash used in financing activities was $32.3 million for the year ended December 31, 2019 compared to cash provided by financing activities of $40.0 million in 2018. The decrease in cash from financing activities is primarily due to $33.6 million of net repayments of borrowings under our Credit Agreement in 2019 compared to $50.9 million of net borrowings on our line of credit during 2018 to fund acquisitions. In addition, there was a $8.5 million decrease in cash used for open market share repurchases in 2019 compared to 2018 and a $3.2 million change in negative cash book balances during 2019 compared to 2018.
Cash Flow Comparison for Fiscal 2018 compared to 2017
For a comparison of our cash flows for the years ended December 31, 2018 and 2017, see "Part II, Item 7. Management's Discussion and Analysis of Financial Condition and Results of Operations" of our annual report on Form 10-K for the fiscal year ended December 31, 2018, filed with the SEC on April 1, 2019.
Debt
On November 30, 2018, we entered into a Credit Agreement with PNC Bank, National Association, as administrative agent for a syndicate of lenders (the “Credit Agreement”), replacing the prior credit agreement with Wells Fargo dated December 21, 2016, as amended on April 28, 2018 and June 29, 2018 (the "Original Credit Agreement"). The Credit Agreement provides for a revolving credit facility, which expires on November 29, 2023, and consists of: a revolving loan facility with a borrowing limit of $200 million, including a $20 million sublimit for foreign borrowings; an accordion feature allowing the Company to request increases in commitments to the credit facility by up to an additional $100 million; a $20 million letter of credit sublimit; and a swingline loan credit sublimit of $20 million. The obligations under the Credit Agreement are guaranteed by certain of the Company's subsidiaries (the "Guarantors"). As collateral security under the Credit Agreement and the guarantees thereof, the Company and
35
the Guarantors have granted to the administrative agent, for the benefit of the lenders, a lien on, and first priority security interest in substantially all of their tangible and intangible assets. The proceeds of the Credit Agreement were used, in part, to repay in full all outstanding borrowings under the Original Credit Agreement, and additional proceeds of the revolving credit facility are expected to be used for working capital and other general corporate purposes of the Company and its subsidiaries, including the issuance of letters of credit and Permitted Acquisitions, as defined.
Borrowings under the Credit Agreement may be in the form of Base Rate loans or Euro-Rate loans, at the option of the borrowers, and bear interest at the Base Rate plus 0.25% to 1.25% or the Daily LIBOR Rate plus 1.25% to 2.25% respectively. Base Rate loans will bear interest at a fluctuating per annum Base Rate equal to the highest of (i) the Overnight Bank Funding Rate, plus 0.5%, (ii) the Pime Rate, and (iii) the Daily LIBOR Rate, plus 100 basis points (1.0%); plus an Applicable Margin. Determination of the Applicable Margin is based on a pricing grid that is generally dependent upon the Company's Leverage Ratio (as defined) as of the end of the fiscal quarter for which consolidated financial statements have been most recently delivered. We may prepay the revolving loan, in whole or in part, at any time without premium or penalty, subject to certain conditions.
The Credit Agreement contains customary representations, warranties and affirmative covenants. The Credit Agreement also contains customary negative covenants, subject to negotiated exceptions, including but not limited to: (i) liens, (ii) investments, (iii) indebtedness, (iv) significant corporate changes, including mergers and acquisitions, (v) dispositions, (vi) restricted payments, including stock dividends, and (vii) certain other restrictive agreements. On June 28, 2019, we entered into an amendment to the Credit Agreement that requires the company to maintain compliance with a maximum leverage ratio of 3.75 to 1.0 for the fiscal quarter ended June 30, 2019, 3.5 to 1.0 for the fiscal quarter ending September 30, 2019 and 3.0 to 1.0 for the fiscal quarters ended December 31, 2019 and thereafter, and a minimum interest expense coverage ratio of 3.0 to 1.0. The leverage ratio is computed by dividing our Funded Debt by our Consolidated EBITDA, as those terms are defined in the Credit Agreement, for the trailing four fiscal quarters, and the interest coverage ratio is computed by dividing our Consolidated EBITDA by our Consolidated Interest Expense for the trailing four fiscal quarters. As of December 31, 2019, our leverage ratio was 2.3 to 1.0 and our interest expense ratio was 6.1 to 1.0, each of which was in compliance with the Credit Agreement.
As of December 31, 2019, we had $82.9 million of borrowings outstanding and $25.8 million of available borrowings under the revolving credit facility based on our consolidated leverage ratio. For the years ended December 31, 2019 and 2018, the weighted average interest rate on our borrowings was 4.5% and 4.0%, respectively. There were $1.2 million of unamortized debt issue costs related to the Credit Agreement as of December 31, 2019 which are being amortized to interest expense over the term of the Credit Agreement and are included in Other assets on our consolidated balance sheet.
Contractual Payment Obligations
We enter into various agreements that result in contractual obligations in connection with our business activities. These obligations primarily relate to debt and interest payments under our Credit Agreement, operating leases and purchase commitments under non-cancelable contracts for certain products and services. The following table summarizes our total contractual payment obligations as of December 31, 2019 (in thousands):
Payments due in | ||||||||||||||||||||
2020 | 2021-2022 | 2023-2024 | After 2024 | Total | ||||||||||||||||
Operating lease commitments | 8,411 | 11,703 | 8,268 | 6,060 | 34,442 | |||||||||||||||
Purchase commitments (1) | 8,175 | 9,252 | 1,878 | — | 19,305 | |||||||||||||||
Total | $ | 16,586 | $ | 20,955 | $ | 10,146 | $ | 6,060 | $ | 53,747 | ||||||||||
(1) | Excludes purchase orders for goods and services entered into by us in the ordinary course of business, which are non-binding and subject to amendment or termination within a reasonable notification period. |
Off-Balance Sheet Commitments
As of December 31, 2019, we had outstanding letters of credit totaling approximately $0.1 million, which expire in 2022. In addition, as of December 31, 2019, we had three outstanding performance bonds totaling $12.4 million primarily for contracts in our alternative fuels business. We do not have any off-balance sheet financing except for short-term operating leases and letters of credit entered into in the normal course of business.
36
Management Discussion of Critical Accounting Policies
The preparation of our consolidated financial statements in conformity with U.S. GAAP requires us to make estimates and assumptions that affect the reported amounts of assets and liabilities and disclosure of contingent assets and liabilities at the date of the financial statements and the reported amounts of revenues and expenses during the reporting period. Our estimates, judgments and assumptions are continually evaluated based on available information and experience. Because of the use of estimates inherent in the financial reporting process, actual results could differ from those estimates.
Certain of our accounting policies require higher degrees of judgment than others in their application. These include revenue recognition, impairment of intangible assets, including goodwill, valuation of contingent consideration for business acquisitions, and income taxes, which are summarized below. In addition, Note 1 to the accompanying Consolidated Financial Statements includes further discussion of our significant accounting policies.
Revenue Recognition
We account for revenue in accordance with ASC Topic 606, Revenue from Contracts with Customers (ASC Topic 606), which we adopted on January 1, 2018, using the modified retrospective method. Revenue is measured based on the consideration specified in a contract with a customer. Most of our contracts with customers contain transaction prices with fixed consideration, however, some contracts may contain variable consideration in the form of discounts, rebates, refunds, credits, price concessions, incentives, performance bonuses, penalties and other similar items. When a contract includes variable consideration, we evaluate the estimate of variable consideration to determine whether the estimate needs to be constrained; therefore, we include the variable consideration in the transaction price only to the extent that it is probable that a significant reversal of the amount of cumulative revenue recognized will not occur when the uncertainty associated with the variable consideration is subsequently resolved. We recognize revenue when we satisfy a performance obligation by transferring control over a product or service to a customer. This can result in recognition of revenue over time as we perform services or at a point in time when the deliverable is transferred to the customer, depending on an evaluation of the criteria for over time recognition in ASC Topic 606. Further details regarding our revenue recognition for various revenue streams are discussed below.
Nature of goods and services
Over 90% of our revenue is derived from services provided to our customers for training, consulting, technical, engineering and other services. Less than 10% of our revenue is derived from various other offerings including custom magazine publications and assembly of glovebox portfolios for automotive manufacturers, licenses of software and other intellectual property, and software as a service (SaaS) arrangements.
Our primary contract vehicles are time-and-materials, fixed price (including fixed-fee per transaction) and cost-reimbursable contracts. Each contract has different terms based on the scope, deliverables and complexity of the engagement, requiring us to make judgments and estimates about recognizing revenue.
Under time-and-materials and cost-reimbursable contracts, the contractual billing schedules are based on the specified level of resources we are obligated to provide. Revenue under these contract types are recognized over time as services are performed as the client simultaneously receives and consumes the benefits provided by our performance throughout the engagement. The time and materials incurred for the period is the measure of performance and, therefore, revenue is recognized in that amount.
For fixed price contracts which typically involve a discrete project, such as development of training content and materials, design of training processes, software implementation, or engineering projects, the contractual billing schedules are not necessarily based on the specified level of resources we are obligated to provide. These discrete projects generally do not contain milestones or other measures of performance. The majority of our fixed price contracts meet the criteria in ASC Topic 606 for over time revenue recognition. For these contracts, revenue is recognized using a percentage-of-completion method based on the relationship of costs incurred to total estimated costs expected to be incurred over the term of the contract. We believe this methodology is a reasonable measure of proportional performance since performance primarily involves personnel costs and services provided to the customer throughout the course of the projects through regular communications of progress toward completion and other project deliverables. In addition, the customer is required to pay us for the proportionate amount of our fees in the event of contract termination. A small portion of our fixed price contracts do not meet the criteria in ASC Topic 606 for over time revenue recognition. For these projects, we defer revenue recognition until the performance obligation is satisfied, which is generally when the final deliverable is provided to the client. The direct costs related to these projects are capitalized and then recognized as cost of revenue when the performance obligation is satisfied.
37
For fixed price contracts, when total direct cost estimates exceed revenues, the estimated losses are recognized immediately. The use of the percentage-of-completion method requires significant judgment relative to estimating total contract costs, including assumptions relative to the length of time to complete the project, the nature and complexity of the work to be performed, and anticipated changes in estimated salaries and other costs. Estimates of total contract costs are continuously monitored during the term of the contract, and recorded revenues and costs are subject to revision as the contract progresses. When revisions in estimated contract revenues and costs are determined, such adjustments are recorded in the period in which they are first identified. Adjustments to our fixed price contracts in the aggregate resulted in a net increase (decrease) to revenue of $1.8 million, $1.5 million, and $(0.8) million for the years ended December 31, 2019, 2018 and 2017, respectively.
For certain fixed-fee per transaction contracts, such as delivering training courses or conducting workshops, revenue is recognized during the period in which services are delivered in accordance with the pricing outlined in the contracts.
For certain fixed-fee per transaction and fixed price contracts in which the output of the arrangement is measurable, such as for the shipping of publications and print materials, revenue is recognized at the point in time at which control is transferred which is upon delivery.
Taxes assessed by a government authority that are both imposed on and concurrent with a specific revenue-producing transaction, that we collect from a customer, are excluded from revenue.
Contract Related Assets and Liabilities
The timing of revenue recognition, billings and cash collections results in billed accounts receivable, unbilled revenue (contract assets), and deferred revenue (contract liabilities) on the consolidated balance sheet. Amounts charged to our clients become billable according to the contract terms, which usually consider the passage of time, achievement of milestones or completion of the project. When billings occur after the work has been performed, such unbilled amounts will generally be billed and collected within 60 to 120 days but typically no longer than over the next twelve months. When we advance bill clients prior to the work being performed, generally, such amounts will be earned and recognized in revenue within the next twelve months. These assets and liabilities are reported on the consolidated balance sheet on a contract-by-contract basis at the end of each reporting period. Changes in the contract asset and liability balances during the year ended December 31, 2019 were not materially impacted by any other factors, except for a significant decrease in unbilled revenue as of December 31, 2019 compared to 2018 due to a delay in billings at the end of 2018 in connection with the implementation of a new ERP system in the fourth quarter of 2018.
Impairment of Intangible Assets, Including Goodwill
We review goodwill for impairment annually as of October 1st and whenever events or changes in circumstances indicate the carrying value of an asset may not be recoverable. We test goodwill at the reporting unit level. A reporting unit is an operating segment, or one level below an operating segment, as defined by U.S. GAAP. We have four reporting units for purposes of goodwill impairment testing, which represent our four practices which are one level below our operating segments.
Our goodwill balances as of December 31, 2019 for each reporting unit were as follows (in thousands):
Reporting Unit | |||
Managed Learning Services | $ | 75,209 | |
Engineering & Technical Services | 42,804 | ||
Sales Enablement | 7,516 | ||
Organizational Development | 46,034 | ||
$ | 171,563 | ||
ASC 350 permits an entity to first assess qualitative factors to determine whether it is more likely than not that the fair value of a reporting unit is less than its carrying amount as a basis for determining whether it is necessary to perform a quantitative goodwill impairment test. Under ASC 350, an entity is not required to perform a quantitative goodwill impairment test for a reporting unit if it is more likely than not that its fair value is greater than its carrying amount. For our annual goodwill impairment tests as of October 1, 2019 and 2018, we performed a quantitative goodwill impairment test and concluded that the fair values of each of our reporting units exceeded their respective carrying values. Each of the reporting units had a significant excess fair value over its respective carrying value, with the exception of the Organizational Development reporting unit which had a fair value that exceeded its carrying value by 11% as of the October 1, 2019 testing date. The Organizational Development reporting unit has a significant amount of goodwill attributable to previously completed acquisitions. If it continues to experience declines, fails to meet its financial
38
projections, or if other adverse market conditions occur which would lower the fair value of the business, we could incur material goodwill and other intangible asset impairment charges in the future.
In the quantitative impairment test, we compare the fair value of each reporting unit to its carrying value. If the fair value of the reporting unit exceeds the carrying value of the net assets assigned to that unit, goodwill is not impaired and we are not required to perform further testing. If the carrying value of the net assets assigned to the reporting unit exceeds the fair value of the reporting unit, then we record an impairment loss equal to the difference, however, the loss recognized would not exceed the total amount of goodwill allocated to the reporting unit.
We determine the fair value of our reporting units using both an income approach and a market approach, and weigh both approaches to determine the fair value of each reporting unit. Under the income approach, we perform a discounted cash flow analysis which incorporates management’s cash flow projections over a five-year period and a terminal value is calculated by applying a capitalization rate to terminal year projections based on an estimated long-term growth rate. The five-year projected cash flows and calculated terminal value are discounted using a weighted average cost of capital (“WACC”) which takes into account the costs of debt and equity. The cost of equity is based on the risk-free interest rate, equity risk premium, industry and size equity premiums and any additional market equity risk premiums as deemed appropriate for each reporting unit. To arrive at a fair value for each reporting unit, the terminal value is discounted by the WACC and added to the present value of the estimated cash flows over the discrete five-year period. There are a number of other variables which impact the projected cash flows, such as expected revenue growth and profitability levels, working capital requirements, capital expenditures and related depreciation and amortization. Under the market approach, we perform a comparable public company analysis and apply revenue and earnings multiples from the identified set of companies to the reporting unit’s actual and forecasted financial performance to determine the fair value of each reporting unit. We evaluate the reasonableness of the fair value calculations of our reporting units by reconciling the total of the fair values of all of our reporting units to our total market capitalization, and adjusting for an appropriate control premium. In addition, we make certain judgments in allocating shared assets and liabilities to determine the carrying values for each of our reporting units.
Determining the fair value of a reporting unit is judgmental in nature and involves the use of significant estimates and assumptions. These estimates and assumptions include revenue growth rates and operating margins used to calculate projected future cash flows, risk-adjusted discount rates, future economic and market conditions and determination of appropriate market comparables. We base our fair value estimates on assumptions we believe to be reasonable but that are unpredictable and inherently uncertain. Actual future results may differ from those estimates. In addition, we make certain judgments and assumptions in allocating shared assets and liabilities to determine the carrying values for each of our reporting units. The timing and frequency of our goodwill impairment tests are based on an ongoing assessment of events and circumstances that would indicate a possible impairment. We will continue to monitor our goodwill and intangible assets for impairment and conduct formal tests when impairment indicators are present.
Valuation of Contingent Consideration for Business Acquisitions
Acquisitions may include contingent consideration payments based on future financial measures of an acquired company. Contingent consideration is required to be recognized at fair value as of the acquisition date. We estimate the fair value of these liabilities using an appropriate valuation methodology, typically either an income-based approach or a simulation model, such as the Monte Carlo model, depending on the structure of the contingent consideration arrangement. We believe our estimates and assumptions are reasonable; however, there is significant judgment involved. At each reporting date, the contingent consideration obligation are revalued to estimated fair value and changes in fair value subsequent to the acquisition are reflected in income or expense in the consolidated statements of operations, and could cause a material impact to our operating results. Changes in the fair value of contingent consideration obligations may result from changes in discount periods and rates and changes in the timing and amount of revenue and/or earnings projections.
Income Taxes
We account for income taxes using the asset and liability method. Deferred tax assets and liabilities are recognized for future tax consequences attributable to differences between the financial statement carrying amounts of existing assets and liabilities and their respective tax basis and for operating loss and tax credit carryforwards. Deferred tax assets and liabilities are measured using enacted tax rates expected to apply to taxable income in the years in which those temporary differences are expected to be recovered or settled. The effect on deferred tax assets and liabilities of a change in tax rates is recognized in income in the period that includes the enactment date.
39
The measurement of deferred taxes often involves an exercise of judgment related to the computation and realization of tax basis. Our deferred tax assets and liabilities reflect our assessment that tax positions taken, and the resulting tax basis, are more likely than not to be sustained if they are audited by taxing authorities. We establish accruals for uncertain tax positions taken or expected to be taken in a tax return when it is more likely than not (i.e., a likelihood of more than fifty percent) that the position would be sustained upon examination by tax authorities that have full knowledge of all relevant information. A recognized tax position is then measured at the largest amount of benefit that is greater than fifty percent likely of being realized upon ultimate settlement. A number of years may elapse before a particular matter, for which we have or have not established an accrual, is audited and finally resolved. Favorable or unfavorable adjustment of the accrual for any particular issue would be recognized as an increase or decrease to our income tax expense in the period of a change in facts and circumstances.
In assessing the realizability of our deferred tax assets, we consider whether it is more likely than not that some portion or all of the deferred tax assets may not be realized. The ultimate realization of the deferred tax assets is dependent upon the generation of future income during the periods in which temporary differences are deductible. Management considers the scheduled reversal of deferred tax liabilities, projected future taxable income and tax planning strategies in making this assessment. Based upon these factors, we believe it is more likely than not that we will realize the benefits of our deferred tax assets, net of the valuation allowance. The valuation allowance primarily relates to both foreign and domestic net operating loss carryforwards for which we do not believe the benefits may be realized.
The above matters, and others, involve the exercise of significant judgment. Any changes in our practices or judgments involved in the measurement of deferred tax assets and liabilities could materially impact our financial condition or results of operations.
Accounting Standards Issued and Adopted
We discuss recently issued and adopted accounting standards in Note 1 to the accompanying Consolidated Financial Statements.
40
Item 7A: Quantitative and Qualitative Disclosures about Market Risk
Our primary exposure to market risk relates to changes in interest rates and foreign currency exchange rates.
Interest Rate Risk
We are exposed to interest rate risk related to our outstanding debt obligations. On November 30, 2018, we entered into a new credit agreement with a bank which provides for a five-year secured revolving loan facility in an aggregate principal amount of up to $200.0 million. As of December 31, 2019, we had $82.9 million outstanding under the credit facility. We may draw funds from our revolving credit facility under interest rates based on either the Federal Funds Rate or the Adjusted London Interbank Offered Rate (“LIBOR rate”). If these rates increase significantly, our costs to borrow these funds will also increase. In an effort to manage our exposure to this risk, we have entered into interest rate derivative contracts. As of December 31, 2019, we did not have any interest rate hedging instruments in place but may enter into new hedging instruments in the future to mitigate our exposure to interest rate risk.
We estimate that the fair value of our borrowings under our revolving credit facility approximates its carrying value as of December 31, 2019 as it bears interest at variable rates.
Foreign Currency Exchange Rate Risk
We operate in various foreign countries, which exposes us to market risk associated with foreign currency exchange rate fluctuations. Our foreign currency exposure primarily relates to intercompany receivables and payables and third party receivables and payables that are denominated in currencies other than the functional currency of our legal entities. Our largest foreign currency exposure is unsettled intercompany payables and receivables which are reviewed on a regular basis. Gains and losses from foreign currency transactions are included in "Other income (expense)" on our Consolidated Statements of Operations. We had foreign currency transaction losses totaling $0.7 million, $2.3 million and $0.3 million for the years ended December 31, 2019, 2018 and 2017, respectively.
Most of our foreign subsidiaries operate in a currency other than the United States dollar; therefore, increases or decreases in the value of the U.S. dollar against other major currencies will affect our operating results and the value of our balance sheet items denominated in foreign currencies. Our most significant exposures to translation risk relates to functional currency assets and liabilities that are denominated in the British Pound Sterling, Euro and Canadian dollar. The changes in the net investments of foreign subsidiaries whose currencies are denominated in currencies other than the U.S. dollar are reflected in "Foreign currency translation adjustments” on our Consolidated Statements of Comprehensive Income. We have not used any exchange rate hedging programs to mitigate the effect of exchange rate fluctuations.
41
Item 8: Financial Statements and Supplementary Data
Page | |
Financial Statements of GP Strategies Corporation and Subsidiaries: | |
Reports of Independent Registered Public Accounting Firm | |
Consolidated Balance Sheets – December 31, 2019 and 2018 | |
Consolidated Statements of Operations – Years ended December 31, 2019, 2018 and 2017 | |
Consolidated Statements of Comprehensive Income – Years ended December 31, 2019, 2018 and 2017 | |
Consolidated Statements of Stockholders’ Equity – Years ended December 31, 2019, 2018 and 2017 | |
Consolidated Statements of Cash Flows – Years ended December 31, 2019, 2018 and 2017 | |
Notes to Consolidated Financial Statements | |
42
Report of Independent Registered Public Accounting Firm
To the Stockholders and Board of Directors
GP Strategies Corporation:
Opinion on the Consolidated Financial Statements
We have audited the accompanying consolidated balance sheets of GP Strategies Corporation and subsidiaries (the Company) as of December 31, 2019 and 2018, the related consolidated statements of operations, comprehensive income, stockholders’ equity, and cash flows for each of the years in the three‑year period ended December 31, 2019, and the related notes (collectively, the consolidated financial statements). In our opinion, the consolidated financial statements present fairly, in all material respects, the financial position of the Company as of December 31, 2019 and 2018, and the results of its operations and its cash flows for each of the years in the three‑year period ended December 31, 2019, in conformity with U.S. generally accepted accounting principles.
We also have audited, in accordance with the standards of the Public Company Accounting Oversight Board (United States) (PCAOB), the Company’s internal control over financial reporting as of December 31, 2019, based on criteria established in Internal Control - Integrated Framework (2013) issued by the Committee of Sponsoring Organizations of the Treadway Commission, and our report dated March 10, 2020 expressed an adverse opinion on the effectiveness of the Company’s internal control over financial reporting.
Change in Accounting Principle
As discussed in Notes 1 and 14 to the consolidated financial statements, effective January 1, 2019, the Company adopted Financial Accounting Standards Board (FASB) Accounting Standards Codification (ASC) Topic 842, Leases. This change was adopted using the modified retrospective method.
As discussed in Notes 1 and 2 to the consolidated financial statements, effective January 1, 2018, the Company adopted FASB ASC Topic 606, Revenue from Contracts with Customers. This change was adopted using the modified retrospective method.
Basis for Opinion
These consolidated financial statements are the responsibility of the Company’s management. Our responsibility is to express an opinion on these consolidated financial statements based on our audits. We are a public accounting firm registered with the PCAOB and are required to be independent with respect to the Company in accordance with the U.S. federal securities laws and the applicable rules and regulations of the Securities and Exchange Commission and the PCAOB.
We conducted our audits in accordance with the standards of the PCAOB. Those standards require that we plan and perform the audit to obtain reasonable assurance about whether the consolidated financial statements are free of material misstatement, whether due to error or fraud. Our audits included performing procedures to assess the risks of material misstatement of the consolidated financial statements, whether due to error or fraud, and performing procedures that respond to those risks. Such procedures included examining, on a test basis, evidence regarding the amounts and disclosures in the consolidated financial statements. Our audits also included evaluating the accounting principles used and significant estimates made by management, as well as evaluating the overall presentation of the consolidated financial statements. We believe that our audits provide a reasonable basis for our opinion.
/s/ KPMG LLP
We or our predecessor firms have served as the Company’s auditor since 1970.
Baltimore, Maryland
March 10, 2020
43
Report of Independent Registered Public Accounting Firm
To the Stockholders and Board of Directors
GP Strategies Corporation:
Opinion on Internal Control Over Financial Reporting
We have audited GP Strategies Corporation and subsidiaries’ (the Company) internal control over financial reporting as of December 31, 2019, based on criteria established in Internal Control - Integrated Framework (2013) issued by the Committee of Sponsoring Organizations of the Treadway Commission. In our opinion, because of the effect of the material weaknesses, described below, on the achievement of the objectives of the control criteria, the Company has not maintained effective internal control over financial reporting as of December 31, 2019, based on criteria established in Internal Control - Integrated Framework (2013) issued by the Committee of Sponsoring Organizations of the Treadway Commission.
We also have audited, in accordance with the standards of the Public Company Accounting Oversight Board (United States) (PCAOB), the consolidated balance sheets of the Company as of December 31, 2019 and 2018, the related consolidated statements of operations, comprehensive income, stockholders’ equity, and cash flows for each of the years in the three-year period ended December 31, 2019, and the related notes (collectively, the consolidated financial statements), and our report dated March 10, 2020 expressed an unqualified opinion on those consolidated financial statements.
A material weakness is a deficiency, or a combination of deficiencies, in internal control over financial reporting, such that there is a reasonable possibility that a material misstatement of the company’s annual or interim financial statements will not be prevented or detected on a timely basis. The following material weaknesses were identified and included in management’s assessment:
Our risk assessment process was not effective in considering changes to the business operations, personnel and other factors affecting certain financial reporting processes, and we did not have sufficient resources available to perform the risk assessment process and implement controls in the requisite timeframe. This resulted in:
• | Ineffective program change management controls over program and data changes affecting the enterprise resource planning (ERP) financial IT applications. Specifically, the change management process was not designed properly to demonstrate the completeness and approval of all configuration changes that have occurred. The related detective control to monitor changes was not implemented. Also, the control over access to migrate changes into the production environment was determined to be ineffective. |
• | Ineffective user access controls to adequately restrict user access to financial applications and related data commensurate with job responsibilities. Management did not perform appropriate user access reviews. |
• | Ineffective general information technology controls over the ERP system resulting in ineffective automated controls and manual controls that are dependent upon the completeness and accuracy of information derived from the ERP system. This includes automated and manual controls over all significant accounts presented in the consolidated financial statements. |
• | Ineffective risk assessment to ensure controls were designed and implemented to respond to the risks within the revenue and human resources processes company-wide as well as other processes specific to only TTi Global, Inc., which was acquired on November 30, 2018. |
The material weaknesses were considered in determining the nature, timing, and extent of audit tests applied in our audit of the 2019 consolidated financial statements, and this report does not affect our report on those consolidated financial statements.
44
Basis for Opinion
The Company’s management is responsible for maintaining effective internal control over financial reporting and for its assessment of the effectiveness of internal control over financial reporting, included in the accompanying Management’s Annual Report on Internal Control over Financial Reporting. Our responsibility is to express an opinion on the Company’s internal control over financial reporting based on our audit. We are a public accounting firm registered with the PCAOB and are required to be independent with respect to the Company in accordance with the U.S. federal securities laws and the applicable rules and regulations of the Securities and Exchange Commission and the PCAOB.
We conducted our audit in accordance with the standards of the PCAOB. Those standards require that we plan and perform the audit to obtain reasonable assurance about whether effective internal control over financial reporting was maintained in all material respects. Our audit of internal control over financial reporting included obtaining an understanding of internal control over financial reporting, assessing the risk that a material weakness exists, and testing and evaluating the design and operating effectiveness of internal control based on the assessed risk. Our audit also included performing such other procedures as we considered necessary in the circumstances. We believe that our audit provides a reasonable basis for our opinion.
Definition and Limitations of Internal Control Over Financial Reporting
A company’s internal control over financial reporting is a process designed to provide reasonable assurance regarding the reliability of financial reporting and the preparation of financial statements for external purposes in accordance with generally accepted accounting principles. A company’s internal control over financial reporting includes those policies and procedures that (1) pertain to the maintenance of records that, in reasonable detail, accurately and fairly reflect the transactions and dispositions of the assets of the company; (2) provide reasonable assurance that transactions are recorded as necessary to permit preparation of financial statements in accordance with generally accepted accounting principles, and that receipts and expenditures of the company are being made only in accordance with authorizations of management and directors of the company; and (3) provide reasonable assurance regarding prevention or timely detection of unauthorized acquisition, use, or disposition of the company’s assets that could have a material effect on the financial statements.
Because of its inherent limitations, internal control over financial reporting may not prevent or detect misstatements. Also, projections of any evaluation of effectiveness to future periods are subject to the risk that controls may become inadequate because of changes in conditions, or that the degree of compliance with the policies or procedures may deteriorate.
/s/ KPMG LLP
Baltimore, Maryland
March 10, 2020
45
GP STRATEGIES CORPORATION AND SUBSIDIARIES
Consolidated Balance Sheets
December 31, 2019 and 2018
(In thousands, except shares and par value per share)
2019 | 2018 | |||||||
Assets | ||||||||
Current assets: | ||||||||
Cash | $ | 8,159 | $ | 13,417 | ||||
Accounts and other receivables, less allowance for doubtful accounts of $1,132 in 2019 and $2,034 in 2018 | 131,852 | 107,673 | ||||||
Unbilled revenue | 57,229 | 80,764 | ||||||
Prepaid expenses and other current assets | 19,115 | 19,048 | ||||||
Total current assets | 216,355 | 220,902 | ||||||
Property, plant and equipment, net | 5,803 | 5,859 | ||||||
Operating lease right-of-use assets | 27,251 | — | ||||||
Goodwill | 171,563 | 176,124 | ||||||
Intangible assets, net | 16,344 | 20,933 | ||||||
Deferred tax assets | 1,121 | 1,077 | ||||||
Other assets, net | 10,465 | 9,843 | ||||||
$ | 448,902 | $ | 434,738 | |||||
Liabilities and Stockholders’ Equity | ||||||||
Current liabilities: | ||||||||
Accounts payable and accrued expenses | 92,332 | 93,254 | ||||||
Current portion of operating lease liability | 7,871 | — | ||||||
Deferred revenue | 23,234 | 23,704 | ||||||
Total current liabilities | 123,437 | 116,958 | ||||||
Long-term debt | 82,870 | 116,500 | ||||||
Long-term portion of operating lease liability | 22,159 | — | ||||||
Deferred tax liabilities | 7,439 | 8,817 | ||||||
Other noncurrent liabilities | 3,083 | 5,894 | ||||||
Total liabilities | 238,988 | 248,169 | ||||||
Stockholders’ equity: | ||||||||
Preferred stock, par value $0.01 per share; | ||||||||
Authorized 10,000,000 shares; no shares issued | — | — | ||||||
Common stock, par value $0.01 per share; Authorized 35,000,000 shares; issued 17,222,781 shares in 2019 and 2018 | 172 | 172 | ||||||
Additional paid-in capital | 102,319 | 105,850 | ||||||
Retained earnings | 131,228 | 116,039 | ||||||
Treasury stock, at cost (190,115 shares in 2019 and 603,041 shares in 2018) | (4,070 | ) | (13,802 | ) | ||||
Accumulated other comprehensive loss | (19,735 | ) | (21,690 | ) | ||||
Total stockholders’ equity | 209,914 | 186,569 | ||||||
$ | 448,902 | $ | 434,738 | |||||
See accompanying notes to consolidated financial statements.
46
GP STRATEGIES CORPORATION AND SUBSIDIARIES
Consolidated Statements of Operations
Years ended December 31, 2019, 2018 and 2017
(In thousands, except per share data)
2019 | 2018 | 2017 | ||||||||||
Revenue | $ | 583,290 | $ | 515,160 | $ | 509,208 | ||||||
Cost of revenue | 494,077 | 437,417 | 427,181 | |||||||||
Gross profit | 89,213 | 77,743 | 82,027 | |||||||||
General and administrative expenses | 64,492 | 54,848 | 55,753 | |||||||||
Sales and marketing expenses | 7,875 | 4,798 | 1,666 | |||||||||
Restructuring charges | 1,639 | 2,930 | 3,317 | |||||||||
Gain on change in fair value of contingent consideration, net | 677 | 4,438 | 1,620 | |||||||||
Gain on sale of business | 12,126 | — | — | |||||||||
Operating income | 28,010 | 19,605 | 22,911 | |||||||||
Interest expense | 6,058 | 2,945 | 3,132 | |||||||||
Other income (expense) (including interest income of $50 in 2019, $8 in 2018 and $43 in 2017) | 417 | (1,897 | ) | (90 | ) | |||||||
Income before income taxes | 22,369 | 14,763 | 19,689 | |||||||||
Income tax expense | 7,180 | 4,927 | 6,798 | |||||||||
Net income | $ | 15,189 | $ | 9,836 | $ | 12,891 | ||||||
Basic weighted average shares outstanding | 16,827 | 16,608 | 16,748 | |||||||||
Diluted weighted average shares outstanding | 16,861 | 16,696 | 16,873 | |||||||||
Per common share data: | ||||||||||||
Basic earnings per share | $ | 0.90 | $ | 0.59 | $ | 0.77 | ||||||
Diluted earnings per share | $ | 0.90 | $ | 0.59 | $ | 0.76 | ||||||
See accompanying notes to consolidated financial statements.
47
GP STRATEGIES CORPORATION AND SUBSIDIARIES
Consolidated Statements of Comprehensive Income
Years ended December 31, 2019, 2018 and 2017
(In thousands)
2019 | 2018 | 2017 | ||||||||||
Net income | $ | 15,189 | $ | 9,836 | $ | 12,891 | ||||||
Foreign currency translation adjustments | 1,955 | (6,914 | ) | 6,686 | ||||||||
Change in fair value of interest rate cap, net of tax | — | 142 | (142 | ) | ||||||||
Change in fair value of interest rate swap, net of tax | — | (63 | ) | 63 | ||||||||
Comprehensive income | $ | 17,144 | $ | 3,001 | $ | 19,498 | ||||||
See accompanying notes to consolidated financial statements.
48
GP STRATEGIES CORPORATION AND SUBSIDIARIES
Consolidated Statements of Stockholders’ Equity
Years ended December 31, 2019, 2018 and 2017
(In thousands, except for par value per share)
Common stock ($0.01 par) | Additional paid-in capital | Retained earnings | Treasury stock at cost | Accumulated other comprehensive loss | Total stockholders’ equity | |||||||||||||||||||
Balance at December 31, 2016 | $ | 172 | $ | 106,803 | $ | 93,708 | $ | (11,628 | ) | $ | (21,462 | ) | $ | 167,593 | ||||||||||
Net income | — | — | 12,891 | — | — | 12,891 | ||||||||||||||||||
Foreign currency translation adjustments | — | — | — | — | 6,686 | 6,686 | ||||||||||||||||||
Change in fair value of interest rate cap, net of tax | (142 | ) | (142 | ) | ||||||||||||||||||||
Change in fair value of interest rate swap, net of tax | 63 | 63 | ||||||||||||||||||||||
Repurchases of common stock in the open market | — | — | — | (4,302 | ) | — | (4,302 | ) | ||||||||||||||||
Stock-based compensation expense | — | 3,589 | — | — | — | 3,589 | ||||||||||||||||||
Shares withheld in exchange for tax withholding payments on stock-based compensation | — | (1,168 | ) | — | — | — | (1,168 | ) | ||||||||||||||||
Issuance of stock for employer contributions to retirement plan | — | 40 | — | 2,685 | — | 2,725 | ||||||||||||||||||
Net issuances of stock pursuant to stock compensation plans and other | — | (2,008 | ) | — | 2,127 | — | 119 | |||||||||||||||||
Balance at December 31, 2017 | $ | 172 | $ | 107,256 | $ | 106,599 | $ | (11,118 | ) | $ | (14,855 | ) | $ | 188,054 | ||||||||||
Cumulative effect adjustment of adopting ASU 2014-09 | — | — | (396 | ) | — | — | (396 | ) | ||||||||||||||||
Adjusted balance at December 31, 2017 | $ | 172 | $ | 107,256 | $ | 106,203 | $ | (11,118 | ) | $ | (14,855 | ) | $ | 187,658 | ||||||||||
Net income | — | — | 9,836 | — | — | 9,836 | ||||||||||||||||||
Foreign currency translation adjustments | — | — | — | — | (6,914 | ) | (6,914 | ) | ||||||||||||||||
Change in fair value of interest rate cap, net of tax | 142 | 142 | ||||||||||||||||||||||
Change in fair value of interest rate swap, net of tax | (63 | ) | (63 | ) | ||||||||||||||||||||
Repurchases of common stock in the open market | — | — | — | (7,993 | ) | — | (7,993 | ) | ||||||||||||||||
Stock-based compensation expense | — | 1,350 | — | — | — | 1,350 | ||||||||||||||||||
Shares withheld in exchange for tax withholding payments on stock-based compensation | — | (416 | ) | — | — | — | (416 | ) | ||||||||||||||||
Issuance of stock for employer contributions to retirement plan | — | (867 | ) | — | 3,827 | — | 2,960 | |||||||||||||||||
Net issuances of stock pursuant to stock compensation plans and other | — | (1,473 | ) | — | 1,482 | — | 9 | |||||||||||||||||
Balance at December 31, 2018 | $ | 172 | $ | 105,850 | $ | 116,039 | $ | (13,802 | ) | $ | (21,690 | ) | $ | 186,569 | ||||||||||
Net income | — | — | 15,189 | — | — | 15,189 | ||||||||||||||||||
Foreign currency translation adjustments | — | — | — | — | 1,955 | 1,955 | ||||||||||||||||||
Stock-based compensation expense | — | 2,617 | — | — | — | 2,617 | ||||||||||||||||||
Shares withheld in exchange for tax withholding payments on stock-based compensation | — | (278 | ) | — | — | — | (278 | ) | ||||||||||||||||
Issuance of stock for employer contributions to retirement plan | — | (2,251 | ) | — | 5,229 | — | 2,978 | |||||||||||||||||
Net issuances of stock pursuant to stock compensation plans and other | — | (3,619 | ) | — | 4,503 | — | 884 | |||||||||||||||||
Balance at December 31, 2019 | $ | 172 | $ | 102,319 | $ | 131,228 | $ | (4,070 | ) | $ | (19,735 | ) | $ | 209,914 | ||||||||||
See accompanying notes to consolidated financial statements.
49
GP STRATEGIES CORPORATION AND SUBSIDIARIES
Consolidated Statements of Cash Flows
Years ended December 31, 2019, 2018 and 2017
(In thousands)
2019 | 2018 | 2017 | ||||||||||
Cash flows from operating activities: | ||||||||||||
Net income | $ | 15,189 | $ | 9,836 | $ | 12,891 | ||||||
Adjustments to reconcile net income to net cash provided by operating activities: | ||||||||||||
Gain on change in fair value of contingent consideration, net | (677 | ) | (4,438 | ) | (1,620 | ) | ||||||
Gain on sale of business | (12,126 | ) | — | — | ||||||||
Depreciation and amortization | 9,482 | 7,921 | 6,974 | |||||||||
Non-cash compensation expense | 5,595 | 4,310 | 6,314 | |||||||||
Deferred income taxes | (1,086 | ) | 876 | (313 | ) | |||||||
Changes in other operating items, net of acquired amounts: | ||||||||||||
Accounts and other receivables | (23,803 | ) | 23,092 | (10,977 | ) | |||||||
Unbilled revenue | 23,473 | (36,868 | ) | (1,893 | ) | |||||||
Prepaid expenses and other current assets | 421 | 705 | (2,297 | ) | ||||||||
Accounts payable, accrued expenses and net change in operating leases | (4,859 | ) | 8,110 | 15,392 | ||||||||
Deferred revenue | (326 | ) | (2,094 | ) | 2,520 | |||||||
Contingent consideration payments in excess of fair value on acquisition date | — | — | (408 | ) | ||||||||
Other | 2,117 | (240 | ) | (323 | ) | |||||||
Net cash provided by operating activities | 13,400 | 11,210 | 26,260 | |||||||||
Cash flows from investing activities: | ||||||||||||
Additions to property, plant and equipment | (2,315 | ) | (2,834 | ) | (2,734 | ) | ||||||
Proceeds from sale of business | 20,048 | — | — | |||||||||
Acquisitions, net of cash acquired | 850 | (55,290 | ) | (11,111 | ) | |||||||
Capitalized software development costs | (2,632 | ) | (3,544 | ) | (1,313 | ) | ||||||
Other investing activities | — | (86 | ) | (295 | ) | |||||||
Net cash provided by (used in) investing activities | 15,951 | (61,754 | ) | (15,453 | ) | |||||||
Cash flows from financing activities: | ||||||||||||
Proceeds from (repayment of) short-term borrowings | — | (37,577 | ) | 19,864 | ||||||||
Proceeds from long-term debt | 178,750 | 146,000 | — | |||||||||
Repayments of long-term debt | (212,380 | ) | (57,500 | ) | (12,000 | ) | ||||||
Contingent consideration payments | — | — | (4,657 | ) | ||||||||
Change in negative cash book balance | 1,932 | (1,278 | ) | (2,138 | ) | |||||||
Repurchases of common stock | — | (8,522 | ) | (3,773 | ) | |||||||
Tax withholding payments for employee stock-based compensation in exchange for shares surrendered | (278 | ) | (416 | ) | (1,168 | ) | ||||||
Premium paid on interest rate cap | — | — | (474 | ) | ||||||||
Cash proceeds from termination of interest rate derivatives | — | 544 | — | |||||||||
Payment of debt issuance costs | (303 | ) | (1,231 | ) | — | |||||||
Other financing activities | — | 10 | 120 | |||||||||
Net cash provided by (used in) financing activities | (32,279 | ) | 40,030 | (4,226 | ) | |||||||
50
2019 | 2018 | 2017 | ||||||||||
Effect of exchange rate changes on cash | (2,330 | ) | 319 | 685 | ||||||||
Net change in cash | (5,258 | ) | (10,195 | ) | 7,266 | |||||||
Cash at beginning of year | 13,417 | 23,612 | 16,346 | |||||||||
Cash at end of year | $ | 8,159 | $ | 13,417 | $ | 23,612 | ||||||
Supplemental disclosures of cash flow information: | ||||||||||||
Cash paid during the year for: | ||||||||||||
Interest | $ | 5,831 | $ | 3,741 | $ | 1,841 | ||||||
Income taxes | $ | 4,327 | $ | 4,528 | $ | 6,256 | ||||||
Non-cash financing activities: | ||||||||||||
Accrued share repurchases | $ | — | $ | (529 | ) | $ | 529 | |||||
Accrued contingent consideration | $ | — | $ | 905 | $ | 5,613 | ||||||
See accompanying notes to consolidated financial statements.
51
GP STRATEGIES CORPORATION
Notes to Consolidated Financial Statements
(1) | Description of Business and Significant Accounting Policies |
Business
GP Strategies Corporation is a global performance improvement solutions provider of training, digital learning solutions, management consulting and engineering services. References in this report to “GP Strategies,” the “Company,” “we” and “our” are to GP Strategies Corporation and its subsidiaries, collectively.
FASB Codification
We follow generally accepted accounting principles (“GAAP”) set by the Financial Accounting Standards Board (“FASB”). References to GAAP issued by the FASB in these footnotes are to the FASB Accounting Standards Codification, sometimes referred to as ASC.
Basis of Consolidation
The consolidated financial statements include the operations of our wholly-owned subsidiaries. All significant intercompany balances and transactions have been eliminated.
Significant Customers & Concentration of Credit Risk
We have a market concentration of revenue in both the automotive sector and financial services & insurance sector. Revenue from the automotive industry accounted for approximately 28%, 23% and 22% of our consolidated revenue for the years ended December 31, 2019, 2018 and 2017, respectively. In addition, we have a concentration of revenue from a single automotive customer, which accounted for approximately 13%, 14% and 13% of our consolidated revenue for the years ended December 31, 2019, 2018 and 2017, respectively. As of December 31, 2019 accounts receivable from a single automotive customer totaled $17.2 million, or 13%, of our consolidated accounts receivable balance.
Revenue from the financial services and insurance industry accounted for approximately 16%, 19% and 20% of our consolidated revenue for the years ended December 31, 2019, 2018 and 2017, respectively. In addition, we have a concentration of revenue from a single financial services customer, which accounted for approximately 10%, 13% and 14% of our consolidated revenue for the years ended December 31, 2019, 2018 and 2017, respectively. As of December 31, 2019, billed and unbilled accounts receivable from a single financial services customer totaled $15.4 million, or 8%, of our consolidated accounts receivable and unbilled revenue balances.
No other single customer accounted for more than 10% of our consolidated revenue in 2019 or consolidated accounts receivable balance as of December 31, 2019.
Cash
We maintain our cash balances in bank accounts at various financial institutions. Outstanding checks which have been issued but not presented to the banks for payment in excess of amounts on deposit may create negative book cash balances. We transfer cash on an as-needed basis to fund these items as they clear the bank in subsequent periods. Such negative cash balances are included in accounts payable and accrued expenses and totaled $3.7 million and $1.8 million as of December 31, 2019 and 2018, respectively. Changes in negative book cash balances from period to period are reported as a financing activity in the consolidated statement of cash flows.
52
GP STRATEGIES CORPORATION
Notes to Consolidated Financial Statements
Allowance for Doubtful Accounts Receivable
Trade accounts receivable are recorded at invoiced amounts. We evaluate the collectability of trade accounts receivable based on a combination of factors. When we are aware that a specific customer may be unable to meet its financial obligations to us, such as in the case of bankruptcy filings or deterioration in the customer’s operating results or financial position, we evaluate the need to record a specific reserve for bad debt to reduce the related receivable to the amount we reasonably believe is collectible. We also record reserves for bad debt for all other customers based on a variety of factors, including the length of time the receivables are past due, historical collection experience and trends of past due accounts, write-offs and specific identification and review of past due accounts. Actual collections of trade receivables could differ from management’s estimates due to changes in future economic or industry conditions or specific customers’ financial conditions.
Activity in our allowance for doubtful accounts was comprised of the following for the periods indicated:
Year ended December 31, | ||||||||||||
2019 | 2018 | 2017 | ||||||||||
(In thousands) | ||||||||||||
Beginning balance | $ | 2,034 | $ | 2,492 | $ | 1,091 | ||||||
Additions | 2,871 | 234 | 1,720 | |||||||||
Deductions | (3,773 | ) | (692 | ) | (319 | ) | ||||||
Ending balance | $ | 1,132 | $ | 2,034 | $ | 2,492 | ||||||
During the fourth quarter ended December 31, 2017, we recognized a $1.3 million bad debt reserve related to accounts receivable on a contract with a foreign oil and gas client which was terminated. During the third quarter of 2017, we also recognized a $2.6 million revenue and gross profit reduction related to this contract due to a performance dispute resulting in an increase in estimated costs to complete the project. During the fourth quarter of 2019, we entered into a settlement agreement with the client and recognized an additional bad debt reserve of $2.2 million to reflect the accounts receivable at its recoverable amount as of December 31, 2019. The remaining accounts receivable, net of the reserve, totaling $1.6 million was collected in January 2020.
Foreign Currency Translation
The functional currencies of our international operations are the respective local currencies of the countries in which we operate. The translation of the foreign currency into U.S. dollars is performed for balance sheet accounts using current exchange rates in effect at the balance sheet date and for revenue and expense accounts using the weighted average exchange rates prevailing during the year. The unrealized gains and losses resulting from such translation are included as a component of comprehensive income. Transaction gains and losses arising from currency exchange rate fluctuations on transactions denominated in a currency other than the local functional currency are included in “Other income (expense)" on our Consolidated Statements of Operations. We had foreign currency transaction losses totaling $0.7 million, $2.3 million and $0.3 million for the years ended December 31, 2019, 2018 and 2017, respectively.
Revenue Recognition
On January 1, 2018, we adopted FASB Accounting Standards Update ("ASU") 2014-09, Revenue from Contracts with Customers ("Topic 606") using the modified retrospective method. Under this transition method, we applied the new standard to contracts that were not completed as of the adoption date and recognized a cumulative effect adjustment which reduced retained earnings by $0.4 million on January 1, 2018. The comparative prior period information has not been restated and continues to be presented according to accounting standards in effect for those periods. Further information regarding our revenue recognition, including our full accounting policy description, can be found in Note 2.
53
GP STRATEGIES CORPORATION
Notes to Consolidated Financial Statements
Contract Related Assets and Liabilities
The timing of revenue recognition, billings and cash collections results in billed accounts receivable, unbilled revenue (contract assets), and deferred revenue (contract liabilities) on the consolidated balance sheet. Amounts charged to our clients become billable according to the contract terms, which usually consider the passage of time, achievement of milestones or completion of the project. When billings occur after the work has been performed, such unbilled amounts will generally be billed and collected within 60 to 120 days but typically no longer than over the next twelve months. When we advance bill clients prior to the work being performed, generally, such amounts will be earned and recognized in revenue within the next twelve months. These assets and liabilities are reported on the consolidated balance sheet on a contract-by-contract basis at the end of each reporting period. Changes in the contract asset and liability balances during the twelve-month period ended December 31, 2019 were not materially impacted by any other factors, except for a significant decrease in unbilled contract receivables as of December 31, 2019 compared to 2018 due to higher unbilled balances at December 31, 2018 resulting from a delay in billings at the end of 2018 in connection with the implementation of a new ERP system in the fourth quarter of 2018.
Comprehensive Income
Comprehensive income consists of net income, foreign currency translation adjustments, and the change in fair value of interest rate derivatives, net of tax.
Other Current Assets
Prepaid expenses and other current assets on our consolidated balance sheet include prepaid expenditures for goods or services before the goods are used or the services are received, inventories and work in progress on customer contracts. Prepaid expenses are charged to expense in the periods the benefits are realized. Inventories are stated at lower of cost or market. Provision is made to reduce excess and obsolete inventories to their estimated net realizable value. Costs included in work in progress on customer contracts are recognized to cost of revenue when the performance obligation is satisfied and revenue is recognized.
Property, Plant and Equipment
Property, plant and equipment are carried at cost (or fair value at acquisition date for assets obtained through business combinations). Major additions and improvements are capitalized, while maintenance and repairs which do not extend the lives of the assets are expensed as incurred. Gain or loss on the disposition of property, plant and equipment is recognized in operations when realized.
Depreciation of property, plant and equipment is recognized on a straight-line basis over the following estimated useful lives:
Class of assets | Useful life | |
Buildings and improvements | 5 to 40 years | |
Machinery, equipment, and furniture and fixtures | 3 to 10 years | |
Leasehold improvements | Shorter of asset life or term of lease | |
Impairment of Long-Lived Assets
Long-lived assets, such as property, plant, and equipment, and intangibles subject to amortization, are reviewed for impairment whenever events or changes in circumstances indicate that the carrying amount of an asset may not be recoverable. Recoverability of assets to be held and used is measured by a comparison of the carrying amount of an asset to estimated undiscounted future cash flows expected to be generated by the asset. If the carrying amount of an asset exceeds its estimated future cash flows, an impairment charge is recognized at the amount by which the carrying amount of the asset exceeds the fair value of the asset. Impairment of long-lived assets is assessed at the lowest level for which there are identifiable cash flows that are independent from other groups of assets. Assets to be disposed of would be separately presented in the balance sheet and reported at the lower of the carrying amount or fair value less costs to sell, and would no longer be depreciated.
54
GP STRATEGIES CORPORATION
Notes to Consolidated Financial Statements
Goodwill and Intangible Assets
Our intangible assets include amounts recognized in connection with acquisitions, including customer relationships, tradenames, technology and intellectual property. Intangible assets are initially valued at fair market value using generally accepted valuation methods appropriate for the type of intangible asset. Amortization is recognized on a straight-line basis over the estimated useful life of the intangible assets. Intangible assets with definite lives are reviewed for impairment if indicators of impairment arise. Except for goodwill, we do not have any intangible assets with indefinite useful lives.
Goodwill represents the excess of costs over fair value of assets of businesses acquired. We review our goodwill for impairment annually as of October 1 and whenever events or changes in circumstances indicate the carrying value of an asset may not be recoverable. We test goodwill at the reporting unit level.
ASC 350 permits an entity to first assess qualitative factors to determine whether it is more likely than not that the fair value of a reporting unit is less than its carrying amount as a basis for determining whether it is necessary to perform a quantitative goodwill impairment test. Under ASC 350, an entity is not required to perform a quantitative goodwill impairment test for a reporting unit if it is more likely than not that its fair value is greater than its carrying amount. For our annual goodwill impairment tests as of both October 1, 2019 and 2018, we performed quantitative goodwill impairment tests and concluded that the fair values of each of our reporting units exceeded their respective carrying values.
In the quantitative impairment test, we compare the fair value of each reporting unit to its carrying value. If the fair value of the reporting unit exceeds the carrying value of the net assets assigned to that unit, goodwill is not impaired and we are not required to perform further testing. If the carrying value of the net assets assigned to the reporting unit exceeds the fair value of the reporting unit, then we record an impairment loss equal to the difference, however, the loss recognized would not exceed the total amount of goodwill allocated to the reporting unit.
We determine the fair value of our reporting units using both an income approach and a market approach, and weigh both approaches to determine the fair value of each reporting unit. Under the income approach, we perform a discounted cash flow analysis which incorporates management’s cash flow projections over a five-year period and a terminal value is calculated by applying a capitalization rate to terminal year projections based on an estimated long-term growth rate. The five-year projected cash flows and calculated terminal value are discounted using a weighted average cost of capital (“WACC”) which takes into account the costs of debt and equity. The cost of equity is based on the risk-free interest rate, equity risk premium, industry and size equity premiums and any additional market equity risk premiums as deemed appropriate for each reporting unit. To arrive at a fair value for each reporting unit, the terminal value is discounted by the WACC and added to the present value of the estimated cash flows over the discrete five-year period. There are a number of other variables which impact the projected cash flows, such as expected revenue growth and profitability levels, working capital requirements, capital expenditures and related depreciation and amortization. Under the market approach, we perform a comparable public company analysis and apply revenue and earnings multiples from the identified set of companies to the reporting unit’s actual and forecasted financial performance to determine the fair value of each reporting unit. We evaluate the reasonableness of the fair value calculations of our reporting units by reconciling the total of the fair values of all of our reporting units to our total market capitalization, and adjusting for an appropriate control premium. In addition, we make certain judgments in allocating shared assets and liabilities to determine the carrying values for each of our reporting units.
Determining the fair value of a reporting unit is judgmental in nature and involves the use of significant estimates and assumptions. These estimates and assumptions include revenue growth rates and operating margins used to calculate projected future cash flows, risk-adjusted discount rates, future economic and market conditions and determination of appropriate market comparables. We base our fair value estimates on assumptions we believe to be reasonable but that are unpredictable and inherently uncertain. Actual future results may differ from those estimates. In addition, we make certain judgments and assumptions in allocating shared assets and liabilities to determine the carrying values for each of our reporting units. The timing and frequency of our goodwill impairment tests are based on an ongoing assessment of events and circumstances that would indicate a possible impairment. We will continue to monitor our goodwill and intangible assets for impairment and conduct formal tests when impairment indicators are present.
55
GP STRATEGIES CORPORATION
Notes to Consolidated Financial Statements
Contingent Consideration for Business Acquisitions
Acquisitions may include contingent consideration payments based on future financial measures of an acquired company. Contingent consideration is required to be recognized at fair value as of the acquisition date. We estimate the fair value of these liabilities using an appropriate valuation methodology, typically either an income-based approach or a simulation model, such as the Monte Carlo model, depending on the structure of the contingent consideration arrangement. At each reporting date, the contingent consideration obligation is revalued to estimated fair value and changes in fair value subsequent to the acquisition are reflected in income or expense in the consolidated statements of operations, and could cause a material impact to our operating results. Changes in the fair value of contingent consideration obligations may result from changes in discount periods and rates and changes in the timing and amount of revenue and/or earnings projections.
Other Assets
Other assets primarily include an investment in a joint venture, certain software development costs, and unamortized debt issuance costs relating to our revolving credit facility. We account for a 10% interest in a joint venture partnership under the equity method of accounting because significant influence exists due to certain factors, including representation on the partnership’s Management Board and voting rights. We capitalize the cost of internal-use software in accordance with ASC Topic 350-40, Internal-Use Software and ASU No. 2018-15, Customer's Accounting for Implementation Costs Incurred in a Cloud Computing Arrangement That is a Service Contract. These costs consist of internal labor costs and payments made to third parties for software development and implementation and are amortized using the straight-line method over their estimated useful lives, ranging from three to eight years. We amortize debt issuance costs to interest expense on a straight-line basis over the term of our revolving credit facility.
Income Taxes
Income taxes are accounted for under the asset and liability method. Deferred tax assets and liabilities are recognized for the future tax consequences attributable to differences between the financial statement carrying amounts of existing assets and liabilities and their respective tax basis and for operating loss and tax credit carryforwards. Deferred tax assets and liabilities are measured using enacted tax rates expected to apply to taxable income in the years in which those temporary differences are expected to be recovered or settled. The effect on deferred tax assets and liabilities of a change in tax rates is recognized in income in the period that includes the enactment date.
We establish accruals for uncertain tax positions taken or expected to be taken in a tax return when it is more likely than not (i.e., a likelihood of more than fifty percent) that the position would be sustained upon examination by tax authorities that have full knowledge of all relevant information. A recognized tax position is then measured at the largest amount of benefit that is greater than fifty percent likely of being realized upon ultimate settlement. Favorable or unfavorable adjustment of the accrual for any particular issue would be recognized as an increase or decrease to income tax expense in the period of a change in facts and circumstances. Interest and penalties related to income taxes are accounted for as income tax expense.
Earnings per Share
Basic earnings per share (“EPS”) are computed by dividing earnings by the weighted average number of common shares outstanding during the periods. Diluted EPS reflects the potential dilution of common stock equivalent shares that could occur if securities or other contracts to issue common stock were exercised or converted into common stock.
Our dilutive common stock equivalent shares consist of stock options and restricted stock units outstanding under our stock-based incentive plans and are computed under the treasury stock method, using the average market price during the period. Performance-based restricted stock unit awards are included in the computation of diluted shares based on the probable outcome of the underlying performance conditions being achieved. The following table presents instruments which were not dilutive and were excluded from the computation of diluted EPS in each period, as well as the weighted average dilutive common stock equivalent shares which were included in the computation of diluted EPS:
56
GP STRATEGIES CORPORATION
Notes to Consolidated Financial Statements
Year ended December 31, | |||||||||
2019 | 2018 | 2017 | |||||||
(In thousands) | |||||||||
Non-dilutive instruments | 103 | 82 | 13 | ||||||
Dilutive common stock equivalents | 34 | 88 | 125 | ||||||
Stock-Based Compensation
Pursuant to our stock-based incentive plans which are described more fully in Note 12, we grant stock options, restricted stock units, performance-based stock units (PSU's) and equity to officers, employees, and members of the Board of Directors. We compute compensation expense for all equity-based compensation awards issued to employees using the fair-value measurement method. We recognize compensation expense on a straight-line basis over the requisite service period for stock-based compensation awards with both graded and cliff vesting terms. We recognize forfeitures as they occur with a reduction in compensation expense in the period of forfeiture. We do not capitalize any material portion of our stock-based compensation.
We recognize compensation expense for PSU's on a straight-line basis over the performance period based on the probable outcome of achievement of the financial targets. At the end of each reporting period, we estimate the number of PSU's expected to vest, based on the probability and extent to which the performance goals will be met, and take into account these estimates when calculating the expense for the period. If the number of shares expected to be earned changes during the performance period, we will make a cumulative adjustment to compensation expense based on the revised number of shares expected to be earned.
We estimate the fair value of our stock options on the date of grant using the Black-Scholes option pricing model, which requires various assumptions such as expected term, expected stock price volatility and risk-free interest rate. We estimate the expected term of stock options granted taking into consideration historical data related to stock option exercises. We use historical stock price data in order to estimate the expected volatility factor of stock options granted. The risk-free interest rate for the periods within the expected life of the option is based on the U.S. Treasury yield curve in effect at the time of grant.
Use of Estimates
The preparation of financial statements in conformity with U.S. GAAP requires management to make estimates and assumptions that affect the reported amounts of assets and liabilities and disclosure of contingent assets and liabilities at the date of the financial statements and the reported amounts of revenues and expenses during the reporting period. On an ongoing basis, we evaluate the estimates used, including but not limited to those related to revenue recognition, the allowance for doubtful accounts receivable, impairments of goodwill and other intangible assets, valuation of intangible assets acquired and contingent consideration liabilities assumed in business acquisitions, valuation of stock-based compensation awards and income taxes. Actual results could differ from these estimates.
Fair Value Estimates
ASC Topic 820, Fair Value Measurements and Disclosure (“Topic 820”), defines fair value, establishes a market-based framework or hierarchy for measuring fair value, and expands disclosures about fair value measurements. Fair value is defined as the price that would be received to sell an asset or paid to transfer a liability in an orderly transaction between market participants. The guidance within Topic 820 is applicable whenever another accounting pronouncement requires or permits assets and liabilities to be measured at fair value. The fair value hierarchy prioritizes the inputs used in valuation techniques into three levels as follows:
• | Level 1 – unadjusted quoted prices for identical assets or liabilities in active markets; |
• | Level 2 – quoted prices for similar assets and liabilities in active markets, quoted prices for identical or similar assets or liabilities in markets that are not active, and inputs other than quoted market prices that are observable or that can be corroborated by observable market data by correlation; and |
57
GP STRATEGIES CORPORATION
Notes to Consolidated Financial Statements
• | Level 3 – unobservable inputs based upon the reporting entity’s internally developed assumptions which market participants would use in pricing the asset or liability. |
The carrying value of financial instruments including cash, accounts receivable and accounts payable approximate estimated market values because of short-term maturities and interest rates that approximate current rates. In addition, the fair value of our long-term debt approximated its carrying value as of December 31, 2019 as it bears interest at variable rates. Our fair value measurements related to goodwill, intangible assets and contingent consideration are recognized in connection with acquisitions and are valued using Level 3 inputs. Our interest rate derivatives are valued using Level 2 inputs.
Leases
On January 1, 2019, we adopted FASB Accounting Standards Update ("ASU") 2016-02, Leases ("Topic 842") and all the related amendments. The impact of adoption is discussed below under the "Recent Accounting Standards" section. Further information regarding our lease accounting, including our full accounting policy description, can be found in Note 14.
Legal Expenses
We are involved, from time to time, in litigation and proceedings arising out of the ordinary course of business. Costs for legal services rendered in the course of these proceedings are charged to expense as they are incurred.
Reclassifications
Certain prior year amounts have been reclassified to conform with the current year presentation.
Recent Accounting Standards
On January 1, 2019, we adopted Accounting Standards Update (ASU) 2016-02, Leases (Topic 842), which requires the recognition of lease rights and obligations as assets and liabilities on the balance sheet. Previously, lessees were not required to recognize on the balance sheet assets and liabilities arising from operating leases. We adopted Topic 842 using the modified retrospective method of adoption applying the transition provisions at the beginning of the period of adoption, rather than at the beginning of the earliest comparative period presented in these financial statements. As a result, prior period information has not been restated.
The new standard provides several optional practical expedients for use in transition. We elected to use what the FASB has deemed the “package of practical expedients,” which allows us not to reassess our previous conclusions about lease identification, lease classification and the accounting treatment for initial direct costs. The ASU also provides several optional practical expedients for the ongoing accounting for leases. We have elected the short-term lease recognition exemption for all leases that qualify, meaning that for leases with terms of twelve months or less, we will not recognize right-of-use (ROU) assets or lease liabilities on our consolidated balance sheet. Additionally, we have elected to use the practical expedient to not separate lease and non-lease components for leases of real estate, meaning that for these leases, the non-lease components are included in the associated ROU asset and lease liability balances on our consolidated balance sheet.
The most significant effects of adopting Topic 842 on our consolidated financial statements were (1) the recognition of new ROU assets and lease liabilities for our operating leases of $31.1 million and $34.9 million , respectively on January 1, 2019, which included reclassifying accrued rent as a component of the ROU asset, and 2) significant new disclosures about our leasing activities, which are provided in Note 14. Topic 842 did not have a material impact on our results of operations or cash flows.
58
GP STRATEGIES CORPORATION
Notes to Consolidated Financial Statements
In June 2016, the FASB issued ASU 2016-13, Financial Instruments - Credit Losses (Topic 326): Measurement of Credit Losses on Financial Instruments, which requires companies to record an allowance for expected credit losses over the contractual term of financial assets, including short-term trade receivables and contract assets, and expands disclosure requirements for credit quality of financial assets. Upon adoption of the new standard on January 1, 2020, we began recognizing an allowance for credit losses based on the estimated lifetime expected credit loss related to our financial assets. Based on our analysis of Topic 326 and due to the nature and extent of our financial instruments in scope of this ASU (primarily accounts receivable) and the historical, current and expected credit quality of our customers, we do not expect this ASU to have a material impact on our consolidated results of operations and financial condition.
In August 2018, the FASB issued ASU 2018-13, Fair Value Measurement (Topic 820): Disclosure Framework—Changes to the Disclosure Requirements for Fair Value Measurement, which modifies the disclosure requirements for fair value measurements. The guidance promotes a framework to help improve the effectiveness of disclosures in the notes and is effective for annual and interim periods beginning after December 15, 2019, although early adoption is permitted. The new standard will impact our disclosures but is not anticipated to impact on our operating results, financial position or cash flows.
In January 2017, the FASB issued ASU No. 2017-04, Simplifying the Test for Goodwill Impairment. The standard removes step two from the goodwill impairment test. Under the ASU, an entity should perform its annual goodwill impairment test by comparing the fair value of a reporting unit with its carrying amount and recognize an impairment charge for the amount by which the carrying amount exceeds the reporting unit's fair value, however, the loss recognized should not exceed the total amount of goodwill allocated to that reporting unit. ASU 2017-04 is effective for public companies for annual reporting periods beginning after December 15, 2019. Early adoption is permitted for goodwill impairment tests performed on testing dates after January 1, 2017. We adopted the standard on January 1, 2019. The adoption of the ASU did not have an effect on our results of operations, financial condition or cash flows.
(2) Revenue
Significant Accounting Policy
We account for revenue in accordance with ASC Topic 606, Revenue from Contracts with Customers (ASC Topic 606), which we adopted on January 1, 2018, using the modified retrospective method. Revenue is measured based on the consideration specified in a contract with a customer. Most of our contracts with customers contain transaction prices with fixed consideration, however, some contracts may contain variable consideration in the form of discounts, rebates, refunds, credits, price concessions, incentives, performance bonuses, penalties and other similar items. When a contract includes variable consideration, we evaluate the estimate of variable consideration to determine whether the estimate needs to be constrained; therefore, we include the variable consideration in the transaction price only to the extent that it is probable that a significant reversal of the amount of cumulative revenue recognized will not occur when the uncertainty associated with the variable consideration is subsequently resolved. We recognize revenue when we satisfy a performance obligation by transferring control over a product or service to a customer. This can result in recognition of revenue over time as we perform services or at a point in time when the deliverable is transferred to the customer, depending on an evaluation of the criteria for over time recognition in ASC Topic 606. Further details regarding our revenue recognition for various revenue streams are discussed below.
Nature of goods and services
Over 90% of our revenue is derived from services provided to our customers for training, consulting, technical, engineering and other services. Less than 10% of our revenue is derived from various other offerings including custom magazine publications and assembly of glovebox portfolios for automotive manufacturers, licenses of software and other intellectual property, and software as a service (SaaS) arrangements.
Our primary contract vehicles are time-and-materials, fixed price (including fixed-fee per transaction) and cost-reimbursable contracts. Each contract has different terms based on the scope, deliverables and complexity of the engagement, requiring us to make judgments and estimates about recognizing revenue.
Under time-and-materials and cost-reimbursable contracts, the contractual billing schedules are based on the specified level of resources we are obligated to provide. Revenue under these contract types are recognized over time as services are performed as the client simultaneously receives and consumes the benefits provided by our performance throughout the engagement. The time and materials incurred for the period is the measure of performance and, therefore, revenue is recognized in that amount.
59
GP STRATEGIES CORPORATION
Notes to Consolidated Financial Statements
For fixed price contracts which typically involve a discrete project, such as development of training content and materials, design of training processes, software implementation, or engineering projects, the contractual billing schedules are not necessarily based on the specified level of resources we are obligated to provide. These discrete projects generally do not contain milestones or other measures of performance. The majority of our fixed price contracts meet the criteria in ASC Topic 606 for over time revenue recognition. For these contracts, revenue is recognized using a percentage-of-completion method based on the relationship of costs incurred to total estimated costs expected to be incurred over the term of the contract. We believe this methodology is a reasonable measure of proportional performance since performance primarily involves personnel costs and services provided to the customer throughout the course of the projects through regular communications of progress toward completion and other project deliverables. In addition, the customer is required to pay us for the proportionate amount of our fees in the event of contract termination. A small portion of our fixed price contracts do not meet the criteria in ASC Topic 606 for over time revenue recognition. For these projects, we defer revenue recognition until the performance obligation is satisfied, which is generally when the final deliverable is provided to the client. The direct costs related to these projects are capitalized and then recognized as cost of revenue when the performance obligation is satisfied.
For fixed price contracts, when total direct cost estimates exceed revenues, the estimated losses are recognized immediately. The use of the percentage-of-completion method requires significant judgment relative to estimating total contract costs, including assumptions relative to the length of time to complete the project, the nature and complexity of the work to be performed, and anticipated changes in estimated salaries and other costs. Estimates of total contract costs are continuously monitored during the term of the contract, and recorded revenues and costs are subject to revision as the contract progresses. When revisions in estimated contract revenues and costs are determined, such adjustments are recorded in the period in which they are first identified. Adjustments to our fixed price contracts in the aggregate resulted in a net increase (decrease) to revenue of $1.8 million, $1.5 million, and $(0.8) million for the years ended December 31, 2019, 2018 and 2017, respectively.
For certain fixed-fee per transaction contracts, such as delivering training courses or conducting workshops, revenue is recognized during the period in which services are delivered in accordance with the pricing outlined in the contracts.
For certain fixed-fee per transaction and fixed price contracts in which the output of the arrangement is measurable, such as for the shipping of publications and print materials, revenue is recognized at the point in time at which control is transferred which is upon delivery.
Taxes assessed by a government authority that are both imposed on and concurrent with a specific revenue-producing transaction, that we collect from a customer, are excluded from revenue.
Performance Obligations
A performance obligation is a promise in a contract to transfer a distinct good or service to the customer, and is the unit of account in ASC Topic 606. A contract’s transaction price is allocated to each distinct performance obligation and recognized as revenue when, or as, the performance obligation is satisfied. For contracts with multiple performance obligations, we allocate the contract’s transaction price to each performance obligation using our best estimate of the standalone selling price of each distinct good or service in the contract. As of December 31, 2019 we had $349.8 million of remaining performance obligations, which we also refer to as total backlog. We expect to recognize approximately 85 percent of our remaining performance obligations as revenue within the next twelve months. We did not apply any of the practical expedients permitted by ASC Topic 606 in determining the amount of our performance obligations as of December 31, 2019.
Contract Balances
Revenue recognized for the years ended December 31, 2019 and 2018, that was included in the contract liability balance at the beginning of the year was $18.9 million and $20.0 million, respectively, and primarily represented revenue from services performed during the current period for which we received advance payment from clients in a prior period.
Contract Costs
Costs to fulfill contracts which do not meet the over time revenue recognition criteria are capitalized and recognized to cost of revenue when the performance obligation is satisfied and revenue is recognized. Such costs are included in prepaid expenses and other current assets on the consolidated balance sheet and totaled $0.6 million and $1.6 million as of December 31, 2019 and 2018, respectively.
Applying the practical expedient in ASC Topic 606, we recognize the incremental costs of obtaining contracts (i.e. sales commissions) as an expense when incurred if the amortization period of the assets that we otherwise would have recognized is one year or less. Substantially all of our sales commission arrangements have an amortization period of one year or less. As of December 31, 2019 and 2018, we did not have any capitalized sales commissions.
60
GP STRATEGIES CORPORATION
Notes to Consolidated Financial Statements
Revenue by Category
The following series of tables presents our revenue disaggregated by various categories (dollars in thousands).
Years Ended December 31, | |||||||||||||||||||||||
Workforce Excellence | Business Transformation Services | Consolidated | |||||||||||||||||||||
2019 | 2018 | 2017 | 2019 | 2018 | 2017 | 2019 | 2018 | 2017 | |||||||||||||||
Revenue by type of service: | |||||||||||||||||||||||
Managed learning services | $ | 218,730 | 206,388 | 207,007 | $ | — | — | — | $ | 218,730 | 206,388 | 207,007 | |||||||||||
Engineering & technical services | 111,065 | 110,426 | 101,252 | — | — | — | 111,065 | 110,426 | 101,252 | ||||||||||||||
Sales enablement | — | — | — | 161,295 | 103,740 | 101,196 | 161,295 | 103,740 | 101,196 | ||||||||||||||
Organizational development | — | — | — | 92,200 | 94,606 | 99,753 | 92,200 | 94,606 | 99,753 | ||||||||||||||
$ | 329,795 | 316,814 | 308,259 | $ | 253,495 | 198,346 | 200,949 | $ | 583,290 | 515,160 | 509,208 | ||||||||||||
Revenue by geographic region: | |||||||||||||||||||||||
Americas | $ | 230,236 | 213,938 | 198,653 | $ | 193,129 | 165,807 | 175,027 | $ | 423,365 | 379,745 | 373,680 | |||||||||||
Europe Middle East Africa | 91,947 | 91,764 | 100,296 | 50,160 | 38,171 | 30,461 | 142,107 | 129,935 | 130,757 | ||||||||||||||
Asia Pacific | 34,300 | 30,688 | 29,828 | 25,354 | 2,634 | 376 | 59,654 | 33,322 | 30,204 | ||||||||||||||
Eliminations | (26,688 | ) | (19,576 | ) | (20,518 | ) | (15,148 | ) | (8,266 | ) | (4,915 | ) | (41,836 | ) | (27,842 | ) | (25,433 | ) | |||||
$ | 329,795 | 316,814 | 308,259 | $ | 253,495 | 198,346 | 200,949 | $ | 583,290 | 515,160 | 509,208 | ||||||||||||
Revenue by client market sector: | |||||||||||||||||||||||
Automotive | $ | 10,024 | 10,646 | 10,102 | $ | 155,105 | 105,431 | 101,285 | $ | 165,129 | 116,077 | 111,387 | |||||||||||
Financial & Insurance | 82,434 | 87,813 | 86,718 | 10,715 | 12,303 | 16,339 | 93,149 | 100,116 | 103,057 | ||||||||||||||
Manufacturing | 34,154 | 33,055 | 35,795 | 21,894 | 16,156 | 17,134 | 56,048 | 49,211 | 52,929 | ||||||||||||||
Energy / Oil & Gas | 35,604 | 37,088 | 34,195 | 5,693 | 4,752 | 2,429 | 41,297 | 41,840 | 36,624 | ||||||||||||||
U.S. Government | 39,432 | 29,584 | 25,254 | 7,964 | 8,782 | 9,475 | 47,396 | 38,366 | 34,729 | ||||||||||||||
U.K. Government | 18,153 | 18,733 | 27,734 | — | — | — | 18,153 | 18,733 | 27,734 | ||||||||||||||
Information & Communication | 14,294 | 14,083 | 18,123 | 7,913 | 9,510 | 10,490 | 22,207 | 23,593 | 28,613 | ||||||||||||||
Aerospace | 27,511 | 25,989 | 22,142 | 7,754 | 3,683 | 6,549 | 35,265 | 29,672 | 28,691 | ||||||||||||||
Electronics Semiconductor | 13,906 | 15,070 | 16,449 | 1,495 | 857 | 1,069 | 15,401 | 15,927 | 17,518 | ||||||||||||||
Life Sciences | 19,560 | 15,009 | 8,420 | 6,370 | 8,750 | 9,377 | 25,930 | 23,759 | 17,797 | ||||||||||||||
Other | 34,723 | 29,744 | 23,327 | 28,592 | 28,122 | 26,802 | 63,315 | 57,866 | 50,129 | ||||||||||||||
$ | 329,795 | 316,814 | 308,259 | $ | 253,495 | 198,346 | 200,949 | $ | 583,290 | 515,160 | 509,208 | ||||||||||||
61
GP STRATEGIES CORPORATION
Notes to Consolidated Financial Statements
(3) | Acquisitions |
We did not complete any acquisitions in 2019. Below is a summary of the acquisitions we completed during 2018 and 2017 respectively.
2018 Acquisitions
The following table summarizes the purchase prices and purchase price allocations for the acquisitions completed during the year ended December 31, 2018. A description of the acquired businesses is summarized below the table.
Acquired company | TTi Global | TTi Europe | IC Axon | Hula | ||||||||||||
Acquisition date | 11/30/2018 | 8/7/2018 | 5/1/2018 | 1/2/2018 | ||||||||||||
Cash purchase price | $ | 14,195 | $ | 3,000 | $ | 30,535 | $ | 10,000 | ||||||||
Fair value of contingent consideration | — | — | 905 | — | ||||||||||||
Working capital adjustment | (850 | ) | — | — | — | |||||||||||
Total purchase price | $ | 13,345 | $ | 3,000 | $ | 31,440 | $ | 10,000 | ||||||||
Purchase price allocation: | ||||||||||||||||
Cash | $ | 1,780 | $ | 125 | $ | 538 | $ | — | ||||||||
Accounts receivable and other assets | 14,218 | 1,684 | 3,110 | — | ||||||||||||
Fixed assets | 300 | 9 | 368 | — | ||||||||||||
Customer-related intangible assets | 4,428 | 762 | 10,365 | 1,367 | ||||||||||||
Marketing-related intangible assets (tradename) | 454 | 45 | 239 | 106 | ||||||||||||
Goodwill | 4,655 | 2,179 | 21,613 | 8,527 | ||||||||||||
Total assets | 25,835 | 4,804 | 36,233 | 10,000 | ||||||||||||
Accounts payable and accrued expenses | 10,066 | 1,609 | 983 | — | ||||||||||||
Deferred revenue | 219 | 126 | 979 | — | ||||||||||||
Deferred tax liability | 2,205 | 69 | 2,831 | — | ||||||||||||
Total liabilities | 12,490 | 1,804 | 4,793 | — | ||||||||||||
Net assets acquired | $ | 13,345 | $ | 3,000 | $ | 31,440 | $ | 10,000 | ||||||||
62
GP STRATEGIES CORPORATION
Notes to Consolidated Financial Statements
TTi Global
On November 30, 2018, we entered into a Share Purchase Agreement with TTi Global, Inc. ("TTi Global") and its stockholders and acquired all of the outstanding shares of TTi Global. The transaction under the Share Purchase Agreement includes the acquisition of TTi Global’s subsidiaries (except for its UK and Spain subsidiaries and dormant entities) and certain affiliated companies. The Company purchased TTi Global’s UK and Spain subsidiaries in a separate transaction in August 2018 which is discussed further below. TTi Global is a provider of training, staffing, research and consulting solutions to industries across various sectors with automotive as a core focus. The total upfront purchase price for TTi Global was $14.2 million of cash paid at closing on November 30, 2018. The final purchase price allocation above was adjusted during 2019 based on the finalization of the working capital adjustment, as defined in the Share Purchase Agreement, and other purchase accounting adjustments identified during the measurement period. During the third quarter of 2019, the seller paid us $0.9 million in settlement of the working capital adjustment. The purchase price allocation for the acquisition includes $4.4 million of a customer-related intangible asset which is being amortized over nine years and $0.5 million of a marketing-related intangible asset which was amortized over one year from the acquisition date. The goodwill recognized is due to the expected synergies from combining the operations of the acquiree with the company. None of the goodwill recorded for financial statement purposes is deductible for tax purposes. The acquired TTi Global business is included in the Business Transformation Services segment and the results of its operations have been included in the consolidated financial statements beginning December 1, 2018. The pro-forma impact of the acquisition is not material to our results of operations.
TTi Europe
On August 7, 2018, we acquired the entire share capital of TTi (Europe) Limited, a subsidiary of TTi Global, Inc. (TTi Europe), a provider of training and research services primarily for the automotive industry located in the United Kingdom. The upfront purchase price was $3.0 million in cash. The purchase price allocation for the acquisition primarily includes $0.8 million of a customer-related intangible asset which is being amortized over nine years from the acquisition date. The goodwill recognized is due to the expected synergies from combining the operations of the acquiree with the company. None of the goodwill recorded for financial statement purposes is deductible for tax purposes. The acquired TTi Europe business is included in the Business Transformation Services segment and the results of its operations have been included in the consolidated financial statements beginning August 7, 2018. The pro-forma impact of the acquisition is not material to our results of operations.
IC Axon
On May 1, 2018, we acquired the entire share capital of IC Acquisition Corporation, a Delaware corporation, and its subsidiary, IC Axon Inc., a Canadian corporation (IC Axon). IC Axon develops science-driven custom learning solutions for pharmaceutical and life science customers. The upfront purchase price was $30.5 million in cash. In addition, the purchase agreement requires up to an additional $3.5 million of consideration, contingent upon the achievement of an earnings target during a twelve-month period subsequent to the closing of the acquisition. The purchase price allocation for the acquisition includes $10.4 million of a customer-related intangible asset which is being amortized over eight years and $0.2 million of a marketing-related intangible assets being amortized over three years from the acquisition date. The goodwill recognized is due to the expected synergies from combining the operations of the acquiree with the company. None of the goodwill recorded for financial statement purposes is deductible for tax purposes. The acquired IC Axon business is included in the Workforce Excellence segment and the results of its operations have been included in the consolidated financial statements beginning May 1, 2018. The pro-forma impact of the acquisition is not material to our results of operations.
Hula Partners
On January 2, 2018, we acquired the business and certain assets of Hula Partners, a provider of SAP Success Factors Human Capital Management (HCM) implementation services. The purchase price was $10.0 million which was paid in cash at closing. The goodwill recognized is due to the expected synergies from combining operations of the acquiree with the Company. The purchase price allocation for the acquisition includes $1.4 million of a customer-related intangible asset which is being amortized over four years and $0.1 million of a marketing-related intangible asset which is being amortized over two years from the acquisition date. All of the goodwill recorded for financial statement purposes is deductible for tax purposes. The acquired Hula Partners business is included in the Business Transformation Services segment and the results of its operations have been included in the consolidated financial statements beginning January 2, 2018. The pro-forma impact of the acquisition is not material to our results of operations.
63
GP STRATEGIES CORPORATION
Notes to Consolidated Financial Statements
2017 Acquisitions
The following table summarizes the purchase prices and purchase price allocations for the acquisitions completed during the year ended December 31, 2017. A description of the acquired businesses is summarized below the table.
Acquired company | YouTrain | CLS | Emantras | McKinney Rogers | ||||||||||||
Acquisition date | 8/31/2017 | 8/31/2017 | 4/1/2017 | 2/1/2017 | ||||||||||||
Cash purchase price | $ | 4,898 | $ | 436 | $ | 3,191 | $ | 3,259 | ||||||||
Fair value of contingent consideration | — | 888 | 220 | 4,505 | ||||||||||||
Working capital adjustment | 180 | — | — | — | ||||||||||||
Total purchase price | $ | 5,078 | $ | 1,324 | $ | 3,411 | $ | 7,764 | ||||||||
Purchase price allocation: | ||||||||||||||||
Cash | $ | 673 | $ | — | $ | — | $ | — | ||||||||
Accounts receivable and other assets | 234 | — | — | — | ||||||||||||
Fixed assets | 215 | — | 50 | — | ||||||||||||
Technology-related intangible assets | — | — | — | 2,704 | ||||||||||||
Customer-related intangible assets | 1,313 | 253 | 818 | 653 | ||||||||||||
Marketing-related intangible assets (tradename) | — | — | — | 121 | ||||||||||||
Goodwill | 3,268 | 1,090 | 3,156 | 5,196 | ||||||||||||
Total assets | 5,703 | 1,343 | 4,024 | 8,674 | ||||||||||||
Accounts payable and accrued expenses | 348 | 19 | 558 | 44 | ||||||||||||
Deferred revenue | 28 | — | 55 | 866 | ||||||||||||
Deferred tax liability | 249 | — | — | — | ||||||||||||
Total liabilities | 625 | 19 | 613 | 910 | ||||||||||||
Net assets acquired | $ | 5,078 | $ | 1,324 | $ | 3,411 | $ | 7,764 | ||||||||
YouTrain
On August 31, 2017, we acquired the entire share capital of YouTrain Limited ("YouTrain"), an independent training company delivering IT, digital and life sciences skills training in Scotland and North West England. The upfront purchase price was $4.9 million which was paid in cash at closing and a completion accounts payment of $0.2 million was paid to the sellers during the fourth quarter of 2017. The purchase price allocation for the acquisition includes $1.3 million of a customer-related intangible asset which is being amortized over five years from the acquisition date. The goodwill recognized is due to the expected synergies from combining the operations of the acquiree with the Company. None of the goodwill recorded for financial statement purposes is deductible for tax purposes. The acquired YouTrain business is included in the Workforce Excellence segment and the results of its operations have been included in the consolidated financial statements beginning September 1, 2017. The pro-forma impact of the acquisition is not material to our results of operations. The acquired YouTrain business is included in our acquiring United Kingdom subsidiary and its functional currency is the British Pound Sterling.
64
GP STRATEGIES CORPORATION
Notes to Consolidated Financial Statements
CLS Performance Solutions Limited
On August 31, 2017, we acquired the business and certain assets of CLS Performance Solutions Limited ("CLS"), an independent provider of Enterprise Resource Planning (ERP) end user adoption and training services in the United Kingdom. The upfront purchase price was $0.4 million which was paid in cash at closing. In addition, the purchase agreement required up to an additional $2.2 million of consideration contingent upon the achievement of certain earnings targets during the twelve-month period following the completion of the acquisition. No contingent consideration was payable as the earnings target was not achieved for the twelve-month period subsequent to the acquisition. The purchase price allocation for the acquisition includes $0.3 million of a customer-related intangible asset which is being amortized over three years from the acquisition date. The goodwill recognized is due to the expected synergies from combining the operations of the acquiree with the Company. None of the goodwill recorded for financial statement purposes is deductible for tax purposes. The acquired CLS business is included in the Business Transformation Services segment, and the results of its operations have been included in the consolidated financial statements beginning September 1, 2017. The pro-forma impact of the acquisition is not material to our results of operations. The acquired CLS business is included in our acquiring United Kingdom subsidiary and its functional currency is the British Pound Sterling.
Emantras
Effective April 1, 2017, we acquired the business and certain assets of Emantras, a digital education company that provides engaging learning experiences and effective knowledge delivery through award-winning digital and mobile solutions with offices in Fremont, California and Chennai, India. This acquisition strengthens our eLearning development capabilities, allowing us to better serve our customer base with the latest digital learning solutions. The upfront purchase price was $3.2 million in cash. In addition, the purchase agreement required up to an additional $0.3 million of consideration, contingent upon the achievement of an earnings target during the twelve-month period following completion of the acquisition, plus a percentage of any earnings in excess of the specified earnings target. No contingent consideration was paid as the earnings target for the twelve-month period subsequent to the acquisition was not achieved. The purchase price allocation for the acquisition includes $0.8 million of a customer-related intangible asset which is being amortized over four years from the acquisition date. The goodwill recognized is due to the expected synergies from combining the operations of the acquiree with the Company. The portion of the goodwill recorded for financial statement purposes that is deductible for tax purposes is $0.8 million. The acquired Emantras business is included in the Workforce Excellence segment, and the results of its operations have been included in the consolidated financial statements beginning April 1, 2017. The pro-forma impact of the acquisition is not material to our results of operations. The India-based operations of the acquired Emantras business is included in our India subsidiary and its functional currency is the Indian Rupee.
McKinney Rogers
On February 1, 2017, we acquired the business and certain assets of McKinney Rogers, a provider of strategic consulting services with offices in New York and London. This acquisition expands our solutions offerings, giving us the ability to leverage McKinney Rogers' intellectual property and consulting methodologies to help our global client base meet strategic business goals. The upfront purchase price was $3.3 million in cash. In addition, the purchase agreement required up to an additional $18.0 million of consideration, $6.0 million of which was contingent upon the achievement of certain earnings targets during the five-month period ended April 30, 2017 and $12.0 million of which is contingent upon the achievement of certain earnings targets during the three twelve-month periods following completion of the acquisition. In 2017, we paid the seller $1.0 million in respect of the contingent consideration for the five-month period ended April 30, 2017. No contingent consideration was payable with respect to the two twelve-month periods following completion of the acquisition as the earnings targets were not achieved. In July 2019, we entered into an amendment to the asset purchase agreement that implemented certain changes, including the elimination of the third year earnout for the period ended January 31, 2020.
The purchase price allocation for the acquisition includes $2.7 million of a technology-related intangible asset and $0.7 million of a customer-related intangible asset which are both being amortized over five years and $0.1 million of a marketing-related intangible asset which is being amortized over three years from the acquisition date. The goodwill recognized is due to the expected synergies from combining the operations of the acquiree with the Company. The portion of the goodwill recorded for financial statement purposes that is deductible for tax purposes is $1.6 million. The acquired McKinney Rogers business is included in the Business Transformation Services segment, and the results of its operations have been included in the consolidated financial statements beginning February 1, 2017. The pro-forma impact of the acquisition is not material to our results of operations.
65
GP STRATEGIES CORPORATION
Notes to Consolidated Financial Statements
Contingent Consideration
Contingent consideration is recognized at fair value on the acquisition date and is re-measured each reporting period with subsequent adjustments recognized in the consolidated statement of operations. We estimate the fair value of contingent consideration liabilities using an appropriate valuation methodology, typically either an income-based approach or a simulation model, such as the Monte Carlo model, depending on the structure of the contingent consideration arrangement. Contingent consideration is valued using significant inputs that are not observable in the market which are defined as Level 3 inputs pursuant to fair value measurement accounting. We believe our estimates and assumptions are reasonable; however, there is significant judgment involved. At each reporting date, the contingent consideration obligation is revalued to estimated fair value, and changes in fair value subsequent to the acquisitions are reflected in income or expense in the consolidated statements of operations, and could cause a material impact to, and volatility in, our operating results. Changes in the fair value of contingent consideration obligations may result from changes in discount periods and rates and changes in the timing and amount of revenue and/or earnings projections.
Below is a summary of the changes in the recorded amount of contingent consideration liabilities from December 31, 2018 to December 31, 2019 for each acquisition (dollars in thousands):
Liability as of | 2019 Additions | Change in Fair Value of Contingent | Foreign Currency | 2019 Payments | Liability as of | |||||||||||||||||||
Acquisition: | Dec. 31, 2018 | Consideration | Translation | Dec. 31, 2019 | ||||||||||||||||||||
IC Axon | $ | 594 | $ | — | $ | (594 | ) | $ | — | $ | — | $ | — | |||||||||||
McKinney Rogers | 83 | — | (83 | ) | — | — | — | |||||||||||||||||
$ | 677 | $ | — | $ | (677 | ) | $ | — | $ | — | $ | — | ||||||||||||
As of December 31, 2019, there were no remaining contingent consideration liabilities. As of December 31, 2018, contingent consideration included in accounts payable and accrued expenses on the consolidated balance sheet totaled $0.6 million and we also had accrued contingent consideration totaling $0.1 million included in other long-term liabilities on the consolidated balance sheet which represented the portion of contingent consideration estimated to be payable greater than twelve months from the balance sheet date.
66
GP STRATEGIES CORPORATION
Notes to Consolidated Financial Statements
(4) | Divestitures & Assets Held for Sale |
Sale of Tuition Program Management Business
On October 1, 2019, we sold our tuition program management business pursuant to an Asset Purchase Agreement with Bright Horizons Children's Centers LLC (the "buyer"). The purchase price was $20.0 million which was paid on closing, other than $1.5 million which is being held in escrow to secure possible indemnification claims pursuant to the terms of an escrow agreement which expires October 1, 2020. An additional $0.1 million was paid to the buyer in January 2020 based on the final calculation of assumed liabilities as defined in the asset purchase agreement. We recognized a pre-tax gain of $12.1 million, net of $0.1 million of direct selling costs, on the sale of the business. The gain recorded represents the difference between the purchase price and the carrying value of the business, which primarily included goodwill of $7.7 million. The tuition program management business was part of the Workforce Excellence segment.
Sale of Alternative Fuels Division
Effective January 1, 2020, we sold our Alternative Fuels Division pursuant to an Asset Purchase Agreement with Cryogenic Industries, LLC. The purchase price is up to $6.0 million, subject to adjustment based on a final calculation of net working capital as defined in the asset purchase agreement. Of the total purchase consideration, we received an advance payment of $1.5 million on December 31, 2019 and the remaining upfront consideration of $3.5 million on January 2, 2020 based on the estimated net working capital. In addition, up to $0.5 million of the purchase price is subject to the achievement of certain milestones under an assigned contract through the period December 31, 2021. The purchase price adjustment for closing net working capital is expected to be finalized during the first quarter of 2020.
The major classes of assets and liabilities sold in connection with our Alternative Fuels Division included accounts receivable, net of $0.9 million, other current assets of $0.9 million, estimated goodwill of approximately $2.7 million, deferred revenue of $1.3 million and other current liabilities of $0.2 million as of December 31, 2019. The Alternative Fuels Division was part of the Workforce Excellence segment.
67
GP STRATEGIES CORPORATION
Notes to Consolidated Financial Statements
(5) | Goodwill & Other Intangible Assets |
Goodwill
Changes in the carrying amount of goodwill by reportable business segment for the years ended December 31, 2019 and 2018 were as follows (in thousands):
Business | ||||||||||||
Workforce | Transformation | |||||||||||
Excellence | Services | Total | ||||||||||
Net book value at | ||||||||||||
January 1, 2018 | ||||||||||||
Goodwill | $ | 114,814 | $ | 45,438 | $ | 160,252 | ||||||
Accumulated impairment losses | (9,050 | ) | (6,367 | ) | (15,417 | ) | ||||||
Total | 105,764 | 39,071 | 144,835 | |||||||||
2018 Activity: | ||||||||||||
Acquisitions | 21,613 | 14,033 | 35,646 | |||||||||
Foreign currency translation | (3,459 | ) | (898 | ) | (4,357 | ) | ||||||
Net book value at | ||||||||||||
December 31, 2018 | ||||||||||||
Goodwill | 132,968 | 58,573 | 191,541 | |||||||||
Accumulated impairment losses | (9,050 | ) | (6,367 | ) | (15,417 | ) | ||||||
Total | 123,918 | 52,206 | 176,124 | |||||||||
2019 Activity: | ||||||||||||
Purchase accounting adjustments | — | 1,327 | 1,327 | |||||||||
Divestitures | (7,681 | ) | — | (7,681 | ) | |||||||
Foreign currency translation | 1,776 | 17 | 1,793 | |||||||||
Net book value at | ||||||||||||
December 31, 2019 | ||||||||||||
Goodwill | 127,063 | 59,917 | 186,980 | |||||||||
Accumulated impairment losses | (9,050 | ) | (6,367 | ) | (15,417 | ) | ||||||
Total | $ | 118,013 | $ | 53,550 | $ | 171,563 | ||||||
68
GP STRATEGIES CORPORATION
Notes to Consolidated Financial Statements
Intangible Assets Subject to Amortization
Intangible assets with finite lives are subject to amortization over their estimated useful lives. The primary assets included in this category and their respective balances were as follows (in thousands):
December 31, 2019 | ||||||||||||
Gross Carrying | Accumulated | Net Carrying | ||||||||||
Amount | Amortization | Amount | ||||||||||
Customer relationships | $ | 22,348 | $ | (7,473 | ) | $ | 14,875 | |||||
Intellectual property and other | 3,915 | (2,446 | ) | 1,469 | ||||||||
$ | 26,263 | $ | (9,919 | ) | $ | 16,344 | ||||||
December 31, 2018 | ||||||||||||
Customer relationships | $ | 26,524 | $ | (8,547 | ) | $ | 17,977 | |||||
Intellectual property and other | 4,936 | (1,980 | ) | 2,956 | ||||||||
$ | 31,460 | $ | (10,527 | ) | $ | 20,933 | ||||||
Amortization expense for intangible assets was $5.0 million, $4.6 million and $4.0 million for the years ended December 31, 2019, 2018 and 2017, respectively. Estimated future amortization expense for intangible assets included in our consolidated balance sheet as of December 31, 2019 is as follows (in thousands):
Fiscal year ending: | |||
2020 | $ | 3,908 | |
2021 | 3,290 | ||
2022 | 2,086 | ||
2023 | 1,852 | ||
2024 | 1,852 | ||
Thereafter | 3,356 | ||
Total | $ | 16,344 | |
As of December 31, 2019, our intangible assets with definite lives had a weighted average remaining useful life of 5.7 years. We have no amortizable intangible assets with indefinite useful lives.
(6) | Property, Plant and Equipment |
Property, plant and equipment consisted of the following (in thousands):
December 31, | ||||||||
2019 | 2018 | |||||||
Machinery, equipment and vehicles | $ | 17,170 | $ | 18,121 | ||||
Furniture and fixtures | 3,530 | 3,779 | ||||||
Leasehold improvements | 2,725 | 2,369 | ||||||
Buildings | 321 | 311 | ||||||
23,746 | 24,580 | |||||||
Accumulated depreciation and amortization | (17,943 | ) | (18,721 | ) | ||||
$ | 5,803 | $ | 5,859 | |||||
Depreciation expense was $2.4 million, $2.2 million and $2.6 million for the years ended December 31, 2019, 2018 and 2017, respectively.
69
GP STRATEGIES CORPORATION
Notes to Consolidated Financial Statements
(7) | Debt |
On November 30, 2018, we entered into a Credit Agreement with PNC Bank, National Association, as administrative agent and a syndicate of lenders (the “Credit Agreement”), replacing the prior credit agreement with Wells Fargo dated December 21, 2016, as amended on April 28, 2018 and June 29, 2018 (the "Original Credit Agreement"). The Credit agreement provides for a revolving credit facility, which expires on November 29, 2023, and consists of: a revolving loan facility with a borrowing limit of $200 million, including a $20 million sublimit for foreign borrowings; an accordion feature allowing the Company to request increases in commitments to the credit facility by up to an additional $100 million; a $20 million letter of credit sublimit; and a swingline loan credit sublimit of $20 million. The obligations under the Credit Agreement are guaranteed by certain of the Company's subsidiaries (the "Guarantors"). As collateral security under the Credit Agreement and the guarantees thereof, the Company and the Guarantors have granted to the administrative agent, for the benefit of the lenders, a lien on, and first priority security interest in substantially all of their tangible and intangible assets. The proceeds of the Credit Agreement were used, in part, to repay in full all outstanding borrowings under the Original Credit Agreement, and additional proceeds of the revolving credit facility are expected to be used for working capital and other general corporate purposes of the Company and its subsidiaries, including the issuance of letters of credit and Permitted Acquisitions, as defined.
Borrowings under the Credit Agreement may be in the form of Base Rate loans or Euro-Rate loans, at the option of the borrowers, and bear interest at the Base Rate plus 0.25% to 1.25% or the Daily LIBOR Rate plus 1.25% to 2.25% respectively. Base Rate loans will bear interest at a fluctuating per annum Base Rate equal to the highest of (i) the Overnight Bank Funding Rate, plus 0.5%, (ii) the Prime Rate, and (iii) the Daily LIBOR Rate, plus 100 basis points (1.0%); plus an Applicable Margin. Determination of the Applicable Margin is based on a pricing grid that is generally dependent upon the Company's Leverage Ratio (as defined) as of the end of the fiscal quarter for which consolidated financial statements have been most recently delivered. We may prepay the revolving loan, in whole or in part, at any time without premium or penalty, subject to certain conditions.
The Credit Agreement contains customary representations, warranties and affirmative covenants. The Credit Agreement also contains customary negative covenants, subject to negotiated exceptions, including but not limited to: (i) liens, (ii) investments, (iii) indebtedness, (iv) significant corporate changes, including mergers and acquisitions, (v) dispositions, (vi) restricted payments, including stock dividends, and (vii) certain other restrictive agreements. The Credit Agreement also requires the Company to maintain compliance with the following financial covenants; (i) a maximum leverage ratio, and (ii) a minimum interest expense coverage ratio. On June 28, 2019 we entered into an amendment to the Credit Agreement that modified the maximum leverage ratio requirements for 2019. We were in compliance with each of these financial covenants under the Credit Agreement, as amended, as of December 31, 2019.
As of December 31, 2019, there were $82.9 million of borrowings outstanding and $25.8 million of available borrowings under the revolving loan facility based on our Leverage Ratio.
For the years ended December 31, 2019 and 2018, the weighted average interest rate on our borrowings was 4.5% and 4.0%, respectively. As of December 31, 2019, the fair value of our borrowings under the Credit Agreement approximated its carrying value as it bears interest at variable rates. There were $1.2 million of unamortized debt issue costs related to the Credit Agreement as of December 31, 2019 which are being amortized to interest expense over the term of the Credit Agreement and are included in Other Assets on our consolidated balance sheet.
70
GP STRATEGIES CORPORATION
Notes to Consolidated Financial Statements
(8) | Accounts Payable and Accrued Expenses |
Accounts payable and accrued expenses consisted of the following (in thousands):
December 31, | ||||||||
2019 | 2018 | |||||||
Trade accounts payable | $ | 37,792 | $ | 40,969 | ||||
Accrued salaries, vacation and benefits | 22,322 | 21,550 | ||||||
Other accrued expenses | 28,517 | 28,372 | ||||||
Accrued contingent consideration | — | 594 | ||||||
Negative cash book balance | 3,701 | 1,769 | ||||||
$ | 92,332 | $ | 93,254 | |||||
(9) | Employee Benefit Plan |
We offer the GP Retirement Savings Plan (the “Plan”) to our employees in the United States. Eligible employees are automatically enrolled unless they elect to not participate in the Plan, and contributions begin as soon as administratively feasible after enrollment. The Plan permits pre-tax contributions to the Plan by participants pursuant to Section 401(k) of the Internal Revenue Code (IRC). We make matching contributions at our discretion. In 2019, 2018 and 2017, we contributed 219,427, 162,572, and 104,751 shares, respectively, of our common stock directly to the Plan which had a value of approximately $3.0 million, $3.0 million and $2.7 million, respectively, and is recognized as compensation expense in the consolidated statements of operations for matching contributions to the Plan.
We also maintain several defined contribution pension plans for our employees in the United States, United Kingdom and other countries. We contributed to these plans $2.7 million, $2.7 million and $2.5 million during the years ended December 31, 2019, 2018 and 2017, respectively.
71
GP STRATEGIES CORPORATION
Notes to Consolidated Financial Statements
(10) | Income Taxes |
The components of income before income taxes and income tax expense for the years ended December 31, 2019, 2018 and 2017 are as follows (in thousands):
Years ended December 31, | ||||||||||||
2019 | 2018 | 2017 | ||||||||||
Income before income taxes: | ||||||||||||
Domestic | $ | 12,814 | $ | 5,577 | $ | 2,901 | ||||||
Foreign | 9,555 | 9,186 | 16,788 | |||||||||
Total income before income taxes | $ | 22,369 | $ | 14,763 | $ | 19,689 | ||||||
Income tax expense (benefit): | ||||||||||||
Current: | ||||||||||||
Federal | $ | 2,634 | $ | 388 | $ | 3,210 | ||||||
State and local | 586 | 378 | 256 | |||||||||
Foreign | 5,046 | 3,285 | 3,645 | |||||||||
Total current | 8,266 | 4,051 | 7,111 | |||||||||
Deferred: | ||||||||||||
Federal | (338 | ) | 813 | (241 | ) | |||||||
State and local | (99 | ) | 258 | (176 | ) | |||||||
Foreign | (649 | ) | (195 | ) | 104 | |||||||
Total deferred | (1,086 | ) | 876 | (313 | ) | |||||||
Total income tax expense | $ | 7,180 | $ | 4,927 | $ | 6,798 | ||||||
The provision for income taxes differs from the amount computed by applying the statutory federal income tax rate to income before income taxes. The sources and tax effects of the differences are as follows:
December 31, | |||||||||
2019 | 2018 | 2017 | |||||||
Federal income tax rate | 21.0 | % | 21.0 | % | 35.0 | % | |||
State and local taxes net of federal benefit | 3.0 | 1.9 | 0.2 | ||||||
Domestic production deduction | — | — | (1.1 | ) | |||||
Valuation allowance | 6.3 | 0.4 | 0.9 | ||||||
Foreign tax credits | (5.0 | ) | — | — | |||||
Foreign tax rate differential | 4.1 | 1.8 | (8.8 | ) | |||||
Permanent differences | 3.5 | 2.7 | (6.2 | ) | |||||
Other | (1.0 | ) | 2.2 | (1.8 | ) | ||||
Global Intangible Low-taxed Income | 0.2 | 1.5 | — | ||||||
Tax Cuts and Jobs Act of 2017 | — | 1.9 | 16.3 | ||||||
Effective tax rate | 32.1 | % | 33.4 | % | 34.5 | % | |||
The Tax Cuts and Jobs Act of 2017 created a requirement that Global Intangible Low-Taxed Income (“GILTI”) earned by a controlled foreign corporation (“CFC”) must be included in the gross income of the U.S. shareholder. The FASB Staff Q&A Topic 740, No. 5, “Accounting for Global Intangible Low-Taxed Income” states that an entity can make an accounting policy election to either recognize deferred taxes for temporary basis difference expected to reverse as GILTI in future years, or to provide for the tax expense related to GILTI in the year the tax is incurred as a period expense only. The Company has elected to account for GILTI as a current period expense when incurred.
72
GP STRATEGIES CORPORATION
Notes to Consolidated Financial Statements
Income tax expense was $7.2 million for the year ended December 31, 2019 compared to $4.9 million for the year ended December 31, 2018. Our effective income tax rate was 32.1% and 33.4% for the years ended December 31, 2019 and 2018, respectively. The decrease in the effective income tax rate compared to 2018 is primarily due to a change in the mix of income from higher to lower taxing jurisdiction.
Uncertain Tax Positions
As of December 31, 2019 and 2018, we had no uncertain tax positions reflected on our consolidated balance sheet. The Company files income tax returns in U.S. federal, state and local jurisdictions, and various non-U.S. jurisdictions, and is subject to audit by tax authorities in those jurisdictions. Tax years 2016 through 2019 remain open to examination by these tax jurisdictions, and earlier years remain open to examination in certain of these jurisdictions which have longer statutes of limitations.
Deferred Income Taxes
Deferred income taxes reflect the net tax effects of temporary differences between the carrying amounts of assets and liabilities for financial reporting purposes and the amounts used for tax purposes. Significant components of our deferred tax assets and liabilities are as follows (in thousands):
December 31, | ||||||||
2019 | 2018 | |||||||
Deferred tax assets: | ||||||||
Allowance for doubtful accounts | $ | 291 | $ | 531 | ||||
Accrued liabilities and other | 2,066 | 2,564 | ||||||
Stock-based compensation expense | 297 | 296 | ||||||
Net federal, state and foreign operating loss carryforwards | 2,825 | 1,953 | ||||||
Foreign tax credit carryforwards | 1,379 | 266 | ||||||
Deferred tax assets | 6,858 | 5,610 | ||||||
Valuation allowance on deferred tax assets | (4,025 | ) | (1,385 | ) | ||||
Deferred tax liabilities: | ||||||||
Other | 182 | 1,181 | ||||||
Intangible assets, property and equipment, principally due to difference in depreciation and amortization | 8,969 | 10,784 | ||||||
Net deferred tax liabilities | $ | (6,318 | ) | $ | (7,740 | ) | ||
As of December 31, 2019, we had foreign and U.S. state net operating loss carryforwards of $11.5 million for tax purposes, which will be available to offset future taxable income. If not used, these carryforwards will expire beginning in 2020.
In assessing the realizability of deferred tax assets, management considers whether it is more likely than not that some portion or all of the deferred tax assets may not be realized. The ultimate realization of the deferred tax assets is dependent upon the generation of future taxable income during the periods in which temporary differences are deductible. Management considers the scheduled reversal of deferred tax liabilities, projected future taxable income and tax planning strategies in making this assessment. Based upon these factors, management placed a valuation allowance of $4.0 million and $1.4 million as of the years ended December 31, 2019 and 2018, respectively, against certain deferred tax assets, including net operating loss carryforwards, due to the uncertainty of future profitability in foreign jurisdictions. Management believes it is more likely than not that the Company will realize the benefits of the remaining deferred tax assets.
Foreign Income
The 2017 Tax Act includes a mandatory one-time tax on accumulated earnings of foreign subsidiaries, and as a result, all previously unremitted earnings for which no U.S. deferred tax liability had been accrued have now been subject to U.S. tax. Notwithstanding the U.S. taxation of these amounts, we intend to continue to invest these earnings, as well as the capital invested in these subsidiaries, indefinitely outside of the U.S. and do not expect to incur any significant, additional taxes related to such amounts. The Company has not provided for any additional outside basis difference inherent in its foreign subsidiaries, as these amounts continue to be indefinitely reinvested in foreign operations. Determining the amount of unrecognized deferred tax liability related to any additional outside basis difference in these entities is not practicable.
73
GP STRATEGIES CORPORATION
Notes to Consolidated Financial Statements
(11) Restructuring
The following table shows the balances and activity for our restructuring liability (in thousands):
Employee Severance and Related Benefits | Excess Facilities and Other Costs | Total | ||||||||||
Liability as of December 31, 2018 | $ | 1,266 | $ | 591 | $ | 1,857 | ||||||
Additional restructuring charges | 1,639 | — | 1,639 | |||||||||
Reclassification to operating lease liabilities | — | (554 | ) | (554 | ) | |||||||
Payments | (2,675 | ) | (9 | ) | (2,684 | ) | ||||||
Liability as of December 31, 2019 | $ | 230 | $ | 28 | $ | 258 | ||||||
In December 2017, we announced a new organizational structure and plan to improve operating results by increasing organic growth and reducing operating costs, and we initiated restructuring and transition activities to improve operational efficiency, reduce costs and better position the company to drive future revenue growth. These restructuring activities were completed by June 30, 2018. The total remaining liability under this restructuring plan was $0.1 million as of December 31, 2019 and $1.9 million as of December 31, 2018. As of December 31, 2019, $0.1 million is included in accounts payable and accrued expenses. As of December 31, 2018, $1.5 million was included in accounts payable and accrued expenses and $0.4 million was included in other noncurrent liabilities.
In connection with the acquisition of TTi Global, Inc. in December 2018, we initiated restructuring and transition activities in the first quarter of 2019 to reduce costs and eliminate redundant positions to realize synergies with the acquired business. For the year ended December 31, 2019, we recorded $1.6 million of restructuring charges in connection with these activities. The total remaining liability under these restructuring activities was $0.2 million as of December 31, 2019 which is included in accounts payable and accrued expenses. These restructuring activities were substantially complete as of December 31, 2019.
(12) | Stock-Based Compensation |
Under our 2011 Stock Incentive Plan (the "2011 Plan"), we may grant awards of non-qualified stock options, incentive stock options, restricted stock, stock units, performance shares, performance units and other incentives payable in cash or in shares of our common stock to officers, employees or members of the Board of Directors. We are authorized to grant an aggregate of 2,205,764 shares under the 2011 Plan. As of December 31, 2019, there were 827,855 shares available for issuance of future grants of awards under the 2011 Plan and 568,812 shares representing outstanding awards under the 2011 Plan. We may issue new shares or use shares held in treasury to deliver shares to employees for our equity grants or upon exercise of non-qualified stock options.
The following table summarizes the pre-tax stock-based compensation expense included in reported net income (in thousands):
Years ended December 31, | ||||||||||||
2019 | 2018 | 2017 | ||||||||||
Cost of revenue | $ | 1,995 | $ | 992 | $ | 2,832 | ||||||
General and administrative expenses | 622 | 358 | 757 | |||||||||
Total stock-based compensation expense | $ | 2,617 | $ | 1,350 | $ | 3,589 | ||||||
We recognized a deferred income tax benefit of $0.4 million, $0.3 million and $1.2 million, respectively, during the years ended December 31, 2019, 2018, and 2017 associated with the compensation expense recognized in our consolidated financial statements. As of December 31, 2019, we had restricted stock units outstanding under these plans as discussed below.
74
GP STRATEGIES CORPORATION
Notes to Consolidated Financial Statements
Non-Qualified Stock Options
Non-qualified stock options are granted with an exercise price not less than the fair market value of our common stock at the date of grant, vest over a period up to ten years, and expire at various terms up to ten years from the date of grant. There were no outstanding stock options as of December 31, 2019. We received cash for the exercise price associated with stock options exercised of less than $0.1 million during the year ended December 31, 2018 and $0.1 million during the year ended December 31, 2017. During the year ended December 31, 2017, we settled 55,050 outstanding stock options held by our employees by issuing 13,482 fully vested shares which represented the fair value of those stock options upon settlement, net of required income tax withholdings. The total intrinsic value realized by participants on stock options exercised and/or settled was less than $0.1 million and $0.7 million during the years ended December 31, 2018 and 2017 respectively.
Restricted Stock Units
In addition to stock options, we issue restricted stock units to key employees and members of the Board of Directors based on meeting certain service goals. The stock units vest to the recipients at various dates, up to five years, based on fulfilling service requirements. We recognize the value of the market price of the underlying stock on the date of grant to compensation expense over the requisite service period. Upon vesting, the stock units are settled in shares of our common stock. Summarized share information for our restricted stock units is as follows:
Year ended December 31, 2019 | Weighted average grant date fair value | ||||||
(In shares) | (In dollars) | ||||||
Outstanding and unvested, beginning of period | 132,753 | $ | 20.91 | ||||
Granted | 132,394 | 15.52 | |||||
Vested | (161,584 | ) | 18.00 | ||||
Forfeited | (11,462 | ) | 21.53 | ||||
Outstanding and unvested, end of period | 92,101 | $ | 18.19 | ||||
The total intrinsic value realized by participants upon the vesting of restricted stock units was $2.3 million, $1.3 million and $2.7 million during the years ended December 31, 2019, 2018 and 2017, respectively. As of December 31, 2019, we had unrecognized compensation cost of $1.8 million related to the unvested portion of our outstanding restricted stock units to be recognized over a weighted average remaining service period of 1.3 years. During the years ended December 31, 2019, 2018, and 2017, we realized excess income tax benefits (deficiencies) of $(0.1) million, $(0.3) million and $0.1 million respectively, related to stock option exercises or expirations and restricted stock vesting.
We have a long-term incentive program (LTIP) which provides for the issuance of performance-based stock units under the 2011 Plan to certain executives. Under the LTIP, a target level of equity compensation is set for each officer. Under the program, the Compensation Committee typically sets the performance-based goals within the first 90 days of each year. Vesting of the performance-based stock units (PSU's) is contingent upon the employee's continued employment and the Company's achievement of certain performance goals during a three-year performance period. The performance goals are established by the Compensation Committee for a three-year performance period based on certain financial targets. We recognize compensation expense, net of estimated forfeitures, for PSU's on a straight-line basis over the performance period based on the probable outcome of achievement of the financial targets. At the end of each reporting period, we estimate the number of PSU's expected to vest, based on the probability and extent to which the performance goals will be met, and take into account these estimates when calculating the expense for the period. If the number of shares expected to be earned changes during the performance period, we make a cumulative adjustment to compensation expense based on the revised number of shares expected to be earned.
75
GP STRATEGIES CORPORATION
Notes to Consolidated Financial Statements
Summarized share information for our performance-based restricted stock units is as follows:
Year ended December 31, 2019 | Weighted average grant date fair value | ||||||
(In shares) | (In dollars) | ||||||
Outstanding and unvested, beginning of period | 266,963 | $ | 23.80 | ||||
Granted | 270,572 | 15.41 | |||||
Vested | — | — | |||||
Forfeited | (60,824 | ) | 26.66 | ||||
Outstanding and unvested, end of period | 476,711 | $ | 18.67 | ||||
As of December 31, 2019, we had unrecognized compensation cost of $1.6 million related to the unvested portion of our outstanding performance-based restricted stock units to be recognized over a weighted average remaining service period of 2.0 years.
(13) | Common Stock |
The holders of common stock are entitled to one vote per share. As of December 31, 2019, there were 17,032,666 shares of common stock issued and outstanding. In addition, as of December 31, 2019, there were 568,812 shares reserved for issuance under outstanding equity compensation awards for unvested restricted stock units and an additional 827,855 shares available for issuance for future grants of awards under the 2011 Plan.
Stock Repurchase Program
We have a share repurchase program under which we may repurchase shares of our common stock from time to time in the open market, subject to prevailing business and market conditions and other factors. During the year ended December 31, 2019 we did not repurchase shares and during the years ended December 31, 2018 and 2017, we repurchased approximately 354,000 and 182,000 shares, respectively, of our common stock in the open market for a total cost of approximately $8.0 million and $4.3 million, respectively. As of December 31, 2019, there was approximately $3.8 million available for future repurchases under the buyback program. There is no expiration date for the repurchase program.
Securities Purchase Agreement
On December 30, 2009, we entered into a Securities Purchase Agreement (the “Purchase Agreement”) with a single accredited investor, Sagard Capital Partners, L.P. (“Sagard”), pursuant to which we sold to Sagard, in a private placement, an aggregate of 2,857,143 shares (the “Shares”) of our common stock, par value $0.01, at a price of $7.00 per share (the “Offering”), for an aggregate purchase price of $20.0 million. The Offering closed on December 30, 2009. The Purchase Agreement prohibits Sagard from acquiring beneficial ownership of more than 23% of our common stock (calculated on a fully diluted basis). As of December 31, 2019, Sagard beneficially owned 3,639,367 shares or 21.4% of our outstanding common stock.
In connection with the Offering, on December 30, 2009, we entered into a Registration Rights Agreement (the “Registration Rights Agreement”) with Sagard. Pursuant to the Registration Rights Agreement, we filed a registration statement with the Securities and Exchange Commission (the “SEC”) for purposes of registering the resale of the Shares and any shares of common stock issued pursuant to the preemptive rights under Section 4(l) of the Purchase Agreement (or any shares of common stock issuable upon exercise, conversion or exchange of securities issued pursuant to the preemptive rights). We filed the registration statement with the SEC on September 27, 2010 and it was declared effective by the SEC on October 8, 2010. If we fail to meet filing or effectiveness deadlines with respect to any additional registration statements required by the Registration Rights Agreement, or fail to keep any registration statements continuously effective (with limited exceptions), we will be obligated to pay to the holders of the Shares liquidated damages in the amount of 1% of the purchase price for the Shares per month, up to a maximum of $2.4 million. We also agreed, among other things, to indemnify the selling holders under the registration statements from certain liabilities and to pay all fees and expenses (excluding underwriting discounts and selling commissions and all legal fees of the selling holders in excess of $25,000) incident to our obligations under the Registration Rights Agreement.
76
GP STRATEGIES CORPORATION
Notes to Consolidated Financial Statements
(14) | Leases |
We determine at its inception whether an arrangement that provides us control over the use of an asset is a lease. We recognize at lease commencement a right-of-use (ROU) asset and lease liability based on the present value of the future lease payments over the lease term. We have elected not to recognize a ROU asset and lease liability for leases with terms of 12 months or less. Certain of our leases include options to extend the term of the lease or to terminate the lease prior to the end of the initial term. When it is reasonably certain that we will exercise the option, we include the impact of the option in the lease term for purposes of determining total future lease payments. As most of our lease agreements do not explicitly state the discount rate implicit in the lease, we use our incremental borrowing rate on the commencement date to calculate the present value of future payments.
Some of our leases include future rent escalations that are based on the Consumer Price Index (CPI) or other similar indices. These future rent escalations are not included in the calculation of the ROU asset and lease liability because they be cannot be forecasted at the lease inception date. These are considered variable lease payments and are expensed as incurred. In addition to the present value of the future lease payments, the calculation of the ROU asset also includes any lease pre-payments and initial direct costs of obtaining the lease, such as commissions.
In addition to the base rent, real estate leases typically contain provisions for common-area maintenance and other similar services, which are considered non-lease components for accounting purposes. For our real estate leases, we apply a practical expedient to include these non-lease components in calculating the ROU asset and lease liability. For all other types of leases, non-lease components are excluded from our ROU assets and lease liabilities and expensed as incurred.
We have operating leases for office facilities, vehicles and computer and office equipment. We do not have any material finance leases.
Lease expense is included in Cost of Revenue and General & Administrative Expenses on the consolidated statements of operations, and is recorded net of immaterial sublease income. The components of lease expense were as follows (in thousands):
Year Ended December 31, 2019 | ||||
Operating lease cost | $ | 9,148 | ||
Short-term lease cost | 1,695 | |||
Total lease costs | $ | 10,843 | ||
Supplemental information related to leases was as follows (dollars in thousands):
Year Ended December 31, 2019 | |||
Operating lease right-of-use assets | $ | 27,251 | |
Current portion of operating lease liabilities | $ | 7,871 | |
Non-current portion of operating lease liabilities | 22,159 | ||
Total operating lease liabilities | $ | 30,030 | |
Cash paid for amounts included in the measurement of operating lease liabilities | $ | 10,137 | |
Right-of-use assets obtained in exchange for operating lease liabilities | $ | 4,353 | |
Weighted-average remaining lease term for operating leases (years) | 5.5 years | ||
Weighted-average discount rate for operating leases | 4.7 | % | |
77
GP STRATEGIES CORPORATION
Notes to Consolidated Financial Statements
The following is a reconciliation of future undiscounted cash flows to the operating lease liabilities on our consolidated balance sheet as of December 31, 2019 (in thousands):
Year ended December 31, | ||||
2020 | $ | 8,411 | ||
2021 | 6,583 | |||
2022 | 5,120 | |||
2023 | 4,276 | |||
2024 | 3,992 | |||
Thereafter | 6,060 | |||
Total future lease payments | 34,442 | |||
Less: imputed interest | (4,412 | ) | ||
Present value of future lease payments | 30,030 | |||
Less: current portion of lease liabilities | (7,871 | ) | ||
Long-term lease liabilities | $ | 22,159 | ||
Under Topic 840, our future minimum payments for all operating lease obligations as of December 31, 2018 were as follows (in thousands):
Year ended December 31, | ||||
2019 | $ | 10,646 | ||
2020 | 7,833 | |||
2021 | 5,520 | |||
2022 | 4,528 | |||
2023 | 3,898 | |||
Thereafter | 8,671 | |||
Total | $ | 41,096 | ||
Rent expense was approximately $10.9 million and $11.0 million for the years ended December, 31, 2018 and 2017, respectively.
78
GP STRATEGIES CORPORATION
Notes to Consolidated Financial Statements
(15) Business Segments
As of December 31, 2019, we operated through two reportable business segments: (i) Workforce Excellence and (ii) Business Transformation Services. We are organized into two operating segments aligned by complementary service lines and supported by a business development organization aligned by industry sector. Each of our two reportable segments represents an operating segment under ASC Topic 280, Segment Reporting. We test our goodwill at the reporting unit level, or one level below an operating segment, under ASC Topic 350, Intangibles - Goodwill and Other. We have four reporting units for purposes of goodwill impairment testing, which represent our four practices which are one level below our operating segments, as discussed below.
Our two segments each consist of two global practice areas which are focused on providing similar and/or complementary products and services across our diverse customer base and within targeted markets. Within each practice are various service lines having specific areas of expertise. Marketing and communications, sales, accounting, finance, legal, human resources, information systems and other administrative services are organized at the corporate level. Business development and sales resources are aligned by industry sector to support existing customer accounts and new customer development across both segments. Further information regarding our business segments is discussed below.
Workforce Excellence. The Workforce Excellence segment advises and partners with leading organizations in designing, implementing, operating and supporting their talent management and workforce strategies, enabling them to gain greater competitive edge in their markets. This segment consists of two practices:
• | Managed Learning Services - this practice focuses on creating value for our customers by delivering a suite of talent management and learning design, development, operational and support services that can be delivered as large scale outsourcing arrangements, managed services contracts and project-based service engagements. The Managed Learning Services offerings include strategic learning and development consulting services, digital learning content design and development solutions and a suite of managed learning operations services, including: managed facilitation and delivery, managed training administration and logistics, help desk support, event management and vendor management. |
• | Engineering & Technical Services - this practice focuses on capital intensive, inherently hazardous and/or highly complex technical services in support of both U.S. government and global commercial industries. Our products and services include design, development and delivery of technical work-based learning, CapEx (plant launch) initiatives, engineering design and construction management, fabrication, and management services, operational excellence consulting, chemical demilitarization services, homeland security services, emergency management support services along with all forms of technical documentation. We deliver world-class asset management and performance improvement consulting to a host of industries. Our proprietary EtaPRO® Performance and Condition Monitoring System provides a suite of real-time digital solutions for hundreds of facilities and is installed in power-generating units around the world. We also provide thousands of technical courses in a web-based off-the-shelf delivery format through our GPiLEARN+™ portal. |
Business Transformation Services. The Business Transformation Services segment works with organizations to execute complex business strategies by linking business systems, processes and workforce performance to clear and measurable results. We have a holistic methodology to establishing direction and closing the gap between strategy and execution. Our approach equips business leaders and teams with the tools and capability to deliver high-performance results. This segment consists of two practices:
• | Sales Enablement - this practice provides custom product sales training and service technical training, primarily to automotive manufacturers, designed to better educate customer salesforces as well as service technicians with respect to new product features and designs, in effect rapidly increasing the salesforce and technician knowledge base and enabling them to address retail customer needs. Furthermore, this segment helps our clients assess their customer relationship marketing strategy and connect with their customers on a one-to-one basis, including custom print and digital publications. We have been a custom product sales and service technical training provider and leader in serving manufacturing customers in the U.S. automotive industry for over 40 years. |
79
GP STRATEGIES CORPORATION
Notes to Consolidated Financial Statements
• | Organizational Development - this practice works with organizations to design and execute an integrated people performance system. This translates to helping organizations set strategy, carry that strategy through every level of the organization and ensure that their people have the right skills, knowledge, tools, processes and technology to enable transformation and achieve business results. Solutions include strategy, leadership, employee engagement and culture consulting, enterprise technology implementation and adoption solutions, and organization design and business performance consulting. |
We do not allocate the following items to the segments: general & administrative expenses, sales & marketing expenses, restructuring charges, other income (expense), interest expense, gain on change in fair value of contingent consideration, net and income tax expense.
The following table sets forth the revenue and operating results attributable to each reportable segment and includes a reconciliation of segment revenue to consolidated revenue and operating results to consolidated income before income tax expense (in thousands):
Years ended December 31, | ||||||||||||
2019 | 2018 | 2017 | ||||||||||
Revenue: | ||||||||||||
Workforce Excellence | $ | 329,795 | $ | 316,814 | $ | 308,259 | ||||||
Business Transformation Services | 253,495 | 198,346 | 200,949 | |||||||||
$ | 583,290 | $ | 515,160 | $ | 509,208 | |||||||
Gross Profit: | ||||||||||||
Workforce Excellence | $ | 55,855 | $ | 50,875 | $ | 52,958 | ||||||
Business Transformation Services | 33,358 | 26,868 | 29,069 | |||||||||
Total gross profit | 89,213 | 77,743 | 82,027 | |||||||||
General and administrative expenses | 64,492 | 54,848 | 55,753 | |||||||||
Sales and marketing expenses | 7,875 | 4,798 | 1,666 | |||||||||
Restructuring charges | 1,639 | 2,930 | 3,317 | |||||||||
Gain on change in fair value of contingent consideration, net | 677 | 4,438 | 1,620 | |||||||||
Gain on sale of business | 12,126 | — | — | |||||||||
Operating income | 28,010 | 19,605 | 22,911 | |||||||||
Interest expense | 6,058 | 2,945 | 3,132 | |||||||||
Other income (expense) | 417 | (1,897 | ) | (90 | ) | |||||||
Income before income tax expense | $ | 22,369 | $ | 14,763 | $ | 19,689 | ||||||
Additional information relating to our business segments is as follows (in thousands):
December 31, | ||||||||
2019 | 2018 | |||||||
Identifiable assets: | ||||||||
Workforce Excellence | $ | 290,465 | $ | 283,039 | ||||
Business Transformation Services | 158,437 | 151,699 | ||||||
Total assets | $ | 448,902 | $ | 434,738 | ||||
Corporate and other assets which consist primarily of cash, other assets, and deferred tax assets and liabilities are allocated to the segments based on their respective percentage of consolidated revenues.
80
GP STRATEGIES CORPORATION
Notes to Consolidated Financial Statements
Years ended December 31, | ||||||||||||
2019 | 2018 | 2017 | ||||||||||
Additions to property, plant and equipment: | ||||||||||||
Workforce Excellence | $ | 1,657 | $ | 1,321 | $ | 1,609 | ||||||
Business Transformation Services | 395 | 625 | 184 | |||||||||
Corporate and other | 263 | 888 | 941 | |||||||||
$ | 2,315 | $ | 2,834 | $ | 2,734 | |||||||
Depreciation and amortization: | ||||||||||||
Workforce Excellence | $ | 3,865 | $ | 3,664 | $ | 2,643 | ||||||
Business Transformation Services | 3,641 | 2,827 | 2,770 | |||||||||
Corporate and other | 1,976 | 1,430 | 1,561 | |||||||||
$ | 9,482 | $ | 7,921 | $ | 6,974 | |||||||
Information about our revenue in different geographic regions, which is attributable to our operations located primarily in the United States, United Kingdom and other countries is as follows (in thousands):
Years ended December 31, | ||||||||||||
2019 | 2018 | 2017 | ||||||||||
United States | $ | 374,017 | $ | 344,720 | $ | 350,632 | ||||||
United Kingdom | 86,511 | 92,059 | 100,466 | |||||||||
Other | 122,762 | 78,381 | 58,110 | |||||||||
$ | 583,290 | $ | 515,160 | $ | 509,208 | |||||||
Information about our total assets in different geographic regions is as follows (in thousands):
December 31, | ||||||||
2019 | 2018 | |||||||
United States | $ | 255,649 | $ | 248,657 | ||||
United Kingdom | 72,939 | 72,048 | ||||||
Canada | 43,503 | 41,974 | ||||||
Other | 76,811 | 72,059 | ||||||
$ | 448,902 | $ | 434,738 | |||||
(16) | Fair Value Measurements |
Our financial instruments measured at fair value include contingent consideration in connection with business combinations. The following table summarizes the financial assets and liabilities measured at fair value on a recurring basis as of December 31, 2019 and 2018, and the level they fall within the fair value hierarchy (in thousands):
Fair Value | ||||||||||||
Fair Value | December 31, | |||||||||||
Financial Instrument | Financial Statement Classification | Hierarchy | 2019 | 2018 | ||||||||
Contingent consideration | Accounts payable and accrued expenses | Level 3 | $ | — | $ | 594 | ||||||
Contingent consideration | Other noncurrent liabilities | Level 3 | — | 83 | ||||||||
81
GP STRATEGIES CORPORATION
Notes to Consolidated Financial Statements
(17) | Commitments, Guarantees, and Contingencies |
As of December 31, 2019, we had outstanding letters of credit totaling $0.1 million, which expire in 2022. In addition, as of December 31, 2019, we had three outstanding performance bonds totaling $12.4 million primarily for contracts in our alternative fuels business.
(18) | Quarterly Information (unaudited) |
Our quarterly financial information has not been audited but, in management’s opinion, includes all adjustments necessary for a fair presentation.
(In thousands) | Three months ended | Year ended | ||||||||||||||||||
2019 | March 31 | June 30 | September 30 | December 31 | December 31 | |||||||||||||||
Revenue | $ | 139,473 | $ | 149,413 | $ | 139,005 | $ | 155,399 | $ | 583,290 | ||||||||||
Gross profit | 21,278 | 22,959 | 21,667 | 23,309 | 89,213 | |||||||||||||||
Net income | 334 | 3,219 | 2,141 | 9,495 | (a) | 15,189 | ||||||||||||||
Earnings per share: | ||||||||||||||||||||
Basic | $ | 0.02 | $ | 0.19 | $ | 0.13 | $ | 0.56 | $ | 0.90 | ||||||||||
Diluted | $ | 0.02 | $ | 0.19 | $ | 0.13 | $ | 0.56 | $ | 0.90 | ||||||||||
2018 | ||||||||||||||||||||
Revenue | $ | 125,032 | $ | 133,691 | $ | 123,566 | $ | 132,871 | $ | 515,160 | ||||||||||
Gross profit | 17,679 | 22,573 | 19,199 | 18,292 | 77,743 | |||||||||||||||
Net income | 2,632 | 3,575 | 3,244 | 385 | 9,836 | |||||||||||||||
Earnings per share: | ||||||||||||||||||||
Basic | $ | 0.16 | $ | 0.22 | $ | 0.20 | $ | 0.02 | $ | 0.59 | ||||||||||
Diluted | $ | 0.16 | $ | 0.22 | $ | 0.20 | $ | 0.02 | $ | 0.59 | ||||||||||
The sum of the quarterly earnings per share amounts may not equal the total for the year due to the effects of rounding and dilution as a result of issuing common shares during the year.
(a) | Includes a $12.1 million pre-tax gain on the sale of our tuition program management business on October 1, 2019 which is described more fully in Note 4 to the Consolidated Financial Statements. |
82
Item 9: Changes in and Disagreements with Accountants on Accounting and Financial Disclosure
None.
Item 9A: Controls and Procedures
Disclosure Controls and Procedures
As required by Rule 13a-15(b) of the Securities Exchange Act of 1934 (the “Exchange Act”), as amended, we have evaluated, under the supervision and with the participation of our management, including our Chief Executive Officer and Chief Financial Officer, the effectiveness of the design and operation of our disclosure controls and procedures (as defined in Rules 13a-15(e) and 15d-15(e) under the Exchange Act) as of the end of the period covered by this Annual Report.
Based upon that evaluation, our Chief Executive Officer and Chief Financial Officer concluded that our disclosure controls and procedures were not effective due to material weaknesses in our internal control over financial reporting, which are described below under “Management’s Annual Report on Internal Control Over Financial Reporting.”
As a result of the material weaknesses identified, we performed additional analysis and other post-closing procedures intended to ensure that our consolidated financial statements were prepared in accordance with U.S. GAAP. Accordingly, management believes that the consolidated financial statements and related notes thereto included in this Annual Report on Form 10-K fairly present, in all material respects, the Company’s financial condition, results of operations and cash flows for the periods presented.
Our disclosure controls and procedures are designed to provide reasonable assurance that the information required to be disclosed by us in reports that we file under the Exchange Act is accumulated and communicated to our management, including our principal executive officer and principal financial officer, as appropriate, to allow timely decisions regarding required disclosure and is recorded, processed, summarized and reported within the time periods specified in the rules and forms of the SEC. Based upon the evaluation, our principal executive officer and principal financial officer have concluded that our disclosure controls and procedures were not effective as of December 31, 2019 at the reasonable assurance level due to the material weaknesses described below. Notwithstanding these material weaknesses, management concluded that the consolidated financial statements included in this Annual Report present fairly, in all material respects, the financial position of the Company at December 31, 2019 in conformity with GAAP and our external auditors have issued an unqualified opinion on our consolidated financial statements as of and for the year ended December 31, 2019.
Management’s Annual Report on Internal Control Over Financial Reporting
Our management is responsible for establishing and maintaining adequate internal control over financial reporting as defined in Exchange Act Rule 13a-15(f). Internal control over financial reporting is a process designed by, or under the supervision of, the company's principal executive and principal financial officers, or persons performing similar functions, and effected by the company's board of directors, management, and other personnel, to provide reasonable assurance regarding the reliability of financial reporting and the preparation of financial statements for external purposes in accordance with GAAP and includes those policies and procedures that: (1) Pertain to the maintenance of records that, in reasonable detail, accurately and fairly reflect the transactions and dispositions of the assets of the company; (2) Provide reasonable assurance that transactions are recorded as necessary to permit preparation of financial statements in accordance with generally accepted accounting principles, and that receipts and expenditures of the company are being made only in accordance with authorizations of management and directors of the company; and (3) Provide reasonable assurance regarding prevention or timely detection of unauthorized acquisition, use, or disposition of the company's assets that could have a material effect on the financial statements.
Internal control over financial reporting has inherent limitations. Internal control over financial reporting is a process that involves human diligence and compliance and is subject to lapses in judgment and breakdowns resulting from human failures. Internal control over financial reporting also can be circumvented by collusion or improper management override. Because of such limitations, there is a risk that material misstatements will not be prevented or detected on a timely basis by internal control over financial reporting. However, these inherent limitations are known features of the financial reporting process. Therefore, it is possible to design into the process safeguards to reduce, though not eliminate, this risk.
83
A material weakness is a deficiency, or a combination of deficiencies, in internal control over financial reporting, such that there is a reasonable possibility that a material misstatement of the Company’s annual or interim financial statements will not be prevented or detected on a timely basis.
Under the supervision and with the participation of management, including our Chief Executive Officer and Chief Financial Officer, and with the oversight of our Board of Directors, we conducted an evaluation of internal control over financial reporting as of December 31, 2019 based on the criteria set forth by the Committee of Sponsoring Organizations of the Treadway Commission in Internal Control - Integrated Framework (2013) (“COSO Framework”). As a result of our evaluation, we identified the following material weaknesses related to financial processing and enterprise resource planning (ERP) systems management:
Our risk assessment process was not effective in considering changes to the business operations, personnel and other factors affecting certain financial reporting processes, and we did not have sufficient resources available to perform the risk assessment process and implement controls in the requisite timeframe. This resulted in:
• | Ineffective program change management controls over program and data changes affecting the ERP financial IT applications. Specifically, the change management process was not designed properly to demonstrate the completeness and approval of all configuration changes that have occurred. The related detective control to monitor changes was not implemented. Also, the control over access to migrate changes into the production environment was determined to be ineffective. |
• | Ineffective user access controls to adequately restrict user access to financial applications and related data commensurate with job responsibilities. Management did not perform appropriate user access reviews. |
• | Ineffective general information technology controls over the ERP system resulting in ineffective manual controls that are dependent upon the completeness and accuracy of information derived from the ERP system. This includes automated and manual controls over all significant accounts presented in the consolidated financial statements. |
• | Ineffective risk assessment to ensure controls were designed and implemented to respond to the risks within the revenue and human resources processes company-wide as well as other processes specific to only TTi Global, Inc., which was acquired on November 30, 2018. |
Certain of these control deficiencies resulted in immaterial and material misstatements to the preliminary consolidated financial statements that were corrected in the audited consolidated financial statements prior to the release of our annual report in Form 10-K. These control deficiencies create a reasonable possibility that a material misstatement to the consolidated financial statements will not be prevented or detected on a timely basis. Accordingly, we have concluded that our internal control over financial reporting is not effective as of December 31, 2019.
KPMG LLP, an independent registered public accounting firm, has audited the Company’s consolidated financial statements and has issued an adverse report on the effectiveness of internal control over financial reporting, which is included on page 44 in this Form 10-K.
Remediation Plan
Management has been implementing and continues to implement measures designed to ensure that control deficiencies contributing to the material weaknesses are remediated. The remediation actions include:
Risk Assessment Activities: ensuring appropriate internal and external resources are assigned to identify risks, changes, and other factors affecting business operations and financial reporting processes, and improving accountability of process owners and control operators.
Logical Access: during 2019, we redesigned user access roles to address segregation of duties conflicts. We are implementing timely logical access reviews to ensure appropriate assignment to user access roles and performing additional reviews over user roles.
Program Change Management: ensuring that change management review controls are fully refined and implemented; testing and approving configuration changes prior to promotion to the ERP system; validating that configuration of reports utilized in control are complete and accurate; completing manual reviews of transactions to ensure processing and reporting of data is complete and accurate.
84
Additionally, we continue to enhance internal training programs to improve the knowledge of our personnel and to reduce our dependency on external service providers, to improve processes, and to emphasize the importance of IT general controls in the Company’s internal control over financial reporting. We are providing timely reporting to the Audit Committee of the Board of Directors of results of remediation efforts.
We believe that these actions will remediate the material weaknesses. The weaknesses will not be considered remediated, however, until the applicable controls operate for a sufficient period of time and management has concluded, through testing, that these controls are operating effectively.
Changes in Internal Control Over Financial Reporting
Except for the material weaknesses that were identified in fourth quarter but that arose earlier in 2019, there have been no changes in our internal control over financial reporting during the year ended December 31, 2019 that have materially affected or are reasonably likely to materially affect our internal control over financial reporting.
Item 9B: Other Information
None.
85
Part III
Item 10. Directors, Executive Officers and Corporate Governance
The additional information required by this item will be either set forth under the Election of Directors section in the Proxy Statement for the 2020 Annual Meeting of Shareholders and incorporated herein by reference or provided in an amendment to this Form 10-K to be filed no later than April 29, 2020.
Compliance with Section 16(a) of the Exchange Act
Section 16(a) of the Exchange Act requires our officers and directors, and persons who own more than 10% of a registered class of our securities, to file reports of ownership and changes in ownership with the Securities and Exchange Commission (“SEC”) and the New York Stock Exchange (“NYSE”), and to furnish us with such reports. Based solely on a review of copies of such reports for 2019, we believe that during 2019 all reports applicable to our officers, directors and greater than 10% beneficial owners were filed on a timely basis, with the exception of six Form 4's reporting our quarterly share issuance to our directors which were filed two days late.
Item 11. Executive Compensation
The information required by this item will be either set forth under the Executive Compensation section in the Proxy Statement for the 2020 Annual Meeting of Shareholders and incorporated herein by reference or provided in an amendment to this Form 10-K to be filed no later than April 29, 2020.
Item 12. Security Ownership of Certain Beneficial Owners and Management and Related Stockholder Matters
The additional information required by this item will be either set forth under the Principal Stockholders and Security Ownership of Directors and Named Executive Officers sections in the Proxy Statement for the 2020 Annual Meeting of Stockholders and incorporated herein by reference or provided in an amendment to this Form 10-K to be filed no later than April 29, 2020.
Equity Compensation Plan information as of December 31, 2019
Plan category: | |||
Equity compensation plans not approved by security holders: | |||
(a) Number of securities to be issued upon exercise of outstanding options | — | ||
(b) Weighted average exercise price of outstanding options | $ | — | |
(c) Number of securities remaining available for future issuance under equity compensation plans (excluding securities reflected in row (a)) | — | ||
Equity compensation plans approved by security holders: | |||
(a) Number of securities to be issued upon exercise of outstanding options | — | ||
(b) Weighted average exercise price of outstanding options | $ | — | |
(c) Number of securities remaining available for future issuance under equity compensation plans | 827,855 | ||
For a description of the material terms of our stock-based compensation plans, see Note 12 to the Consolidated Financial Statements in Item 8 of this report.
86
Item 13. Certain Relationships and Related Transactions, and Director Independence
The information required by this item will be either set forth in the Certain Relationships and Related Transactions section of the Proxy Statement for the 2020 Annual Meeting of Shareholders and incorporated herein by reference or provided in an amendment to this Form 10-K to be filed no later than April 29, 2020.
Item 14. Principal Accounting Fees and Services
The information required by this item will be either set forth in the Ratification of Independent Registered Public Accounting Firm section of the Proxy Statement for the 2020 Annual Meeting of Shareholders and incorporated herein by reference or provided in an amendment to this Form 10-K to be filed no later than April 29, 2020.
87
Part IV
Item 15: Exhibits and Financial Statement Schedules
(a) | The following documents are filed as a part of this Report: |
(1) | Financial Statements of GP Strategies Corporation and Subsidiaries (Part II, Item 8): |
Reports of Independent Registered Public Accounting Firm | |
Consolidated Balance Sheets – December 31, 2019 and 2018 | |
Consolidated Statements of Operations – Years ended December 31, 2019, 2018 and 2017 | |
Consolidated Statements of Comprehensive Income – Years ended December 31, 2019, 2018 and 2017 | |
Consolidated Statements of Stockholders’ Equity – Years ended December 31, 2019, 2018 and 2017 | |
Consolidated Statements of Cash Flows – Years ended December 31, 2019, 2018 and 2017 | |
Notes to Consolidated Financial Statements | |
(2) | Financial Statement Schedules: |
Other financial statement schedules are omitted because they are not required or applicable, or the required information is shown in the financial statements or notes thereto, or contained in this report. | |
(3) | Exhibits required by Item 601 of Regulation S-K. |
Exhibit number
3.1 | |
3.2 | |
4.1 | |
10.1 | |
10.2 | |
10.3 | |
10.4 | |
88
10.5 | |
10.6 | |
10.7 | |
10.8 | |
10.9 | |
10.10 | |
10.11 | |
10.12 | |
10.13 | |
10.14 | |
10.15 | |
10.16 | |
10.17 | |
10.18 | |
10.19 | |
10.20 | |
10.21 | |
10.22 | |
89
10.23 | |
10.24 | |
10.25 | |
10.26 | |
10.27 | |
10.28 | |
10.29 | |
10.30 | |
21 | |
23 | |
31.1 | |
31.2 | |
32.1 | |
101 | The following materials from GP Strategies Corporation’s Annual Report on Form 10-K for the year ended December 31, 2019, formatted in XBRL (eXtensible Business Reporting Language): (i) Consolidated Balance Sheets; (ii) Consolidated Statements of Operations; (iii) Consolidated Statements of Comprehensive Income, (iv) Consolidated Statements of Stockholders’ Equity; (v) Consolidated Statements of Cash Flows; and (vi) Notes to Consolidated Financial Statements.* |
* Filed herewith.
90
SIGNATURES
Pursuant to the requirements of Section 13 or 15(d) of the Securities Exchange Act of 1934, the Registrant has duly caused this report to be signed on its behalf by the undersigned, thereunto duly authorized.
GP STRATEGIES CORPORATION | ||
Dated: March 10, 2020 | By | /s/ Scott N. Greenberg |
Scott N. Greenberg | ||
Chief Executive Officer | ||
Pursuant to the requirements of the Securities Exchange Act of 1934, this report has been signed below by the following persons on behalf of the Registrant and in the capacities and on the dates indicated.
Signatures | Title | Date | ||
/s/ Scott N. Greenberg | ||||
Scott N. Greenberg | Chairman of the Board & Chief Executive Officer (Principal Executive Officer and Director) | March 10, 2020 | ||
/s/ Michael R. Dugan | ||||
Michael R. Dugan | Executive Vice President and Chief Financial Officer (Principal Financial and Accounting Officer) | March 10, 2020 | ||
/s/ Samuel D. Robinson | ||||
Samuel D. Robinson | Lead Independent Director | March 10, 2020 | ||
/s/ Tamar Elkeles | ||||
Tamar Elkeles | Director | March 10, 2020 | ||
/s/ Marshall S. Geller | ||||
Marshall S. Geller | Director | March 10, 2020 | ||
/s/ Steven E. Koonin | ||||
Steven E. Koonin | Director | March 10, 2020 | ||
/s/ Jacques Manardo | ||||
Jacques Manardo | Director | March 10, 2020 | ||
/s/ Richard C. Pfenniger, Jr. | ||||
Richard C. Pfenniger, Jr. | Director | March 10, 2020 | ||
91