Attached files
| file | filename |
|---|---|
| EX-99.1 - EX-99.1 - Manitex International, Inc. | d898688dex991.htm |
| 8-K - 8-K - Manitex International, Inc. | d898688d8k.htm |

MANITEX INTERNATIONAL, INC. NASDAQ: MNTX Fourth Quarter Earnings Conference Call March 2020 Exhibit 99.2
Forward-Looking Statement and Non-GAAP Measures Safe Harbor Statement under the U.S. Private Securities Litigation Reform Act of 1995: This presentation contains statements that are forward-looking in nature which express the beliefs and expectations of management including statements regarding the Company’s expected results of operations or liquidity; statements concerning projections, predictions, expectations, estimates or forecasts as to our business, financial and operational results and future economic performance; and statements of management’s goals and objectives and other similar expressions concerning matters that are not historical facts. In some cases, you can identify forward-looking statements by terminology such as “anticipate,” “estimate,” “plan,” “project,” “continuing,” “ongoing,” “expect,” “we believe,” “we intend,” “may,” “will,” “should,” “could,” and similar expressions. Such statements are based on current plans, estimates and expectations and involve a number of known and unknown risks, uncertainties and other factors that could cause the Company's future results, performance or achievements to differ significantly from the results, performance or achievements expressed or implied by such forward-looking statements. These factors and additional information are discussed in the Company's filings with the Securities and Exchange Commission and statements in this presentation should be evaluated in light of these important factors. Although we believe that these statements are based upon reasonable assumptions, we cannot guarantee future results. Forward-looking statements speak only as of the date on which they are made, and the Company undertakes no obligation to update publicly or revise any forward-looking statement, whether as a result of new information, future developments or otherwise. NASDAQ : MNTX
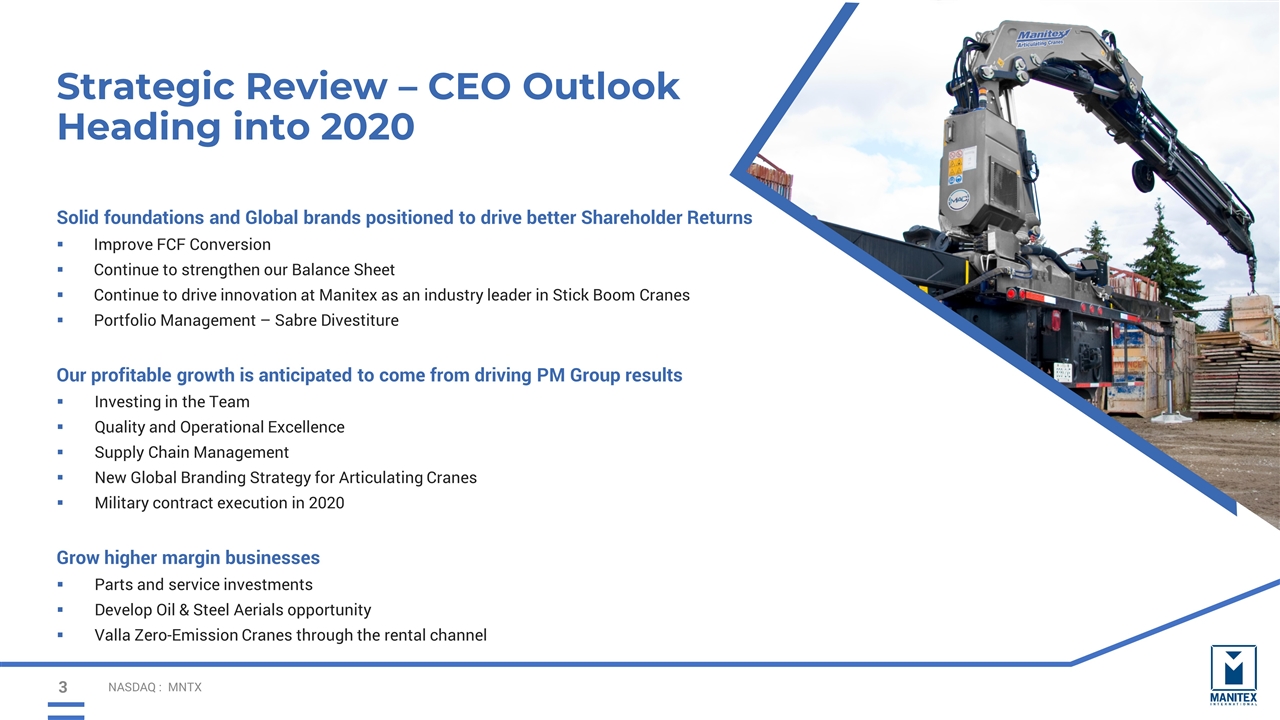
Strategic Review – CEO Outlook Heading into 2020 Solid foundations and Global brands positioned to drive better Shareholder Returns Improve FCF Conversion Continue to strengthen our Balance Sheet Continue to drive innovation at Manitex as an industry leader in Stick Boom Cranes Portfolio Management – Sabre Divestiture Our profitable growth is anticipated to come from driving PM Group results Investing in the Team Quality and Operational Excellence Supply Chain Management New Global Branding Strategy for Articulating Cranes Military contract execution in 2020 Grow higher margin businesses Parts and service investments Develop Oil & Steel Aerials opportunity Valla Zero-Emission Cranes through the rental channel NASDAQ : MNTX
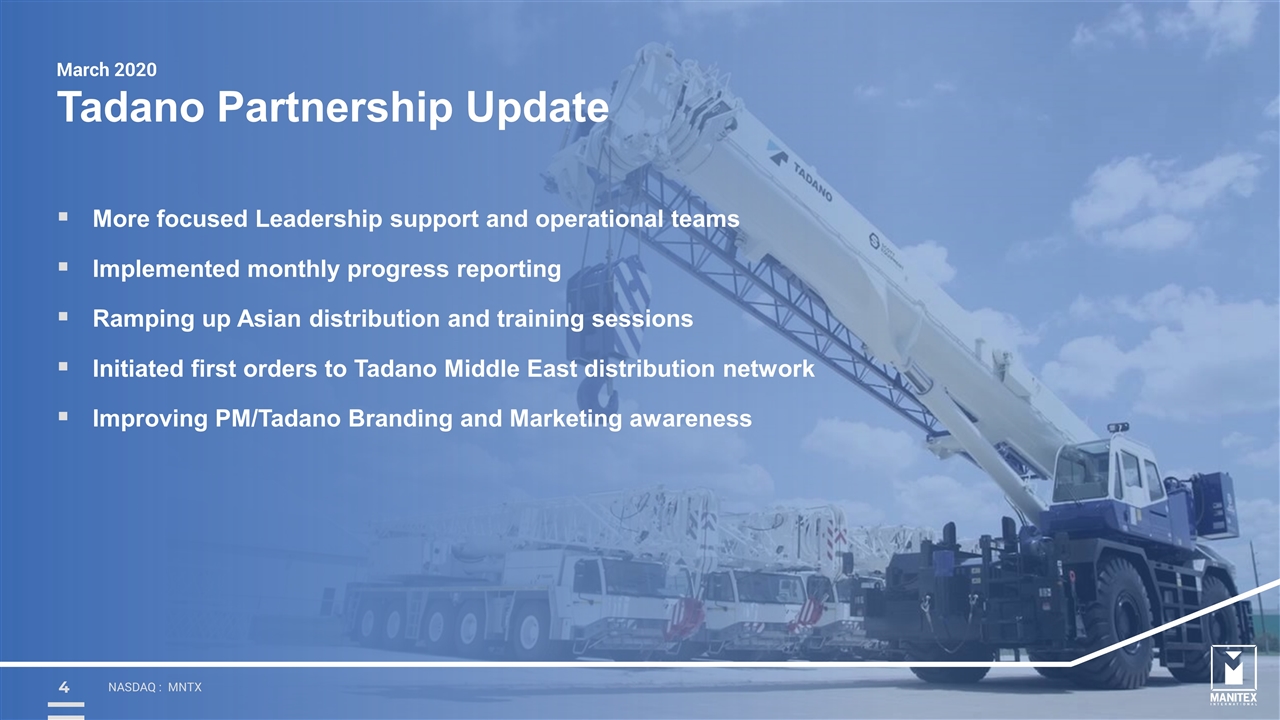
Tadano Partnership Update NASDAQ : MNTX March 2020 More focused Leadership support and operational teams Implemented monthly progress reporting Ramping up Asian distribution and training sessions Initiated first orders to Tadano Middle East distribution network Improving PM/Tadano Branding and Marketing awareness
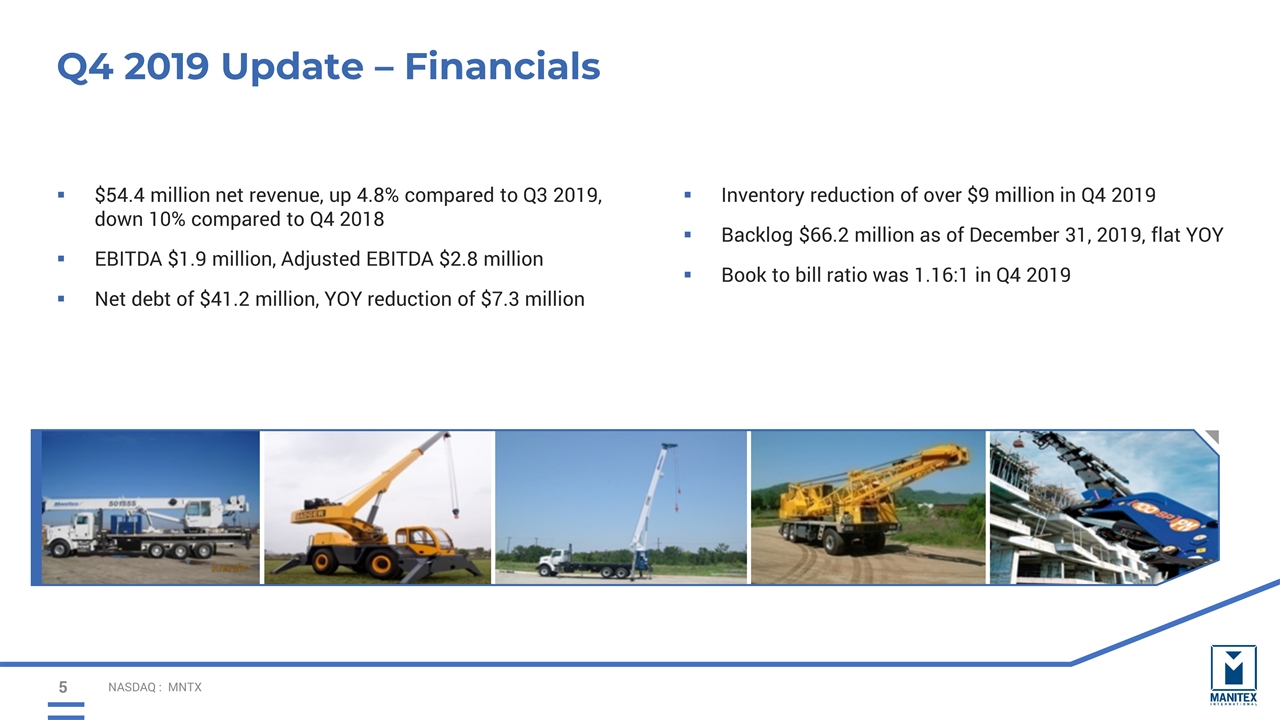
Q4 2019 Update – Financials $54.4 million net revenue, up 4.8% compared to Q3 2019, down 10% compared to Q4 2018 EBITDA $1.9 million, Adjusted EBITDA $2.8 million Net debt of $41.2 million, YOY reduction of $7.3 million Inventory reduction of over $9 million in Q4 2019 Backlog $66.2 million as of December 31, 2019, flat YOY Book to bill ratio was 1.16:1 in Q4 2019 NASDAQ : MNTX
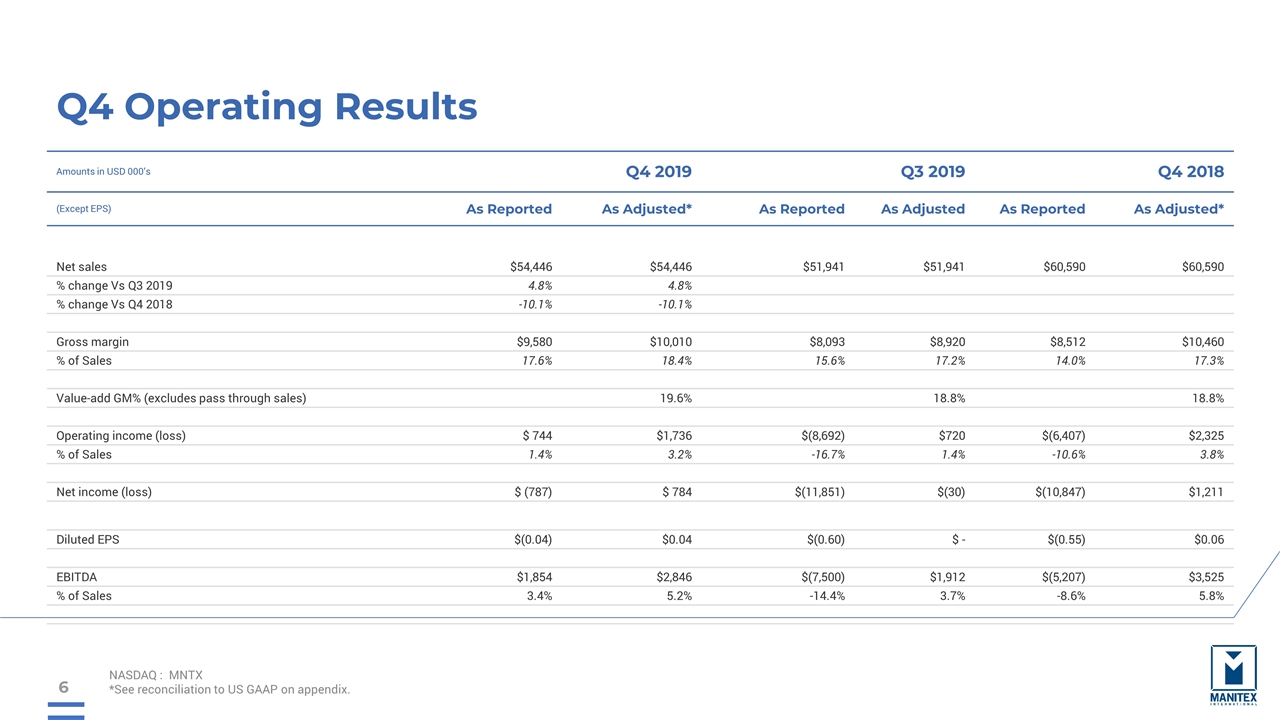
Q4 Operating Results NASDAQ : MNTX *See reconciliation to US GAAP on appendix. Amounts in USD 000’s Q4 2019 Q3 2019 Q4 2018 (Except EPS) As Reported As Adjusted* As Reported As Adjusted As Reported As Adjusted* Net sales $54,446 $54,446 $51,941 $51,941 $60,590 $60,590 % change Vs Q3 2019 4.8% 4.8% % change Vs Q4 2018 -10.1% -10.1% Gross margin $9,580 $10,010 $8,093 $8,920 $8,512 $10,460 % of Sales 17.6% 18.4% 15.6% 17.2% 14.0% 17.3% Value-add GM% (excludes pass through sales) 19.6% 18.8% 18.8% Operating income (loss) $ 744 $1,736 $(8,692) $720 $(6,407) $2,325 % of Sales 1.4% 3.2% -16.7% 1.4% -10.6% 3.8% Net income (loss) $ (787) $ 784 $(11,851) $(30) $(10,847) $1,211 Diluted EPS $(0.04) $0.04 $(0.60) $ - $(0.55) $0.06 EBITDA $1,854 $2,846 $(7,500) $1,912 $(5,207) $3,525 % of Sales 3.4% 5.2% -14.4% 3.7% -8.6% 5.8%
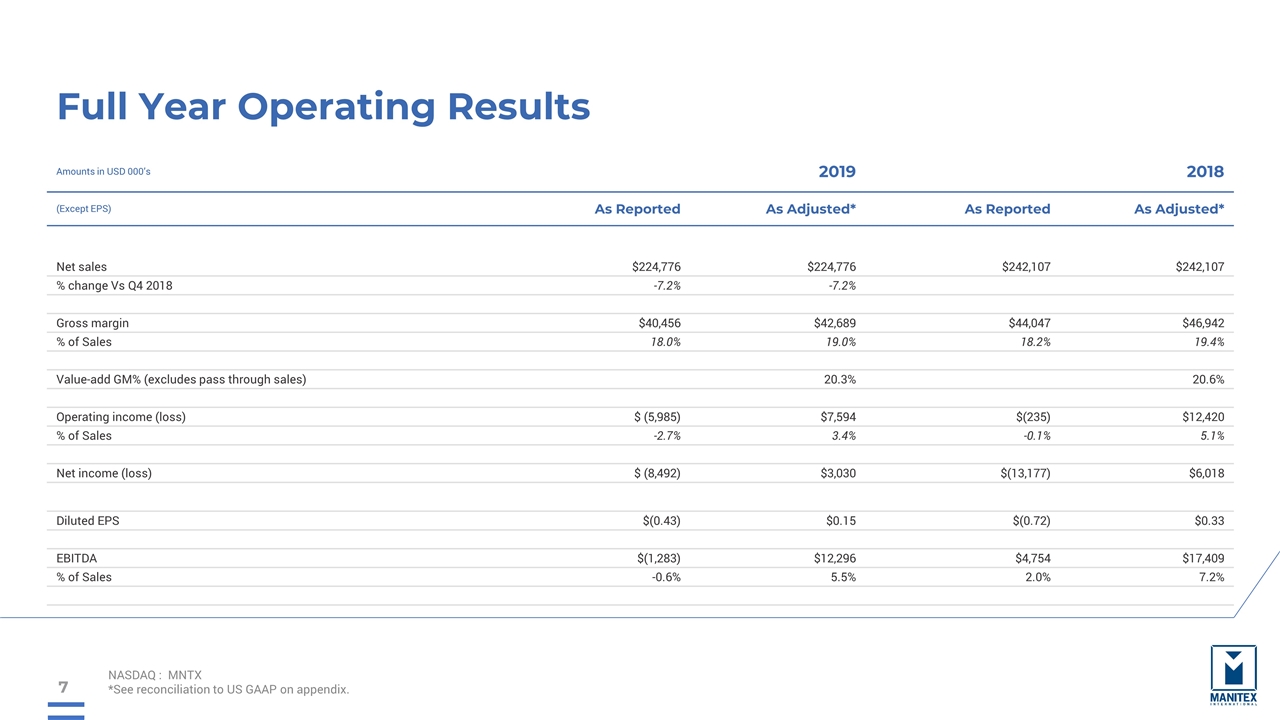
Full Year Operating Results NASDAQ : MNTX *See reconciliation to US GAAP on appendix. Amounts in USD 000’s 2019 2018 (Except EPS) As Reported As Adjusted* As Reported As Adjusted* Net sales $224,776 $224,776 $242,107 $242,107 % change Vs Q4 2018 -7.2% -7.2% Gross margin $40,456 $42,689 $44,047 $46,942 % of Sales 18.0% 19.0% 18.2% 19.4% Value-add GM% (excludes pass through sales) 20.3% 20.6% Operating income (loss) $ (5,985) $7,594 $(235) $12,420 % of Sales -2.7% 3.4% -0.1% 5.1% Net income (loss) $ (8,492) $3,030 $(13,177) $6,018 Diluted EPS $(0.43) $0.15 $(0.72) $0.33 EBITDA $(1,283) $12,296 $4,754 $17,409 % of Sales -0.6% 5.5% 2.0% 7.2%
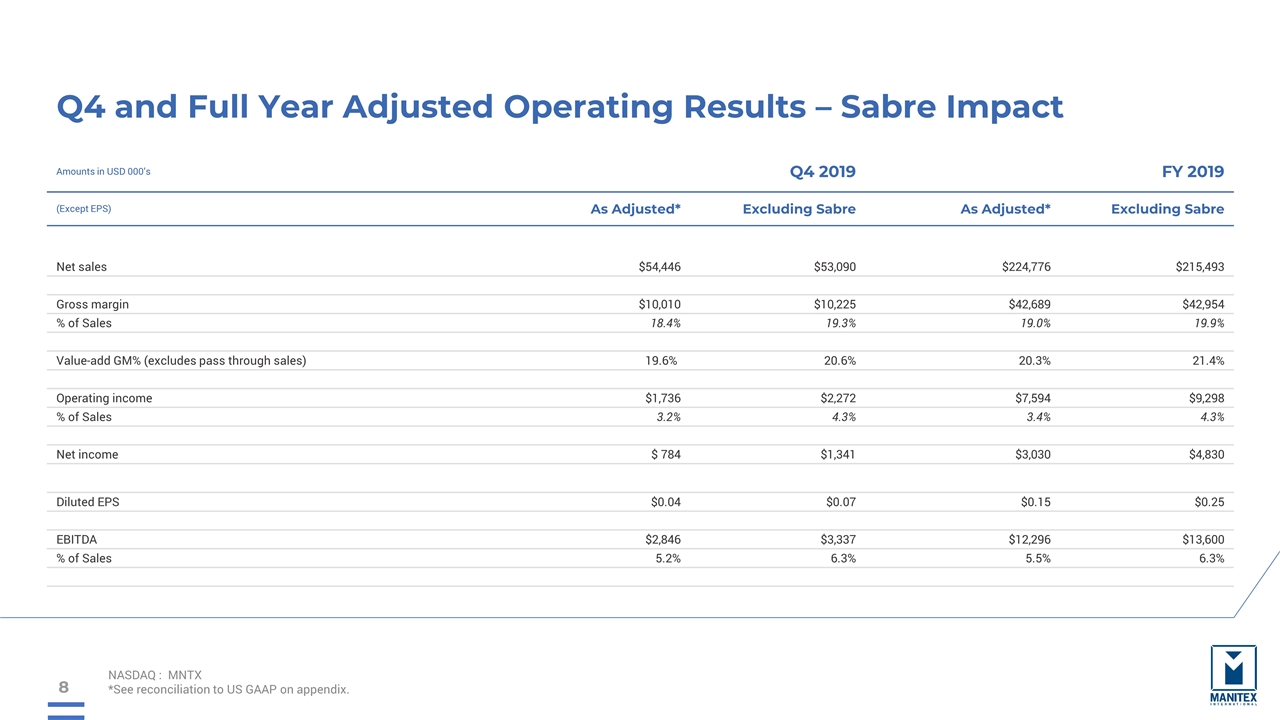
Q4 and Full Year Adjusted Operating Results – Sabre Impact NASDAQ : MNTX *See reconciliation to US GAAP on appendix. Amounts in USD 000’s Q4 2019 FY 2019 (Except EPS) As Adjusted* Excluding Sabre As Adjusted* Excluding Sabre Net sales $54,446 $53,090 $224,776 $215,493 Gross margin $10,010 $10,225 $42,689 $42,954 % of Sales 18.4% 19.3% 19.0% 19.9% Value-add GM% (excludes pass through sales) 19.6% 20.6% 20.3% 21.4% Operating income $1,736 $2,272 $7,594 $9,298 % of Sales 3.2% 4.3% 3.4% 4.3% Net income $ 784 $1,341 $3,030 $4,830 Diluted EPS $0.04 $0.07 $0.15 $0.25 EBITDA $2,846 $3,337 $12,296 $13,600 % of Sales 5.2% 6.3% 5.5% 6.3%
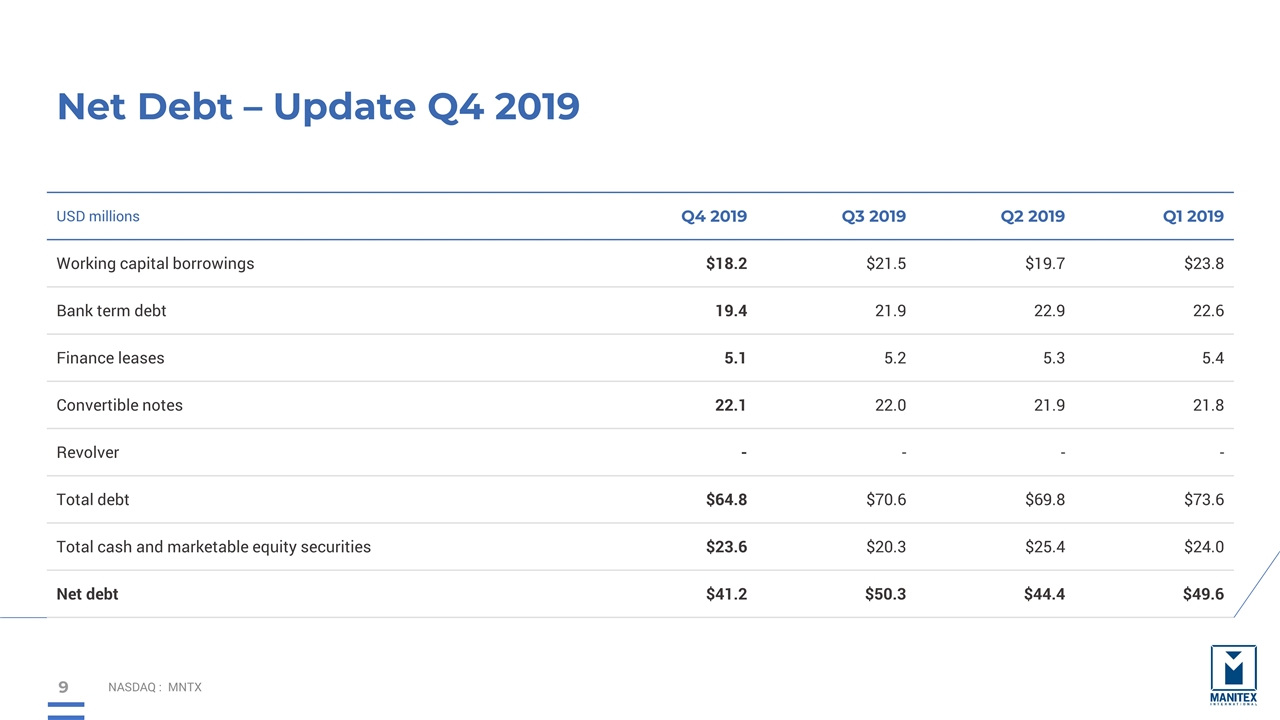
Net Debt – Update Q4 2019 NASDAQ : MNTX USD millions Q4 2019 Q3 2019 Q2 2019 Q1 2019 Working capital borrowings $18.2 $21.5 $19.7 $23.8 Bank term debt 19.4 21.9 22.9 22.6 Finance leases 5.1 5.2 5.3 5.4 Convertible notes 22.1 22.0 21.9 21.8 Revolver - - - - Total debt $64.8 $70.6 $69.8 $73.6 Total cash and marketable equity securities $23.6 $20.3 $25.4 $24.0 Net debt $41.2 $50.3 $44.4 $49.6
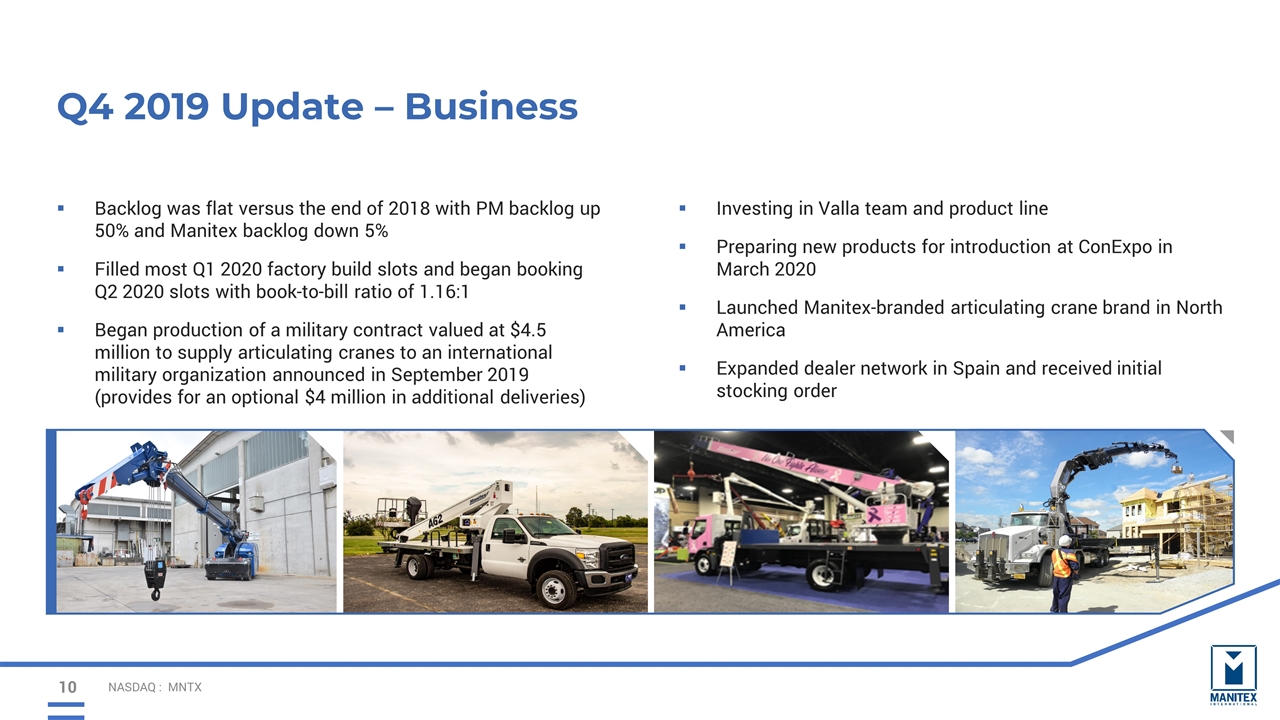
Q4 2019 Update – Business Backlog was flat versus the end of 2018 with PM backlog up 50% and Manitex backlog down 5% Filled most Q1 2020 factory build slots and began booking Q2 2020 slots with book-to-bill ratio of 1.16:1 Began production of a military contract valued at $4.5 million to supply articulating cranes to an international military organization announced in September 2019 (provides for an optional $4 million in additional deliveries) Investing in Valla team and product line Preparing new products for introduction at ConExpo in March 2020 Launched Manitex-branded articulating crane brand in North America Expanded dealer network in Spain and received initial stocking order NASDAQ : MNTX
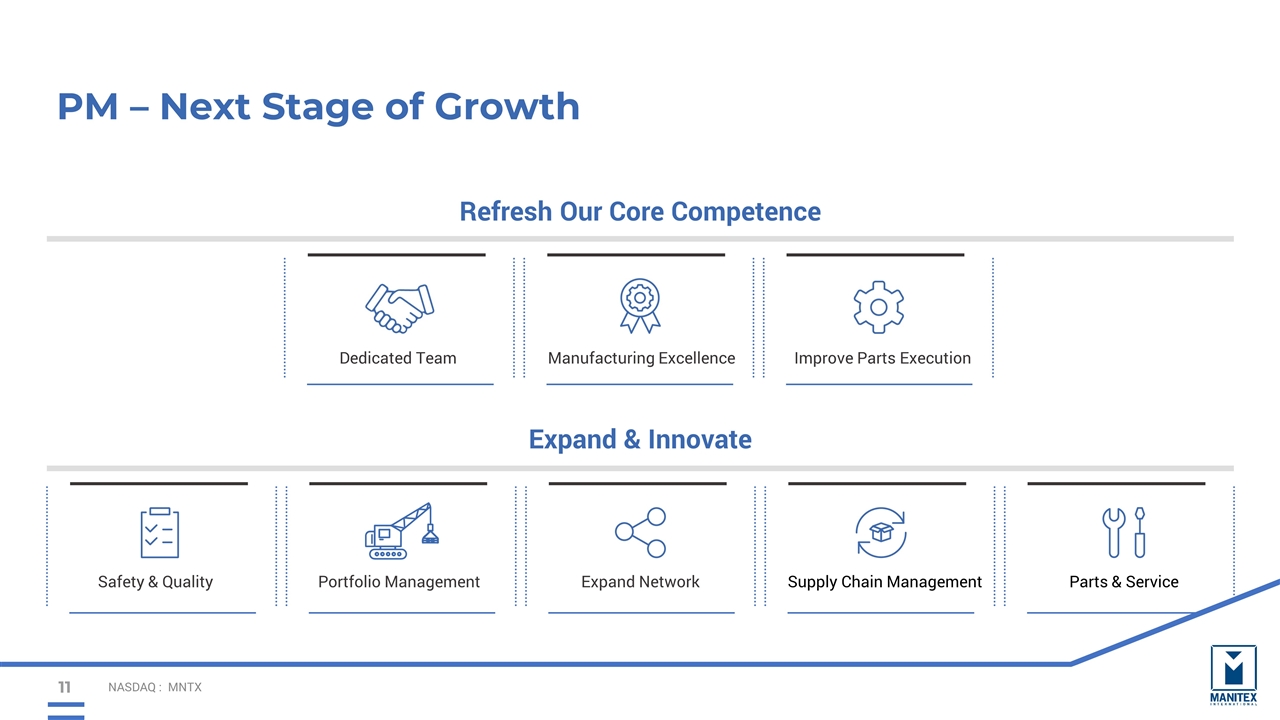
PM – Next Stage of Growth NASDAQ : MNTX Dedicated Team Manufacturing Excellence Improve Parts Execution Safety & Quality Portfolio Management Expand Network Supply Chain Management Parts & Service Refresh Our Core Competence Expand & Innovate
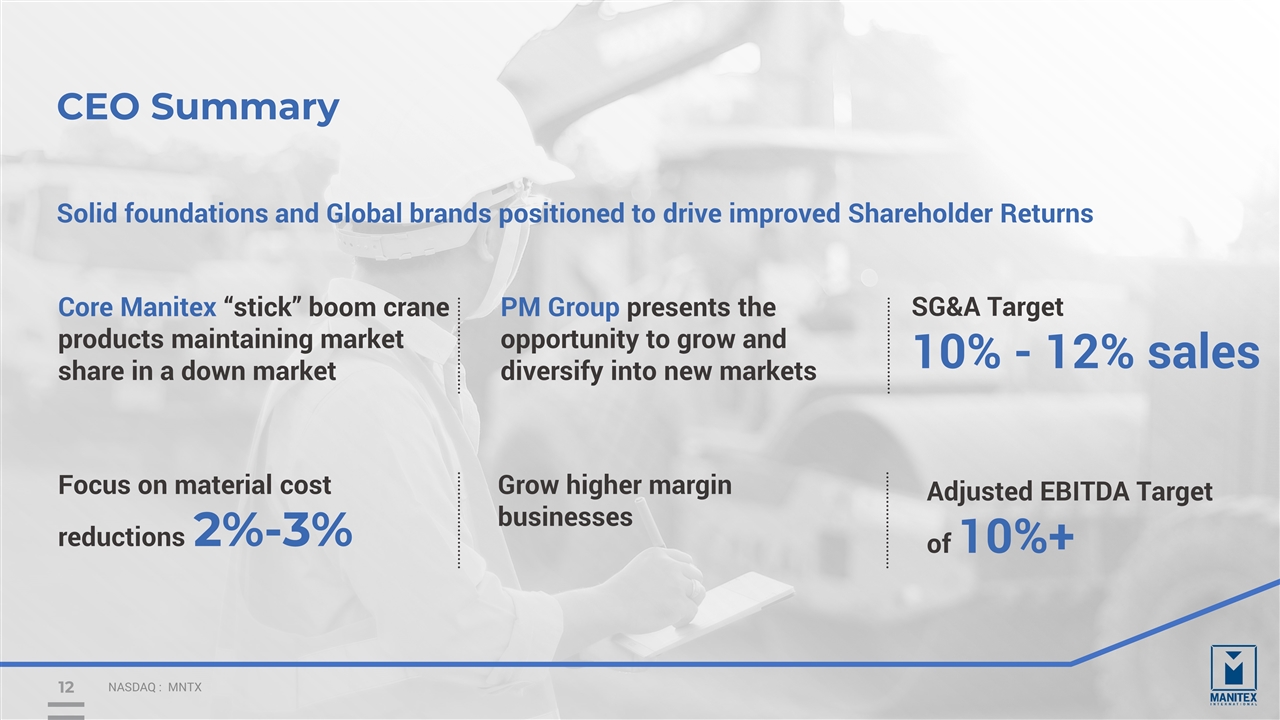
Grow higher margin businesses Adjusted EBITDA Target of 10%+ CEO Summary NASDAQ : MNTX Core Manitex “stick” boom crane products maintaining market share in a down market PM Group presents the opportunity to grow and diversify into new markets SG&A Target 10% - 12% sales Focus on material cost reductions 2%-3% Solid foundations and Global brands positioned to drive improved Shareholder Returns
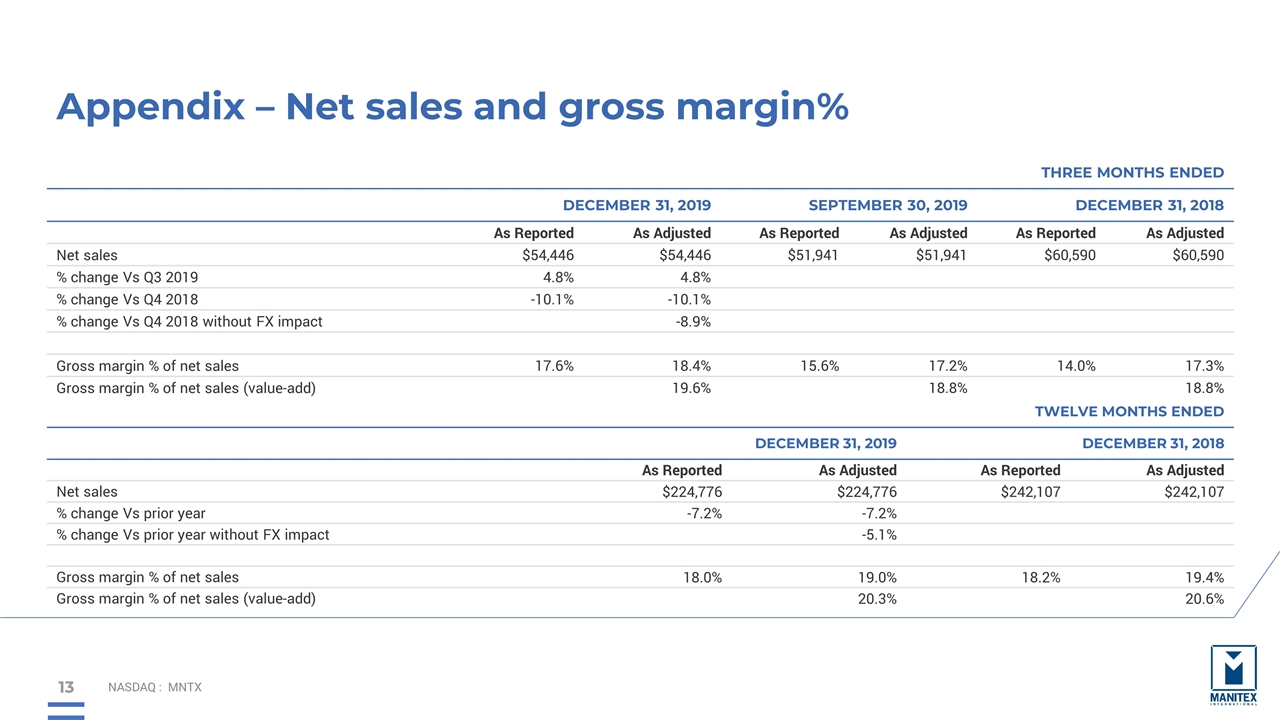
Appendix – Net sales and gross margin% NASDAQ : MNTX THREE MONTHS ENDED DECEMBER 31, 2019 SEPTEMBER 30, 2019 DECEMBER 31, 2018 As Reported As Adjusted As Reported As Adjusted As Reported As Adjusted Net sales $54,446 $54,446 $51,941 $51,941 $60,590 $60,590 % change Vs Q3 2019 4.8% 4.8% % change Vs Q4 2018 -10.1% -10.1% % change Vs Q4 2018 without FX impact -8.9% Gross margin % of net sales 17.6% 18.4% 15.6% 17.2% 14.0% 17.3% Gross margin % of net sales (value-add) 19.6% 18.8% 18.8% TWELVE MONTHS ENDED DECEMBER 31, 2019 DECEMBER 31, 2018 As Reported As Adjusted As Reported As Adjusted Net sales $224,776 $224,776 $242,107 $242,107 % change Vs prior year -7.2% -7.2% % change Vs prior year without FX impact -5.1% Gross margin % of net sales 18.0% 19.0% 18.2% 19.4% Gross margin % of net sales (value-add) 20.3% 20.6%
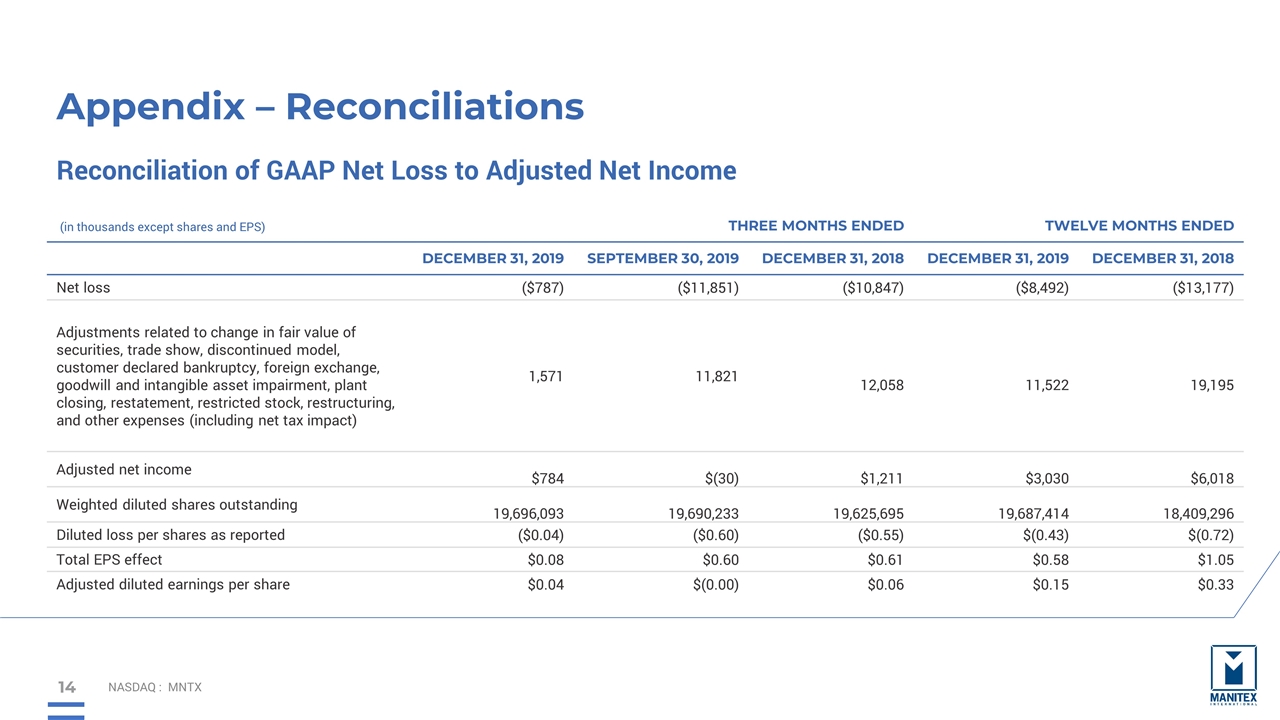
Appendix – Reconciliations NASDAQ : MNTX Reconciliation of GAAP Net Loss to Adjusted Net Income (in thousands except shares and EPS) THREE MONTHS ENDED TWELVE MONTHS ENDED DECEMBER 31, 2019 SEPTEMBER 30, 2019 DECEMBER 31, 2018 DECEMBER 31, 2019 DECEMBER 31, 2018 Net loss ($787) ($11,851) ($10,847) ($8,492) ($13,177) Adjustments related to change in fair value of securities, trade show, discontinued model, customer declared bankruptcy, foreign exchange, goodwill and intangible asset impairment, plant closing, restatement, restricted stock, restructuring, and other expenses (including net tax impact) 1,571 11,821 12,058 11,522 19,195 Adjusted net income $784 $(30) $1,211 $3,030 $6,018 Weighted diluted shares outstanding 19,696,093 19,690,233 19,625,695 19,687,414 18,409,296 Diluted loss per shares as reported ($0.04) ($0.60) ($0.55) $(0.43) $(0.72) Total EPS effect $0.08 $0.60 $0.61 $0.58 $1.05 Adjusted diluted earnings per share $0.04 $(0.00) $0.06 $0.15 $0.33
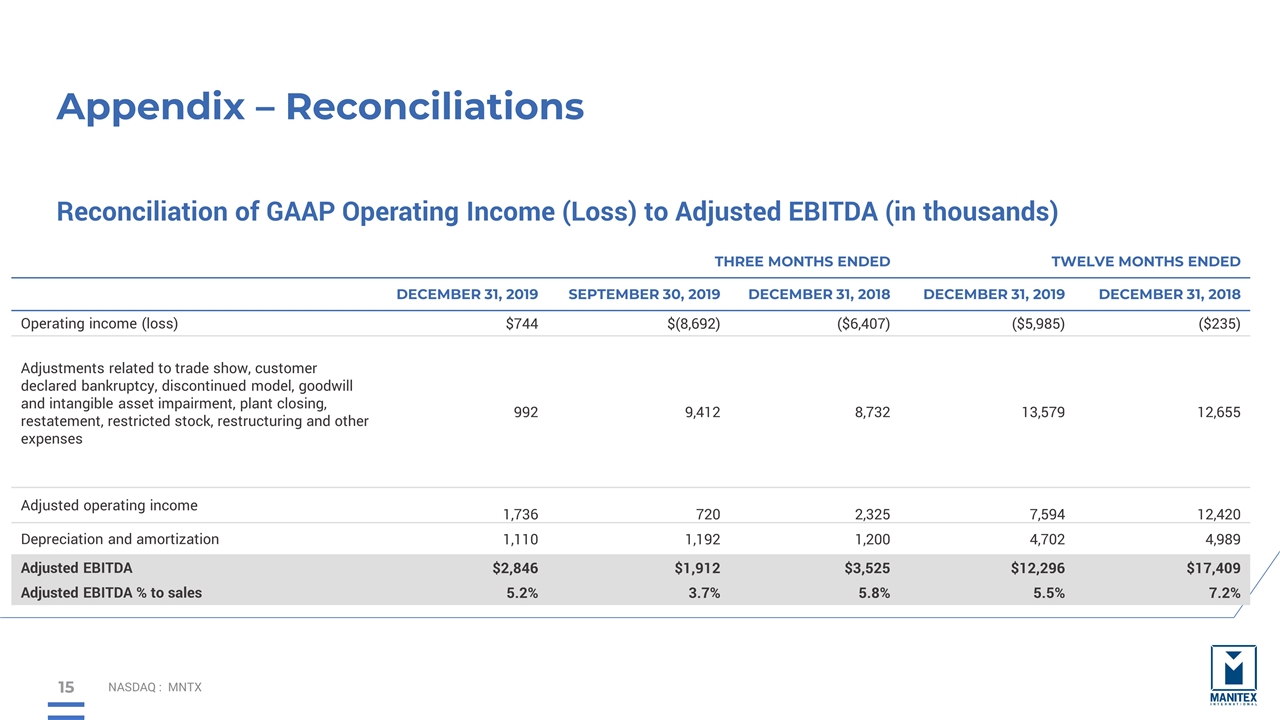
Appendix – Reconciliations NASDAQ : MNTX Reconciliation of GAAP Operating Income (Loss) to Adjusted EBITDA (in thousands) THREE MONTHS ENDED TWELVE MONTHS ENDED DECEMBER 31, 2019 SEPTEMBER 30, 2019 DECEMBER 31, 2018 DECEMBER 31, 2019 DECEMBER 31, 2018 Operating income (loss) $744 $(8,692) ($6,407) ($5,985) ($235) Adjustments related to trade show, customer declared bankruptcy, discontinued model, goodwill and intangible asset impairment, plant closing, restatement, restricted stock, restructuring and other expenses 992 9,412 8,732 13,579 12,655 Adjusted operating income 1,736 720 2,325 7,594 12,420 Depreciation and amortization 1,110 1,192 1,200 4,702 4,989 Adjusted EBITDA $2,846 $1,912 $3,525 $12,296 $17,409 Adjusted EBITDA % to sales 5.2% 3.7% 5.8% 5.5% 7.2%
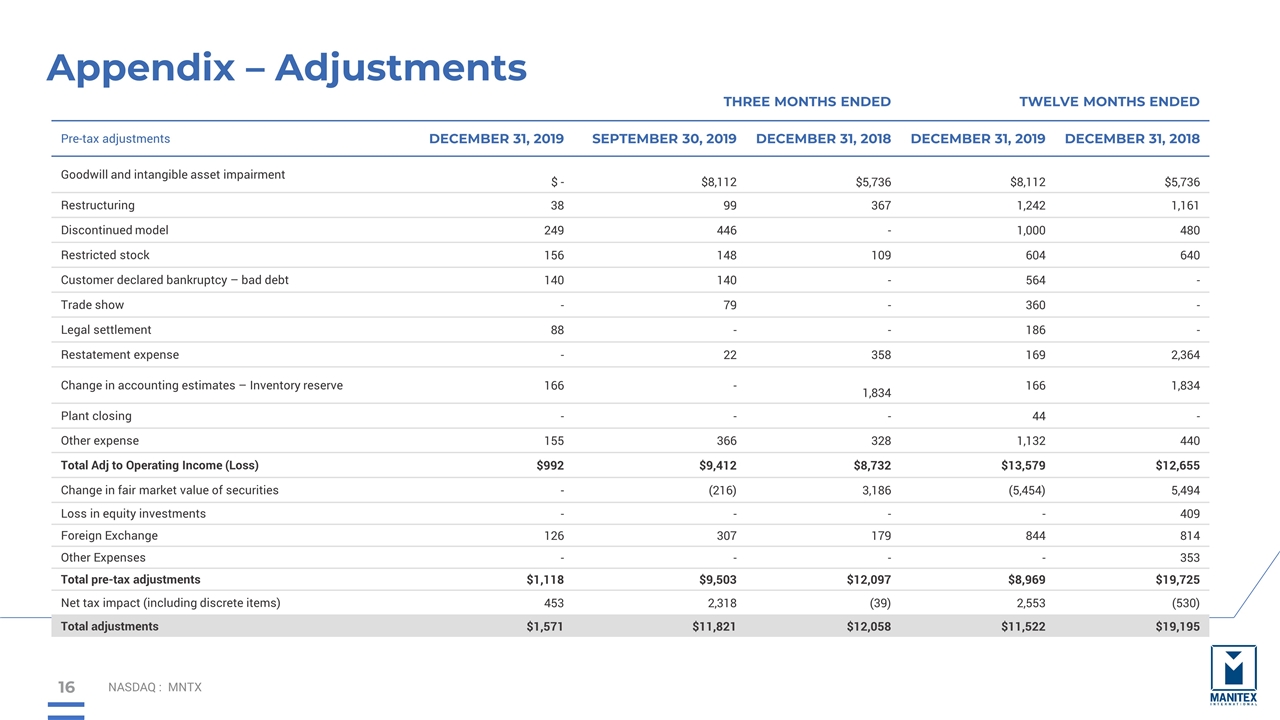
Appendix – Adjustments NASDAQ : MNTX THREE MONTHS ENDED TWELVE MONTHS ENDED Pre-tax adjustments DECEMBER 31, 2019 SEPTEMBER 30, 2019 DECEMBER 31, 2018 DECEMBER 31, 2019 DECEMBER 31, 2018 Goodwill and intangible asset impairment $ - $8,112 $5,736 $8,112 $5,736 Restructuring 38 99 367 1,242 1,161 Discontinued model 249 446 - 1,000 480 Restricted stock 156 148 109 604 640 Customer declared bankruptcy – bad debt 140 140 - 564 - Trade show - 79 - 360 - Legal settlement 88 - - 186 - Restatement expense - 22 358 169 2,364 Change in accounting estimates – Inventory reserve 166 - 1,834 166 1,834 Plant closing - - - 44 - Other expense 155 366 328 1,132 440 Total Adj to Operating Income (Loss) $992 $9,412 $8,732 $13,579 $12,655 Change in fair market value of securities - (216) 3,186 (5,454) 5,494 Loss in equity investments - - - - 409 Foreign Exchange 126 307 179 844 814 Other Expenses - - - - 353 Total pre-tax adjustments $1,118 $9,503 $12,097 $8,969 $19,725 Net tax impact (including discrete items) 453 2,318 (39) 2,553 (530) Total adjustments $1,571 $11,821 $12,058 $11,522 $19,195

Steve Filipov, CEO Manitex International 708-237-2054 Peter Seltzberg, IR Darrow Associates, Inc. 516-419-9915 MANITEX INTERNATIONAL, INC. NASDAQ: MNTX Fourth Quarter Earnings Conference Call March 2020
