Attached files
| file | filename |
|---|---|
| EX-99.1 - EXHIBIT 99.1 - International Money Express, Inc. | ex99_1.htm |
| 8-K - 8-K - International Money Express, Inc. | form8k.htm |
Exhibit 99.2

Fourth Quarter and Full Year 2019 Earnings Presentation March 2020 Exhibit 99.2

This presentation contains “forward-looking statements” within the meaning of Section 27A of the Securities Act of 1933, as amended,
and Section 21E of the Securities Exchange Act of 1934, as amended, which reflect our current view with respect to certain events that could have an effect on our future financial performance. These statements relate to expectations
concerning matters that are not historical fact and may include the words or phrases such as “will,” “should,” “expects,” “believes,” “anticipates,” “plans,” “intends,” “estimates,” “approximately,” “our planning assumptions,” “future
outlook,” and similar expressions. Except for historical information, matters discussed in such statements are forward-looking statements. All of these forward-looking statements are based largely on information currently available to our
management and on our current expectations, assumptions, estimates, judgments and projections about our business and our industry, and are subject to various risks and uncertainties that could cause actual results to differ materially from
historical results or those currently anticipated. While we believe these expectations, assumptions, estimates, judgments and projections are reasonable, such forward-looking statements are only predictions and involve known and unknown risks
and uncertainties, many of which are beyond our control. These and other important factors may cause our actual results, performance or achievements to differ materially from any future results, performance or achievements expressed or
implied by these forward-looking statements, or could affect our share price. Accordingly, there is no assurance that our expectations will, in fact, occur or that our estimates or assumptions will be correct, and we caution investors and all
others not to place undue reliance on such forward-looking statements. Some of the factors that could cause actual results to differ materially from those expressed or implied by the forward-looking statements include among other things,
competition in the markets in which we operate; our ability to maintain agent relationships on terms consistent with those currently in place; our ability to maintain banking relationships necessary for us to conduct our business; credit
risks from our agents and the financial institutions with which we do business; bank failures, sustained financial market illiquidity, or illiquidity at our clearing, cash management or custodial financial institutions; new technology or
competitors that disrupt the current ecosystem; cyber-attacks or disruptions to our information technology, computer network systems and data centers; our success in developing and introducing new products, services and infrastructure;
customer confidence in our brand and in consumer money transfers generally; our ability to maintain compliance with the regulatory requirements of the jurisdictions in which we operate or plan to operate; international political factors or
implementation of tariffs, border taxes or restrictions on remittances or transfers of money out of the United States; changes in tax laws and unfavorable outcomes of tax positions we take; political instability, currency restrictions and
devaluation in countries in which we operate or plan to operate; weakness in U.S. or international economic conditions; change or disruption in international migration patterns; our ability to protect our brand and intellectual property
rights; our ability to retain key personnel; and other factors described in the “Risk Factors” section in periodic reports we file with the Securities and Exchange Commission and our prospectus supplement, dated September 11, 2019, files
pursuant to Rule 424(b)(4). All statements other than statements of historical fact included in this press release are forward-looking statements including, but not limited to, expected financial outlook for the year 2020 and all
forward-looking statements that are made or attributable to us are expressly qualified in their entirety by this cautionary notice. Any forward-looking statement that we make in this presentation speaks only as of the date of this
presentation. We undertake no obligation to update or revise, or to publicly announce any update or revision to, any of the forward-looking statements made herein, whether as a result of new information, future events or otherwise except as
required by law.This presentation includes certain non-GAAP financial measures, including Adjusted Net Income, Adjusted EBITDA, Adjusted EBITDA growth, Adjusted EBITDA margin, Adjusted Earnings per Share and Free Cash Generated. These
non-GAAP financial measures should be considered only as supplemental to, and not as superior to, financial measures prepared in accordance with U.S. GAAP. Please refer to Slides 16, 17 and 18 of this presentation for a reconciliation of Net
Income to Adjusted Net Income and Adjusted EBITDA, Net income per share to Adjusted Earnings per Share, and Net Income to Net Free Cash. Adjusted Net Income is defined as net income adjusted to add back certain charges and expenses, such as
transaction costs, non-cash amortization resulting from push-down accounting, and non-cash compensation costs, as these charges and expenses are not considered a part of our core business operations and are not an indicator of ongoing, future
company performance. Adjusted EBITDA is defined as net income before depreciation and amortization, interest expense, income taxes, and also adjusted to add back certain charges and expenses, such as transaction costs and non-cash
compensation costs, as these charges and expenses are not considered a part of our core business operations and are not an indicator of ongoing, future company performance. Free Cash Generated is defined as net income before provision for bad
debt and depreciation and amortization adjusted to add back certain charges and expenses, such as and non-cash compensation costs, as these charges and expenses are not considered a part of our core business operations as well as reduced by
the cash used in investing activities and servicing of our debt obligations.A quantitative reconciliation of projected 2020 Adjusted EBITDA to the most comparable GAAP measure is not available without unreasonable efforts because of the
inherent difficulty in forecasting and qualifying the amounts necessary under GAAP guidance for one-time, non-recurring items including, without limitation, costs related to acquisitions and the registration of the Company’s securities, and
losses related to legal contingencies or disposal of assets. Safe Harbor Statement / Non-GAAP Financial Measures

Driving Core GrowthMore U.S. zip codes we want to be in than those where we currently operateGrowth in secondary and tertiary
marketsExpanding Depth of Service Successful launch of Africa and Canada businessesWhite Label processing live with two partnersSolidifying Our Balance SheetFree Cash generation and debt capacity provides acquisitive firepowerStrengthening
Our Leadership TeamHired Joseph Aguilar as Chief Operating Officer in September 2019Hired Max Leiva as Chief Information Officer in January 2020Executing Key Efficiency InitiativesStrategic relationship with Ripple 2019 Strategic
Priorities and Business Updates

Adjusted Net Income and Adjusted EBITDA reflect add-backs for one-time, non-recurring items. Please see pages 16 and 17 for detail on
those adjustments and a reconciliation of Net Income to Adjusted Net Income and Adjusted EBITDA Review of Key Performance Indicators 4Q’19 vs 4Q’18 FY’19 vs FY’18 Revenue Growth 10.9% 16.7% Adj. EBITDA Growth(1) 22.6% 22.2% Net
Income $5.3M vs $4.9M $19.6M vs ($7.2M) Adj. Net Income(1) $7.6M vs $7.3M $32.6M vs $18.4M

Intermex Growth Story Money Transfer Transactions Volume (# In millions) ($ in millions) Adjusted EBITDA reflects add-backs for
one-time, non-recurring items. Please see page 17 for detail on adjustments to EBITDA and a reconciliation of Net Income to Adjusted EBITDA Revenue Adjusted EBITDA(1) ($ in millions) ($ in millions) 16.7% 10.9% 22.2% 22.6%
17.2% 12.1% 11.4% 15.7%

Mexico Industry Growth(1) Historical Industry Growth Trends Banco de Mexico and World Bank. Represents total remittance volume for
US dollars outbound to Mexico CAGR: 10.3% (Total Remittance Volume) Intermex Growth CAGR: 19.7% (Total Remittance Volume) Intermex has a strong ability to outpace industry growth, but it is not immune to overall industry trends CAGR:
3.3% CAGR: 26.0%

Highly Cash Generative Business Model Free Cash Generated(1) as a Percentage of Adjusted EBITDA(2) Free Cash Generated reflects Net
Income with certain adjustments. Please see page 18 for detail on adjustments to Net Income and a reconciliation of Net Income to Free Cash Generated.Adjusted EBITDA reflects add-backs for one-time, non-recurring items. Please see page 17 for
detail on adjustments to EBITDA and a reconciliation of Net Income to Adjusted EBITDA.

2014 2018 2019 14.0% 24.0%(3) 25.4%(3) All
Others 86.0% 76.0% 74.6% 2014 2018 2019 7.9% 17.4%(3) 18.0%(3) All Others 92.1% 82.7% 82.0% LAC Market Landscape Intermex enjoys a strong and growing position across key target markets Intermex Share of Key Target
Markets (2) LAC Countries - 2019 Mexico Market Share Breakdown Guatemala Market Share Breakdown World Bank (2019). Reflects US share of estimated LAC market size as of October 2019.Source: Banco de Guatemala and Banco de
Mexico Reflective of respective country central bank inflows from USA based on World Bank % Share originating from USA. Favorable, Fragmented Competitive
Landscape Country Size(US$B)1 Region MEX $34.8 38.5% GUA $9.5 10.5% DOM $4.7 5.1% COL $4.8 5.3% ELS $7.4 8.1% HON $7.0 7.8% PRU $3.3 3.6% ECU $3.2 3.5% HAI $3.3 3.6% BRA $3.2 3.5% JAM $2.6 2.8% NIC $1.7 1.8% BOL $1.3 1.4% OTHER $3.8 4.2% Total
Market Size:~$90 Billion (1)

Tier I and II Countries Remittance Volume Growth(1) Intermex Volume Growth All Others Volume Growth Intermex Market
Share Intermex outperforms market growth in its core markets of Mexico and Guatemala.A consistent and large portion of the growth in the Mexico market is captured by Intermex. Source: Banco de Guatemala, Banco Central de Honduras, Banco de
Mexico, Banco Central de Reserva de El Salvador – US originating Volume using based on latest 2019 results 76%24% 65%35% 62%38% 63%37% 61%39% 69%31% Market Share and Percent of Industry Growth

Adjusted EBITDA margin expanded 160bps YoY to 17.0%(1)Solidified salesforce in high priority expansion marketsGenerated $5.3M Net
Income, 9.8% increase YoY Adjusted EBITDA reflects add-backs for one-time, non-recurring items. Please see page 17 for detail on adjustments to EBITDA and a reconciliation of Net Income to Adjusted EBITDASource: Banco de Mexico, Banco de
Guatemala, World Bank US outbound volumes and Intermex company data Fourth Quarter 2019 Performance Highlights Revenue Remittance Volume Adj. EBITDA(1) Net Income $83.2M $2.6B $14.1M $5.3M +10.9% +11.4% +22.6% +9.8%
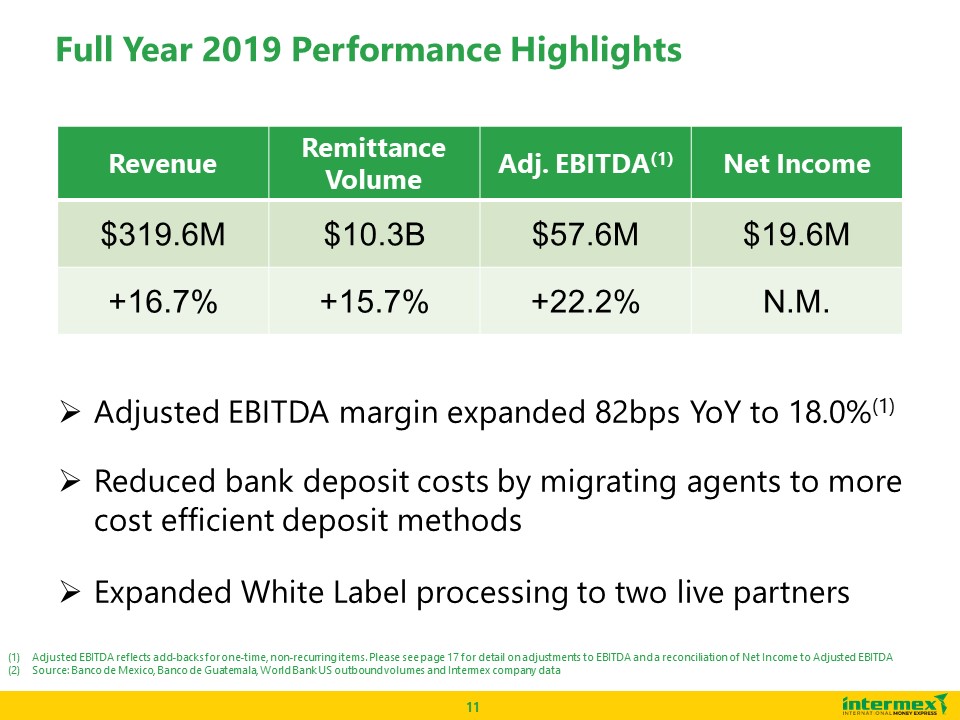
Adjusted EBITDA margin expanded 82bps YoY to 18.0%(1)Reduced bank deposit costs by migrating agents to more cost efficient deposit
methodsExpanded White Label processing to two live partners Adjusted EBITDA reflects add-backs for one-time, non-recurring items. Please see page 17 for detail on adjustments to EBITDA and a reconciliation of Net Income to Adjusted
EBITDASource: Banco de Mexico, Banco de Guatemala, World Bank US outbound volumes and Intermex company data Full Year 2019 Performance Highlights Revenue Remittance Volume Adj. EBITDA(1) Net
Income $319.6M $10.3B $57.6M $19.6M +16.7% +15.7% +22.2% N.M.
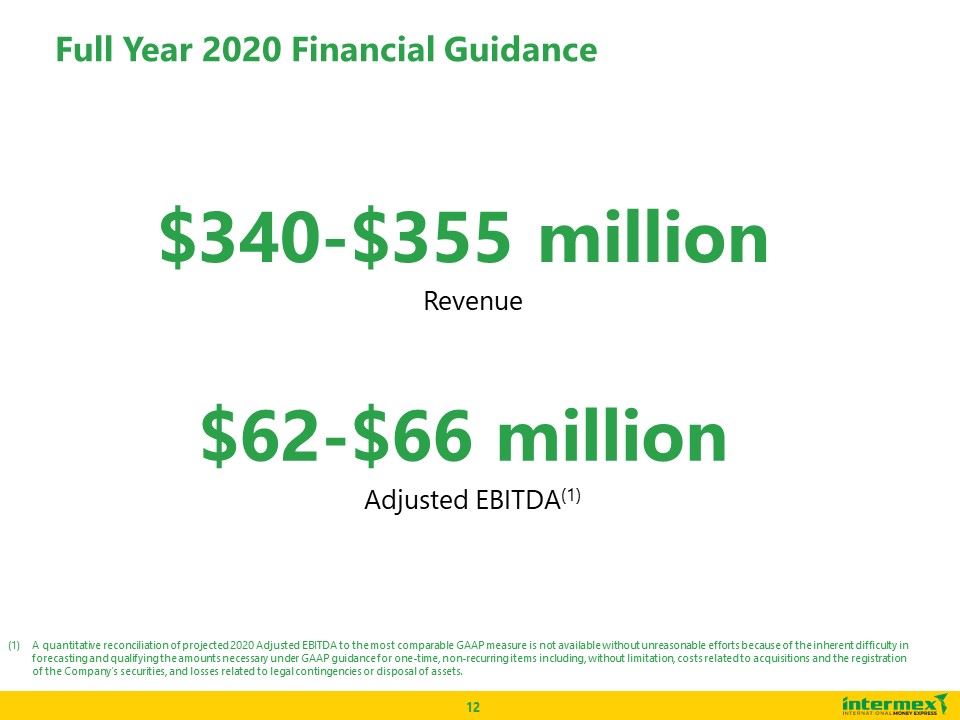
A quantitative reconciliation of projected 2020 Adjusted EBITDA to the most comparable GAAP measure is not available without
unreasonable efforts because of the inherent difficulty in forecasting and qualifying the amounts necessary under GAAP guidance for one-time, non-recurring items including, without limitation, costs related to acquisitions and the
registration of the Company’s securities, and losses related to legal contingencies or disposal of assets. $340-$355 million Revenue $62-$66 million Adjusted EBITDA(1) Full Year 2020 Financial Guidance

Appendix

Consolidated Balance Sheets
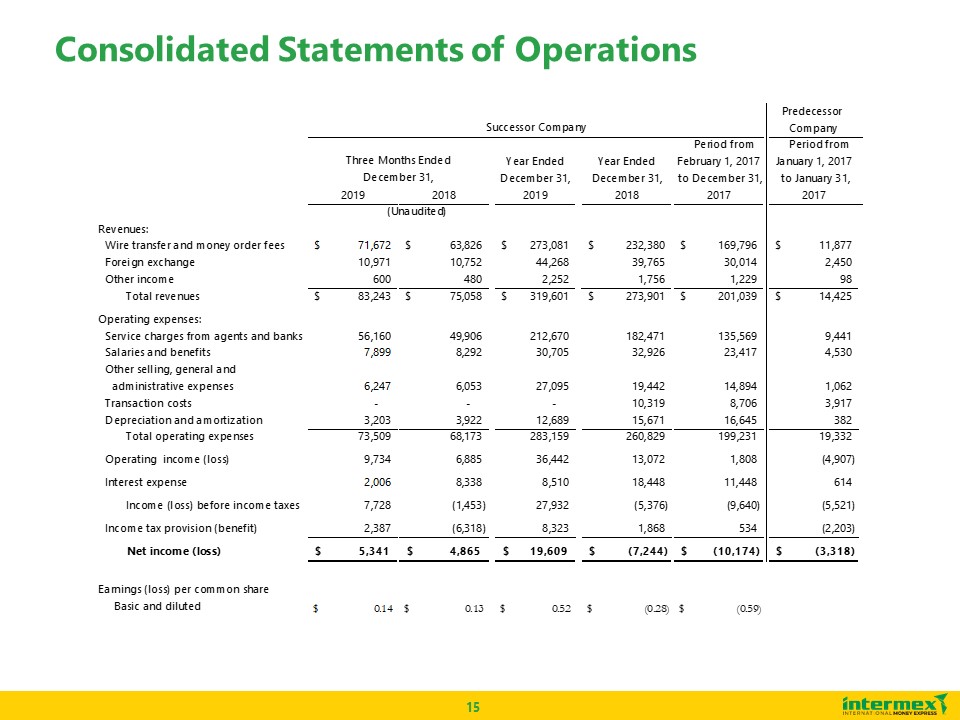
Consolidated Statements of Operations

Net Income (Loss) to Adj. Net Income Reconciliation
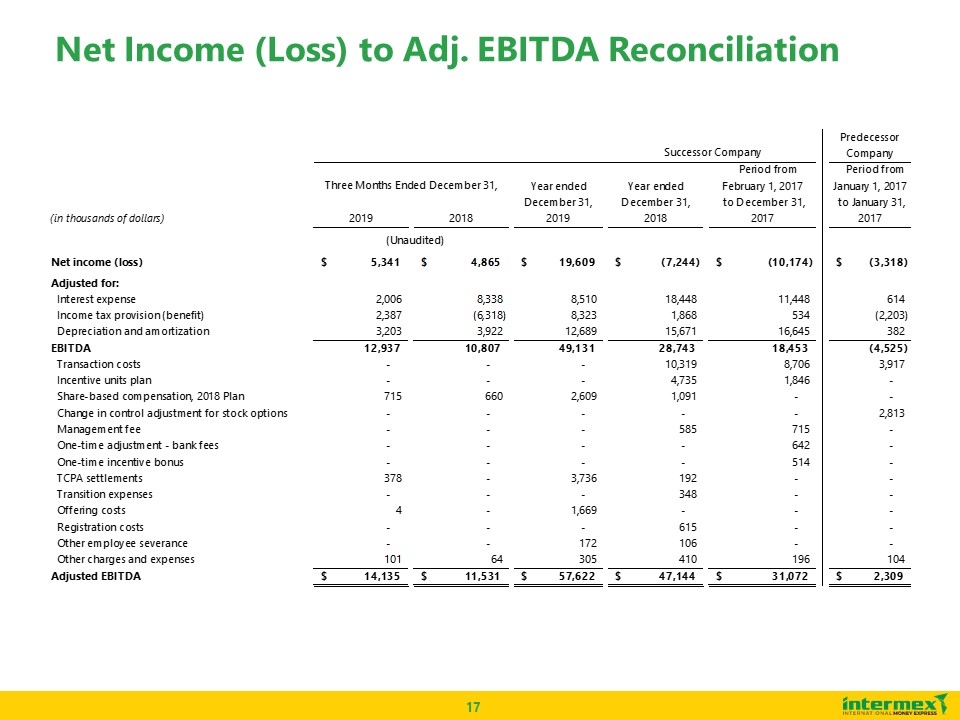
Net Income (Loss) to Adj. EBITDA Reconciliation

Net Income to Net Free Cash Generated Reconciliation