Attached files
| file | filename |
|---|---|
| EX-99.1 - EX-99.1 - OptiNose, Inc. | a12-31x19earningsrelea.htm |
| 8-K - 8-K - OptiNose, Inc. | a8-k12x31x19earningsre.htm |

Exhibit 99.2 Building a Leading ENT / Allergy Specialty Company Corporate Presentation March 5, 2020
Forward-Looking Statements This presentation and our accompanying remarks contain “forward-looking statements” within the meaning of the U.S. Private Securities Litigation Reform Act of 1995. All statements that are not historical facts are hereby identified as forward-looking statements for this purpose and include, among others, statements relating to: potential for continued XHANCE growth, potential growth drivers and market opportunity; prescription, refill and market share trends; potential effects of INS market seasonality on XHANCE prescriptions; early year effects on net revenue and prescriptions related to patient insurance; projected Company GAAP operating expenses and stock-based compensation for 2020; projected XHANCE net revenues for full year and first quarter 2020; projected XHANCE net revenue per prescription for the first quarter and the remainder of 2020; expected XHANCE market share growth in 2020; the Company's plans to seek approval for a follow-on indication for XHANCE for the treatment of chronic sinusitis and the potential benefits of such indication; the expectation of top line results from both chronic sinusitis trials in second half 2021; corporate guidance; and other statements regarding the Company’s future operations, financial performance, prospects, intentions, objectives and other future events. Forward-looking statements are based upon management’s current expectations and assumptions and are subject to a number of risks, uncertainties and other factors that could cause actual results and events to differ materially and adversely from those indicated by such forward-looking statements including, among others: physician and patient acceptance of XHANCE; the Company’s ability to maintain adequate third party reimbursement for XHANCE (market access); the Company’s ability to grow XHANCE prescriptions and net revenues; market opportunities for XHANCE may be smaller than expected; uncertainties and delays relating to the initiation, enrollment, completion and results of clinical trials; unexpected costs and expenses; the Company’s ability to satisfy the conditions for additional draws under the Pharmakon note purchase agreement and its ability to comply with the covenants and other terms of the agreement; risks and uncertainties relating to intellectual property; and the risks, uncertainties and other factors discussed in the “Risk Factors” section and elsewhere in our most recent Form 10-K and Form 10-Q filings with the Securities and Exchange Commission – which are available at http://www.sec.gov. As a result, you are cautioned not to place undue reliance on any forward-looking statements. Any forward-looking statements made in this presentation speak only as of the date of this presentation, and we undertake no obligation to update such forward-looking statements, whether as a result of new information, future developments or otherwise. 2

Key Takeaways and Q4 2019 Highlights Commercial Strategy Driving Strong XHANCE Growth Substantial Growth Opportunity Remains for XHANCE Strong Balance Sheet - Pharmakon Provides Access to Additional Cash Full Year 2019 Performance Aligned with Company Guidance Providing Initial Company Guidance for Q1 and Full Year 2020 +26% $204 Up to +26% XHANCE Net XHANCE Net XHANCE TRx Revenue Revenue per TRx Growth Q4/Q3 Growth Q4/Q3 in Q4 2019 $70M $147M Incremental cash Cash and equivalents available from as of December 31, Pharmakon through 2019 early 2021 3
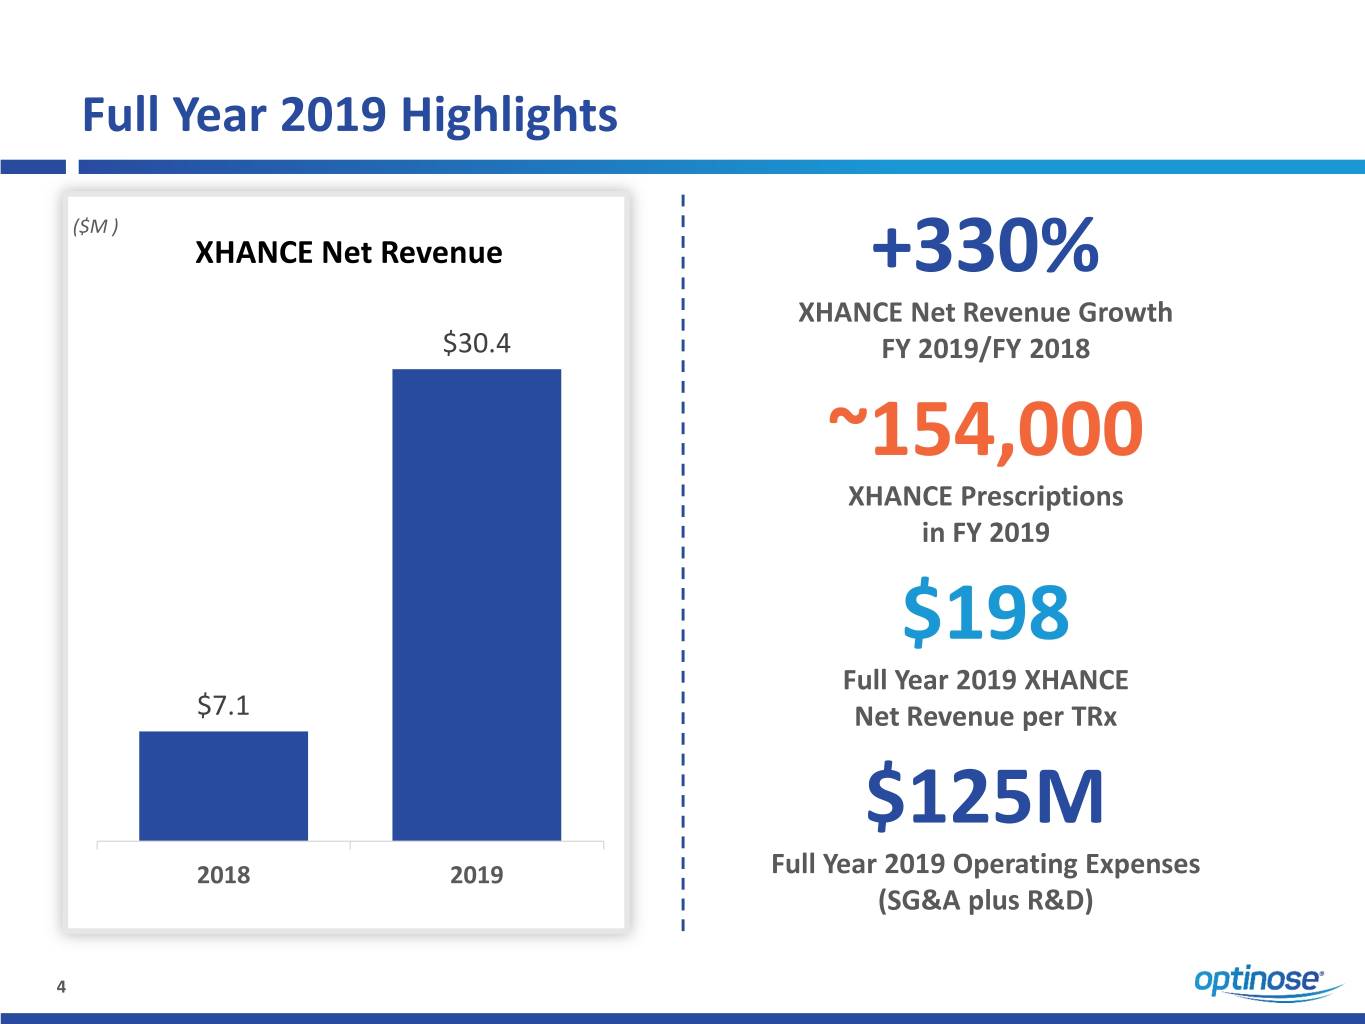
Full Year 2019 Highlights ($M ) XHANCE Net Revenue +330% XHANCE Net Revenue Growth $30.4 FY 2019/FY 2018 ~154,000 XHANCE Prescriptions in FY 2019 $198 Full Year 2019 XHANCE $7.1 Net Revenue per TRx $125M 2018 2019 Full Year 2019 Operating Expenses (SG&A plus R&D) 4

XHANCE Launch Update

XHANCE New Prescription Trends New prescriptions of XHANCE increased 19% in Q4 2019 compared to Q3 2019 XHANCE NRx (in thousands) +19% 25.0 +14% 21.2 20.0 +22% 17.8 +44% 15.6 15.0 12.7 10.0 8.8 5.0 0.0 Q4 '18 Q1 '19 Q2 '19 Q3 '19 Q4 '19 6 Estimated based on monthly prescription data from public source and XHANCE preferred pharmacy network.
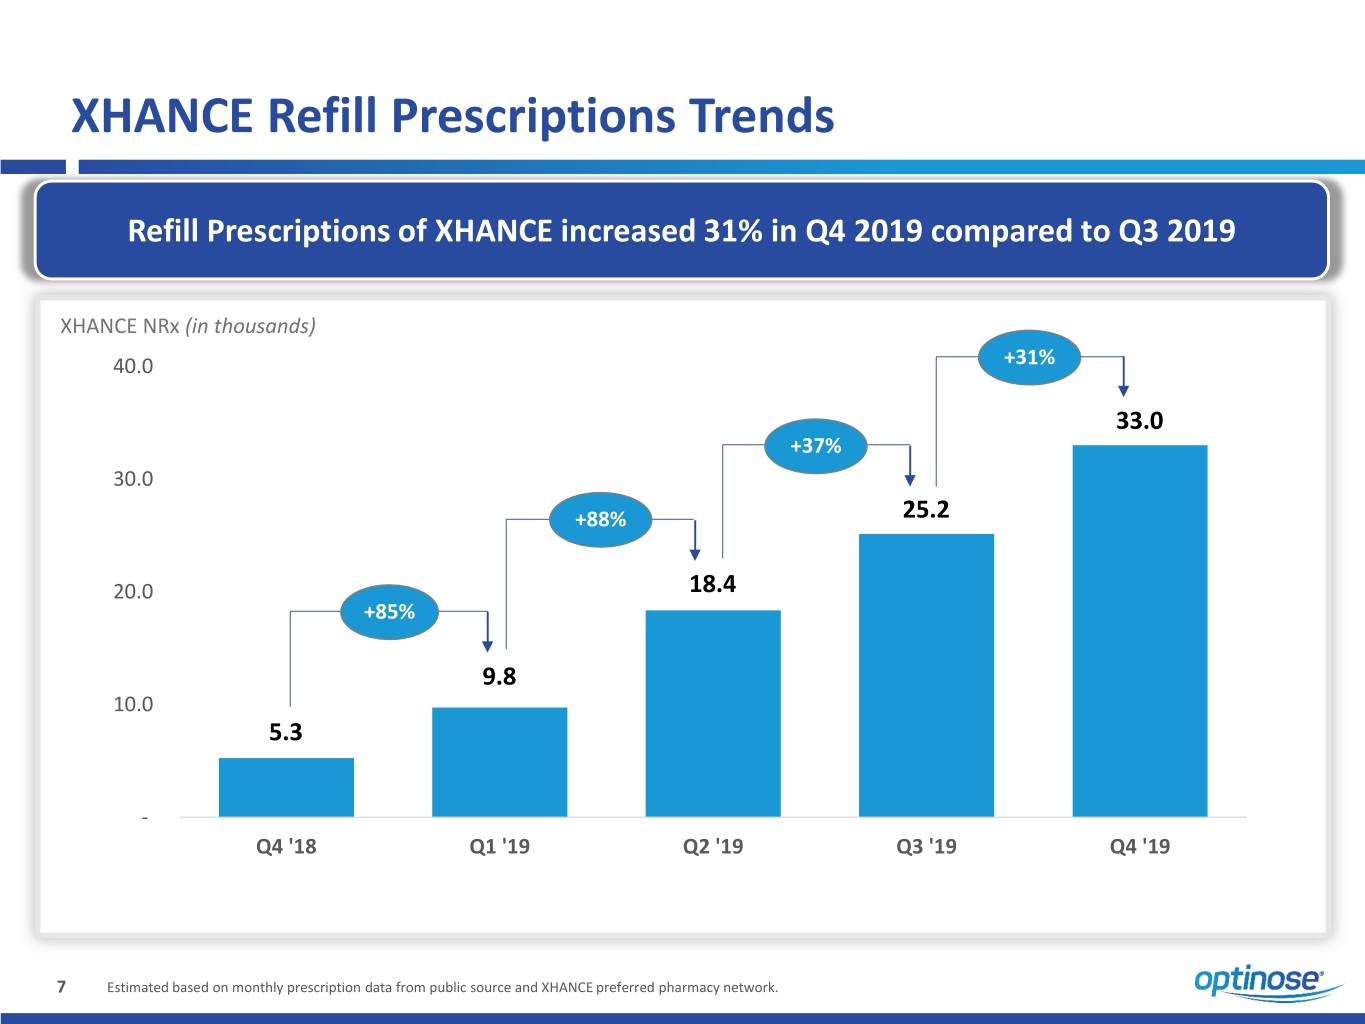
XHANCE Refill Prescriptions Trends Refill Prescriptions of XHANCE increased 31% in Q4 2019 compared to Q3 2019 XHANCE NRx (in thousands) 40.0 +31% 33.0 +37% 30.0 +88% 25.2 20.0 18.4 +85% 9.8 10.0 5.3 - Q4 '18 Q1 '19 Q2 '19 Q3 '19 Q4 '19 7 Estimated based on monthly prescription data from public source and XHANCE preferred pharmacy network.

XHANCE Prescription Trends Strong growth in both new prescriptions and refills drove XHANCE quarterly prescription growth of 26% in Q4 2019 XHANCE Prescriptions (in thousands) +26% 60.000 +27% 54.3 50.000 +51% 43.0 40.000 33.9 33.0 +59% 30.000 25.2 22.5 18.4 20.000 14.1 9.8 5.3 21.2 10.000 17.8 12.7 15.6 8.8 0.000 Q4 '18 Q1 '19 Q2 '19 Q3 '19 Q4 '19 New Prescriptions Refills TRx for Intranasal Steroids Market increased 3% from Q4 2018 to Q1 2019, increased 1% from Q1 to Q2 2019, decreased 11% from Q2 to Q3 2019, and increased 9% from Q3 to Q4 2019 8 Estimated based on monthly prescription data from public source and XHANCE preferred pharmacy network.

XHANCE Share of INS Prescriptions Within the Target Physician Audience is Growing and the Remaining Opportunity is Large Market share within the XHANCE target physician audience increased consistently in 2019 and we believe share will continue to increase in 2020 XHANCE Share of INS TRx Within Target Physician Audience 4.5% 3.5% 4.0% 3.5% 3.0% 3.0% 2.5% 2.2% 2.0% 1.5% 1.5% 0.9% 1.0% 0.5% 0.0% Q4 ‘18 Q1 ‘19 Q2 ‘19 Q3 ‘19 Q4 ‘19 The Market on this slide is defined as the sum of all intranasal steroid prescriptions written by physicians in the XHANCE target physician audience. Estimated based on monthly prescription data from public source and XHANCE preferred pharmacy network. 9
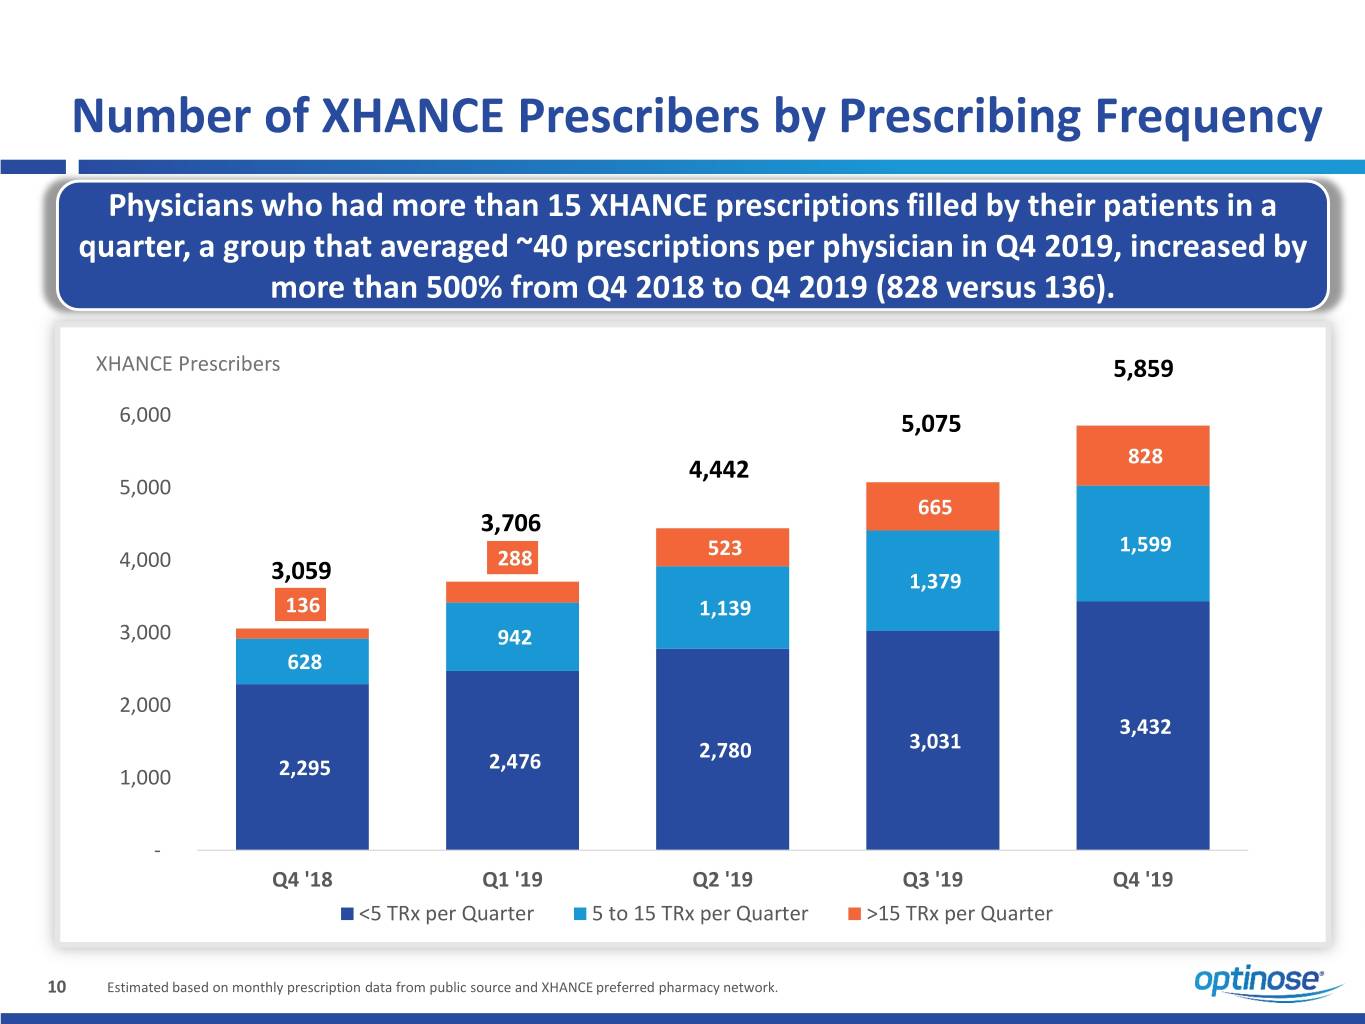
Number of XHANCE Prescribers by Prescribing Frequency Physicians who had more than 15 XHANCE prescriptions filled by their patients in a quarter, a group that averaged ~40 prescriptions per physician in Q4 2019, increased by more than 500% from Q4 2018 to Q4 2019 (828 versus 136). XHANCE Prescribers 5,859 6,000 5,075 828 4,442 5,000 665 3,706 1,599 4,000 288 523 3,059 1,379 136 1,139 3,000 942 628 2,000 3,432 3,031 2,476 2,780 1,000 2,295 - Q4 '18 Q1 '19 Q2 '19 Q3 '19 Q4 '19 <5 TRx per Quarter 5 to 15 TRx per Quarter >15 TRx per Quarter 10 Estimated based on monthly prescription data from public source and XHANCE preferred pharmacy network.

Q4 2019 Financial Update

Financial Review – Fourth Quarter 2019 Q4 2019 XHANCE Net Revenue Increased 26% to $11.1 Million ($M ) XHANCE Net Revenue Average Net Revenue per TRx $30.4M $11.1 FY 2019 . Average XHANCE net revenue $8.7 of $204 per TRx in Q4 2019 – Increased from $202 in Q3 2019 $6.7 . Average XHANCE net revenue $4.0 of $198 per TRx for Full Year $3.0 2019 Q4 '18 Q1 '19 Q2 '19 Q3 '19 Q4 '19 12
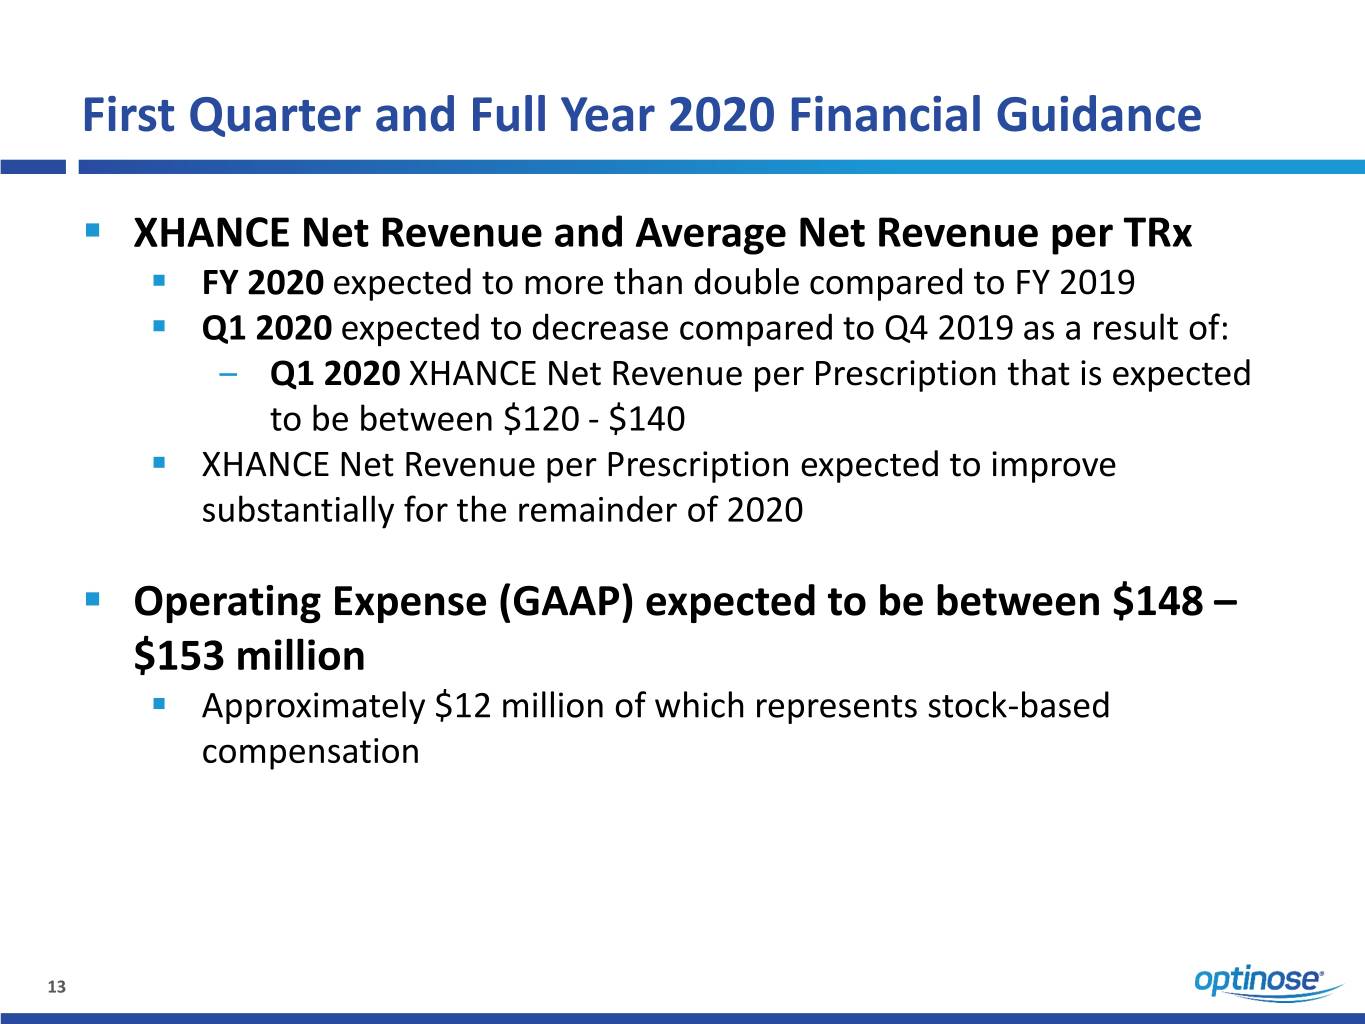
First Quarter and Full Year 2020 Financial Guidance . XHANCE Net Revenue and Average Net Revenue per TRx . FY 2020 expected to more than double compared to FY 2019 . Q1 2020 expected to decrease compared to Q4 2019 as a result of: ‒ Q1 2020 XHANCE Net Revenue per Prescription that is expected to be between $120 - $140 . XHANCE Net Revenue per Prescription expected to improve substantially for the remainder of 2020 . Operating Expense (GAAP) expected to be between $148 – $153 million . Approximately $12 million of which represents stock-based compensation 13

Pipeline Update
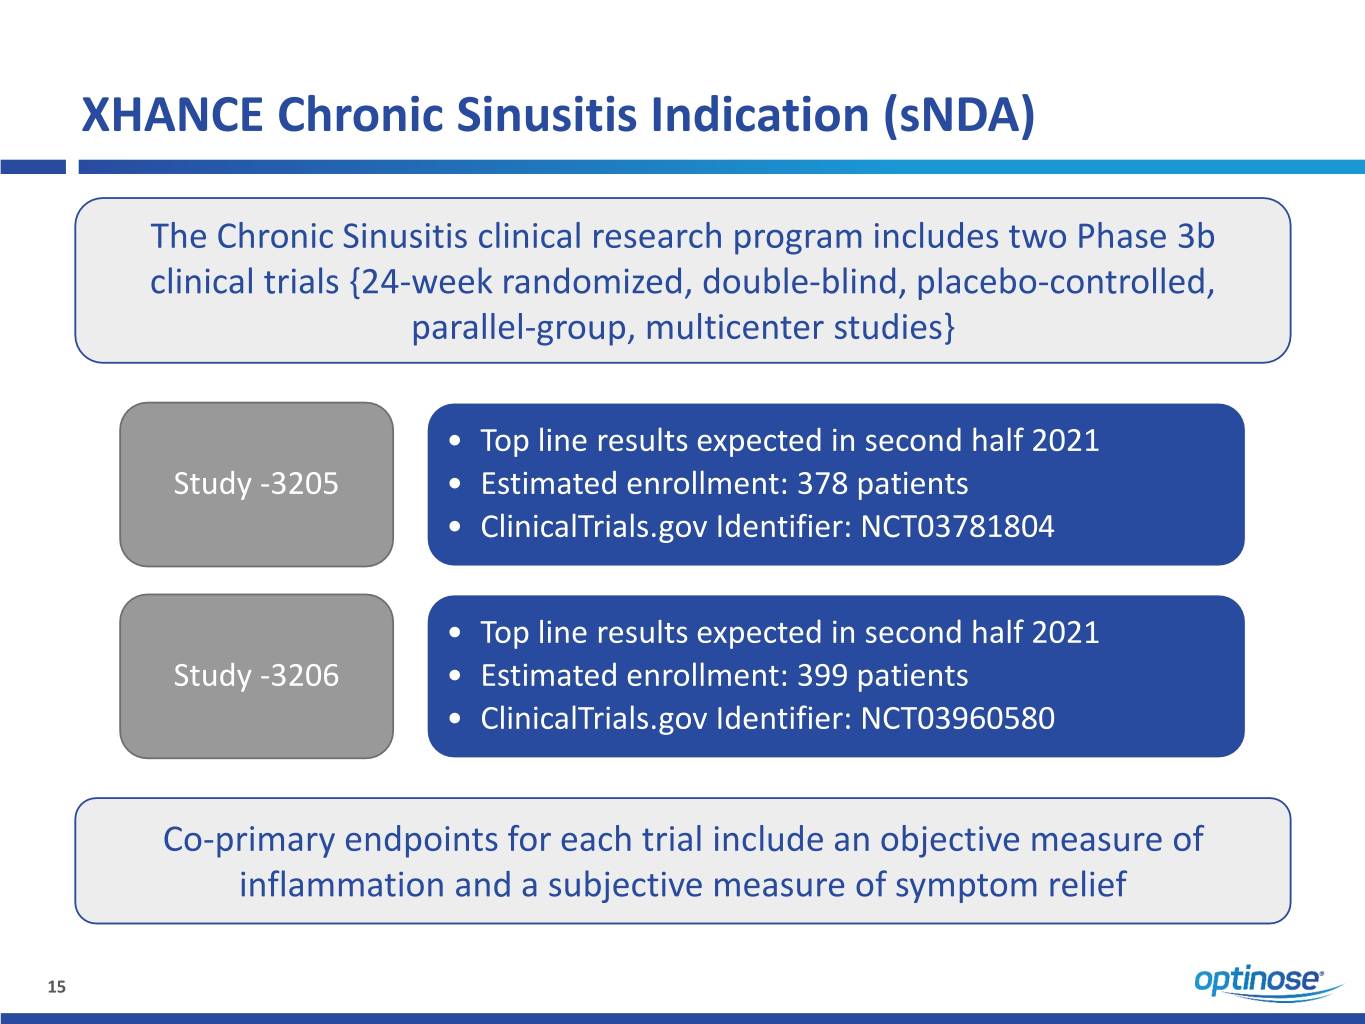
XHANCE Chronic Sinusitis Indication (sNDA) The Chronic Sinusitis clinical research program includes two Phase 3b clinical trials {24-week randomized, double-blind, placebo-controlled, parallel-group, multicenter studies} • Top line results expected in second half 2021 Study -3205 • Estimated enrollment: 378 patients • ClinicalTrials.gov Identifier: NCT03781804 • Top line results expected in second half 2021 Study -3206 • Estimated enrollment: 399 patients • ClinicalTrials.gov Identifier: NCT03960580 Co-primary endpoints for each trial include an objective measure of inflammation and a subjective measure of symptom relief 15

Closing Remarks
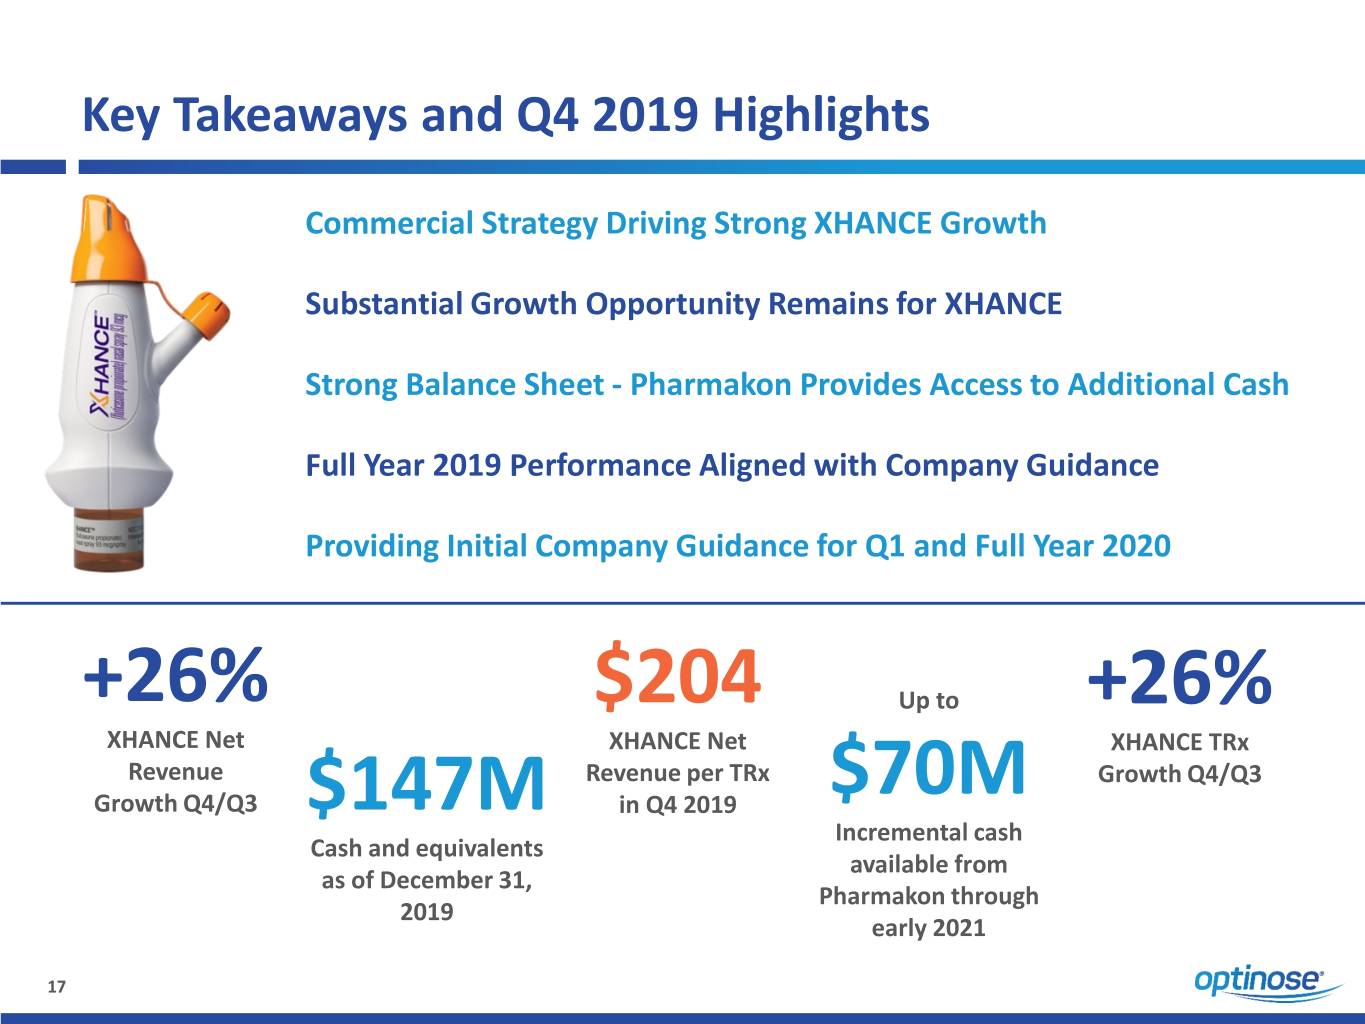
Key Takeaways and Q4 2019 Highlights Commercial Strategy Driving Strong XHANCE Growth Substantial Growth Opportunity Remains for XHANCE Strong Balance Sheet - Pharmakon Provides Access to Additional Cash Full Year 2019 Performance Aligned with Company Guidance Providing Initial Company Guidance for Q1 and Full Year 2020 +26% $204 Up to +26% XHANCE Net XHANCE Net XHANCE TRx Revenue Revenue per TRx Growth Q4/Q3 Growth Q4/Q3 in Q4 2019 $70M $147M Incremental cash Cash and equivalents available from as of December 31, Pharmakon through 2019 early 2021 17

Investor Relations – NASDAQ: OPTN At 31 December 2019: Analyst Coverage 1 – $147 million in cash – Long-term debt: $80 million BMO: Gary Nachman – 45.9 million common shares o/s – 10.1 million options & warrants o/s Cantor Fitzgerald: Brandon Folkes Cowen: Ken Cacciatore Optinose Investor Contact Jefferies: David Steinberg Jonathan Neely, VP, Investor Relations and Business Operations 267-521-0531 Piper Sandler: David Amsellem RBC: Randall Stanicky investors@optinose.com www.optinose.com @optinose 1 - Optinose is followed by the analysts listed above. Please note that any opinions, estimates or forecasts regarding the Company’s performance made by these analysts are theirs alone and do not represent opinions, forecasts or predictions of Optinose or its management. Optinose does not by its reference above or distribution imply its endorsement of or concurrence with such information, conclusions or recommendations. 18

Building a Leading ENT / Allergy Specialty Company Corporate Presentation March 5, 2020
