Attached files
| file | filename |
|---|---|
| EX-99.4 - EXHIBIT 99.4 - PHOTRONICS INC | ex99_4.htm |
| EX-99.3 - EXHIBIT 99.3 - PHOTRONICS INC | ex99_3.htm |
| EX-99.2 - EXHIBIT 99.2 - PHOTRONICS INC | ex99_2.htm |
| EX-99.1 - EXHIBIT 99.1 - PHOTRONICS INC | ex99_1.htm |
| 8-K - 8-K - PHOTRONICS INC | form8k.htm |
Exhibit 99.5

Photronics, Inc. Q1 2020 Financial Results Conference CallMarch 4, 2020

Safe Harbor Statement 2 This presentation and some of our comments may contain projections or other
forward-looking statements regarding future events, our future financial performance, and/or the future performance of the industry. These statements are predictions, and contain risks and uncertainties. Actual events or results may differ
materially from those presented. These statements include words like “anticipate”, “believe”, “estimate”, “expect”, “forecast”, “may”, “plan”, “project”, “in our view” or the negative thereto. We cannot guarantee the accuracy of any forecasts
or estimates, and we are not obligated to update any forward-looking statements if our expectations change. If you would like more information on the risks involved in forward-looking statements, please see the documents we file from time to
time with the Securities and Exchange Commission.

Photronics Investor DayFriday, May 29, 2020New York Hilton Midtown ManhattanNew York CityDetails to
follow. Contact Troy Dewar (tdewar@photronics.com) with questions. Save the Date

Record revenue of $159.7M, up 2% Q/Q and 28% Y/YRecord FPD revenue driven by mobile displays and Hefei
production rampIC revenue up Y/Y as design activity remains strong; seasonal softness in memory Q/QRecord revenue of products shipped to China, up 13% Q/Q; represents 37% of total revenueNet income attributable to Photronics, Inc.
shareholders of $10.3M ($0.16/share)Cash balance grew to $218M; $31M operating cash generationRepurchased 0.9M shares for $11MChina production contributed $20M to revenue; Hefei facility generated operating profit and positive operating cash
flowPotential impact in Q2 due to coronavirus Q1 2020 Summary 4 Successfully repositioned the business; China investments driving long-term, profitable growth

$M (except EPS) Q120 Q419 Q/Q Q119 Y/Y Revenue $ 159.7 $ 156.3 2% $ 124.7 28% Gross
Profit $ 34.6 $ 38.2 (9%) $ 26.1 33% Gross Margin 21.7% 24.4% (270 bps) 20.9% 80 bps Operating Income $ 16.3 $ 21.5 (24%) $ 8.0 103% Operating Margin 10.2% 13.7% (350 bps) 6.5% 370 bps Other income (expense) $ 3.7 ($
6.1) $ 9.8 $ 1.1 $ 2.6 Income tax provision $ 9.1 $ 2.3 $ 6.7 $ 1.4 $ 7.7 Minority interest $ 0.6 $ 3.3 ($ 2.7) $ 2.5 ($ 1.9) Net Income* $ 10.3 $ 9.7 6% $ 5.3 96% Diluted EPS* $ 0.16 $ 0.15 $ 0.01 $ 0.08 $
0.08 Days in quarter 94 95 (1) 88 6 Gross and operating margin negatively affected by higher ramp and compensation expenseChina operations were $2.9M negative impact to operating income; Hefei facility achieved operating profitOther
income includes FX gain and higher China interest expenseMinority interest reflects Taiwan JV gain offset by China JV loss Income Statement Summary 5 *Net income attributable to Photronics, Inc. shareholders
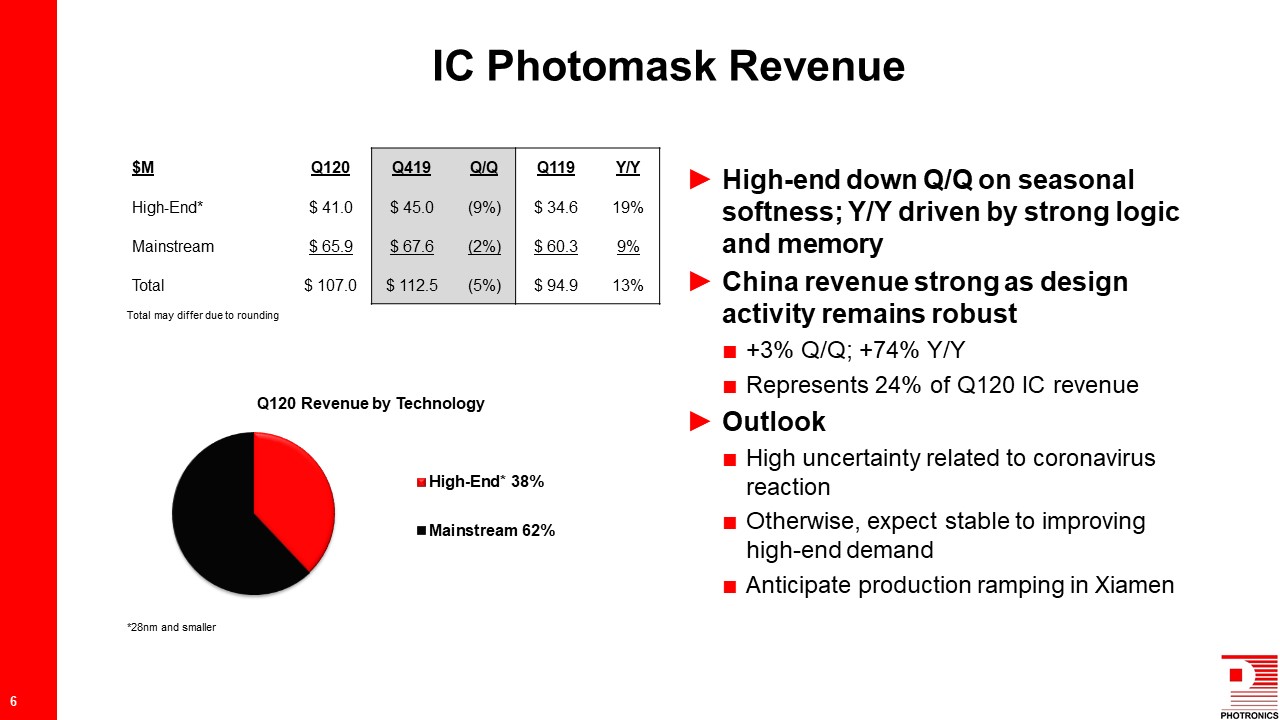
High-end down Q/Q on seasonal softness; Y/Y driven by strong logic and memoryChina revenue strong as
design activity remains robust+3% Q/Q; +74% Y/YRepresents 24% of Q120 IC revenueOutlookHigh uncertainty related to coronavirus reactionOtherwise, expect stable to improving high-end demandAnticipate production ramping in
Xiamen $M Q120 Q419 Q/Q Q119 Y/Y High-End* $ 41.0 $ 45.0 (9%) $ 34.6 19% Mainstream $ 65.9 $ 67.6 (2%) $ 60.3 9% Total $ 107.0 $ 112.5 (5%) $ 94.9 13% IC Photomask Revenue 6 *28nm and smaller Total may differ due
to rounding

Record FPD revenue driven by mobile displays and China production ramp, including G10.5+China revenue
+22% Q/Q; +154% Y/YRepresents 62% of Q120 FPD revenueOutlookHigh uncertainty related to coronavirus reactionMobile display demand expected to remain highProduction should remain at capacity $M Q120 Q419 Q/Q Q119 Y/Y High-End* $
39.8 $ 25.4 56% $ 15.4 159% Mainstream $ 13.0 $ 18.3 (29%) $ 14.5 (10%) Total $ 52.8 $ 43.7 21% $ 29.8 77% FPD Photomask Revenue 7 *≥G10.5, AMOLED and LTPS Total may differ due to rounding

Full-year 2018 Q119 Q219 Q319 Q419 Full-year 2019 High-End FPD 52,942 15,350 22,051
23,088 25,435 85,924 Mainstream FPD 66,270 14,482 10,942 14,839 18,283 58,546 Total FPD 119,212 29,832 32,993 37,927 43,718 144,470 To align with industry trends and reflect our new operating environment,
we redefined high-end FPD photomasksOld definition: AMOLED, G8.5 or greater (includes G10.5+)New definition: AMOLED, G10.5+ (G8.5 now mainstream), LTPSTable shows revenue splits per new definition New FPD High-End Definition 8

$M Q120 Q419 Q119 Cash $ 218 $ 207 $ 232 Debt $ 54 $ 53 $ 86 Net Cash* $ 164 $ 154 $
146 Operating Cash Flow $ 31 $ 45 ($ 19) Capital Expenditures $ 14 $ 18 $ 107 Government Incentives $ 2 $ 9 $ 5 Share repurchase $ 11 $ 11 $ 11 Debt is local China borrowing to finance fixed assetsFY 2020 capex ~ $100M
(includes 2019 carryover & $35M capital lease)Repurchased 0.9M shares for $11MBalance sheet able to fund planned investments, share repurchases, and strategic M&A opportunities Select Financial Data 9 *Net cash defined as cash and
cash equivalents less long-term borrowings (including current portion), as reported in accordance with GAAP
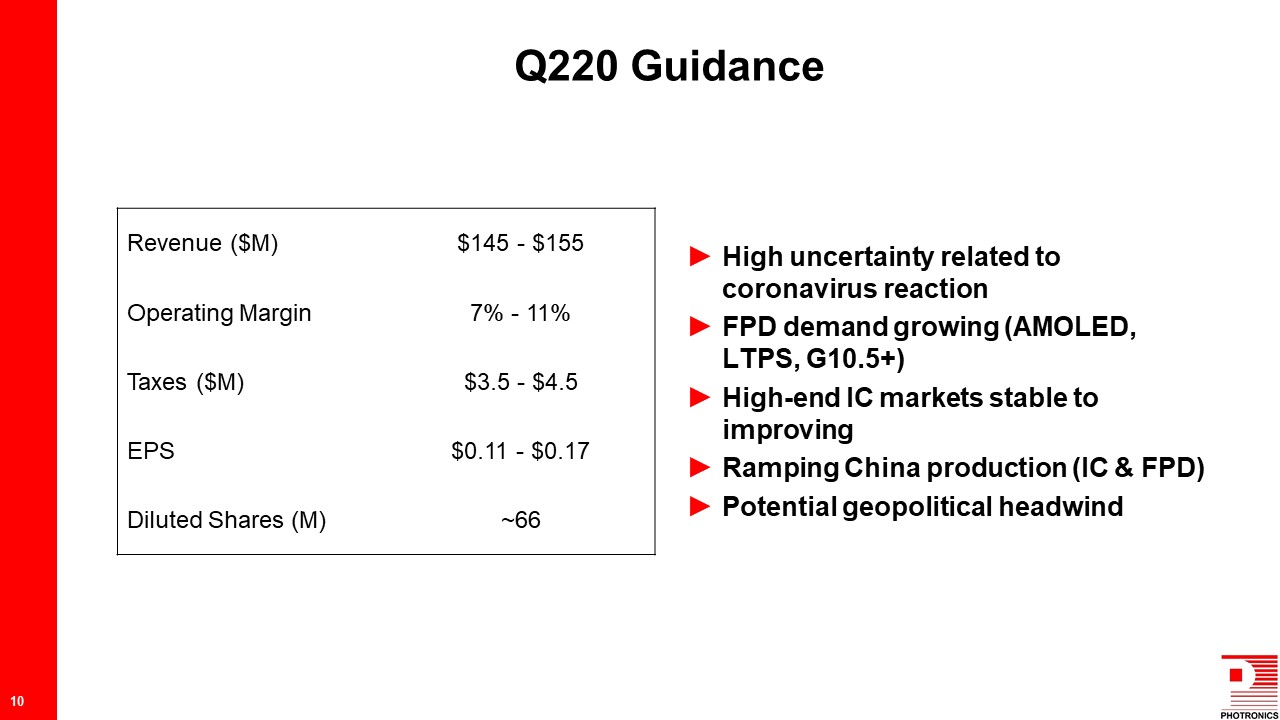
Revenue ($M) $145 - $155 Operating Margin 7% - 11% Taxes ($M) $3.5 - $4.5 EPS $0.11 -
$0.17 Diluted Shares (M) ~66 High uncertainty related to coronavirus reactionFPD demand growing (AMOLED, LTPS, G10.5+)High-end IC markets stable to improvingRamping China production (IC & FPD)Potential geopolitical headwind Q220
Guidance 10

Thank you for your interest! For Additional Information:R. Troy Dewar, CFAVice President, Investor
Relations203.740.5610tdewar@photronics.com

Appendix

Total Revenue 13 IC FPD
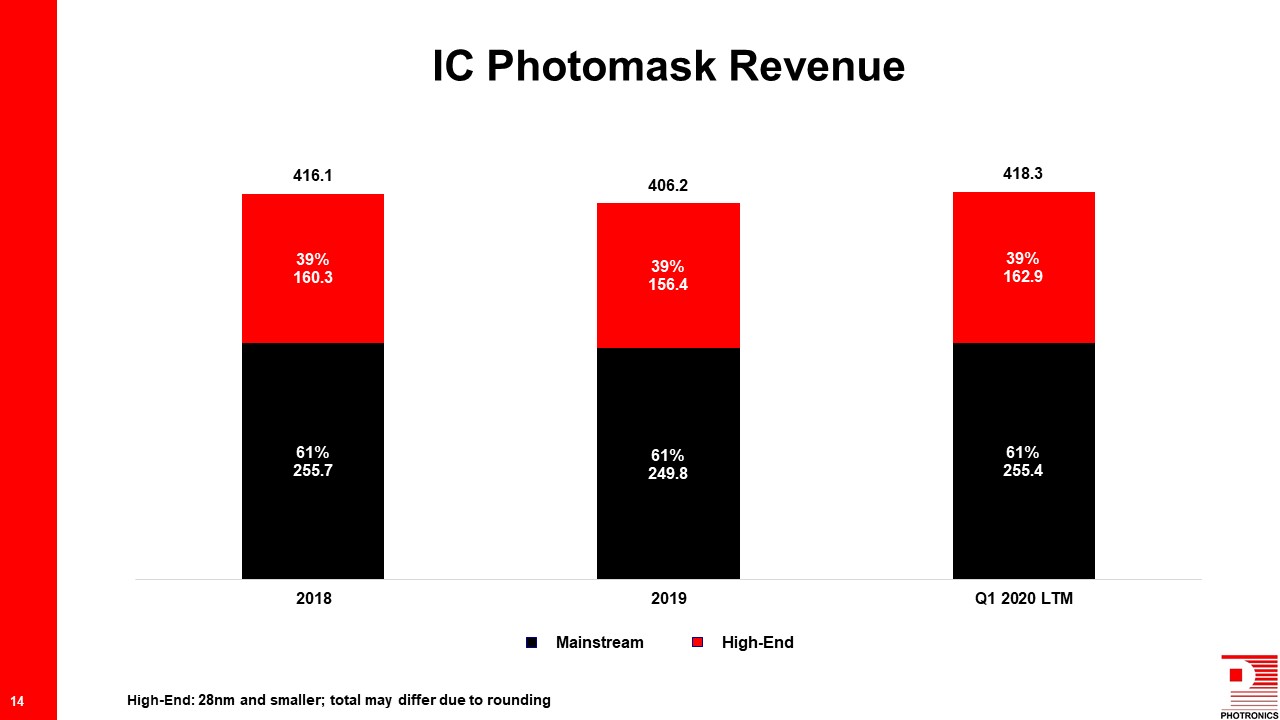
IC Photomask Revenue 14 Mainstream High-End High-End: 28nm and smaller; total may differ due to
rounding

FPD Photomask Revenue 15 Mainstream High-End High-End: ≥G10.5, AMOLED and LTPS; total may
differ due to rounding