Attached files
| file | filename |
|---|---|
| EX-99.3 - EX-99.3 - INDUS REALTY TRUST, INC. | ex-99d3.htm |
| EX-99.2 - EX-99.2 - INDUS REALTY TRUST, INC. | ex-99d2.htm |
| EX-99.1 - EX-99.1 - INDUS REALTY TRUST, INC. | ex-99d1.htm |
| EX-10.1 - EX-10.1 - INDUS REALTY TRUST, INC. | ex-10d1.htm |
| 8-K - 8-K - INDUS REALTY TRUST, INC. | f8-k.htm |
Exhibit 99.4
| INVESTOR UPDATE MARCH 2020 Exhibit 99.4 |
| 2 Forward-Looking Statements This presentation (the “Presentation”) by Griffin Industrial Realty, Inc. (“Griffin”) contains forward-looking statements within the meaning of Section 27A of the Securities Act of 1933, as amended, and Section 21E of the Exchange Act of 1934, as amended. For this purpose, any statements contained in this Presentation that relate to future events or conditions including, without limitation, the statements regarding site work for and construction of additional buildings, Griffin’s plan not to add to its office/flex portfolio, closing of land transactions currently under agreement, acquisition, sale, development, conversion, expansion and growth strategies, use of 1031 “Like-Kind Exchange” proceeds, plans for, and expected results of, Griffin’s development pipeline, estimated costs of developments under construction, growing cash flow and increasing stockholder value, approvals for future developments on Griffin’s land, expected property holdings, monetization of land holdings, changes in certain expenses, potential impact of increased interest rates on future borrowings, industry prospects, offerings that may be made pursuant to an “at-the-market” equity distribution program (“ATM”) and related impact and use of proceeds, equity issuance plans, Griffin’s anticipated conversion to a REIT and related access to capital markets, intended improvements on areas of concern or Griffin’s plans, intentions, expectations, or prospective results of operations, liquidity or financial position, may be deemed to be forward-looking statements. Without limiting the foregoing, the words “believes,” “anticipates,” “plans,” “expects,” “intends,” “seeks,” “potential” and similar expressions are intended to identify forward-looking statements. Such forward-looking statements represent management’s current expectations and are inherently uncertain. There are a number of important factors that could materially impact the value of Griffin’s common stock or cause actual results to differ materially from those indicated by such forward-looking statements. Such factors are described in Griffin’s Securities and Exchange Commission filings, including the “Business,” “Risk Factors,” “Management’s Discussion and Analysis of Financial Condition and Results of Operations” and “Forward-Looking Statements” sections in Griffin’s Annual Report on Form 10-K for the fiscal year ended November 30, 2019. Although Griffin believes that its plans, intentions and expectations reflected in such forward-looking statements are reasonable, it can give no assurance that such plans, intentions or expectations will be achieved. The projected information disclosed in this Presentation is based on assumptions and estimates that, while considered reasonable by Griffin as of the date hereof, are inherently subject to significant business, economic, competitive and regulatory uncertainties and contingencies, many of which are beyond the control of Griffin and which could cause actual results and events to differ materially from those expressed or implied in the forward-looking statements. Griffin disclaims any obligation to update any forward-looking statements in this Presentation as a result of developments occurring after the date of this Presentation except as required by law. |
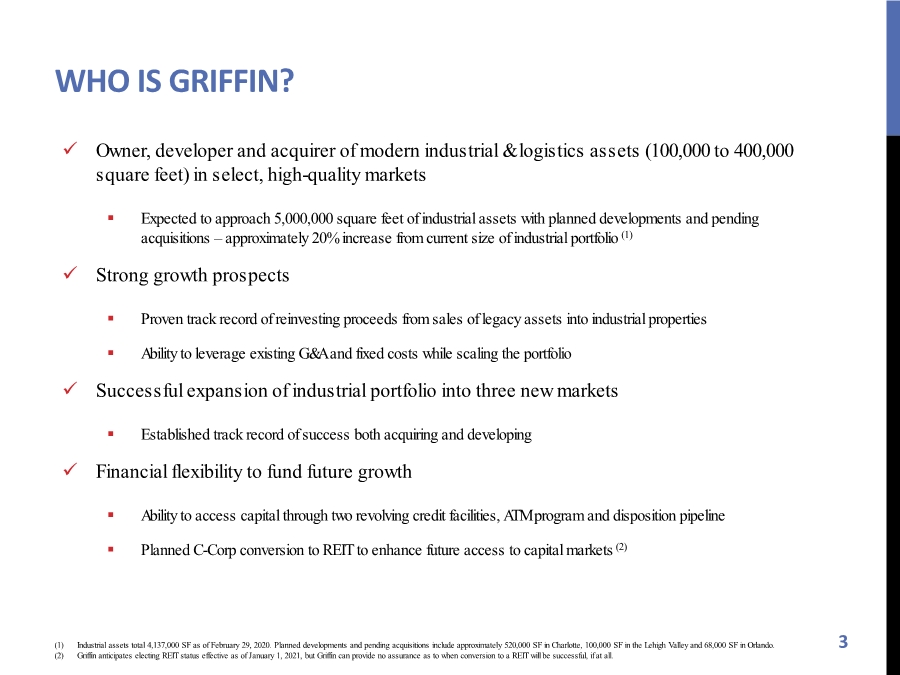
| WHO IS GRIFFIN? Owner, developer and acquirer of modern industrial & logistics assets (100,000 to 400,000 square feet) in select, high-quality markets . Expected to approach 5,000,000 square feet of industrial assets with planned developments and pending acquisitions – approximately 20% increase from current size of industrial portfolio (1) Strong growth prospects . Proven track record of reinvesting proceeds from sales of legacy assets into industrial properties . Ability to leverage existing G&A and fixed costs while scaling the portfolio Successful expansion of industrial portfolio into three new markets . Established track record of success both acquiring and developing Financial flexibility to fund future growth . Ability to access capital through two revolving credit facilities, ATM program and disposition pipeline . Planned C-Corp conversion to REIT to enhance future access to capital markets (2) 3 (1) Industrial assets total 4,137,000 SF as of February 29, 2020. Planned developments and pending acquisitions include approximately 520,000 SF in Charlotte, 100,000 SF in the Lehigh Valley and 68,000 SF in Orlando. (2) Griffin anticipates electing REIT status effective as of January 1, 2021, but Griffin can provide no assurance as to when conversion to a REIT will be successful, if at all. |
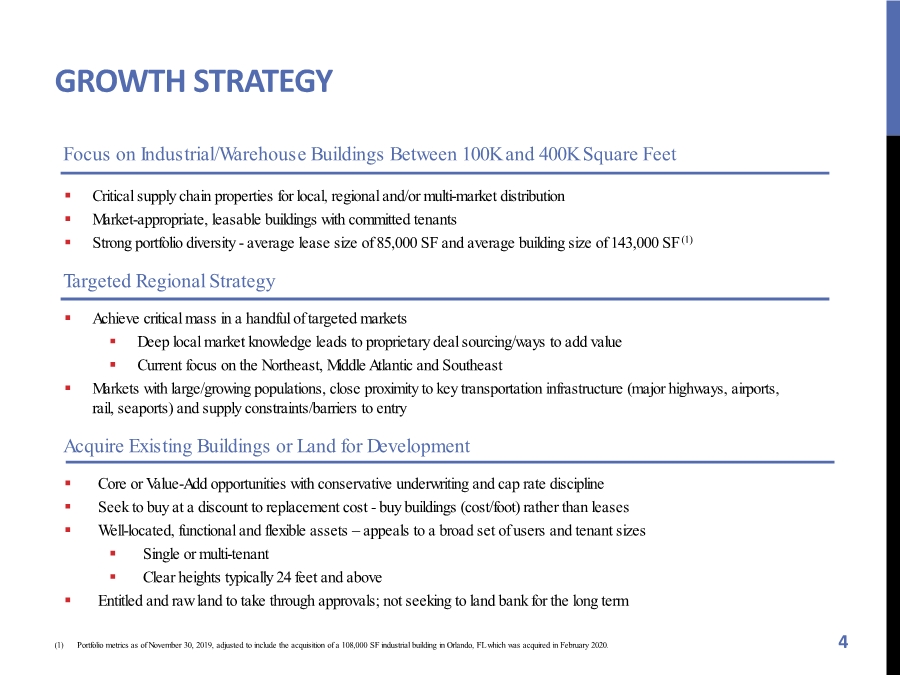
| GROWTH STRATEGY . Critical supply chain properties for local, regional and/or multi-market distribution . Market-appropriate, leasable buildings with committed tenants . Strong portfolio diversity - average lease size of 85,000 SF and average building size of 143,000 SF (1) . Achieve critical mass in a handful of targeted markets . Deep local market knowledge leads to proprietary deal sourcing/ways to add value . Current focus on the Northeast, Middle Atlantic and Southeast . Markets with large/growing populations, close proximity to key transportation infrastructure (major highways, airports, rail, seaports) and supply constraints/barriers to entry . Core or Value-Add opportunities with conservative underwriting and cap rate discipline . Seek to buy at a discount to replacement cost - buy buildings (cost/foot) rather than leases . Well-located, functional and flexible assets – appeals to a broad set of users and tenant sizes . Single or multi-tenant . Clear heights typically 24 feet and above . Entitled and raw land to take through approvals; not seeking to land bank for the long term 4 Focus on Industrial/Warehouse Buildings Between 100K and 400K Square Feet Targeted Regional Strategy Acquire Existing Buildings or Land for Development (1) Portfolio metrics as of November 30, 2019, adjusted to include the acquisition of a 108,000 SF industrial building in Orlando, FL which was acquired in February 2020. |
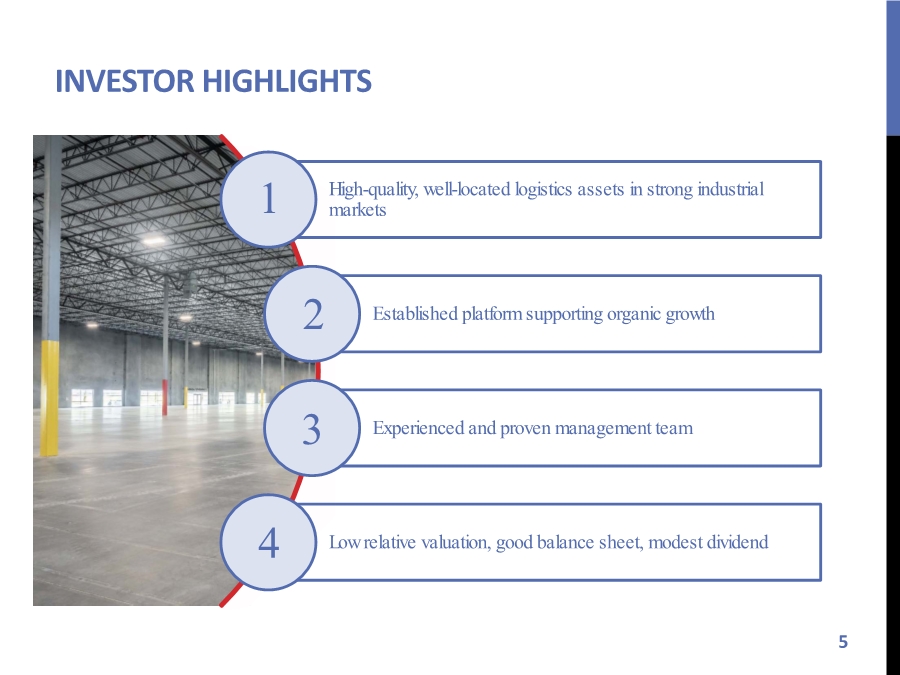
| INVESTOR HIGHLIGHTS High-quality, well-located logistics assets in strong industrial markets Established platform supporting organic growth Experienced and proven management team Low relative valuation, good balance sheet, modest dividend 5 1 2 3 4 |
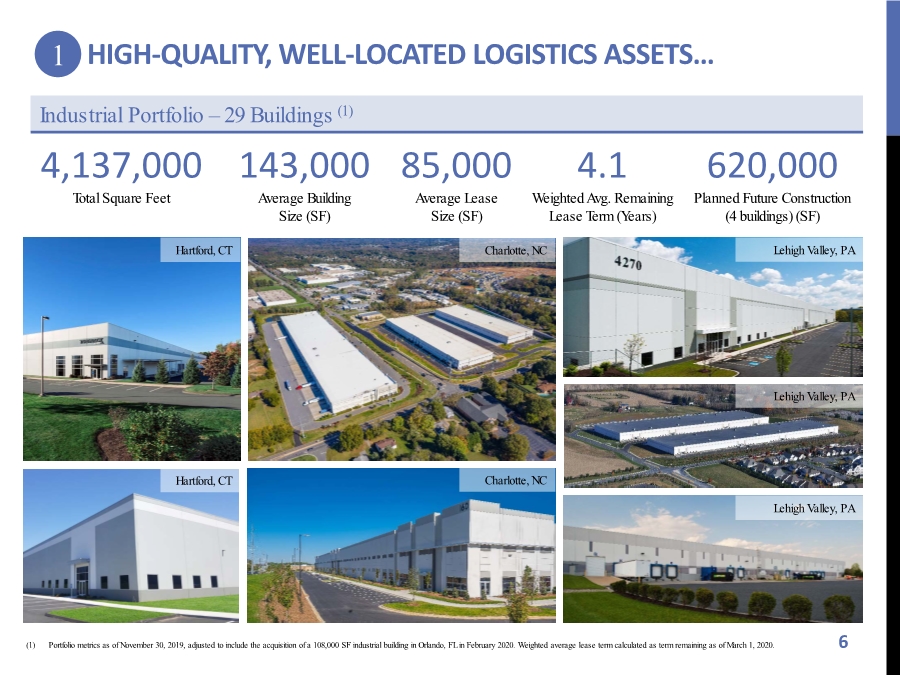
| HIGH-QUALITY, WELL-LOCATED LOGISTICS ASSETS… 6 1 Industrial Portfolio – 29 Buildings (1) Lehigh Valley, PA Lehigh Valley, PA Lehigh Valley, PA Hartford, CT Charlotte, NC Charlotte, NC Hartford, CT (1) Portfolio metrics as of November 30, 2019, adjusted to include the acquisition of a 108,000 SF industrial building in Orlando, FL in February 2020. Weighted average lease term calculated as term remaining as of March 1, 2020. 4,137,000 Total Square Feet 143,000 Average Building Size (SF) 4.1 Weighted Avg. Remaining Lease Term (Years) 85,000 Average Lease Size (SF) 620,000 Planned Future Construction (4 buildings) (SF) |
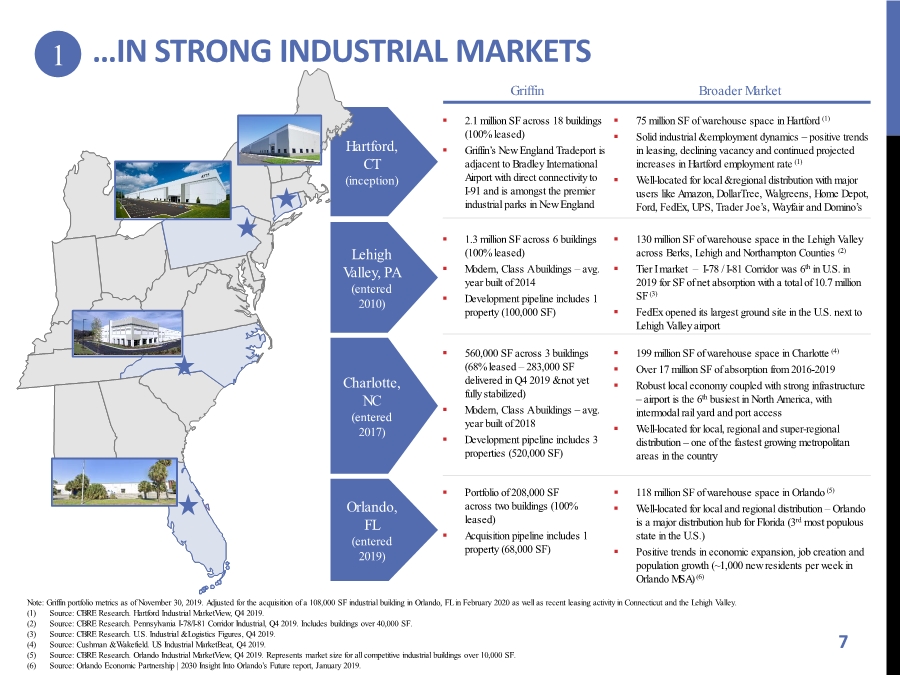
| …IN STRONG INDUSTRIAL MARKETS 7 Hartford, CT (inception) Lehigh Valley, PA (entered 2010) Charlotte, NC (entered 2017) Orlando, FL (entered 2019) . 2.1 million SF across 18 buildings (100% leased) . Griffin’s New England Tradeport is adjacent to Bradley International Airport with direct connectivity to I-91 and is amongst the premier industrial parks in New England . 1.3 million SF across 6 buildings (100% leased) . Modern, Class A buildings – avg. year built of 2014 . Development pipeline includes 1 property (100,000 SF) . 560,000 SF across 3 buildings (68% leased – 283,000 SF delivered in Q4 2019 & not yet fully stabilized) . Modern, Class A buildings – avg. year built of 2018 . Development pipeline includes 3 properties (520,000 SF) . Portfolio of 208,000 SF across two buildings (100% leased) . Acquisition pipeline includes 1 property (68,000 SF) Note: Griffin portfolio metrics as of November 30, 2019. Adjusted for the acquisition of a 108,000 SF industrial building in Orlando, FL in February 2020 as well as recent leasing activity in Connecticut and the Lehigh Valley. (1) Source: CBRE Research. Hartford Industrial MarketView, Q4 2019. (2) Source: CBRE Research. Pennsylvania I-78/I-81 Corridor Industrial, Q4 2019. Includes buildings over 40,000 SF. (3) Source: CBRE Research. U.S. Industrial & Logistics Figures, Q4 2019. (4) Source: Cushman & Wakefield. US Industrial MarketBeat, Q4 2019. (5) Source: CBRE Research. Orlando Industrial MarketView, Q4 2019. Represents market size for all competitive industrial buildings over 10,000 SF. (6) Source: Orlando Economic Partnership | 2030 Insight Into Orlando’s Future report, January 2019. 1 . 75 million SF of warehouse space in Hartford (1) . Solid industrial & employment dynamics – positive trends in leasing, declining vacancy and continued projected increases in Hartford employment rate (1) . Well-located for local & regional distribution with major users like Amazon, DollarTree, Walgreens, Home Depot, Ford, FedEx, UPS, Trader Joe’s, Wayfair and Domino’s . 130 million SF of warehouse space in the Lehigh Valley across Berks, Lehigh and Northampton Counties (2) . Tier I market – I-78 / I-81 Corridor was 6th in U.S. in 2019 for SF of net absorption with a total of 10.7 million SF (3) . FedEx opened its largest ground site in the U.S. next to Lehigh Valley airport . 199 million SF of warehouse space in Charlotte (4) . Over 17 million SF of absorption from 2016-2019 . Robust local economy coupled with strong infrastructure – airport is the 6th busiest in North America, with intermodal rail yard and port access . Well-located for local, regional and super-regional distribution – one of the fastest growing metropolitan areas in the country . 118 million SF of warehouse space in Orlando (5) . Well-located for local and regional distribution – Orlando is a major distribution hub for Florida (3rd most populous state in the U.S.) . Positive trends in economic expansion, job creation and population growth (~1,000 new residents per week in Orlando MSA) (6) Griffin Broader Market |
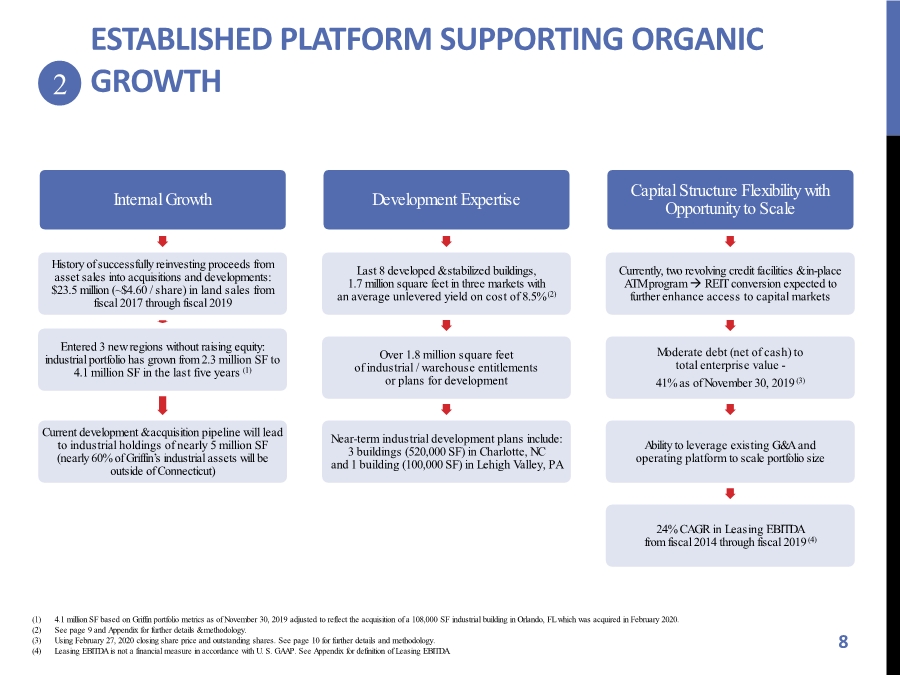
| Internal Growth History of successfully reinvesting proceeds from asset sales into acquisitions and developments: $23.5 million (~$4.60 / share) in land sales from fiscal 2017 through fiscal 2019 Entered 3 new regions without raising equity: industrial portfolio has grown from 2.3 million SF to 4.1 million SF in the last five years (1) Current development & acquisition pipeline will lead to industrial holdings of nearly 5 million SF (nearly 60% of Griffin’s industrial assets will be outside of Connecticut) Development Expertise Last 8 developed & stabilized buildings, 1.7 million square feet in three markets with an average unlevered yield on cost of 8.5% (2) Over 1.8 million square feet of industrial / warehouse entitlements or plans for development Near-term industrial development plans include: 3 buildings (520,000 SF) in Charlotte, NC and 1 building (100,000 SF) in Lehigh Valley, PA Capital Structure Flexibility with Opportunity to Scale Currently, two revolving credit facilities & in-place ATM program REIT conversion expected to further enhance access to capital markets Moderate debt (net of cash) to total enterprise value - 41% as of November 30, 2019 (3) Ability to leverage existing G&A and operating platform to scale portfolio size 24% CAGR in Leasing EBITDA from fiscal 2014 through fiscal 2019 (4) ESTABLISHED PLATFORM SUPPORTING ORGANIC GROWTH 8 2 (1) 4.1 million SF based on Griffin portfolio metrics as of November 30, 2019 adjusted to reflect the acquisition of a 108,000 SF industrial building in Orlando, FL which was acquired in February 2020. (2) See page 9 and Appendix for further details & methodology. (3) Using February 27, 2020 closing share price and outstanding shares. See page 10 for further details and methodology. (4) Leasing EBITDA is not a financial measure in accordance with U. S. GAAP. See Appendix for definition of Leasing EBITDA. |
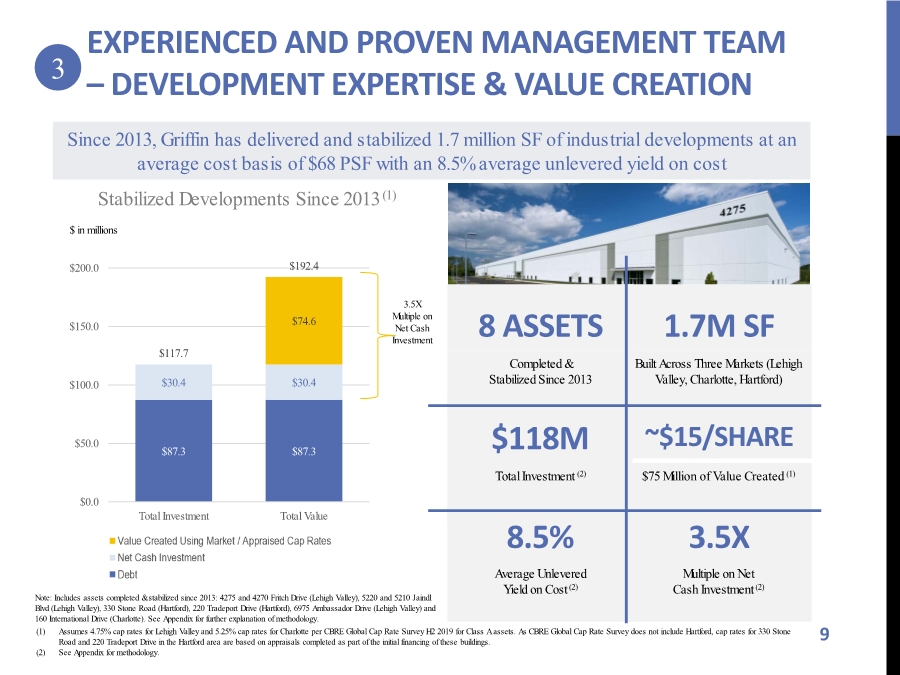
| $87.3 $87.3 $30.4 $30.4 $74.6 $117.7 $192.4 $0.0 $50.0 $100.0 $150.0 $200.0 Total Investment Total Value Total Value Created Using Market / Appraised Cap Rates Net Cash Investment EXPERIENCED AND PROVEN MANAGEMENT TEAM – DEVELOPMENT EXPERTISE & VALUE CREATION 9 8 ASSETS Completed & Stabilized Since 2013 1.7M SF Built Across Three Markets (Lehigh Valley, Charlotte, Hartford) $118M Total Investment (2) ~$15/SHARE $75 Million of Value Created (1) 8.5% Average Unlevered Yield on Cost (2) 3.5X Multiple on Net Cash Investment (2) Since 2013, Griffin has delivered and stabilized 1.7 million SF of industrial developments at an average cost basis of $68 PSF with an 8.5% average unlevered yield on cost $ in millions Stabilized Developments Since 2013 (1) Note: Includes assets completed & stabilized since 2013: 4275 and 4270 Fritch Drive (Lehigh Valley), 5220 and 5210 Jaindl Blvd (Lehigh Valley), 330 Stone Road (Hartford), 220 Tradeport Drive (Hartford), 6975 Ambassador Drive (Lehigh Valley) and 160 International Drive (Charlotte). See Appendix for further explanation of methodology. (1) Assumes 4.75% cap rates for Lehigh Valley and 5.25% cap rates for Charlotte per CBRE Global Cap Rate Survey H2 2019 for Class A assets. As CBRE Global Cap Rate Survey does not include Hartford, cap rates for 330 Stone Road and 220 Tradeport Drive in the Hartford area are based on appraisals completed as part of the initial financing of these buildings. (2) See Appendix for methodology. 3.5X Multiple on Net Cash Investment 3 |
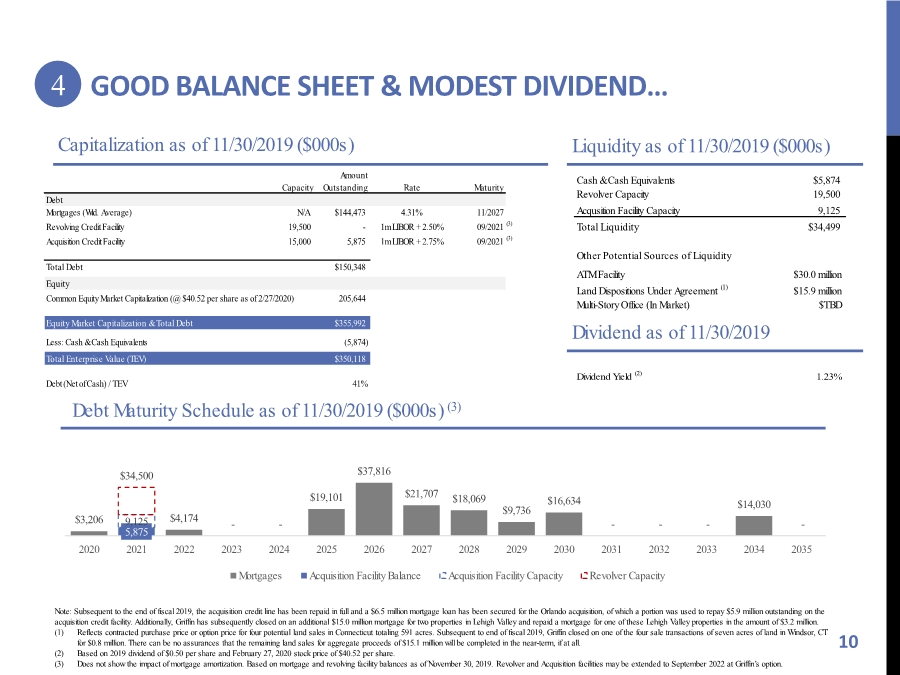
| 5,875 9,125 $3,206 $34,500 $4,174 - - $19,101 $37,816 $21,707 $18,069 $9,736 $16,634 - - - $14,030 - 2020 2021 2022 2023 2024 2025 2026 2027 2028 2029 2030 2031 2032 2033 2034 2035 Mortgages Acquisition Facility Balance Acquisition Facility Capacity Revolver Capacity GOOD BALANCE SHEET & MODEST DIVIDEND… 10 Capitalization as of 11/30/2019 ($000s) Liquidity as of 11/30/2019 ($000s) Debt Maturity Schedule as of 11/30/2019 ($000s) (3) Note: Subsequent to the end of fiscal 2019, the acquisition credit line has been repaid in full and a $6.5 million mortgage loan has been secured for the Orlando acquisition, of which a portion was used to repay $5.9 million outstanding on the acquisition credit facility. Additionally, Griffin has subsequently closed on an additional $15.0 million mortgage for two properties in Lehigh Valley and repaid a mortgage for one of these Lehigh Valley properties in the amount of $3.2 million. (1) Reflects contracted purchase price or option price for four potential land sales in Connecticut totaling 591 acres. Subsequent to end of fiscal 2019, Griffin closed on one of the four sale transactions of seven acres of land in Windsor, CT for $0.8 million. There can be no assurances that the remaining land sales for aggregate proceeds of $15.1 million will be completed in the near-term, if at all. (2) Based on 2019 dividend of $0.50 per share and February 27, 2020 stock price of $40.52 per share. (3) Does not show the impact of mortgage amortization. Based on mortgage and revolving facility balances as of November 30, 2019. Revolver and Acquisition facilities may be extended to September 2022 at Griffin’s option. 4 Dividend as of 11/30/2019 Amount Capacity Outstanding Rate Maturity Debt Mortgages (Wtd. Average) N/A $144,473 4.31% 11/2027 Revolving Credit Facility 19,500 - 1m LIBOR + 2.50% 09/2021 (3) Acquisition Credit Facility 15,000 5,875 1m LIBOR + 2.75% 09/2021 (3) Total Debt $150,348 Equity Common Equity Market Capitalization (@ $40.52 per share as of 2/27/2020) 205,644 Equity Market Capitalization & Total Debt $355,992 Less: Cash & Cash Equivalents (5,874) Total Enterprise Value (TEV) $350,118 Debt (Net of Cash) / TEV 41% Dividend Yield (2) 1.23% Cash & Cash Equivalents $5,874 Revolver Capacity 19,500 Acqusition Facility Capacity 9,125 Total Liquidity $34,499 Other Potential Sources of Liquidity ATM Facility $30.0 million Land Dispositions Under Agreement (1) $15.9 million Multi-Story Office (In Market) $TBD |
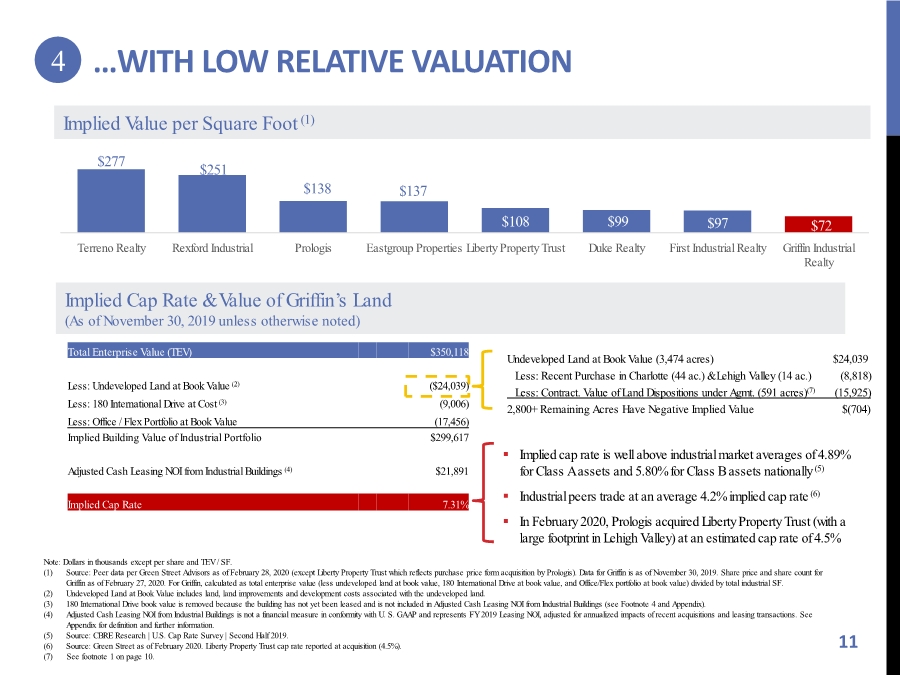
| …WITH LOW RELATIVE VALUATION 11 Note: Dollars in thousands except per share and TEV / SF. (1) Source: Peer data per Green Street Advisors as of February 28, 2020 (except Liberty Property Trust which reflects purchase price form acquisition by Prologis). Data for Griffin is as of November 30, 2019. Share price and share count for Griffin as of February 27, 2020. For Griffin, calculated as total enterprise value (less undeveloped land at book value, 180 International Drive at book value, and Office/Flex portfolio at book value) divided by total industrial SF. (2) Undeveloped Land at Book Value includes land, land improvements and development costs associated with the undeveloped land. (3) 180 International Drive book value is removed because the building has not yet been leased and is not included in Adjusted Cash Leasing NOI from Industrial Buildings (see Footnote 4 and Appendix). (4) Adjusted Cash Leasing NOI from Industrial Buildings is not a financial measure in conformity with U. S. GAAP and represents FY 2019 Leasing NOI, adjusted for annualized impacts of recent acquisitions and leasing transactions. See Appendix for definition and further information. (5) Source: CBRE Research | U.S. Cap Rate Survey | Second Half 2019. (6) Source: Green Street as of February 2020. Liberty Property Trust cap rate reported at acquisition (4.5%). (7) See footnote 1 on page 10. $277 $251 $138 $137 $108 $99 $97 $72 Terreno Realty Rexford Industrial Prologis Eastgroup Properties Liberty Property Trust Duke Realty First Industrial Realty Griffin Industrial Realty Implied Value per Square Foot (1) Implied Cap Rate & Value of Griffin’s Land (As of November 30, 2019 unless otherwise noted) 4 . Implied cap rate is well above industrial market averages of 4.89% for Class A assets and 5.80% for Class B assets nationally (5) . Industrial peers trade at an average 4.2% implied cap rate (6) . In February 2020, Prologis acquired Liberty Property Trust (with a large footprint in Lehigh Valley) at an estimated cap rate of 4.5% Total Enterprise Value (TEV) $350,118 Less: Undeveloped Land at Book Value (2) ($24,039) Less: 180 International Drive at Cost (3) (9,006) Less: Office / Flex Portfolio at Book Value (17,456) Implied Building Value of Industrial Portfolio $299,617 Adjusted Cash Leasing NOI from Industrial Buildings (4) $21,891 Implied Cap Rate 7.31% Undeveloped Land at Book Value (3,474 acres) $24,039 Less: Recent Purchase in Charlotte (44 ac.) & Lehigh Valley (14 ac.) (8,818) Less: Contract. Value of Land Dispositions under Agmt. (591 acres)(7) (15,925) 2,800+ Remaining Acres Have Negative Implied Value $(704) |
| APPENDIX 12 |
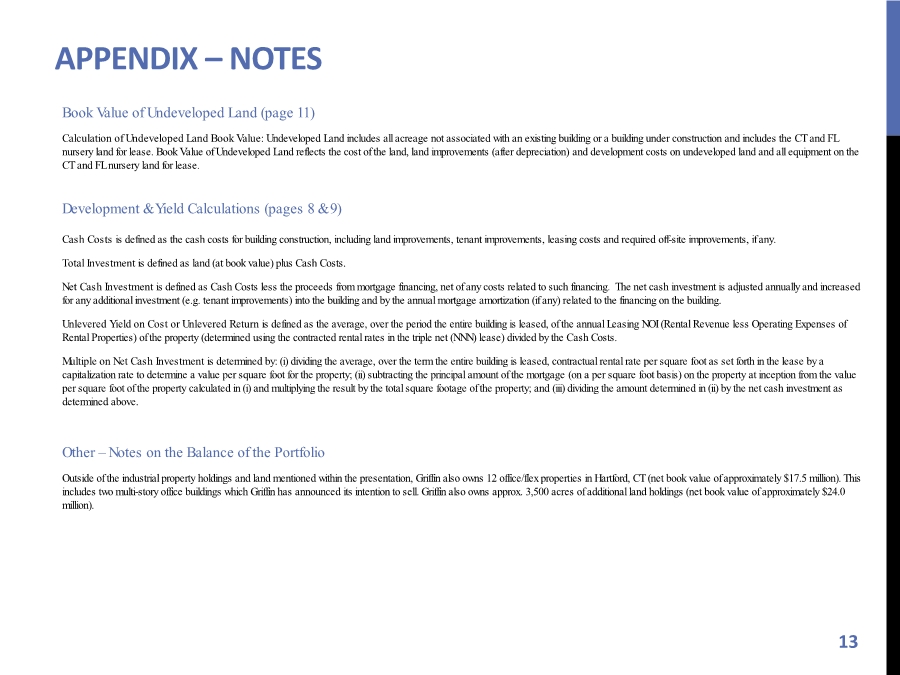
| APPENDIX – NOTES 13 Book Value of Undeveloped Land (page 11) Calculation of Undeveloped Land Book Value: Undeveloped Land includes all acreage not associated with an existing building or a building under construction and includes the CT and FL nursery land for lease. Book Value of Undeveloped Land reflects the cost of the land, land improvements (after depreciation) and development costs on undeveloped land and all equipment on the CT and FL nursery land for lease. Development & Yield Calculations (pages 8 & 9) Cash Costs is defined as the cash costs for building construction, including land improvements, tenant improvements, leasing costs and required off-site improvements, if any. Total Investment is defined as land (at book value) plus Cash Costs. Net Cash Investment is defined as Cash Costs less the proceeds from mortgage financing, net of any costs related to such financing. The net cash investment is adjusted annually and increased for any additional investment (e.g. tenant improvements) into the building and by the annual mortgage amortization (if any) related to the financing on the building. Unlevered Yield on Cost or Unlevered Return is defined as the average, over the period the entire building is leased, of the annual Leasing NOI (Rental Revenue less Operating Expenses of Rental Properties) of the property (determined using the contracted rental rates in the triple net (NNN) lease) divided by the Cash Costs. Multiple on Net Cash Investment is determined by: (i) dividing the average, over the term the entire building is leased, contractual rental rate per square foot as set forth in the lease by a capitalization rate to determine a value per square foot for the property; (ii) subtracting the principal amount of the mortgage (on a per square foot basis) on the property at inception from the value per square foot of the property calculated in (i) and multiplying the result by the total square footage of the property; and (iii) dividing the amount determined in (ii) by the net cash investment as determined above. Other – Notes on the Balance of the Portfolio Outside of the industrial property holdings and land mentioned within the presentation, Griffin also owns 12 office/flex properties in Hartford, CT (net book value of approximately $17.5 million). This includes two multi-story office buildings which Griffin has announced its intention to sell. Griffin also owns approx. 3,500 acres of additional land holdings (net book value of approximately $24.0 million). |
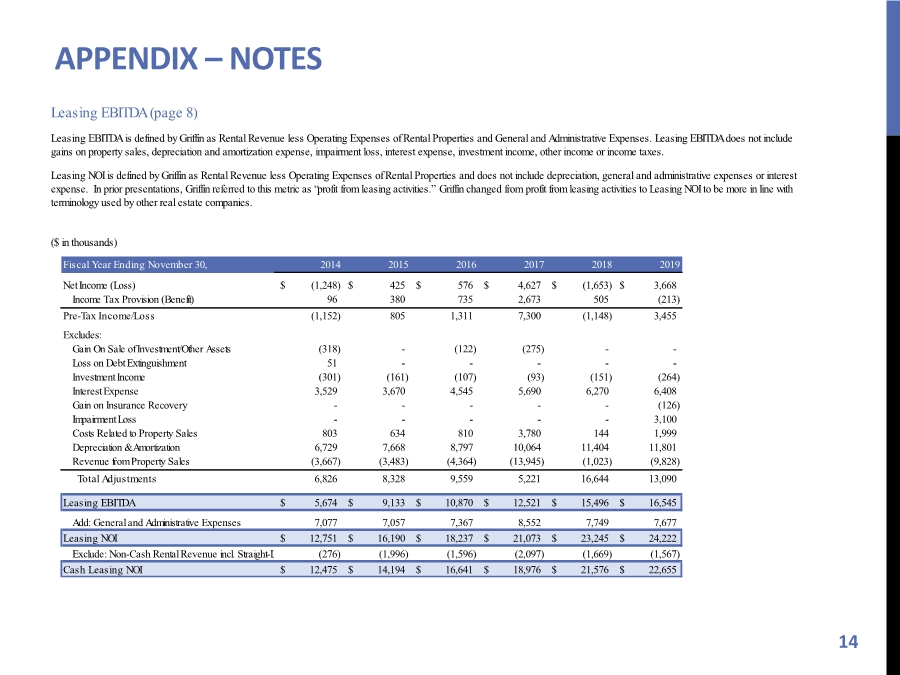
| APPENDIX – NOTES 14 Leasing EBITDA (page 8) Leasing EBITDA is defined by Griffin as Rental Revenue less Operating Expenses of Rental Properties and General and Administrative Expenses. Leasing EBITDA does not include gains on property sales, depreciation and amortization expense, impairment loss, interest expense, investment income, other income or income taxes. Leasing NOI is defined by Griffin as Rental Revenue less Operating Expenses of Rental Properties and does not include depreciation, general and administrative expenses or interest expense. In prior presentations, Griffin referred to this metric as “profit from leasing activities.” Griffin changed from profit from leasing activities to Leasing NOI to be more in line with terminology used by other real estate companies. ($ in thousands) Fiscal Year Ending November 30, 2014 2015 2016 2017 2018 2019 Net Income (Loss) (1,248) $ 425 $ 576 $ 4,627 $ (1,653) $ 3,668 $ Income Tax Provision (Benefit) 96 380 735 2,673 505 (213) Pre-Tax Income/Loss (1,152) 805 1,311 7,300 (1,148) 3,455 Excludes: Gain On Sale of Investment/Other Assets (318) - (122) (275) - - Loss on Debt Extinguishment 51 - - - - - Investment Income (301) (161) (107) (93) (151) (264) Interest Expense 3,529 3,670 4,545 5,690 6,270 6,408 Gain on Insurance Recovery - - - - - (126) Impairment Loss - - - - - 3,100 Costs Related to Property Sales 803 634 810 3,780 144 1,999 Depreciation & Amortization 6,729 7,668 8,797 10,064 11,404 11,801 Revenue from Property Sales (3,667) (3,483) (4,364) (13,945) (1,023) (9,828) Total Adjustments 6,826 8,328 9,559 5,221 16,644 13,090 Leasing EBITDA 5,674 $ 9,133 $ 10,870 $ 12,521 $ 15,496 $ 16,545 $ Add: General and Administrative Expenses 7,077 7,057 7,367 8,552 7,749 7,677 Leasing NOI 12,751 $ 16,190 $ 18,237 $ 21,073 $ 23,245 $ 24,222 $ Exclude: Non-Cash Rental Revenue incl. Straight-L (276) (1,996) (1,596) (2,097) (1,669) (1,567) Cash Leasing NOI 12,475 $ 14,194 $ 16,641 $ 18,976 $ 21,576 $ 22,655 $ |
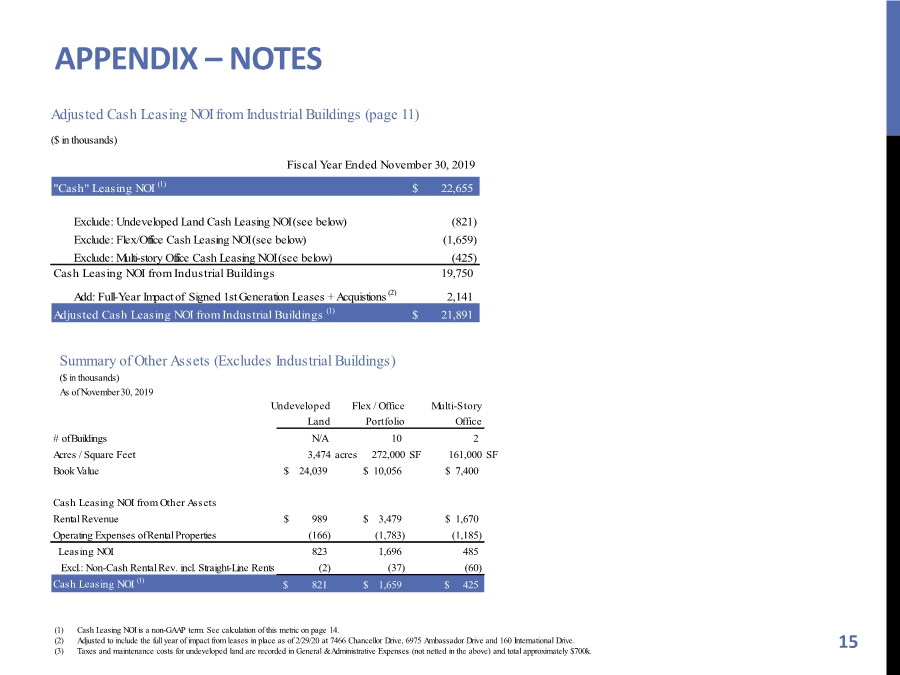
| APPENDIX – NOTES 15 Adjusted Cash Leasing NOI from Industrial Buildings (page 11) ($ in thousands) (1) Cash Leasing NOI is a non-GAAP term. See calculation of this metric on page 14. (2) Adjusted to include the full year of impact from leases in place as of 2/29/20 at 7466 Chancellor Drive, 6975 Ambassador Drive and 160 International Drive. (3) Taxes and maintenance costs for undeveloped land are recorded in General & Administrative Expenses (not netted in the above) and total approximately $700k. Summary of Other Assets (Excludes Industrial Buildings) ($ in thousands) As of November 30, 2019 Fiscal Year Ended November 30, 2019 "Cash" Leasing NOI (1) 22,655 $ Exclude: Undeveloped Land Cash Leasing NOI (see below) (821) Exclude: Flex/Office Cash Leasing NOI (see below) (1,659) Exclude: Multi-story Office Cash Leasing NOI (see below) (425) Cash Leasing NOI from Industrial Buildings 19,750 Add: Full-Year Impact of Signed 1st Generation Leases + Acquistions (2) 2,141 Adjusted Cash Leasing NOI from Industrial Buildings (1) 21,891 $ Undeveloped Flex / Office Multi-Story Land Portfolio Office # of Buildings N/A 10 2 Acres / Square Feet 3,474 acres 272,000 SF 161,000 SF Book Value 24,039 $ 10,056 $ 7,400 $ Cash Leasing NOI from Other Assets Rental Revenue 989 $ 3,479 $ 1,670 $ Operating Expenses of Rental Properties (166) (1,783) (1,185) Leasing NOI 823 1,696 485 Excl.: Non-Cash Rental Rev. incl. Straight-Line Rents (2) (37) (60) Cash Leasing NOI (1) 821 $ 1,659 $ 425 $ |